journal of wind engineering & industrial …...l. salati et al. journal of wind engineering...
TRANSCRIPT
Journal of Wind Engineering & Industrial Aerodynamics 171 (2017) 101–109
Contents lists available at ScienceDirect
Journal of Wind Engineering & Industrial Aerodynamics
journal homepage: www.elsevier .com/locate/ jweia
Wind tunnel experiment on a heavy truck equipped with front-reartrailer device
L. Salati *, P. Schito, F. Cheli
Dipartimento di Meccanica, Politecnico di Milano, Via la Masa 1, Milano, Italy
A B S T R A C T
The aerodynamic drag of a “common” European heavy truck equipped with Front-Rear trailer device, earlier designed by the authors with numerical simulations, wasinvestigated through wind tunnel testing on a 1:10 scale model.
The device, placed on the top and sides of the trailer, as well as at the front and rear, increases the overall dimensions of the heavy truck by less than 1% in widthand height, and reduces the overall drag by about 10%. The Front-Rear trailer device was separated into several parts (top, side, front and rear) to analyze which onereduced the drag more. An analysis was carried out on several parts of the same device simultaneously installed on the trailer (for example top-front and top-reardevices mounted at the same time), in addition to an analysis of the performance of the Front trailer device based on the length of the device itself. Tests wereperformed both in front wind and crosswind conditions.
The device is expected to generate a consistent drag reduction both in front wind and crosswind, to reduce greenhouse gas and pollutant emissions.
1. Introduction
It is estimated that 50% of the truck engine power is needed toovercome the aerodynamic drag of a Heavy Goods Vehicle (HGV) at atypical highway speed of 90-100 km/h Schoon (2007). In fact, aero-dynamic drag increases in relation to the square of the vehicle speed, anddrag is the main source of fuel consumption at cruise speed. Aerodynamicefficiency is strongly affected by the regulation concerning the maximumvehicle dimensions. In Europe, the legal maximum vehicle length in-cludes the whole heavy truck (Directive 96/53/EC (The Council of TheEuropean Union, 1996)), influencing especially the tractor shape and itsaerodynamics performance. In other countries, as in the US, only thetrailer length is fixed, allowing the shape of the tractor to be morestreamlined as shown in Fig. 1.
A first way to reduce drag in heavy trucks without anymodification tothe HGV geometry is platooning as shown in Schito and Braghin (2012).Platooning is the strategy of coupling two or more vehicles togetherwhile they are travelling on the highway at a distance between 5 m and15 m. Several studies were done to understand the impact of this drivingstrategy on the environment, traffic safety and traffic congestion. Amongwhich, the Safe Road Trains for the Environment (SARTRE) (D�avila andNombela, 2011) is a European project aimed at studying platooning toinclude also passenger vehicles. The main goal is to determine if pla-tooning can be integrated with non-platoon traffic, lane changes, etc.Platooning gives promising results, but it requires a significant change in
* Corresponding author.E-mail addresses: [email protected] (L. Salati), [email protected] (P. Schito), federi
https://doi.org/10.1016/j.jweia.2017.09.016Received 8 November 2016; Received in revised form 22 September 2017; Accepted 22 Septe
0167-6105/© 2017 Elsevier Ltd. All rights reserved.
the infrastructure and in the driving behavior of the vehicles traveling inthe platoon configuration. For all these reasons, commercial platooning iscurrently not available.
There are several strategies for reducing the drag on a heavy truck.They can be separated into two major categories: those installed on thetractor and those installed on the trailer. As described in Leuschen andCooper (2006), there could exist as many devices as the number oftractors and trailers in service. Most drag reduction devices are designedto be mounted on the trailer. There is normally a reluctance in industry toadopt them, as a marked distinction exists between tractor own-ers/operators and those of trailers. Nevertheless, trailer manufacturers(in addition to operators in general) have little interest in these devicesthat increase the overall acquisition costs of the trailer.
As a result of studies on the aerodynamic efficiency of a single HGVvehicle, it is known that aerodynamic drag is mostly influenced by:
➢ the front corner radius of the tractor (Palowski, 1930);➢ the tractor-trailer gap (Hucho, 1987);➢ the underbody of both trailer and tractor (Buchheim et al., 1981;
Howell, 1994;➢ the aerodynamic interaction between the tractor and the trailer
(Gilhaus, 1980).
Given this information, several aerodynamic devices are currentlyused to reduce the drag of the trailer, the most common ones being:
[email protected] (F. Cheli).
mber 2017
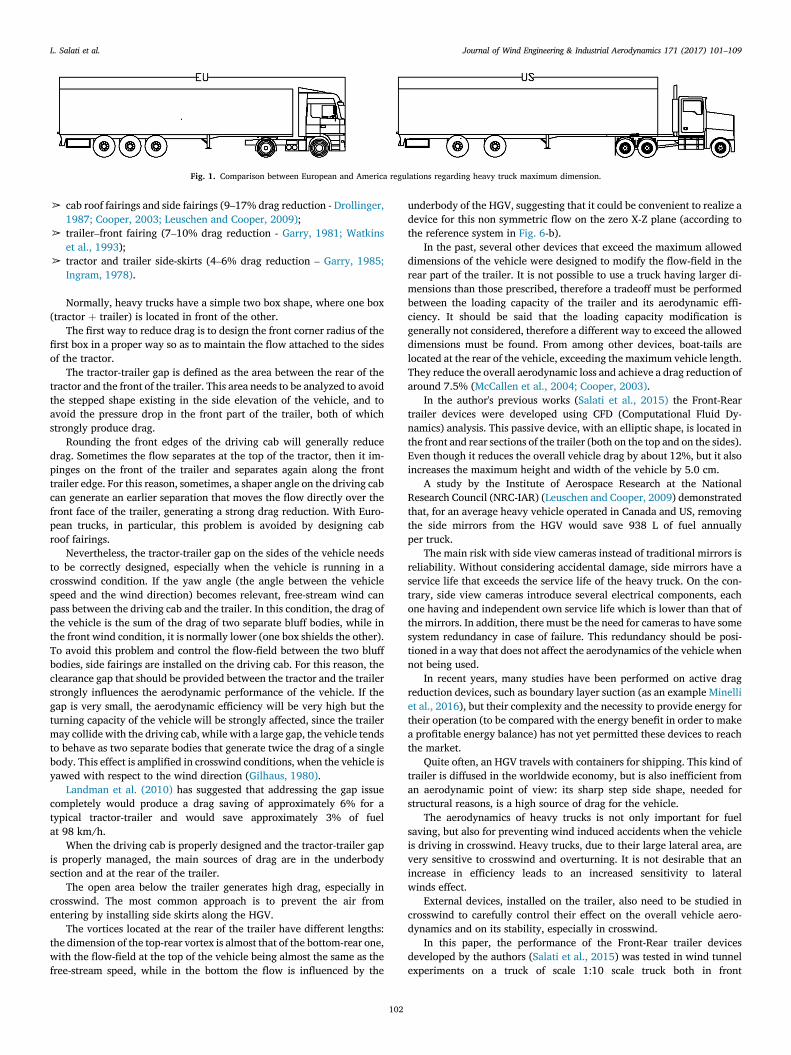
Fig. 1. Comparison between European and America regulations regarding heavy truck maximum dimension.
L. Salati et al. Journal of Wind Engineering & Industrial Aerodynamics 171 (2017) 101–109
➢ cab roof fairings and side fairings (9–17% drag reduction - Drollinger,1987; Cooper, 2003; Leuschen and Cooper, 2009);
➢ trailer–front fairing (7–10% drag reduction - Garry, 1981; Watkinset al., 1993);
➢ tractor and trailer side-skirts (4–6% drag reduction – Garry, 1985;Ingram, 1978).
Normally, heavy trucks have a simple two box shape, where one box(tractor þ trailer) is located in front of the other.
The first way to reduce drag is to design the front corner radius of thefirst box in a proper way so as to maintain the flow attached to the sidesof the tractor.
The tractor-trailer gap is defined as the area between the rear of thetractor and the front of the trailer. This area needs to be analyzed to avoidthe stepped shape existing in the side elevation of the vehicle, and toavoid the pressure drop in the front part of the trailer, both of whichstrongly produce drag.
Rounding the front edges of the driving cab will generally reducedrag. Sometimes the flow separates at the top of the tractor, then it im-pinges on the front of the trailer and separates again along the fronttrailer edge. For this reason, sometimes, a shaper angle on the driving cabcan generate an earlier separation that moves the flow directly over thefront face of the trailer, generating a strong drag reduction. With Euro-pean trucks, in particular, this problem is avoided by designing cabroof fairings.
Nevertheless, the tractor-trailer gap on the sides of the vehicle needsto be correctly designed, especially when the vehicle is running in acrosswind condition. If the yaw angle (the angle between the vehiclespeed and the wind direction) becomes relevant, free-stream wind canpass between the driving cab and the trailer. In this condition, the drag ofthe vehicle is the sum of the drag of two separate bluff bodies, while inthe front wind condition, it is normally lower (one box shields the other).To avoid this problem and control the flow-field between the two bluffbodies, side fairings are installed on the driving cab. For this reason, theclearance gap that should be provided between the tractor and the trailerstrongly influences the aerodynamic performance of the vehicle. If thegap is very small, the aerodynamic efficiency will be very high but theturning capacity of the vehicle will be strongly affected, since the trailermay collide with the driving cab, while with a large gap, the vehicle tendsto behave as two separate bodies that generate twice the drag of a singlebody. This effect is amplified in crosswind conditions, when the vehicle isyawed with respect to the wind direction (Gilhaus, 1980).
Landman et al. (2010) has suggested that addressing the gap issuecompletely would produce a drag saving of approximately 6% for atypical tractor-trailer and would save approximately 3% of fuelat 98 km/h.
When the driving cab is properly designed and the tractor-trailer gapis properly managed, the main sources of drag are in the underbodysection and at the rear of the trailer.
The open area below the trailer generates high drag, especially incrosswind. The most common approach is to prevent the air fromentering by installing side skirts along the HGV.
The vortices located at the rear of the trailer have different lengths:the dimension of the top-rear vortex is almost that of the bottom-rear one,with the flow-field at the top of the vehicle being almost the same as thefree-stream speed, while in the bottom the flow is influenced by the
102
underbody of the HGV, suggesting that it could be convenient to realize adevice for this non symmetric flow on the zero X-Z plane (according tothe reference system in Fig. 6-b).
In the past, several other devices that exceed the maximum alloweddimensions of the vehicle were designed to modify the flow-field in therear part of the trailer. It is not possible to use a truck having larger di-mensions than those prescribed, therefore a tradeoff must be performedbetween the loading capacity of the trailer and its aerodynamic effi-ciency. It should be said that the loading capacity modification isgenerally not considered, therefore a different way to exceed the alloweddimensions must be found. From among other devices, boat-tails arelocated at the rear of the vehicle, exceeding the maximum vehicle length.They reduce the overall aerodynamic loss and achieve a drag reduction ofaround 7.5% (McCallen et al., 2004; Cooper, 2003).
In the author's previous works (Salati et al., 2015) the Front-Reartrailer devices were developed using CFD (Computational Fluid Dy-namics) analysis. This passive device, with an elliptic shape, is located inthe front and rear sections of the trailer (both on the top and on the sides).Even though it reduces the overall vehicle drag by about 12%, but it alsoincreases the maximum height and width of the vehicle by 5.0 cm.
A study by the Institute of Aerospace Research at the NationalResearch Council (NRC-IAR) (Leuschen and Cooper, 2009) demonstratedthat, for an average heavy vehicle operated in Canada and US, removingthe side mirrors from the HGV would save 938 L of fuel annuallyper truck.
The main risk with side view cameras instead of traditional mirrors isreliability. Without considering accidental damage, side mirrors have aservice life that exceeds the service life of the heavy truck. On the con-trary, side view cameras introduce several electrical components, eachone having and independent own service life which is lower than that ofthe mirrors. In addition, there must be the need for cameras to have somesystem redundancy in case of failure. This redundancy should be posi-tioned in a way that does not affect the aerodynamics of the vehicle whennot being used.
In recent years, many studies have been performed on active dragreduction devices, such as boundary layer suction (as an example Minelliet al., 2016), but their complexity and the necessity to provide energy fortheir operation (to be compared with the energy benefit in order to makea profitable energy balance) has not yet permitted these devices to reachthe market.
Quite often, an HGV travels with containers for shipping. This kind oftrailer is diffused in the worldwide economy, but is also inefficient froman aerodynamic point of view: its sharp step side shape, needed forstructural reasons, is a high source of drag for the vehicle.
The aerodynamics of heavy trucks is not only important for fuelsaving, but also for preventing wind induced accidents when the vehicleis driving in crosswind. Heavy trucks, due to their large lateral area, arevery sensitive to crosswind and overturning. It is not desirable that anincrease in efficiency leads to an increased sensitivity to lateralwinds effect.
External devices, installed on the trailer, also need to be studied incrosswind to carefully control their effect on the overall vehicle aero-dynamics and on its stability, especially in crosswind.
In this paper, the performance of the Front-Rear trailer devicesdeveloped by the authors (Salati et al., 2015) was tested in wind tunnelexperiments on a truck of scale 1:10 scale truck both in front
L. Salati et al. Journal of Wind Engineering & Industrial Aerodynamics 171 (2017) 101–109
and crosswind.
2. Experimental set-up
2.1. Target vehicle
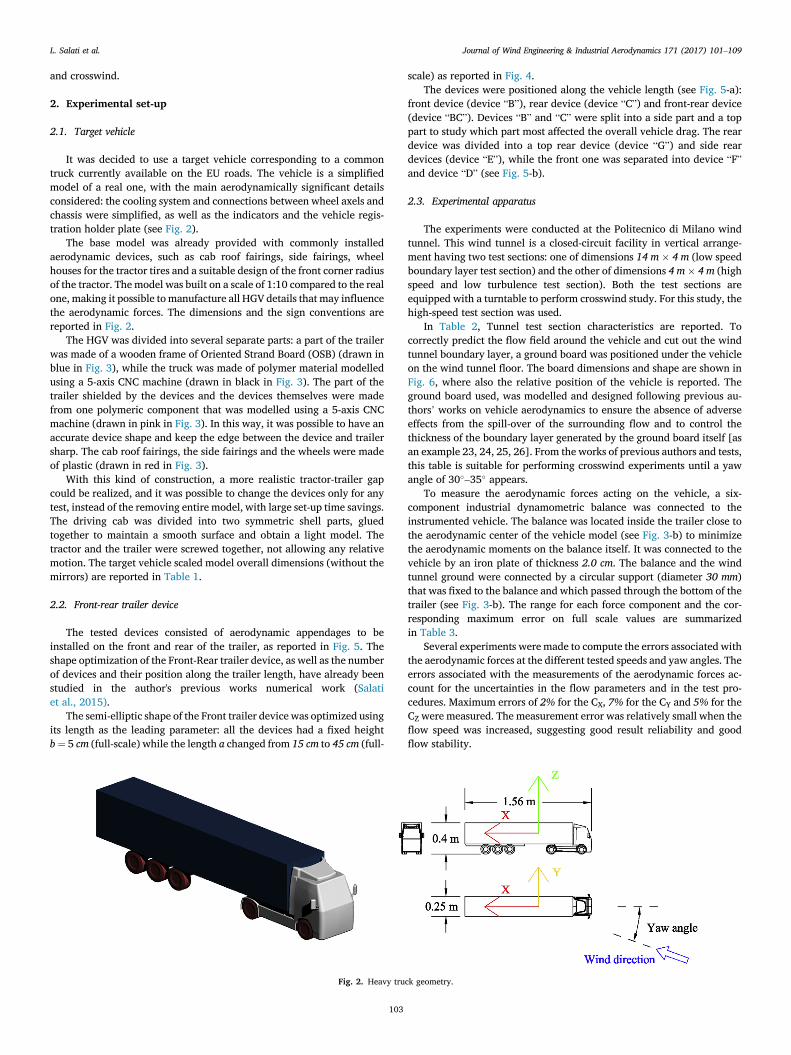
It was decided to use a target vehicle corresponding to a commontruck currently available on the EU roads. The vehicle is a simplifiedmodel of a real one, with the main aerodynamically significant detailsconsidered: the cooling system and connections between wheel axels andchassis were simplified, as well as the indicators and the vehicle regis-tration holder plate (see Fig. 2).
The base model was already provided with commonly installedaerodynamic devices, such as cab roof fairings, side fairings, wheelhouses for the tractor tires and a suitable design of the front corner radiusof the tractor. The model was built on a scale of 1:10 compared to the realone, making it possible to manufacture all HGV details that may influencethe aerodynamic forces. The dimensions and the sign conventions arereported in Fig. 2.
The HGV was divided into several separate parts: a part of the trailerwas made of a wooden frame of Oriented Strand Board (OSB) (drawn inblue in Fig. 3), while the truck was made of polymer material modelledusing a 5-axis CNC machine (drawn in black in Fig. 3). The part of thetrailer shielded by the devices and the devices themselves were madefrom one polymeric component that was modelled using a 5-axis CNCmachine (drawn in pink in Fig. 3). In this way, it was possible to have anaccurate device shape and keep the edge between the device and trailersharp. The cab roof fairings, the side fairings and the wheels were madeof plastic (drawn in red in Fig. 3).
With this kind of construction, a more realistic tractor-trailer gapcould be realized, and it was possible to change the devices only for anytest, instead of the removing entire model, with large set-up time savings.The driving cab was divided into two symmetric shell parts, gluedtogether to maintain a smooth surface and obtain a light model. Thetractor and the trailer were screwed together, not allowing any relativemotion. The target vehicle scaled model overall dimensions (without themirrors) are reported in Table 1.
2.2. Front-rear trailer device
The tested devices consisted of aerodynamic appendages to beinstalled on the front and rear of the trailer, as reported in Fig. 5. Theshape optimization of the Front-Rear trailer device, as well as the numberof devices and their position along the trailer length, have already beenstudied in the author's previous works numerical work (Salatiet al., 2015).
The semi-elliptic shape of the Front trailer device was optimized usingits length as the leading parameter: all the devices had a fixed heightb¼ 5 cm (full-scale) while the length a changed from 15 cm to 45 cm (full-
Fig. 2. Heavy tru
103
scale) as reported in Fig. 4.The devices were positioned along the vehicle length (see Fig. 5-a):
front device (device “B”), rear device (device “C”) and front-rear device(device “BC”). Devices “B” and “C” were split into a side part and a toppart to study which part most affected the overall vehicle drag. The reardevice was divided into a top rear device (device “G”) and side reardevices (device “E”), while the front one was separated into device “F”and device “D” (see Fig. 5-b).
2.3. Experimental apparatus
The experiments were conducted at the Politecnico di Milano windtunnel. This wind tunnel is a closed-circuit facility in vertical arrange-ment having two test sections: one of dimensions 14 m � 4 m (low speedboundary layer test section) and the other of dimensions 4 m � 4 m (highspeed and low turbulence test section). Both the test sections areequipped with a turntable to perform crosswind study. For this study, thehigh-speed test section was used.
In Table 2, Tunnel test section characteristics are reported. Tocorrectly predict the flow field around the vehicle and cut out the windtunnel boundary layer, a ground board was positioned under the vehicleon the wind tunnel floor. The board dimensions and shape are shown inFig. 6, where also the relative position of the vehicle is reported. Theground board used, was modelled and designed following previous au-thors’ works on vehicle aerodynamics to ensure the absence of adverseeffects from the spill-over of the surrounding flow and to control thethickness of the boundary layer generated by the ground board itself [asan example 23, 24, 25, 26]. From the works of previous authors and tests,this table is suitable for performing crosswind experiments until a yawangle of 30�–35� appears.
To measure the aerodynamic forces acting on the vehicle, a six-component industrial dynamometric balance was connected to theinstrumented vehicle. The balance was located inside the trailer close tothe aerodynamic center of the vehicle model (see Fig. 3-b) to minimizethe aerodynamic moments on the balance itself. It was connected to thevehicle by an iron plate of thickness 2.0 cm. The balance and the windtunnel ground were connected by a circular support (diameter 30 mm)that was fixed to the balance and which passed through the bottom of thetrailer (see Fig. 3-b). The range for each force component and the cor-responding maximum error on full scale values are summarizedin Table 3.
Several experiments were made to compute the errors associated withthe aerodynamic forces at the different tested speeds and yaw angles. Theerrors associated with the measurements of the aerodynamic forces ac-count for the uncertainties in the flow parameters and in the test pro-cedures. Maximum errors of 2% for the CX, 7% for the CY and 5% for theCZ were measured. The measurement error was relatively small when theflow speed was increased, suggesting good result reliability and goodflow stability.
ck geometry.
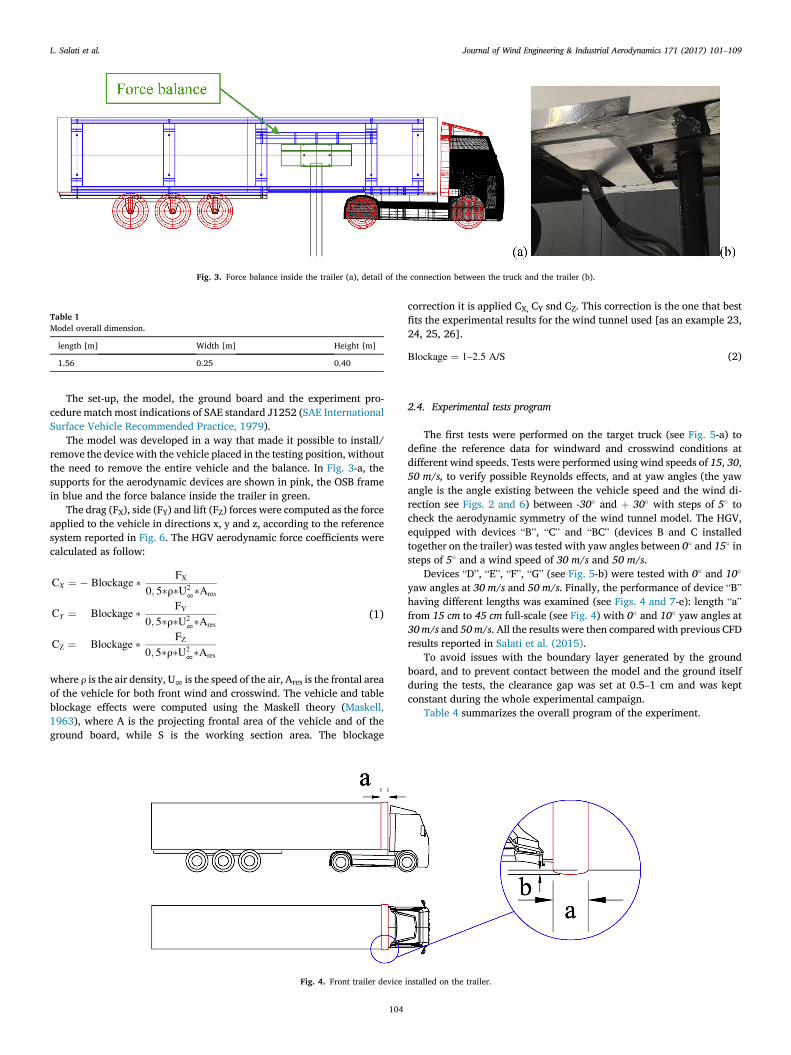
Fig. 3. Force balance inside the trailer (a), detail of the connection between the truck and the trailer (b).
Table 1Model overall dimension.
length [m] Width [m] Height [m]
1.56 0.25 0.40
L. Salati et al. Journal of Wind Engineering & Industrial Aerodynamics 171 (2017) 101–109
The set-up, the model, the ground board and the experiment pro-cedure match most indications of SAE standard J1252 (SAE InternationalSurface Vehicle Recommended Practice, 1979).
The model was developed in a way that made it possible to install/remove the device with the vehicle placed in the testing position, withoutthe need to remove the entire vehicle and the balance. In Fig. 3-a, thesupports for the aerodynamic devices are shown in pink, the OSB framein blue and the force balance inside the trailer in green.
The drag (FX), side (FY) and lift (FZ) forces were computed as the forceapplied to the vehicle in directions x, y and z, according to the referencesystem reported in Fig. 6. The HGV aerodynamic force coefficients werecalculated as follow:
CX ¼ � Blockage � FX
0; 5�ρ�U2∞�Ares
CY ¼ Blockage � FY
0; 5�ρ�U2∞�Ares
CZ ¼ Blockage � FZ
0; 5�ρ�U2∞�Ares
(1)
where ρ is the air density, U∞ is the speed of the air, Ares is the frontal areaof the vehicle for both front wind and crosswind. The vehicle and tableblockage effects were computed using the Maskell theory (Maskell,1963), where A is the projecting frontal area of the vehicle and of theground board, while S is the working section area. The blockage
Fig. 4. Front trailer device
104
correction it is applied CX, CY snd CZ. This correction is the one that bestfits the experimental results for the wind tunnel used [as an example 23,24, 25, 26].
Blockage ¼ 1–2.5 A/S (2)
2.4. Experimental tests program
The first tests were performed on the target truck (see Fig. 5-a) todefine the reference data for windward and crosswind conditions atdifferent wind speeds. Tests were performed using wind speeds of 15, 30,50 m/s, to verify possible Reynolds effects, and at yaw angles (the yawangle is the angle existing between the vehicle speed and the wind di-rection see Figs. 2 and 6) between -30� and þ 30� with steps of 5� tocheck the aerodynamic symmetry of the wind tunnel model. The HGV,equipped with devices “B”, “C” and “BC” (devices B and C installedtogether on the trailer) was tested with yaw angles between 0� and 15� insteps of 5� and a wind speed of 30 m/s and 50 m/s.
Devices “D”, “E”, “F”, “G” (see Fig. 5-b) were tested with 0� and 10�
yaw angles at 30 m/s and 50 m/s. Finally, the performance of device “B”having different lengths was examined (see Figs. 4 and 7-e): length “a”from 15 cm to 45 cm full-scale (see Fig. 4) with 0� and 10� yaw angles at30 m/s and 50 m/s. All the results were then compared with previous CFDresults reported in Salati et al. (2015).
To avoid issues with the boundary layer generated by the groundboard, and to prevent contact between the model and the ground itselfduring the tests, the clearance gap was set at 0.5–1 cm and was keptconstant during the whole experimental campaign.
Table 4 summarizes the overall program of the experiment.
installed on the trailer.
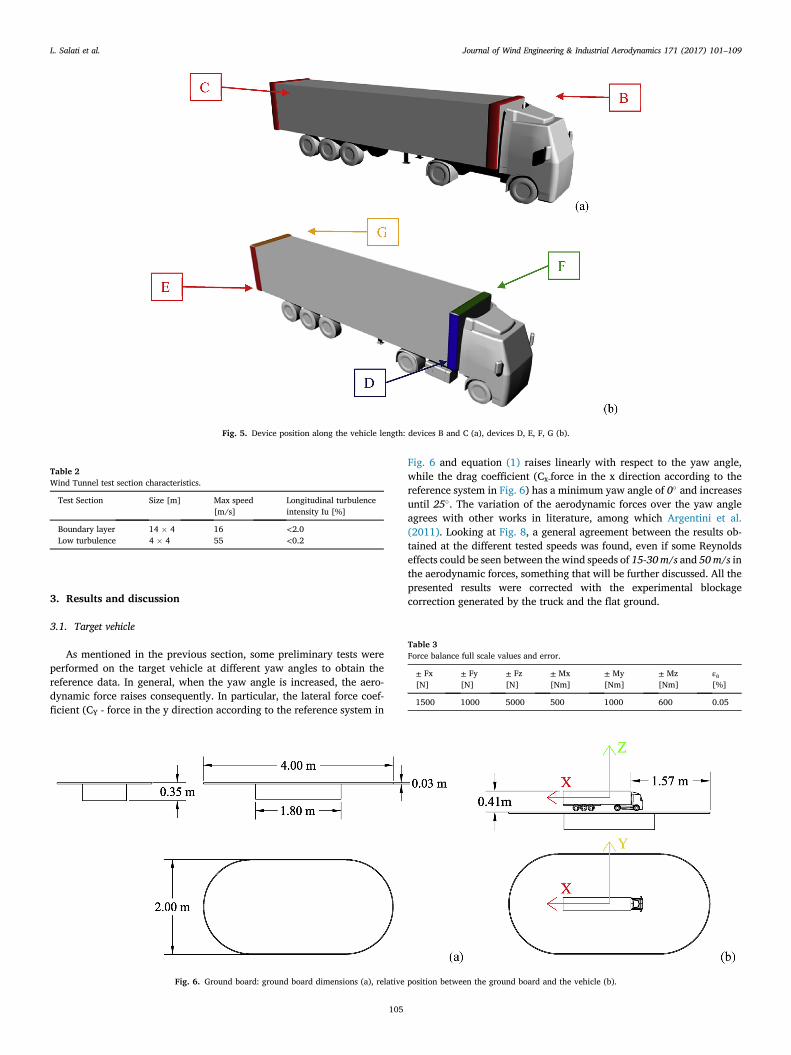
Fig. 5. Device position along the vehicle length: devices B and C (a), devices D, E, F, G (b).
Table 2Wind Tunnel test section characteristics.
Test Section Size [m] Max speed[m/s]
Longitudinal turbulenceintensity Iu [%]
Boundary layer 14 � 4 16 <2.0Low turbulence 4 � 4 55 <0.2
Table 3Force balance full scale values and error.
± Fx[N]
± Fy[N]
± Fz[N]
± Mx[Nm]
± My[Nm]
± Mz[Nm]
εa[%]
1500 1000 5000 500 1000 600 0.05
L. Salati et al. Journal of Wind Engineering & Industrial Aerodynamics 171 (2017) 101–109
3. Results and discussion
3.1. Target vehicle
As mentioned in the previous section, some preliminary tests wereperformed on the target vehicle at different yaw angles to obtain thereference data. In general, when the yaw angle is increased, the aero-dynamic force raises consequently. In particular, the lateral force coef-ficient (CY - force in the y direction according to the reference system in
Fig. 6. Ground board: ground board dimensions (a), relative
105
Fig. 6 and equation (1) raises linearly with respect to the yaw angle,while the drag coefficient (Cx-force in the x direction according to thereference system in Fig. 6) has a minimum yaw angle of 0� and increasesuntil 25�. The variation of the aerodynamic forces over the yaw angleagrees with other works in literature, among which Argentini et al.(2011). Looking at Fig. 8, a general agreement between the results ob-tained at the different tested speeds was found, even if some Reynoldseffects could be seen between the wind speeds of 15-30 m/s and 50 m/s inthe aerodynamic forces, something that will be further discussed. All thepresented results were corrected with the experimental blockagecorrection generated by the truck and the flat ground.
position between the ground board and the vehicle (b).
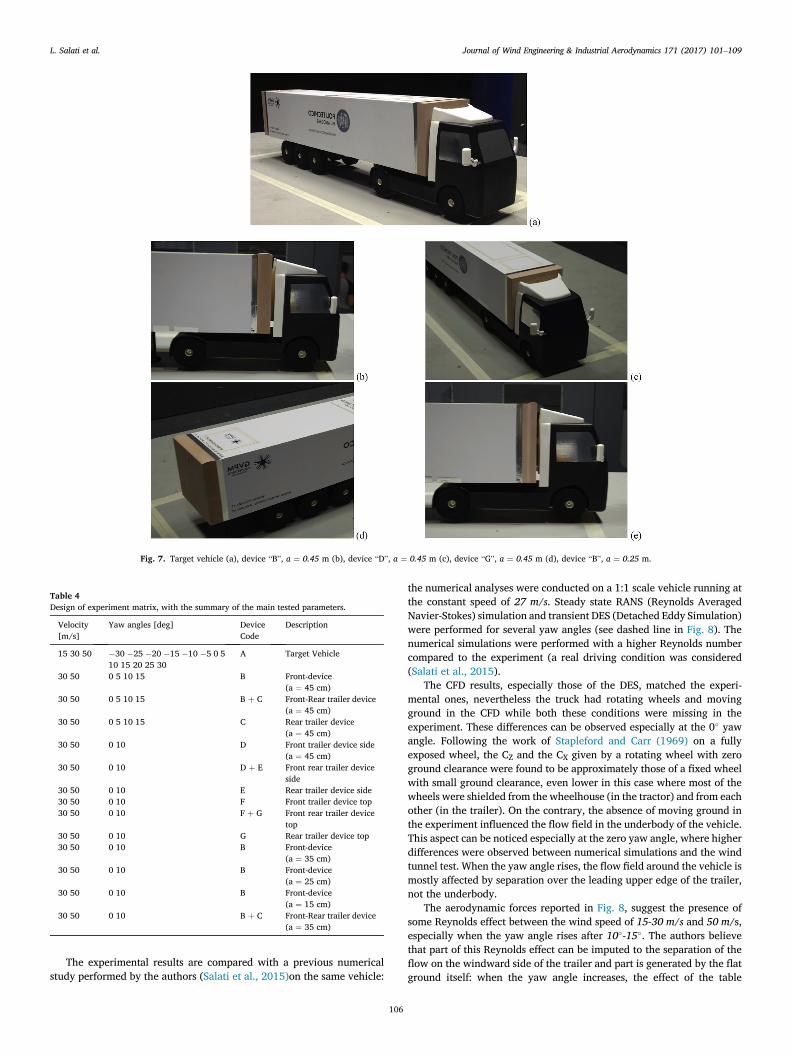
Fig. 7. Target vehicle (a), device “B”, a ¼ 0.45 m (b), device “D”, a ¼ 0.45 m (c), device “G”, a ¼ 0.45 m (d), device “B”, a ¼ 0.25 m.
Table 4Design of experiment matrix, with the summary of the main tested parameters.
Velocity[m/s]
Yaw angles [deg] DeviceCode
Description
15 30 50 �30 �25 �20 �15 �10 �5 0 510 15 20 25 30
A Target Vehicle
30 50 0 5 10 15 B Front-device(a ¼ 45 cm)
30 50 0 5 10 15 B þ C Front-Rear trailer device(a ¼ 45 cm)
30 50 0 5 10 15 C Rear trailer device(a ¼ 45 cm)
30 50 0 10 D Front trailer device side(a ¼ 45 cm)
30 50 0 10 D þ E Front rear trailer deviceside
30 50 0 10 E Rear trailer device side30 50 0 10 F Front trailer device top30 50 0 10 F þ G Front rear trailer device
top30 50 0 10 G Rear trailer device top30 50 0 10 B Front-device
(a ¼ 35 cm)30 50 0 10 B Front-device
(a ¼ 25 cm)30 50 0 10 B Front-device
(a ¼ 15 cm)30 50 0 10 B þ C Front-Rear trailer device
(a ¼ 35 cm)
L. Salati et al. Journal of Wind Engineering & Industrial Aerodynamics 171 (2017) 101–109
The experimental results are compared with a previous numericalstudy performed by the authors (Salati et al., 2015)on the same vehicle:
106
the numerical analyses were conducted on a 1:1 scale vehicle running atthe constant speed of 27 m/s. Steady state RANS (Reynolds AveragedNavier-Stokes) simulation and transient DES (Detached Eddy Simulation)were performed for several yaw angles (see dashed line in Fig. 8). Thenumerical simulations were performed with a higher Reynolds numbercompared to the experiment (a real driving condition was considered(Salati et al., 2015).
The CFD results, especially those of the DES, matched the experi-mental ones, nevertheless the truck had rotating wheels and movingground in the CFD while both these conditions were missing in theexperiment. These differences can be observed especially at the 0� yawangle. Following the work of Stapleford and Carr (1969) on a fullyexposed wheel, the CZ and the CX given by a rotating wheel with zeroground clearance were found to be approximately those of a fixed wheelwith small ground clearance, even lower in this case where most of thewheels were shielded from the wheelhouse (in the tractor) and from eachother (in the trailer). On the contrary, the absence of moving ground inthe experiment influenced the flow field in the underbody of the vehicle.This aspect can be noticed especially at the zero yaw angle, where higherdifferences were observed between numerical simulations and the windtunnel test. When the yaw angle rises, the flow field around the vehicle ismostly affected by separation over the leading upper edge of the trailer,not the underbody.
The aerodynamic forces reported in Fig. 8, suggest the presence ofsome Reynolds effect between the wind speed of 15-30 m/s and 50 m/s,especially when the yaw angle rises after 10�-15�. The authors believethat part of this Reynolds effect can be imputed to the separation of theflow on the windward side of the trailer and part is generated by the flatground itself: when the yaw angle increases, the effect of the table
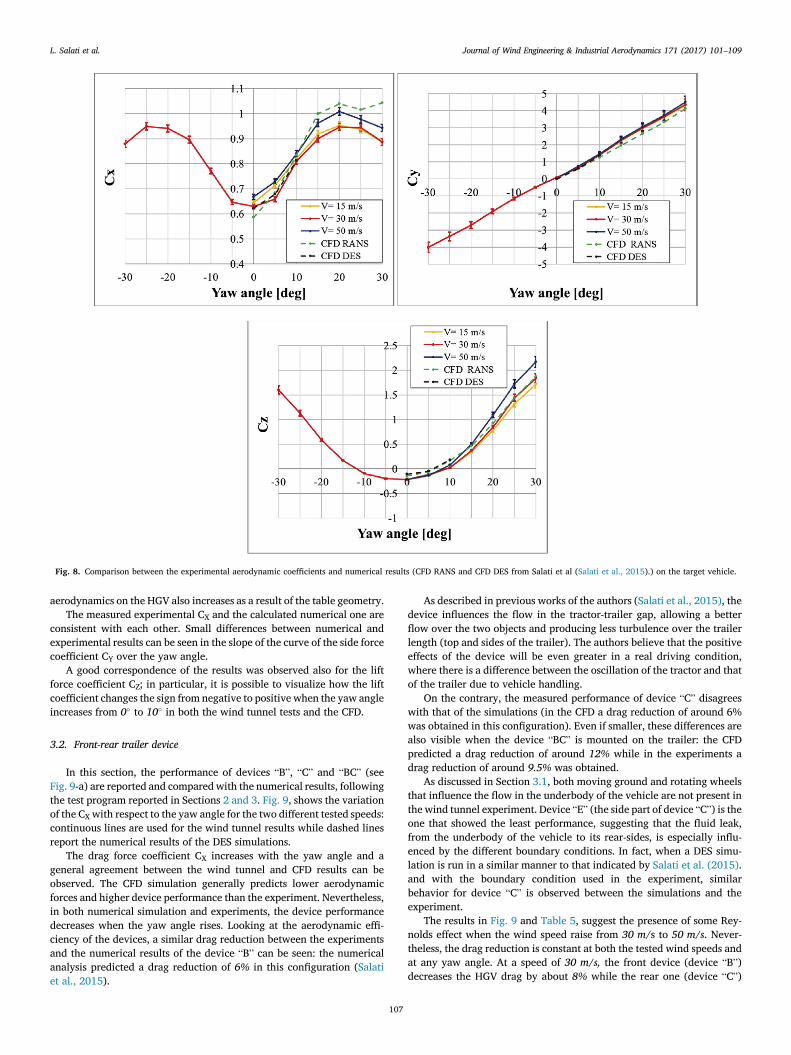
Fig. 8. Comparison between the experimental aerodynamic coefficients and numerical results (CFD RANS and CFD DES from Salati et al (Salati et al., 2015).) on the target vehicle.
L. Salati et al. Journal of Wind Engineering & Industrial Aerodynamics 171 (2017) 101–109
aerodynamics on the HGV also increases as a result of the table geometry.The measured experimental CX and the calculated numerical one are
consistent with each other. Small differences between numerical andexperimental results can be seen in the slope of the curve of the side forcecoefficient CY over the yaw angle.
A good correspondence of the results was observed also for the liftforce coefficient CZ; in particular, it is possible to visualize how the liftcoefficient changes the sign from negative to positive when the yaw angleincreases from 0� to 10� in both the wind tunnel tests and the CFD.
3.2. Front-rear trailer device
In this section, the performance of devices “B”, “C” and “BC” (seeFig. 9-a) are reported and compared with the numerical results, followingthe test program reported in Sections 2 and 3. Fig. 9, shows the variationof the CX with respect to the yaw angle for the two different tested speeds:continuous lines are used for the wind tunnel results while dashed linesreport the numerical results of the DES simulations.
The drag force coefficient CX increases with the yaw angle and ageneral agreement between the wind tunnel and CFD results can beobserved. The CFD simulation generally predicts lower aerodynamicforces and higher device performance than the experiment. Nevertheless,in both numerical simulation and experiments, the device performancedecreases when the yaw angle rises. Looking at the aerodynamic effi-ciency of the devices, a similar drag reduction between the experimentsand the numerical results of the device “B” can be seen: the numericalanalysis predicted a drag reduction of 6% in this configuration (Salatiet al., 2015).
107
As described in previous works of the authors (Salati et al., 2015), thedevice influences the flow in the tractor-trailer gap, allowing a betterflow over the two objects and producing less turbulence over the trailerlength (top and sides of the trailer). The authors believe that the positiveeffects of the device will be even greater in a real driving condition,where there is a difference between the oscillation of the tractor and thatof the trailer due to vehicle handling.
On the contrary, the measured performance of device “C” disagreeswith that of the simulations (in the CFD a drag reduction of around 6%was obtained in this configuration). Even if smaller, these differences arealso visible when the device “BC” is mounted on the trailer: the CFDpredicted a drag reduction of around 12% while in the experiments adrag reduction of around 9.5% was obtained.
As discussed in Section 3.1, both moving ground and rotating wheelsthat influence the flow in the underbody of the vehicle are not present inthe wind tunnel experiment. Device “E” (the side part of device “C”) is theone that showed the least performance, suggesting that the fluid leak,from the underbody of the vehicle to its rear-sides, is especially influ-enced by the different boundary conditions. In fact, when a DES simu-lation is run in a similar manner to that indicated by Salati et al. (2015).and with the boundary condition used in the experiment, similarbehavior for device “C” is observed between the simulations and theexperiment.
The results in Fig. 9 and Table 5, suggest the presence of some Rey-nolds effect when the wind speed raise from 30 m/s to 50 m/s. Never-theless, the drag reduction is constant at both the tested wind speeds andat any yaw angle. At a speed of 30 m/s, the front device (device “B”)decreases the HGV drag by about 8% while the rear one (device “C”)
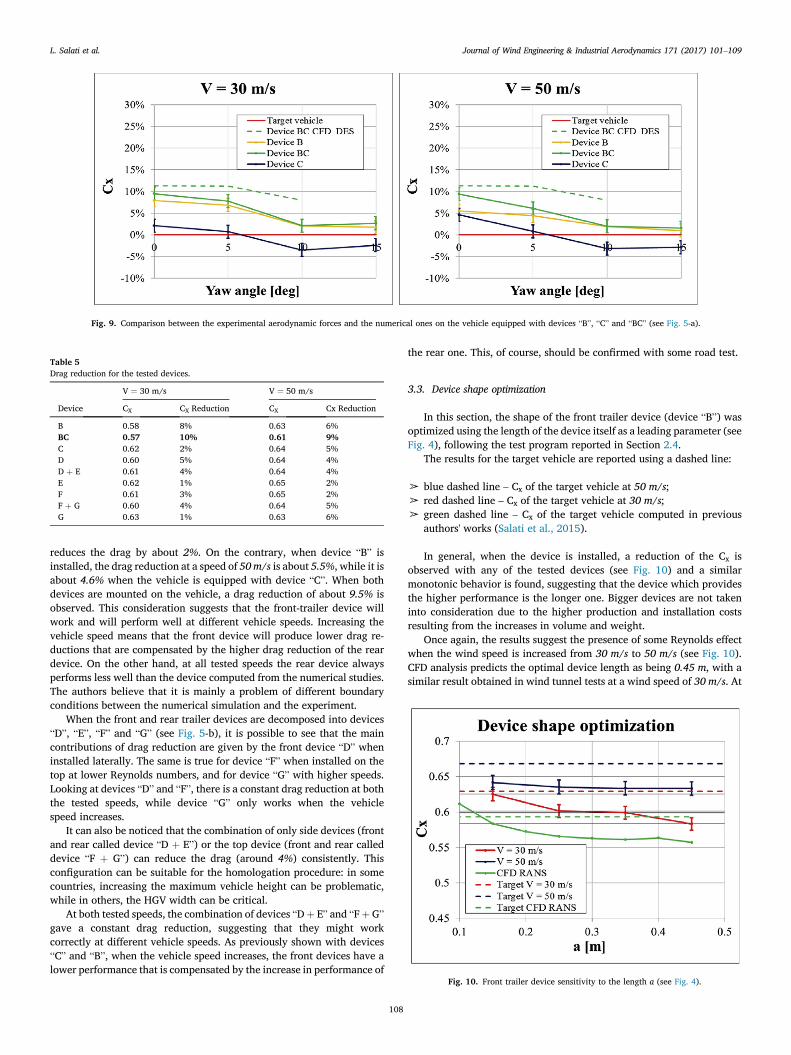
Fig. 9. Comparison between the experimental aerodynamic forces and the numerical ones on the vehicle equipped with devices “B”, “C” and “BC” (see Fig. 5-a).
Table 5Drag reduction for the tested devices.
V ¼ 30 m/s V ¼ 50 m/s
Device CX CX Reduction CX Cx Reduction
B 0.58 8% 0.63 6%BC 0.57 10% 0.61 9%C 0.62 2% 0.64 5%D 0.60 5% 0.64 4%D þ E 0.61 4% 0.64 4%E 0.62 1% 0.65 2%F 0.61 3% 0.65 2%F þ G 0.60 4% 0.64 5%G 0.63 1% 0.63 6%
L. Salati et al. Journal of Wind Engineering & Industrial Aerodynamics 171 (2017) 101–109
reduces the drag by about 2%. On the contrary, when device “B” isinstalled, the drag reduction at a speed of 50 m/s is about 5.5%, while it isabout 4.6% when the vehicle is equipped with device “C”. When bothdevices are mounted on the vehicle, a drag reduction of about 9.5% isobserved. This consideration suggests that the front-trailer device willwork and will perform well at different vehicle speeds. Increasing thevehicle speed means that the front device will produce lower drag re-ductions that are compensated by the higher drag reduction of the reardevice. On the other hand, at all tested speeds the rear device alwaysperforms less well than the device computed from the numerical studies.The authors believe that it is mainly a problem of different boundaryconditions between the numerical simulation and the experiment.
When the front and rear trailer devices are decomposed into devices“D”, “E”, “F” and “G” (see Fig. 5-b), it is possible to see that the maincontributions of drag reduction are given by the front device “D” wheninstalled laterally. The same is true for device “F” when installed on thetop at lower Reynolds numbers, and for device “G” with higher speeds.Looking at devices “D” and “F”, there is a constant drag reduction at boththe tested speeds, while device “G” only works when the vehiclespeed increases.
It can also be noticed that the combination of only side devices (frontand rear called device “D þ E”) or the top device (front and rear calleddevice “F þ G”) can reduce the drag (around 4%) consistently. Thisconfiguration can be suitable for the homologation procedure: in somecountries, increasing the maximum vehicle height can be problematic,while in others, the HGV width can be critical.
At both tested speeds, the combination of devices “Dþ E” and “FþG”gave a constant drag reduction, suggesting that they might workcorrectly at different vehicle speeds. As previously shown with devices“C” and “B”, when the vehicle speed increases, the front devices have alower performance that is compensated by the increase in performance of
108
the rear one. This, of course, should be confirmed with some road test.
3.3. Device shape optimization
In this section, the shape of the front trailer device (device “B”) wasoptimized using the length of the device itself as a leading parameter (seeFig. 4), following the test program reported in Section 2.4.
The results for the target vehicle are reported using a dashed line:
➢ blue dashed line – Cx of the target vehicle at 50 m/s;➢ red dashed line – Cx of the target vehicle at 30 m/s;➢ green dashed line – Cx of the target vehicle computed in previous
authors' works (Salati et al., 2015).
In general, when the device is installed, a reduction of the Cx isobserved with any of the tested devices (see Fig. 10) and a similarmonotonic behavior is found, suggesting that the device which providesthe higher performance is the longer one. Bigger devices are not takeninto consideration due to the higher production and installation costsresulting from the increases in volume and weight.
Once again, the results suggest the presence of some Reynolds effectwhen the wind speed is increased from 30 m/s to 50 m/s (see Fig. 10).CFD analysis predicts the optimal device length as being 0.45 m, with asimilar result obtained in wind tunnel tests at a wind speed of 30 m/s. At
Fig. 10. Front trailer device sensitivity to the length a (see Fig. 4).
L. Salati et al. Journal of Wind Engineering & Industrial Aerodynamics 171 (2017) 101–109
the highest wind velocity, the performances of the device are almostconstant at all lengths. This test suggests that even if the device length hasa limited influence at higher Reynolds numbers, the optimum length of0.45 m is the most suitable one for several different vehicle speeds.
4. Conclusion
In this paper, wind tunnel tests were performed on a heavy goodstruck equipped with a Front-Rear trailer device previously developedusing a CFD approach by the authors (Salati et al., 2015). The resultsshow good agreement between the numerical calculations and theexperimental measured data. The obtained maximum drag reduction isabout 9.5% when both the front device and the rear one are installed onthe truck. The optimum length of the device is about 45 cm. The devicegives a drag reduction both in front and crosswind conditions. The lateraland vertical forces acting on the vehicle do not change significantly,indicating that there are no critical issues for vehicle handling and sta-bility in crosswind.
It can also be noticed that the combination of only side devices (frontand rear called device “D þ E”) or the top device (front and rear calleddevice “F þ G”) can reduce the drag (around 4%) consistently. Thisconfiguration can be suitable for the homologation procedure: in somecountries, increasing the maximum vehicle height can be problematic,while in others, the HGV width can be critical.
The authors believe that the impact of the developed device will behigher in cases in which the trailer and the tractor are made by differentproducers and are not integrated with each other as normally occurs withmost heavy trucks. They help the flow-fields in one of the most criticalareas of drag reduction: the gap between the driving cab and the trailer.Nevertheless, this device can also be a good strategy for reducing theaerodynamic forces acting on a container, where the shear stress and thedrag sources are much higher than on a standard trailer.
References
Argentini, T., Ozkan, E., Rocchi, D., Rosa, L., Zasso, A., 2011. Cross-wind effects on avehicle crossing the wake of a bridge pylon. J. Wind Eng. Ind. Aerodyn. 99 (6–7),734–740. https://doi.org/10.1016/j.jweia.2011.01.021. ISSN 0167-6105.
Buchheim, R., Deutenbach, K., Lückoff, H., 1981. Necessity and Premises for Reducing theAerodynamics Drag of Future Passenger Cars. SAE Technical Paper 810185. https://doi.org/10.4271/810185.
Cooper, K., 2003. Truck Aerodynamics Reborn - Lessons from the Past. SAE TechnicalPaper 2003-01-3376. https://doi.org/10.4271/2003-01-3376.
D�avila, A., Nombela, M., 2011. Sartre - Safe Road Trains for the Environment ReducingFuel Consumption through Lower Aerodynamic Drag Coefficient. SAE TechnicalPaper 2011-36-0060. https://doi.org/10.4271/2011-36-0060.
109
Drollinger, R., 1987. Heavy Duty Truck Aerodynamics. SAE Technical Paper 870001.https://doi.org/10.4271/870001.
Garry, K.P., 1981. Development of container-mounted devices for reducing theaerodynamics drag of commercial vehicles. J. Wind Eng. Ind. Aerodyn. 9, 113–124.https://doi.org/10.1016/0167-6105(81)90082-9.
Garry, K.P., 1985. A review of commercial vehicle aerodynamics drag reductiontechniques. Proc. Inst. Mech. Eng. D Transp. Eng. 199, 215–220. https://doi.org/10.1243/PIME_PROC_1985_199_159_01.
Gilhaus, A., June 1980. “The influence of cab shape on air drag of trucks. In: Presented atthe 4th Colloquium on Industrial Aerodynamics, vols. 1–20, pp. 133–156. Aachen.
Howell J., “The influence of ground simulation on the aerodynamics of simple car shapeswith an underfloor diffuser,” Presented at the RaeS Conference on VehicleAerodynamics, Loughborough, July 1994, pp. 36.1-11.
Hucho, W.H., 1987. Aerodynamics of Road Vehicles. Butterworth, ISBN 0408014229.London.
Ingram, K., 1978. The wind-averaged drag coefficient applied to heavy goods vehicles,”Transport and Road Research Laboratory. TRRL Suppl. Rep. 392.
Landman, D., Wood, R., Seay, W., Bledsoe, J., 2010. Understanding practical limits toheavy truck drag reduction. SAE Int. J. Commer. Veh. 2 (2), 183–190. https://doi.org/10.4271/2009-01-2890.
Leuschen, J., Cooper, K., 2006. Full-scale Wind Tunnel Tests of Production and Prototype,Second-generation Aerodynamic Drag-reducing Devices for Tractor-trailers. SAETechnical Paper 2006-01-3456. https://doi.org/10.4271/2006-01-3456.
Leuschen, J., Cooper, K.R., 2009. Summary of Full-scale Wind Tunnel Tests ofAerodynamics Drag-reducing Devices for Tractor–trailers. The Aerodynamics ofHeavy Vehicles II: Trucks, Buses, and Trains. Springer, New York, pp. 451–462.https://doi.org/10.1007/978-3-540-85070-0_41.
Maskell, E.C., November 1963. A Theory of the Blockage Effects on Bluff Bodies andStalled Wings in a Closed Wind Tunnel, vol. 340. Ministry of Aviation (UK). Reportsand Memoranda R & M.
McCallen, R., Salari Ortega, J., Castellucci, P., Browand, F., Hammache, M. et al., “DOE’seffort to reduce truck aerodynamics drag – joint experiments and computations leadto smart design,” Presented at the 34th AIAA Fluid Dynamics Conference and Exhibit,AIAA 2004-2249, Portland, June 22, 2004, UCRL-CONF-204819.
Minelli Krajnovi�c, S., Basara, B., Noack, B.R., 2016. Numerical investigation of active flowcontrol around a generic truck a-pillar. Flow, Turbul. Combust. 1573–1987. https://doi.org/10.1007/s10494-016-9760-3.
SAE International Surface Vehicle Recommended Practice, “Wind Tunnel Test Procedurefor Trucks and Buses” SAE Standard J1252, Rev. Aug. 1979.
Palowski, F.W., 1930. Wind resistance of automobiles. SAE J. 27, 5–14.Salati, L., Cheli, F., Schito, P., 2015. Heavy truck drag reduction obtained from devices
installed on the trailer. SAE Int. J. Commer. Veh. 8 (2), 747–760. https://doi.org/10.4271/2015-01-2898.
Schito, P., Braghin, F., 2012. Numerical and experimental investigation on vehicles inplatoon. SAE Int. J. Commer. Veh. 5 (1), 63–71. https://doi.org/10.4271/2012-01-0175.
Schoon, R., 2007. On-road Evaluation of Devices to Reduce Heavy Truck AerodynamicsDrag. SAE Technical Paper 2007-01-4294. https://doi.org/10.4271/2007-01-4294.
Stapleford, W.R., Carr, G.W., 1969. Aerodynamic Characteristics of Exposed RotatingWheels. MIRA. MIRA Rep. No. 1970/2.
The Council of The European Union, July 1996. Council Directive 96/53/EC.Watkins, S., Saunders, J.W., Hoffman, P.H., 1993. Comparison of road and wind-tunnel
drag reductions for commercial vehicles. J. Wind Eng. Ind. Aerodyn. 49, 411–420.