journal of sciences implementation of measurement system analysis
TRANSCRIPT

Volume 2 No.10, October 2012 ISSN 2224-3577
International Journal of Science and Technology
©2012 IJST. All rights reserved
http://www.ejournalofsciences.org
749
Implementation of Measurement System Analysis System (MSA):
In the Piston Ring Company "Case Study"
Farhad Kooshan Quality Engineering Manager, Department of Research & Development
ABSTRACT
In this survey, case study program is evaluated to improve one the Iran khodro company suppliers . And we tried to implement
measurement analysis system that is one of the requirements of the automotive companies, leads to powerful increase in product quality
and reducing the cost of duplication and external/internal failure and price. In this paper we used a methodology called; MSA along with
APQP and designing the test in the form of three inspectors in the final control on one of important characteristics to measure (the
AXIAL WIDTH of ring piston), with measurement, instruments capability(variable aspect),and inspector capability (attribute aspect).
The MSA action strongly influences the company s general business performance as revealed by the final analysis in the article. In
conclusion, the results concerning the first test (GR&R or capability of measuring instrument) was accepted by implementing the
required corrective action, And the results for attribute test (inspector capability) and their ability were identified to detect the correct
piece, and the inspectors were achieved in organizing arrangements.
Keywords: Measurement System, Repeatability, Reproducibility, Reference Value
1. INTRODUCTION
In the last, the calibration was used to determine the quality of
measurement instruments. in calibration only measurement
instruments in an ideal conditions is investigation in a room
with trained people, standard parts, and standard instruction.
MSA, to measure system performance in real conditions.
Because in inflation and lack of efficient production, the
companies have been forced to implement quality management
system. The standards include: DIN EN ISO9000 Inspection,
Measuring and Test Equip ment QS 9000 4.11.4 Measuring
System AnalysisISO/TS 16949 4.11.1.2 Measuring System
Analysis[1,2] one of the requirements of the standards
mentioned above, is “MSA” the final consumer is prevented
from sending the defective product. understanding and
managing measurement error generally called measurement
system analysis (MSA),is an extremely important function in
process improvement[3],if all customer engineering design
record and specification requirements are properly understood
by the supplier and that the process has the potential to produce
product consistently meeting during an actual production run
[4]. Total quality management has significantly positive effect
on operational and business performance [5].the use of (TQM)
as an overall quality program is still prevalent in modern
industry ,but many companies are extending this kindof
initiative to incorporate strategic and financial issues[6]. After
the TQM hyp of the early 1980s, six sigma ,building on well-
proven elements of TQM, can be seen as the current stage of
evolution [7] .Six sigma program is a key to successfully
implementing a quality management system[8]. Six sigma is a
business strategy that seeks to identify and eliminate causes of
errors or defects-defined as anything which could lead to
customer dissatisfaction [9] or failure in business process by
focusing on output that are critical to customer [10], it uses the
normal distribution and a strong relationship between product
nonconformities, or defects, and product yield, reliability ,cycle
time, inventory, etc[11]. Advanced product quality planning (or
APQP) is a framework of procedures and techniques used to
develop products in industry, particularly the automotive
industry. It is quite similar to the concept of Design For Six
Sigma (DFSS). It is a defined process for a product
development system for General Motors, Ford, Chrysler and
their suppliers. According to the Automotive Industry Action
Group (AIAG), the purpose of APQP is "to produce a product
quality plan which will support development of a product or
service that will satisfy the customer. The APQP process, which
is part of a series of interrelated documents that the basis for the
make-up of a Process Control Plan is included in the APQP
Manual. These manuals include: AIAG, APQP Manual [12].
1. The FMEA Manual
2. The Production Part Approval Process (PPAP) Manual
3. The Statistical process control (SPC) Manual
4. The Measurement Systems Analysis (MSA) Manual In
FMEA, failures are prioritized according to how
serious their consequences are, how frequently they
occur and how easily they can be detected. An FMEA
also documents current knowledge and Below is the
list of all 18 elements, and a brief description of them
[4].
-Design Records A copy of the drawing. If the customer is
design responsible this is a copy of actions about the risks of
failures for use in continuous improvement. FMEA is used

Volume 2 No.10, October 2012 ISSN 2224-3577
International Journal of Science and Technology
©2012 IJST. All rights reserved
http://www.ejournalofsciences.org
750
during the design stage with an aim to avoid future failures
(sometimes called DFMEA in that case). Later it isused for
process control, before and during ongoing operation of the
process. Ideally, FMEA begins during the earliest conceptual
stages of design and continues throughout the life of the product
or service. AIAG FMEA Manual [13]. Although initially
developed by the military, FMEA methodology is now
extensively used in a variety of industries including
semiconductor processing, food service, plastics, software, and
healthcare. It is integrated into the Automotive Industry Action
Group's (AIAG) Advanced Product Quality Planning (APQP)
process to provide risk mitigation in both product and process
development phases. Each potential cause must be considered
for its effect on the product or process and, based on the risk,
actions are determined and risks revisited after actions are
complete. Toyota has taken this one step further with its Design
Review Based on Failure Mode (DRBFM) approach. The
method is now supported by the American Society for Quality
which provides detailed guides on applying the method.The
outcomes of an FMEA development are actions to prevent or
reduce the severity or likelihood of failures, starting with the
highest-priority ones. It may be used to evaluate risk
management priorities for mitigating known threat
vulnerabilities. FMEA helps select remedial actions that reduce
cumulative impacts of life-cycle consequences (risks) from a
systems failure [14]. Is highlighted in Fig.1. It is used in many
formal quality systems such as QS-9000 or ISO/TS 16949.
Fig.1: FMEA CYCLE
customer drawing that is sent together with the Purchase Order
(PO). If supplier is design responsible this is a released drawing
in supplier's release system.
-Authorized Engineering Change (note) Documents A
document that shows the detailed description of the change.
Usually this document is called "Engineering Change Notice",
but it may be covered by the customer PO or any other
engineering authorization.
-Engineering Approval This approval is usually the Engineering
trial with production parts performed at the customer plant. A
"temporary deviation" usually is required to send parts to
customer before PPAP. Customer may require other
"Engineering Approvals".
.-DFMEA A copy of the Design Failure Mode and Effect
Analysis (DFMEA), reviewed and signed-off by supplier and
customer. If customer is design responsible, usually customer
may not share this document with the supplier. However, the
list of all critical or high impact product characteristics should
be shared with the supplier, so they can be addressed on the
PFMEA and Control Plan.
-Process Flow Diagram A copy of the Process Flow, indicating
all steps and sequence in the fabrication process, including
incoming components.
-PFMEA A copy of the Process Failure Mode and Effect
Analysis (PFMEA), reviewed and signed-off by supplier and
customer. The PFMEA follows the Process Flow steps, and
indicate "what could go wrong" during the fabrication and
assembly of each component.
-Control Plan A copy of the Control Plan, reviewed and signed-
off by supplier and customer. The Control Plan follows the
PFMEA steps, and provides more details on how the "potential
issues" are checked in the incoming quality, assembly process
or during inspections of finished products.
-Measurement System Analysis Studies (MSA) MSA usually
contains the Gage R&R for the critical or high impact
characteristics, and a confirmation that gauges used to measure
these characteristics are calibrated.
-Dimensional Results A list of every dimension noted on the
ballooned drawing. This list shows the product characteristic,
specification, the measurement results and the assessment
showing if this dimension is "ok" or "not ok". Usually a
minimum of 6 pieces is reported per product/process
combination.
.-Records of Material / Performance Tests A summary of
every test performed on the part. This summary is usually on a
form of DVP&R (Design Verification Plan and Report), which
lists each individual test, when it was performed, the
specification, results and the assessment pass/fail. If there is an
Engineering Specification, usually it is noted on the print. The
DVP&R shall be reviewed and signed off by both customer and
supplier engineering groups. The quality engineer will look for
a customer signature on this document.
In addition, this section lists all material certifications (steel,
plastics, plating, etc.), as specified on the print. The material
certification shall show compliance to the specific call on the
print.
.-Initial Process Studies Usually this section shows all
Statistical Process Control charts affecting the most critical
characteristics. The intent is to demonstrate that critical

Volume 2 No.10, October 2012 ISSN 2224-3577
International Journal of Science and Technology
©2012 IJST. All rights reserved
http://www.ejournalofsciences.org
751
processes have stable variability and that is running near the
intended nominal value
-Qualified Laboratory Documentation Copy of all laboratory
certifications (e.g. A2LA, TS) of the laboratories that
performed the tests reported.
.-Appearance Approval Report A copy of the AAI
(Appearance Approval Inspection) form signed by the
customer. Applicable for components affecting appearance only
-Sample Production Parts A sample from the same lot of initial
production run. The PPAP package usually shows a picture of
the sample and where it is kept (customer or supplier).
.-Master Sample A sample signed off by customer and
supplier, that usually is used to train operators on subjective
inspections such as visual or for noise.
-Checking Aids When there are special tools for checking parts,
this section shows a picture of the tool and calibration records,
including dimensional report of the tool.
-Customer-Specific Requirements Each customer may have
specific requirements to be included on the PPAP package. It is
a good practice to ask the customer for PPAP expectations
before even quoting for a job. North America auto makers
OEM (Original Equipment Manufacturer) requirements are
listed on the IATF website.
-Part Submission Warrant (PSW) This is the form that
summarizes the whole PPAP package. This form shows the
reason for submission (design change, annual revalidation, etc.)
and the level of documents submitted to the customer. There is
a section that asks for "results meeting all drawing and
specification requirements: yes/no" refers to the whole package.
If there is any deviations the supplier should note on the
warrant or inform that PPAP cannot be submitted. AS a
requirement for statistical process control (MSA)
implementation , the MSA action has been required to ensure
that measured values are correct and relevant for analysis based
on SPC, thus ,MSA has been performed for the measuring
system used to measure variable values of the most important
product quality characteristic, directly related to the majority of
nonconformities found in the observed manufacturing system.
APQP consists of five phases: [12].
1-Plan and Define Program
2-Product Design and Development Verification
3-Process Design and Development Verification
4-Product and Process Validation
5-Launch, Feedback, Assessment & Corrective Action and
according law”1-10-100”, if defect is detected before the
production stage, it will take a costs once time, in the
production stage, it will take a cost equal ten times, finally
when it reaches to the customer, we will have a cost equal
100times, in comparison to the first price[15].
2. THE SUBJECT
There are many variables in production processes that lead to
the correct misdiagnosis, the process may be measured using
improper measuring tools or directional results obtained are
not consistent with reality,[16]. A measurement system
incapable of detecting process variation can never be trusted to
make a decisions on process adjustment [17]. In the repeated
measuring different sizes may be read by the operator, or
operators are different than each other. Even when measuring
devices are properly used, device to measure the wrong
displays, MSA focus is on understanding the measurement
process, determining the amount of error in the process, and
assessing the adequacy of the measurement system for product
and process control and promotes understanding and
improvement-variation reduction, AIAG,MSA Manual[18]. Measuring equipment and processes must be well controlled
and suitable to their application in order to assure accurate data
collection [19] . MSA is useful not audit existing measurement
system, but also to select the most appropriate ones for a new
measurement task [20]. Changes in outcome measures include:
AIAG,MSA Manual[18].
1-real changes in product process
2-due to changes in measurement system
Measurement is defined as “the assignment of numbers to
material things to represent the relations among them with
respect to particular properties. [21,22]. The purpose of this
paper is the following fundamental questions to be answered.
1-does the measuring equipment have the capability in the
consequent measurement?
2-do all operators have the same efficiency?
3-do the operators have the potential of making errors that may
lead to duplication cost and defective product?
4-is there any difference between operators in the consequent
measurement?
5-is there any tendency in operators to accept or reject the
product?

Volume 2 No.10, October 2012 ISSN 2224-3577
International Journal of Science and Technology
©2012 IJST. All rights reserved
http://www.ejournalofsciences.org
752
In this research scientific application of (aspects variable
&attribute) is carried.
3. THE ROLE OF MSA IN THE
PERFORMANCE MANAGEMENT
3-1-The changes are primarily two categories based on following:
AIAG,MSA Manual[18]: closeness to the true value or an
accepted :Accurate
Fig. 2.Illustrates the concept of accuracy and precision
The MSA reference manual defines data quality and error in
terms, The following Fig-3
Fig. 3.shows the fluctuations of the system is measured
3-2-the precision of a measurement system includes the
following components .AIAG,MSA Manual[18].
Repeatability
• Variation in measurements obtained with one
measuring instrument when used several times by an
appraiser while measuring the identical characteristic
on the same part[23,24]
• The variation in successive (short term) trials under
fixed and defined conditions of measurement Commonly referred to as E.V. (following Fig.4)
Is determined by multiplying the average rang ( by a constant
(K1). K1 depends upon the number of trial used in the gage
study.
EV= *K1 (1-1)
Fig. 4: Equipment Variation or Within-system variation
Reproducibility
Variation in the average of the measurements made by different
appraisers using the same gage when measuring a characteristic
on one part. For product and process qualification, error may
be appraiser, environment (time),or method [18,19].
.Commonly referred to as A.V. Appraiser Variation (following
Fig.5)
Therefore, is calculated by :
AV √ DIFF*K2)2 –(EV2/nr)] (1-2)
K2 depend upon the number of appraisers used in the gage
study.
Where n=number of part and, r=number of trials.
Fig. 5: Appraiser Variation
The measurement system variation for repeatability and
reproducibility (GR&R) is calculated by adding the square of
the equipment variation and square of the appraiser variation
and taking the square root as follows Fig-6
R&R= 2)+(AV2)] (1-3)
OR
2
ityRepeatibil
2
ilityReprodueib
2 GRR

Volume 2 No.10, October 2012 ISSN 2224-3577
International Journal of Science and Technology
©2012 IJST. All rights reserved
http://www.ejournalofsciences.org
753
Fig. 6: Gage R&R or GRR
Part Variation
In determining measurement systems error(R&R), is acceptable
or not, we should compare it with a criterion. Is determined by
multiplying the rang of part averages (RP) by a constant (K3).
K3 depends upon the number of part used in the gage study.
(1-4) PV= RP * K3
Total variation (TV)
It is calculated by summing the square of both the repeatability
and reproducibility variation and the part to part variation (PV)
and taking the square root as follows:
(1-5) TV=√ 2+PV2)
For measurement system whose purpose is to analyze a process,
a general rule of thumb for measurement system acceptability is
as following: (AIAG, MSA Manual [18]).
if R&R:
-under 10 percent error generally considered to be an acceptable
measurement system.
-10 percent to 30 percent error may be acceptable based upon
importance of application, cost of measurement device. Cost of
repair, etc.
-over 30 percent considered to be not acceptable every effort
should be made to improve the measurement system.
4. CONDUCT RESEARCH
In evaluate the measurement system analysis in parts
manufacturing company piston ring, after organizing the quality
assurance department, the experimental was designed in the
final control. the company started a quality improvement
project through APQP methodology implementation, aiming
to reduce process variability and
waste(defects/nonconformities)and improve business
performances.
With implementing of APQP phases studying of related
documents from OEM, and with using people who are expert
in the ring industry we obtained DFMEA that gave us role
and performance of part all failure mode ,potential effect failure
has been recognized, and the DFMEA became as basis of
developing of ( PFMEA -control plan) for controlling the
process .(Table.2).
Recognizing the importance of the characteristic following
table details the major product is described as well as the degree
of its importance.( Table.1). The AXIAL WIDTH of the ring
was identified as important characteristics.
4.1 Case Study
Ring piston is a Cylindrical piece of metal with a spring
capability and high strain, which is inserted in grooves in the
top part of piston. The goals of rings are sealing the space
between piston and cylinder and discharging the combustion
gases.
Overall, the main tasks of the combustion engine piston ring
are:
1. Compress the air in the cylinder.
2. Prevent to penetration of oil into the combustion
chamber.
Due to the nature of these two functions piston rings are made
with AXIAL WIDTH precision. otherwise fuel consumption
will be increased, the oil leaking into the combustion chamber
or low engine compress. in the top of piston, the ring is located
in the grooves where are built for this purpose. the piston outer
is not circle complete. One of the most mechanical role of ring
is interaction between piston and bush. if the (AXIAL WIDTH)
height of the ring goes up, it will be stuck in butt and cylinder
&bush will be damaged. when The AXIAL WIDTH of the ring
goes down, ring to be looses in butt, and finally breaks. The
characteristic processes in two steps to close to the numbers of
the map(1.48mm:iso-6621-2:2003) the equipments that used in
the production process is called “DUS” machine, besides the
equipments that can measure the height of ring is named
“micrometer or measuring-time”

Volume 2 No.10, October 2012 ISSN 2224-3577
International Journal of Science and Technology
©2012 IJST. All rights reserved
http://www.ejournalofsciences.org
754
Table 1: Important Characteristics
SPECIAL CHARACTERISTICS PAGE:1 CODE :RKP –FR-EN-03
DATE:2012/6/5 REV NR:00
DRAWINGNr:R011122-00 : PRODUCTNAME:FIRST RING(XU7)
APQP TEAM:
CODE:001-Z-CR-P-KV1
1 AXIAL WIDTH
A
TU = 1.47 mm . TO = 1.49 mm
2 RADIAL WALL THICKNESS
A TO =3.6 mm , TU = 3.3 mm
3 TANGENTIAL LOAD
B TO=11.2N ,TU=16.8
4 LIGHT TIGHTNESS A 100%
5 DIAMETERE A
(83)
6 ROUGH NESS B
4µm RZ=
7 GAP CLEARANCE A
TO =0.2 mm
TU = 0.35 mm
8 COATING THICKNESS C
Max= 2
9 COATING COHESION AND RESISTANCE C
ACCORDING TO GOETZE

Volume 2 No.10, October 2012 ISSN 2224-3577
International Journal of Science and Technology
©2012 IJST. All rights reserved
http://www.ejournalofsciences.org
755
ACT RESULT Recom
mended
action
RP
N
Det
ecti
on
(d)
Current control
Occ
ura
nce
(
o)
Potential
cause of
failure
cla
ss
Sev
erit
y (
s)
Po
ten
tial
effe
ct f
ail
ure
Pro
cess
fail
ure
mo
de
pro
cess
RPN D O
S
Actions
taken preention
detection
27 3 1 9
Performing of
msa in final
controlling for
improving of
production
process-
(R&R),E,pMIS
S
,PFALSE
Cp,cpk=1.62-
1.55
implem
enting
MSA
After
that
implent
ing SPC
And
capabilt
y
process
162 3
Operating
and
controlling
of
parameters
In
accordance
with
instruction
clock 6
Not
functioning
properly in
purification
and cool
equipment
B 9
Duplicatin
g
(rework)
The height of
AXIAl
WIDTH
goes up
DUS-
1
DUS-
2
27 3 1 9
" "" 162 3
Daily op-
supervisor
controlling
indicator 6 Not setting of
magnet surface
*A 9 wasting
The height of
AXIAl
WIDTH
goes down
" "" 162 3 " thermomet
er 6
inappropriate
of solution
temperature
80 5
Setting first
shift(dressin
g)
Daily
controlling
of height
by
operator
2
inappropriate
the space
between stone
to magnet
B 8
Not
functionin
g properly
Not uniformed
height
80 5 " " 2
Not prospering
the angle
between two
stone
*A 8 wasting breaking
6 2
Daily
supervisor
controlling
Warning
system 2
Cutting out or
lacking of Debi
cooling
solution
C 2 appearanc
e
The surface of
parts changes
blue
5. METHODOLOGY AND NUMERICAL
CALCULATIONS
AIAG,MSA Manual[18]. Refer to the GRR data sheet in
Tables. 3,4 the detailed procedure is as follows:
1. Obtain a sample of 10 parts that represent the actual or
expected range of process variation. Refer to the
appraisers as A,B,C .so that number are not visible to the
appraisers
2. Instrument was calibrated.
Table 2- POTENTIAL FAILURE MODE&EFFECTS ANALYSIS (PFMEA) REV:
PART NO:
9624507980
DOC NO:
PART/PRODUCT
NAME:RING PISTON
PROCESS:RING
PISTON DATE:

Volume 2 No.10, October 2012 ISSN 2224-3577
International Journal of Science and Technology
©2012 IJST. All rights reserved
http://www.ejournalofsciences.org
756
3. Let appraiser A measure 10 parts in a random order and
enter the results in row 1. 4. Let appraisers B and C measure the same 10 parts
without seeing Each other reading ;then enter the results
in rows 6 and 11,respectively.
5. Repeat the cycle using a different random order of
measurement enter data in rows 2,7 and 12.record the
data in the appropriate column.
6. Subtract the smallest reading from the largest in
rows1,2,3;enter the result in row 5. Do the same for rows
6,7, and 8; and 11,12,and 13 and enter results in rows 10
and15 ,respectively.
7. Total row 5 and divide the total by the number of parts
sampled to obtain the average range for the first
appraisers trials Do the same for rows 10 and 15 to
obtain , . 8. Transfer the averages of rows 5,10 and 15( , )to
row 17.add them together and divide by the number of
appraisers and enter results (average of all ranges).
9. Enter (average value)in rows 19 and 20and multiply by
D4 To get the lower and upper control limits .note D4 is
3.27 if two trials are used the value of the upper control
limit UCLR of the individual ranges is entered in row
19.the value of lower control limit UCLR for less than
seven trials equal to zero.
10. Sum the rows 1,2,3,6,7,8,11,12,13.divide the sum in each
row by the number of parts sampled and enter these
values in the right most column labeled ”average”.
11. Add the average in rows 1,2,3 and divide the total by the
number of trials and enter the value in row 4 in the Blocks .repeat this for rows 6,7,8 ;and11,12,13 and enter
the results in the blocks for bو c ,in rows
9,14,respectively.
12. Enter the maximum and minimum average of rows 4,9
and14 in the appropriate space in row 18 and determine
the differences ,Enter this difference in the space labeled
DIFF in row 18.
13. Sum the measurements for each trial, for each part ,and
divide the total by the number of measurement .enter the
results in row 16 in the spaces provided for part average.
14. Subtract the smallest part average from the largest part
average and enter the result in the space labeled RP in
row 16 . RP is the range of part averages.
15. Transfer the calculated values of و DIFFو RP to the
blanks provided on the report side of the form.
Table 3: Gage Repeatability and Reproducibility Data Collection Sheet
Appraiser/trial
part
Average
1 2 3 4 5 6 7 8 9 10
1 A 1
1.13 1. 48 1.33 1.33 1.03 1.48 1.43 1.33 1.48 1.08
2 2
1.08 1.48 1.28 1.43 0.93 1.48 1.43 1.28 1.48 1.18
3 3
4 AVE 1.11
1.48 1.13 1.38 0.98 1.48 1.43 1.31 1.48 1.13 a=1.31
5 RNG 0.05
0.00 0.05 0.1 0.1 0.00 0.00 0.05 0.00 0.1
a=0.05
6 B 1 1.03 1.53 1.28 1.28 0.88 1.48 1.43 1.23 1.48 1.03
2 7
1.03 1.43 1.23 1.23 0.88 1.53 1.38 1.18 1.43 0.98
3 8
AVE 9
1.03
1.48 1.26 1.26 0.88 1.51 1.41 1.21 1.46 1.01 b=1.25
10 RNG 0.00
0.1 0.05 0.05 0.00 0.05 0.05 0.05 0.05 0.05 b=0.05
11 C 1 0.98 1.53 1.28 1.28 0.93 1.48 1.43 1.28 1.53 1.33
12 2 1.03 1.48 1.28 1.28 0.98 1.53 1.43 1.28 1.53 1.28
13 3
14 AVE 1.01
1.51 1.28 1.28 0.96 1.51 1.43 1.28 1.53 1.31 c=1.31
RNG
15
0.05
0.05 0.00 0.00 0.05 0.05 0.00 0.00 0.00 0.05 c=0.03
16
PART 1.05 1.49 1.28 1.31 0.94 1.5 1.42 1.27 1.49 1.15
=

Volume 2 No.10, October 2012 ISSN 2224-3577
International Journal of Science and Technology
©2012 IJST. All rights reserved
http://www.ejournalofsciences.org
757
AVE RP=0.56
17 [ a= 0.005 + b= 0.005 + C=0.03 ]/ OF OPERATOR=3]= =0.004
18 [max= 1.31 -min =1.25 ]= DIFF 0.06
19 [ =0.04 * D4= 2.37 ]= .UCLR
for 2 trials D4=3.27 for 3 trials D4=2.58 to seven test D3=0 0.13
20 [ =0.04 * D3= 0.00 ] = LCLR 0.00
Table 4: Calculation (R&R)
NAME PART:PISTON RING N.O TOOLS: DM/QA/0012 INSTRUMENT:
measuring-time
TECHNICAL SPECIFICATION:1.48MM
Repeatability=Equipment variation (EV)
EV= *K1
=0.04*4.56=0.18
trials K1 EV=100(EV/TV)=%
=100[0.18/0.93] =18.7% 2
3
4.56
3.05
Reproducibility=Apprasier variation (AV)
AV √ DIFF*K2)2 –
(EV2/nr)]
= 2-
(0.182/10*2)
=0.16
operator 2 3 AV=100(AV/TV) %
100[0.16/0.93 ] =16.8%
N=number of parts
r=number of trials
K2 3.65 2.70
Repeatability &Reproducibility (R&R)
R&R=√ 2+AV2)
+0.162) =0.24
%R&R=100[R&R/TV]
=100[0.24/0.93]
=25.8%
Part variation(PV)
PV= RP * K3
=0.56*1.62
=0.90
parts
K3
%PV=100[PV/TV]
=100[0.9/0.93]
=96.8%
TOTAL VARIATION(TV)
TV=√ 2+PV2)
=√ 2+0.902)
=0.93
2
3
4
5
6
7
8
9
10
3.65
2.70
2.30
2.08
1.93
1.82
1.74
1.67
1.62
5. Emphasis in attribute studies, on the ability of the operator or
their efficiency in indentifying conformity and unconformity
the parts and their willingness to accept or reject the piece.
5.1 Conduct Research
Defects that were identified by methodology of APQP, 14
pieces were selected by the engineering division (8 conformity
and 6 nonconformity) each piece was inspected three times and
the results were recorded in the Table-5.

Volume 2 No.10, October 2012 ISSN 2224-3577
International Journal of Science and Technology
©2012 IJST. All rights reserved
http://www.ejournalofsciences.org
758
Table 5: Data Analysis System Measured using
Attribute Data
Operator C Operator B Operator A C
or
N
number
3 2 1 3 2 1 3 2 1
C C C C C C C C C C 1
N N N N N N N N N N 3
C C C C C C C C C C 2
N N N N N N N N N N 4
N N N N C N N N N N 5
C C C C C C N N N C 6
C N C C C C N C N C 7
C C C C C C C C C C 8
C C C C C C N N N N 9
C C C C C C C C C C 10
C C C C C C C C C C 11
N N N N N N N N N N 13
C C C C C C C C C C 12
N N N N N N N N N N 14
As a column (C,N) displayed containing the identity of the real
part.
C , means conformity , N , means nonconformity.
Analysis is performed based on counting .see Table-6
Table 6: Attribute Work Sheet
GRAND
TOTAL
(6)
MISSES
(5)
FALSE
ALARMS
(4)
TOTAL
CORRECT
(3)
BAD
CORRECT
(2)
GOOD
CORRECT
(1)
OPERATOR
42 0 5 37 18 19 A
42 4 0 38 14 24 B
42 3 1 38 15 23 C
5.2 Test Operators in Identifying Parts
Column1: good correct, indicate the number of conformity parts
that have been correctly diagnosed by operator, in this
experiment there were conformity pieces 8, that were inspected
three times, 24 0pportunities for the correct diagnosis was
conformity parts.
Column2: bad correct, indicate the number of nonconformity
that have been correctly diagnosed by operators. In this test
there were nonconformity pieces 6, inspected three times,
therefore 18 0pportunities for correct diagnosis was conformity
parts.
Column3: is equal to the sum of column 1,2 and used to
calculate the efficiency .
Column4: indicate the number of false alarm for each operator.
The operator A has 5 times false alarm, three times for sample
of six and two times for sample of 8.
Column5: indicate the number of nonconformity parts that
declared conformity. operator B has four times failed to
recognize.
Column6: is the sum of column 3,4,5 that must be equal to total
number of inspections(14 parts *three times for each inspector
,it should be 42).
5.3 Introduce iIndicators to Evaluate the Ability of
Operators (Attribute). AIAG,MSA Manual[18].
1. Efficiency: an operator can diagnose conformity and
nonconformity parts correctly .
E=
(1-6)
2. The probability of indiscrimination fail to detect
nonconformity. (1-7)
PMISS
3. False Alarm
P(FA)=
(1-8)
5.4 The Calculation based on the above Evaluation
Indicators
see table-7
Table 7: Calculation Based on Indicators
P(MISS)
(5)/(2)+(5) P(F)
(4)/(1)+(4) E
6)/)3))
operator
0/18=0
5/24=0.21 37/42=0.88 A
4/18=0.22 0/24=0 38/42=0.90 B
3/18=0.17 1/24=0.04 38/42=0.90 C
5.5 The Reference Standard for Acceptable Results.
see table-8
Table 8: Guidelines for each Appraiser Results
index acceptable marginally unacceptable
E 0.9 ≤ 0.8-0.9 0.8. >
P(FA) 0.05≥ 0.1-0.05 0.1<
P(MISS) 0.02 ≥ 0.05-0.2 0.05<
Volume 2 No.10, October 2012 ISSN 2224-3577
International Journal of Science and Technology
©2012 IJST. All rights reserved
http://www.ejournalofsciences.org
759
b=p(fa)/pmiss 1.2-0.8 1.5-1.2 or
0.8-0.5
More than 1.5 less, than 0.5
It is necessary to explain:
When, b=1 there is no tendency.
When, b there is a willingness to accept parts.
When, b there is a willingness to rejecting parts..
6. ANALYSIS (GR&R STUDY)
If repeatability (EV) is large compared to reproducibility (AV).
See Table -4
The reason may be:
The instrument needs maintenance.
The gage may need to be redesigned to be more rigid.
The clamping or location for gauging need to be emperor.
There is excessive within part variation.
Taking into consideration all relevant factors (cost of
measurement device, cost of repair, etc), the observed
measuring system may be accepted since operators and
equipment cause 25.8% (<30%) of measuring variation [25] .
Because PV was much larger than EV, indicate that 50% of the
average measured outside the control means. AIAG,MSA
Manual(2010). Therefore PV is valid. Considering,
R&R=25.8% , According to Table 4, measurement system is
approved. In order to further improve the measurement system,
Operator is required daily to clean the measuring-time and
calibrate it by gauge block. Increasing in the number of meeting
with personnel in production line, the factors that caused
reduction in motivation have been studied and deleted as
possible. Ensuring that evaluation equipment is clean, it has
been cleaned twice in a week before but now it should be
cleaned after each shift. The uniformization of testing methods.
Retraining of evaluation instructions and emphasizing to
operator in correct implementation of instructions and
controlling and surveying of operator method in comparing
with instructions.
7. ANALYSIS (ATTRIBUTE STUDY)
To sum up all the information we already had, the team come
up with this Table(7,8). First operator(A), relatively acceptable
performance and the lack of recognition in conformity parts,
the company will increase the cost of inspection ,and tendency
error is calculated by, b=P(FA)/p(miss), in this case we
should consider only, P(FA) error. The operator does not have
any tendency to accept or reject product. Operator (A) was
trained for a correct diagnosis (conformity parts) and the
reference samples were reviewed.
Operator(A)
E=37/42=0.88 , P(MISS)=0 , P(FA)=5/24=0.21
Operator(B)
E=38/42=0.90 ,P(MISS)=4/18=0.22 ,P(FA)=0
The operator (B) does not have any error detection, ability is
very high.
Operator(C)
E=38/42=0.90 , P(F)=1/24=0.04 ,
P(MISS)=3/18=0.17
Then b=P(FA)/P(MISS)
b=0.04/0.17=0.24
Operator(C) is willing to accept parts(since operator should
reject some of those parts ). It was decided, that the operator(C)
is used for the inspection process or characteristic that is less
important.
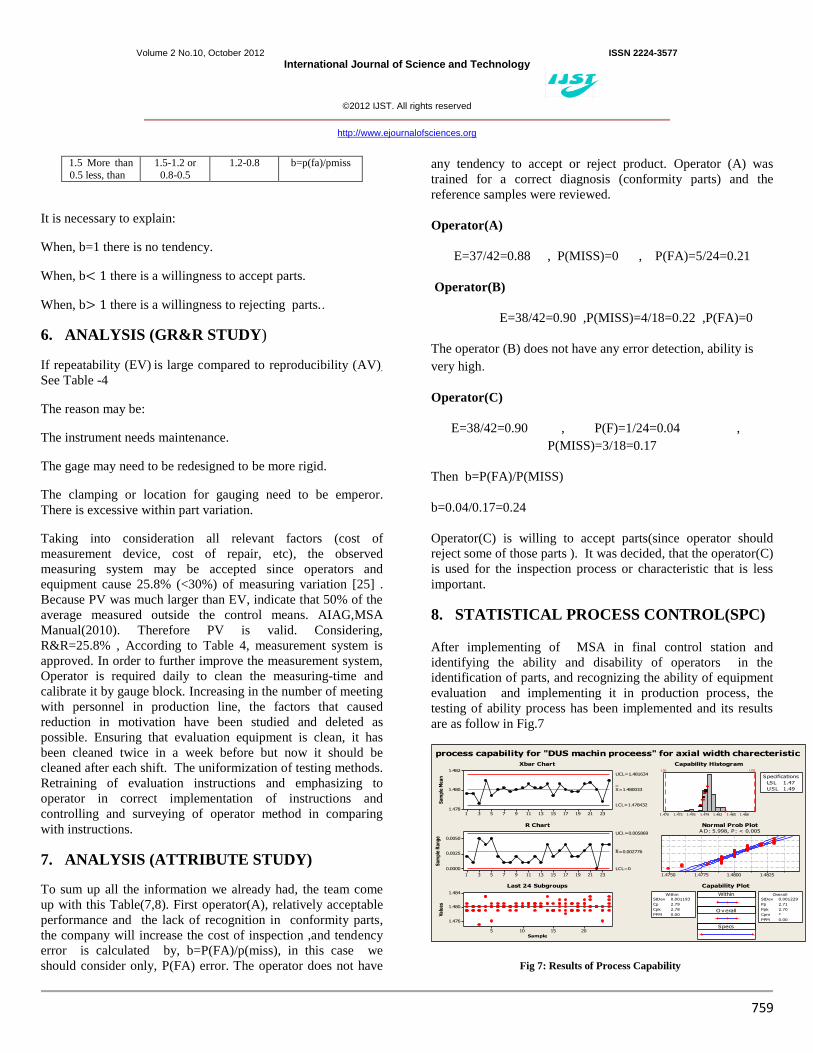
8. STATISTICAL PROCESS CONTROL(SPC)
After implementing of MSA in final control station and
identifying the ability and disability of operators in the
identification of parts, and recognizing the ability of equipment
evaluation and implementing it in production process, the
testing of ability process has been implemented and its results
are as follow in Fig.7
2321191715131197531
1.482
1.480
1.478
Sa
mp
le M
ea
n
__X=1.480033
UCL=1.481634
LCL=1.478432
2321191715131197531
0.0050
0.0025
0.0000
Sa
mp
le R
an
ge
_R=0.002776
UCL=0.005869
LCL=0
2015105
1.484
1.480
1.476
Sample
Va
lue
s
1.4881.4851.4821.4791.4761.4731.470
LSL USL
LSL 1.47
USL 1.49
Specifications
1.48251.48001.47751.4750
Within
O v erall
Specs
StDev 0.001193
Cp 2.79
Cpk 2.78
PPM 0.00
Within
StDev 0.001229
Pp 2.71
Ppk 2.70
Cpm *
PPM 0.00
Overall
process capability for "DUS machin proceess" for axial width charecteristic
Xbar Chart
R Chart
Last 24 Subgroups
Capability Histogram
Normal Prob PlotA D: 5.998, P: < 0.005
Capability Plot
Fig 7: Results of Process Capability
Volume 2 No.10, October 2012 ISSN 2224-3577
International Journal of Science and Technology
©2012 IJST. All rights reserved
http://www.ejournalofsciences.org
760
9. CONCLUSION AND SUGGESTION
Although there were some considerations in regard to
variability of the measurement (Gage R&R), this measuring
System was accepted for the measurement of ring piston AXIAL
which presents the pre-request for the implementation of
analyzing and controlling of automatic AXIAL WIDTH process.
According to preliminary results, significant financial benefit
was achieved in a relatively short period of time. This allowed
the quantity of nonconformities (defects) to be reduced by nearly
7.5%,which presents direct financial gains .In addition, direct
financial gain caused by significant reduction of the number of
nonconformities related to Ring AXIAL WIDTH caused a chain
reaction in which efficiency and effectiveness runtime and
overall process Were increased, the quality of product was
improved and reworking and inspecting were reduced, having
been evaluating of process capability according as Fig.7,we will
have cp, cpk, pp, ppk >2. In implementing of MSA of parts
produced in the lower level of tolerance, and therefore with
corrective actions that were required and the evaluation of
equipment precision with operators, process capability located in
middle tolerance. By implementing and analyzing of
measurement systems in spare-part-company, the senior
managers and employers found better understanding of this
system and its efficiency and benefits. Concerning on MSA and
having no information on effective factors in measurement
process can impose much more costs to the organization. This
analysis that caused to reduce some related costs and to prevent
shipping nonconformity products, and in three times evaluations
by OEM there was no form of notice issued had been received
for spare-part company. In particular, very good results have
been achieved in the improvement of the overall performance of
company through implementation of APQP and MSA
methodology. This paper presents a case study of MSA within
APQP, demonstrating how the effective introduction and
implementation of statistical tools can lead to detailed
understanding of the components of variation during measuring
process and evaluation if a measurement system is suitable for a
specific application measurement of the products most critical
quality characteristic. For the case study analyzed in this article,
further studies need to be performed. In order to improve and
absolutely accept this measuring system for ring piston
measurement, we suggest to all companies to follow this
measurement system. Despite this, it is recommended to
investigate method as well as with fuzzy logic, be investigated in
future.
REFERENCES
[1] Kartha, C.P. (2004). "A comparison of ISO 9000:2000
quality system standards, QS9000, ISO/TS 16949 and
Baldrige criteria". The TQM Magazine Volume 16
(Emerald Group Publishing Limited) Number 5: 336.
[2] Shamspour Mohammad & Merhrdad.(1381).quality
management systems ,ISO TS 16949;2002”1rd edition,
Publisher industrial research &training center of Iran.
[3] Montgomery DC(2005) introduction to statistical quality
control. john wiley and sons .new York .
[4] AIAG (2006)Production part approval process, AIAG
reference manual ,4th
edn.auto-motive industry action
.group.
[5] Terziovski M,Samson D (1999) The link between total
quality management practice and organization
performance .int J Qual Manag 16(3):226-237 .
[6] Harry MJ(2000) Anew definition aims to connect quality
with financial performance .Qual prog 33(1):64-67.
[7] Wessel G,Burcher P(2004) Six sigma For small and
medium –sized enterprises. TQM mag 16(4):264-272 .
[8] Cheng J-L (2008) Implementing six sigma via TQM
improvement : an empirical study in Taiwan.
[9] JIJU A(2004) some pros and cons of six sigma: an
academic perspective.TQM Mag 16(4):303-306
[10] Snee RD (1994) why should statisticians pay attention to
six sigma? QUAL PROG ,September.100-103.
[11] Tadikamala P (1994)The confusion over six sigma
quality.Qual prog, November
[12] AIAG(2008)Advanced product quality planning and
control plan, 2nd
edn , auto-motive industry action group.
[13] AIAG(2008)Potential failure mode and effect analysis,
4th
edn. auto-motive industry action group.
[14] Fadlovich,Erik, Failure mode and effect analysis
December 31,2007.
[15] Deming,Ed,(2000).Out of Crises, 1st edition.
[16] Hewson C, O,
Sullivan P, Stenning K (1996) Training
needs associated with statistical process control. Train
Qual 4(4):32-36
[17] Evans JR(2001)An exploratory study of performance
measurement system and relationship with performance
results .presented at the dicision exploratory study of
performance measurement systems and relationship

Volume 2 No.10, October 2012 ISSN 2224-3577
International Journal of Science and Technology
©2012 IJST. All rights reserved
http://www.ejournalofsciences.org
761
with performance reults .presented at the dicision
science institute, 32nd
Annual conference, Sanfrancisco,
pp.1-27
[18] AIAG(2010)Measurement system analysis, AIAG
reference manual,4th
edn.auto-motive industry action
group.
[19] Little T(2001) 10 Requirement for effective process
control :a case study .Qual prog34(2):46-52.
[20] Dasgupta T, Murthy SVSN (2001) Looking beyond the
audit-oriented evaluation of gauge repeatability and
reproducibility: a case study. Total Qual Manag 12(6):
649-655
[21] Sadeghi Fard,N.(2005). Principles of measurement and
calibration,standars10012.1ST
edition, publisher industrial
research &training center of Iran.
[22] Industrial Research & standard Institute.(1381). General
requirements for competence of laboratories of
calibration&test-17025. 1st
edition.
[23] Kappele w.Raffaldi J(2005) An introduction to gauge
R&R.Quality 44(13):24-25.
[24] Raffaldi J, kappele w (2004) Improve Gauge R&R ration
.Quality 43:48-54.
[25] Pyzdek T(2003) Six sigma hand book .Mac Graw-Hill
companies Inc, new York ,ISBN 0-07-141015-5.