journal of management & technology 1997- 4507... · dr. naveed akhtar, habib ur rehman, ......
TRANSCRIPT

Copyright © 2014. NJMT
1
NUML Journal of Management & Technology
Vol: 9, No: 2. July, 2014 ISSN 1997-4507
NUML Journal of Management & Technology
ISSN: 1997- 4507
Volume: 9 - Numbers: 2 - July, 2014
A Research Journal Published by
Faculty of Management Sciences
National University of Modern Languages
Islamabad-Pakistan www.numl.edu.pk
This Issue includes:
Copyright © 2014 NJMT
1. Leadership Styles as Predictor of Decision Making Styles; Moderating Role of
Emotional Intelligence Dr. Naveed Akhtar, Sajid Rahman Khattak, Asif Ghani
2. The Impact of Working Capital Management on Profitability of Cement Industry in
Pakistan
Shahzaad Hameed Qamar
3. The mediating influence of Task conflict on the relationship between situational
constraint and workplace bullying Dr. Naveed Akhtar, Habib Ur Rehman, Sajid Rehman Khattak
4. Does Person- Organization Fit and Affective Organizational Commitment
Relationship is Moderated by Personality Traits: Analysis of Extraversion and
Emotional stability Nadia, Hafiz Ishaque, Madiha Akram
5. The ranking and comparison of close-ended mutual funds performance with
open-ended mutual funds: Evidence from Pakistan mutual funds industry Ehtisham Ali , Faid Gul, Rashid Mehmood Khan, Dr. Naveed Akhtar
Copyright © 2014. NJMT
2
NUML Journal of Management & Technology
Vol: 9, No: 2. July, 2014 ISSN 1997-4507
NUML Journal of Management & Technology
Patron-in-Chief
Major General Masood Hassan ®
Rector NUML
Patron
Brig. Azam Jamal,
Director General, NUML
Chief Editor
Dr. Naveed Akhtar Faculty of Management Sciences
Editorial Advisory Board
Professor Dr. Bahaudin Mujtaba,
Huizinga, NOVA , Florida, USA
Prof.Dr.Gurbuz Gokcen. School of
Economics and Administrative
Sciences, Marmara University
Prof. Dr. Yan Li. Department of
Organization & HRM. Beijing
Institute of Technology, Heijing, P.R.
China
Prof. Dr. Songsheng Chen. School of
Management and Economics, Beijing
Institute of Technology, Haidian
District, Beijing, P.R. China
Professor Dr. Canan CETIN, Marmara
University Faculty of Economy and
Administrative Sciences, Instanbul,
Turkey
Dr. Amir
SZABIST
Professor Dr. Ayse Kucuk Yilmaz,
Anadolu University Turkey
Dr. M.Zahid Iqbal
COMSATAS, Islamabad.
Professor Dr. Lisa Anderson,
University of Liverpool, UK.
Dr. Waheed Akhtar
COMSATS, Lahore
Dr. Sermin Senturan
Bulent Ecevit University Zonguldak,
Turkey
Dr. Aurangzeb Zulfiqar Khan
COMSATS, Islamabad
Dr. Mehmet Sisman, Marmara
University, Istanbul
Dr. Sajid Bashir
MAJU
Prof. Dr. Erkan TASKIRAN
Duzce University, Trukey
Dr. Tasweer Hussain Shah,
Department of management, C of E &
ME, NUST, Pakistan
Working Group Members:
Sajid Rahman Khattak Nisbat Ali
w w w . n u m l . e d u . p k

Copyright © 2014. NJMT
3
NUML Journal of Management & Technology
Vol: 9, No: 2. July, 2014 ISSN 1997-4507
Table of Contents
1. Leadership Styles as Predictor of Decision Making Styles; Moderating Role of
Emotional Intelligence Dr. Naveed Akhtar, Sajid Rahman Khattak, Asif Ghani
2. The Impact of Working Capital Management on Profitability of Cement Industry
in Pakistan
Shahzaad Hameed Qamar
3. The mediating influence of Task conflict on the relationship between situational
constraint and workplace bullying
Dr. Naveed Akhtar, Habib Ur Rehman, Sajid Rehman Khattak
4. Does Person- Organization Fit and Affective Organizational Commitment
Relationship is Moderated by Personality Traits: Analysis of Extraversion and
Emotional stability
Nadia, Hafiz Ishaque, Madiha Akram
5. The ranking and comparison of close-ended mutual funds performance
with open-ended mutual funds: Evidence from Pakistan mutual funds
industry
Ehtisham Ali , Faid Gul, Rashid Mehmood Khan, Dr. Naveed Akhtar
w w w . n u m l . e d u . p k
Volume: 9 - Numbers: 2 - January, 2014

Copyright © 2014. NJMT
4
NUML Journal of Management & Technology
Vol: 9, No: 2. July, 2014 ISSN 1997-4507
Leadership Styles as Predictor of Decision Making Styles; Moderating Role of
Emotional Intelligence
Dr. Naveed Akhtar
Asst. Prof NUML Islamabad
Sajid Rahman Khattak PhD Scholar
Asif Ghani
Lecturer KKKUK
Abstract
The present study aims to investigate the relationship between leadership styles and
decision making styles with the moderating role of emotional intelligence. The sample of
the study consists of 150 employees from different organizations including banks,
pharmaceutical companies, and services industry located in Rawalpindi and Islamabad.
For data collection Multifactor Leadership Questionnaire MLQ (Form-5) (developed by
Bass and Avolio, 1990), general decision making style questionnaire (developed by Scott
and Bruce, 1995), and emotional intelligence questionnaire (developed by GENOS EI
inventory) were used. The study found that transformational leadership style have
significant association with dependent, rational, intuitive, avoidant, and spontaneous
decision making styles. Transactional leadership style positively associated dependent
decision making style. Laissez-faire leadership style positively predicts avoidant decision
making style. Emotional intelligence did not moderate the relationship between
leadership styles and decision making styles.
Keywords: leadership styles, decision making styles, emotional intelligence, regression,
correlation
1. Introduction
Leader is a person who has the abilities to influence others and the leadership is what
leaders do to influence group to achieve some designated goals. The ability of effective
leader is to make decisions confidently (Muchinsky, 2007). The core responsibility of a
manager‘s is to make valuable decisions which helps organization‘s to achieve its goals.
The success or failure of an organization depends upon managerial decisions (Kreitner
and Kinicki, 2004). Recent dynamic corporate environment demands from managers to
become excellent, quick, and effective decision makers. According to Singh (2001)
decision making is the ―total task of a manager‖. One of the characteristics of an effective
leader is to make effective decisions. Leader performed various leadership styles depends
upon their abilities, attitudes, knowledge and the environment in which he/she work as a
leader. Such styles are divided into three main categories these are, transformational,
transactional and laissez- faire leadership style.
Transactional leadership style (TR) deals with the normal flow of operations. To perform
best such leader motivates their followers through power and incentives. Such leaders

Copyright © 2014. NJMT
5
NUML Journal of Management & Technology
Vol: 9, No: 2. July, 2014 ISSN 1997-4507
motivate employees by exchanging rewards for performance. Transactional leaders focus
on short term or day to day operational decisions rather than for strategically long term
decisions. They are mostly concerned that everything flows smoothly today. Such leaders
are rational decision makers and problem solvers. They make logical decisions.
Transactional leaders are also dependent decision makers as by depending on
subordinate‘s cognitions to make decisions (Barbuto et al., 2000).
Transformational leadership style (TF) is viewed as humanistic, influential, motivational
and inspirational. Transformational leadership style is a style through which a leader,
who boosts the confidence level of individuals or groups, conjures up awareness and
interest in the group and struggle to achieve their desire goals. They are just like a model
for their supporters. Bass and Avolio (2000) define five facets of transformational
leadership which as (a) idealized influence (attributed) – creating and building a sense of
mission and vision in the mind of their supporters. Followers give him value/respect and
trust on them: (b) idealized influence (behavior) – such leader act as a role model,
followers observe him and doing accordingly: (c) inspirational motivation – such leader
clarifies the paths for the followers by finishing ambiguities, and communicates the
innovative vision: (d) intellectual simulation – such leader support their supporters to
solve old problems through innovative or new ways, support creativity, and give
confidence by practicing on brainstorming and rational thinking: and (e) individualized
consideration – leader consider their followers needs, give them care and attention.
Laissez-faire style (LF) of leadership is in which decisions are delayed, responsibilities
are withdrawn, quests for support and feedback, and by showing irresponsiveness in
decision making. Such leaders are passive and incompetent, and avoid decisions when
needed (Bass and Riggio, 2006). Thus avoidant decision is one of the big quality of
laissez-faire leaders. Laissez – faire leaders are dependent on their followers on making
decisions, and call workgroup to take their responsibilities (Shamir et al., 2000).
Emotional intelligence (EI) play an important role and are more loyal towards
organization performance (Abraham, 2000), and have high success rate (Miller, 1999).
Emotional intelligence is the ability to perceive perfectly, and convey emotion; the ability
to generate or access feelings; the quality to realized emotional knowledge. Emotional
intelligence helps leaders to improve their ability to solve problem and give direction to

Copyright © 2014. NJMT
6
NUML Journal of Management & Technology
Vol: 9, No: 2. July, 2014 ISSN 1997-4507
the organization to achieve its goals effectively. Emotional intelligence based on three
models which are (a) competency based model (b) ability model, and (c) non-cognitive
model. Competency based model of emotional intelligence were used to measure
workplace application. This study utilize competency based model which is related to
workplace emotional intelligence.
Research identify various decision making models, each have their own importance, no
single model is universally acceptable, that is why this study focuses on the model
developed by Scott and Bruce (1995). According to this model while making decisions
managers performing five styles: (a) Rational Decision Making Style (RDM) – which is
the use of interpretation and rational or logical approaches to decision making; (b)
Intuitive Decision Making style (IDM) – such leaders depend upon hunches, gut
feelings, and intuition experience; (c) Dependent Decision Making Style (DDM) – is
when making a decision getting help or support of others; (d) Avoidant Decision Making
Style (ADM) – is ascribed by postponing, retreating, and hostile the decisions; and (e)
Spontaneous Decision Making Style (SDM) – is defined by making impetuous, hurried,
and nippy decisions.
1.1 Statement of the Problem
A lot of research work has been done on leadership styles as well as on decision making
styles but not a single study can find the relationship between them in Pakistan, so, the
contribution of this study is to find out the relationship between leadership styles and
decision making styles in Pakistani organizations. Second, this study will go beyond the
prior research by considering all the three leadership styles and five decision making
styles while prior research only one or two leadership styles and one or two decision
making styles.
1.2 Purpose of the Study
The purpose of this study is to find out the relationship between leadership styles and
decision making styles in Pakistani organization, and to find out which leadership style is
more appropriate in Pakistani context. Also, this research will try to answer the question

Copyright © 2014. NJMT
7
NUML Journal of Management & Technology
Vol: 9, No: 2. July, 2014 ISSN 1997-4507
regarding different decision making styles and which decision making style is more
appropriate in Pakistani organization. Another important purpose was to check the
moderating role of emotional intelligence on the relationship between leadership styles
and decision making styles.
1.3 Importance of the Study
The core responsibility of a manager‘s is to make valuable decisions which helps
organization‘s to achieve its goals. Successful leaders create and build successful
organizations. The importance of the study is that it will helpful for managers to follow
the most appropriate leadership style as well as decision making style which will help to
improve the performance of the overall organization. Another importance is that through
appropriate style managers can create a learning organization, increased innovation, and
motivates employees which altimetry improve the overall performance of the
organizations.
1.4 Plan of the Study
The study is organized as follow: section two describe relevant literature, section three
explain theoretical framework and hypothesis of the study, section four explore the
methodology of the study in which we describe sampling technique, measurement tools,
population of the study, section five describe the results of the study including
correlation, regression analysis with and without moderating variable, and lastly section
six shows references of the study.
2. Literature Review
The terms transformational and transactional leadership styles were introduced by Burns
in 1978. Bass (2000), Bass and Avolio (2003), and Bass and Reggio (2006), extended the

Copyright © 2014. NJMT
8
NUML Journal of Management & Technology
Vol: 9, No: 2. July, 2014 ISSN 1997-4507
previous work on leadership styles and proposed a full range theory which includes
transactional, transformational, and laissez- faire leadership styles. Transformational
leaders make knowledge based decisions which in turn secured organizational interests
(Brower and Balch, 2006). Leaders logical actions and emotions resides rationality which
involve inspiration and stimulation. An effective leadership incorporates both sides in
consideration (Bass, 1999; Gar 1999). Both rational and emotional strategies were used
by transformational leaders in decision making process.
Avolio and Bass, (2002) found that decision making of transactional and transformational
leaders could be participative or authoritarian as well as directive and participative, elitist
or leveling. Transformational leaders shared organizational vision and ideas (Bass and
Reggio, 2006). They encouraged follower‘s participation. Transformational leader‘s
decisions were based on information sharing which become collective decisions of an
enterprise. Fischhoff, (1992) argued that consultation led managers to inappropriate
contradictory advices which ultimately affect on decision making.
Downey et al. (2006) found that managers displaying more transformational leadership
had also more emotional intelligence (EI) and intuition than managers having less
transformational leadership. Hansson and Anderson, (2001) argued that the most
appropriate decision making styles is intuitive decision making style in case where
organizations were pressurize to bring change.
Tambe and Krishnan, (2000) investigated the correlation between decision making styles
and transformational leadership, and found positive correlation between rational decision
making styles and negative correlation with avoidant decision making styles. Rehman
and Waheed, (2012) studied the relationship between transformational leadership style
and decision making styles with moderating role of emotional intelligence in Pakistan.
The results show that transformational leadership style strongly predicts rational and
dependent DMC, and weakly predict spontaneous and intuitive DMC. The study also
found that emotional intelligence plays its moderating role and strengthen the relationship
between transformational leadership and decision making styles.
Kroeck and Sivasubramaniam, (1996), studied leadership styles and their impact on
innovative work behavior and found positive relationship between transformational
leadership and innovative work behavior. However, some studies also found no
Copyright © 2014. NJMT
9
NUML Journal of Management & Technology
Vol: 9, No: 2. July, 2014 ISSN 1997-4507
relationship between them such as Jaskyte (2004); found no significant relationship
between leadership styles and innovative work behavior.
Riaz and Haque, (2012) studied the role of leadership styles in their predictive quality of
decision making styles and found that most effective decision makers are
transformational and transactional leaders. Almas (2007) found that conflicts in
manufacturing organizations are effectively managed by transformational leaders. Engen,
(2003) found that transformational leadership qualities are mostly found in female as
compared to their male counterparts. They also found that male are mostly transactional
and laissez-faire, however, some studies found no gender differences in leadership styles.
The word transactional is based on the exchange between two things i.e. leaders and
followers. Leader motivates their followers that their needs will be satisfied on exchange
the leader demand to meet the standard of the organization and fulfilling their duties.
Rewards system are based on performance (Avolio and Bass, 2000; 2002).
Transactional leaders employ logic in decision making. They are rational decision makers
and problem solvers. While making decisions, transactional leaders depend upon the
subordinates cognitions, and are extrinsically motivated to lead (Borbuto et. al; 2000).
Transactional leaders rely on logic and rational thinking, and offer rewards such as pay,
promotion, other jobs related benefits, in exchange for completion of work assignment
(Fulton and Maddock, 1998).
Wooten et al. (1994); found that rational decision makers are static organized and
unchanged routine activities. That is why transactional leaders are effective in
transactional management practices which are compulsory to keep the organizational
operations on track (Lane and Daft, 2002), on the other hand, reliance on hunches and
quick procedure are the quality of spontaneous and intuitive decision maker (Scott and
Bruce, 1995), that is why, decision making styles like intuitive and spontaneous are not
make by transactional leaders. Loo, (2000); found negative correlation between avoidant
and rational DMC. Barbuto et al. (2000); argued that transactional leaders are dependent
decision makers. While making decision they depend upon the subordinates cognitions.
Transactional leaders are considered appropriate for maintaining stability in organization
(Leavitt, 1987).
3. Theoretical framework and hypothesis development

Copyright © 2014. NJMT
10
NUML Journal of Management & Technology
Vol: 9, No: 2. July, 2014 ISSN 1997-4507
3.1 Theoretical framework
Theoretical model of the study as that leadership styles is our independent variable which
includes three types of leadership styles i.e. laissez-faire, transactional, and
transformational leadership styles. Dependent variable is decision making styles which
include dependent, avoidant, spontaneous, rational, and intuitive, decision making styles.
To check the moderating effect we use emotional intelligence is a moderating variable of
the study.
Hypothesis
Literature led us to hypnotize the study as;
H1: transformational leadership style will positively predict decision making styles.
H2: transactional leadership style will positively predict decision making styles.
H3: Laissez-faire leadership style will positively predict decision making styles.
H4: Emotional intelligence will play a moderating role in the relationship between
leadership styles and decision making styles.
4. Methodology
4.1 Sample
Leadership Styles
Transformationa
l
Transactional
Laissez-faire
Rational
Intuitive
Avoidant
Dependent
Spontaneous
Decision Making Styles
Emotional
Intelligence

Copyright © 2014. NJMT
11
NUML Journal of Management & Technology
Vol: 9, No: 2. July, 2014 ISSN 1997-4507
The sample of the study consist of 150 employees from private and public sector
organizations including pharmaceutical firms, services organizations and banks, located
in Rawalpindi and Islamabad. Due to limited time and resources convenience sampling
technique is selected because it is easy and time saving technique to gather data.
4.2 Measures and Procedures
For data collection questionnaire is used which includes three types of scales. The first
scale is Multifactor Leadership Questionnaire MLQ (Form-5x) developed by Bass and
Avolio (2000). This scale has 21-items in which 15-items of transformational, 3-items of
transactional, and 3-items of laissez-faire leadership styles with a cronbach‘s alpha 0.87.
To measure decision making styles the second scale developed by Bruce and Scott (1995)
is used which includes 25-items including 5-items related to each DMS with a cronbach‘s
alpha 0.80. The third scale developed by GENOS EI inventory used to measures work
place emotional intelligence of the employee‘s. It consists of 35-items having a
cronbach‘s alpha of 0.89. Four-point Likert rating scale is used for leadership styles to
measures the responses ranging from 1= once in awhile 2= sometimes 3= fairly often 4=
frequently, if not always. Five-point Likert scale is used for emotional intelligence and
decision making styles to measures the responses ranging from 1= strongly disagree to 5=
strongly agree. Total 175 questionnaires were distributed from which 150 were received
back with a response rate of 85.71%.
5. Results
Table 1
Correlation Matrix
TF TR LF RDM IDM DDM ADM SDM
TF 1
TR .671 1
LF .368 .000 1
RDM .008 .113 .056 1
IDM .003 .169 .168 .001 1

Copyright © 2014. NJMT
12
NUML Journal of Management & Technology
Vol: 9, No: 2. July, 2014 ISSN 1997-4507
DDM .048 .023 .205 .000 .000 1
ADM .001 .037 .015 .000 .000 .000 1
SDM .000 .035 .005 .000 .002 .023 .000 1
Table 1 shows Pearson correlation matrix of DMS and LSS. The table shows that all
variables are positively associated with each other. Transformational leadership style is
significantly associated with rational, intuitive, dependent, avoidant, and spontaneous
DMS, while insignificantly associated with transactional and laissez-faire LSS.
Transactional leadership style is significantly associated with laissez-faire leadership
style, dependent, avoidant, and spontaneous DMS and insignificantly associated with
transformational leadership style, rational and intuitive DMS. Laissez-faire LSS is
significantly associated with transactional leadership style, rational, avoidant, and
spontaneous DMS. Rational DMS is significantly associated with transformational, and
laissez-faire LSS, and also with intuitive, avoidant, dependent, and spontaneous DMS,
but insignificantly associated with transactional leadership style. Intuitive DMS is
significantly associated with transformational LSS, rational, dependent, avoidant, and
spontaneous DMS, while insignificantly associated with transactional and laissez-faire
LSS. Dependent decision making style is significantly associated with transformational
and transactional LSS, rational, intuitive, avoidant, and spontaneous DMS, while
insignificant association with laissez-faire leadership style and so on.
Table 2
Correlation with Moderator
TFEI_ZTF TREI_ZTR LFEI_ZLF SDM ADM DDM IDM RDM LF TR TF
TFEI_ZTF 1
TREI_ZTR .480 1
LFEI_ZLF .339 .032 1
SDM .000 .015 .004 1
ADM .001 .022 .012 .000 1

Copyright © 2014. NJMT
13
NUML Journal of Management & Technology
Vol: 9, No: 2. July, 2014 ISSN 1997-4507
DDM .039 .028 .193 .023 .000 1
IDM .003 .105 .187 .002 .000 .000 1
RDM .005 .105 .034 .000 .000 .000 .001 1
LF .343 .000 .000 .005 .015 .205 .168 .056 1
TR .657 .000 .000 .035 .037 .023 .169 .113 .000 1
TF .000 .493 .369 .000 .001 .048 .003 .008 .368 .000 1
TFEI_ZTF, TREI_ZTR, and LFEI_ZLF are our independent variables with moderator.
First we calculate Z score values of these variables and then multiply these values with
our independent variables TF, TR, and LF. Now we only explain the association of these
variables only because we also explain all other variables in table 1, however there values
are changed but we know that if value is less than .05 then we says that there is significant
association and if value is greater than .05then we say that it is insignificant association.
TFEI_ZTF is significantly associated with rational, intuitive, dependent, avoidant, and
spontaneous DMS, also with transformational LSS. While there is insignificant
association with TREI_ZTR, LFEI_ZLF, transactional, and laissez-faire LSS. TREI_ZTR
is positively and significantly associated with, spontaneous, avoidant, and dependent
DMS, and with LFEI_ZLF, transactional and laissez-faire LSS. There is insignificant
association of TREI_ZTR with TFEI_ZTF and transformational LSS and with rational and
intuitive DMS. LFEI_ZLF is significantly associated with TREI_ZTR, transactional and
laissez-faire LSS and with spontaneous, avoidant, and rational DMS. There is also
insignificant association of LFEI_ZLF with TFEI_ZTF and transformational LSS and with
intuitive DMS.
Table 3
RDM with and without moderator
Without Moderator With Moderator
Variabl
es
Coefficien
ts
Significance Variables Coefficien
ts
Significance
Constan
t 2.716 .000 Constant 21.250 .001

Copyright © 2014. NJMT
14
NUML Journal of Management & Technology
Vol: 9, No: 2. July, 2014 ISSN 1997-4507
TF .228 .011 TFEI_ZTF .068 .117
TR .085 .350 TREI_ZTR -.015 .475
LF .124 .202 LFEI_ZLF .100 .006
R Square TF -1.983 .162
.072 TR .549 .370
LF -3.154 .008
R Square .146
In the above table we take rational DMS as a dependent variable and transformational,
transactional, and laissez-faire as an independent variables. The right hand side of the
table shows result with moderator (emotional intelligence), and the left hand side of the
table shows result without moderating effect. R Square shows the explanatory power of
dependent variable which is 14.6% with moderating effect of emotional intelligence and
7.2% explanatory power without moderating effect. Table shows that our model with and
without moderator is significant (.000) and (.001) respectively. Results also show that
there is insignificant relationship between TFEI_ ZTF and TREI_ZTR with rational
DMS, and positive significant relation with LFEI_ZLF. On the other hand, the left hand
side shows that transactional LSS and laissez-faire have positive insignificant relation
with rational DMS and positive significant relation with transformational LSS. Moderator
improve R Square and constant coefficient but variables coefficient are decreases which
shows that emotional intelligence did not moderate the relationship between leadership
styles and rational decision making style.
Table 4
DDM with and without moderator
Without Moderator With Moderator
Variabl
es
Coefficien
ts
Significance Variables Coefficien
ts
Significance
Constan
t 2.848 .000 Constant 11.631 .008
TF .176 .058 TFEI_ZTF .055 .229
TR .183 .052 TREI_ZTR -.003 .881

Copyright © 2014. NJMT
15
NUML Journal of Management & Technology
Vol: 9, No: 2. July, 2014 ISSN 1997-4507
LF .033 .743 LFEI_ZLF .020 .595
R Square TF -1.637 .279
.059 TR .286 .661
LF -.638 .610
R Square .073
Table 4 highlights the results of dependent DMS and LSS with and without moderating
effect. There is positive and significant relationship between transformational and
transactional LSS with dependent DMS, while there is positive insignificant relationship
with laissez-faire LSS. So we can say that transformational and transactional LSS predict
dependent DMS. In case of moderator (EI) all three leadership styles have insignificant
relationship with dependent DMS, also TREI_ZTR have a negative association.
Although, R Square and constant coefficient improve due to moderating effect of
emotional intelligence but coefficient of variables shows that there is no significant effect
of moderating variable (emotional intelligence).

Copyright © 2014. NJMT
16
NUML Journal of Management & Technology
Vol: 9, No: 2. July, 2014 ISSN 1997-4507
Table 5
SDM with and without moderator
Without Moderator With Moderator
Variabl
es
Coefficien
ts
Significance Variables Coefficien
ts
Significance
Constan
t 1.971 .000 Constant 17.630 .008
TF .321 .001 TFEI_ZTF .121 .009
TR .112 .239 TREI_ZTR -.008 .715
LF .205 .043 LFEI_ZLF .016 .677
R Square TF -3.628 .016
.131 TR .349 .589
LF -.326 .792
R Square .177
The above table shows that spontaneous decision making style as a dependent variable
and transformational, transactional, and laissez-faire leadership styles as an independent
variables. Transformational and laissez-faire leadership styles positively and significantly
associated with spontaneous decision making style, and positive but insignificant
association with transactional leadership style. Thus, transformational and laissez-faire
leadership styles predict spontaneous decision making style. In case of moderating effect
coefficient constant and R Square are improved but coefficients of variables are
decreased, even TREI_ZTR have shown negative association. Although TFEI_ZTF have
positive and significant relationship with spontaneous decision making style. Thus, we
can say that there is weakly moderate the relationship between leadership styles and
spontaneous decision making style.

Copyright © 2014. NJMT
17
NUML Journal of Management & Technology
Vol: 9, No: 2. July, 2014 ISSN 1997-4507
Table 6
IDM with and without moderator
Without Moderator With Moderator
Variable
s
Coefficient
s
Significance Variables Coefficient
s
Significance
Constan
t 2.845 .000 Constant 6.602 .273
TF .243 .004 TFEI_ZTF .038 .360
TR .079 .356 TREI_ZTR .033 .097
LF .069 .447 LFEI_ZLF -.038 .275
R Square TF -
1.035 .451
.072 TR -.907 .128
LF 1.306 .251
R Square .097
Table 6 shows the regression analysis between intuitive decision making and leadership
styles with and without moderation. Transformational leadership style is positively and
significantly associated with intuitive decision making style while transactional and
laissez-faire are positively but insignificant associated with intuitive decision making
style. So, transformational leadership style predicts intuitive decision making style. On
the other hand, there is positive and significant association between TREI_ZTR and
intuitive decision making style, while there is insignificant relationship between
TFEI_ZTF and LFEI_ZLF with intuitive decision making style. Coefficient of all
variables decreased due to moderation which shows that there is no impact of emotional
intelligence on intuitive decision making style.
Table 7
ADM with and without moderator
Without Moderator With Moderator
Variabl
es
Coefficien
ts
Significance Variables Coefficien
ts
Significance
Constan
t 2.371 .001 Constant 23.837 .000
TF .268 .002 TFEI_ZTF .132 .001
TR .112 .199 TREI_ZTR .040 .038
LF .152 .000 LFEI_ZLF .009 .794
R Square TF -4.075 .003
.110 TR -1.075 .064
LF -.152 .891

Copyright © 2014. NJMT
18
NUML Journal of Management & Technology
Vol: 9, No: 2. July, 2014 ISSN 1997-4507
R Square .203
Table 7 highlights the regression analysis between avoidant DMS and LSS.
Transformational and laissez-faire LSS are positively and significantly associated with
avoidant DMS, while transactional LSS is positively insignificant associated with
avoidant DMS. We can say that transformational and laissez-faire LSS predict avoidant
DMS. In case of moderating effect of emotional intelligence transformational and
transactional have positively associated with avoidant DMS, while laissez-faire have
insignificant association. Although, R Square and constant coefficient increased due to
moderation but coefficient of variables are decreases in values which shows that
emotional intelligence weekly moderate the relationship between avoidant decision
making style and leadership styles.
6. Discussion
Present study aim is to investigate the relationship between leadership styles
(transformational, transactional, and laissez-faire) and decision making styles (rational,
intuitive, dependent, avoidant, and spontaneous) with the moderating role of emotional
intelligence. The results of the study fully supported H1 hypothesis that is
transformational leadership style positively predicts decision making styles (rational =
.011, dependent=.058, spontaneous=.001, intuitive= .004, and avoidant=.002). The
results (rational, spontaneous, and intuitive) are consistent with (Tambe and Krishna ,
2000 Downey et al. 2006 Andersen, 2000 Avolio and Bass, 2002 Thunholm, 2004). The
results (dependent and avoidant) are inconsistent with (Avolio and Bass, 2002 Riaz and
Haque, 2012). The results of the study partially support H2 hypothesis that is
transactional leadership styles positively predict decision making styles (rational= .350
dependent= .052 spontaneous= .239 intuitive= .356 avoidant= .199). The results
(intuitive, spontaneous, and avoidant) are consistent with (Daft and Lane, 2002, Scott and
Bruce, 1995 Loo, 2000). The results (rational) are inconsistent with (Barbuto et al. 2000,
Maddock and Fulton, 1998). The results regarding dependent decision making is in line
with (Barbuto et al. 2000) that transactional leaders are dependent on subordinate‘s
cognitions. The third hypothesis H3 are partially supported by the results that is laissez-
faire leadership style positively predict decision making styles (rational= .202

Copyright © 2014. NJMT
19
NUML Journal of Management & Technology
Vol: 9, No: 2. July, 2014 ISSN 1997-4507
dependent= .743 spontaneous= .043 intuitive= .447 avoidant= .000). The results
regarding avoidant decision making style are in line with (Bass and Reggio, 2006 Bass,
1998 Scott and Bruce, 1995) because they are missing when required; they are unable to
act upon their intentions. The results regarding dependent decision making style is
inconsistent with (Shamir et al. 2000 Jones and Rudd, 2007). The results regarding
rational and intuitive decision making styles are in line with (Harren, 1979 Loo, 2000)
that laissez-faire leaders are unable to make rational or intuitive decisions. The forth and
last hypothesis H4 is that emotional intelligence moderate the relationship between
leadership styles and decision making styles are rejected. There is no such result found in
the study which shows that moderator plays its role.
7. Conclusion and recommendations
Conclusively, we can say that leadership styles play a significant role in predicting
decision making styles. According to the theory and past research the ideal leadership
style is transformational leadership style which positively and significantly predicts the
ideal decision making style which is rational decision making style. Transactional
leadership style positively predicts dependent decision making style. The logic behind
that is that transactional leaders depend upon subordinate‘s cognition‘s. Laissez-faire
leadership style positively predicts avoidant decision making style. The logic is that
laissez-faire leaders are lezzy, irresponsive, ineffective, and inactive style of leadership so
they avoid or delayed the decisions.
There are also some limitations of the study as well. First, the study use convenience
sampling which might not represent the population as a whole. It will better if the study
uses other sampling techniques which are more generaliseable. Second, there are limited
observations (150) by selecting only two cities which affect the generaliseability of the
results. Third, the study use emotional intelligence as moderating variable but did not
focus on three facets of emotional intelligence separately which is (1) emotional
awareness of self (2) others (3) and emotional reasoning. The present research suggests
that it will more helpful for future work to increase the sample size and to use other
dimensions of emotional intelligence as well.
References
Copyright © 2014. NJMT
20
NUML Journal of Management & Technology
Vol: 9, No: 2. July, 2014 ISSN 1997-4507
Bass, B. M. (1998). The future of leadership in learning organizations. Journal of
Leadership Studies, 7(3), pp 18-40.
Eagly. A. H. and Johannesen-Schmidt, M. C., (2001). The leadership styles of women
and men. Journal of Social Issues, 57, pp 781-797.
Hater, J. J., and Bass, B. M. (1998). Superior‘s evaluations and subordinates perceptions
of transformational and transactional leadership. Journal of Applied Psychology, 73, pp
695-702.
Hitt, M., and Ireland, D. (2004). The essence of strategic leadership: managing human
and social capital. Journal of Leadership and organizational Studies, 9(1), pp 3-11.
Andersen, J. A. (2000). Intuition in managers. Are intuitive managers more effective? J.
Manage. Psychol, 15(1), pp 46-63.
Adams, J. S. (1975). Towards an understanding of inequity. Journal of Abnormal and
Social Psychology, 67, 1963, pp 422-436.
Baron, R. M., and Kenny, D. A. (1986). This moderator-mediation variable distinction in
social psychological research: conceptual, strategic, and statistical considerations. Journal
of Personality and Social Psychology, 51(6), pp 1173-82.
Alexander, S., and Ruderman, M. (1987). The role of procedural and distributive justice
in organizational behaviors. Social Justice Research 1, pp 177-198.
Avolio, B. J., and Bass, B. M., (1995). Construct validation and norms for the multifactor
leadership questionnaire (MLQ-Form 5X). New York: Center for leadership studies,
Binghamton University, State University of New York.
Bass, B. M., and Avolio, B. J. (1993). Transformational leadership and organizational
culture. Public Administration Quarterly, 17, pp 112-121.
Gillespie, N. A., and Mann, L., (2004). Transformational leadership and shared values:
The building blocks of trust. Journal of Managerial Psychology, 19(6), pp 588-607.
Howell, j. M., and Avolio, B. J., (1993). Transformational leadership, transactional
leadership, locus of control, and support for innovation: key predictor of consolidation-
business-unit performance. Journal of Applied Psychology, 78, pp 891-902.
Seltzer, J., and Bass, B. M. (1990). Transformational leadership: Beyond initiation and
consideration. Journal of Management, 16(4), pp 693-703.
Avolio, B. J. (1999). Full Leadership Development. Sage Publications: California.
Barbuto, J. E., and Fritz, S. M. (2000). A field study of two measures of work motivation
for predicting leader‘s transformational behaviors. Psychol Rep, 86, pp 295-300.
Bass, B. M. (1997). Does the transactional-transformational leadership paradigm
transcend the organizations and national boundaries? Am Psychol, 52(2), pp 130-139.
Bass, B. M. (2000). The future of leadership in learning organizations. J. Leadersh. Stud.,
7(3), pp 18-40.
Callan, J., and Proctor, S. (2000). Tactical decision making under uncertainty:
Experiment 1, and 2. California: SSC San Diego, Inc.
Dane, E. I., and Pratt, M. G. (2007). Exploring intuition and its role in managerial
decision making. Acad Manage Rev, 32, pp 33-54.
Downey, L. A., Papageorgiou, V., and Stough, C. (2006). Examining the relationship
between leadership, emotional intelligence and intuition in senior female managers.
Leadersh. Org. dev. J. 27(4), pp 250-264.
Spicer, D. P., and Sadler-Smith, E. (2005). An examination of the general decision
making style questionnaire in two UK samples. J. Manage. Psychol., 20(2), pp 137-149.

Copyright © 2014. NJMT
21
NUML Journal of Management & Technology
Vol: 9, No: 2. July, 2014 ISSN 1997-4507
Tambe, A., and Krishnan, V. R. (2000). Leadership in Decision-Making. Ind. Manage,
39(5), pp 69-79.
Thunholm, P. (2004). Decision-making style: Habit, style or both? Pers. Indiv. Differ,
36(4), pp 931-944.
Scott, S. G., and Bruce, R. A. (1995). Decision-making style: the development and
assessment of a new measure. Educ. Psychol. Meas., 55, pp 818-831.
Philips, S., and Pazienza, N. (1984). Decision making styles and problem solving
appraisal. J. Couns. Psychol, 31, pp 497-502.
Riaz, M. N., and Haque, M. A. (2012). Leadership styles as predictors of decision making
styles. African Journal of Business management. 6(15), pp 5226-5233.
Riaz, M. N., Khan, M. J., and Aslam., N. (2012). Leadership styles as predictors of
innovative work behavior. Pakistan Journal of Social and Clinical Psychology, 9(2), pp
17-22.
Hablemitoglu, S., and Yildirm, F., (2008). The relationship between perception of risk
and decision making styles of Turkish University Students. A descriptive study of
individual differences. World Appl. Sci. J., 4(2), 214-224.
Ismail, A., and Mohamad, M. H. (2010). Transformational and transactional leadership
styles as a predictor of individual outcomes. Theoretical and Applied Economics, 6(547),
pp 89-104.
Copyright © 2014. NJMT
22
NUML Journal of Management & Technology
Vol: 9, No: 2. July, 2014 ISSN 1997-4507
The Impact of Working Capital Management on Profitability of
Cement Industry in Pakistan
Shahzaad Hameed Qamar
Muhammad Ali Jinnah University Islamabad, Pakistan Email: [email protected]
Abstract
The study examines the impact of working capital in the cement industry of
Pakistan. Moreover, the study outlines the main determinants of working capital in the
cement industry of Pakistan. The determinants of working capital are related to the
factors associated with Current ratio, Quick ratio, Inventory Turnover ratio, Account
Receivable Turnover ratio, Debt Equity Ratio. The data to be taken for analysis consist of
accounts of 2005-2012, policies and procedures of the company and methods used by the
company. We are Studying the impact of working capital management over profitability
of cement industry of Pakistan. For this purpose we have used five independent variables
namely CR, QR, ART, ITR and DE for measuring working capital and two dependent
variables ROA, ROE for measuring profitability. Secondary data of 18 cement
companies listed in KSE have been used and regression and correlation analysis has
been run through E-viwes and following results are reported. In model 1Out of the five
ratios selected for the study three ratios, namely CR, QR, D/E, and IRT registered
positive correlation with the selected profitability ratio, ROA. ART has negative
correlation with ROA and CR, QR, ART and ITR have insignificant relationship with
ROA. Only DE ratio has significant relationship with ROA. In Model 2 five ratios
selected for the study and all five ratios CR, QR, D/E, ITR and IRT registered positive
correlation with the selected profitability ratio, ROE. But ART, ITR and QR have
significant positive relationship with ROE and CR, and DE has insignificant relationship
with ROE. It means when ART, ITR and QR are increased it will put significant positive
impact on profitability ratio (ROE). Hence, the study of the impact of working capital
ratios on profitability viewed both negative and positive impacts. The study of the
relationship between the profitability and working capital, ratios confirm with accepted
rule that larger the turnover increases the profitability of the company.
Keywords: Working Capital; Current Ratio; Quick Ratio; Debt to equity Ratio; Account
Receivable; Inventory Turnover Ratio; Profitability

Copyright © 2014. NJMT
23
NUML Journal of Management & Technology
Vol: 9, No: 2. July, 2014 ISSN 1997-4507
Introduction
Working capital management is a very essential component of corporate finance because
it directly influences the profitability of the company. When we are talking about the
company's working capital is what makes it profitable or not profitable. The more
working capital a company has the better that company is doing, financially. Many
potential investors and others in the public field will scrutinize a balance sheet to find the
working capital calculation of a company. Working capital usually consists of current
assets less current liabilities. Positive working capital means that the company is able to
pay off its short-term liabilities. Negative working capital means that a company
currently is unable to meet its short-term liabilities with its current assets. Determination
of appropriate level of investment in current assets is the first and foremost responsibility
of working capital manager.
Working capital refers to the cash a business requires for day-to-day operations, or, more
specifically, for financing the conversion of raw materials into finished goods, which the
company sells for payment. Among the most important items of working capital are
levels of inventory, accounts receivable, and accounts payable. Analysts look at these
items for signs of a company's efficiency and financial strength. Working capital is used
by lenders to help gauge the ability for a company to weather difficult financial periods.
Working capital is calculated by subtracting current liabilities from current assets. Due to
differences in businesses and the fact that working capital is not a ratio but an absolute
amount, it is difficult to predict what the ideal amount of working capital would be for
the business.
The determination of appropriate level of working capital can be effect upon the
profitability working efficacy and strength of the business. Working capital is the
parameter of capital budgeting that predicts and indicates the short terms assets and
liabilities. Positive working capital is the strength of the business that can enhance the
profitability of the business project and negative working capital is the bed prediction for
the business and future outcome. When we are taking about business philosophy, theory

Copyright © 2014. NJMT
24
NUML Journal of Management & Technology
Vol: 9, No: 2. July, 2014 ISSN 1997-4507
and design than that means the working capital is the substantial dimension of the
business. It must be positive and moderate level at any cost in the business. Than it must
be consider the all characteristic of the capital budgeting or investment appraisal is
planning process used to determine whether the organization is long term and short term
both the dimension of the investment. Long term investment means such as new
machinery new plant and new products research and development projects are worth
perusing. It is budget for major capital or investment expenditure. The above mentioned
long term investment strongly correlated with working capital management or
operationalization of the business. How much capital is required to meet day to day
expenditure or operationalization of the project?
Working capital is the major function of finance. There are three types of decision in
finance
1. Investment decision
2. Financing decision
3. Dividend decision
The decision with regards to long term assets is called capital budgeting. The
decision with regards to short term or current assets is called working capital
management.
The capital required for the business can be classified under two main categories
1. Fixed Capital
2. Working capital
The term working capital refers to current assets which may be defined as (i) those which
are convertible into cash or equivalents within a period of one year, and (ii) those which
are required to meet day to day operations. The fixed assets as well as the current assets,
both require investment of funds.
So, the management of working capital and of fixed assets, apparently, seem to involve
same type of considerations but it is not so.
The management of working capital involves different concepts and methodology than
the techniques used in fixed assets management. The very basics of fixed assets decision
process (i.e., the capital budgeting) and the working capital decision process are
different. The fixed assets involve long period perspective and therefore, the concept of
Copyright © 2014. NJMT
25
NUML Journal of Management & Technology
Vol: 9, No: 2. July, 2014 ISSN 1997-4507
time value of money is applied in order to discount the future cash flows; whereas in
working capital the time horizon is limited, in general, to one year only and the time
value of money concept is not considered. The fixed assets affect the long term
profitability of the firm while the current assets affect the short term liquidity position.
The fixed assets decisions are irreversible and affect the growth of the firm, whereas the
working capital decisions can be changed and modified without many implications.
Managing current assets may require more attention than managing fixed assets. The
financial manager cannot simply decide the level of the current assets and stop there. The
level of investment in each of the current assets varies from day to day, and the financial
manager must therefore, continuously monitor these assets to ensure that the desired
levels are being maintained. Too large an investment in current assets means tying up
funds that can be productively used elsewhere (or it means added interest cost if the firm
has borrowed funds to finance the investment in current assets). Excess investment may
also expose the firm to undue risk e.g., in case, the inventory cannot be sold or the
receivables cannot be collected.
On the other hand, too little investment also can be expensive. For example, insufficient
inventory may mean that sales are lost as the goods which a customer wants are not
available. The result is that the financial managers spend a large chunk of their time
managing the current assets because level of these assets changes quickly and a lack of
attention paid to them may result in appreciably lower profits for the firm. So, in the
working capital management, a financial manager is faced with a decision involving
some of the considerations as follows:
1. What should be the total investment in working capital of the firm?
2. What should be the level of individual current assets?
3. What should be the relative proportion of different sources to finance the working
capital requirements?
Thus, the working capital management may be defined as the management of firm‘s
sources and uses of working capital in order in maximize the wealth of the shareholders.
The proper working capital management requires both the medium term planning (say up
to three years) and also the immediate adaptations to changes arising due to fluctuations
in operating level of the firm.
Copyright © 2014. NJMT
26
NUML Journal of Management & Technology
Vol: 9, No: 2. July, 2014 ISSN 1997-4507
The term working capital may be used in two different ways.
i) Gross Working Capital (or Total Working Capital): The gross working capital
refers to the firm‘s investment in all the current assets taken together. The total of
investments in all the individual current assets is the gross working capital. For
example, if a firm has a cash balance of Rs. 50,000, debtors of Rs. 70,000 and
inventory of raw material and finished goods has been assessed at Rs. 1,00,000,
then the gross working capital of the firm is Rs. 2,20,000 (i.e. Rs.50,000 +
Rs.70,000 + Rs.1,00,000).
ii) Net Working Capital: The term net working capital may be defined as the excess
of total current assets over total current liabilities. It may be noted that the current
liabilities refer to those liabilities which are payable within a period of 1 year.
The extent, to which the payments to these current liabilities are delayed, the firm
gets the availability of funds for that period. So, a part of the funds required to
maintain current assets is provided by the current liabilities and the firm will be
required to invest the funds in only those current assets which are not financed by
the current liabilities.
The net working capital may either be positive or negative. If the total current
assets are more than total current liabilities, then the difference is known as
positive net working capital, otherwise the difference is known as negative net
working capital. The net working capital measures the firm‘s liquidity. The
greater the margin (i.e., net working capital) by which the firm‘s current assets
cover its current liabilities, the better will it be. Although the firm‘s current assets
may not be converted into cash precisely when they are needed, still greater net
working capital assures that in all likelihood some current assets will be converted
into cash to pay the current liabilities.
The distinction between gross working capital and net working capital does not in any
way undermine the relevance of the concepts of either gross or net working capital. A
financial manager must consider both of them because they provide different
interpretations. The gross working capital denotes the total working capital or the total
investment in current assets. A firm should maintain an optimum level of gross working
capital. This will help avoiding (i) the unnecessarily stoppage of work or chance of

Copyright © 2014. NJMT
27
NUML Journal of Management & Technology
Vol: 9, No: 2. July, 2014 ISSN 1997-4507
liquidation due to insufficient working capital, and (ii) effect on profitability (because
over flowing working capital implies cost). Therefore, a firm should have just adequate
level of total current assets. The gross working capital also gives an idea of total funds
required for maintaining current assets.
On the other hand, net working capital refers to the amount of funds that must be invested
by the firm, more or less, regularly in current assets. The remaining portion of current
assets is being financed by the current liabilities. The net working capital also denotes
the net liquidity being maintained by the firm. This also gives an idea of buffer available
to the current liabilities.
Thus, both concepts of working capital i.e., the gross working capital and the net working
capital have their own relevance and a financial manager should give due attention to
both of these.
Some time, If creditors demands their money from company, at this time company's high
working capital saves company from this situation. You know that selling of current
assets are easy in small period of time but Company cannot sell their fixed assets with in
small period of time. So, If Company have sufficient working capital, Company can
easily pay off the creditors and create his reputation in market. But if a company has zero
working capital and then company can not pay creditors in emergency time and either
company becomes bankrupt or takes loan at higher rate of Interest. In both condition, it is
very dangerous and always Company's Account Manager tries to keep some amount of
working capital for creating goodwill in market.
Positive working capital enables also to pay day to day expenses like wages, salaries,
overheads and other operating expenses. Because sufficient working capital can not only
pay maturity liabilities but also outstanding liabilities without any more delay.
One of the advantages of positive working capital is that company can do every risky
work without any tension of self security.
Objectives of the Study
The present study fulfills the following objectives.
• To assess the impact of working capital on profitability.
Copyright © 2014. NJMT
28
NUML Journal of Management & Technology
Vol: 9, No: 2. July, 2014 ISSN 1997-4507
• To examine the combine effect of the ratios relating to working capital management and
profitability with the assistance of multiple correlation coefficient and multiple regression
equation and to test the significance of the regression coefficients.
To measure the appropriate level of working capital in the capital budgeting
Working capital is the essential elements of the corporate finance.
For the discovery of better results and outcomes that can be possible by the
determination of the moderate level of working capital management.
Literature Review
The negative relationship between accounts receivables and firms‘ profitability suggests
that less profitable firms will pursue a decrease of their accounts receivables in an attempt
to reduce their cash gap in the cash conversion cycle. Likewise the negative relationship
between number of days in inventory and corporate profitability suggests that in the case
of a sudden drop in sales accompanied with a mismanagement of inventory will lead to
tying up excess capital at the expense of profitable operations (Lazaridis, 2000; &
Tryfonids, 2000).
In one study it was suggested that a priori is impossible to predict the impact on the
current ratio, quick ratio, cash conversion cycle, profits and leverage when a change in
sales causes a change in working capital variables (Katerina, 2000; Lazaridis, j. 2000).
Likewise, a managerial decision that changes components of working capital will cause
an unpredictable change in the liquidity, profitability and leverage ratios. Overall, the
cash conversion cycle was significantly positively related to the current and quick ratios,
to the receivables and to the inventory conversion period.
Most of the Pakistani firms have large amounts of cash invested in working capital. It can
therefore be expected that the way in which working capital is managed will have a
significant impact on profitability of those firms.
We have found a significant negative relationship between net operating profitability and
the average collection period, inventory turnover in days, average payment period and
cash conversion cycle for a sample of Pakistani firms listed on Karachi Stock Exchange.
These results suggest that managers can create value for their shareholders by reducing
the number of day‘s accounts receivable and inventories to a reasonable minimum. The

Copyright © 2014. NJMT
29
NUML Journal of Management & Technology
Vol: 9, No: 2. July, 2014 ISSN 1997-4507
negative relationship between accounts payable and profitability is consistent with the
view that less profitable firms wait longer to pay their bills. On basis of the above
analysis we may further conclude that these results can be further strengthened if the
firms manage their working capital in more efficient ways. Management of working
capital means ―management of current assets and current liabilities, and financing these
current assets‖. If these firms properly manage their cash, accounts receivables and
inventories in a proper way, this will ultimately increase profitability of these companies
(Rehman, 2007; Nasr, 2007).
Working capital and liquidity of the company concluded, the increase in the profitability
of the company was less than the proportion to decrease in working capital. Working
capital management and profitability of the company disclosed both negative and positive
association number of negative association only one positive association of ROI. (Raman,
P., 2003)
Most firms have a large amount of cash invested in working capital. It can therefore be
expected that the way in which working capital is managed will have a significant impact
on the profitability of firms. In this paper a significant negative relation between gross
operating income and the number of days accounts receivable, inventories and accounts
payable of Belgian firms has been found. The negative relation between accounts payable
and profitability is consistent with the view that less profitable firms wait longer to pay
their bills.
Deloof, (2003) proved that the degree of net working capital as a proportion of the overall
financing required, the higher the net working capital the greater being the impact of
inflation on capital spending.
(Geofrey, T., 1996) explained the impact of aggressive/conservative working capital
investment and financing policies has been examined through cross-sectional regression
models between working capital policies and profitability as well as risk of the firms. We
found a negative relationship between the profitability measures of firms and degree of
aggressiveness of working capital investment and financing policies. The firms yield
negative returns if they follow an aggressive working capital policy.
Researchers (Talat, 2007; Nazir, 2007) further elaborated that the working capital needs
of an organization change over time as does its internal cash generation rate. The study

Copyright © 2014. NJMT
30
NUML Journal of Management & Technology
Vol: 9, No: 2. July, 2014 ISSN 1997-4507
has shown that the paper and printing industry has been able to achieve high scores on the
various components of working capital and this has positively impact on its profitability.
(Kesseven, p., 2006) further Analyzed, Analysis of working capital management
efficiency was done on a sample of 349 telecommunication equipment companies. It is
found that the working capital management efficiency is negatively associated to the
profitability and liquidity. When the working capital management efficiency is improved
by decreasing days of working capital, there is improvement in profitability of the firms
in telecommunication firms in terms of profit margin. It is also found that the inventory
management among the sample firms may not be efficient.
The statistical evidences indicate that the management of a company does not have much
impact on the return on assets and profit margin. This is mainly due to heavy fixed assets
requirements in telecommunication industry. There is also evidence that there is poor
management of accounts receivable and accounts payable (Vedavinayan, G., 2007).
An empirical evidence of working capital management policies and practices of the
private sector manufacturing companies in srilanka was provided by (Pandey, 1997;
Parera, 1997). They found that most companies in srilanka have informal working capital
policies and company size has an influence on the overall working capital policy and
approach. Moreover, company profitability has an influence on the methods of working
capital planning and control. This article attempts to place working capital policy in
perspective with other policies of the small business. Contrary to common usage,
working capital policy should be expressed in terms of asset liquidity, deferability of
current liabilities, predictability of sales, and composition of financing (particularly debt),
rather than in terms of net working capital magnitude (CA minus CL). The distinction is
critical for the small business because: (1) initial liquidity is generally poor; (2) postpone-
ability of current liabilities is both an unknown and risky element; (3) sales predictability
—when attempted—is low; and (4) long-term capital is difficult to obtain. Those
interested in maintaining and extending the small business sector should increase interest
in this critical area (Brian, B., 1996).
When working capital is managed improperly, allocating more than enough of it will
render management non-efficient and reduce the benefits of short term investments. On
the other hand, if working capital is too low, the company may miss a lot of profitable

Copyright © 2014. NJMT
31
NUML Journal of Management & Technology
Vol: 9, No: 2. July, 2014 ISSN 1997-4507
investment opportunities or suffer short term liquidity crisis, leading to degradation of
company credit, as it cannot respond effectively to temporary capital requirements
(Nazir, M., 2008; Afza, T., 2008).
Working capital management is particularly important in the case of small and medium-
sized companies. Most of these companies‘ assets are in the form of current assets. Also,
current liabilities are one of their main sources of external finance. In this context, the
objective of the current research has been to provide empirical evidence about the effects
of working capital management on the profitability of a sample of small and medium-
sized firms. To this end, a sample of Spanish firms was used to conduct a study with
panel data for SMEs. Data on a panel of 8,872 SMEs was collected, covering the period
from 1996 to 2002. The results are similar to those found in previous studies that focused
on large firms and the analyses carried out confirm the important role of working capital
management in value generation in small and medium-sized firms. There is a significant
negative relation between an SME‘s profitability and the number of day‘s accounts
receivable and days of inventory. I cannot, however, confirm that the number of day‘s
accounts payable affects an SME‘s return on assets (Pedro et al., 1996).
Regarding the influence of international sales levels on the use of the working capital
management vehicles, the results show that international sales levels have little impact.
As one would expect, the number of foreign banks and overseas demand deposit amounts
are significantly related to international sales levels. The level at which working capital
decisions are made is not dependent on international sales levels, perhaps an indication
that corporate culture concerning decision-making plays a larger role than international
sales levels (Ricci, C., 1996; Vito, D., 1996).
The inefficiency of a firm‘s working capital management is positively correlated with
firm size and uncorrelated with its industry‘s concentration. I interpret these results as
suggesting that firms are not using their market power at the margin to improve the
efficiency of their working capital management practices. Instead, they tend to follow the
practices of their industry (Robert et al., 2006).
Increases in the current ratio and debt ratios are negatively associated with profitability
and risk adjusted return. Profitability is also significantly negatively related to the current

Copyright © 2014. NJMT
32
NUML Journal of Management & Technology
Vol: 9, No: 2. July, 2014 ISSN 1997-4507
ratio. In other words, liquidity and profitability are clearly inversely related (Shin, 1998;
Soenen, 1998).
Working capital management relates to the source, and application of short-term capital.
When working capital is managed improperly, allocating more than enough of it will
render management non-efficient and reduce the benefits of short-term investment. On
the other hand, if working capital is too low, the company may miss profitable investment
opportunities or suffer short-term liquidity crises, leading to degradation of company
credit, as it cannot respond effectively to temporary capital requirements.
Chiou and Cheng‘ (2006) the research presented here is based on the annual ratings of
working capital management published in CFO magazine. Our findings indicate a
consistency in how industries ―stack up‖ against each other over time with respect to the
working capital measures. However, the working capital measures themselves are not
static, with our results indicting significant movements across our entire sample over
time. Our findings are important because they provide insight to working capital
performance across time, and shine light on working capital management across
industries.
Filbeck & Krueger‘ (2003) this study looked at ten diverse industry groups to examine
the relative relationship between their aggressive/conservative working capital policies.
Regarding the degree of aggressive asset management, the industries had distinctive and
significantly different policies. In addition, the relative nature of the asset policies
between industries exhibited remarkable stability over the ten year study period. Industry
policies concerning the relative degree of aggressive liability management also were
significantly different, but not to the same extent or with the same stability. Interestingly,
Weinraub and Visscher (1998) study also showed a high and significant negative
correlation between industry asset and liability policies. In general, it appears that when
relatively aggressive working capital asset policies are followed they are balanced by
relatively conservative working capital financial policies. It should be apparent that
increased direct investment requires additional working capital.
Consequently, they surveyed executives of Japanese-owned companies to determine their
working capital practices. In this survey, they discovered that the most important
objective of working capital management by Japanese investors was to provide various
Copyright © 2014. NJMT
33
NUML Journal of Management & Technology
Vol: 9, No: 2. July, 2014 ISSN 1997-4507
current assets and short-term credit necessary to support anticipated sales. No other
objective rated close to this one. In addition, the respondents reported that they obtained
most of their short-term funds from Japanese sources, thus rising -the possibility that they
participate in the keiretsu system (Suk et al., 1992).
Eljelly (2004) elucidated that efficient liquidity management involves planning and
controlling current assets and current liabilities in such a manner that eliminates the risk
of inability to meet due short-term obligations and avoids excessive investment in these
assets.
The relation between profitability and liquidity was examined, as measured by current
ratio and cash gap (cash conversion cycle) on a sample of joint stock companies in Saudi
Arabia using correlation and regression analysis. The study found that the cash
conversion cycle was of more importance as a measure of liquidity than the current ratio
that affects profitability. The size variable was found to have significant effect on
profitability at the industry level. The results were stable and had important implications
for liquidity management in various Saudi companies. First, it was clear that there was a
negative relationship between profitability and liquidity indicators such as current ratio
and cash gap in the Saudi sample examined. Second, the study also revealed that there
was great variation among industries with respect to the significant measure of liquidity.
Ghosh and Maji‘ (2003) study shows to examine the efficiency of working capital
management of the Indian cement companies during 1992 – 1993 to 2001 – 2002. For
measuring the efficiency of working capital management, performance, utilization, and
overall efficiency indices were calculated instead of using some common working capital
management ratios. Setting industry norms as target-efficiency levels of the individual
firms, this paper also tested the speed of achieving that target level of efficiency by an
individual firm during the period of study. Findings of the study indicated that the Indian
Cement Industry as a whole did not perform remarkably well during this period.
It was examine the influence of a firm‘s industry on its working capital management
(Hawawini et al., 1986). Using data on 1,181 U.S. firms over the period 1960 to 1979,
they conclude that there is a substantial industry effect on firm working capital
management practices that is stable over time. From these studies, I conclude that sales

Copyright © 2014. NJMT
34
NUML Journal of Management & Technology
Vol: 9, No: 2. July, 2014 ISSN 1997-4507
growth and industry practices are important factors influencing a firm‘s investment in
working capital.
According to (Moyer et al., 1998), firms have two goals - liquidity and profitability.
Many types of costs are related to the excesses and shortages of working capital levels of
investment and financing. Managing these costs can increase the profitability of a firm‘s
operations. Firms have to determine the individual and joint impact of the levels of short-
term investment and financing on the dual objectives of working capital management.
These goals imply that decisions that tend to maximize profitability tend not to maximize
the chances of adequate liquidity. Conversely, focusing almost entirely on liquidity will
tend to reduce the potential profitability of the firm.
Most business operations affect or are affected by working capital operations (purchase
of materials for production, production of finished goods and sales of finished goods to
customers). Purchases of material result in increasing the investment, payment of cash, or
increasing payables. Production results in increasing work in process inventory and
finished goods inventory. Sales end-up in decreasing finished goods inventory, and
increasing cash or receivables. The management of these activities is very time
consuming and may even demand more time if the working capital investments and
short-term financing are actively managed. It is therefore normal for managers to spend
much of their time in activities directly or indirectly related to working capital
investments and short-term debts (Scherr, 1989).
Raw material inventories are used to make production scheduling easier, to take
advantage of price changes and quantity discounts, and to hedge against supply shortages.
If raw material inventories were not held, purchases would have to be made continuously
at the rate of production. This would not only mean high ordering costs and less quantity
discounts, but also production interruptions when raw materials cannot be procured in
time. Therefore, the firm has an interest in buying enough raw materials to provide an
effective cushion between purchases and production (Horim, 1987).
Horne and Wachowicz‘ (1998) study shows us that On the basis of the stability of
balances compared to changes in the volume of sales and production, current assets can
also be divided into permanent and fluctuating. The balance of permanent current assets
remains constant regardless of the change in sales volume or production capacity, while

Copyright © 2014. NJMT
35
NUML Journal of Management & Technology
Vol: 9, No: 2. July, 2014 ISSN 1997-4507
fluctuating current assets vary with a change in sales volume and production capacity.
Permanent current assets include the safety stocks of cash and inventories. They are often
used to meet the long-term minimum needs of investment in current assets. Their balance
is constant over a longer period of time and is therefore comparable with the firms fixed
assets because investments in permanent current assets remain within the firm. The main
difference between permanent current assets and fixed assets is that permanent current
assets constantly change in physical terms, while fixed assets do not.
Due to the large size of inventories maintained, firms commit a considerable amount of
funds to inventories. Therefore, in order to avoid unnecessary investments it is absolutely
imperative to manage inventories efficiently. Neglecting the management of inventories
will jeopardize a firm‘s short and long-term profitability. Inventories are the least liquid
of all current assets; it should therefore provide the highest yield to justify investment
(Block, 1992; Hirt, 1992). Overall, in line with that of cash there are three motives for
holding inventories – the transactions motive, the precautionary motive and the
speculative motive. The transaction motive emphasize on the need to maintain inventory
in order to facilitate smooth production and sales operations. Inventory held for
precautionary motive guards against the risk of unpredictable changes in inventory price,
demand and supply factors. The speculative motive refers to carrying inventory in order
to take advantage of unpredictable changes in inventory price. To be effective,
management has to apply a system to keep track of inventory on hand and on order,
knowledge of lead times and its variability, a reliable forecast of inventory demand and
reasonable estimates of inventory holding, ordering and shortage costs (Stevenson, 1982).
Williamson (1985) pointed out cultural practices, believes and norms also determine
practical management approaches. The study of working capital management has to be
designed in such-away that it takes full consideration of the government regulations and
cultural factors. Management in general and that of working capital in particular, has
become a two-edged sword - internal and external. Internally various working capital
approaches are used to maximize the benefit and reduces the costs of working capital,
Externally the firm-supplier-customer linkages are managed such that the business to
business cooperation results in synergy effects on firm value. This is achieved by

Copyright © 2014. NJMT
36
NUML Journal of Management & Technology
Vol: 9, No: 2. July, 2014 ISSN 1997-4507
reducing inter-firm transaction costs and creates firm value in a win-win condition
(Rubin, 1998; Alvarez, 1998).
(Yeager, 1989; Seitz, 1989) further elaborated when liquidity is maintained through
borrowing, there will be a trade-off between the interest costs paid to creditors and the
income earned from the investment in the assets financed from the borrowing. Therefore,
both too much and too little liquidity have costs. (Fafchamps, 1997) the study indicates
that the Firms would rather sell for cash than on credit, but competitive pressure forces
most companies to offer trade credits. Unlike credit from financial institutions, trade
credit does not rely on formal collateral but on trust and reputation. According to
(Stickney, 1996), cash flow based valuation gives a better picture of a firm's operating
efficiency. This is mainly because of two reasons. First, cash is the ultimate source of
value, that is, when firms invest in resource they delay current consumption and it is the
medium of exchange that will permit them to consume various goods and services in the
future. He argues that a resource has value because of its ability to provide future cash
flows. Second, cash serves as a common measuring unit of future benefits and to compare
future benefits of alternative operating and investment opportunities.
Hypotheses
Ha0: Current Ratio does not have significant impact on profitability
Ha1: Current Ratio has significant impact on profitability
Hb0: Quick Ratio does not have significant impact on profitability
Hb2: Quick Ratio has significant impact on profitability
Hc0: Debt Equity does not have significant impact on profitability
Hc3: Debt Equity has significant impact on profitability
Hd0: Accounts Receivable Turnover does not have significant impact on profitability
Hd4: Accounts Receivable Turnover have significant impact on profitability
He0: Inventory Turnover does not have significant impact on profitability
He5: Inventory Turnover have significant impact on profitability

Copyright © 2014. NJMT
37
NUML Journal of Management & Technology
Vol: 9, No: 2. July, 2014 ISSN 1997-4507
Model 1
Y=b0 + b1 CR + b2 QR+ b3 D/E+b4 ITR +b5 ART+ ε
Theoretical Model 1
Independent Variables Dependent Variable
Accounts Receivable
Turnover
Quick Ratio
Debt to Equity Ratio
Return on Assets
(Lazaridis et al., 2000)
Current Ratio
Inventory Turnover

Copyright © 2014. NJMT
38
NUML Journal of Management & Technology
Vol: 9, No: 2. July, 2014 ISSN 1997-4507
Model 2
Y=b0 + b1 CR + b2 QR+ b3 D/E+b4 ITR +b5 ART+ ε
Theoretical Model 2
Independent Variables Dependent Variable
Methodology
The study is designed to measure the relationship among the working capital and
profitability.
Population
The population for the current research work is cement industry of Pakistan.
Accounts Receivable
Turnover
Quick Ratio
Debt to Equity Ratio
Return on Equity
(Lazaridis et al., 2000)
Current Ratio
Inventory Turnover

Copyright © 2014. NJMT
39
NUML Journal of Management & Technology
Vol: 9, No: 2. July, 2014 ISSN 1997-4507
Sampling
Researcher have selected the all 18 listed companies of cement industry from KSE:
Pioneer cement, Fauji cement, Cherat cement, D.G.Khan cement, Al-Abbas, Bestway,
Dandot Cement, Dewan cement, Fecto cement, Attock Cement etc.
Research Instruments and Data Collection
Annual reports, financial statements of the companies and published articles about the
performance of cement sector of Pakistan have been used in the study. The data is taken
by the State Bank website.
Data Analysis Methods
The data of 18 firms in cement industry for the years 2005 to 2012 used in this study have
been taken from mainly secondary sources. The necessary secondary data have been
collected from the financial statements published in the Annual Reports of the cement
companies. Editing, classification and tabulation of the financial data collection from the
above-mentioned source have been done as per the requirements of the study. For
assessing the performances of the financial data collected form the above-mentioned
source have been done as per the requirements of the study. For analyzing data simple
mathematical tools like ratios, percentage and various statistical tools have been used.
The ratios relating to working capital management which have been selected and
computed for the study are:
The independent variables of the study are as follows:
(i) Current Ratio (CR)
(ii) Quick Ratio (QR)
(iii) Debt to Equity Ratio (D/E)
(iv) Accounts Receivable Turnover Ratio (ART)
(v) Inventory Turnover Ratio (ITR)
Dependent variables of the study are as follows:
i) Return on Assets (ROA)
(ii) Return on Equity (ROE)
Results, Discussion & Operationalization

Copyright © 2014. NJMT
40
NUML Journal of Management & Technology
Vol: 9, No: 2. July, 2014 ISSN 1997-4507
After collecting the data from SBP website as per our econometrics model we will
calculated the
Variables as follow:
Return on Assets (ROA) = Net Income
Total Assets
Return on Equity (ROE) = Net Income
Total Assets
Current Ratio (CR) = Current Asset
Current Liabilities
Quick Ratio (QR) = Current Asset_-Inventory
Current Liabilities
Debt/ Equity Ratio (DE) = Total Liabilities
Total Shareholder Equity
Inventory Turnover Ratio (ITR) = Cost of Goods Sold
Inventories
Account Receivable Turnover (ART) = Sale on Credit
Account Receivable
With the help of above formulas all variable are computed in the excel sheet than
populated all variable in Eviews than with the help of plotting graph in Eviews to identify
outliers and remove all abnormal outliers from the all variables data series which are also
not justifiable by economics rational. So remove all outliers which are against economic
theory than check heterokedasticty.
Detecting Heterokedasticty
Study used white hetroskedasticity test to test the presence and absence of
hetroskedasticity in the given data.
Detecting Autocorrelation
After detecting the heterokedasticty than check is there is any auto correlation of times
series with its lags values. For this first of all we will used the Breush Godfry seriel

Copyright © 2014. NJMT
41
NUML Journal of Management & Technology
Vol: 9, No: 2. July, 2014 ISSN 1997-4507
Correlation LM test. It is found that the autocorrelation of first degree exist in the data
because p value of Resid (-1) is significant. When again run this test by putting no. of
lags = 2 than p value of resid(-2) become insignificant. Therefore first order auto
correlation exists. Autocorrelation is addressed by putting AR (1) term in the main
equation due to which autocorrelation becomes insignificant.
Descriptive Statistics
Table 1 show the descriptive statistics result. ROA data series has means value of 1.103
and median of 0.70 and maximum point is 11.00 and minimum point of -7.30 and
volatility in RoA is 5.16 and the data is positively skewed and the kurtosis is < 3 there the
shape of curve is flatter. ROE data series has means value of 2.846 and median of 2.8 and
maximum point is 28.8 and minimum point of -21.10 and volatility in RoE is 13.56 and
the data is positively skewed and the kurtosis is < 3 there the shape of curve is flatter. QR
data series has means value of 51.39 and median of 49.6 and maximum point is 93.8 and
minimum point of 16.1 and volatility in QR is 23.22 and the data is positively skewed
and the kurtosis is < 3 there the shape of curve is flatter. The Volatility in CR, DE, ITR
and ART is 27.24, 42.84, 8.20.217.12 respectively. The Coefficient of Skewness is
positive in all data series therefore there is positively skewed distribution and the value of
Kurtosis show that shape of curve is flatter except the ART data series which have picked
curve because kurtosis is >3.
Descriptive Statistics Table: 1
ROA ROE QR CR DE ITR ART
Mean 1.103 2.846 51.395 59.93 116.37 15.17 138.53
Median 0.700 2.800 49.600 59.50 107.50 14.44 66.67
Maximum 11.00 28.80 93.800 106.60 206.10 30.93 1000.0
Minimum -7.30 -21.10 16.100 19.00 52.30 0.000 0.000
Std. Dev. 5.167 13.568 23.22 27.24 42.84 8.20 217.12
Skewness 0.338 0.075 0.152 0.129 0.360 0.029 2.94
Kurtosis 2.013 1.883 1.797 1.659 2.006 2.230 11.92
Correlation Matrix
Table: 3
Variables ROA ART CR DE ITR QR
ROA 1.000
ART 0.297 1.000
CR 0.990 0.352 1.000
DE 0.996 0.304 0.988 1.000

Copyright © 2014. NJMT
42
NUML Journal of Management & Technology
Vol: 9, No: 2. July, 2014 ISSN 1997-4507
ITR 0.987 0.293 0.979 0.986 1.000
QR 0.994 0.324 0.997 0.992 0.987 1.000
Regression for Model 1
Dependent Variable: ROA
Method: Least Squares Table : 2
Variable Coefficient Std. Error t-Statistic Prob.
C -11.670 0.451 -25.899 0.000
ART 0.000 0.000 -1.423 0.160
CR 0.024 0.029 0.823 0.414
DE 0.068 0.014 4.896 0.000
ITR 0.042 0.047 0.874 0.386
QR 0.056 0.038 1.471 0.147
R-squared 0.995092 Mean dependent var 1.10308
Adjusted R-squared 0.994676 S.D. dependent var 5.16751
S.E. of regression 0.377067 Akaike info criterion 0.97498
Sum squared resid 8.388606 Schwarz criterion 1.17569
Log likelihood -25.6868 Hannan-Quinn criter. 1.05417
F-statistic 2392.198 Durbin-Watson stat 0.79812
Prob(F-statistic) 0
ROE Model
Dependent Variable: ROE
Method: Least Squares Table : 2
Variable Coefficient Std. Error t-Statistic Prob.
C -25.870 0.648 -39.915 0.000
ART 0.001* 0.001 2.530 0.014
CR 0.027 0.049 0.556 0.580

Copyright © 2014. NJMT
43
NUML Journal of Management & Technology
Vol: 9, No: 2. July, 2014 ISSN 1997-4507
DE 0.006 0.021 0.306 0.761
IRT 0.494*** 0.086 5.740 0.000
QR 0.364*** 0.070 5.218 0.000
R-squared 0.997114 Mean dependent var 2.846
Adjusted R-squared 0.99687 S.D. dependent var 13.57
S.E. of regression 0.759152 Akaike info criterion 2.375
Sum squared resid 34.00244 Schwarz criterion 2.575
Log likelihood -71.1725 Hannan-Quinn criter. 2.454
F-statistic 4077.288 Durbin-Watson stat 1.067
Prob(F-statistic) 0
Correlation Matrix Table: 5
Variables ROE ART CR DE IRT QR
ROE 1.000 0.335 0.994 0.992 0.991 0.997
ART 0.335 1.000 0.352 0.304 0.293 0.325
CR 0.993 0.352 1.000 0.988 0.979 0.997
DE 0.991 0.303 0.987 1.000 0.986 0.992
IRT 0.991 0.293 0.979 0.986 1.000 0.987
QR 0.997 0.324 0.997 0.992 0.987 1.000
Results and Discussion
Model Summary of Return on Assets
The Statically analysis model summary shows that the return on asset is the dependent
variable up to R square 99 % variation is explained by explanatory variables. The
explanatory variables Current Ratio Quick Ratio Debt to Equity Ratio Account
Receivable Inventory Turnover.
F Statistics
The regressions run on this model which shows the high significance the result. Because
the F statistics is has significant p value. Therefore the model is best fit. The regression
line is the minimum variance line.

Copyright © 2014. NJMT
44
NUML Journal of Management & Technology
Vol: 9, No: 2. July, 2014 ISSN 1997-4507
Coefficients
The coefficient of data analysis shows the following results.
Current Ratio: It indicates that there is direct relationship between the Current Ratio and
Return on Assets. But the relationship is in significant. The movement of the slop is
positive direction which is 0.024. The result is significant because p value is greater than
5%.
Quick Ratio
It indicates that there is direct relationship between the quick Ratio and Return on Assets.
But the relationship is insignificant. The movement of the slop is positive direction which
is 0.056. The result is is significant because p value is greater than 5%.
Debt to Equity Ratio
It indicates that there is direct relationship between the Debt Equity ratio and Return on
Assets. But the relationship is significant. The movement of the slop is positive direction
which is 0.056. The result is is significant because p value is less than 5%.
When the company is highly leveraged it means it has a positive impact on return on
assets.
Account Receivable Turnover (ART) Ratio
ART indicates that the slop of equation is the negative which is -.00046 that means there
is a inverse relationship between the independent and dependent variables both are
moving in the opposite direction. When there are increases in account receivable turnover
it leads to increase on Return on Assets. Although the results are not significant.
Inventory Turnover Ratio
The results show that there is a direct relationship between the dependent and
independent variables the slop is 0.0415 and the results are insignificant.
Correlation Matrix (table 3)
Table 3 shows the correlation among the entire variable. There is significant correlation
between ROA and ART, CR DE ITR and QR. Because the value of correlation
coefficient is greater than 0.5 as shown in table 3 there is significant positive correlation
in above mention all the variables. It means when there is one unit change in ROA than
ART, CR DE ITR and QR are also change but in same direction. Because the above
variables are showing direct relationships.

Copyright © 2014. NJMT
45
NUML Journal of Management & Technology
Vol: 9, No: 2. July, 2014 ISSN 1997-4507
Model 2 (Table 5)
The impact of working capital ratio Over Return on Equity
With the help of above formulas all variable are computed in the excel sheet than
populated all variable in Eviews than with the help of plotting graph in Eviews to identify
outliers and remove all abnormal outliers from the all variables data series which are also
not justifiable by economics rational. So remove all outliers which are against economic
theory than check heterokedasticty.
Detecting Heteroskedasticity
There are following five methods will be used to check where given data series are
homoscedasticity are having presence of Heteroskedasticity.
The Breusch pagan LM Test
The Glesjer LM Test
The Harvey-Godfrey LM Test
The park Test
The White Test
The above mentioned LM test are run in Eviews and the result of LM=No. of observation
X R square
The p value is insignificant which is greater than 5%. So it is concluded that the given
data series does not report heterokedasticty and data are homokadasticst.
Detecting Autocorrelation
After detecting the heterokedasticty than check is there is any auto correlation of times
series with its lags values. For this first of all we will used the Breush God fry serial
Correlation LM test. It is found that the autocorrelation of first degree exist in the data
because p value of Resid (-1) is significant. When again run this test by putting no. of
lags = 2 than p value of resid (-2) become insignificant. Therefore first order auto
correlation exists so Durbin Watson test is run for detecting autocorrelation. We regress
the equation in Eviews as ROA as dependent variable and CR, QR, DE, IRT, ART as
independent variables. Than observe the value of Durbin Watson state is 1.067. By using
Durbin Watson State table to find out DL and DU. That is DL= 1.44 DU =1.77 at
k=5(independent variable and n=65. Drawn the durbin Watson line our calculated value
falls between 0 and 1.44. Therefore it concluded that positive autocorrelation is exist in

Copyright © 2014. NJMT
46
NUML Journal of Management & Technology
Vol: 9, No: 2. July, 2014 ISSN 1997-4507
the data and then method of HAC (neway-west) is used than the result that are free from
autocorrelation are as follow as shown table 5 :
Model Summary of Return on equity table 5
The Statically analysis model summary shows that the return on equity is the dependent
variable up to R square 99 % variation is explained by explanatory variables. The
explanatory variables Current Ratio Quick Ratio Debt to Equity Ratio Account
Receivable Inventory Turnover.
F Statistics
Table 4 the regressions run on this model which shows the high significance the result.
Because the F statistics is has significant p value. Therefore the model is best fit. The
regression line is the minimum variance line.
Coefficients
The coefficient of data analysis shows the following results.
Current Ratio: It indicates that there is direct relationship between the Current Ratio and
Return on equity. But the relationship is in significant. The movement of the slop is
positive direction which is 0.027. The result is insignificant because p value is greater
than 5%.
Quick Ratio
It indicates that there is direct relationship between the quick Ratio and Return on
equity. But the relationship is significant. The movement of the slop is positive direction
which is 0.363. The result is insignificant because p value is less than 5%.
Debt to Equity Ratio
It indicates that there is direct relationship between the Debt Equity ratio and Return on
Assets. But the relationship is insignificant. The movement of the slop is positive
direction which is 0.0062. The result is insignificant because p value is greater than 5%.
Account Receivable Turnover (ART) Ratio
ART indicates that the slop of equation is the positive which is .0012 that means there is
a direct relationship between the independent and dependent variables both are moving in
the same direction. When there are increases in account receivable turnover it leads to
increase on Return on equity. Results are significant because p value is less than 5%.
Inventory Turnover Ratio

Copyright © 2014. NJMT
47
NUML Journal of Management & Technology
Vol: 9, No: 2. July, 2014 ISSN 1997-4507
The results show that there is a direct relationship between the dependent and
independent variables the slop is 0.493 and results are significant because p value is less
than 5%.
Correlation Matrix (table 5)
Table 3 shows the correlation among the entire variable. There is significant correlation
between ROE and ART, CR DE ITR and QR. Because the value of correlation
coefficient is greater than 0.5 as shown in table 3 there is significant positive correlation
in above mention all the variables. It means when there is one unit change in ROE than
ART, CR DE ITR and QR are also change but in same direction. Because above
variables are showing direct relationships.
Conclusions and Recommendations
Working capital management and profitability of the company disclosed both negative
and positive association. In Model 1 (Table 2) Out of the five ratios selected for the
study three ratios, namely CR, QR, D/E, and IRT registered positive correlation with the
selected profitability ratio, ROA. ART has negative correlation with ROA and CR, QR,
ART and ITR have insignificant relationship with ROA. Only DE ratio has significant
relationship with ROA. It means when DE increased it will put significant positive
impact on profitability ratio (ROA).
In Model 2 (Table 4) five ratios selected for the study and all five ratio CR, QR, D/E, ITR
and IRT registered positive correlation with the selected profitability ratio, ROE. But
ART, ITR and QR has significant positive relationship with ROE and CR, and DE have
insignificant relationship with ROE. It means when ART , ITR and QR are increased it
will put significant positive impact on profitability ratio (ROE).
This study was conducted to check the relationship between working capital management
and profitability. All the five hypotheses are partially proved by the data. Although from
the literature review it is proved that working capital management has a positive
relationship with the profitability.
It is suggested that further research should be conducted in this area with some different
aspects of working capital management such as payables, cash conversion cycle and
receivables which also are an essential part of the working capital management.

Copyright © 2014. NJMT
48
NUML Journal of Management & Technology
Vol: 9, No: 2. July, 2014 ISSN 1997-4507
The new thing in our research the idea is tested but we have studied on of richest
manufacturing sector in Pakistan where there is high level of Working Capital is required
to improve the business efficiency and profit margin also as well . In cement sector and
other manufacturing sector there is the need of time to set all important parameters and
must be determine the appropriate level of Working Capital is required
This study highlights the importance and effectiveness of the working capital practices in
corporate sectors. Many studies have provided the solid documentary evidence that there
is the position and negative significant relationship among the working capital and
profitability of the company. We found the negative relationship between profitability
measures of the firm and degree of the aggressiveness of the working capital. Investment
and financing policy. This study should be predicted applied in the corporate sector.

Copyright © 2014. NJMT
49
NUML Journal of Management & Technology
Vol: 9, No: 2. July, 2014 ISSN 1997-4507
References
Afza T and MS Nazir (2007). Is it Better to be Aggressive or Conservative in Managing
Working Capital? (Unpublished Dissertation). Pakistan: COMSATS institute of
information technology Islamabad
Afza T and MS Nazir (2007). Working Capital Management Policies of Firms: Empirical
Evidence from Pakistan. Presented at 9th South Asian Management Forum (SAMF) on
February 24-25, North South University, Dhaka, Bangladesh.
Anthony. Robert. N., Reece, James.S, ―Accounting Principles‖, 2004, Edition
6th
.A.I.T.B.S Publisher and distributors all India traveler bookseller, pp. 322-23.
Band, G.C. (1991), ―Fifty years of UK Offshore oil & gas‖. The geographic journal,
vol.157, no.2, pp.179-189.
Banker, R.D., Chang, H.H. & Majumdar, S.K. (1993), ―Analyzing the underlying
dimensions of firm profitability‖. Managerial and decision Economics, vol.14, no.1,
pp.25-76.
Ben-Horim Moshe, (1987), Essentials of Corporate Finance, Allyn and Bacon, Inc., Boston.
Block S. B., Hirt G. A., (1992), Foundations of Financial Management, Richard D. Irwin
Inc., Boston, Mass
Bodie. Zvi, Kane. Alex, Margus. Alan.J, ―Investment‖, 1999, Edition 4th
, Irwin Mc
Graw_Hill, pp. 578-585.
Brain, B. WORKING CAPITAL POLICY AND LIQUIDITY IN THE SMALL
BUSINESS. Theme article
Capon, N., Farley, J.U & Hoenig, S. (1990),‖Determinants of financial performance: a
meta-analysis‖. Management Sciences, vol.36, no.10, pp.1143-1159
Capron, L., Mitchell. W. & Swaminathan. A. (2001), ―Asset divestiture following
horizontal acquisitions: A dynamic view‖. Strategic Management Journal, vol.22, no.9,
pp.817-844.
Cavanaugh, J.K. & Garen, J. (1997), ―Asset Specificity, Unionization and the Firm's Use
of Debt‖. Managerial and Decision Economics, vol.18, no.3, pp.255-269.
Chasteen. Lanny. G, Flaherty. Richard.E, ―Intermediate Accounting‖, 1997 Edition 6th
,
Irwin Mc Graw_Hill, pp. 240-245, 228-247.
Chiou,J.R. and Cheng,L. 2006 ―The Determinants of Working Capital Management‖ The
Journal of American Academy of Business, Cambridge Vol. 10 Num. 1
Deloof, M. 2003. ―Does Working Capital Management Affects Profitability of Belgian
Department of Management and Finance, Faculty of Economy and Business,
Eljelly, A. 2004. ―Liquidity-Profitability Tradeoff: An empirical Investigation in an
Emerging Market”, International Journal of Commerce & Management, Vol 14 No 2
pp. 48 - 61)

Copyright © 2014. NJMT
50
NUML Journal of Management & Technology
Vol: 9, No: 2. July, 2014 ISSN 1997-4507
Fafchamps, M. (1997), ―Trade credit in Zimbabwian Manufacturing‖, World Bank
development, vol. 25 no.5, pp 795-815.
Filbeck, G. and Krueger, T. An Analysis of Working Capital Management Results Across
Industries
Firms?‖, Journal of Business Finance & Accounting, Vol 30 No 3 & 4 pp. 573 – 587
Ganesan, V (2007). ―An analysis of working capital management efficiency in
telecommunication equipment‖. The journal of financial and quantitative analysis, vol 3,
no 2.
Ghosh, S. K. and Maji, S. G. 2003. ―Working Capital Management Efficiency A study on
the Indian Cement Industry‖. The Institute of Cost and Works Accountants of India.
Gondzio, J., & Berg, R. K. (2001), ―High performance computing for asset-liability
management‖. Operation research, vol.49, no.6, pp.879-891.
Griffin, J.M. (1988), ―A test of free cash flow hypothesis results from petroleum
industry”. The review of economics and statistics, vol.70, no.1, pp.76-82.
Hawawini, G., C. Viallet, and A. Vora, 1986, ―Industry Influence on Corporation
Hovakimian, A., Opler, T., Titman, S. (2001), ―The Debt-Equity Choices‖. The journal of
financial and quantitative analysis, vol.36, no.1, pp.1-24.
International Journal of Managerial Finance Vol. 3 No. 2, 2007 pp. 164-177
Kieschnick, R. LaPlante, M. Moussawi, R 2006 ―Corporate working capital management:
Determinants and Consequences‖
Kim,S.H, Rowland,M. and Kim,S.H. 1996 ―Working Capital Practices by Japanese
Manufacturers in the U.S.‖ Financial practice and education.
Kusy, M.I. & Ziemba, W.T. (1986), ―A Bank asset and Liability Management Model‖.
Operations Research, vol.34, no.3, pp.356-376.
Lazaridis Ioannis, K.Lyroudi (2000), ―Short-term financial management of the business
in Greece and in Cyprus, Business and Economics Society International
Lazaridis, i. & tryfonidis, d., (2006), ―relationship between working capital management
and profitability of listed companies in the Asian stock exchange‖ journal of financial
management and analysis pp 26-35
Meigs. Robert.F, Williams. Jan.R, Haka. Susan.F,& Bettner.Mark.S, ―Accounting‖, 1999,
Edition 11th
, pp. 608-673.
Mills,G.T. 1996 ‗The impact of inflation on capital budgeting and working capital‘,
Journal Of Financial And Strategic Decisions Vol. 9 No. 1.
Missale, A.,Giavazzi, F. & Benigno, P. (2002), ―How Is the Debt Managed? Learning
from Fiscal Stabilizations‖. The Scandinavian Journal of Economics, vol.104, no.3,
pp.443-469.
Moyer R. C., Mcguigan J. R., Kretlow W.J. (1995), Contemporary Financial

Copyright © 2014. NJMT
51
NUML Journal of Management & Technology
Vol: 9, No: 2. July, 2014 ISSN 1997-4507
Naceur, S.B. & Goaid, M.(2002), ―The relationship between dividend policy, financial
structure, profitability and firm value‖. Applied financial economics, vol.12, no.12, pp.
843-849.
Padachi,K. 2006 ―Trends in Working Capital Management and its Impact on Firms‘
Performance: An Analysis of Mauritian Small Manufacturing Firms‖ International
Review of Business Research Papers Vo.2 No. 2 Pp. 45 -58
Pan, y. & Chi, P.S.k. (1999), ―Financial Performance and Survival of Multinational
Corporations in China”. Strategic Management Journal, vol.20, no.4, pp.359-374.
Pandey IM and KLW Parera (1997). Determinants of Effective Working Capital
Management - A Discriminant Analysis Approach. IIMA Working Paper # 1349.
Research and Publication Department Indian Institute of Management Ahmedabad India.
Pedro Juan Garcı´a-Teruel and Pedro Martı´nez-Solano
Rehman A (2006). Working Capital Management and Profitability: Case of Pakistani
Firms (Unpublished Dissertation). Pakistan: COMSATS Institute of Information
Technology Islamabad.
RICCI,C. and Vito,N.D. 2000 ―International working capital practices in the UK‖
European Financial Management, Vol. 6, No. 1, pp 69-84.
Roberts, P.W. & Dowling, G.R. (2002), ―Corporate reputation and sustained superior
financial performance”. Strategic Management Journal, vol.23, no.12, pp.1077-1093.
Rubin R. E., Alvarez A., (1998), ―Business LINC: Business to Business Relationship that
Increases the Economic Competitiveness of Firms
Scherr, F. C., (1989), Modern Working Capital Management, Text and Cases, Prentice-Hall
International Editions, Englewood Cliffs, New Jersey
Seshadri, s., Khanna, A., Harche, F. Wyle, R. (1999), ―A method for strategic asset-
liability management with an application to the federal home loan bank of newyork‖.
Operations Research, vol.47, no.3, pp.345-360.
Shin, H.H and Soenen, L. 1998. “Efficiency of Working Capital Management and
Corporate Profitability”, Financial Practice and Education, Vol 8 No 2, pp 37-45
Stevenson, William J., (1982), Production / Operation Management, Irwin, Homewood, III.
Stickney C. P. (1996), Financial Reporting and Statement Analysis, Third Ed., The
Dryden Press, Forth Worth.
Szymanski, D. M., Bhardwaj, S. G., Varadarajan, P. R. (1993), ―An analysis of market
share-profitability relationship”. Journal of marketing, vol.57, no.3, pp.1-18.
Thomadakis, S.B., (1977),‖A value-based test of profitability and market structure‖. The
review of economics and statistics, vol.59, no.2, pp.176-185.
University of Murcia, Murcia, Spain
Van Horne J. C., and Wachowicz J. M., (1998), Fundamentals of Financial
Watts. John, ―Accounting in business environment‖, 1996, Edition 2nd,
Pitman Publisher,
pp. 451-500.
Copyright © 2014. NJMT
52
NUML Journal of Management & Technology
Vol: 9, No: 2. July, 2014 ISSN 1997-4507
Weinraub HJ and S Visscher (1998). Industry Practice Relating To Aggressive
Conservative Working Capital Policies. Journal of Financial and Strategic Decision
11(2): 11-18.
Williamson O. E., (1985), the Economic Institutions of Capitalism, Firms, Markets and
Relational Contracting, Free Press, New York
Working Capital Decisions,‖ Sloan Management Review 27, 15-24.
Yeager F. C. and Seitz N. E. (1989). Financial Institution Management, Text and Cases,
Prentice hall, Englewood Cliffs, NJ

Copyright © 2014. NJMT
53
NUML Journal of Management & Technology
Vol: 9, No: 2. July, 2014 ISSN 1997-4507
The mediating influence of Task conflict on the relationship between
situational constraint and workplace bullying
Dr. Naveed Akhtar
Email: [email protected]
Habib Ur Rehman
Email: [email protected]
Sajid Rehman Khattak
Email:[email protected]
Abstract
Task conflict subsists contained through a group or team when there are divergences
accompanied by means of the group associates regarding the tasks being executed. Yet
even so situational manipulates may reason persons in the direction of obtain positive
dissimilar conflict management strategies transversely time; work locations are time and
yet again extremely resolute as well as relatively predictable. Workplace bullying, similar
to infancy bullying, is the resemblance of entity otherwise groups just before utilize
persistent in timid dating or in equitable activities alongside an associate or assistant.
Workplace bullying preserve restrain such methods in oral, nonverbal, emotional physical
mistreatment with disgrace. Situational constraints, as well as frequently well-known
appearance of job stressor or else injures, had common sensible consciousness inside
intensification environmental otherwise connected tools of the work place. Data were
investigated since an outcome of calculate Multi-Collinarity Analysis of Variance
(MANOVA) statistics, Factor Analysis, Post-hoc analysis, Mediation test, Sobel test,
Factor Analysis, Correlation Matrix, the empirical evidence established so as to there is a
positive significant relationship among workplace bullying along with situational
constraint through task conflict by means of since mediator, situational constraint
manipulates experience on the way to workplace bullying, the factor control time, work
environment, job connected in sequence manipulate it. Task conflict partially mediates
workplace bullying.
INTRODUCTION
The possible for conflict exists whenever and wherever people have get in touch with as
people are organized into groups to look for a general goal, the probability of conflict to
the highest degree increases. Since only the grimmest conflicts make headlines, conflict
has a negative implication for many people. The entire conflicts are not the unchanged
Task conflict is when team members convey differences of belief that narrate only to
work tasks. Past research has exposed that task conflict may possibly sometimes be
valuable and sometimes be negative to team recital When team members are not scared to
exclaim and propose nonconforming opinions that confront the status quo. If people
deem that they will be attacked for expressing unusual viewpoints, the environment is
said to have low psychological wellbeing. In this case, the team could be in jeopardy of
group feel, which is when disinclination to raise your voice leads to poor or appalling
team decision making.
Copyright © 2014. NJMT
54
NUML Journal of Management & Technology
Vol: 9, No: 2. July, 2014 ISSN 1997-4507
Workplace bullying, like childhood bullying, is the affinity of individuals or groups to
use relentless hostile or unfair behavior beside a co-worker or subordinate. Workplace
bullying can contain such procedure as verbal, nonverbal, psychological, physical abuse
and humiliation. This type of aggression is mainly complicated because; dissimilar the
emblematic forms of school bullying, workplace bullies frequently drive within the
reputable regulations and policies of their organization and their society. Bullying in the
workplace is in the greater part of gear reported as having been perpetrated by
management and takes an extensive range of forms. Bullying can be concealed or over
task conflict exists within a group or team when there are disagreements between the
group members regarding the tasks being performed. Task conflict exists within a group
or team when there are disagreements amid the group members about the tasks being
performed. Even nevertheless situational influences may cause individuals to take up
different conflict management strategies across time; work settings are time and again
highly unwavering and quite conventional. Employees cooperate with the same co-
workers, inducement structures do not change suddenly, employees do the identical kind
of work for longer periods of time, and they mug the same (interpersonal) problems on a
returning basis. The situational constraints theory presented by Peters, O‘Connor, and
Eulberg (1985) and Kane (1993) provided the theoretical framework for the study. While
early work proved informative in considerate the relationship of situational constraints
with many intrapersonal, or individual, constructs such as goal setting (Peters, Chassie,
Lindholm, O‘Conner & Kline, 1982).Socio cultural theory focuses on accepting the
magnitude of situational factors in behavior faintly than individual distinction factors.
Socio cultural theory places of interest the importance of the culture of the organization,
When increased disappointment or stress caused by workplace factors result in
employees intriguing frustrations out on others. Conflict management styles are select by
individuals to match situations and diverge depending upon an individual‘s perceptions
of disagreement, intervention, negative emotions, as well as the type of conflict.
According to Baron and Kenny (1986), a mediator is a variable that changes in relative to
the independent and dependent variables. Mediation implies a causal progression along
with three variables. A mediation model identifies and clarifies the apparatus that
underlies an pragmatic relationship between an independent variable and a dependent
variable passing through the insertion of a third explanatory variable, known as a
mediator variable. According to Baron and Kenny (1986), Mediation is second-hand in
the case of a strong relationship between the predictor and criterion variable. The
independent variable is assumed to basis the mediator; these two variables should be
connected. The occurrence of such a correlation results in multicollinearity, when the
possessions of independent variable and mediator on the dependent variable are probable
Multicollinearity is a statistical trend in which two or more predictor variables in a
multiple regression model are vastly correlated. In this situation the coefficient estimates
may change randomly in reaction to small changes in the model or the data.
Multicollinearity does not condense the predictive influence or reliability of the model as
a whole, at least within the sample data themselves; it only affects estimates a propos
individual. That is, a multiple regression model with correlated predictors can indicate
how well the complete pack of predictors predicts the outcome variable, but it may not
provide valid results about any individual predictor, or about which predictors are
unnecessary with respect to others, the assumptions basic regression analyses such as

Copyright © 2014. NJMT
55
NUML Journal of Management & Technology
Vol: 9, No: 2. July, 2014 ISSN 1997-4507
ordinary least squares, the phrase "no multicollinearity" is every so often used to signify
the nonexistence of fault less multicollinearity, which is an strict (non-stochastic) linear
relation between the regresses.
Research Questions
1) Does situational constraint leads to exposure to workplace bullying?
2) Does situational constraint leads to task conflict?
3) Does situational constraint mediates the relationship between task conflict and
exposure to workplace bullying?
Research Objectives
1) To determine high perceived situational constraint to exposure to workplace
bullying.
2) To determine high perceived situational constraint leads to task conflict.
3) To determine task conflict positively correlates with exposure to workplace
bullying.
4) To determine task conflict mediates the relationship between workload and
workplace bullying.
Significance
In Pakistan scenario this is the first study conducted to provide an indulgent of the
situational constraint between workplace bullying and task conflict used as a
mediator. In this study provides occasion for positive approach to address any
shortcoming. It provides an understanding of the situational constraint among
workplace bullying and task conflict.
Literature Review
Bullying at work intended irritating, offending, socially exclusive of an important person
or negatively upsetting someone's work tasks. In array for the tag bullying (or mobbing)
to be useful to a scrupulous bustle, interface or process it had to occur repetitively and
commonly and over a period of time. Bullying was getting higher process in the path of
which the person confronted trimmings up in a mediocre position and becomes the target
of systematic negative social acts. A conflict could not be called bullying if the incident
was an isolated event or if two parties of approximately equal "strength" was in conflict.
Bullying of workplace newcomers, or rite de passage bullying, comprises an old type of
workplace bullying, known for centuries, especially occurring within shipping, military
service, or several societies. In such cases, newcomers in the work place were met with
unapproachable behavior. This conduct could be regarded as a cultural tradition, in which
the new person was checked out and "tested".
The concept of workplace bullying refers to situations where an employee inside
fatigable expose to negative and aggressive behaviors at work mainly of a psychological
Copyright © 2014. NJMT
56
NUML Journal of Management & Technology
Vol: 9, No: 2. July, 2014 ISSN 1997-4507
nature (Leymann, 1996), with the effect of mortifying, menacing, fearsome or tiring the
target. Many of these single acts may be rather general in the workplace (Leymann, 1996)
and, when happening in seclusion, may be seen as cipher of uncivil behavior or
‗‗impoliteness‘‘ at work (Lim & Cortina, 2005).When tirelessly directed towards the
same individual over a longer period of time, they may revolve into an intense source of
social stress (Zapf, 1999), proficient of causing relentless harm. Although the negative
and discarded nature of the behavior complicated is important to the concept of bullying,
the concept‘s center characteristic is not the nature of the behaviors per se, but slightly
the persistency of the experience (Einarsen et al., 2003).Buss (1961) argued that hostile
behavior could be conceptualized beside three magnitudes: physical-verbal, active-
passive, and direct-indirect.
Hence, bullying constitutes budding and frequently growing hostile workplace
associations relatively than isolated and detached events and is allied with replication
(frequency), gap (over a period of time) and patterning (of a variety of behaviors
involved) as its most prominent features (Einarsen et al., 2003). An uncomplicated Work
& Stress by difference exists between straight measures, such as accusations, verbal
abuse and public embarrassment on the one hand, and indirect acts of hostility, such as
rumors, gossiping and social isolation, on the other (O‘Moore, Seigne, McGuire, &
Smith, 1998). With situation to the workplace situation a supplementary difference has
been made between work-related behaviors and person-related behaviors (Einarsen,
1999), obvious in an untimely Finnish study (Vartia, 1991) where smear, social seclusion
and intimation about someone‘s mental health may be seen as examples of person related
bullying, even as giving a person too many, too few or too simple tasks, or tirelessly
criticizing a person or their work, may be allied with work-related bullying.
While mainly apprehensive with negative behavior of a psychological nature, studies
relating targets of bullying have discovered that physically menacing acts, and in some
cases even physical brutality or the threat of violence, form part of a wider repertoire of
aggressive acts applied in bullying cases (Leymann, 1990)..Bullying could have long-
term academic, physical, and emotion consequences on bullies, their fatalities, and
bystanders. The prevalence of bullying at schools had a negative impact on students‘
prospect to be trained in a milieu that was safe and secure and where they were treated
with respect (Shellard and Turner, 2004; Lumsden, 2002).
An endeavor to ignominy a coworker, the bully may buzz sabotage work, or criticize
ideas (Lutgen-Sa). If workers could confirm they were targets of verbal operation
sabotage, or threats, they may be proficient to salvage lost wages, medical expenses, and
even castigatory reparation Furthermore sixteen additional states were proposing anti-
bullying legislation (Cohen, 2010).Employees that witnesses their co-workers being
abused capacity be terrified that they will be the next target of the bully. As a result, non-
targeted co-workers also experience more stress in chaotic environments; actors may see
their activities as maintaining control in situations where the actor has insufficient work
control or high levels of work conflict (Einarsen et al., 1994). Individual responses
suggest that accountability for bullying resides in the targeted individual, which simply
was not the case. What were more, individual efforts to stop bullying was usually less

Copyright © 2014. NJMT
57
NUML Journal of Management & Technology
Vol: 9, No: 2. July, 2014 ISSN 1997-4507
than successful (Keashly, 2001; Lutgen-Sandvik, Alberts, & Tracy, 2008). Nonetheless,
those targeted were keen to know what they could do to stop abuse. We argue a number
of probable approaches targets may take, including how coworkers could help in these
situations. Coworkers could be very helpful for supporting targets‘ stories and breaking
the bullying cycle (Macintosh, 2006); concerted voice simply increases believability
(Lutgen-Sandvik, 2006).
The situational constraints scale was measured a causal sign scale in which the items
were not manifestations of a single basic assemble, but in its place were measured to
compose a put up when united. In other words, the items were not similar forms of a
single primary raise, nor did they imitate each other as was anticipated in a traditional
effect sign scale (Spector& Jex, 1998, for further discussion).Situational constraints, an
repeatedly famous form of job stressor or strains, had usual moderate awareness in
explaining environmental, or related apparatus of the work place (Spector & O‘Connell,
1994; Spector, Chen & O‘Connell, 2000).Task conflict regards incompatibilities about
the comfortable of tasks (Jehn, 1997; Jehn&Bendersky, 2003) On Individual level, task
conflict could increase personal work attempt for instance. However, on individual level,
penalty of task conflict were not only positive as this type of conflict also leads to more
stress and apprehension (Jehn&Bendersky, 2003). Bullying can involve relentless
supervisory abuse of subordinates (most common), coworkers ―ganging up‖ on age group
or, in rare occasions, "bullying up" when subordinates abuse a higher-level organizational
member (Einarsen, Hoel, Zapf, & Cooper, 2003).
Bullying constitutes, and was constituted by, aggressive work environments (Liefooghe
& MacKenzie-Davey, 2001; Salin, 2003) manifest by persistent fear and anxiety of
workgroup members. Bullying was both an outcome of and a recursive reserve for hostile
work environments (Lutgen-Sandvik & McDermott, 2008).Bullying at work was obvious
by a difference in power between actors and targets (Einarsen et al., 2003) that exists
preceding to the commencement of bullying (e.g., abusive supervision) or arises as a
result of enduring harassment(peer-to-peer abuse) (Keashly & Nowell, 2003).Witnessing
coworkers details augmented stress and objective to leave (Lutgen-Sandvik, et al., 2007;
Vartia, 2001).
Task conflict typology was main in conflict literature, and many studies complete the
task conflict frame (Amason, 1996; DeDreu, 2006; Olson et al., 2007; Pelled,
Eisenhardt, & Xin, 1999).Literature on conflict studies the penalty of conflict at
together individual and group levels of analysis. Jehn‘s (1995) framework, conflict
was crack into task conflict refers to difference in viewpoints concerning a task.
Examples of task conflict were disagreement between group members on work system
and policy and resources ascription (De Dreu& Van Vianen, 2001). Cognition was the
interior of task conflict; thus, it was also called cognitive conflict. This type of conflict
was expected or was sometimes expectant in team work, as it focuses on assorted
ideas on how best to attain common group goals (Amason, 1996).
Copyright © 2014. NJMT
58
NUML Journal of Management & Technology
Vol: 9, No: 2. July, 2014 ISSN 1997-4507
To understand how task conflict involve a variety of team outcomes, a plentiful
literature search was conducted on organizational conflict studies available after
Jehn‘s (1995) worked (Dreu&Weingart, 2003) were also examined for probable
sources. As a result of this search, in any case twenty three publications were
originate, which listening carefully on task conflict, studies. Thirteen experiential
studies examined the belongings of task conflict. Eight of the thirteen studies reported
positive possessions of task conflict on team outcomes, whereas seven studies reported
negative possessions only one study reported a non-significant effect of task conflict
on team outcomes. In dissimilarity, task conflicts were disagreements between
individuals about the comfortable of the task being performed, including differences in
viewpoints, ideas, and opinions. The most commonly reported task conflicts anxiety
sharing of resources, measures or course of action and interpretation of facts (Jehn,
1995, 1997).
Task conflict normally concerns one of two sets of issues: what was to be completed
and how it was done (Barki & Hartwick 2004).Task conflicts were disagreements
about the at ease of a task and work goals, such as allocation of resources, procedures,
and understanding of facts (Jehn, 1995, 1997).Task conflicts embrace differences in
viewpoints, ideas, and opinions, and may overlap with vigorous discussions and
personal anticipation Task conflict had been related with numerous valuable effects,
such as improving the use of debate within a team (Jehn, et al., 1999), which results
inequality ideas and improvement (Amason, 1996; West & Anderson, 1996), and leads
to better service deliverance (Tjosvold, Dann, & Wong, 1992).In distinction, task
conflict had been related with quite a lot of useful effects, such as humanizing the
quality of thoughts and innovation (Amason, 1996; West & Anderson,
1996),increasing beneficial debate (Jehn, et al., 1999), facilitating a more effective use
of resources, and foremost to better service proviso (Tjosvold, et al., 1992). Jehn et al.
(1999) found that task conflict mediates the positive effect of informational diversity
on group performance.
Jehn and Mannix (2001) examined in their longitudinal study that high-performing
groups had a lofty task conflict in the middle phase of the group contact. Additionally;
Amason (1996) found that task conflict was of assistance to team members‘ attitudes
such as assurance and sentimental reception of team members. Argue that task conflict
was dynamic was also confirmed in the management teaching field. Bradley (2012)
task conflict leads to better team performance. This was because team members feel
secure with discussing differing viewpoints and they understand that these opinions
are severely connected to the work at hand. Under this situation, the team would
produce more ideas and keep in healthy debate to turn up at the best solution. When
psychological safety was low, team members might interpret any type of dissent as
personal and threatening, even when it was task interconnected first, there was a lack
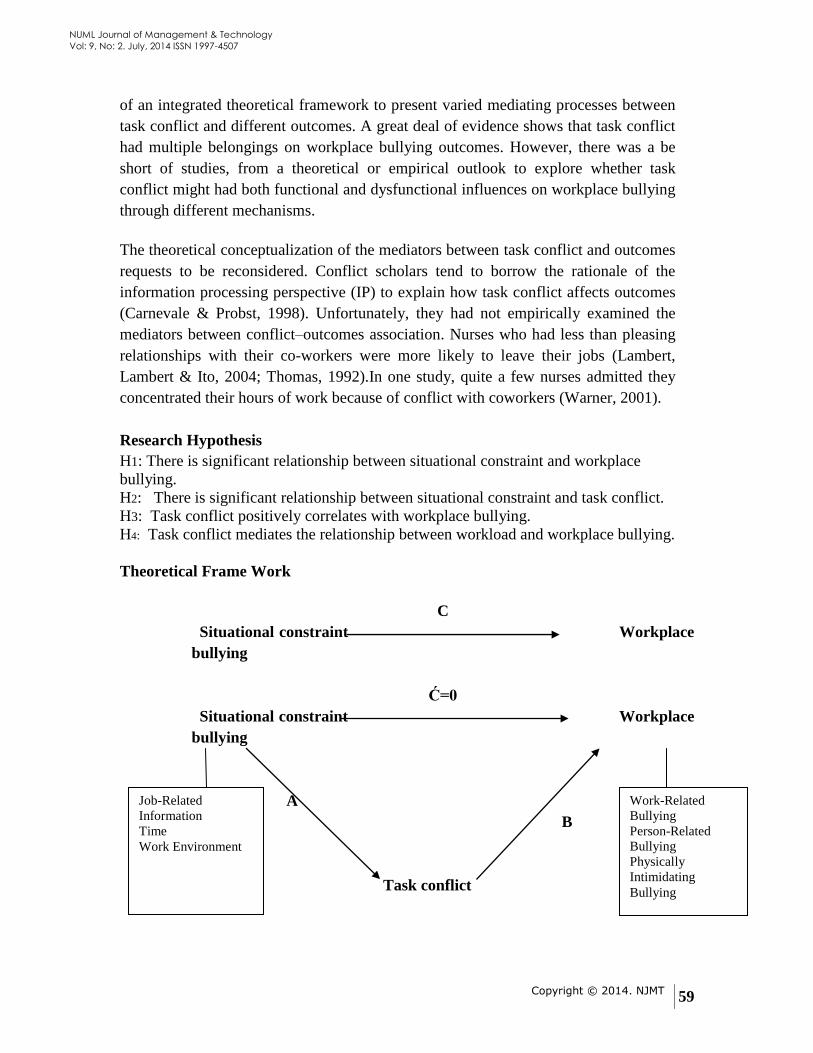
Copyright © 2014. NJMT
59
NUML Journal of Management & Technology
Vol: 9, No: 2. July, 2014 ISSN 1997-4507
of an integrated theoretical framework to present varied mediating processes between
task conflict and different outcomes. A great deal of evidence shows that task conflict
had multiple belongings on workplace bullying outcomes. However, there was a be
short of studies, from a theoretical or empirical outlook to explore whether task
conflict might had both functional and dysfunctional influences on workplace bullying
through different mechanisms.
The theoretical conceptualization of the mediators between task conflict and outcomes
requests to be reconsidered. Conflict scholars tend to borrow the rationale of the
information processing perspective (IP) to explain how task conflict affects outcomes
(Carnevale & Probst, 1998). Unfortunately, they had not empirically examined the
mediators between conflict–outcomes association. Nurses who had less than pleasing
relationships with their co-workers were more likely to leave their jobs (Lambert,
Lambert & Ito, 2004; Thomas, 1992).In one study, quite a few nurses admitted they
concentrated their hours of work because of conflict with coworkers (Warner, 2001).
Research Hypothesis
H1: There is significant relationship between situational constraint and workplace
bullying.
H2: There is significant relationship between situational constraint and task conflict.
H3: Task conflict positively correlates with workplace bullying.
H4: Task conflict mediates the relationship between workload and workplace bullying.
Theoretical Frame Work
C
Situational constraint Workplace
bullying
Ć=0
Situational constraint Workplace
bullying
A
B
Task conflict
Work-Related
Bullying
Person-Related
Bullying
Physically
Intimidating
Bullying
Job-Related
Information
Time
Work Environment

Copyright © 2014. NJMT
60
NUML Journal of Management & Technology
Vol: 9, No: 2. July, 2014 ISSN 1997-4507
Methodology
Data Collection
Procedures Data were collected from Power Tech, Huawei, Zte, Nokia Seimens, PTCL, lCC,
Netkom, Supernet, Wateen, Wi- Tribe, Qubee companies through questionnaire. The
employees filled in a hard copy of questionnaire the questionnaire mixed up of three
demographic questions and additional included 5 Likert scales with around 31questions.
These questions could be answered by specifying the liking on a, 5-, -point Likert-scale.
The rationale last the long survey was that it sample size neglect
Sample
The method description from this point further on will always rise to these 625
respondents.49.3% of the respondents filled in the questionnaire, while 51.7% proficient
the telecom. Also gender was almost equally dispersed with 54.6% male and 45.4%
female respondents. While 100% of the employees work in companies, work in telecom
service provider companies. The occupational sharing was as follows: 5.2% blue collar
workers, 23% white collar workers, 8.6% private servants, 16% of the employees are
positioned in middle management, 3.4% high level managers, and 43.6% of the
respondents had other occupations. Other occupations are mainly made up from food
employees, sales persons, and general employees. In this cross-sectional study, 625
employees of 12 different companies were addressed to fill in a hard copy survey in
Rawalpindi, Islamabad cities. However, may possibly only use 625 observations in this
study since 34 questionnaires were appropriate, as these respondents work in teams or
work units. Situation constraint was preserved as a condition for studying task conflict as
a mediator in this research
Measurement
Work-Place Bullying
Exposure to workplace bullying was measured by means of the S-NAQ as offered by
Notelaers & Einarsen (2008). Nine items measured the exposure to negative acts at work.
Respondents could answer on a 5-point Likert-scale categorized as ―never‖, ―now and
then‖, ―once a month‖ and ―once a week or more‖. Cronbach‘s alpha for the S-NAQ was
.86.
Task Conflict
Task conflict, in this research, focuses only on task conflict mediates the work place
bullying since the negative acts that characterize bullying (jehn & Bendersky, 2003). To
avoid these possible overlaps, Jehn‘s (1995) task conflict scale is used. This scale
consists of four items. The response potential categorized on a 5-point Likert-scale were
―never‖, ―sometimes―, ―now and then―, ―often― and ―very often―. Cronbach‘s alpha for
the task conflict scale was .83.
Situation constrain
Situationnel Contraints Questionnaire (SCQ) (O‘Connor, Peters, Pooyan et al, 1984;
Freeman, 1996; Kane, 1997). Internal reliability for the measure is reported to range from
.79 to .96, (Freeman, 1996; Kane, 1997). The SCQ consists of 24 items that measure each
of the eight situational constraint factors. Participants are instructed to use a 5-point
Likert-type scale to specify how well each statement corresponds to or describes their job

Copyright © 2014. NJMT
61
NUML Journal of Management & Technology
Vol: 9, No: 2. July, 2014 ISSN 1997-4507
setting or situations. The Likert-type scale assesses the precision of each statement
ranging from 1 (not at all accurate) to 5(completely accurate). Scores are summed on
each of the eight original Situational Constraints Questionnaire subscale factors.
Control variables
Age, gender and tenure are added as control variables. Particularly age and gender are
widely used control variables in workplace bullying literature (Noterlaers et al., 2010;
Raynor & Hoel, 1997; Vartia, 1996). For someone to be measured a fatality of workplace
bullying he or she has to be exposed to negative acts at least once a week in the last six
months (Leymann, 1996). Since the results of this study are therefore related to the time
the employee works in the company, tenure is also controlled for.
Instrument
Survey research has been accompanied for half years by researchers via formats that
incorporated questionnaires. Most often the data attains from a particular target group or
a random sample of a precise population. Krathwohl (1997) renowned that survey
research applications on the team spirit of participant answers, how and how much their
answers change and are similar, and the reply of members established on their
demographic variables. In addition to demographic facts invited, the accused will be
tested to broad the Situational Constraints Questionnaire [SCQ] (O‘Connor et al, 1984).
The SCQ lies of 9 items that measure each of the three situational constraints. In this
particular research, the Short Negative Acts Questionnaire after this stated to as S-NAQ)
(Notelaers & Einarsen, 2008), the Task conflict scale (Jehn, 1995), and the workplace
bullying scale were secondhand (Notelaers, De Witte, van Veldhoven, & Vermunt, 2007.
Participants are instructed to use a 5-point Likert-type scale to point out how well each
statement corresponds to or defines their job location or situations. The Likert-type scale
evaluates the correctness of each statement reaching from 1 (not at all accurate) to 5
(Completely accurate).
Data Analysis
Analysis strategies included calculation of frequency counts on the demographic data.
These results described the respondents in the study .Response rates were also computed
and a post hoc analysis was performed to ascertain any response/non-response bias in the
data. Data were analyzed by computing Multicollinearity-Analysis of Variance
(MANOVA) statistics, Factor Analysis, Post-hoc analysis, Mediation test, Sobel test.
The dependent variables were the three situational constraint factors from the SCQ. A
separate analysis was performed for each of these dependent variables. The analysis
allowed the researcher to examine mean scores and variance on the dependent variables.
Because the independent variable consisted of three categories, post-hoc tests were
proposed when a main effect was found. The results of these analyses determined what
categories of the independent variable contribute to statistically significant differences in
the dependent variable of constraints impacting their work.
Results and Findings
Descriptive statistics
A set of descriptive statistics coefficients that summarize a given set, which can either be
a representation of the entire population or a sample. The measures used to describe the
data set are measures of central tendency and measures of variability or dispersion. The
frequency distribution of the return series is not normal. The skewness coefficient 0 and
kurtosis >3, but the results show that.700 skewness andkurtosis-1.378, so its show that

Copyright © 2014. NJMT
62
NUML Journal of Management & Technology
Vol: 9, No: 2. July, 2014 ISSN 1997-4507
distribution is not normal. For a data set, the mean is the sum of values divided by the
number of values. The mean is2.3360 often quoted along with the standard deviation
1.79718 the mean describes the central location of the data, and the standard deviation
describes the spread. An alternative measure of dispersion is the mean deviation,
equivalent to the average absolute deviation from the mean.
Table1Descriptive Statistics
Table2Reliability Statistics
Cronbach’s Alpha Cronbach’s Alpha Based on
Standardized items
.939 .937
Cronbach‘s alpha average inter correlation among the items, so results show that
workplace bullying, situation constraint, task conflict Cronbach‘s alpha .939.It‘s very
good reliability statistics, the results show that variable highly correlated.
Table3
Regression
YWRB =α + βJRI+ γWE + λTIME + μt
Regression equation show that dependent variable work related bullying and independent
variable job related information, work environment, time, and error term. The ANOVA
result show that significance of the model, the last column sig shows (.000) the goodness
of fit to the model, if ―sig‖ is greater than.05, we conclude that our model could not fit
the data and F. Statistics greater than 5.96, the F. Statistics result 90.691.The total Sum of
Square 2015.440 is the total deviation in the dependent variable. The aim of the
regression is to explain these deviations by the best β that can minimize the sum of
squares of these deviations.
Mean 2.3360 3.3872 3.4032 3.4400
S.Deviation 1.79718 1.18504 1.18375 1.29375
Minimum 1.00 1.00 1.00 1.00
Maximum 5.00 5.00 5.00 5.00
Skewness .700 -.031 -.030 -.132
Kurtosis -1.37 -1.123 1.146 -1.369

Copyright © 2014. NJMT
63
NUML Journal of Management & Technology
Vol: 9, No: 2. July, 2014 ISSN 1997-4507
Table 3a ANOVA b
Model Sum of
Squares
df Mean
Square
F Sig.
Regression 1149.396 9 127.711 90.691 .000 a
Residual 866.044 615 1.406 - -
Total 2015.440 624 - - -
Table 3b
Model Summary b
Model R R Square Adjusted R
Square
Std.Error of the
Estimates
1 .755a .570 .564 1.18668
R-Square measures the proportion of the variation in the dependent variable that
explained by variation in the independent variables R-Square result show that 57% of the
variation explained. The adjusted R-Square the proportion of the variance in the
dependent variable that explained by variations in the independent variable, the result
show that Adjusted R-Square 56.4% of the variance explained. Standard error of the
estimate 1.18668measure the dispersion of the dependent variables estimates, if the
standard error is more than 10% of the mean, its high.
Table 3c MANOVA
Unstandardized
Coefficients
β t.value sig VIFStatistics
Constant -1.521 -4.854 .000 -
JRI1 .223 4.957 .000 1.112
JRI .189 4.458 .000 1.130
JRI .621 15.703 .000 1.373

Copyright © 2014. NJMT
64
NUML Journal of Management & Technology
Vol: 9, No: 2. July, 2014 ISSN 1997-4507
Time1 .003 3.05 .04 1.216
Time2 -.113 -2.181 .03 1.241
Time3 .119 2.599 .01 1.160
WE1 -.119 -2.774 .005 1.078
WE2 .073 2.634 .003 1.095
WE3 .378 9.049 .000 1.175
The coefficients provide information on the confidence with which we can support the
estimate for each such estimate ―T‖ and ―Sig‖. Our results significant with a 95% level of
confidence. Simply put, the unstandardized β coefficient represents the effect of an
independent variable on the dependent variable, net of the effects of the other
independent variables, the 95% confidence for each beta estimate. At value is any
statistical hypothesis test in which the test statistic f. if the null hypothesis is supported. It
is most commonly applied when the test statistic would follow a normal distribution if the
value of a scaling term in the test statistic were known. When the scaling term is
unknown and is replaced by an estimate based on the data, the t-value statistic value
>1.96.The coefficient results show that job related information positive significant
relationship, time significant, insignificant relationship, work environment significant,
insignificant relationship with workplace bullying. JRI 4.957, TIME 3.05,-2.181, WE-
2.774, 2.634. Collinarity between variables is always present to resolve this problem
Variance Inflation Factor analysis, VIF>10 high Collinarity in the data. The VIF results
show that 1.112 very low so we can resolve the problem of Collinarity.
Table 3d
Co-linearity Diagnostic
Eigen
Value
JR1 JR2 JR3 TIME1 TIME2 TIME3 WE1 WE2 WE3
9.075
.00 .00 .00 .00 .00 .00 .00 .00 .00
.229
.00 .00 .33 .04 .04 .00 .02 .00 .10
.151
.00 .04 .10 .00 .01 .11 .03 .01 .69
.120 .01 .36 .05 .00 .00 .15 .19 .03 .20
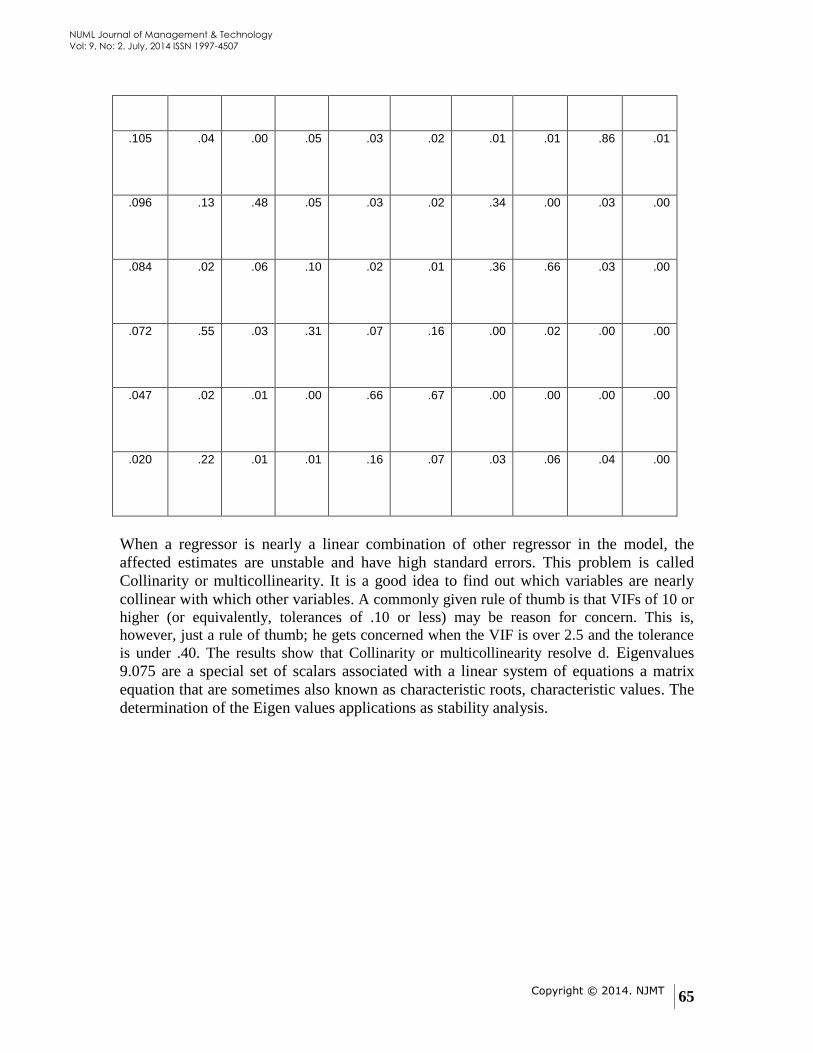
Copyright © 2014. NJMT
65
NUML Journal of Management & Technology
Vol: 9, No: 2. July, 2014 ISSN 1997-4507
.105
.04 .00 .05 .03 .02 .01 .01 .86 .01
.096
.13 .48 .05 .03 .02 .34 .00 .03 .00
.084
.02 .06 .10 .02 .01 .36 .66 .03 .00
.072
.55 .03 .31 .07 .16 .00 .02 .00 .00
.047
.02 .01 .00 .66 .67 .00 .00 .00 .00
.020
.22 .01 .01 .16 .07 .03 .06 .04 .00
When a regressor is nearly a linear combination of other regressor in the model, the
affected estimates are unstable and have high standard errors. This problem is called
Collinarity or multicollinearity. It is a good idea to find out which variables are nearly
collinear with which other variables. A commonly given rule of thumb is that VIFs of 10 or
higher (or equivalently, tolerances of .10 or less) may be reason for concern. This is,
however, just a rule of thumb; he gets concerned when the VIF is over 2.5 and the tolerance
is under .40. The results show that Collinarity or multicollinearity resolve d. Eigenvalues
9.075 are a special set of scalars associated with a linear system of equations a matrix
equation that are sometimes also known as characteristic roots, characteristic values. The
determination of the Eigen values applications as stability analysis.
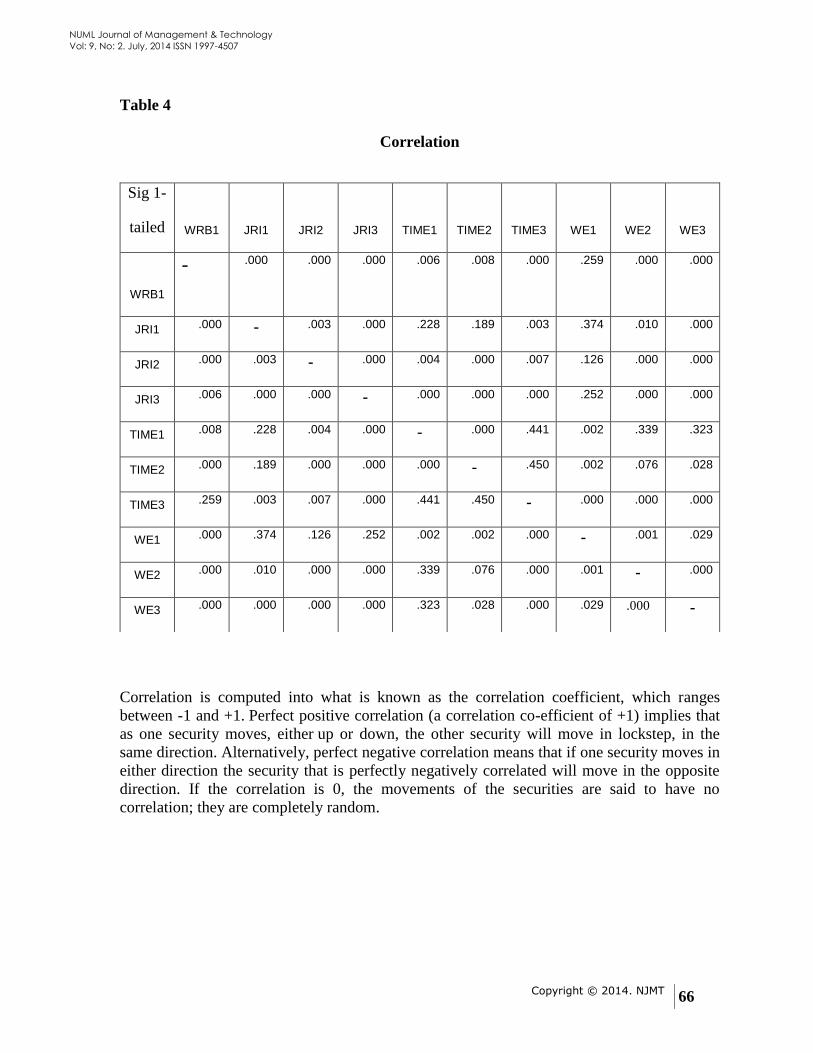
Copyright © 2014. NJMT
66
NUML Journal of Management & Technology
Vol: 9, No: 2. July, 2014 ISSN 1997-4507
Table 4
Correlation
Sig 1-
tailed WRB1 JRI1 JRI2 JRI3 TIME1 TIME2 TIME3 WE1 WE2 WE3
WRB1
- .000
.000 .000 .006 .008 .000 .259 .000 .000
JRI1 .000 - .003 .000 .228 .189 .003 .374 .010 .000
JRI2 .000 .003 - .000 .004 .000 .007 .126 .000 .000
JRI3 .006 .000 .000 - .000 .000 .000 .252 .000 .000
TIME1 .008 .228 .004 .000 - .000 .441 .002 .339 .323
TIME2 .000 .189 .000 .000 .000 - .450 .002 .076 .028
TIME3 .259 .003 .007 .000 .441 .450 - .000 .000 .000
WE1 .000 .374 .126 .252 .002 .002 .000 - .001 .029
WE2 .000 .010 .000 .000 .339 .076 .000 .001 - .000
WE3 .000 .000 .000 .000 .323 .028 .000 .029 .000 -
Correlation is computed into what is known as the correlation coefficient, which ranges
between -1 and +1. Perfect positive correlation (a correlation co-efficient of +1) implies that
as one security moves, either up or down, the other security will move in lockstep, in the
same direction. Alternatively, perfect negative correlation means that if one security moves in
either direction the security that is perfectly negatively correlated will move in the opposite
direction. If the correlation is 0, the movements of the securities are said to have no
correlation; they are completely random.
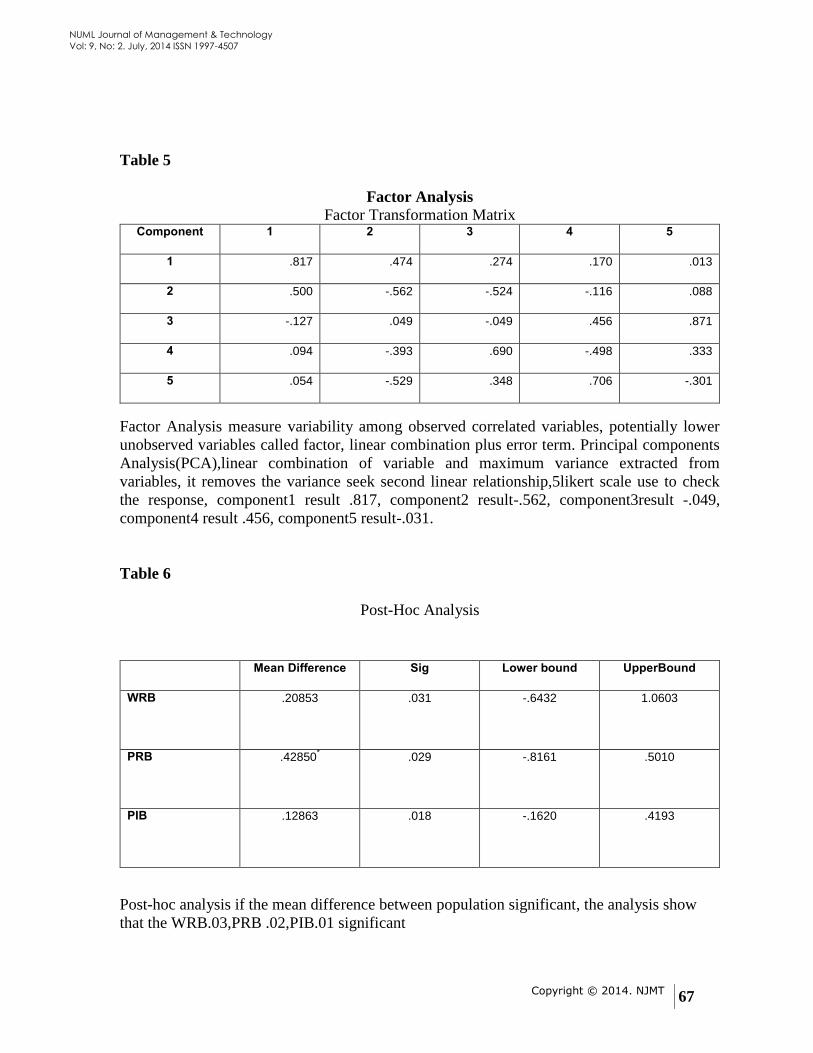
Copyright © 2014. NJMT
67
NUML Journal of Management & Technology
Vol: 9, No: 2. July, 2014 ISSN 1997-4507
Table 5
Factor Analysis
Factor Transformation Matrix Component 1 2 3 4 5
1 .817 .474 .274 .170 .013
2 .500 -.562 -.524 -.116 .088
3 -.127 .049 -.049 .456 .871
4 .094 -.393 .690 -.498 .333
5 .054 -.529 .348 .706 -.301
Factor Analysis measure variability among observed correlated variables, potentially lower
unobserved variables called factor, linear combination plus error term. Principal components
Analysis(PCA),linear combination of variable and maximum variance extracted from
variables, it removes the variance seek second linear relationship,5likert scale use to check
the response, component1 result .817, component2 result-.562, component3result -.049,
component4 result .456, component5 result-.031.
Table 6
Post-Hoc Analysis
Mean Difference Sig Lower bound UpperBound
WRB .20853
.031
-.6432
1.0603
PRB .42850*
.029 -.8161 .5010
PIB .12863
.018 -.1620 .4193
Post-hoc analysis if the mean difference between population significant, the analysis show
that the WRB.03,PRB .02,PIB.01 significant

Copyright © 2014. NJMT
68
NUML Journal of Management & Technology
Vol: 9, No: 2. July, 2014 ISSN 1997-4507
Partial Mediation
Coefficient situational constraint variable to the task conflict and task conflict to the
workplace bullying and results significant this is called intervention mediation. We estimate
Sobel test as below.
Regression
Table 6a
ANOVA b
Model
1
Sum of
Squares
df Mean
Square
F Sig.
Regression 1399.817 13 107.678 106.870 .000 a
Residual 615.623 611 1.008 - -
Total 2015.440 624 - - -
The ANOVA result shows that significance of the model, the last column sig shows (.000)
the goodness of fit to the model, if ―sig‖ is greater than.05, we conclude that our model could
not fit the data and F. Statistics greater than 5.96, the F. Statistics result 106.870.
Table 6
Model Summary b
Model R R
Square
Adjusted
R
Square
1 .833a .695 .688
R-Square measures the proportion of the variation in the dependent variable that explained by
variation in the independent variables R-Square result show that 69.5% of the variation
explained. The adjusted R-Square the proportion of the variance in the dependent variable
that explained by variations in the independent variable, the result show that Adjusted R-
Square 68.8% of the variance explained.

Copyright © 2014. NJMT
69
NUML Journal of Management & Technology
Vol: 9, No: 2. July, 2014 ISSN 1997-4507
Table 6b
Coefficients a
Model
1
Unstandardized
Coefficients
β
t
Constant .943 2.801*
JRI1 .191 5.000***
JRI2 .107 2.941**
JRI3 .360 9.644***
TIME1 .013 .302
TIME2 -.046 -1.048
TIME3 .114 2.942**
WE1 -.074 -2.014**
WE2 .046 1.205
WE3 .226 6.110***
TC1 -.076 -1.911*
TC2 -.064 -1.710
TC3 .013 .311
TC4 -.554 -15.149***
The coefficients provide information on the confidence with which we can support the
estimate for each such estimate ―T‖ and ―Sig. Our results significant with a 95% level of
confidence. Simply put, the un-standardized β coefficient represents the effect of an
independent variable on the dependent variable, net of the effects of the other independent
variables, the 95% confidence for each beta estimate. A t value is any statistical hypothesis
test in which the test statistic F. The coefficient results show that mixed results with the help
of this results we calculate Sobel test as below.

Copyright © 2014. NJMT
70
NUML Journal of Management & Technology
Vol: 9, No: 2. July, 2014 ISSN 1997-4507
Table 7a
Sobel Test
Input Test
Statistics
Std.Error P.value
a -1.521 Sobel Test -2.42492033 .59148459 .000
b .943 ArorianTest -2.38725703 .60081633 .000
Sa .313 Goodmantest -2.46442441 .58200324 .000
Sb .337
Table 7b
Input Test Statistics P.value
ta -4.854 Sobel Test 2.42605268 .05526405
tb 2.801 Aroriant Test 2.38832829 .01692522
Goodman Test 2.46562308 .01367752
Un-standardized coefficient value standard error of these path coefficient if the p-value=0 so
first stage mediation also called intervention mediation, we completed first step than second
step of mediation here z ≤± 1.96 then we go further next step is called full mediation but our
result show that partial mediation because Sobel test value2.42, Aroriant test value2.38,
Goodman test value2.46.The results values > z value so we cannot move further.
Limitation
Limitation in this study is the use of self-report surveys which creates the probable for
familiar method variance or measurement bias. General method variance is related with the
method of measuring variables that can drive up the relationship between variables and is
apprehension when self-reports are used to measure both the independent and dependent
variable. However, self-reports are required for the study of concepts such as perceptions of
the Common method variance can occur for several reasons, respondents may try to maintain
uniformity in their responses; answer in accordance to pre-existing theories about what the
relationships between the variables under study should be strive to nearby themselves
auspiciously and answer in accordance with the format of the items, rather than the
comfortable. In this study the alteration of the task conflict scales. While the individual items
were not changed but not used the relationship subscale of the measure was condensed with
an item added from another subscale. Situational constraint has eight magnitude but we are
used three dimension.
Conclusion and Recommendations
Task conflict was found to partial mediate the relationship between situational constraint and
workplace bullying. This finding signifying that formerly investigated organizational

Copyright © 2014. NJMT
71
NUML Journal of Management & Technology
Vol: 9, No: 2. July, 2014 ISSN 1997-4507
predictors of workplace bullying does not always straight give to the occurrence of this
phenomenon. In order to more carefully understand why bullying takes place and to avert
impact on company costs and human-well being
Organizations must supporter for safe work environments, stricter laws and compulsory
convention enforcing workplace practices. Organizations must establish and continue
inclusive program for the avoidance of workplace bullying and management of all types of
workplace. Managers need to create and keep up supportive work environments and help to
subordinate to achieving the task, organizational policies are followed, and occurrence
reporting is efficient and blame-free. Manager must include workplace bullying, situational
constraint factor obstacle and conflict management in the prospectus and arrange professional
employees in the preclusion assessment, and management of aggression in patients, visitors,
and colleagues. When conflict arise Investigators should study upbeat obstacle and
interference strategies, worth of training modalities, and worth of specific policies and task
conflict to classify best practices for avoidance of workplace bulling. Manager supports a
continual assurance to promotion a safe and healthy work environment
References
Balducci, C., Cecchin, M., & Fraccaroli, F. (2011). Role stressors and workplace bullying: A prospective
analysis including personal vulnerability factors . work and stress , 24-32.
Curşeu, P. L. (2011). Intra-Group Conflict and Teamwork Quality: The Moderating Role of Leadership
Styles. Adm. Sci , 3-13.
Einarsen, S., Hoel, H., & Notelaers, G. (2009). Measuring exposure to bullying and harassment at
work: Validity, factor structure and psychometric properties of the Negative Acts Questionnaire-
Revised. Work & Stress , 24-44.
Einarsen, S., Mikkelsen, E., & Matthiesen, S. (2008). The psychology of bullying at work: Explaining
the detrimental effects on victims . work and stress , 71-84.
Khan, M. A., Afzal, H., & Rehman, K. u. (2009). Impact of Task Conflict on Employee‘s
Performance of Financial Institutions . European Journal of Scientific Research , 479-487 Balducci, C., Cecchin, M., & Fraccaroli, F. (2011). Role stressors and workplace bullying: A prospective
analysis including personal vulnerability factors . work and stress , 24-32.
Curşeu, P. L. (2011). Intra-Group Conflict and Teamwork Quality: The Moderating Role of Leadership
Styles. Adm. Sci , 3-13.
Einarsen, S., Hoel, H., & Notelaers, G. (2009). Measuring exposure to bullying and harassment at
work: Validity, factor structure and psychometric properties of the Negative Acts Questionnaire-
Revised. Work & Stress , 24-44.
Einarsen, S., Mikkelsen, E., & Matthiesen, S. (2008). The psychology of bullying at work: Explaining

Copyright © 2014. NJMT
72
NUML Journal of Management & Technology
Vol: 9, No: 2. July, 2014 ISSN 1997-4507
the detrimental effects on victims . work and stress , 71-84.
Khan, M. A., Afzal, H., & Rehman, K. u. (2009). Impact of Task Conflict on Employee’s Performance of
Financial Institutions . European Journal of Scientific Research , 479-487 .
Kieseker, R., & Marchant, T. (1999). Workplace Bullying in Australia: A Review of Current
Conceptualisations and Existing Research. Australian Journal of Management & Organisational
Behaviour, , 61-75 .
Notelaers, G. (2010). Workplace bullying . work and stress , 12-28.
Notelaers, G., Einarsen, S., Witte, H. D., & Vermunt, J. K. (2006). Measuring exposure to bullying at
work: The validity and advantages of the latent class cluster approach. Work & Stress, .
Notelaers, G., Einarsen, S., Witte, H. D., & Vermunt, J. K. (2006). Measuring exposure to bullying at
work: The validity and advantages of the latent class cluster approach. Work & Stress , 288-301.
Pamela Lutgen-Sandvik, G. N., & Ruth Namie. (2007). Workplace Bullying: Causes, Consequences,
and Corrections . Lutgen-Sandvik & Syphe , 41-52.
Ricerca, D. d. (2011). Aggressive behavior at work: Investigating and integrating the target’s and
actor’s perspectives. work and stress , 56-69.
Simons, T. L., & Peterson, R. S. (2000). Task Conflict and Relationship Conflict in Top Management
Teams. Journal of Applied Psychology , 102-111 .
Copyright © 2014. NJMT
73
NUML Journal of Management & Technology
Vol: 9, No: 2. July, 2014 ISSN 1997-4507
Does Person- Organization Fit and Affective Organizational
Commitment Relationship is Moderated by Personality Traits:
Analysis of Extraversion and Emotional stability
Nadia Batool MS Scholar, Faculty of Management Sciences
International Islamic University, Islamabad, Pakistan
Dr. Hafiz Muhammad Ishaq
Assistant professor, Department of Business Administration
Federal Urdu University of Arts, Science and Technology, Islamabad, Pakistan
Madiha Akram
MS Scholar, Faculty of Management Sciences
International Islamic University, Islamabad, Pakistan
Correspondence Author: [email protected]
Abstract Purpose __ The core objective of this study was to explore the relationship between
person-organization fit and effective organizational commitment. In addition to examine
moderating effect of Emotional stability and extraversion (Personality Traits), whether
these strengthen or weaken the association of Person Organization fit and effective
organizational commitment.
Design/Methodology __ Data was collected through structured questionnaires using
Likert Scale which were distributed among a convenience sample of 230 employees of
five large public organization of Pakistan. The data was analyzed using SPSS software.
Findings __ The results reveal that P-O fit has significant positive impact on effective
organizational commitment. In addition, findings suggest that emotional stability and
extraversion personality traits of employee do not moderate relationship between person
organization fit and affective commitment significantly.
Research Limitations __ Sample size was small and data was collected only from public
organizations. The future research needs to be conducted in private sector as well to
make general applicability of proposed model in other organizations.
Practical Implications __ This study provides means by which organizations can develop
schemes and evaluate the personality factors of existing employees which greatly
enhance the effective organizational commitment.
Key words __ Employees, Person organization Fit, effective organizational commitment,
extraversion, emotional stability, Personality traits
Introduction:
Person organization fit an integral part in selection process of organization and is defined
as the compatibility and congruency between the values of individuals and organization.
The similarity between characteristics of organization and individuals has a great impact
on employees‘ attitude and job outcomes including organizational commitment, job

Copyright © 2014. NJMT
74
NUML Journal of Management & Technology
Vol: 9, No: 2. July, 2014 ISSN 1997-4507
satisfaction and employee retention. Ketchad and Strawser (2001) proposed that person
organization fit is a key determinant of affective organizational commitment.
The person organization fit is based on social exchange theory defined as ―Organizations
supply financial, physical and psychological resources as well as the task related
interpersonal and growth opportunities that are demanded by employees. Similarly
organizations demand contributions from their employees in term of time, effort,
commitment, knowledge, skills and abilities (Kristof, 1996, p.3).
A number of researchers have studied different types of Fit (Person supervisor Fit, Person
Environment etc.) in relation to job outcomes like job satisfaction, affective commitment
and turnover intensions. But in advancement and maintenance of affective commitment,
Person- Organization Fit has been recognized as a potentially significant key factor
(Mowday, Porter & Steers, 1982). Recent meta-analysis conducted by Kristof,
Zimmerman and Johnson (2005) to test impact of Person Organization Fit on affective
commitment provides strong supportive evidences of this relationship.
A little work done on personality traits, suggesting that they positively impact the
relationship between Person-Organization Fit and Affective Commitment of employees.
But limited research has been found enhancing the moderating impact of Big five
personality traits of employees specifically emphasizing extraversion and emotional
stability on person organization fit and Affective Commitment relationship. In previous
studies researchers have used Big Five personality model to examine personality (Fields,
2002). Therefore the present study expands previous research by introducing big five
personality for measurement of impact of employees‘ personality traits on affective
commitment. The big five personality model proposes five broad factors as personality
measures which are emotional stability, extraversion, sociability, agreeableness, openness
to experience. Valuable work has been done on the positive impact of personality on
employees‘ performance on job (Hurtz & Donovan, 2000) but little research found
linking Big Five personality traits to organizational affective commitment. For this
purpose the current piece of research focuses only on two factors; extraversion and
emotional stability of big five personality model to measure employee personality and its
impact on strengthening affective organizational commitment. Extroverts are identified as
energetic, creative, talkative and social, whereas emotional stability is characterized by

Copyright © 2014. NJMT
75
NUML Journal of Management & Technology
Vol: 9, No: 2. July, 2014 ISSN 1997-4507
self confidence, feelings of calmness and cool. The reason for analyzing employees‘
personality in terms of extraversion and emotional stability is that these two traits are
more critical and their high ratings develop best fit between person and supervisor.
Earlier researchers showed that big five personality traits specifically emotional stability
and extraversion have significant impact on affective commitment and person supervisor
relationship and 25% of variation in supervisor leadership is due to personality (Smith &
Canger, 2004).
Lack of person-organization fit poses great problems for the organization. Firstly, as
human resource is key factor for the success of any organization, they must be provided
with all the resources to work effectively. When organizations fail to provide
organization fit, they are unable to attract and retain competitive and talented workforce.
Secondly, competitors can take advantage of this situation by attracting these dissatisfied
and unwilling employees by offering them better fit according to their personality.
Finally, people perceive that they do not feel congruency of their values and individual
characteristics; they not only go for other job opportunities but also make use of bad
words of mouth about that organization. This significantly deteriorate the image and
reputation of organization.
The present study provides future contribution to understand impact of person
Organization Fit for affective commitment of employees to respective organization with
the moderating effect of their personality traits (extraversion & emotional stability). The
objective of current piece of research is to facilitate middle and top level management of
public sector organization and institutes to increase affective commitment and loyalty of
employees and university lecturers. This study could be beneficial for human resource
managers for formulation and implementation of strategies regarding employees‘
personality traits and person- organization fit that increase level of performance of
temporary and permanent staff. This ultimately leads to achievement of personal and
professional goals like job satisfaction and emotional attachment to organization.
Extraversion and emotional stability, employees‘ personality characteristics create great
person-supervisor fit and person- organization fit which enable the employees to identify
themselves with the goals and objectives of respective organization and accomplishment
of affective commitment.
Copyright © 2014. NJMT
76
NUML Journal of Management & Technology
Vol: 9, No: 2. July, 2014 ISSN 1997-4507
The purpose of this study is to build up and empirically test a model that throw light on
the role of person-organization fit in developing employee affective commitment with in
organization. This piece of research aims to extend the literature on person –organization
fit, employee affective commitment, and personality traits (extraversion and emotional
stability) by: (1) investigating the role of person-organization fit in predicting and
enhancing employee affective commitment at workplace, and (2) simultaneously
evaluating moderating role of personality traits particularly focusing on extraversion and
emotional stability that either these strengthen or weaken the relationship between
person-organization fit and affective commitment of employees.
The present study significantly contributes to theoretical body of knowledge by
investigating the role of employees fit in the organization in predicting level of their
affective commitment under the umbrella of theory of social exchange (Thibault and
Kelley, 1952). According to this theory when employees receive physical and
psychological resources from their organization, they feel themselves fit in the workplace
environment. Thus in exchange to this employee think that they must pay to the
organization in same way through commitment, and other extra role behaviors as person-
organization fit fortify their need of belongingness. Secondly, this research has great
importance for job seekers as job search criterion. Furthermore this knowledge can
potentially increase the efficiency and productivity of business by improving working
conditions and developing fit for employees in their respective organizations.
The proposal of the study is ordered into five chapters. The first chapter comprises the
introduction; the second chapter is reviews the existing literature, discussing the
relationship between variables; the third chapters forwards the theoretical framework and
methodology of this research (including data collection techniques and analytical
procedure) to test the hypotheses of the study and draw conclusion; fourth chapter
focuses on analysis and results; and last chapter consists of discussion based on the
findings along with implications of results, limitations, and future directions.
Literature Review
Person - Organization Fit:
The person organization fit is the compatibility of an employee with the working
conditions, culture and values of respective organization (Kristof, 1996). According to

Copyright © 2014. NJMT
77
NUML Journal of Management & Technology
Vol: 9, No: 2. July, 2014 ISSN 1997-4507
Holland (1973) congruence is obtain when an employee‘s personal characteristics are
similar to working environment. The person organization fit is similarity of values
between employees and organization in which he/she is working.
In previous research person organization fit was examined as congruence between
employee‘s personality type and climate of working organization (Tom, 1971). Person
organization fit has been analyzed as critical predictor of job satisfaction and organization
commitment. According to Huang, cheng and chou (2005) person organization fit is a
key factor which greatly influence the employee outcomes (work attitudes, turnover
intentions, psychological behavior and work performance). Person organization fit could
be a good predictor of extra effort and commitment to organization (Huang et al., 2005).
Person organization fit finds its fundamentals in social exchange theory in which
exchange of resources and growth opportunities in return for commitment, significant
contributions and retention takes place among employees and organizations. The
expectation about mutual exchange can play significant role in employee‘s adjustability
and compatability to organizational culture. (Kristof, 1996). Development of person
organization fit can result in favorable individual attitude (such as job satisfaction, team
work and affective commitment) and desirable employees‘ behaviors (such as increased
on job performance and decreased turnover intentions).
Affective Organizational Commitment:
Organizational commitment is defined as ―The relative strength of individual‘s
identification with and involvement in a particular organization‖ (Mowday, Porter &
Steers, 1982, p. 27). A psychological state that binds individuals to organizations is
termed as organizational commitment (Allen & Mayer & Smith, 1993).
Organizational commitment is a multidimensional job outcome. It has three components
which are Affective (employee‘s emotional attachment to, identification with and
engagement in organizational goals and objectives), Continuance (an awareness about
costs associated with loosing the organization) and Normative (a feeling of obligation to
continue job in the respective organization). The present study focuses only on affective
commitment of employees and its relationship with person organization fit. Affective
commitment is psychological attachment and belongingness to an organization through

Copyright © 2014. NJMT
78
NUML Journal of Management & Technology
Vol: 9, No: 2. July, 2014 ISSN 1997-4507
development of feelings such as ownership, loyalty and high level of satisfaction. The
bases of affective commitment are identity relevance, shared values and personal
involvement.
It has been found in earlier researches that person organization fit makes employees
strongly committed to respective organization. Meyer and Hoscovitch (2001) found that
shared values of person and organization are solid bases for affective commitment. The
relationship between affective commitment and person organization fit has been
confirmed by empirical studies (Cable & Dekue, 2002; Van Vianen, 2000 & Wasti,
2003). Person organization fit enhances affective organizational commitment. Committed
employees are likely to reinforce and strengthen the existing structure and values of an
organization (Herndon et al., 2001). Boosting employees‘ response toward working
environment of organization, results in enhanced affective commitment, which will
ultimately lead to accomplishment of organizational goals.
In all, congruency between values and culture of organization and employees may in turn
reinforce employee‘s affective commitment for their organizations. Therefore based on
social exchange theory it is hypothesized:
H1. Person organization fit strengthens employees’ affective commitment
towards the organization.
The moderating role of Personality traits:
In past studies have been conducted on Big Five personality traits and their impact on job
outcomes. But limited research has been found enhancing the moderating impact of Big
five personality traits of employees specifically emphasizing extraversion and emotional
stability on person organization fit and Affective Commitment relationship. In previous
studies researchers have used Big Five personality model to examine personality (Fields,
2002). Big Five personality model is important to use for certain reasons like 1) It
provides meaningful and critical categories of personality traits, 2) It is common
framework which helps in research. Therefore the present study expands previous
research by introducing big five personality for measurement of impact of employees‘
personality traits on affective commitment. The big five personality model proposes five
broad factors as personality measures which are emotional stability, extraversion,
sociability, agreeableness, openness to experience. Valuable work has been done on the

Copyright © 2014. NJMT
79
NUML Journal of Management & Technology
Vol: 9, No: 2. July, 2014 ISSN 1997-4507
positive impact of personality on employees‘ performance on job (Hurtz & Donovan,
2000) but little research found linking Big Five personality traits to organizational
affective commitment. For this purpose the current piece of research focuses only on two
factors; extraversion and emotional stability of big five personality model to measure
employee personality and its impact on strengthening affective organizational
commitment.
Extrovert persons are creative, talkative and social in their nature. They are identified by
searching for excitement and therefore show great commitment toward social activities
and groups. Such behaviors of extroverts may lead them to display commitment toward
organizational work by organizing different type of meetings and sharing their ideas and
knowledge through presentation of development projects.
Emotionally stable persons are characterized by cool, self confidence, calmness, having
positive emotions and dealing great pressures with their strong personalities. Therefore
employees with such personality trait demonstrate affective commitment toward
organization.
Building on the notation that employee personality is key determinant of job outcomes
and it strengthen the employees‘ affective organizational commitment, on the basis of
personality trait theory and organizational support theory we hypothesized:
H2. Personality will positively moderate the relationship between
person- organization fit an affective commitment if employee is
extrovert.
H3. Personality will positively moderate the relationship between
person- organization fit an affective commitment if employee is
emotionally stable.

Copyright © 2014. NJMT
80
NUML Journal of Management & Technology
Vol: 9, No: 2. July, 2014 ISSN 1997-4507
Consolidated form of Hypotheses:
H1. Person organization fit strengthens employees‘ affective
commitment towards the organization.
H2. Personality will positively moderate the relationship between
person- organization fit an affective commitment if employee is
extrovert.
H3. Personality will positively moderate the relationship between
person- organization fit an affective commitment if employee is
emotionally stable.

Copyright © 2014. NJMT
81
NUML Journal of Management & Technology
Vol: 9, No: 2. July, 2014 ISSN 1997-4507
METHOD
Research Design
A causal study was conducted to check impact of person organization fit on employees‘
organizational affective commitment with moderation of Big Five personality traits of
employees. Variables were studied in field settings; not a single environmental aspect
was controlled. Measurement of all variables in natural settings makes research
interference minimal. Furthermore, unit of analysis was different organization working in
Pakistan and the time horizon of research was cross-sectional i.e. data was collected only
once.
Participants and Data collection
For current study, participants consist of full time employees of 5 large organizations
operating in education (four companies) and service (one company) industries of
Pakistan. Self-administered questionnaires were used to collect data. A total of 230
questionnaires were distributed among targeted participants to collect data on desired
variables. 202 questionnaires were received back, out of which 190 were identified as
usable for data analysis. The response rate was 82 percent. Sample size selected was
considerable and provided sufficient data for analysis of results.
Total sample size consists of 52.9 % per cent males and 47.1 % per cent females having
an average age lying between the ranges of 21 to 45 years. Information on questionnaires
was gathered not only permanent employees but contractual employees as well to
minimize the risk of correlation inflation due to common source bias (Podsakoff,
Mackenzie & Podsakoff, 2003).
Measures
Person-organization fit, Respondents‘ congruence between their individual values,
believes perceptions and culture of organization was assessed with 3- items scale
(adapted version) created by Cable and DeRue (2002). Likert scale was used in
administered questionnaire which consists of five responses for each item. (Ending
points: 1 = Strongly Agree, 5 = Strongly Disagree). 0.852 was reliability value found for
P-O fit scale for current set of data.
Organizational affective commitment, An 8-item scale was adopted to evaluate
individuals‘ emotional belongingness to their respective organizations, which was
Copyright © 2014. NJMT
82
NUML Journal of Management & Technology
Vol: 9, No: 2. July, 2014 ISSN 1997-4507
developed by Mayer and Allen (1997). Each item was subjected to answer on a five point
Likert scale ranging between 1 (strongly disagree) to 5 (strongly agree). The reliability of
this scale was found to be 0.838.
Extraversion, Responses for extraversion were measured with 4- items scale (NEO-FFI;
Costa & McCrae, 1992). Likert scale was used in administered questionnaire which
consists of five responses for each item. (Ending points: 1 = Strongly Agree, 5 = Strongly
Disagree). 0.687 was reliability value found for extraversion scale for current set of data.
Emotional Stability, Responses for emotional stability were measured with 5- items scale
(NEO-FFI; Costa & McCrae, 1992). Likert scale was used in administered questionnaire
which consists of five responses for each item. (Ending points: 1 = Strongly Agree, 5 =
Strongly Disagree). 0.687 was reliability value found for emotional stability scale for
current set of data.
Statistical Analysis
Pearson‘s correlation analysis was used to analyze the relationship among Person-
Organization fit, Organizational affective commitment and employees personality traits
(extraversion & emotional stability. To test the research hypotheses and moderating
effect of person supervisor fit, data on desired variable was entered into Hierarchical
regression equation.
RESULTS
Demographical categorization table shows the gender distribution among career stage
(three levels). 170 was the total number of respondents, out of which 52.9 % were males
and 47.1 % were females. In sample size of 170, 26 males and 31 females belongs to
junior level, 45 males and 40 females are from middle level and 19 males and 09 females
belongs to senior level of career stage.
Table 2 shows descriptive statistics which includes mean, standard deviation and
correlations for all central variables of study. All scales were satisfactory in their internal
consistency. Results for correlations reflects that person organization fit is positively
associated with employees affective organizational commitment (r = 0.410, p = 0.01). In
addition both of personality traits that is extroversion (r = 0.328, p = 0.01) and emotional
stability (r = 0.242, p = 0.01) are in positive association with employees affective
Copyright © 2014. NJMT
83
NUML Journal of Management & Technology
Vol: 9, No: 2. July, 2014 ISSN 1997-4507
organizational commitment. All correlations among central variables of study are highly
significant at 1 %.
Values of standard deviation reflects that the variables of affective commitment
(SD=0.73974), person organization fit (SD=0.88616), extroversion (SD=0.68757) and
emotional stability (SD=0.73926) are almost equally deviated from their mean values.
For all study variables hypotheses are in expected directions.
Table 3 displays the overall fitness of good for proposed model (R2
= 0.239). The results
show that there is a highly significant impact of person organization fit and personality on
employee affective organizational commitment. Value of R2
represents the variation in
affective organizational commitment i.e. 23.9 % caused by person organization fit and
employee personality traits (Extroversion & emotional stability) remaining all other
variables constant. In addition table 3 also throw light on individual impact of person
organization fit and personality traits on affective organizational commitment (DV).
Betas are showing the rate of change caused by each predictor in dependent variable. Out
of total variation, 32.9 % of affective organizational commitment is explained by person
organization fit, 22.9 % by extroversion and emotional
Table 4 provides the assessment of the possible moderation caused by personality traits
of employees which are extroversion (Ex) and emotional stability (Ems) in the
relationship of person organization fit (POF) and employee affective organizational
commitment (AC). Results of table 4 demonstrate that there is no significant moderation
effect of employees‘ personality traits in this relationship. Although extroversion and
emotional stability have individual significant impact on affective organizational
commitment but when interaction terms of extroversion and emotional stability with
person organization fit are introduced, it make the existing relationship insignificant.
Comparing values of R2 obtained in step 1 and step 2 clearly reflect that as there is no
significant change and improvement in fitness of good of proposed model by introducing
interaction terms of moderators with independent variable, therefore there is no
moderation of personality in the relationship between person organization fit and
affective organizational commitment. Value of R2
change (0.003) is another sign of
insignificant moderation. Negative values of betas for both interaction terms shows that
extroversion (β = -0.164) and emotional stability (β = -0.283) are negatively impacting

Copyright © 2014. NJMT
84
NUML Journal of Management & Technology
Vol: 9, No: 2. July, 2014 ISSN 1997-4507
the employees‘ affective organizational commitment which is against the expected
hypotheses of current study.
DISCUSSION
The main objective of current piece of study was to broaden the previous research on
person organization fit and employees‘ affective organizational commitment in eastern
context with moderation impact of employees‘ personality traits. Two traits from Big five
personality traits model were targeted for current study which are extroversion (energetic,
talkative and social) and emotional stability (tolerant, low in neuroticism, positive
emotions).
The current study supported investigation of previous researchers on the impact of person
organization fit on employees‘ organizational affective commitment significantly. Results
showed that when person organization fit is analyzed as match of values, perceptions and
believes, it is associated with organizational effective commitment. The present research
added to previous studies and empirical evidences that higher the person organization fit,
higher will be organizational affective commitment. The argument for this could be that
when employees find match of their believes, perceptions and values with those of the
organizations, they identified themselves with the goals and objectives of organization
and start owning them which ultimately leads to organizational affective commitment.
Current findings are in congruence with those of previous researchers such as Kristof-
Brown (2000). Person organization fit is an important and valid determinant of
organizational affective commitment for both temporary and regular employees. Findings
of current piece of research, add value to prior empirical studies that congruence of
values does matter for organizational affective commitment. Social exchange theory
provides strong and fundamental evidence for significant relationship between person
organization fit and organizational affective commitment.
The most important part of current study was to check moderating effect of employees‘
personality traits (extraversion & emotional stability) on the relationship of person
organization fit and organizational affective commitment. It was hypothesized that
extraversion and emotional stability will positively moderate the relationship and will
more strengthen it. But results of present study did not provide support in expected
Copyright © 2014. NJMT
85
NUML Journal of Management & Technology
Vol: 9, No: 2. July, 2014 ISSN 1997-4507
directions. Regression analysis reflected hat people high in extraversion and emotional
stability possess low organizational affective commitment. A supporting argument for
these results could be that no doubt personality traits may enhanced organizational
affective commitment, suggesting that an employee high in extraversion and emotional
stability displays organizational affective commitment as compare to individuals low on
these traits, when some other important factors LMX, empowerment and person
environment fit are present. In absence of these factors, contributions of these personality
characteristics are of no relevance. Person supervisor fit not only influence the employee
effectiveness but also influence their attitudes. This implies that lower the person
organization fit, lower will be LMX and ultimately lower would be organizational
affective commitment regardless of extraversion and emotional stability.
Extroverts are identified with self-confidence, dominance, social and generating great
enthusiasm, creative, wants to set their own objectives and apply their ideas. But
unfortunately in our country individuals are not provided with authority and
empowerment to achieve organizational goals by their own unique way. Rather they are
given set pattern, which they have to follow. This is the main cultural difference among
east and west, which makes extroverts as well as emotionally stable people low in
organizational affective commitment and look for other jobs providing them career
growth. Because extroverts show great commitment to their professions as compare to
organization and its goals. This factor makes them high in continuance commitment as
people stay in organization for economic benefits associated with job in return for their
efforts.
LIMITATIONS
As far as limitations of present research are concerned, the first problem was that sample
size was too small for obtaining precise results. Secondly self administered questionnaire
was used to collect data on central variables of study. Thus results may have affected by
common method variance. Common method variance is defined by Avolio, Yammarino
and Bass (1991) as ―the overlap in variance between two variables attributable to the type
of measurement instrument used rather than due to a relationship between the underlying
constructs‖ (p. 572).

Copyright © 2014. NJMT
86
NUML Journal of Management & Technology
Vol: 9, No: 2. July, 2014 ISSN 1997-4507
Furthermore only Likert scale was used to record employee responses. This might have
influence the results because respondents are confined to set options whereas they might
have some what different opinion. Finally sample size was selected only from public
sector. To make this study generalizeable and valid for all organizations, it must also be
in private sector as well.
RESEARCH IMPLICATION AND FUTURE DIRECTIONS
Despite of certain limitations, the current piece of study‘s findings presents practical as
well as theoretical level valuable and credible implications for organizations working in
Pakistan regarding enhancement of organizational affective commitment by identifying
its critical determinants like LMX, person environment and empowerment. Therefore
organizations should establish strategies which put emphasis on LMX, personality and
empowerment that can play the key role in organization‘s performance through increased
commitment because these factors are basic sources of organizational affective
commitment. In addition these results also provide organization with understanding that
to what extent employees‘ personality traits influence o organizational affective
commitment. Specifically, the present study points out that indeed extraversion and
emotional stability are associated with organizational affective commitment.
Therefore motivating employees through empowerment and recognition would lead to
show organizational affective commitment and put extra effort through organizational
citizenship behavior, if employees are managed in effective way. Presence of respect,
trust and partnership among supervisor and individual makes employees‘ empowerment
successful, because only in this way supervisor will consider their ideas and enhance their
self determination perception. In return organizational affective commitment by
employees will get strengthen. Future research should be conducted to check combined
effect of LMX, empowerment, person organization fit in presence of Big Five personality
traits on organizational affective commitment to reconfirm the logic of current research.
It is also required to analyze variables which can moderate proposed relationship of this
research. For valid results and increased generalizability, sample size should be selected
more than 500 for future research. Furthermore researchers must investigate the impact of
Big Five personality traits on organizational affective commitment in cross cultures such

Copyright © 2014. NJMT
87
NUML Journal of Management & Technology
Vol: 9, No: 2. July, 2014 ISSN 1997-4507
as comparison of impact of personality on organizational affective commitment in east
and west cultures.
CONCLUSION
This piece of research explored positive relationship among person organization fit and
organizational affective commitment, which will be enhanced by employees‘ personality
traits n presence of empowerment and LMX. The findings of this study have practical
and theoretical implications and future directions which are valuable and credible for
organizations and researchers as well.
References:
Cable, D. M., & DeRue, D. S. (2002). The convergent and discriminant validity of
subjective fit perceptions. Journal of Applied Psychology, 87 (8), 875-84.
Dansereau, F., Graen, G., & Haga, W. J. (1975). A Vertical Dyad Linkage approach to
leadership within formal organizations: A longitudinal investigation of the role
making process. Organizational Behavior and Human Performance, 13, 46-78.
Fields, D. L. (2002). Taking the measure of work: A guide to validated scales for
Organizational research and diagnosis. Thousand Oaks, CA: Sage.
Finegan, J. E. (2000). The impact of person and organizational values on organizational
commitment. Journal of Personnel Psychology, 73(2), 149-169.
Harris, K. J., Kachmar, Κ. c., & Witt, L. A. (2005). An examination of the Cur- vilinear
relationship between leader-member exchange and intent to turn- over. Journal of
Organizational Behavior, 26, 363-378.
Harris, J., & Brannick, J. (1999). Finding and keeping great employees. New York:
AMACOM
Herndon, J., Fraedrich, J. P. and Yeh, Q. ( 2001). An investigation of moral values and
the ethical content of the corporate culture: Taiwanese versus U.S. sales people.
Journal of Business Ethics, 30, 73-85
Huang, X., & Iun, J. (2006). The impact of subordinate-supervisor similarity in growth-
need strength on work outcomes: The mediating role of perceived similarity.
Journal of Organizational Behavior, 27(8), 1121–1148
Hurtz, G. M., & Donovan, J. J. (2000). Personality and job performance: The Big Five
revisited. Journal of Applied Psychology, 85(6), 869.

Copyright © 2014. NJMT
88
NUML Journal of Management & Technology
Vol: 9, No: 2. July, 2014 ISSN 1997-4507
Kaye, B., & Jordan-Evans, S. (1999). Love 'em or lose 'em: Getting good people to stay.
San Francisco: Berrett-Koehler Publishers, Inc.
Ketchand, A. A., & Strawser, J. R. (2001). Multiple dimensions of organizational
commitment: Implications for future accounting research. Behavioral Research in
Accounting, 13, 221-253.
Kristof, A. L., Zimmerman, D. R., & Johnson, C. E. (2005). Journal of Personnel
Psychology, 58(2), 281-342.
Kristof, A. L. (1996). Person-Organization Fit: An integrative review of its
conceptualizations, measurement, and implications. Journal of Personnel
Psychology, 49(1), 1-49
Mowday, R. T., Porter, L. W., & Steers, R.M. (1982). Employee-organization linkages:
the psychology of commitment, absenteeism and turnover. New York: Academic
Press. Inc., London.
Meyer, J. P., Allen, N. J., and Smith, C. A. (1993). Commitment to organizations and
occupations: extension and test of a three-component conceptualization. Journal of
Applied Psychology, 78(4), 538-51.
Meyer, J. P., & Allen, N. J. (1991). A three-component conceptualization of
organizational commitment. Human Resource Management Review, 1(1), 61-89.
Meyer, J. P., & Allen, N. J. (1984). Testing the ―Side-Bet Theory‖ of organizational
commitment: Some methodological considerations. Journal of Applied Psychology,
69, 372-378.
Meyer, J. P., & Herscovitch, L. (2001). Commitment in the workplace towards a general
model. Human Resource Management Review, 11 (3), 299-326.
Meyer, J. P., & Allen, N.J. (1997). Commitment in the Workplace: Theory, Research,
and Application, Sage, London.
Smith, M. A., & Canger J. M. (2004). Effects of supervisor ―Big Five‖ personality on
subordinate attitudes. Journal of Business & Psychology, 18(4), 465-481.
Thomas, D. A. (1990). The impact of race on managers' experiences of developmental
relationships (Mentoring and Sponsorship): An Intra-organizational study. Journal
of Organizational Behavior, 11, 479-492.

Copyright © 2014. NJMT
89
NUML Journal of Management & Technology
Vol: 9, No: 2. July, 2014 ISSN 1997-4507
VanVianen, A. E. M. (2000). Person-organization fit: the match between newcomers‘ and
recruiters‘ preferences for organizational cultures. Journal of Personnel
Psychology, 53 (1), 1-32.
Walton, R. (1985). From control to commitment in the workplace. HarvardBusiness
Review, 63(2), 77-84.
Wexley, K. N., Alexander, R. A., Greenawalt, J. P., & Couch, M. A. (1980). Attitudinal
congruence and similarity as related to interpersonal evaluations in manager-
subordinate dyads. Academy of Management Journal, 23, 320–330.
Wasti, S. A. (2003). Organizational commitment, turnover intentions and the influence of
cultural values. Journal of Occupational & Organizational Psychology, 76 (3), 303-
321.

Copyright © 2014. NJMT
90
NUML Journal of Management & Technology
Vol: 9, No: 2. July, 2014 ISSN 1997-4507
The Ranking and Comparison of Close-Ended Mutual Funds
Performance with Open-Ended Mutual Funds: Evidence from Pakistan
Mutual Funds Industry Ehtisham Ali* (Corresponding Author)
Email: [email protected]
Faid Gul*
Email: [email protected]
Rashid Mehmood Khan*
Email: [email protected]
Dr. Naveed Akhtar *
Email: [email protected]
*National University of Modern Languages, Islamabad
Abstract
The primary objective of this study is to rank and compare the performance of
close and open-ended mutual funds in Pakistan. For this purpose the study ranked
the close-ended mutual funds over the time period 2008 to 2012. By using Sharpe
and Treynor measures, the 12 mutual funds have been ranked for five years. It has
revealed that the Pakistani market is efficient as no fund performs better than the
market in five years. A comparative study has also been conducted to compare the
performances of open-ended and close-ended mutual funds. By using paired
samples t-test the study finds no difference between the performance of open-ended
and close-ended mutual funds performance. However, fund size and fund age are
significantly different for open-ended and close-ended funds.
Key Words: Mutual fund industry, performance comparison, open-ended mutual
funds, close-ended mutual funds
Introduction
The trend of investment in mutual funds is going up day by day. In developed countries‘
financial markets the increase in the number of mutual fund shows the preference of
investors in this type of investment (Huhmann & Bhattacharyya, 2005). As define by
Bogle (2004) Mutual Funds are managed by professionals who manage individual funds

Copyright © 2014. NJMT
91
NUML Journal of Management & Technology
Vol: 9, No: 2. July, 2014 ISSN 1997-4507
along with fund complexes. The purpose of establishing mutual fund is to facilitate small
investors who have less investment and want diversified investment and who cannot
invest in securities directly. For this reason the asset management company is effective to
provide professional management as it has expertise in financial market (Afza & Rauf,
2009). According to Shah, Hijazi & Hamdani (2005) mutual funds are very useful for
saving purpose as the savings are important for every individual to fulfill basic needs
which are health, education and better living standard. In Pakistan, people have religious
mind and they don‘t prefer to invest in interest base banking schemes. For such people
there is an opportunity to save their capital by investing it in mutual funds and ultimately
the money, they have stored in their pockets due to interest base banking schemes, will be
mobilized for productive purpose.
Presently there are 130 open-ended and 14 close-ended mutual funds available in private
sector (MUFAP, March 2013) and Securities and Exchange Commission of Pakistan
(SECP) is the regulatory body of all types of mutual funds in Pakistan.
Open-Ended Mutual Funds
Open-Ended Mutual Funds are those funds which can be subscribed and redeemed on
frequent basis. Open-ended mutual funds give the opportunity to the investors to
withdraw their amount from fund at any specified time. The open-ended mutual funds
have liquidity requirements as the large number of investors may redeem their units at a
given day. Hence, the Asset Management Companies may need capitalization
requirements. According to Rao (1996) open-ended mutual funds are the investment
companies which remain ready every time to purchase their own shares at net asset value
or its near price. As the price of share in open-ended fund varies with the proportion of
net asset value therefore it directly affects the performance of fund. At the end of 2005,
there were limited numbers of open-ended funds in Pakistan but now 130 open-ended
mutual funds are listed in MUFAP (MUFAP, March 2013).
Close-Ended Mutual Funds
The close-ended funds are offered initially to public and then traded in the stock markets.
Close-ended mutual funds are listed in MUFAP and traded in stock exchanges. This type

Copyright © 2014. NJMT
92
NUML Journal of Management & Technology
Vol: 9, No: 2. July, 2014 ISSN 1997-4507
of mutual fund has fixed capitalization of shares and investors have no option to
withdraw their investment from fund. They can only trade in their shares in stock markets
and can exchange their shares with other investors at any time during market hours. In
close-ended mutual funds the redemption facility is not available therefore, the managers
do not retain high cash for liquidity purpose. The price of share in close-ended mutual
funds is settled by the valuation of the market and its price is affected by the demand and
supply forces for that particular fund. The price can be different from the Net Asset Value
(NAV). Usually the market price for these close-ended mutual funds is 10% to 20%
higher or lower than the NAV.
Literature Review
Mutual fund is appearing as the great topic in these days researches. Mutual Funds
industry is attaining great attention of the researchers as the trend of investment in mutual
funds is growing day by day. So in order to facilitate the small investors and funds
managers, many studies have been conducted on mutual funds in foreign countries and
some studies have also been conducted in Pakistan.
Many researchers have conducted their studies on Mutual Funds with regard to Fund
type. According to Anderson, Coleman, Frohich & Stegall (2001) close ended mutual
funds are the funds which are different from ordinary funds as their shares traded on
discounted prices in secondary market. They find that the returns of these type of funds
relate to the country‘s market index, exchange rate and the discount in selling price of
funds.
Yi & Kim (2005) examine the risk factors and performance of close ended mutual funds
by taking the data from 1993 to 1999 by taking the sample of 82 close-ended mutual
funds they investigate the risk factors and returns. They take price and return from The
Center for Research in Security Prices (CRSP) and portfolios return from Morning Star
Mutual Funds. They document that the close-ended mutual funds have unique
characteristics. They also document the risk factors are not identical in common stock
and close-ended mutual funds. However, book-to-market ratio and size are equally
important for both common stock and mutual funds.

Copyright © 2014. NJMT
93
NUML Journal of Management & Technology
Vol: 9, No: 2. July, 2014 ISSN 1997-4507
Brown (1995) finds that returns of mutual funds are consecutively correlated over a
period of time. He also pointed out that past performance of mutual funds is good
predictor of performance in future of mutual funds.
Pontiff (1997) investigates the returns of close and open ended mutual funds and
documents that the variance of return on close-ended mutual fund price is greater than the
variance on return in net asset value. He also documents that the open ended mutual
funds have no market price therefore share price of this type of funds are same as market
value of investment.
Peterson, Pietranico, Riepe & Xu (2001) say that the funds can be affected by different
factors. In their study they examine the factors which affect the funds. These factors
include pre-tax performance which further includes risk, turnover and fund expense. The
other factor is post tax performance which includes expenses, risk, past pre-tax
performance, and past tax efficiency.
Glosten & Harris (1988) document that Mutual Funds, by their large trading volume and
market positions, accomplish the trades more favorably. These large funds can also
increase their research resources which lead them to create more investment
opportunities. Filbeck & Tompkins (2004) conduct their study on fund performance by
using data over the period 1999 to 2001 and document that the mature funds perform
better than short term funds. However, Blake, Lehmann & Timmermann (1998) state that
the funds perform better in their first year of existence. Most of these studies are
conducted in foreign countries. There is a scope for conducting this kind of study in
Pakistani mutual fund industry.
Methodology
The population of the study consists of all close and open-ended mutual funds listed in
MUFAP. The data of the time period from January 2008 to December 2012 have been
used for analysis. A total 13 close-ended mutual funds are listed in MUFAP. From the
total of 13 mutual funds, 12 funds have been selected which are having their data publicly
available in the data period from 2008 to 2012. To rank the performance of mutual funds
the traditional measures like Treynor and Sharpe models are used. To compare the

Copyright © 2014. NJMT
94
NUML Journal of Management & Technology
Vol: 9, No: 2. July, 2014 ISSN 1997-4507
performance of open and close-ended funds paired samples t-test is used. For this
purpose, Statistical Package for Social Sciences (SPSS) and MS Excel have been used.
Treynor Model
This model was introduced by Treynor in 1966 to measure the performance of portfolio
by taking into account the factor of systematic risk. The current study has used this model
to analyze the performances of all close-ended mutual funds. Treynor ratio has calculated
for five years of data for every fund and compared the performance with market. The
model is:
Sharpe Model
Sharpe introduced this model in 1966 to measure the performance of portfolios by taking
into account the companies‘ specific risk / standard deviation. This study has employed
this measure for analyzing mutual funds performance evaluation.
Sharpe ratio has been calculated for five years of data of each fund and compared the
performance of funds with market. In this study Sharpe ratio is reported in percentage
values. A comparative analysis has also carried out to compare open-ended and close-
X
100

Copyright © 2014. NJMT
95
NUML Journal of Management & Technology
Vol: 9, No: 2. July, 2014 ISSN 1997-4507
ended mutual funds. This analysis is based on the comparison of fund size, fund age,
turnover, expense ratio, ROA and ROE.
Results and Findings
The results of Treynor and Sharpe measures are as follows:
Table 1
Treynor and Sharpe Ratio for 2008
Sr.
No. Fund Name
Treynor
Ratio Ranking
Sharpe
Ratio Ranking
1 Atlas Fund of Funds -0.742 7 -5.9767 3
2 Asian Stock Fund -0.8371 10 -7.07432 10
3 Safeway Mutual Funds -0.8703 11 -7.27362 11
4 JS Growth Fund -0.6793 1 -1.67174 1
5 JS Value Fund Limited -0.8121 8 -6.61779 9
6 Meezan Balanced Fund -1.3015 12 -9.2887 12
7 PICIC Energy Fund -0.7405 6 -6.16313 7
8 PICIC Growth Fund -0.7146 4 -5.99121 4
9 PICIC Investment Fund -0.7192 5 -6.1156 6
10 NAMCO Balanced Fund -0.7011 3 -6.01411 5
11 First Capital Mutual Fund -0.6812 2 -5.81199 2
12
Golden Arrow Selected Stock
Fund -0.8287 9 -6.55448 8
13 Market -0.69333 -1.22245
Table 1 shows Sharpe and Treynor ratio of each fund for the year 2008. The table shows
that all the funds have negative Sharpe and Treynor ratios even the market has both its
Treynor and Sharpe ratios negative. This can be associated to the start of financial crisis
arround the world in the late of 2007. In 2008 Pakistani stock market remained freezed
for a longer period of time therefore no trading took place and market went down. The
table reveals that no fund outperformed the market even when the market itself has
negative Treynor and Sharpe ratios. The fund at serial 4 i.e. JS Growth Fund perform

Copyright © 2014. NJMT
96
NUML Journal of Management & Technology
Vol: 9, No: 2. July, 2014 ISSN 1997-4507
better as compare to the other funds and the same ranking through Sharpe and Treynor
ratio means that the fund is properly diversified. First Capital Mutual Fund is on second
ranking but less performance than the market and it also has the same ranking in Sharpe
and Treynor measures which indicates the proper diversificaiton of the fund. Likewise
NAMCO Balanced Fund is at third in Treynor but at fifth in the Sharpe ratio. It means the
fund is managing its systematic risk but unable to manage its unsystematic portfolio risk
therefore the ranking is different in Sharpe and Treynor. Likewise, the table ranks all the
other funds. The Meezan Balanced Fund is at last in ranking i.e. 12th
number and the
ranking in Sharpe and Trynor is same.
Table 2
Treynor and Sharpe Ratio for 2009
Table 2 shows the ranking of all the funds through Sharpe and Treynor ratios for the year
2009. The table reveals that all the funds have their Sharpe and Treynor ratios positive
which means that their performance remained better in 2009. It is shown in the table that
the market has negative values of Sharpe and Treynor but the funds have positive value
Sr. No. Fund Name
Treynor
Ratio Ranking
Sharpe
Ratio Ranking
1 Atlas Fund of Funds 0.57291 7 6.266449 7
2 Asian Stock Fund 0.62928 3 8.694846 2
3 Safeway Mutual Funds 0.60832 5 8.267113 5
4 JS Growth Fund 0.57364 6 2.203073 11
5 JS Value Fund Limited 0.03755 12 0.431592 12
6 Meezan Balanced Fund 0.56201 8 5.534710 9
7 PICIC Energy Fund 1.06711 1 9.774832 1
8 PICIC Growth Fund 0.47502 10 5.978949 8
9 PICIC Investment Fund 0.51672 9 6.712850 6
10 NAMCO Balanced Fund 0.41915 11 5.156769 10
11 First Capital Mutual Fund 0.64379 2 8.540304 4
12 Golden Arrow Selected Stock Fund 0.62902 4 8.632312 3
13 Market -0.49730 -1.055294

Copyright © 2014. NJMT
97
NUML Journal of Management & Technology
Vol: 9, No: 2. July, 2014 ISSN 1997-4507
which means in 2009 all mutual funds outperformed the market. The table also ranks the
funds and fund at serial 7 i.e. PICIC Energy Fund is on the first rank because both values
are greater than the other funds‘ values. The same ranking in Sharpe and Treynor shows
that the fund is properly diversified. First Capital Mutual Fund is second in Treynor
ranking but at fourth in Sharpe ranking. It means the fund is not properly diversified
therefore the systematic and unsystematic portfolio risk differs.
Table 3
Treynor and Sharpe Ratio for 2010
Sr.
No. Fund Name
Treynor
Ratio
Rankin
g
Sharpe
Ratio
Rankin
g
1 Atlas Fund of Funds 0.15957 1 2.225254 1
2 Asian Stock Fund -0.14063 8 -2.222780 8
3 Safeway Mutual Funds -0.17819 11 -2.566025 10
4 JS Growth Fund -0.13774 7 -0.656863 5
5 JS Value Fund Limited -0.12490 6 -2.059905 7
6 Meezan Balanced Fund -0.02787 3 -0.418077 3
7 PICIC Energy Fund 0.03905 2 0.664589 2
8 PICIC Growth Fund -0.03371 4 -0.610148 4
9 PICIC Investment Fund -0.05999 5 -1.105575 6
10 NAMCO Balanced Fund -0.19359 12 -3.239257 12
11 First Capital Mutual Fund -0.14680 9 -2.643901 11
12 Golden Arrow Selected Stock
Fund -0.17032 10 -2.274010 9
13 Market 0.12402 2.307251
Table 3 shows the Sharpe and Treynor ranking for each fund for the year 2010. The table
reveals that all the funds, except Atlas Fund of Funds and PICIC Energy Fund, have their
ratios negative which indicates their bad performance in 2010. All the funds have
underperformed the market as the market has positive Sharpe and Treynor ratio. All
funds have lower ratios than the market, except Atlas Fund of Funds‘ Treynor ratio.
Other than market, the Atlas Fund of Funds is first in ranking and performed better as
compare to other funds. The ranking of Atlas Fund of Funds in both Sharpe and Treynor
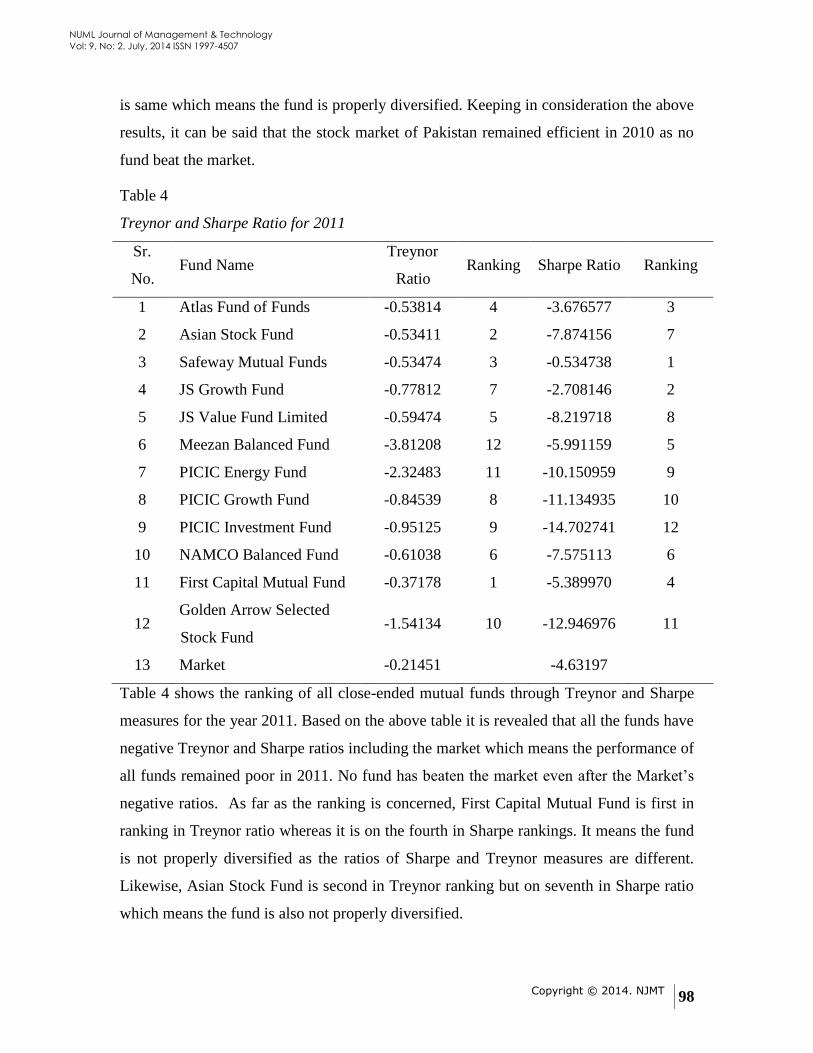
Copyright © 2014. NJMT
98
NUML Journal of Management & Technology
Vol: 9, No: 2. July, 2014 ISSN 1997-4507
is same which means the fund is properly diversified. Keeping in consideration the above
results, it can be said that the stock market of Pakistan remained efficient in 2010 as no
fund beat the market.
Table 4
Treynor and Sharpe Ratio for 2011
Sr.
No. Fund Name
Treynor
Ratio Ranking Sharpe Ratio Ranking
1 Atlas Fund of Funds -0.53814 4 -3.676577 3
2 Asian Stock Fund -0.53411 2 -7.874156 7
3 Safeway Mutual Funds -0.53474 3 -0.534738 1
4 JS Growth Fund -0.77812 7 -2.708146 2
5 JS Value Fund Limited -0.59474 5 -8.219718 8
6 Meezan Balanced Fund -3.81208 12 -5.991159 5
7 PICIC Energy Fund -2.32483 11 -10.150959 9
8 PICIC Growth Fund -0.84539 8 -11.134935 10
9 PICIC Investment Fund -0.95125 9 -14.702741 12
10 NAMCO Balanced Fund -0.61038 6 -7.575113 6
11 First Capital Mutual Fund -0.37178 1 -5.389970 4
12 Golden Arrow Selected
Stock Fund -1.54134 10 -12.946976 11
13 Market -0.21451 -4.63197
Table 4 shows the ranking of all close-ended mutual funds through Treynor and Sharpe
measures for the year 2011. Based on the above table it is revealed that all the funds have
negative Treynor and Sharpe ratios including the market which means the performance of
all funds remained poor in 2011. No fund has beaten the market even after the Market‘s
negative ratios. As far as the ranking is concerned, First Capital Mutual Fund is first in
ranking in Treynor ratio whereas it is on the fourth in Sharpe rankings. It means the fund
is not properly diversified as the ratios of Sharpe and Treynor measures are different.
Likewise, Asian Stock Fund is second in Treynor ranking but on seventh in Sharpe ratio
which means the fund is also not properly diversified.

Copyright © 2014. NJMT
99
NUML Journal of Management & Technology
Vol: 9, No: 2. July, 2014 ISSN 1997-4507
Table 5
Treynor and Sharpe Ratio for 2012
Sr.
No. Fund Name
Treynor
Ratio Ranking
Sharpe
Ratio Ranking
1 Atlas Fund of Funds 0.157949 6 3.350303 3
2 Asian Stock Fund 0.312718 2 3.982683 2
3 Safeway Mutual Funds 0.306236 3 0.306235 10
4 JS Growth Fund 0.259639 5 1.209528 6
5 JS Value Fund Limited 0.439519 1 3.07420 5
6 Meezan Balanced Fund -0.063145 12 -0.760139 11
7 PICIC Energy Fund 0.121405 7 3.091096 4
8 PICIC Growth Fund 0.026832 10 0.575090 9
9 PICIC Investment Fund 0.031715 9 0.692195 8
10 NAMCO Balanced Fund -0.045578 11 -1.152491 12
11 First Capital Mutual Fund 0.039885 8 1.059164 7
12 Golden Arrow Selected Stock
Fund 0.294403 4 7.776318 1
13 Market 0.313719 10.96620
Table 5 shows the ranking of all close-ended mutual funds through Sharpe and Treynor
measures for the year 2012. The table reveals that most of the funds performed better in
2012. The Treynor and Sharpe ratio for market was 0.313719 and 10.96620, respectively.
The table shows that only JS Value Fund Limited has high Treynor Ratio than the market
otherwise no fund has its Treynor or Sharpe ratio higher than the market. So it can be said
that only JS Value Fund Limited outperformed the market whereas all other funds
underperformed the market. The table also reveals that the Treynor and Sharpe ratio are
not same for JS Value Fund Limited which means the fund is not properly diversified.
Likewise, Asian Stock Fund is on second ranking which has second highest Treynor and
Sharpe ratio but less as compare to market. The ranking of Asian Stock in Treynor and
Sharpe ratios are same which means that the fund is properly diversified. In 2012 only
two funds i.e. Meezan Balanced Fund and NAMCO Balanced Fund have their Sharpe

Copyright © 2014. NJMT
100
NUML Journal of Management & Technology
Vol: 9, No: 2. July, 2014 ISSN 1997-4507
ratio negative. The negative Sharpe ratio means poor performance of the funds therefore
it is easy to ascertain that these two funds have bad performance as compare to other
funds.
Keeping into consideration the results of five years, it is revealed that the Pakistani stock
market is reasonably efficient as individual funds could not beat the market on consistent
basis even in the aftermath of financial crisis of 2007 coupled with the political instability
in the country.
Comparative Analysis
Table 6 shows the pairs of open and close-ended funds by taking ROE, ROA, Expense
Ratio, Turnover, Fund Size and Fund Age. The table shows that pair number 5 and 6
have significant difference at significance value of 0.01 which means that there is
statistically significant difference between the fund size and fund age of open ended and
close-ended. Other values are insignificant which means there is no difference in open
and close-ended mutual funds with respect to ROE, ROA, Expense Ratio and Turnover.
Based on the results it can be concluded that close-ended mutual funds are significantly
larger in size and older in life. Although, these funds are fewer in number but their
average size is significantly bigger than open-ended mutual funds. This can be associated
with the fact that, unlike the open-ended funds, investors of close-ended funds cannot
redeem their investment therefore these funds keep on growing in size. Similarly, close-
ended funds are significantly older in age as compared to their open-ended counterparts.
The fact is that no new close-ended fund is established in the near past so keeping the
average age of the existing funds high while on the other hand a large number of open-
ended funds are established in the recent past which significantly decreased the average
age of open-ended funds. But looking into the more important aspects of these funds for
investors i.e. ROA, ROE and expense ratio, open-ended funds are better, though not
statistically significant, than open-ended funds. Adding to it the advantage of liquidity
offered by open-ended funds can explain the trend toward the open-ended funds in the
recent past. No close-ended fund is established (rather close-ended funds decreased in
number) in the last 8-10 years but a large number of open-ended funds are started as
show by MUFAP data. In 2003 there were around 13 open-ended and 35 close-ended

Copyright © 2014. NJMT
101
NUML Journal of Management & Technology
Vol: 9, No: 2. July, 2014 ISSN 1997-4507
funds registered in MUFAP whereas as in the year 2012-13 the number for open-ended
increased by 130 whereas the number of close-ended funds dropped down to only 14
(MUFAP, 2013).
Conclusion
This study has focused on the ranking of close-ended mutual funds over five years and a
comparative analysis of open and close-ended funds characteristics. By using the Treynor
and Sharpe measures it has been revealed that no fund outperformed the market on a
consistent basis over the study period. It has also been revealed that Pakistani stock
market is reasonably efficient as no fund could beat the market on regular basis even
when the market was facing downfall problem. A comparative study has also conducted
to compare open and close-ended mutual funds on different aspects. The results

Copyright © 2014. NJMT
102
NUML Journal of Management & Technology
Vol: 9, No: 2. July, 2014 ISSN 1997-4507
demonstrate that there is no difference in the performance of open and close-ended
mutual funds over the study period. There is significant different in the two groups based
on fund‘s age and size but these differences have their own reasons behind it. Lastly, this
study explains the rationale behind the dramatic increase in the number and value of
open-ended funds in Pakistan over the recent past.
References
Afza, T., & Rauf, A. (2009). Performance evaluation of Pakistani mutual funds. Pakistan
Economic and Social Review, 47(2), 199-214.
Anderson, S., Coleman, B., Frohich, C. and Steagall, J. (2001). A Multifactor Analysis of
Country Fund Returns. Journal of Financial Research, 24, 331-346
Blake, D., Lehmann, B. N., & Timmermann, A. (1999). Asset allocation dynamics and
pension fund performance*. The Journal of Business, 72(4), 429-461.
Bogle, J. C. (2003). Re-Mutualizing the Mutual Fund Industry-The Alpha and the
Omega. BCL Rev., 45, 391.
Brown, S. J., & Goetzmann, W. N. (1995). Performance persistence. The Journal of
finance, 50(2), 679-698.
Filbeck, G., & Tompkins, D. L. (2004). Management Tenure and Risk-Adjusted
Performance of Mutual Funds. The Journal of Investing, 13(2), 72-80.
Glosten, L. R., & Harris, L. E. (1988). Estimating the components of the bid/ask spread.
Journal of financial Economics, 21(1), 123-142.
Huhmann, B. A., & Bhattacharyya, N. (2005). Does mutual fund advertising provide
necessary investment information?. International Journal of Bank Marketing, 23(4), 296-
316.
Mutual Funds Association of Pakistan ‗Assets Under Management‘. Retrieved from
http://www.mufap.com.pk/aum_report.php?tab=01 (Accessed: 2 March, 2013).
Peterson, J.D., Pietranico, P.A., Riepe, M. W. and Xu, F. (2001), Explaining the
Performance of Domestic Equity Mutual Funds. Journal of Investing, 10, 81-92.
Pontiff, J. (1997). Excess volatility and closed-end funds. The American Economic
Review, 155-169.
Shah, S. A., Hijazi, S. T., & Hamdani, N. H. (2005). Performance Evaluation of Mutual
Funds in Pakistan. The Pakistan Development Review, 863-876.
Yi, J., & Kim, M. K. (2005). Risk Factors On Returns Of Closed-End Funds. Journal of
Business & Economics Research (JBER), 3(10).