journal of health & translational medicine jummec
TRANSCRIPT

JOURNAL OF HEALTH & TRANSLATIONAL MEDICINE
JUMMEC
AN EVALUATION OF TREATMENT OUTCOME IN TUBERCULOSIS DIRECTLY OBSERVED TREATMENT SHORT COURSE FACILITIES IN JIGAWA STATE, NIGERIA (2010–2014)
Faisal M, ABM Alauddin C, Md. Imdadul H, Moniruddin C
TUNNELLED PERIPHERALLY INSERTED CENTRAL CATHERER- HOW WE DO THEM
Vijaynanthan A, Nawawi O, Abdullah BJJ
EVALUATION OF DIFFUSION-WEIGHTED IMAGING AND APPARENT DIFFUSION COEFFICIENT MAPPING USING DIFFERENT B-VALUES FOR MAGNETIC RESONANCEGUIDED FOCUSED ULTRASOUND SURGERY: A PRELIMINARY STUDY FOR UTERINE FIBROID AND ADENOMYOMA
Panicker A, Abdullah BJJ, Yaakup NA, Wong YH, Yeong CH, Omar SZ, Vijaynanthan A
THE EXPERIMENTAL ASSESSMENT OF BUILD UP FACTOR AND ATTENUATION COEFFICIENT OF BRASS COMPENSATOR APPLIED IN INTENSITY-MODULATED RADIATION THERAPY (IMRT) FOR 6MV PHOTON BEAM
Elnaz B, Peyman H, Abbas H, Raheb G, Zaker S
PULMONARY REHABILITATION USING MECHANICAL INSUFFLATION-EXSUFFLATION THERAPY FOR SPINAL CORD INJURY – TWO CASE STUDIES IN THE UNIVERSITY MALAYA MEDICAL CENTRE
Tan JH, Aishah A Fauzi, Hasnan N
Volume 20 Issue 2 December 2017 Managing Editor Noor Azlin Yahya

JUMMECJournal of Health and Translational Medicine
Volume 20 Issue 2 2017

JUMMECJournal of Health and Translational Medicine
Editorial i
Instructions for Authors iii
Foreword From the Editor
iv
Original ArticleAN EVALUATION OF TREATMENT OUTCOME IN TUBERCULOSIS DIRECTLY OBSERVED TREATMENT SHORT COURSE FACILITIES IN JIGAWA STATE, NIGERIA (2010–2014)Faisal M, Abm Alauddin C, Md. Imdadul H, Moniruddin C
1
Case ReportTUNNELLED PERIPHERALLY INSERTED CENTRAL CATHERER- HOW WE DO THEM Vijaynanthan A, Nawawi O, Abdullah BJJ
8
Original ArticleEVALUATION OF DIFFUSION-WEIGHTED IMAGING AND APPARENT DIFFUSION COEFFICIENT MAPPING USING DIFFERENT B-VALUES FOR MAGNETIC RESONANCE-GUIDED FOCUSED ULTRASOUND SURGERY: A PRELIMINARY STUDY FOR UTERINE FIBROID AND ADENOMYOMA Panicker A, Abdullah BJJ, Yaakup NA, Wong YH, Yeong CH,, Omar SZ, Vijaynanthan A
13
Original ArticleTHE EXPERIMENTAL ASSESSMENT OF BUILD UP FACTOR AND ATTENUATION COEFFICIENT OF BRASS COMPENSATOR APPLIED IN INTENSITY-MODULATED RADIATION THERAPY (IMRT) FOR 6MV PHOTON BEAM Elnaz B, Peyman H, Abbas H, Raheb G, Zaker S
26
Case ReportPULMONARY REHABILITATION USING MECHANICAL INSUFFLATION-EXSUFFLATION THERAPY FOR SPINAL CORD INJURY – TWO CASE STUDIES IN THE UNIVERSITY MALAYA MEDICAL CENTRE Tan JH, Aishah A Fauzi, Hasnan N
31
List of Reviewers 34
Volume 20 Issue 2 2017

i
JUMMECVolume 20 Issue 1 2017
Editor-in-ChiefTunku Kamarul Tunku Zainol Abidin, MD, MS Ortho, PhD
Founding EditorKhairul Anuar Abdullah, MPH, PhD
EditorsSaw Aik, MBBS, M.Med, FRCS, RUSHDebra Sim Si Mui, B.Sc, Ph.D. Ivy Chung, Postdoc, B.Eng, Ph.D.Lau Yee Ling, B.Sc, MMedSc, Ph.D. Azlina Amir Abbas, MD, DipAdvMedSc, MSORTH, FRDOCAzura Mansor, MBBS, MS OrthoVictor Hoe Chee Wai Abdullah, MBBS, MPH, MPH (OH), MEng (SHE), Ph.D.Kiew Lik Voon, B.Sc, MSc (Pharm), Ph.D.Raja Elina Afzan Raja Ahmad, MBChB, MMedSc, Ph.D.Wong Pooi Fong, BBioMedSc, DipTropMed, MMedSc, Ph.D.Anwar Norazit, B.Sc, M.Sc, Ph.D.Suzita Mohd Noor, MMedSc, BBioMedScThamil Selvee A/P Ramasamy, B.Sc, Ph.D.Noor Azlin Yahya, DipTrans, BDS, MdenSci
Language EditorGracie Ong @ Gracie Ong Siok Yan, MBBS, FJFICM, FANZCA, FFARACSGeh Sooi Lin, M.Sc (Pharm), B. Pharm
Editorial AssistantNurul Fatihah Hamdani
Correspondence All manuscripts, general correspondence and enquiries should be addressed to: Journal of Health and Translational Medicine (JUMMEC), The Dean’s Office, Faculty of Medicine, University of Malaya, 50603 Kuala Lumpur, MALAYSIA.

ii
International Advisory Board David Chiu-Yin Kwan, China Medical University, TaiwanParveen June Kumar, Queen Mary University of London, United Kingdom
International EditorSimon Frostick, University of Liverpool, United KingdomJohn Fairclough, Cardiff Metropolitan University, United Kingdom
Publisher The Journal of Health and Translational Medicine (JUMMEC) is published two times a year by the Faculty of Medicine, University of Malaya. An online archive of JUMMEC issues is available through the website: jummec.um.edu.my.
Aim and Scope JUMMEC publishes both basic and applied science as well as clinical research studies on any area of medicine that is of interest and relevance to the medical community. This is a peer-reviewed Journal that publishes twice yearly on Review Articles, Original Articles, Short Communications, Clinico-pathological conference abstracts, Case Reports, Letters to the Editor and Book Reviews.
Manuscript Submission We welcome journal submissions throughout the year. Articles submitted for publication are understood to be offered only to JUMMEC and which have not been sent to other journals for consideration.

iii
Instructions for AuthorsThe Journal of Health and Translational Medicine (JUMMEC) publishes both basic and applied science as well as clinical research studies on any area of medicine that is of interest and relevance to the medical community. This is a peer-reviewed journal that publishes Reviews Articles, Original Articles, Short Communications, Clinico-pathological Conference Abstracts, Case Reports, Letters to the Editor and Book Reviews. Articles submitted for publication are understood to be offered only to JUMMEC and which have not been sent to other journals for consideration.
The Manuscripts Send manuscripts via email to: [email protected] or write in to: Editor-in-Chief Journal of Health and Translational Medicine (JUMMEC), The Dean’s Office Faculty of Medicine, University of Malaya, 50603 Kuala Lumpur, MALAYSIA. Fax: (603) 7956 8841. Manuscripts submitted to JUMMEC should be prepared according to the American Medical Association (AMA) Manual of Style (10th edition). We accept articles written in either British English or American English but the language usage should be consistent throughout the manuscript. Each manuscript component must begin on a new page in the following sequence: (1) title page; (2) abstract and keywords; (3) text; (4) acknowledgements; (5) references; (6) figure legends; (7) tables; and (8) figures. Please submit figures as separate figure files (jpeg or gif) with 300 dpi resolution or better. Type manuscript double-spaced throughout. Number pages consecutively commencing on the title page. Articles should be not more than 3,000 words.
The Title Page The title page should contain a concise title of the article. Names of authors who have contributed to the writing of the manuscript should be written in style of initials followed by surname or preferred name, eg. Saleena VEO, Anita S or Brown J. Add at the bottom of the phrase “Address for correspondence;” followed by full name and address with postal code and email address.
The Abstract Limit the number of words to 150. It should state the purpose of the study, a brief description of the procedures employed, main findings and principal of conclusions. At the end of the abstract, please include an alphabetical list of 3-5 keywords and subjects for indexing. Choose the appropriate keywords as these will be used for subsequent retrieval.
The Text It should consist of an Introduction, Methods, Results, Discussion and Conclusion/Recommendation. Systeme Internationale (SI) Units should be used. Use only standard abbreviations. The full term for which an abbreviation stands should precede its first use in the text unless it is a standard unit of measurement.
References Number the references in the order of mention in text. References in the text should be indicated by a figure within
parenthesis e.g. (1, 2,). Limit references to 30, if possible. Identify references in text, tables and legends. The titles of journals in the list should be abbreviated according to the Index Medicus. Authors are responsible for the accuracy of all references. The editor can only check for correctness of format. Follow the examples of forms of references as shown below. Journal references should be cited as follows: Stewart AL, Mills KM, King AC, et al. CHAMPS Activities questionnaire for older adults. Med Sci Sports Exerc 2001; 33(7): 1126-1141. Kaneda T. Health care challenges for developing countries with aging populations. Populations Reference Bureau. Available from http://www.prb.org/Articles/2006/HealthCare ChallengeswithAgingPopulations.aspx. Accessed 21 Mar 2007.
Book chapters should conform to the following: Skinner MW, Holden LK, Binzer SM. Aural rehabilitation for individuals with severe and profound impairment hearing aids, cochlear implants, counseling and training. In: Valente M. ed. Strategies for Selecting and Verifying Hearing Aid Fittings. NY: Thieme Medical Publishers; 1994: 267-299.
Books should be listed as: Baselt RC, Cravey RH. Disposition of Toxic Drugs and Chemicals in Man. 8th ed. Foster City, Calif: Chemical Toxicology Institute; 2008. Iverson C, Flanagin A, Fontanarosa PB, Glass RM, Glitman P, Lantz JC, et al. American Medical Association manual of style: a guide for authors and editors. 9th Ed. Baltimore: Williams & Wilkins; 1998.
Tables Start each table double-spaced on a separate sheet. Do not submit tables as photographs. Give each table a number in order of mention in text. Provide footnotes for explanatory matter and identify in alphabetical order all abbreviations used. Place all tables and figures at the end of the manuscript after the references. You may place callouts for the table and figures in the text. For example, write “INSERT TABLE 1 HERE” to show where the table should appear within the text. All tables should be prepared for publication vertically.
Illustrations Authors are advised to submit figures as JPEG, TIFF or GIF formats; PowerPoint slides and images embedded in Word documents do not transfer well to print unless they are simple line art. Abbreviations, arrows, symbols, numbers or letters used in the figures are to be identified and explained in the corresponding legends. Submit written permission from the copyright holder to reproduce any previously published figures. Colour photographs will be published at the author’s expense.
Disclaimer Neither the editors nor the publishers accept responsibility for the views of authors expressed in the contributions.
iv
Dear JUMMEC readers,
The year 2017 has seen incredible advancement in research and unearthed both more concerns and more solutions. The turn of the year has arrived and it is imperative to reflect on our achievements that will no doubt beneficial to the medical field while planning for the oncoming year.
On 5th October 2017, JUMMEC has received the potential CREAM status award from the Ministry of Higher Education. A heartiest congratulation to JUMMEC team, who had worked very hard to push the journal to a level that had allowed this recognition to be conferred. For this issue of JUMMEC (Issue 2, Volume 20), it is my pleasure to introduce the contributions of several authors in the field of Health and Translational Research.
Tuberculosis (TB) is a major public health problem worldwide. Globally, incident cases of TB showed a rising trend, with a 6.6 million reported in 1990, and an estimated 9.27 million incident cases in 2007. The first article in this issue reported the treatment outcome of TB patients in Jigawa State, Nigeria.
With the advancement in new chemotherapeutic regimes, a better and easier venous access is becoming critical for intravenous chemotherapeutics delivery. In the second article, a new technique to place a tunneled peripherally inserted central catheter (PICC) at the upper arm of patient under real-time ultrasound-guided venipuncture using disposal equipment provided within a standard PICC set is described by Prof. Dr. Basri Johan Jeet Abdullah and team.
Uterine fibroids and adenomyoma are benign pathological diseases that have affected women in the reproductive age group. These diseases have caused significant disability and morbidity in patients and constitute a major source of public healthcare cost worldwide. Researchers from both Department of Biomedical Imaging and Department of Obstetrics and Gynaecology, Faculty of Medicine, University of Malaya, have taken a study to assess the feasibility of diffusion-weighted imaging (DWI) and apparent diffusion coefficient (ADC) mapping using different b-values for magnetic resonance-guided focused ultrasound (MRgFUS) treatment of uterine fibroid and adenomyoma.
Recent compensators are commonly applied in intensity-modulated radiation therapy (IMRT). The precise properties of applied compensators such as thickness, attenuation coefficient and build up factor are intensively important for IMRT calculations. The brass compensator used for 6 MV photon beam was studied by a group of researchers from Iran, to estimate the relative effect of thickness and field size on IMRT calculations. Last but not least, we have a case report from Department of Rehabilitation Medicine, Faculty of Medicine, University of Malaya. Mechanical insufflation-exsufflation (MIE) therapy is an option for secretion management in individuals with acute spinal cord injury. In this paper, they presented their experience using MIE as an adjunct to management of secretions in the spinal cord injured population at the University of Malaya Medical Centre.
We would like to give special thanks to Faculty of Medicine, University of Malaya for continually providing quality review articles and published material of relevance. It is only with the combined effort of the contributors as well as the readers that has allowed JUMMEC to continue its endeavor to share the ever-growing progress in the medical field.
Noor Azlin YahyaManaging Editor (Volume 20 Issue 2)
Foreword from the Editor

1
JUMMEC 2017:20(2)ORIGINAL ARTICLE
AN EVALUATION OF TREATMENT OUTCOME IN TUBERCULOSIS DIRECTLY OBSERVED TREATMENT SHORT
COURSE FACILITIES IN JIGAWA STATE, NIGERIA (2010–2014)
Faisal M1, ABM Alauddin C1, Md. Imdadul H1, Moniruddin C2
1 Department of Public Health, Faculty of Allied Health Science, Daffodil International University, Dhanmondi, Dhaka 1207, Bangladesh2 Department of Medicine & Centre for Research on Non-Communicable Diseases, Faculty of Medicine & Health Sciences, Universiti Tunku Abdul Rahman, Sungai Long Campus, Jalan Sungai Long, Bandar Sungai Long, Cheras 43000, Kajang, Selangor Darul Ehsan, Malaysia
Correspondence:Dr. Moniruddin ChowdhuryDepartment of Medicine& Centre for Research on Non-Communicable DiseasesFaculty of Medicine & Health SciencesUniversiti Tunku Abdul Rahman, Sungai Long Campus, Jalan Sungai Long, Bandar Sungai Long, Cheras 43000,Kajang, Selangor Darul Ehsan, MalaysiaEmail: [email protected]
ABSTRACTTuberculosis (TB) is a major public health problem worldwide. It is estimated that 2 billion people, a third of the world population, have TB infection, but are not down with the disease. Globally, incident cases of TB showed a rising trend, with a 6.6 million reported in 1990, 8.3 million in 2000, 9.24 million in 2004, and an estimated 9.27 million incident cases in 2007. The aim of this study was to evaluate the treatment outcome of TB patients in Nigeria in the state of Jigawa. A cross sectional retrospective study was conducted to evaluate the treatment outcome in directly observed treatment with a short course for tuberculosis (TB DOTS) in facilities in the state between the years 2010 to 2014. The study population were all the patients with TB, who had access to DOTS therapy. Data were collected from the various local governmental areas for tuberculosis control (LGA TB) register. The LGA TB control registers contained basic information of the patients, and a statistical software SPSS-V22.0 was used to analyse the data. A total of 963 TB patients were studied. More than half (57.4%) of the patients were male, and nearly three- fourths (71.2%) of the patients accessed care from urban local government areas in the state. The greater majority (96.3%) of the cases had pulmonary tuberculosis (PTB). Among the patients, more than two-fifths (45%) were cured, and a little over one-fifth (20.6%) of them were HIV positive. This study revealed that the treatment success rate (TSR) in the Jigawa State of Nigeria was higher than the overall TSR of Nigeria, and the defaulter rate in this state was lower than the Nigerian average. The aim of this study was to evaluate the treatment outcome of TB patients in Nigeria in the state of Jigawa. A cross sectional retrospective study was conducted to evaluate the treatment outcome in directly observed treatment with a short course for tuberculosis (TB DOTS) in facilities in the state between the years 2010 to 2014. The study population were all the patients with TB, who had access to DOTS therapy. Data were collected from the various local governmental areas for tuberculosis control (LGA TB) register. The LGA TB control registers contained basic information of the patients, and a statistical software SPSS-V22.0 was used to analyse the data. A total of 963 TB patients were studied. More than half (57.4%) of the patients were male, and nearly three- fourths (71.2%) of the patients accessed care from urban local government areas in the state. The greater majority (96.3%) of the cases had pulmonary tuberculosis (PTB). Among the patients, more than two-fifths (45%) were cured, and a little over one-fifth (20.6%) of them were HIV positive. This study revealed that the treatment success rate (TSR) in the Jigawa State of Nigeria was higher than the overall TSR of Nigeria, and the defaulter rate in this state was lower than the Nigerian average.
Keywords: Cases, DOTS, Health, HIV, Nigeria, Patients, Pulmonary, Treatment, Tuberculosis, WHO

2
ORIGINAL ARTICLE JUMMEC 2017:20(2)
IntroductionTuberculosis (TB) is a major public health problem worldwide. Globally, it is estimated that 2 billion people, a third of the world population, have TB infection, but not the disease. There is an increase in the incident cases of tuberculosis from 6.6 million cases in 1990, 8.3 million cases in 2000, and 9.24 million cases in 2006, to an estimated 9.27 million incident cases of TB in 2007(1).
In the mid-1990s, the World Health Organisation (WHO) initiated various efforts to improve TB care and control at national and international levels. TB was declared a global public health emergency in 1993 (2). The increase in the incident cases in 2007 was in Asia (55%) and Africa (31%), with a very small proportion of cases in the Eastern Mediterranean region (6%), Europe (5%), and the Americas (3%) (1). In the 21st century, TB remains a global emergency and is one of the major public health problems (3). It is not only a public health burden, but also a significant socioeconomic issue (4). According to the Global TB Report, in 2013, an estimated 9.0 million people developed TB, and 1.5 million died from the disease with more than half (56%) in South-East Asia and the Western Pacific region, and 29% were in Africa. The highest rates of cases and deaths occurred in Africa (5). However, the global TB prevalence in 2015 was 42% lower than in 1990 (6).
There were an estimated 0.5 million cases of multi-drug resistant tuberculosis (MDR-TB) in 2007. 27 countries, of which 15 were in the European region, accounted for 85% of the MDR-TB cases. The countries that ranked from the first to the fifth, in terms of the total numbers of MDR-TB cases were India with 131000, China with 112000, the Russian Federation with 43000, South Africa with 16000 and Bangladesh with 15000. Globally about 3.7% of new TB patients had MDR-TB, and the rate was much higher, about 20%, in those who had been previously treated. The frequency of MDR-TB varied substantially between countries. About 9% of MDR-TB cases also had resistance to two other classes of drugs, and were termed the extensively drug-resistant TB (XDR-TB). By the end of 2008, 55 countries and territories had reported at least one case of XDR-TB (1) and by March 2013, the number of countries reporting at least one XDR-TB case had increased to 84.(7).
WHO developed a treatment strategy for TB, with a directly observed treatment with a short course (DOTS). DOTS was introduced in 1994, where the patient took each dose of medication under the direct observation of a health care worker to ensure that the correct dosage and combination of TB medications were taken for the entire course of the treatment. It became the standard of care for the TB patient, and it was adopted within a decade by almost all countries. Considerable progress was seen towards achieving the global targets established for 2005 (2). It was evident that the best way to cure TB was to be treated under the DOTS where the TB patients’ response and adherence to treatment were closely monitored, and treatment failure, the emergence of drug resistance and spread of the disease could be avoided. In 2006, the Stop
TB Strategy, stretching from 2006 to 2015 was launched as a continuation of programme.
Nigeria was rated 4th among the 22 countries worldwide with a high TB burden. Nigeria had 774 local government areas (LGAs), and at least two health facilities in each of these LGAs had functional DOTS services (1). The case detection rate had been increasing steadily but remained relatively low. Although the outcome of treatment was not evaluated in many of the patients, the TSR was 76% in Nigeria using the 2006 TB cohort (1). It was estimated that the incidence of TB cases in the country was 311 per 100,000 population with an incidence of new smear-positive cases of TB at 131 per 100,000 population. The prevalence was estimated at 521 per 100,000 population, with new MDR-TB contributing 1.8% of the number. The mortality rate was 93 per year per 100,000 population. The prevalence rate of HIV in adult TB patients was 27% ranging from 15% to 49%, in the state. WHO estimated that TB accounted for 50% of all AIDS related death annually in Sub Saharan Africa with Nigeria included (1). Although the implementation of DOTS increased treatment success and decreased transmission of resistant TB, the disease still killed 5000 people every day (8-10).
TB treatment in Nigeria was usually through the DOTS therapy through the National Tuberculosis and Leprosy Control Programme (NTBLCP). Criteria for assigning treatment included age, history of previous anti TB exposure, pregnancy, HIV status, pretreatment and weight. The drugs used for TB treatment in Nigeria included rifampicin (R), isoniazid (H), ethambutol (E), pyrazinamide (Z), and streptomycin (S). The treatment regimen under the NTBLCP was for 8 months for all categories of TB patients (CAT 1 and CAT 2 patients). CAT 1 patients included all new cases who were smear-positive, or smear-negative, and who had pulmonary or extra pulmonary TB. CAT 2 patients included patients who had relapsed, who had defaulted and returned for treatment, or had treatment failure and others. In the 8 months of the treatment by NTBLCP, there was an intensive phase for the first 2 months, and then a follow up of 6 months of treatment called the continuation phase. For CAT 1 TB patients, the intensive phase medication consisted of a combination of rifampicin, isoniazid, pyrazinamide and ethambutol followed by a 6 months continuation phase of isoniazid and ethambutol (2RHZE/6EH). For CAT 2 TB patients, the intensive phase with daily supervision was for 3 months with rifampicin, isoniazid, pyrazinamide, and ethambutol. Streptomycin was added in the first 2 months daily. The continuation phase involved a daily intake for 5 months of rifampicin, isoniazid, ethambutol and pyrazinamide (2SRHZE/RHZE/5RHZE). Under the NTBLCP, TB drugs came as a fixed dose combination (FDC) which helped to ensure adherence (11).
Monitoring of the progress of TB patients while on treatment was an essential part of the case management for TB patients. This was to ascertain the effectiveness of treatment as well as assessing improvement in the

3
JUMMEC 2017:20(2)ORIGINAL ARTICLE
patients’ clinical state. Monitoring was done through sputum microscopy examination, clinical examination and drug intake recording.
Sputum smears were made on two early morning sputum samples, taken within two days and examined under microscopy for the bacilli. They were done at the end of the 2nd month for new cases, and at the end of the 3rd month for retreatment cases. The sputum smear examinations were then repeated at the end of 5th and 7th months respectively. A clinical examination of the patient was regularly conducted at least monthly, including a weight assessment. Assessment of the regularity of the drug intake was made by an examination of the patients’ records.
NTBLCP adopted DOTS as the central strategy and mainstay in tackling the TB scourge in Nigeria. It was adopted to help in achieving its main targets of identifying at least 70% of the estimated infectious cases with positive sputum smear; a cure rate of at least 85% of the detected smear-positive cases; a reduction of TB prevalence and death rates by 50% relative to the 1990 level by 2015; and the elimination of TB as a public health problem by 2050 (11).The DOTS strategy improved treatment compliance, and increased the TB cure rate (12). Left alone, many people with TB failed to take all their medication and contributed to the spread of drug-resistant TB (Source: http://www.medicinenet.com/ script/ main/ art. asp?articlekey=12850).
In Jigawa state, DOTS was practised in all the local government areas, and the activities were coordinated by the State TB Leprosy Control Program (STBLCP) as well. DOTS activities were usually comprehensive and included both the treatment and diagnoses of TB. In 2006, the World Health Organization (WHO) launched the Stop TB Strategy, stretching from 2006 to 2015. This study was designed to evaluate the treatment outcome of TB patients in the selected areas, in Jigawa State, Nigeria.
MethodologyA cross sectional retrospective study was carried out to assess the treatment outcome in the selected TB DOTS facilities. The study was conducted at the seven local government areas of Jigawa State of Nigeria, with all the 963 TB patients, who were registered between years through 2010 to 2014, and had their treatment using the DOTS therapy. The outcome of the patients were evaluated at the end of their treatment.
Data were collected from the various LGA TB control registers used for the study with the help of data collection instruments. The LGA TB control registers contained basic information of the patients. This information included the date of registration and the LGA TB registration number; the demographic data of name, age and sex of the patient ; the details of treatment, the unit or facility, the date of the start of treatment and the treatment category; the details of the infection, the site of the infection (pulmonary/extra pulmonary),and the type of patient; the investigations including the baseline and follow up of TB smear results,
and the x-ray results where applicable; the treatment follow up, HIV classification and the eventual treatment outcome. All the records obtained from the documents or history of TB patients were coded numerically and entered into the statistical software SPSS-V 22.0 for analysis. Chi-square tests were employed to compare different groups for categorical data. A p-value less than 0.05 was considered as significant.
Ethical Approval and ConsentThe study was ethically approved by the Ethical Committee, Department of Public Health Daffodil International University Dhaka, Bangladesh. The ethics number was FAHSEC/DIU/2016/1002.
Results
Socio-demographic distribution of patients The age group of 20 –29 years had the highest number of patients (25.2%) followed by the age group of 30 –39 years (22.9%). The older age groups of 50 –59 years and those older than 60 years had the least number of TB cases. More than half (57.4%) of the patients were male, and the rest were female (Table 1). It was observed that 71.2% of the patients accessed care from the urban local government areas, while the rest of the cases accessed care from rural local government areas (Table 1).
Table 1: Socio demographic distribution of patients (n=963)
Variables Frequency Percent (%)Age (years)0-1920-29 30-39 40-49 50-59 >59
12224322116989
119
12.725.222.917.59.2
12.4
SexMale Female
553 410
57.4 42.6
Type of residenceUrban Rural
686 277
71.2 28.8
Mean age = 36 years, SD ± 7.97
Distribution of patients by disease classification and categoryTable 2 showed the distribution of the patients by disease classification. 96.3% of the cases were PTB-cases while the remaining were EPTB-cases. Table 2 also showed the distribution of the TB patients by disease category. More than four-fifths (85.2%) of the cases were Category 1 TB cases while the remaining were Category 2 TB cases. Category 1 patients were all patients classified as new

4
ORIGINAL ARTICLE JUMMEC 2017:20(2)
cases including smear positive, smear negative and extra pulmonary new cases. Category 2 patients were patients classified under relapse, return with default, failure and others (Table 2).
Table 2: Distribution of patients by disease classification (n=963)
Variables Frequency Percent (%)Disease classificationPTBEPTB
92736
96.33.7
Disease CategoryCAT 1CAT 2
820143
85.214.8
Total 963 100
Distribution of patient by treatment outcomeFigure 1 showed the treatment outcome of the 963 patients in the study: 45% of the cases were cured; 38.2% had completed their treatment as scheduled; 5.3% of them died while undergoing treatment; slightly below one-tenth (8.4%) were defaulters; 1.3% had treatment failure, and 1.8% were transferred out. TSR for the state which is defined as the total number of patients that were either cured or had treatment completed was 83.2% (Figure 1).
Figure I : The distribution of patients by treatment outcome (n=963)
Factors affecting treatment outcomeTable 3 showed the effect of smear characteristics, disease category and disease classification on treatment outcome. The study showed that the TSR of smear positive and smear negative TB patients are close (82.6% vs.84.5%).The table showed that there was a highly significant (p<0.001) association between smear characteristics and treatment outcome. The TSR of Category 2 and I were 83.9% and 79.1 %. There was also a statistically significant (p<0.05) association between the disease category and the treatment outcome. The table showed that the TSR of PTB patients was better than that of EPTB patients (83.4% vs.75.0%). It could be seen that there was a statistically
Table 3: Factors affecting treatment outcome (n=963)
Factors Curedn (%)
Treatmentn (%)
Diedn (%)
Defaultern (%)
Transfern (%)
Failuren (%)
Totaln (%)
TSR*(%)
Statistics
Smear type
+ve-ve
378(57.4)55(18.1)
166(25.2)202(66.4)
33(5.0)18(5.9)
61(9.3)20(6.6)
12(1.8)5(1.6)
9(1.4)4(1.3)
659(100)304(100)
82.6 84.5
X2=1.661P<0.001
CategoryCAT 1CAT 2
379(46.2) 54(37.8)
309(37.7)59(41.3)
42(5.1)9(6.3)
71(8.7)10(7.0)
11(1.3%)6(4.2%)
8(1.0)5(3.5)
820(100)143(100)
83.979.1
X2=14.413P<0.05
Disease classificationPTBEPTB
425(45.8) 8(22.2)
349(37.6)19(52.8)
48(5.2)3(8.3)
75(8.1)6(16.7)
17(1.8)0(0.0)
13(1.4)0(0.0)
927(100)36(100)
83.4 75.0
X2=11.224P<0.05
ResidenceUrban Rural
283(41.3)150(54.2)
272(39.7)96(34.7)
33(4.8)18(6.5)
72(10.5)9(3.2)
17(2.5)0(0.0)
9(1.3)4(1.4)
686(100)277(100)
81.088.9
X2=28.858P<0.001
SexMaleFemale
228(41.2)205(50.1)
222(40.1)146(35.7)
32(5.8)19(4.6)
51(9.2)30(7.3)
11(1.9)6(1.5)
10(1.8)3(0.7)
554(100)409(100)
81.385.8
X2=9.293P>0.05
Age (years)≤1920-2930-3940-4950-59>59
122(100)243(100)68(30.8)
0(0.0)0(0.0)0(0.0)
0(0.0)0(0.0)
127(57.5)169(100)72(80.9)
0(0.0)
0(0.0)0(0.0)
26(11.8)0(0.0)
12(13.5)13(10.9)
0(0.0)0(0.0)0(0.0)0(0.0)1(1.1)
80(67.2)
0(0.0)0(0.0)0(0.0)0(0.0)4(4.5)
13(10.9)
0(0.0)0(0.0)0(0.0)0(0.0)0(0.0)
13(10.9)
122(100)243(100)221(100)169(100)89(100)
119(100)
10010088.310080.90.0
X2=2.403P<0.001
Total 433 368 51 81 17 13 963
*TSR: Treatment Success Rate, *PTB: Pulmonary Tuberculosis, *EPTB: Extra-pulmonary Tuberculosis, *CAT 1: Category 1, *CAT 2: Category 2.

5
JUMMEC 2017:20(2)ORIGINAL ARTICLE
significant (p<0.05) association between them. The TSR of rural areas was higher than the TSR of the urban area (88.9% vs. 81.0%). There were more defaulters in urban areas compared to rural areas (10.5% Vs 3.2%). There was also a highly significant (p<0.001) association between the location of treatment facility and treatment outcome. There was no significant (p>0.05) association between sex of the patients and treatment outcome. There was a highly significant (P<0.001) association between treatment outcome and age of the respondents.
Screening of HIV Disease
Figure 2 showed that out of 963 TB patients who were screened for HIV, 198(20.6%) of them were HIV positive and the rest 765(79.4%) were HIV negative. HIV prevalence rate of the study was 20.6%.
Figure 2: Screening of HIV Disease (n=963)
DiscussionIn this study, 963 TB patients were evaluated. 633 (65.7%) patients were within the age range 20 –50 years (Table 1), showing that TB mainly infected the productive age group in the state, constituting a strong economic burden which could affect the work force. This was consistent with findings in previous reports in developing countries. The study done by Bello in Ilorin found that 75% of TB patients were in the age group 16 –45 years (13) and the study in Ile Ife by Erhabor et al. also showed that 80% of patients evaluated for TB compliance in Ile Ife were of the age range 16 –45 years (14). In contrast, TB had been reported to be two-to-four times more prevalent among the elderly age grouping in developed countries (15). In this study, the mean age of the patients was 36 years. This was consistent with the findings of Bello in Ilorin Nigeria where he found that 36 years was the mean age of the patients (13). Table 1 also showed that 553 (57.4%) of the TB patients were of the male sex. The finding was consistent with the previous study done in Gambella (16). Underutilization of DOTS services by females could be the reason behind the higher proportion of males in the present study. This factor was also of economic importance as males are predominantly the bread winners of the family in Africa. This was consistent with the findings in studies in Ibadan, Thailand and Malawi (17-19).
Of the 963 TB patients, 930 cases (96.3%) were PTB while 33 cases (3.7%) were EPTB cases (Table 2). The TSR for PTB was higher than that of EPTB (83.4% Vs 75.0). It could be due to the rate of HIV co-infection among the group of patients (20). This might be due to diagnostic challenges in identifying EPTB cases as a diagnosis of EPTB was made only by doctors and most TB DOTS services were manned by trained nurses and community health extension workers who were not competent or trained to diagnose EPTB. Other reasons might be the over reliance on alternative medical practitioners and native doctors by the general populace and poor intensive case findings of TB cases in Nigeria. Table 2 also showed that 820 (85.2%) of the TB cases were of CAT 1 TB cases. CAT 1 patients comprised of new cases both smear positive and smear negative, it also included all the extra pulmonary new cases. CAT 2 patients that included the patients classified under relapse, return after default, failure and others. According to the WHO 2009 report on global TB control, the TSR under the DOTS programs among 22 high-burden countries (HBCs) ranged from 58% in Russia to 94% in China, with an average of 87% (1). Our study showed that 45% and 38.2% of the TB patients were cured and completed treatment respectively (figure 1). This accounted for a TSR of 83.2% which was higher than that of Nigeria and African region (17). The TSR was also lower than that of 2013 international TSR (86%) among all new TB cases (21) and also lower than that reported from Dabat (87.8%) (22). The African region from the same 2009 report had a TSR of 75%, and Nigeria with the 4th highest TB burden had a TSR of 76% (17). The higher TSR of this study might be attributed to increased government commitment in the implementation of DOTS in the state. Causes of treatment failure from TB in other studies included drug resistant TB, TB-HIV co infection, prescription errors by unqualified health care workers, non-acceptable regimen, treatment outside the national program, patient related factors including illiteracy and poverty. Our findings found the death, default and treatment failure rate was 5.3%, 8.4% and 1.3% respectively. Cumulatively an overall unsuccessful TB treatment outcome rate was 15.0% which was similar to the findings of a study done in Southern Ethiopia (14.8%) (23). Unsuccessful treatment outcome higher than ours had been reported from southern Ethiopia (16.7%) (24). There were more deaths in DOTS facilities located in rural areas compared to the DOTS facilities located in urban areas (4.8% Vs 6.5%). Patients from rural areas might have lower awareness of TB treatment, and the long distance between their homes and the treatment centres could contribute to lower treatment success (25). Nevertheless, in our study, the TSR in the rural area (88.9%) was higher than TSR in the urban area (81.0%). Of the 963 TB patients evaluated in the study, 198(20.6%) of them were HIV positive. This was lower than the Nigerian TB HIV prevalence rate of 27% but was much higher than the average for the whole world 15% (26). TB HIV patients were monitored both by the TB team and the HIV team leading to increased compliance of the patient to both treatments hence improving treatment outcome. Of the total 963 TB

6
ORIGINAL ARTICLE JUMMEC 2017:20(2)
patients screened for HIV, slightly above one-fifth (20.6%) were HIV positive, with the majority males. This showed that more males were screened and supported the fact that in Nigeria attendance and utilisation of the health services depended on many factors. In some cultures and religions, the females would have to depend on their male counterparts for advice and funding before attending hospital hence delaying attendance. A study conducted in Bangladesh on access to TB diagnosis and treatment also documented that women had poorer access to public outpatient clinics than men (27).
This study showed that the introduction of the DOTS program made a commendable positive impact in the Jigawa state of Nigeria and steps should be taken to maintain a momentum to reach the NTBLCP and world TB target of 85% cure rate. DOTS as the standard of treatment and care in the LGAs would enable all to have treatment especially in the rural areas. The training of DOTS health care professionals with a commitment by the national health authorities in health policies, human resource development would ensure that the patients are cared for. TB HIV collaboration should be encouraged and enhanced. HIV testing should be extended to all TB patients while all HIV patients should be screened for TB. Proper reporting of data by DOTS facilities, with trained staff with accurate observation and follow up of patients during treatment, was important. Observations could be done by regular home visits of TB patients, formation of TB support groups, and usage of a family member as a treatment supporter. All these would help to monitor and report issues of defaulters to health care workers. These also would help in making sure that the treatment protocol was followed, leading to better treatment outcome.
ConclusionThis study revealed a treatment success rate (TSR) in Jigawa State of Nigeria that is higher than the TSR of Nigeria. The defaulter rate was lower than the Nigerian average. The failure rate was marginally lower and better than the Nigeria average using 2009 WHO Global TB report. This study found a death rate which is close to the death rate of TB patients in Nigeria.
AbbreviationsDOTS: Directly Observed Treatment Short course;
TB: Tuberculosis;
HIV: Human Immunodeficiency Virus;
TSR: Treatment Success Rate;
WHO, World Health Organization;
MDR: Multi Drug Resistant;
LGAs: Local Government Areas;
AIDS: Acquired Immune Deficiency Syndrome;
NTBLCP: Nigeria Tuberculosis and Leprosy Control Program;
STBLCP: State TB Leprosy Control Program;
TBL: Tuberculosis and Leprosy;
PTB: Pulmonary Tuberculosis;
EPTB: Extra-Pulmonary Tuberculosis.
AcknowledgmentsThe authors would like to thank reviewers whose helpful comments and suggestions helped to improve this paper and also our gratitude goes to Department of Public Health Daffodil International University, Dhaka-1207 Bangladesh and also Department of Medicine, Universiti Tunku Abdul Rahman, Kuala Lumpur, Malaysia. We would like to thank Mr Bala Inusa, the Medical Record Officer, who helped in the data collection, and to Dr Salamat Khandker and Dr Md. Shahjahan for their help and guidance throughout this research.
Competing interestsThe authors declare that they have no competing interests.
References1. World Health Organization. Global Tuberculosis
Control. WHO, Geneva, 2009: 11-80.2. World Health Organization, Global Tuberculosis
Control: WHO Report, WHO/HTM/TB/2012.6, WHO, Geneva 2012.
3. Santos LC. The Molecular Basis of Resistance in Mycobacterium tuberculosis. Open J Med Microbiol. 2012; l2: 24–36.
4. Liu JJ, Yao HY, Liu, EY. Analysis of factors affecting the epidemiology of tuberculosis in China. Int J Tuberc Lung. 2005; 9: 450–454.
5. World Health Organization. Global Tuberculosis report. WHO/HTM/TB/2014.08. WHO. 2014.
6. World Health Organization, Global Tuberculosis Control: WHO Report, WHO/HTM/TB/2015.22, WHO, Geneva. 2015.
7. World Health Organization (WHO). Multidrug-resistant tuberculosis (MDR-TB), Fact sheet. Available from: http://www.who.int/tb/challenges/mdr/MDR_TB_FactSheet.pdf (Accessed 30 Mar, 2017).
8. World Health Organization, Tuberculosis - the Global Burden, WHO, Geneva, Switzerland, 2005.
9. Shargie EB, Lindtjørn B. “DOTS improves treatment outcomes and service coverage for tuberculosis in South Ethiopia: a retrospective trend analysis,” BMC Public Health. 2005; 5:62.
10. Moonan PK. Quitugua TN. Pogoda JM. et al. “Does directly observed therapy (DOT) reduce drug resistant tuberculosis?”. BMC Public Health. 2011; 11:19.
11. Obasanya J, Patrobas P, Gidado M, et al. Modules for the training of health facility workers in TB control. Third edition. Jodda Comm Press Zaria. Nigeria. 2007; 5-25.
12. Rodger AJ, Toole M, Lalnuntluangi B, et al., DOTS-based tuberculosis treatment and control during civil

7
JUMMEC 2017:20(2)ORIGINAL ARTICLE
conflict and an HIV epidemic, Churachandpur District, India. Bull World Health Organ. 2002; 80: 451–456.
13. Bello SI. Challenges of DOTS implementation strategy in the treatment of tuberculosis in a tertiary health institution, Ilorin, Nigeria. African journal of pharmacy and pharmacology. 2010; 4(4): 158- 164.
14. Erhabor GE, Aghanwa HS, Yusuph M, et al. Factors affecting compliance to TB on Directly Observed Therapy in Ile Ife, Nigeria. East African Medical Journal. 2000; 77 (5): 235-240.
15. Davies PD. The effects of poverty and ageing on the increase in tuberculosis. Monaldi Arch Chest Dis 1999; 54:168-71.
16. Sisay S, Mengistu B, Erku W et al. Directly Observed Treatment Short-course (DOTS) for tuberculosis control program in Gambella Regional State, Ethiopia: ten years’ experience BMC Research Notes. 2014; 7:44.
17. Akinola AF, Abimbola SO, Afolabi EB. Treatment outcomes among pulmonary tuberculosis patients at treatment centres in Ibadan, Nigeria. Annals of African medicine. 2009; 8 (2): 100-104.
18. Zachariah R, Fitzgerald M, Massaquoi M, et al. Does antiretroviral treatment reduce case fatality among HIV positive patients with Tuberculosis in Malawi. International journal for TB and lung disease. 2007; 11 (8):848 -853.
19. Glynn J, Sonnenberg P, Nelson G, et al. Increasing risk of TB with increasing duration of HIV infection: results from 2000 men followed for 12 years. International journal for TB and lung disease. 2007; 11 (11):112.
20. Esmael A, Tsegaye G, Wubie M, et al. Treatment outcomes of tuberculosis patients in Debremarkos referral hospital, north west Ethiopia (June 2008-August 2013): a five-year retrospective study. IJPSR. 2014; 5(4): 1500–1505.
21. World Health Organization. Global Tuberculosis report. WHO/HTM/TB/2014.08. WHO, 2014.
22. Tadesse S, Tadesse T. Treatment success rate of tuberculosis patients in Dabat, north-west Ethiopia. Health. 2014; 6: 306–310.
23. Gebrezgabiher G, Romha G, Ejeta E, et al. Treatment outcome of tuberculosis patients under directly observed treatment short course and factors affecting the outcome in Southern Ethiopia: a five-year retrospective study. PLoS ONE, 11(2): e0150560.
24. Muñoz-Sellart M, Cuevas LE, Tumato M, et al. Factors associated with poor tuberculosis treatment outcome in the Southern Region of Ethiopia. Int J Tuberc Lung Dis. 2010; 14(8):973–979.
25. Ramose JM, Reyes F, Facin R, et al. Surgical lymph biopsies in a rural Ethiopian hospital: histopathologic diagnoses and clinical characteristics. Ethiop Med J. 2008; 46:173–178.
26. Iseman M D, Kasperbaur H, Blackburn D, et al. The Denver TB course at National Jewish Health. Denver, Colorado. 2009:18-19.
27. Begum V, de-Colombani P, Das-Gupta S, et al. Tuberculosis and patient gender in Bangladesh. Int J Tuberc Lung Dis. 2001; 5(7):604–610.

8
CASE REPORT JUMMEC 2017:20(2)
TUNNELLED PERIPHERALLY INSERTED CENTRAL CATHERER- HOW WE DO THEM
Vijaynanthan A1, Nawawi O1, Abdullah BJJ1
1 Department of Biomedical Imaging, Faculty of Medicine, University of Malaya, 50603 Kuala Lumpur, Malaysia.
Correspondence:Prof. Dr. Basri Johan Jeet AbdullahDepartment of Biomedical Imaging, Faculty of Medicine, University of Malaya, 50603 Kuala Lumpur, Malaysia.Email: [email protected]: +603 79493695
ABSTRACTIn the current study, we report a new technique to place a tunnelled peripherally inserted central catheter (PICC) at the upper arm of patient under real-time ultrasound-guided venipuncture using disposal equipment provided within a standard PICC set. The tunnelling of the PICC required an extra time of 5 minutes but was well tolerated by all patients involved in the study. The tunnelled PICC was applied on 50 patients and the infection rate as well its catheter dwell time were compared to another 50 patients with conventional PICC. The rate of patients who developed infection decreased from 34% for conventional PICC to 16% in tunnelled PICC patients. The central line-associated blood stream infections rate was also decreased from 4.4 per 1000 catheter-days for conventional PICC to 1.3 per 1000 catheter-days for tunnelled PICC. The mean time to infection development for tunnelled PICC (24 days) was longer than those observed with conventional PICC (19 days). Tunnelled PICC has also increased the mean catheter dwell time from 27 days (for conventional PICC) to 47 days. Tunnelling a PICC has the potential to reduce the infection rate while increase the catheter dwell time.
Keywords: Tunnelled Peripherally Inserted Central Catheter, Venous Access, Central Line- Associated Blood Stream Infections, Catheter Dwell Time, Infection Rate
IntroductionWith the advancement in new chemotherapeutic regimes, a better and easier venous access is becoming critical for intravenous chemotherapeutics delivery. To this end, peripheral implantable port for the arm with simpler placement, fewer complications and, in some series, greater patient acceptance has been developed as an alternative to the centrally placed chest port (1). Peripherally inserted central catheter (PICC) is widely used as alternative to the conventional central venous catheter (CVC) for providing intermediate to long term venous access, especially for long term administration of antibiotics, parenteral nutrition and chemotherapy (2). However, PICC has been related to several complications such as phlebitis, thrombosis, premature dislodgement, malfunction and central line-associated blood stream infection (CLABSI), which could have increases the cost in patient management (3, 4).
Tunnelling of the central catheter has been proven to improve the stability and lower the infection rate. The tunnelling of the catheter in the subcutaneous tissue during the catheter placement has decreased the catheter colonization in adults (5). Furthermore, the tunnelling of the catheter would have moved the skin exit site away from the vein entry site, which potentially reduces the extra
luminal infection risk. In view of the above, tunnelling of the PICC might have improved the complications related to the conventional PICC.
We describe our technique for a tunnelled PICC using the standard PICC set and determine if catheter dwell time and infection rate of tunnelled PICC are significantly improved to conventional (non-tunnelled) PICC placements
Methods
Imaging Procedure Using a 5-11MHz linear ultrasound probe, the vein to access is determined following placement of a tourniquet.
Real-Time Ultrasound-Guided VenipunctureFigure 1A shows the standard PICC set manufactured by Bard (Bard Access Systems, Salt Lake City, UT, USA), containing a single or double lumen 18-gauge silicon catheter (4F). The upper arm of patient is cleaned with antiseptic and draped. The 5-11 MHz linear ultrasound transducer (covered with sterile endoscope cover) is placed transversely over the vein and the 21G micro puncture needle is slowly advanced into the anterior vein wall under direct sonographic guidance. The anterior and posterior walls frequently oppose as pressure is applied and it is not

9
JUMMEC 2017:20(2)CASE REPORT
uncommon to traverse both anterior and posterior walls simultaneously. More importantly, it is necessary to change the direction of the tip when the pressure of the needle tip displaces the vein to gain venous access.
A 0.018” guidewire is inserted into the lumen once good flow is obtained (Figure 1B). The wire should enter the vein without hindrance or kinking. Fluoroscopy can be used to view the wire and if there is buckling, the wire should not be inserted further. Once the wire is certain to lie freely within the lumen, the wire can be further advanced. Then, the puncture site is infiltrated with local anaesthetic and the micro puncture needle is removed. A small nick is made at the access site along the wire track making sure that the skin is free. The dilator is withdrawn from the “peel away” sheath and then threated over the wire to dilate catheter tract. The proposed track for tunnelling is between 5–7 cm from original venous puncture site and the venous puncture site is then infiltrated with local anaesthetic using same puncture needle or a 21G spinal needle (Figure 1C). The puncture needle is then bent gently with a more acute curve (opposite the direction of the bevel) at the distal of 2 to 3 cm to allow an easier exit of the needle tip at the venous entry site (Figure 1D).
Another nick is made at the distal tunnelled track near the needle entry point and the needle is directed to exit at the
original venous puncture site (Figure 2A). If the access site is made capacious using blunt dissection, the tunnelling can be performed with greater ease. This can be performed at the initial stage after removal of the micro puncture needle or after track infiltration. Another technique to improve exit of the micro puncture needle after tracking is to use the blunt end of the scalpel to press the skin down. It is important to ensure that the needle path is within the subcutaneous tissue otherwise the tunnelling of the ‘peel away’ sheath would be difficult.
The wire is then threaded into the needle (Figure 2B) and once the tip of wire has exited the hub, the needle and wire slowly withdrawn until the wire is straight. It is important to ensure that the proximal part of the wire within the venous system does not recoil out while the entire guidewire is being straightened (Figs. 2C and D). The ‘peel away’ sheath with the dilator is then re-threated over the wire and pressure is applied over the venous entry point to ensure there is no buckling (Figure 3A). The dilator is then withdrawn while the ‘peel away’ sheath is left in place. After the removal of the dilator component of the ‘peel away’ sheath, the PICC is introduced through the sheath and advanced into position (Figure 3B). Then, the ‘peel away’ sheath hub is split (Figure 3C) and slowly withdrawn while ensuring the PICC does not get pulled
Figure 1. (A) The standard Bard PICC set and the linear ultrasound probe covered with sterile cover. (B) Puncture needle with a guidewire threaded into the vein. (C) The track being infiltrated with local anaesthetic using the same puncture needle or a 21G spinal needle. (D) The micro puncture needle with the tip deflected from the bevel.

10
CASE REPORT JUMMEC 2017:20(2)
Figure 2. (A) Needle tip exiting the original puncture site. (B) The guidewire threaded into the needle as it is slowly withdrawn. (C) The operator has to ensure that the proximal portion of the wire does not recoil out from the vein while the entire guidewire is being straightened. (D) The wire after it has been straightened with the portion tunnelled in the subcutaneous tissue.
Figure 3. (A) Pressure is being applied at the venous access site to reduce buckling of the peel away sheath as it traverses the initial venous access. (B) Double lumen Groschong catheter inserted through the peel away sheath. (C) The peel away sheath hub is split. (D) The peel away sheath is slowly withdrawn while ensuring the PICC does not get pulled back by holding it down by an assistant. (E) The initial venous access site (black arrow) is closed using Steri-strips after ensuring that there is no oozing from the site and the bracket shows the length of the tunnelling. The entire set-up is then covered with OPSITE film. (F) The PICC anchored using the Stadlock and another Steri-strip can be placed at the distal end of the subcutaneous tunnel.

11
JUMMEC 2017:20(2)CASE REPORT
back by holding it down by an assistant (Figure 3D). The position of the PICC can be checked using fluoroscopy, if necessary. The initial venous access site, as shown by a black arrow in Figure 3E, is closed using a Steri-Strip after ensuring there is no oozing from the site. The PICC is anchored using the Stadlock and another Steri-Strip can be placed at the distal end of the subcutaneous tunnel as shown in Figure 3F.
Study ProtocolWe prospectively performed conventional PICC and tunnelled PICC on two separate patient groups of 50 patients each. The type of PICCs used in this study is given in Table 1. Real-Time Ultrasound-Guided Venipuncture is a standard of care for venous access. All patients were reviewed until either the occurrence of PICC-related complication necessitated removal, completion of therapy, death or till the end of the study. The CLABSI was confirmed in each case by demonstrating concordance between isolates colonizing the PICC at the time of infection and from blood cultures. Written informed consent was obtained from all patients before the PICC placement.
Table 1. Type of PICC used in the study for both control and tunnelled PICC patient groups.
Types of PICC Control [No. (%)]Tunneled [No
(%)]
Double lumen Groshong
32 (64%) 30 (60%)
Single lumen Groshong 9 (18%) 12 (24%)
Single lumen Polyrad 9 (18%) 8 (16%)
The commonest indication of PICC in both groups was for antibiotic administration (60% in non tunneled group and 50% in tunneled group), followed by chemotherapy (25% in non-tunneled group and 30% in tunneled), total parenteral nutrition and IV access. Patients who were diagnosed with infection made up the majority of the study population for both groups (58% in non-tunneled and 50% in tunneled), followed by malignancy (36% in non-tunneled and 46% in tunneled) and others (scleroderma, mycotic aneurysm and Chron’s disease).
ResultsThe mean catheter dwell time for tunnelled PICC at 47 days (2352 catheter-days for 50 tunnelled PICC) was significantly longer than conventional PICC at 27 days (1355 catheter days for 50 conventional PICC). Tunnelling of the PICC has decreased the infection rate from 34% for conventional PICC to 16% for tunnelled PICC. The CLABSI rate for patient with tunnelled PICC at 6% was also lower than the CLABSI rate for conventional PICC at 12%. The mean time to infection development for tunnelled PICC at 24 days was found longer than the conventional PICC (19 days). However there was no significant difference in the mean
time to development of infection between the 2 groups (p=0.7). The catheter removal due to infection was 24% in conventional PICC patients but was significantly reduced to 4% in tunnelled PICC (p=0.002).
All CLABSI cases occurred in patients with double lumen PICC. Patients with hematological malignancy requiring PICC for chemotherapy were more prone to develop CLABSI, forming all of the CLABSI cases in the tunneled group and 66.6% of the CLABSI cases in the non-tunneled group (odds ratio 7.6, relative risk of 6). No significant difference was however seen between the 2 groups. Patients with previous PICC were more likely to develop CLABSI compared to patients with no previous PICC [5 cases (19.2%) compared to 4 cases (5.4%) respectively, p value =0.049, relative risk of 3.56, odds ratio of 4.16)].
DiscussionThe mean catheter dwell time for tunnelled PICC was found significantly higher than those observed with conventional PICC. Our results seems to be contradicted with previous reports suggesting longer catheter dwell time would have posed a higher risk of infection (6, 7). While all infections were diagnosed during long term follow-up, there were no procedure-related early infections (within 1 week after the procedure) observed with tunnelled PICC patients. In fact, the tunnelled PICC has a longer mean time to infection development compared to conventional PICC. There was no major procedural complications from the technique as no incidence of vascular injury or excessive bleeding, mechanical complications (such as catheter occlusion, fracture or malposition), ‘pinch-off’ or compression point in the catheter line at the venous entry in tunnelled PICC patients. Furthermore, other major complications such as infection or venous thrombosis were found equivalent in both conventional PICC and tunnelled PICC patients.
Overall, the technical success of inserting a tunnelled PICC in patient is high despite required an extra average time of 5 minutes to create the tunnel. However, the tunnelling procedure was very well tolerated by patients and the skin of the arm is easily withstands the tunnelling process. Additionally, the procedure to create a tunnel in the arm of the patient is much simpler and required a shorter procedural time than in the chest. However, the venous access for tunnelled PICC has to be made in the mid-forearm of the patient to avoid tunnelling across the joint has limited the patient’s ability to use the arm freely. Furthermore, mechanical compression, kinking or mitigation of the PICC may occur during falling. Further improvement of the tunnelled PICC with the use of the modified cuffed PICC as described previously (8) could have improves its stability.
Tunnelling a PICC has the potential to reduce the infection rate while increase the catheter dwell time, provided all other measures recommended for PICC care are implemented. As the technique of tunnelling PICC becomes more widely applied, the benefits such as pain elimination of routine peripheral intravenous access and

12
CASE REPORT JUMMEC 2017:20(2)
lower risk of venous inflammation, venous thrombosis and extravasation of cytotoxic agents during chemotherapy will be available to more patients. This will reduce the need of repeated PICC insertions due to infection. As more and more care is shifted towards outpatient care (continuous infusion chemotherapy) and in-home care (palliative medicine), the tunnelled PICC not only reduces the medical cost but also meets the increased societal demand for outpatient cancer chemotherapy. The tunnelled PICC could potentially reduce the need to perform routine central venous port implantation procedures.
ConclusionsWe have described our simple technique of tunnelling PICC using the Bard system without the needs of any additional expensive or disposal equipment. We believe any operator with moderate expertise can perform this technique following the procedure described. Further improvements in the PICC with the addition of cuffs would enable the tunnelled PICC to be used for multiple functions, which can contribute to a secure, safe and seamless care from anti-cancer therapy to palliative medicine. We hope this procedure will become more common and eventually be validated in prospective multicentre randomized clinical trials regarding its non-inferiority or superiority to other central venous line procedures e.g. PICC with respect to safety.
Conflict of InterestsThe authors declare no conflict of interest.
References1. Foley MJ. Radiologic Placement of Long-term Central
Venous Peripheral Access System Ports (PAS Port): Results in 150 Patients. J Vasc Interv Radiol. 1995; 6(2):255-62.
2. Merrell SW, Peatross BG, Grossman MD, Sullivan JJ, Harker WG. Peripherally inserted central venous catheters. Low-risk alternatives for ongoing venous access. West J Med. 1994; 160(1):25-30.
3. Mermel LA. Prevention of intravascular catheter-related infections. Ann Intern Med. 2000; 132(5):391-402.
4. Warren DK, Quadir WW, Hollenbeak CS, Elward AM, Cox MJ, Fraser VJ. Attributable cost of catheter-associated bloodstream infections among intensive care patients in a nonteaching hospital. Crit Care Med. 2006; 34(8):2084-9.
5. Nahum E, Levy I, Katz J, Samra Z, Ashkenazi S, Ben-Ari J, et al. Efficacy of subcutaneous tunneling for prevention of bacterial colonization of femoral central venous catheters in critically ill children. Pediatr Infect Dis J. 2002; 21(11):1000-4.
6. Balkhy HH, Alsaif S, El-Saed A, Khawajah M, Dichinee R, Memish ZA. Neonatal rates and risk factors of device-associated bloodstream infection in a tertiary care center in Saudi Arabia. Am J Infect Control. 2010; 38(2):159-61.
7. McLaws ML, Berry G. Nonuniform risk of bloodstream infection with increasing central venous catheter-days. Infect Control Hosp Epidemiol. 2005; 26(8):715-9.
8. Selby Jr, Cohn DJ, B. GKJ. Peripherally inserted tunnelled catheters: a new option for venous access. Minim Invasive Ther Allied Technol. 2001; 10(4-5):231-4.

13
JUMMEC 2017:20(2)ORIGINAL ARTICLE
EVALUATION OF DIFFUSION-WEIGHTED IMAGING AND APPARENT DIFFUSION COEFFICIENT MAPPING USING
DIFFERENT B-VALUES FOR MAGNETIC RESONANCE-GUIDED FOCUSED ULTRASOUND SURGERY: A
PRELIMINARY STUDY FOR UTERINE FIBROID AND ADENOMYOMA
Panicker A1, Abdullah BJJ1, Yaakup NA1, Wong YH1, Yeong CH1, Omar SZ2, Vijaynanthan A1 1 Department of Biomedical Imaging, Faculty of Medicine, University of Malaya, 50603 Kuala Lumpur, Malaysia2 Department of Obstetrics and Gynaecology, Faculty of Medicine, University of Malaya, 50603 Kuala Lumpur, Malaysia
Correspondence:Dr. Yeong Chai HongDepartment of Biomedical Imaging, Faculty of Medicine, University of Malaya, 50603 Kuala Lumpur, Malaysia.Email: [email protected]: +6016 7016875
ABSTRACTThe study was taken to assess the feasibility of diffusion-weighted imaging (DWI) and apparent diffusion coefficient (ADC) mapping using different b-values for magnetic resonance-guided focused ultrasound (MRgFUS) treatment of uterine fibroid and adenomyoma.
The contrast-enhanced T1-weighted image (cT1WI) as well as DWIs and ADC maps of different b-values (i.e. 200, 600 and 800 s/mm²) were obtained from nine fibroid and five adenomyoma patients, immediately after, and 12 months after MRgFUS treatment. The image contrast score, non-perfused volume (NPV) and NPV ratio obtained were compared to determine the feasibility of DWI and ADC mapping for MRgFUS treatment outcome evaluation.
Our finding showed that immediately after MRgFUS treatment, the DWI acquired using 200 s/mm² b-value gave the highest image contrast score among all other b-values. The NPV calculated from DWI of 200 s/mm² showed the best correlation (R² = 0.938) with post-contrast NPV. At 12 months follow-up, there was no specific b-value considered as significantly superior to others in terms of image contrast. However, the NPVs and NPV ratios obtained from all DWIs and ADC maps of different b-values were in good agreement with the post-contrast NPV and NPV ratio.
We observed that the DWI, particularly obtained with a low b-value (i.e. 200 s/mm²), is feasible for delineation and quantitative volumetric evaluation of the ablated region immediately after the MRgFUS treatment. At 12 months follow-up, both DWIs and ADC maps are feasible for NPV and NPV ratio calculation.
Keywords: Apparent Diffusion Coefficient (ADC), Diffusion-Weighted Imaging (DWI), Magnetic Resonance-Guided Focused Ultrasound (Mrgfus), Magnetic Resonance Imaging (MRI), Uterine Fibroid And Adenomyoma
IntroductionUterine fibroids and adenomyoma are benign pathological diseases that have affected women in the reproductive age group. These diseases have caused significant disability and morbidity in patients and constitute a major source of public healthcare cost worldwide (1, 2). Numerous therapeutic strategies such as hormone therapy, drug therapy, surgical intervention, uterine artery embolization and magnetic resonance-guided focused ultrasound
(MRgFUS) ablation, are available to treat uterine fibroids and adenomyoma (2-6). The MRgFUS is proven to be a feasible, safe, efficacious treatment for uterine fibroids and adenomyoma (7-14) by inducing coagulative necrosis, size reduction and functional loss of the lesion (7, 15). The treatment outcome of MRgFUS ablation is normally assessed by contrast-enhanced T1-weighted image (cT1WI) with the use of gadolinium-based magnetic resonance contrast agent.

14
ORIGINAL ARTICLE JUMMEC 2017:20(2)
Although cT1WI has been widely accepted as the gold standard for treatment outcome evaluation, several limitations are found with the technique. The application of contrast enhanced magnetic resonance imaging (MRI) could be limited due to patient allergies towards gadolinium. Further, overestimation of ablated volume may occur when there is a transient reduction of vascularity in non-treated fibroid tissue due to vessel spasm or other factors (16). Besides, the unknown hazardous potential and side effects of heating the contrast agent have limited the peri-procedural contrast enhanced imaging. Due to the same reason, additional treatment would need to be scheduled in the cases of incomplete ablation as MRgFUS is not recommended to be applied immediately after the contrast enhanced MRI scan. In view of the above, the method which could be used for peri- and post-procedural treatment outcome evaluation is therefore favourable.
The diffusion-weighted imaging (DWI) may be feasible to serve as a “functional parameter” to evaluate the peri- and post-procedural treatment outcome by displaying the contrast based on the differences in the water molecules diffusivity within intra- and extracellular spaces. Various studies have reported the use of DWI and apparent diffusion coefficient (ADC) mapping in monitoring and assessing the treatment outcomes of MRgFUS of the uterine fibroids and uterine artery embolization (17-23). However, the correlation between the quantitative volume measurements of the ablated fibroid or adenomyoma obtained from DWI or ADC map and post-contrast non-perfused volume (NPV) obtained from standard cT1WI are not known to be performed previously.
Hence, this study was taken to assess the feasibility of DWI and ADC map in quantitative treatment volume measurement, immediately after MRgFUS treatment and at 12 months follow-up. In particular, our aim was to investigate which image (DWI or ADC map) and which b-value (200, 600 or 800 s/mm2) would provide a better correlation to the standard cT1WI NPV results.
Methods
Patient populationPatients who have been diagnosed with uterine fibroid or adenomyoma were recruited in this study. The inclusion and exclusion criteria are as follows:
Inclusion Criteria:
• Premenopausal women older than 18 years or peri-menopausal women with a normal cervical smear and symptomatic fibroid or adenomyosis disease.
• Patients with confirmed fibroid disease or adenomyoma by clinical examination and deemed suitable for MRgFUS treatment.
Exclusion Criteria:
• Menstruating, pregnant or lactating women.
• Patients having contraindication to standard MR imaging, IV sedation or IV gadolinium chelate.
• Patients with suspected or confirmed uterine malignancy, other pelvic diseases or major systemic diseases.
• Patients showing extensive lower abdominal wall scarring which increases the risk of pain or skin burns.
Medical ethics approval was obtained from the Medical Ethics Committee, University of Malaya Medical Center (UMMC). All patients were counselled on the safety and risks of MRI examination and MRgFUS treatment procedure. Written informed consent about the treatment, the use of conscious sedation and gadolinium contrast agent was obtained from all patients.
Imaging protocolMRI scanning during pre-treatment, immediately after MRgFUS treatment and at 12 months follow-up, were performed on a 1.5 Tesla MRI scanner (Signa HDxt, General Electric Medical Systems, Wisconsin, USA). The T2-weighted (T2WI) fast spin echo sequences [repetition time (TR): 3200 - 4000 ms; echo time (TE): 90 - 110 ms, echo train length (ELT): 24], in sagittal and axial planes, were acquired relative to the orientation of the uterine cavity in 5 mm slices with 1 mm spacing. Then, the axial fat-saturated three dimensional (3D) gradient echo T1WI sequence (TR: 5.32; TE: 2.53 ms) and axial spin-echo T1WI sequence (TR: 536; TE: 11 ms) were acquired followed by additional axial spin-echo echo-planar diffusion-weighted imaging (SE-EPI-DWI) sequence (TR: 8000; TE: 69 ms; b-values: 200, 600 and 800 s/mm2). The ADC maps were constructed from the DWI data using the dedicated software. Following DWI, the contrast-enhanced imaging was performed using axial 3D gradient echo T1WI sequence after administration of 10 ml intravenous bolus of Gadopentetate Dimeglumine (Magnevist; Bayer HealthCare Pharmaceuticals Inc., Berlin, Germany).
Both pre- and post-contrast enhanced T1WI were used to determine the lesion’s viability while T2WI was used to measure and calculate the volume of the treatable fibroid or adenomyoma by assuming the volume (v) of a prolate ellipsoid using the following equation:
v = 43 π × L
2 × W2 × AP
2 (1)
where L, W and AP represent the length, width and anteroposterior length of the lesion in cm, respectively. The DWIs and ADC maps were used for quantitative volume assessment of the NPV.

15
JUMMEC 2017:20(2)ORIGINAL ARTICLE
Magnetic resonance-guided focused ultrasound treatmentThe MRgFUS treatment of all patients was performed in the prone position using the MRgFUS system (ExAblate® 2000, InSightec, Israel) following the standard procedure as described earlier (24). Patients were under conscious sedation and given optimized pain relief with the vital signs such as blood pressure and pulse rate being monitored throughout the procedure. The occurrence of any adverse events such as skin burns, bowel injury and sciatica was recorded during or immediately after the procedure. The patients were discharged after a minimum of 2 hours’ observation or until the effects of conscious sedation wore off.
Patient follow-upPatients were followed up at 12 months after MRgFUS procedure by a repeated routine pelvic MRI following the same imaging protocol as mentioned above.
Image analysisThe image contrast between the ablated and non-ablated regions on cT1WIs, DWIs and ADC maps, both immediately after the treatment and at 12 months follow-up, were evaluated by two senior radiologists using the scoring system below:
• Score 0: No contrast discernible. No DWI/ADC changes
• Score 1: Poor contrast with < 20% correlation with NPV post contrast
• Score 2: Below average contrast with 20 – 50% correlation with post-contrast NPV
• Score 3: Average contrast with 50% correlation with post-contrast NPV
• Score 4: Good contrast with 50 – 80% correlation with post-contrast NPV
• Score 5: Excellent contrast and > 80% correlation with post-contrast NPV
The NPVs were assessed from the cT1WIs, DWIs and ADC maps by two independent senior radiologists using the inherent volume calculation software in the MRI workstation (Signa HDxt 1.5T, General Electric Healthcare, USA). The radiologists independently and manually contoured the non-enhanced / devascularized regions by summation of sequential axial slices on the different MR images to calculate the NPV. All evaluation and measurement were performed under a blinded condition to avoid bias. The NPV ratios of the fibroid and adenomyoma were calculated by dividing the NPV with the lesion volume measured on the T2WI before the treatment.
Statistical analysisThe reproducibility of the image contrast scores and NPV values obtained from two independent radiologists were examined using interclass correlation coefficient
(ICC) where a coefficient of above 0.90 was considered as ‘good’ reliability. The image contrast scores, NPVs and NPV ratios as measured from CT1WIs well as from DWIs and ADC maps of different b-values, were compared in pairs using Wilcoxon signed-rank test, whereas the differences among the image contrast scores, NPVs and NPV ratios as measured on DWIs or ADC maps, were analyzed using Kruskal-Wallis test. A confidence interval of 95% was used and the difference was considered as statistically significant at p < 0.05. In addition, the linear regression analysis was performed and the correlation coefficient was calculated for the NPVs obtained from cT1WIs as well as from DWIs and ADC maps of different b-values. The statistical analysis was performed using SPSS statistical software (version 22.0, IBM, New York, USA).
Results
Patient characteristicsNine fibroid and five adenomyoma patients (39 ± 8 years old), with no concurrent medical disease or previous surgery, have participated in the study and all patients underwent MRgFUS treatment successfully. No adverse reaction was reported except that one patient experienced a mild degree of superficial abdominal skin burn immediately after treatment. Following MRgFUS treatment, eleven patients managed to be followed up after 12 months while two fibroid patients were lost in the follow-up and one adenomyoma patient had undergone a hysterectomy due to persistent menorrhagia. The flow of patients’ recruitment in the study is presented in Figure 1.
Figure 1: Flow chart of patient’s recruitment in the study
Lesion characteristicsSignal intensity changes were not noted in any of the cT1WIs, DWIs and ADC maps acquired before the treatment, indicating no necrosis or degeneration within the lesion. Immediately after the treatment, the ablated regions on DWIs demonstrated hyperintense signals, showing a good

16
ORIGINAL ARTICLE JUMMEC 2017:20(2)
visual agreement with the hypointense non-perfused regions on the cT1WIs. The signal intensity changes on ADC maps (mainly hypointense signals) appeared to be inconsistent and varied between different patients where some lesions showed a mixed and heterogeneous signal intensity change. At 12 months follow-up, despite some changes in size and appearance, the non-perfused regions were found persistent on the cT1WIs of all patients. The signal intensity of the ablated regions on DWIs and ADC maps appeared to be heterogeneous in some cases (mainly on ADC maps). Figures 2 and 3 showed the examples of MR images acquired during pre-treatment, immediately after treatment and at 12 months follow-up, for fibroid and adenomyoma patients, respectively.
Figure 2: Typical T2WI, cT1WI, DWIs and ADC maps (b-values = 200, 600 and 800 s/mm2) of uterine fibroid patient. (A) Before MRgFUS treatment: Pre-treatment MRI showed a hypointense uterine fibroid on axial T2WI which enhanced homogenously on cT1WI. No areas of restricted diffusion observed on DWI or ADC maps of different b-values before MRgFUS. (B) Immediately after the MRgFUS treatment: Non-perfused region was observed on cT1WI, DWIs and ADC maps. DWI of 200 s/mm2 showed a clearer non-perfused area compared to other DWIs and all ADC maps. (C) At 12 months follow-up: Non-perfused area on cT1WI persisted. Heterogeneous area was observed on all DWIs and ADC maps. The DWIs of different b-values showed a clearer delineation area than ADC maps
Figure 3: Typical T2WI, cT1WI, DWIs and ADC maps (b-values = 200, 600 and 800 s/mm2) of adenomyoma patient. (A) Before MRgFUS treatment: Sagittal T2WI showed focal adenomyosis with contrast enhancement on cT1WI. No areas of restricted diffusion seen on all DWIs and ADC maps of different b-values. (B) Immediately after the MRgFUS treatment: Non-perfused region was observed on cT1WI. Hyperintense area observed on DWIs while ADC maps showed no significant intensity changes. Clearer non-perfused area seen on DWI of 200 s/mm2 compared to other DWIs and all ADC maps. (C) At 12 months follow-up: Non- perfused area on cT1WI persisted. Non-perfused area was appreciated on the DWIs. A poor delineation of non-perfused area and poor contrast between ablated and non-ablated regions were observed on ADC maps due to low signal to noise ratio
Image contrast scoreA good inter-observer agreement (ICC = 0.992) were observed between the image contrast scores obtained from two independent radiologists and therefore an average reading was used in subsequent analysis. The image contrast scores of cT1WIs, DWIs and ADC maps of patients can be visualized from Figure 4 and the scores are listed in Supplementary Table 1. The cT1WI has demonstrated the best contrast between the ablated and non-ablated regions, and therefore was given a full score of 5.

17
JUMMEC 2017:20(2)ORIGINAL ARTICLE
The contrast scores of DWIs and ADC maps of different b-values obtained immediately after the treatment were significantly lower (p < 0.05) than the contrast score of cT1WIs (Figure 4A and Table 1). Significantly higher contrast scores (p < 0.05) were obtained from the DWIs compared to the ADC maps of the same b-values. Among the DWIs of different b-values, the DWI obtained with the lowest b-values of 200 s/mm2 has demonstrated the best contrast. However, the contrast scores obtained for DWIs of different b-values did not vary significantly (p = 0.238) from each other. The same observation was found for the ADC maps of different b-value where the p value of 0.989 was obtained from the Kruskal-Wallis test.
At 12 months follow-up, the image contrast scores of all DWIs and ADC maps were essentially lower (p < 0.05) than cT1WIs (Figure 4B). Although ADC maps did produce a poorer contrast compared to DWIs, however, the score difference between ADC maps and DWIs of different b-values were found not to be significant (p > 0.05). The contrast scores of DWIs of different b-values were also found not significantly different (p = 0.823) despite showing a generally better scores for DWIs of higher b-values (600 and 800 s/mm²). A minimal score difference between the ADC maps of different b-values (p = 0.885) were also observed.
Figure 4: Image contrast score obtained for DWIs and ADC maps, immediately after (A) and 12 months after (B) MRgFUS treatment
Table 1: Statistical comparison of contrast scores of cT1WI as well as DWIs and ADC maps of different b-values, immediately after MRgFUS treatment and at 12 months follow-up
Contrast Score p value
Statistical Significant
Immediately after MRgFUS Treatment
cT1WI
DWI200b 0.004 Significant
DWI600b 0.001 Significant
DWI800b 0.001 Significant
ADC200b 0.001 Significant
cT1WI ADC600b 0.001 Significant
ADC800b 0.001 Significant
DWI200b ADC200b 0.002 Significant
DWI600b ADC600b 0.024 Significant
DWI800b ADC800b 0.045 Significant
12 Months Follow-Up
cT1WI
DWI200b 0.005 Significant
DWI600b 0.003 Significant
DWI800b 0.003 Significant
ADC200b 0.003 Significant
cT1WI ADC600b 0.003 Significant
ADC800b 0.003 Significant
DWI200b ADC200b 0.066 Not Significant
DWI600b ADC600b 0.257 Not Significant
DWI800b ADC800b 0.414 Not Significant
Quantitative data analysis An inter-class coefficient of 1.00 has been obtained for the NPVs measured by two independent radiologists and hence the average NPV values were used in subsequent analysis. The NPVs of all patients measured on cT1WIs as well as on DWIs and ADC maps of different b-values, immediately after, and at 12 months after the treatment, are listed in Table 2. While the NPVs obtained from ADC maps of different b-values as well as from DWIs of 600 and 800 s/mm² were significantly different from the post-contrast NPV (p < 0.05) immediately after treatment, only the NPV obtained from DWI of 200 s/mm² were similar to the post-contrast NPV (p = 0.059). The NPVs obtained

18
ORIGINAL ARTICLE JUMMEC 2017:20(2)
from DWIs were also significantly different from the NPVs obtained from ADC maps at p < 0.05 (Table 3). At 12 months follow-up, the NPVs obtained from DWIs and ADC maps of different b-values were found similar to the post-contrast NPV (p > 0.05). The NPVs of DWIs and NPVs of ADC maps of the same b-value were also not significantly different (p > 0.05), except those obtained with b-value of 200 s/mm² (Table 3).
The linear regression analysis was performed on the NPVs obtained from DWIs, ADC maps and CT1WIs, both immediately after the treatment (Figure 5A–C), and at 12 months follow-up (Figure 5D–F). The NPVs obtained from DWIs of different b-values immediately after the treatment were found highly correlated with the post-contrast NPV as the correlation factors were all greater than 0.80. The NPV obtained from DWI of 200 s/mm² showed the strongest correlation to the post-contrast NPV at R2 = 0.983. In
comparison, the correlation between post-contrast NPV and NPVs of different ADC maps were found weaker (53–59%) immediately after the treatment (Figure 5A–C). The correlation between DWIs and ADC maps were found stronger (59–78%) than the correlation between NPVs of ADC maps and cT1WIs, with the strongest correlation found between DWI800b and ADC800b (R² = 0.783).
12 months follow-up, a good correlation (73–95%) was observed between the post-contrast NPV and the NPVs of DWIs and ADC maps of different b-values (Figure 5D–F). The NPVs of DWI200b and ADC200b map showed approximate 84% correlation with the post-contrast NPV, whereas slightly weaker correlations were observed for NPVs of DWIs and ADC maps of 600 and 800 s/mm². The correlation between the NPVs of DWIs and ADC maps of different b-values showed the strongest correlation (~98%) observed at 12 months follow-up (Figure 5D–F).
Figure 5: Linear regression analysis of the NPVs obtained from cT1WI, DWIs and ADC maps, immediately after (A–C), and 12 months after (D–F), MRgFUS treatment

19
JUMMEC 2017:20(2)ORIGINAL ARTICLE
Tabl
e 2:
Ave
rage
non
-per
fuse
d vo
lum
e (N
PV),
as m
easu
red
by tw
o ob
serv
ers
from
the
cT1W
I as
wel
l as
from
DW
Is a
nd A
DC
map
s of
diff
eren
t b-v
alue
s, im
med
iate
ly a
fter
MRg
FUS
trea
tmen
t and
at 1
2 m
onth
s fo
llow
-up
Patie
nt
NPV
Mea
sure
d Im
med
iate
ly a
fter T
reat
men
t (cm
3 )N
PV M
easu
red
at 1
2 M
onth
Fol
low
-Up
(cm
3 )
cT1W
IDW
IAD
C m
apcT
1WI
DWI
ADC
map
200b
600b
800b
200b
600b
800b
200b
600b
800b
200b
600b
800b
113
5.1
95.7
77.3
84.3
71.4
75.1
81.7
36.7
31.3
32.8
32.7
27.6
34.3
34.7
228
.737
.538
.133
.736
.137
.032
.642
.841
.241
.442
.038
.138
.439
.9
311
0.6
103.
997
.983
.310
2.6
96.4
80.1
114.
797
.385
.776
.694
.385
.274
.3
482
.081
.478
.073
.276
.773
.772
.6N
/AN
/AN
/AN
/AN
/AN
/AN
/A
548
.536
.337
.438
.921
.028
.237
.41.
91.
51.
61.
71.
51.
71.
7
616
3.3
168.
915
5.0
171.
916
7.5
153.
817
2.7
79.4
61.0
65.9
70.1
58.2
65.5
70.8
711
.9.0
.0.0
.0.0
.0.0
.0.0
.0.0
.0.0
856
.357
.960
.161
.258
.957
.857
.13.
442
.748
.049
.539
.845
.248
.2
976
.968
.161
.465
.712
.124
.425
.4N
/AN
/AN
/AN
/AN
/AN
/AN
/A
1042
.234
.624
.320
.014
.814
.114
.97.
9.0
.0.0
.0.0
.0
1177
.767
.562
.250
.0.0
.0.0
12.7
13.9
18.3
12.1
.0.0
.0
1250
.138
.729
.219
.737
.123
.421
.9N
/AN
/AN
/AN
/AN
/AN
/AN
/A
1316
.113
.713
.412
.811
.614
.112
.4.0
.0.0
.0.0
.0.0
1412
7.8
129.
913
3.3
95.2
28.4
34.1
32.8
8.6
.0.0
.0.0
.0.0
Lege
nds:
.0
No
abla
ted
regi
on d
isce
rnib
le. N
o m
easu
reab
le v
olum
eN
/A
N
ot a
vaila
ble
as p
atien
ts fa
iled
to fo
llow
-up
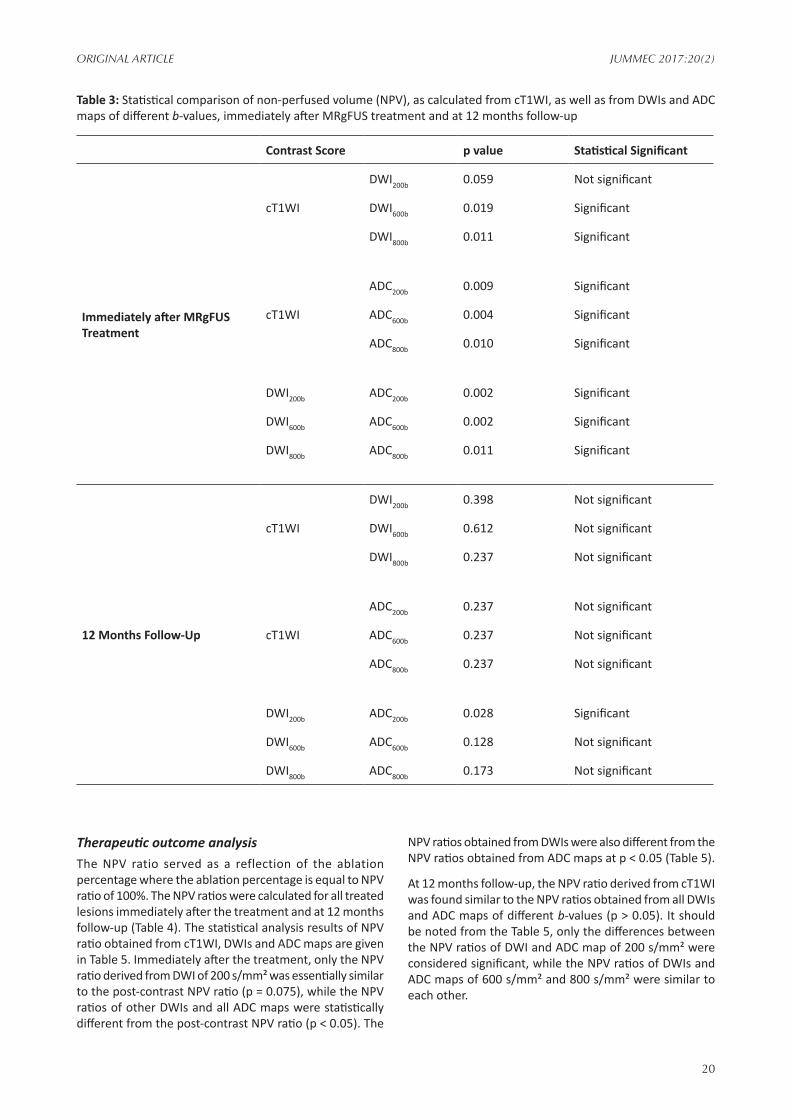
20
ORIGINAL ARTICLE JUMMEC 2017:20(2)
Table 3: Statistical comparison of non-perfused volume (NPV), as calculated from cT1WI, as well as from DWIs and ADC maps of different b-values, immediately after MRgFUS treatment and at 12 months follow-up
Contrast Score p value Statistical Significant
Immediately after MRgFUS Treatment
cT1WI
DWI200b 0.059 Not significant
DWI600b 0.019 Significant
DWI800b 0.011 Significant
ADC200b 0.009 Significant
cT1WI ADC600b 0.004 Significant
ADC800b 0.010 Significant
DWI200b ADC200b 0.002 Significant
DWI600b ADC600b 0.002 Significant
DWI800b ADC800b 0.011 Significant
12 Months Follow-Up
cT1WI
DWI200b 0.398 Not significant
DWI600b 0.612 Not significant
DWI800b 0.237 Not significant
ADC200b 0.237 Not significant
cT1WI ADC600b 0.237 Not significant
ADC800b 0.237 Not significant
DWI200b ADC200b 0.028 Significant
DWI600b ADC600b 0.128 Not significant
DWI800b ADC800b 0.173 Not significant
Therapeutic outcome analysis The NPV ratio served as a reflection of the ablation percentage where the ablation percentage is equal to NPV ratio of 100%. The NPV ratios were calculated for all treated lesions immediately after the treatment and at 12 months follow-up (Table 4). The statistical analysis results of NPV ratio obtained from cT1WI, DWIs and ADC maps are given in Table 5. Immediately after the treatment, only the NPV ratio derived from DWI of 200 s/mm² was essentially similar to the post-contrast NPV ratio (p = 0.075), while the NPV ratios of other DWIs and all ADC maps were statistically different from the post-contrast NPV ratio (p < 0.05). The
NPV ratios obtained from DWIs were also different from the NPV ratios obtained from ADC maps at p < 0.05 (Table 5).
At 12 months follow-up, the NPV ratio derived from cT1WI was found similar to the NPV ratios obtained from all DWIs and ADC maps of different b-values (p > 0.05). It should be noted from the Table 5, only the differences between the NPV ratios of DWI and ADC map of 200 s/mm² were considered significant, while the NPV ratios of DWIs and ADC maps of 600 s/mm² and 800 s/mm² were similar to each other.

21
JUMMEC 2017:20(2)ORIGINAL ARTICLE
Tabl
e 4:
Non
-per
fuse
d vo
lum
e (N
PV)
ratio
, as
mea
sure
d fr
om c
T1W
I as
wel
l as
from
DW
I and
AD
C m
aps
of d
iffer
ent
b-va
lues
, im
med
iate
ly a
fter
MRg
FUS
trea
tmen
t an
d at
12
-mon
ths
follo
w-u
p
Patie
nt
NPV
Mea
sure
d Im
med
iate
ly a
fter T
reat
men
t (cm
3 )N
PV M
easu
red
at 1
2 M
onth
Fol
low
-Up
(cm
3 )
cT1W
IDW
IAD
C m
apcT
1WI
DWI
ADC
map
200b
600b
800b
200b
600b
800b
200b
600b
800b
200b
600b
800b
10.
730.
520.
420.
450.
380.
400.
440.
200.
170.
180.
180.
150.
180.
19
20.
420.
550.
560.
500.
530.
540.
480.
630.
610.
610.
620.
560.
570.
59
30.
190.
180.
170.
140.
170.
160.
140.
200.
170.
150.
130.
160.
150.
13
40.
970.
970.
930.
870.
910.
880.
86N
/AN
/AN
/AN
/AN
/AN
/AN
/A
50.
660.
490.
510.
530.
280.
380.
510.
030.
020.
020.
020.
020.
020.
02
60.
330.
340.
310.
340.
330.
310.
340.
160.
120.
130.
140.
120.
130.
14
70.
06.0
.0.0
.0.0
.0.0
.0.0
.0.0
.0.0
80.
220.
220.
230.
230.
230.
220.
220.
010.
160.
180.
190.
150.
170.
18
90.
610.
540.
490.
520.
100.
190.
20N
/AN
/AN
/AN
/AN
/AN
/AN
/A
100.
150.
120.
090.
070.
050.
050.
050.
03.0
.0.0
.0.0
.0
110.
490.
430.
400.
32.0
.0.0
0.08
0.09
0.12
0.08
.0.0
.0
120.
080.
060.
040.
030.
060.
040.
03N
/AN
/AN
/AN
/AN
/AN
/AN
/A
130.
340.
290.
280.
270.
240.
290.
26.0
.0.0
.0.0
.0.0
140.
820.
830.
860.
610.
180.
220.
210.
06.0
.0.0
.0.0
.0
Lege
nds:
.0
No
abla
ted
regi
on d
isce
rnib
le. N
o m
easu
reab
le v
olum
e
N/A
Not
ava
ilabl
e as
pati
ents
faile
d to
follo
w-u
p

22
ORIGINAL ARTICLE JUMMEC 2017:20(2)
on the DWIs and ADC maps were formed due to, either the perfusion effect from vessel destruction during the treatment, or cytotoxic oedema. The DWI and ADC maps can be used to evaluate the peri- and post-procedural treatment outcome for MRgFUS treatment of uterine fibroid and adenomyoma. The peri-procedural monitoring using DWI and ADC maps could provide more information and feedback to the physician on the treatment planning and tumour ablation. For the post-procedural treatment outcome evaluation, the non-perfused region can be delineated from both the DWI and ADC maps for the determination of NPV and NPV ratio.
The DWI of 200 s/mm² has demonstrated the best image contrast and displayed the clearest visualization of the ablation border compared to other DWIs and ADC maps immediately after the treatment. This observation was in agreement with previously published data, suggesting the lower b-value would have produced a better image contrast (17, 23). The poorer image contrast of DWIs obtained with b-values of 600 s/mm² and 800 s/mm² can be ascribed to low signal-to-noise ratio due to shorter T2 relaxation times (25). Immediately after the treatment, the appearance of the treated regions on all the ADC maps appeared to be unpredictable, similar to those observed by Pilatou et al. (22). The treated regions on ADC maps showed significant areas of heterogeneity which perhaps reflected the differences in the tissue cellularity and properties. The poor contrast resolution of ADC maps obtained at lower b-values was also noticed as the result of low signal attenuation. However, a slight improvement in image resolution was appreciated in the ADC map of 800 s/mm² as a higher signal attenuation was achieved at the higher b-value.
At 12 months follow-up, the image contrast of both DWIs and ADC maps of different b-values were generally poor due to heterogeneity of the ablated region and hence yielded a lower image contrast score. Since no significant difference was noticed between the contrast scores of DWIs and ADC maps of different b-values, there was no specified b-value to be considered as superior in delineating the ablated region at 12 months follow-up. Our results appear to contradict earlier reports (17, 23) that suggested a better ADC map contrast was produced with higher b-values (400, 600 and 800 s/mm²) during 1 month follow-up due to the diffusion effects. Such differences noted can be ascribed to the different length of the follow-up period (1 month in the earlier reports against 12 months in our study). In view of this, a further investigation on a larger scale should be performed to determine the influence of different b-values on image contrast at different follow-up periods.
The NPVs as measured from the DWIs and ADC maps showed an under-estimated ablation volume in most of the patients when compared to the post-contrast NPV, both immediately after and 12 months after the treatment. The NPV derived from DWIs showed a better correlation to the post-contrast NPV compared to those obtained from ADC maps with the best correlation demonstrated by the DWI of 200 s/mm². The higher image contrast of the DWI obtained with b-value of 200 s/mm² has allowed a better delineation
Table 5: Statistical comparison of non-perfused volume (NPV) ratio, as calculated from cT1WI as well as from DWIs and ADC maps of different b-values, immediately after MRgFUS and at 12 months follow-up
Contrast Score p value
Statistical Significant
Immediately after MRgFUS Treatment
cT1WI
DWI200b 0.059Not significant
DWI600b 0.019 Significant
DWI800b 0.011 Significant
ADC200b 0.009 Significant
cT1WI ADC600b 0.004 Significant
ADC800b 0.010 Significant
DWI200b ADC200b 0.002 Significant
DWI600b ADC600b 0.002 Significant
DWI800b ADC800b 0.011 Significant
12 Months Follow-Up
cT1WI
DWI200b 0.398Not significant
DWI600b 0.612Not significant
DWI800b 0.237Not significant
ADC200b 0.237Not significant
cT1WI ADC600b 0.237Not significant
ADC800b 0.237Not significant
DWI200b ADC200b 0.028 Significant
DWI600b ADC600b 0.128Not significant
DWI800b ADC800b 0.173Not significant
DiscussionThe cT1WI is the gold standard for the assessment of a region or volume after MRgFUS treatment. Due to the relatively lower contrast uptake by the ablated region, it appeared as a hypointense region on cT1WI, and is known as a non-perfused region. The volume of the non-perfused region has been widely used for treatment effectiveness measurement. On the other hand, the ablated regions
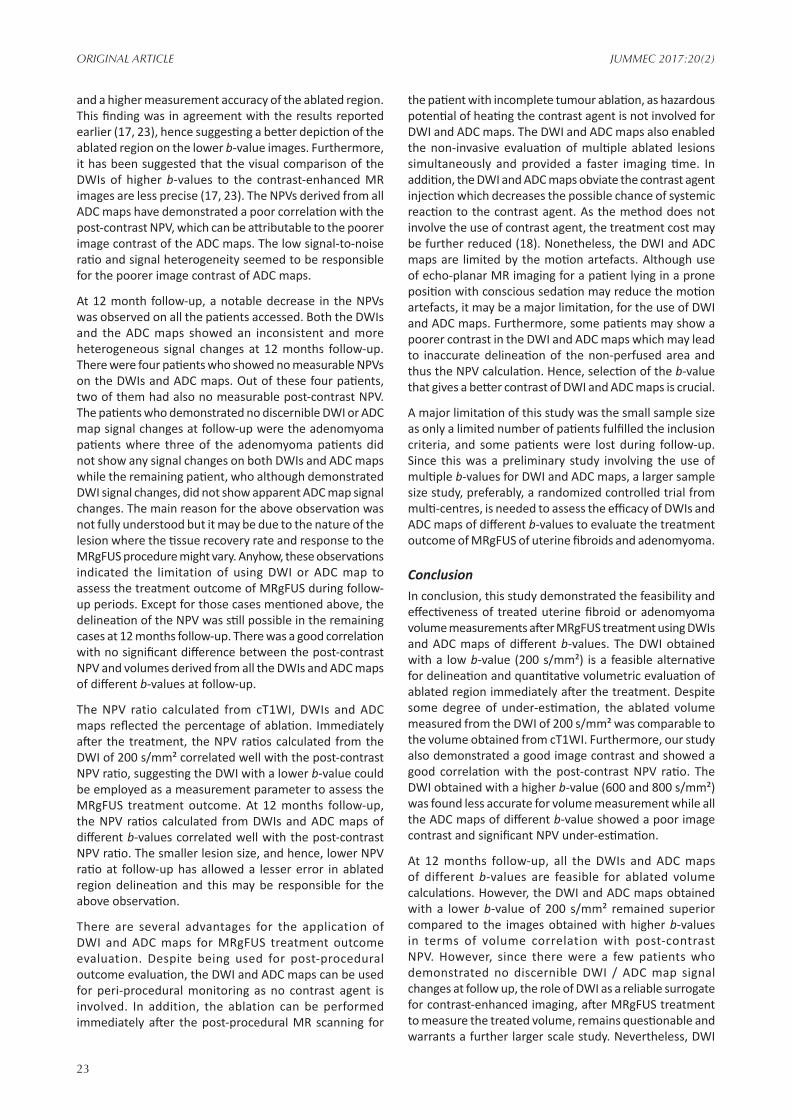
23
JUMMEC 2017:20(2)ORIGINAL ARTICLE
and a higher measurement accuracy of the ablated region. This finding was in agreement with the results reported earlier (17, 23), hence suggesting a better depiction of the ablated region on the lower b-value images. Furthermore, it has been suggested that the visual comparison of the DWIs of higher b-values to the contrast-enhanced MR images are less precise (17, 23). The NPVs derived from all ADC maps have demonstrated a poor correlation with the post-contrast NPV, which can be attributable to the poorer image contrast of the ADC maps. The low signal-to-noise ratio and signal heterogeneity seemed to be responsible for the poorer image contrast of ADC maps.
At 12 month follow-up, a notable decrease in the NPVs was observed on all the patients accessed. Both the DWIs and the ADC maps showed an inconsistent and more heterogeneous signal changes at 12 months follow-up. There were four patients who showed no measurable NPVs on the DWIs and ADC maps. Out of these four patients, two of them had also no measurable post-contrast NPV. The patients who demonstrated no discernible DWI or ADC map signal changes at follow-up were the adenomyoma patients where three of the adenomyoma patients did not show any signal changes on both DWIs and ADC maps while the remaining patient, who although demonstrated DWI signal changes, did not show apparent ADC map signal changes. The main reason for the above observation was not fully understood but it may be due to the nature of the lesion where the tissue recovery rate and response to the MRgFUS procedure might vary. Anyhow, these observations indicated the limitation of using DWI or ADC map to assess the treatment outcome of MRgFUS during follow-up periods. Except for those cases mentioned above, the delineation of the NPV was still possible in the remaining cases at 12 months follow-up. There was a good correlation with no significant difference between the post-contrast NPV and volumes derived from all the DWIs and ADC maps of different b-values at follow-up.
The NPV ratio calculated from cT1WI, DWIs and ADC maps reflected the percentage of ablation. Immediately after the treatment, the NPV ratios calculated from the DWI of 200 s/mm² correlated well with the post-contrast NPV ratio, suggesting the DWI with a lower b-value could be employed as a measurement parameter to assess the MRgFUS treatment outcome. At 12 months follow-up, the NPV ratios calculated from DWIs and ADC maps of different b-values correlated well with the post-contrast NPV ratio. The smaller lesion size, and hence, lower NPV ratio at follow-up has allowed a lesser error in ablated region delineation and this may be responsible for the above observation.
There are several advantages for the application of DWI and ADC maps for MRgFUS treatment outcome evaluation. Despite being used for post-procedural outcome evaluation, the DWI and ADC maps can be used for peri-procedural monitoring as no contrast agent is involved. In addition, the ablation can be performed immediately after the post-procedural MR scanning for
the patient with incomplete tumour ablation, as hazardous potential of heating the contrast agent is not involved for DWI and ADC maps. The DWI and ADC maps also enabled the non-invasive evaluation of multiple ablated lesions simultaneously and provided a faster imaging time. In addition, the DWI and ADC maps obviate the contrast agent injection which decreases the possible chance of systemic reaction to the contrast agent. As the method does not involve the use of contrast agent, the treatment cost may be further reduced (18). Nonetheless, the DWI and ADC maps are limited by the motion artefacts. Although use of echo-planar MR imaging for a patient lying in a prone position with conscious sedation may reduce the motion artefacts, it may be a major limitation, for the use of DWI and ADC maps. Furthermore, some patients may show a poorer contrast in the DWI and ADC maps which may lead to inaccurate delineation of the non-perfused area and thus the NPV calculation. Hence, selection of the b-value that gives a better contrast of DWI and ADC maps is crucial.
A major limitation of this study was the small sample size as only a limited number of patients fulfilled the inclusion criteria, and some patients were lost during follow-up. Since this was a preliminary study involving the use of multiple b-values for DWI and ADC maps, a larger sample size study, preferably, a randomized controlled trial from multi-centres, is needed to assess the efficacy of DWIs and ADC maps of different b-values to evaluate the treatment outcome of MRgFUS of uterine fibroids and adenomyoma.
ConclusionIn conclusion, this study demonstrated the feasibility and effectiveness of treated uterine fibroid or adenomyoma volume measurements after MRgFUS treatment using DWIs and ADC maps of different b-values. The DWI obtained with a low b-value (200 s/mm²) is a feasible alternative for delineation and quantitative volumetric evaluation of ablated region immediately after the treatment. Despite some degree of under-estimation, the ablated volume measured from the DWI of 200 s/mm² was comparable to the volume obtained from cT1WI. Furthermore, our study also demonstrated a good image contrast and showed a good correlation with the post-contrast NPV ratio. The DWI obtained with a higher b-value (600 and 800 s/mm²) was found less accurate for volume measurement while all the ADC maps of different b-value showed a poor image contrast and significant NPV under-estimation.
At 12 months follow-up, all the DWIs and ADC maps of different b-values are feasible for ablated volume calculations. However, the DWI and ADC maps obtained with a lower b-value of 200 s/mm² remained superior compared to the images obtained with higher b-values in terms of volume correlation with post-contrast NPV. However, since there were a few patients who demonstrated no discernible DWI / ADC map signal changes at follow up, the role of DWI as a reliable surrogate for contrast-enhanced imaging, after MRgFUS treatment to measure the treated volume, remains questionable and warrants a further larger scale study. Nevertheless, DWI

24
ORIGINAL ARTICLE JUMMEC 2017:20(2)
remains a useful method to evaluate the regions that have been thermally ablated by MRgFUS.
Conflict of interestsThe authors declare no conflict of interests.
AcknowledgementsThe authors thank the Department of Biomedical Imaging, University of Malaya and University of Malaya Medical Centre, for providing necessary facilities to carry out this work.
References1. Cramer SF, Patel A. The frequency of uterine
leiomyomas. Am J Clin Pathol. 1990; 94(4):435-8.2. Stewart EA. Uterine fibroids. Lancet. 2001;
357(9252):293-8.3. Carlson KJ, Nichols DH, Schiff I. Indications for
hysterectomy. N Engl J Med. 1993; 328(12):856-60.4. Parker WH. Uterine myomas: management. Fertil
Steril. 2007; 88(2):255-71.5. Pron G, Bennett J, Common A, Wall J, Asch M,
Sniderman K. The Ontario uterine fibroid embolization trial. Part 2. Uterine fibroid reduction and symptom relief after uterine artery embolization for fibroids. Fertil Steril. 2003; 79(1):120-7.
6. Gynecologists ACoOa. Surgical alternatives to hysterectomy in the management of leiomyomas acog practice bulletin #16. Int J Gynaecol Obstet. 2000:285-94.
7. Dong X, Yang Z. High-intensity focused ultrasound ablation of uterine localized adenomyosis. Curr Opin Obstet Gynecol. 2010; 22(4):326-30.
8. Fukunishi H, Funaki K, Sawada K, Yamaguchi K, Maeda T, Kaji Y. Early results of magnetic resonance-guided focused ultrasound surgery of adenomyosis: Analysis of 20 cases. J Minim Invasive Gynecol. 2008; 15(5):571-9.
9. Gedroyc WM. MR-guided focused ultrasound treatment of uterine fibroids. In: Kahn T, Busse H, editors. Interventional Magnetic Resonance Imaging. Berlin, Heidelberg: Springer Berlin Heidelberg. 2012:341-8.
10. Hesley GK, Felmlee JP, Gebhart JB, Dunagan KT, Gorny KR, Kesler JB, et al. Noninvasive treatment of uterine fibroids: early Mayo clinic experience with magnetic resonance imaging-guided focused ultrasound. Mayo Clin Proc. 2006; 81(7):936-42.
11. Morita Y, Ito N, Hikida H, Takeuchi S, Nakamura K, Ohashi H. Non-invasive magnetic resonance imaging-guided focused ultrasound treatment for uterine fibroids – early experience. Eur J Obstet Gynaecol Reprod Biol. 2008; 139(2):199-203.
12. Rabinovici J, Stewart EA. New interventional techniques for adenomyosis. Best Pract Res Clin Obstet Gynaecol. 2006; 20(4):617-36.
13. Stewart EA, Rabinovici J, Tempany CMC, Inbar Y, Regan L, Gastout B, et al. Clinical outcomes of focused
ultrasound surgery for the treatment of uterine fibroids. Fertil Steril. 2006; 85(1):22-9.
14. Yoon S-W, Kim KA, Cha SH, Kim YM, Lee C, Na Y-J, et al. Successful use of magnetic resonance–guided focused ultrasound surgery to relieve symptoms in a patient with symptomatic focal adenomyosis. Fertil Steril. 2008; 90(5):2018.e13-.e15.
15. Hindley J, Gedroyc WM, Regan L, Stewart E, Tempany C, Hynnen K, et al. MRI guidance of focused ultrasound therapy of uterine fibroids: Early results. Am J Roentgenol. 2004; 183(6):1713-9.
16. Hesley G, Gorny K, Woodrum D. MR elastography following focused ultrasound treatment of uterine fibroids. J Ther Ultrasound. 2014; 2(Suppl 1):A13-A.
17. Ikink ME, Voogt MJ, Bosch MAAJ, Nijenhuis RJ, Keserci B, Kim Y-s, et al. Diffusion-weighted magnetic resonance imaging using different b-value combinations for the evaluation of treatment results after volumetric MR-guided high-intensity focused ultrasound ablation of uterine fibroids. Eur Radiol. 2014; 24(9):2118-27.
18. Jacobs MA, Herskovits EH, Kim HS. Uterine fibroids: Diffusion-weighted MR imaging for monitoring therapy with focused ultrasound surgery-preliminary study. Radiology. 2005; 236(1):196-203.
19. Jacobs MA, Gultekin DH, Kim HS. Comparison between diffusion-weighted imaging, T(2)-weighted, and postcontrast T(1)-weighted imaging after MR-guided, high intensity, focused ultrasound treatment of uterine leiomyomata: Preliminary results. Med Phys. 2010; 37(9):4768-76.
20. Jacobs MA, Ouwerkerk R, Kamel I, Bottomley PA, Bluemke DA, Kim HS. Proton, diffusion-weighted imaging, and sodium (23Na) MRI of uterine leiomyomata after MR-guided high-intensity focused ultrasound: A preliminary study. J Magn Reson Imaging. 2009; 29(3):649-56.
21. Liapi E, Kamel IR, Bluemke DA, Jacobs MA, Kim HS. Assessment of response of uterine fibroids and myometrium to embolization using diffusion-weighted echoplanar MR imaging. J Comput Assist Tomogr. 2005; 29(1):83-6.
22. Pilatou MC, Stewart EA, Maier SE, Fennessy FM, Hynynen K, Tempany CMC, et al. MRI-based thermal dosimetry and diffusion-weighted imaging of MRI-guided focused ultrasound thermal ablation of uterine fibroids. J Magn Reson Imaging. 2009; 29(2):404-11.
23. Voogt MJ, Keserci B, Kim YS, Rhim H, Lim HK, Mougenot C, et al. Diffusion weighted MR imaging to evaluate treatment results after volumetric MR-guided high intensity focused ultrasound of uterine fibroids: Influence of different b-values. AIP Conference Proceedings. 2011; 1359(1):483-7.
24. Abdullah BJJ, Subramaniam RV, Omar SS, Wragg P, Ramli N, Wui AL, et al. Magnetic resonance-guided focused ultrasound surgery (MRgFUS) treatment for uterine fibroids. Biomed Imaging Interv J. 2010; 6(2):e15.

25
JUMMEC 2017:20(2)ORIGINAL ARTICLE
25. Dietrich O, Biffar A, Baur-Melnyk A, Reiser MF. Technical aspects of MR diffusion imaging of the body. Eur J Radiol. 2010; 76(3):314-22.

26
ORIGINAL ARTICLE JUMMEC 2017:20(2)
THE EXPERIMENTAL ASSESSMENT OF BUILD UP FACTOR AND ATTENUATION COEFFICIENT OF BRASS COMPENSATOR APPLIED IN INTENSITY-MODULATED
RADIATION THERAPY (IMRT) FOR 6MV PHOTON BEAM
Elnaz B1, Peyman H2*, Abbas H3, Raheb G4, Zaker S5
1,2 Department of Medical Physics, Semnan University of Medical Sciences, Semnan, Iran3 Department of Medical Physics, Kermanshah University of Medical Sciences, Kermanshah, Iran4 Department of Epidemiology, Semnan University of Medical Sciences, Semnan, Iran5 Department of Radiation Sciences, Lorestan University of Medical Sciences, Lorestan, Khorramabad, Iran
Correspondence:Peyman Hejazi (PhD)Semnan University of Medical Sciences,Department of Medical Physics,Semnan, Iran Email: [email protected]
ABSTRACTIntroduction: Recent compensators are commonly applied in IMRT. The precise properties of applied compensators such as thickness, attenuation coefficient and build up factor are intensively important for IMRT calculations.
Method: The brass compensator used for 6 MV photon beam was studied to estimate the relative effect of thickness and field size on IMRT calculations. Various field size together with several compensator thicknesses were examined.
Result: The average reduction of effective attenuation coefficient (EAC), for the fields of 10×10 cm2 to 20×20 cm2, was 9.94%. By increasing the field size, EAC was decreased. The major reduction of EAC due to increasing field size was found to be 9.62%. The build up factor was increased by 2% to 21.8% respect to field size and compensator thickness. Also, the build up factor was increased by adding up the thickness. The rate of changes ranged from 24% to 48 %.
Conclusion: The compensator thickness and field size are significantly important to calculate the effective attenuation coefficient and build up factor.
Keywords:Intensity Modulated Radiation Therapy, Compensators, Brass, Effective Attenuation Coefficient, Build up Factor
Introduction: Radiotherapy is one of the effective methods in the treatment of cancer. It is used alone or in combination with surgery or chemotherapy. Half of the cancer patients use radiotherapy as a part of their treatment(1-3). The primary goal of radiotherapy is to deliver the highest dose to cancerous tissue and the lowest to normal organs(2, 4, 5). As the tumor is not isolated, it is not possible to irradiate tumor cells alone. Also, success in removing the tumor depends on technical factors(6). In addition, for an appropriate treatment, accurate definition and description of tumor and treatment volume, high daily repeatability of patient positioning, and accurate dose
delivery to the target volume with an appropriate dose of gradient to critical organs and healthy tissues are required. When some of these requirements are not met, a part of tumor may receive lower dose, and eliminate the chance of cancer cell proliferation would happen(7). In the recent methods of radiotherapy, intensity modulated radiotherapy (IMRT) technique is used, which needs very accurate calculations. In IMRT, the output of the beam must be accurately transferred to the depth of interest in tissue, while in different parts of the target volume and under risk organs in the beam path, various intensities of beam should be received. In other words, the uniform intensity of the output beam from the accelerator

27
JUMMEC 2017:20(2)ORIGINAL ARTICLE
should be modulated in treatment volume(8, 9). Inverse planning method is used in IMRT to calculate the dose in the treatment volume. Target volume and critical organs are determined by CT scan images of tumors. Then the maximum, minimum, and average permissible doses are determined by TPS. TPS software propose several fields based on the optimization algorithm for which it is defined. In these fields, changes in the relative dose are indicated in each area, which show dose changes relative to the uniform open field. The process is called modulated intensity plan. To reach the dose levels, fields must be planned and implemented in accordance with the specification set via treatment planning software. TPS determines there are two ways to deliver radiation dose in IMRT: multileaf collimator and compensators(8-10). The advantages of using compensators are increasing the efficiency of patient treatment, and providing continuous dose. Other benefits of compensators are faster quality assurance program performance, easier dosimetry data management, less running time, less erosion of the accelerator, and lower requirement of shield in treatment room(11). Recently, tendency to use compensators for IMRT treatment has increased(12). The formula used to calculate the thickness of compensator is as follows(8):
𝑥𝑥 = − 1µ𝑒𝑒𝑒𝑒𝑒𝑒
ln( 𝐷𝐷𝐷𝐷0)
Eq.1
is the relative dose; µeff is the attenuation coefficient of the compensator, and x is the thickness of the compensator(8). The thickness of the treatment planning software (TPS) can be sent to an automatic analysing system (such as, Parscientific, Model ACD-3, Odense, Denmark), and the compensator volume can be exploited(13). In the method of constructing compensators, using automatic analysing machines, the maximum reported error in the beam intensity as compared to the ideal state is ±2.5%, which is the half of acceptable error by ICRU(14).
The exact calculation for the optimal dose delivery with acceptable error level to the desired depth therapy is crucial to fabricate a compensator. therefore, the exact calculation of effective attenuation coefficient of the compensator is an important factor. Effective attenuation coefficient of the compensator is not only dependent on the material and the nominal energy of the accelerator, but also it changes by variations in radiation conditions. The other important factors influence on the attenuation coefficient of the compensator are the sizes of treatment field size and compensator thickness(15, 16). In several studies, µeff is calculated using various materials by Mont Carlo simulation (MC) (17-19) or experimental measurements(20) in various radiotherapy conditions. But the error rate in providing doses needs to be calculated due to the lack of the consideration of factors affecting attenuation coefficient of brass compensator. In the present research, after studying the changes in the effective attenuation coefficient based on the field size and compensator thickness, the error rate was calculated. The Buildup factor was also studied in this
research. Considering to this fact that scattering particles are produced at the presence of compensator, therefore the build up factor which is used for counting the primary and scattered radiations can be applied for any definite geometry(21).
Methods and MaterialsThe applied brass alloys in this study was commercial brass contains:FCD (Cuzn39pb3) with 3% lead, 61.5% copper, and 35.5% zinc casted and constructed by cold rolling. Using dosimeter MapCHECK 2 model 1177, solid phantom, and SP34 (Solid Phantom 34), the effect of compensator thickness and field size on the effective attenuation coefficient and build up factor of the compensator was assessed by photon 6 MV Elekta SL 75/25 medical linear accelerator. For all irradiations carried out by 100MU, the distance to phantom surface was set to 100cm. The brass compensator of various thicknesses was placed in the tray at the distance of 672 mm from the accelerator. Dose measurements in all conditions were carried out in solid water phantom at the depth of 5cm (equivalent to tissue) by MapCHECK 2 dosimeter. To calculate the effective attenuation coefficient, Eq1. was applied. In this equation, D is the measured dose in the field with compensator; D0 is the measured dose in the field without compensator; µeff is the effective attenuation coefficient and x is compensator thickness was including 0.5, 1, 1.5, 2, 3, 4, 5, and 6 cm. The compensator was placed 672 mm in front of the head of gantry. In this section, the absorbed dose was measured with and without compensator at the depth of 5 cm in solid water phantom. Then, it was re-measured (D) for each thickness of the same depth. The field size for the thicknesses was ranged from 1×1 cm2 to 20×20 cm2. The effective attenuation coefficient of square fields for dimensions of 1, 2, 3, 4, 6, 8, 10, 15, and 20 cm and the thicknesses of 1, 1.5, 2, 3, 4, 5, and 6 cm was calculated by experimental measurements. For the photon beams, from 6MV to 18MV energy, the measurement error of MapCHECK dosimeter for dose values more than 8cGy was less than 1%(22). All the measurements were conducted for the photon beam of 6 MV with the dose of 100 cGy.
Build up Factor Calculations:The effective attenuation coefficient vs field size was depicted by Excel 2013. The proportional quadrative equation was then found. The linear attenuation coefficient was derived by extrapolation to field size of 0×0. The depth dose at this hypothetical field size results from primary radiation (scattered radiations will not change the depth dose at this field size). The build up factor of square fields for dimensions of 1, 2, 3, 4, 6, 8, 10, 15, and 20 cm and the thicknesses of 1, 1.5, 2, 3, 4, 5, and 6 cm was calculated by experimental measurements.
Uncertainty in dose calculations:The following formula was used to calculate the error percentage:

28
ORIGINAL ARTICLE JUMMEC 2017:20(2)
%ε = |𝑒𝑒−µ𝑒𝑒𝑒𝑒𝑒𝑒(𝑥𝑥,𝐹𝐹)𝑥𝑥−𝑒𝑒−µ𝑒𝑒𝑒𝑒𝑒𝑒(𝑥𝑥=1 𝑐𝑐𝑐𝑐,𝐹𝐹=10×10 𝑐𝑐𝑐𝑐2)𝑥𝑥
𝑒𝑒−µ𝑒𝑒𝑒𝑒𝑒𝑒(𝑥𝑥,𝐹𝐹)𝑥𝑥 | × 100 Eq2.
µeff, x, F and ε are effective attenuation coefficient, compensator thickness, field size and error level, respectively.
Results: Figure 1 and Figure 2 show the changes in the effective attenuation coefficient versus compensator thickness and field size.
Figure 1. Variation of the µeff vs. compensator thickness for various field sizes.1 Effective Attenuation Coefficient
2 Side of square field
Figure 2. Variation of the µeff vs. the field size for various thicknesses of brass.1 Effective Attenuation Coefficient 2 Thickness of compensator
The maximum acceptable error in radiotherapy is 5% that 3% of which is because of the error of measurements and dosimeter calculations, and the rest 2% refers to the treatment planning error(22). The error calculations, Table1, indicates that compensator thickness and field size potentially leads to more than 20% error in dose delivery of the treatment volume in the calculation of the effective attenuation coefficient.
Table 1. The error in dose delivery for thickness and field size
Thickness (cm)
0.5 cm
1 cm
1.5 cm
2 cm
3 cm 4 cm 5 cm
6 cm
Fie
ld si
ze (c
m2 )
1×1 cm2 1.7 1.8 1.4 0.4 1.5 4.7 7.7 10.2
2×2 cm2 1.4 1.4 0.5 0 2.1 4.7 8.1 10.8
3×3 cm2 1.3 1.3 0.3 0.2 2.7 53.1 8.6 10.8
4×4 cm2 1.2 1.1 0.2 0.2 3 5.1 8.6 11.3
6×6 cm2 1.2 1 0 0.6 3 5.8 8.6 11.8
8×8 cm2 1.1 0.5 0.2 1.2 3.2 6.6 10.4 13.4
10×10 cm2 0.6 0 0.7 1.8 4.4 6.9 10.9 13.4
15×15 cm2 0 1.2 2.5 4.5 8.3 12 16.9 20.9
20×20 cm2 1 3 5 7.3 11.6 16.8 22.1 26.4
Figure 3. Variation of the buildup factor vs. the field size for various thicknesses of brass.
Build up factor results:Figure 3 and Figure 4 show the changes of build up factor vs field size and thickness of brass compensator respectively.
Figure 4. Variation of the buildup factor vs. compensator thickness for various field sizes.
Discussion:The reduction in the effective attenuation coefficient by increasing thickness relates to the field size. As an average, µeff decreased the effective attenuation coefficient by 11.57%. For the fields of 10×10 cm2 to 20×20 cm2, the average reduction of the effective attenuation coefficient was 9.94% in Figure 1. By increasing the field size, the

29
JUMMEC 2017:20(2)ORIGINAL ARTICLE
effective attenuation coefficient was decreased. The major reduction of the effective attenuation coefficient due to increasing field size was found to be 9.62%. This results is confirmed by a previous study carried out by T. Bartrum and his team(16). They showed that there is a significant correlation between the effective coefficient of brass and field size for 6 MV beam, so that the effective attenuation coefficient decreases with increasing field size. The results obtained by them show 2.5% disparity with the measurements of this study, which could be due to the difference in depth of measurement. By adding up the thickness from 0.5 cm to 2 cm, the effective attenuation coefficient decreased by 12.18% averagely. By adding up the thickness from 2 to 6 cm, the average decrease of the effective attenuation coefficient was obtained as 10.07 in Figure 2.
As it is illustrated in Figure 3, the build up factor is increased by 2% to 21.8% with field size and compensator thickness. Furthermore, the build up factor was increased by adding up the thickness (Figure 4). The rate of changes ranged from 24% to 48 %. One of the possible reasons for this increase is Compton scattering, considering to this fact that the probability of compton scattering increases with the number of electrons. It must be mentioned that the minimum and maximum values were obtained for the filed sizes of 1×1 and 20×20, respectively.
Conclusion:In this study, the effect of changes in the thickness of brass compensator and field size on µeff and build up factor were assessed to be applied in IMRT. The results revealed that by increasing the thickness and field size, µeff was decreased. This study also demonstrated that the lack of consideration of compensator thickness and field size can lead to more than 20% error rate in dose delivery in the treatment volume. In other words, precise determination of compensator thickness and field size is significantly important for µeff calculation. The results of this study also showed that the build up factor increases by increasing field size and thickness of brass compensator.
References:1. Souhami R, Tobias JS. Cancer and its management:
John Wiley & Sons. 2008.2. Hopkins DN. Determination of the linear attenuation
coefficients and buildup factors of MCP-96 alloy for use in tissue compensation and radiation protection: Ball State University. 2010.
3. Swinnen A. Quality assurance in radiotherapy: Development and validation of a mailed dosimetry procedure for external audits using a multipurpose phantom and in vivo dosimetry: Katholieke Universiteit Leuven. 2005.
4. Khadija M. A clinical comparison and analysis between conventional MLC based and solid compensator based IMRT treatment techniques. 2009.
5. Sasaki K, Obata Y. Dosimetrical characteristics of a cubic-block-piled compensator for intensity-modulated radiation therapy. Journal of Applied Clinical Medical Physics. 2007;8(1).
6. Halperin EC, Perez CA, Brady LW. Perez and Brady’s principles and practice of radiation oncology: Lippincott Williams & Wilkins. 2008.
7. Newhauser W. International Commission on Radiation Units and Measurements Report 78: Prescribing, Recording and Reporting Proton-beam Therapy. Radiation Protection Dosimetry. 2009.
8. Khan FM, Gibbons JP. Khan’s the physics of radiation therapy: Lippincott Williams & Wilkins. 2014.
9. Webb S. Intensity-modulated radiation therapy: CRC Press. 2001.
10. Webb S. The physical basis of IMRT and inverse planning. The British journal of radiology. 2014.
11. BakaI A, Laub W, Nusslin F. Compensators for IMRT–An Investigation in Quality Assorance. Zeitschrift fur Medizinische Physik. 2001;11(1):15-22.
12. Chang S. Compensator-intensity-modulated Radiotherapy—A traditional tool for modern application. US Oncological Disease. 2006:1-4.
13. Partridge M, Donovan E, Fenton N, Reise S, Blane S. Clinical implementation of a computer controlled milling machine for compensating filter production. The British journal of radiology. 1999;72(863):1099-103.
14. Meyer J, Mills J, Haas O, Parvin E, Burnham K. Some limitations in the practical delivery of intensity modulated radiation therapy. The British journal of radiology. 2000;73(872):854-63.
15. Dimitriadis D, Fallone B. Compensators for intensity-modulated beams. Medical Dosimetry. 2002;27(3):215-20.
16. Bartrum T, Bailey M, Nelson V, Grace M. Linear attenuation coefficients for compensator based IMRT. Australasian Physics & Engineering Sciences in Medicine. 2007;30(4):281-7.
17. Du Plessis F, Willemse C. Monte Carlo calculation of effective attenuation coefficients for various compensator mater ia ls . Medical phys ics . 2003;30(9):2537-44.
18. Salehi Z, Ali NY, Yusoff A. X-ray spectra and quality parameters from Monte Carlo simulation and analytical filters. Applied Radiation and Isotopes. 2012;70(11):2586-9.
19. Jurkovic S, Zauhar G, Bistrovic M, Faj D, Kaliman Z, Radojcic DS. An alternative approach to compensators design for photon beams used in radiotherapy. Nuclear Instruments and Methods in Physics Research Section A: Accelerators, Spectrometers, Detectors and Associated Equipment. 2007;580(1):530-3.
20. Attix FH. Introduction to radiological physics and radiation dosimetry: John Wiley & Sons; 2008.
21. Li JG, Yan G, Liu C. Comparison of two commercial detector arrays for IMRT quality assurance. Journal of applied clinical medical physics. 2009;10(2).

30
ORIGINAL ARTICLE JUMMEC 2017:20(2)
22. Jones D. ICRU report 50—prescribing, recording and reporting photon beam therapy. Medical physics. 1994;21(6):833-4.

31
JUMMEC 2017:20(2)CASE REPORT
PULMONARY REHABILITATION USING MECHANICAL INSUFFLATION-EXSUFFLATION THERAPY FOR
SPINAL CORD INJURY – TWO CASE STUDIES IN THE UNIVERSITY MALAYA MEDICAL CENTRE
Tan JH, Aishah A Fauzi, Hasnan N Department of Rehabilitation Medicine, Faculty of Medicine, University of Malaya, 50603 Kuala Lumpur, MALAYSIA
Correspondence:Aishah Ahmad FauziDepartmennt of Rehabilitation Medicine, Faculty of Medicine, University of Malaya, 50603 Kuala Lumpur, Malaysia Email: [email protected]
ABSTRACTThere is a high incidence of 36% to 83% of respiratory dysfunction in patients with acute cervical spinal cord injury. Complications arising from respiratory dysfunction remain one of the most common causes of morbidity and mortality in the spinal cord injured population. Specialized pulmonary care and therapy can help individuals with tetraplegia to maintain a stable respiratory status allowing active participation in active rehabilitation. This would allow them to achieve rehabilitation goals of independent function and community reintegration. Mechanical insufflation-exsufflation (MIE) therapy is an option for secretion management in individuals with acute spinal cord injury. In this paper, we present our experience using MIE as an adjunct to management of secretions in the spinal cord injured population at the University of Malaya Medical Centre.
Keywords: Mechanical Insufflation-Exsufflation, Spinal Cord Injury, Respiratory Dysfunction
IntroductionRespiratory dysfunction is a major cause of morbidity and mortality in spinal cord injury (SCI) (1). Following SCI at the cervical and thoracic region, there is paralysis or weakness of the respiratory muscles with a reduction of vital capacity and lung and chest wall compliance. This results in breathing difficulties as well as an excessive effort during breathing. Patients will have an ineffective cough mechanism, which causes difficulty in the mobilisation of bronchial secretions (2). Secretion retention and autonomic dysfunction are additional factors that contribute to a worsening of respiratory status leading to a delay in access to other aspects of SCI focused rehabilitation.
The cough mechanism is an essential part in the removal of secretions. It has three components: an inspiratory phase, a compressive phase when the closure of the glottis together with the contraction of the expiratory muscles generates an increased intrathoracic pressure, and an expulsive phase resulting from the sudden opening of the glottis (3).The peak cough flow (PCF), a measure of the ability to produce a cough, can be used as an indicator of the effectiveness of secretion clearance from the airways. PCF can also be used to predict a potential failure in extubation
or decannulation for patients with respiratory failure, who are receiving ventilation through an endotracheal tube or a tracheostomy(4).
Aggressive management of atelectasis and secretions are the cornerstones of treatment of respiratory dysfunction following acute SCI (5). Suctioning, manually assisted cough, percussion and postural drainage are methods commonly employed. Mechanical insufflation-exsufflation therapy (MIE) is a non-invasive method used as an adjunct intervention for secretion management of our patients with acute SCI. With this method, insufflation with positive pressure is applied to the airway via a mechanical device, either through a tracheostomy or a mouthpiece. Immediately following this, an exsufflation with a negative pressure is then created in the airway, which generates an air flow similar to a cough (2).
MIE is not yet recognised as an essential step in standard guidelines for respiratory management for spinal cord injury of patients either in intensive care or a ward setting. We present reports of two patients with acute traumatic spinal cord injury with tetraplegia where MIE was successfully used as an adjunct to management of secretions, to illustrate the benefits of MIE.

32
CASE REPORT JUMMEC 2017:20(2)
Case 1A 42-year-old Chinese gentleman with no previous medical illness allegedly fell from a height of a one-storey building and sustained C5 fracture dislocation with a complete transection of the spinal cord, and a closed fracture of the distal end of the left radius. On presentation, he received 3L/min of oxygen via nasal prongs. A posterior decompression with a lateral mass fusion of C3-C6 and an internal fixation of the radius were done. He had a neurological level of C5 AIS A. Post-operatively, there was difficulty in weaning him from the ventilator. This was further complicated by recurrent hospital-acquired infections. Despite undergoing bronchoscopy three times during his stay in the ICU, there were persistent consolidation and collapse of his right lung from mucus plugging. He required ventilator support for three months before he could be transferred out of the Intensive Care Unit (ICU) into the rehabilitation ward.
In ICU, he received chest physiotherapy, with chest percussions, deep breathing exercises and endotracheal suctioning on a twice-daily basis. He was also started on mucolytic agents. Manual assisted cough methods were taught to his caregiver. MIE therapy was started on a daily basis after a month in the ICU. He received 6-8 cycles with 20-30 seconds of rest in between cycles. He was gently and gradually started with a lower pressure regime of ±25 cmH20, which was gradually increased by ±5 cmH20 each week until he was able to tolerate pressures of ±40 cmH20. This regime was continued until six months following admission when he was finally weaned to room air. The effectiveness of respiratory management with MIE was monitored using Peak Cough Flow (PCF). Table 1 illustrated the charted PCF during his stay.
Table 1: Serial peak cough flow (PCF) readings during hospitalisation of the patient (case 1) in the inpatient rehabilitation ward.
Rehabilitation stay
PCF (Liter/ min) pre MIE
PCF (Liter/ min) post MIE
5th month 120 150
6th month 160 180-190
At discharge 175 190-200
Case 2A 51-year-old Chinese gentleman with underlying diabetes mellitus and hypertension was admitted for the removal of a C5-T2 intramedullary tumour. Post-operatively, he developed bilateral upper limb and lower limb weakness. He required prolonged ventilation and a tracheostomy was performed for him. His stay was further complicated by a cardiac event and hospital-acquired pneumonia. He was transferred to the rehabilitation ward, six weeks after the operation.
He was reviewed on a daily basis by the chest physiotherapist, and he received multiple therapies including inspiratory
muscle exercises, manual assisted cough techniques, pharmacological intervention with nebulization of bronchodilators and mucolytic agents, and endotracheal suctioning. However, there was difficulty in weaning off oxygen support due to his thick and copious secretions. He was started on MIE therapy with daily 8-10 cycles, with 30-60 seconds in between cycles. Insufflation-exsufflation pressures were gradually increased on a weekly basis from ±25 cmH20, and after six weeks, he was able to tolerate pressures of ±40 cmH20. He tolerated MIE and was weaned off oxygen at the postoperative period of four months. Table 2 illustrated this patient’s PCF readings during his stay.
Table 2: Serial peak cough flow (PCF) showing gradual improvement in PCF rates following combination of conventional chest and MIE therapy (case 2).
Rehabilitation stay PCF (Liter/ min) pre MIE
PCF (liter/min) post MIE
Week 2 80 130
Week 4 85 110
Week 6 100 130
Week 8 100 150
Week 10 110 140
Week 12 125 170
Week 14 140 190
Week 16 150 180
DiscussionRespiratory complications remain the leading cause of death in persons with spinal cord injury (SCI) (5). Development of respiratory failure is directly associated with the American Spinal Injury Association Impairment Scale (AIS) (1). It is well established that individuals with high cervical SCI (C1-C6) and complete injuries (AIS A) have a higher risk of developing respiratory complications of atelectasis, bronchospasm, pulmonary oedema and pneumonia (1, 5). Both of our patients had involvement of the high cervical spine region resulting in them having significant respiratory dysfunction. The difficulty in managing secretions and atelectasis would limit the participation of these patients in intensive SCI focused rehabilitation for mobility as well as functional training for activities of daily living. This problem can be partially circumvented by introducing an adjunct intervention for managing respiratory secretions such as mechanical insufflation-exsufflation therapy (MIE). It has been previously shown that tetraplegic patients, especially smokers, who were prescribed with outpatient MIE had fewer instances of hospitalisation for respiratory complications (2).
The magnitude of the PCF determines the effectiveness of mucus clearance (6). A PCF level is elicited by having the person cough as forcefully as possible through a peak flow meter. Depending on gender, height and age, a normal PCF

33
JUMMEC 2017:20(2)CASE REPORT
reaches 6-12 litre / second or 360-720 L/ min. In patients with neuromuscular disorders and restrictive lung disease, a PCF of less than 160 L/min can be used to predict a failed extubation or decannulation, which is likely due to inadequate clearance of bronchial secretions (2, 4). SCI patients with tetraplegia may have problems with secretion clearance similar to patients with neuromuscular disorders due to weak inspiratory and expiratory muscles. PCF was chosen as an objective outcome measure to assess the efficacy of the MIE therapy. Once both patients achieved a PCF of more than 160L/min, rehabilitation goals were achieved, and they were able to be discharged from the inpatient rehabilitation facility without oxygen therapy. A consensus regarding the target PCF in patients with spinal cord injury has not yet been reached given the lack of data.
There is a paucity of strong evidence of the benefits of MIE in the SCI population. Studies on the use of MIE in patients with neuromuscular disease indicate that MIE therapy produces a greater increase in PCF compared to other standard cough augmentation techniques (3, 4). PCF produced during MIE significantly exceeds that produced by manually assisted coughing (6). MIE therapy also results in significant increase in forced vital capacity (FVC) and forced expiratory volume in 1 second (FEV1) (7). However, insufflation-exsufflation pressures of less than ±35 cmH20 appear to be inadequate to produce a PCF of 160L/min (8). Both our patients showed improvement of their PCF following their tolerance of ±30-40 cm H20 of insufflation-exsufflation pressure.
A study using the visual analogue scale (VAS) looking at patient comfort and distress found that MIE therapy was tolerated as well as the other cough augmentation techniques (4).The need for deep suctioning is reduced, and it is more comfortable for patients. As MIE treatment is well tolerated and has been shown to be efficient in secretion management in spinal cord injury, it should be considered as an adjunct therapy for patients in acute rehabilitation facilities when pulmonary problems become significant.
Our two case reports illustrated the benefits of adding MIE therapy to standard respiratory care following acute spinal cord injury. Robust studies are needed to prove the effectiveness of MIE in the SCI population.
ConclusionThe use of MIE as an adjunct to other therapeutic measures can improve PCF values and help in the management of clearing of secretion in the respiratory care in individuals with spinal cord injury. Good secretion management reduces respiratory complications and may improve the general condition of patients with SCI. This may lead to a shortened weaning of the tracheostomy, allowing patients to increase their participation in other aspects of rehabilitation, and reducing the length of hospitalisation. MIE therapy should be considered in acute rehabilitation facilities treating individuals with SCI.
AcknowledgementsWe would like to thank the patients whom we reviewed in this report.
References1. Wong SL, Shem K, Crew J. Specialized respiratory
management for acute cervical spinal cord injury:: a retrospective analysis. Top Spinal Cord Inj Rehabil. 2012;18(4):283-90.
2. Crew JD, Svircev JN, Burns SP. Mechanical insufflation-exsufflation device prescription for outpatients with tetraplegia. J Spinal Cord Med. 2010;33(2):128-34.
3. Sivasothy P, Brown L, Smith IE, Shneerson JM. Effect of manually assisted cough and mechanical insufflation on cough flow of normal subjects, patients with chronic obstructive pulmonary disease (COPD), and patients with respiratory muscle weakness. Thorax. 2001;56(6):438-44.
4. Chatwin M, Ross E, Hart N, Nickol AH, Polkey MI, Simonds AK. Cough augmentation with mechanical insufflation/exsufflation in patients with neuromuscular weakness. Eur Respir J. 2003;21(3):502-8.
5. Berlly M, Shem K. Respiratory management during the first five days after spinal cord injury. J Spinal Cord Med. 2007;30(4):309-18.
6. Bach JR. Mechanical insufflation-exsufflation. Comparison of peak expiratory flows with manually assisted and unassisted coughing techniques. Chest. 1993;104(5):1553-62.
7. Pillastrini P, Bordini S, Bazzocchi G, Belloni G, Menarini M. Study of the effectiveness of bronchial clearance in subjects with upper spinal cord injuries: an examination of a rehabilitation programme involving mechanical insufflation and exsufflation. Spinal cord. 2006;44(10):614-6.
8. Gomez-Merino E, Sancho J, Marin J, Servera E, Blasco ML, Belda FJ, et al. Mechanical insufflation-exsufflation: pressure, volume, and flow relationships and the adequacy of the manufacturer’s guidelines. Am J Phys Med Rehabil. 2002;81(8):579-83.

34
ORIGINAL ARTICLE JUMMEC 2016:19(2)
LIST OF REVIEWERS FOR VOLUME 20, ISSUE 2, 2017
Dr. Teoh Teow ChongUniversity of Malaya,Kuala Lumpur, Malaysia
Dr. Cheong Fei WenUniversity of Malaya,Kuala Lumpur, Malaysia
Dr. Nur Yazmin YaacobUniversiti Kebangsaan Malaysia, Malaysia
Prof. Dr. Fazlul Hoque SarkarUniversity of Malaya,Kuala Lumpur, Malaysia
Asst. Prof. Dr. Napapong PongnapangMahidol University, Thailand
Prof. Dr. U Rajendra AcharyaSingapore University of Social Science (SUSS), SIT-Glasgow, Singapore
Dr. Lee Poh FoongTunku Abdul Rahman University, Kajang,Selangor
Dr. Mohammad Hosein ZareShahid Sadoughi University of Medical Sciences, Yazd, Iran
Dr. Reza FardidShiraz University of Medical Sciences, Iran.
Dr. Jaffar FatahiAhvaz Jundishapur University of Medical Sciences, Iran
Prof. Dr. Juliano Ferreira ArcuriFederal University of São Carlos, Brazil
Dr. Robert R. HanseboutMcMaster University, Canada