cardiovascular translational medicine (vii) recent...
TRANSCRIPT
Rev Esp Cardiol. 2009;62(7):781-805 781
Cardiovascular Translational Medicine (VII)
Recent Advances in the Application of Computational Mechanics to the Diagnosis and Treatment of Cardiovascular DiseaseJuan C. del Álamo,a Alison L. Marsden,a and Juan C. Lasherasa,b
aDepartment of Mechanical and Aerospace Engineering, University of California, San Diego, California, USA bDepartment of Bioengineering, University of California, San Diego, California, USA
UPDATE
Alison L. Marsden was supported by a Burroughs Wellcome Fund Career Award at the Scientific Interface and by an American Heart Association Beginning Grant in Aid Award. Juan C. Lasheras was supported by NIH grants 1R01 HL0805518 NIH, BRP081804F NIH, and Juan C. del Álamo by the Spanish Ministry of Education through a Fulbright Fellowship.
Correspondence: Prof J.C. Lasheras,Department of Mechanical and Aerospace Engineering, University of California, San Diego, La Jolla, California 92037-0411, USAE-mail: [email protected]
During the last 30 years, research into the pathogenesis and progression of cardiovascular disease has had to employ a multidisciplinary approach involving a wide range of subject areas, from molecular and cell biology to computational mechanics and experimental solid and fluid mechanics. In general, research was driven by the need to provide answers to questions of critical importance for disease management. Ongoing improvements in the spatial resolution of medical imaging equipment coupled to an exponential growth in the capacity, flexibility, and speed of computational techniques have provided a valuable opportunity for numerical simulations and complex experimental techniques to make a contribution to improving the diagnosis and clinical management of many forms of cardiovascular disease. This paper contains a review of recent progress in the numerical simulation of cardiovascular mechanics, focusing on three particular areas: patient-specific modeling and the optimization of surgery in pediatric cardiology, evaluating the risk of rupture in aortic aneurysms, and noninvasive characterization of intraventricular flow in the management of heart failure.
Key words: Computational. Hypoplastic left heart syndrome. Aneurysms. Heart failure.
Avances en mecánica computacional para el diagnóstico y tratamiento de la enfermedad cardiovascular
Durante los últimos 30 años, el estudio de la patogenia y la progresión de las enfermedades cardiovasculares ha necesitado de un esfuerzo multidisciplinario en el que intervienen muy diversas disciplinas, desde la biología celular y molecular a la mecánica computacional y experimental de sólidos y fluidos. Generalmente estos estudios están motivados por la necesidad de obtener respuestas a las cuestiones esenciales para el control de la enfermedad. Los continuos avances en la resolución de los equipos de imagen médica, junto con el crecimiento exponencial en magnitud, flexibilidad y velocidad de las técnicas computacionales, han creado un importante espacio para el uso de simulaciones numéricas y técnicas experimentales complejas para mejorar el diagnóstico y el manejo clínico de muchas enfermedades cardiovasculares.
En este trabajo revisamos los últimos avances en simula-ciones numéricas de la mecánica cardiovascular centrán-donos en tres áreas específicas: el modelado específico del paciente y la optimización de la cirugía en cardiología pediátrica, la evaluación del riesgo de rotura de los aneu-rismas aórticos y la caracterización no invasiva del flujo intraventricular para el control de la insuficiencia cardiaca.
Palabras clave: Computacional. Síndrome de corazón izquierdo hipoplásico. Aneurismas. Insuficiencia cardiaca.
INTRODUCTION
It has long been recognized that the forces and stresses produced by the blood flow on the walls of the cardiovascular system are central to the origin and progression of many cardiovascular diseases. This has motivated a large number of physicists and engineers to develop complex mathematical models and computational and experimental tools to analyze the mechanics of the blood flow and its interaction with the wall. Recent years have shown a substantial increase in the sophistication and clinical applicability of computational tools for patient-specific modeling of blood flow. Simulations have played a key role
Section sponsored by Laboratorio Dr. Esteve
Document downloaded from http://http://www.revespcardiol.org, day 19/01/2013. This copy is for personal use. Any transmission of this document by any media or format is strictly prohibited.
782 Rev Esp Cardiol. 2009;62(7):781-805
del Álamo JC et al. Cardiovascular Computational Mechanics
The second stage, the Glenn procedure, begins by separating the pulmonary and systemic circulations by connecting the superior vena cava (SVC) to the right pulmonary artery. A Fontan procedure is then performed in its most common variant, using an extra-cardiac conduit to complete the separation resulting in a total cavopulmonary connection (TCPC).39 In the Fontan procedure, a baffle is constructed to connect the inferior vena cava (IVC) to the pulmonary arteries resulting in a modified T-shaped junction. Once the Fontan procedure is completed, blood completely bypasses the heart on the venous side and flows passively from the venae cava into the pulmonary arteries. As a result, the circulation becomes a single pump system, and the heart contains, for all practical purposes, only oxygenated blood.
Clinical studies have shown that early survival rates following the Fontan procedure are as high as 90%, but drop to only 60% after 10 years, with significant morbidity, including arrhythmias, protein-losing enteropathy, thrombosis, arteriovenous malformations, and diminished exercise capacity.40,41 Currently, it is not well understood why some Fontan procedures fail (resulting in patient mortality or heart transplant), why some patients have significantly lower exercise capacity than others, or how to reasonably predict which patients will fall into either of these 2 categories.
Clinical observation, together with previous modeling and experimental work, suggests that the geometry of the TCPC junction plays a key role in energy losses, associated strain on the cardiovascular system, and Fontan procedure outcomes.18,19,42 Pioneering computational simulations by DeLeval et al compared energy loss associated with the standard T-junction Fontan procedure with a newly proposed “offset” model, and this led to the adoption of the offset model as the currently preferred surgical method.18,43,44
During the ensuing 10 years, there has been ongoing interest in modeling the Fontan circulation. This interest, coupled with increases in computational power, has led to the development of more sophisticated calculation tools and increasingly physiologically realistic simulations.14,15,17,38 However, despite the abundance of Fontan simulation studies, there have been relatively few clinical advances to date that can be cited as a direct result of computational methods.
In this section, we focus on recent work that aims to increase the clinical relevance of Fontan simulations by addressing the key limitations of previous work. First, we discuss the use of multiple parameters for evaluating Fontan performance, including energy loss, rest and simulated exercise, wall shear stress (WSS), pressure levels and particle tracking. We then
in understanding the hemodynamics of bypass grafting,1,2 cardiovascular treatment planning,3,4 atherosclerosis in the carotid artery5 and abdominal aorta,6-9 cerebrovascular flow,10-13 the effects of exercise on aortic flow conditions,6,8 congenital heart disease,14-19 and coronary stents.20-22
The current development of geometric modeling enables complex models—including many levels of arterial branches—to be constructed directly from data obtained via clinical magnetic resonance imaging (MRI) or computed tomography (CT). Recent advances in simulation capabilities include image-based modeling,8,23-28 vessel wall deformation,39-32 incorporation of morphometry data,33 physiologic pressure levels that agree with cardiac catheterization data,14,34,35 respiration effects,14 particle tracking,36 optimization,37 and simulated exercise.14,15,38
Cardiovascular mechanics studies are not only contributing to the development of novel medical devices, but also to new diagnosis tools and treatment techniques. Drawing mainly from our own individual research areas, we discuss current advances in cardiovascular mechanics by focusing on 3 specific areas: a) patient-specific modeling and surgery optimization for pediatric cardiology applications; b) computational and experimental studies of the biomechanics of arterial aneurysms to evaluate the risk of rupture; and c) the non-invasive characterization of intra-ventricular flow: a new tool for understanding the hemodynamics of heart failure.
We will use these case studies to illustrate the current capabilities and limitations of the numerical simulation techniques currently being developed for the study of cardiovascular mechanics.
Patient-Specific Modeling and Surgery Optimization for Pediatric Cardiology Applications
In this section, we focus on the use of simulation tools and patient-specific modeling for the treatment of single ventricle heart defects, one of the most serious classes of congenital defects. Congenital heart defects are among the most prevalent form of birth defects, occurring in roughly 1% of births. “Single ventricle”-type defects, such as hypoplastic left heart syndrome and tricuspid atresia, refer to cases where the heart has only 1 effective or functional pumping chamber, and are usually fatal shortly after birth if left untreated.
Single-ventricle patients usually require a staged surgical approach culminating in a Fontan procedure. The first procedure involves aortic root re-construction and a systemic-to-pulmonary shunt in a Norwood procedure or variant thereof.
Document downloaded from http://http://www.revespcardiol.org, day 19/01/2013. This copy is for personal use. Any transmission of this document by any media or format is strictly prohibited.

del Álamo JC et al. Cardiovascular Computational Mechanics
Rev Esp Cardiol. 2009;62(7):781-805 783
solid model for use in the finite element flow solver. The steps in model construction are illustrated in Figure 1 for a typical Fontan patient.
To solve equations for blood flow, 3D Navier-Stokes equations are solved using finite element or finite volume methods, typically with a rigid-wall approximation.7,45 New methods enable the recreation of outflow boundary conditions such that physiologic pressure levels can be predicted in cardiovascular simulations.46,47
Closely coupled to modeling methods is the need for advanced imaging modalities for modeling and validation purposes. Data obtained from magnetic resonance imaging and computed tomography is used for model construction, and phase contrast MRI is used to measure inflow rates that are used as inflow boundary conditions. Data is typically acquired over several cycles of free breathing using cardiac gating and respiratory compensation.
Current diagnostic methods have limited capabilities for determining in vivo flow and pressure under exercise conditions. Acquiring pressure data in a catheterization procedure requires the patient to be sedated, and these measurements are usually performed at rest. Because of this, simulations are the ideal method to obtain information about flow conditions during exercise. Clinical studies have shown that typical Fontan patients are able to approximately double their cardiac output at maximal exercise. Exercise conditions can be
discuss the role of simulation tools in developing and testing new surgical designs. Finally, we discuss the recent development of optimization tools that can evaluate a wide range of potential designs using tools adopted from aerospace engineering.
Model Construction, Imaging, and Simulation Methods
The process of patient-specific modeling involves image and clinical (eg, catheterization) data acquisition, anatomic model construction, flow simulation and post-processing to produce performance measures, such as flow distribution and pressures, that are surrogates for known predictors of patient outcomes. We briefly outline the methods used for Fontan modeling in this section, and refer the reader to other studies for details on simulation techniques.7,14,34
Models are typically constructed based on MRI or CT image data using segmentation methods.23 In methods pioneered by Taylor, patient-specific models are constructed in the following steps: a) paths are defined that run down the center of the vessels of interest; b) the vessel lumen is defined at fixed intervals along each vessel (segmented); c) the vessel portions between the 2D segmentations are interpolated and joined using custom software to create a 3D solid model of the desired vasculature (lofted); and d) a mesh is generated to represent the
Figure 1. Four steps involved in model construction (patient D): (1) creation of vessel paths, (2) segmentation, (3) lofting, and (4) mesh generation. The image is displayed in the posterior-anterior view for ease of viewing. From Marsden et al.16
Document downloaded from http://http://www.revespcardiol.org, day 19/01/2013. This copy is for personal use. Any transmission of this document by any media or format is strictly prohibited.
784 Rev Esp Cardiol. 2009;62(7):781-805
del Álamo JC et al. Cardiovascular Computational Mechanics
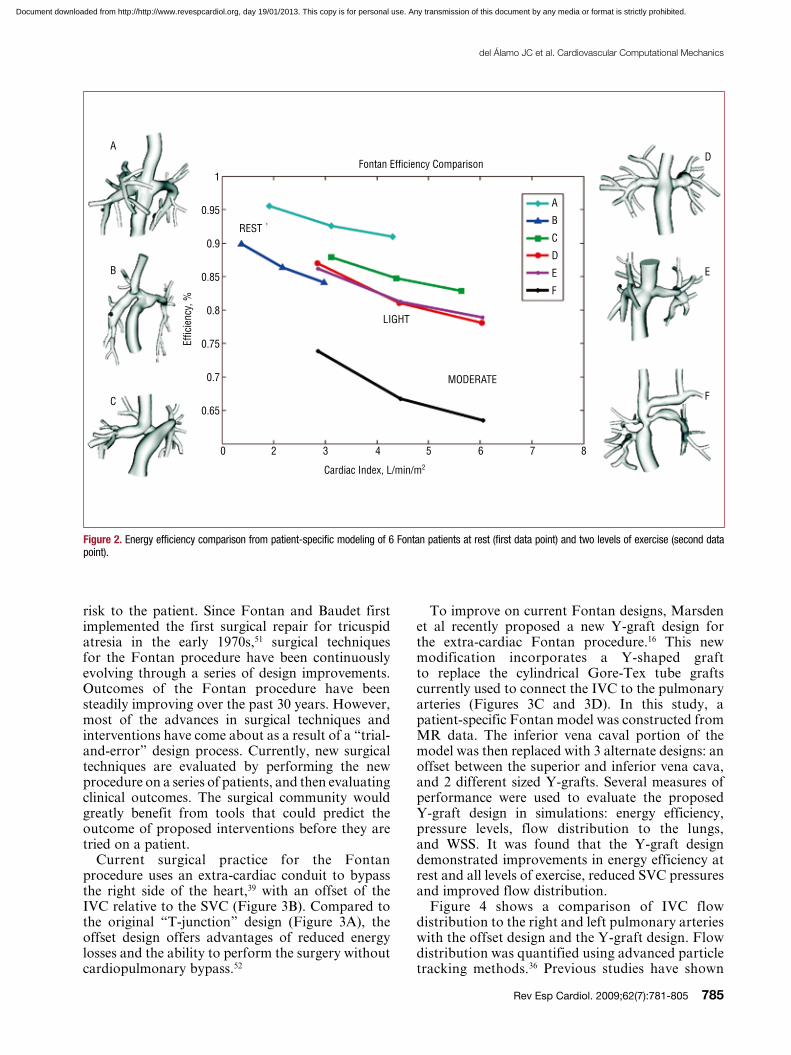
2 levels of simulated exercise conditions. For each patient, several performance parameters were computed, including energy efficiency, IVC and SVC pressure levels, WSS and quantitative data on the distribution of IVC flow to the left and right pulmonary arteries. For each of these parameters, patients were ranked in order of best to worst performance.
Figure 2 shows 6 patient-specific Fontan models (labeled A–F) and their simulated energy efficiency at rest and exercise. The results show a striking decrease in efficiency with exercise, and a wide range of performance among patients. Simulated pressures were well matched to catheterization data, but low Fontan pressure did not correlate with high efficiency.
The results of this study demonstrated that different performance parameters produced different rankings when ordering patients from best to worst performance. Thus, a single simulation-based parameter (such as energy dissipation) is not likely to hold all the answers to improving Fontan performance. The multiple parameter approach illustrates the fact that we still do not know what defines “good” or “bad” Fontan performance, and that we will not have a quantitative answer to that question until multiple parameters are quantified and validated against clinical outcomes.
The concept of multiple competing parameters is the norm in many other design and optimization problems. For example, in aeronautics, competing objectives such as lift, drag, weight, and structural strength are balanced in identifying an optimal airplane wing design. Similarly, the relative importance of different parameters for a Fontan patient may depend on individual risk factors or clinical symptoms, such as history of a clotting disorder, unequal left and right pulmonary artery sizes, high resting Glenn pressure, etc. From a computational standpoint, we have now reached a point where simulations, incorporating patient-specific data, have the potential to function as another diagnostic tool in the ongoing evaluation of Fontan patients and in proposed surgical or percutaneous revisions. Detailed comparisons between multiple parameters, and clinical outcomes need to be made to close the gap between simulations and clinical practice. In the future, competing objectives should be considered in designing an optimal treatment plan for each patient rather than making decisions on a one-size-fits-all basis.
An “In Silico” Testbed for New Interventions
Patient-specific simulations also provide a means to evaluate new surgeries and interventions at no
simulated by a 2- to 3-fold increase in flow such that the effect on quantities of interest, such as energy loss, can be evaluated.14,15,38
Cardiac catheterization pressure tracings, echocardiography, and magnetic resonance (MR) studies have all demonstrated that respiration significantly affects Fontan flow rates and pressures.48,49 As seen by Doppler echocardiography, quantitative real-time phase contrast-MR measurements by Hjortdal et al48 show that flow rates in the IVC vary significantly with respiration at rest (as much as 80%), with smaller cardiac pulsatility superimposed. Cardiac variations in the SVC are found to be small, with no significant respiratory variation. Based on this data, a recent study by Marsden et al14 used a respiration model to account for flow variations in the IVC. In this study, energy efficiency was found to significantly decrease with both exercise and respiration.
Evaluating Performance of the Fontan Procedure at Rest and Exercise: A Multi-Parameter Approach
Prior to testing potential new designs for the Fontan procedure, it would be useful to quantify the performance of current Fontan designs to use as a baseline. Most of the recent Fontan simulation work has focused on a single energy loss parameter for evaluating Fontan performance. However, a wide range of clinical outcomes can arise in Fontan patients, including exercise intolerance, arteriovenous malformations, protein-losing enteropathy, heart failure, and thromboembolic complications. In general, Fontan procedures are considered unsuccessful if adverse hemodynamic conditions arise, such as significant pressure gradients or uneven left and right pulmonary flows. Thus, while it is clear that energy loss is likely linked to clinical outcomes, it would be a gross oversimplification to assume it is the sole determinant of the success or failure of a Fontan procedure. A recent review article of DeGroff50 issued a “call to arms” to increase the sophistication and impact of Fontan simulations by including, among other things, respiration, exercise, wall compliance, unsteady flow, and more accurate anatomical data.
Recently, Marsden et al proposed a multiple parameter approach to evaluating Fontan performance.14,16 These studies also incorporated key modeling advances including respiration effects, simulated-exercise, unsteady flow conditions, physiologic pressure levels and particle tracking methods. Using patient-specific models derived from image data, comprehensive simulations were performed for 6 Fontan patients at rest and under
Document downloaded from http://http://www.revespcardiol.org, day 19/01/2013. This copy is for personal use. Any transmission of this document by any media or format is strictly prohibited.
del Álamo JC et al. Cardiovascular Computational Mechanics
Rev Esp Cardiol. 2009;62(7):781-805 785
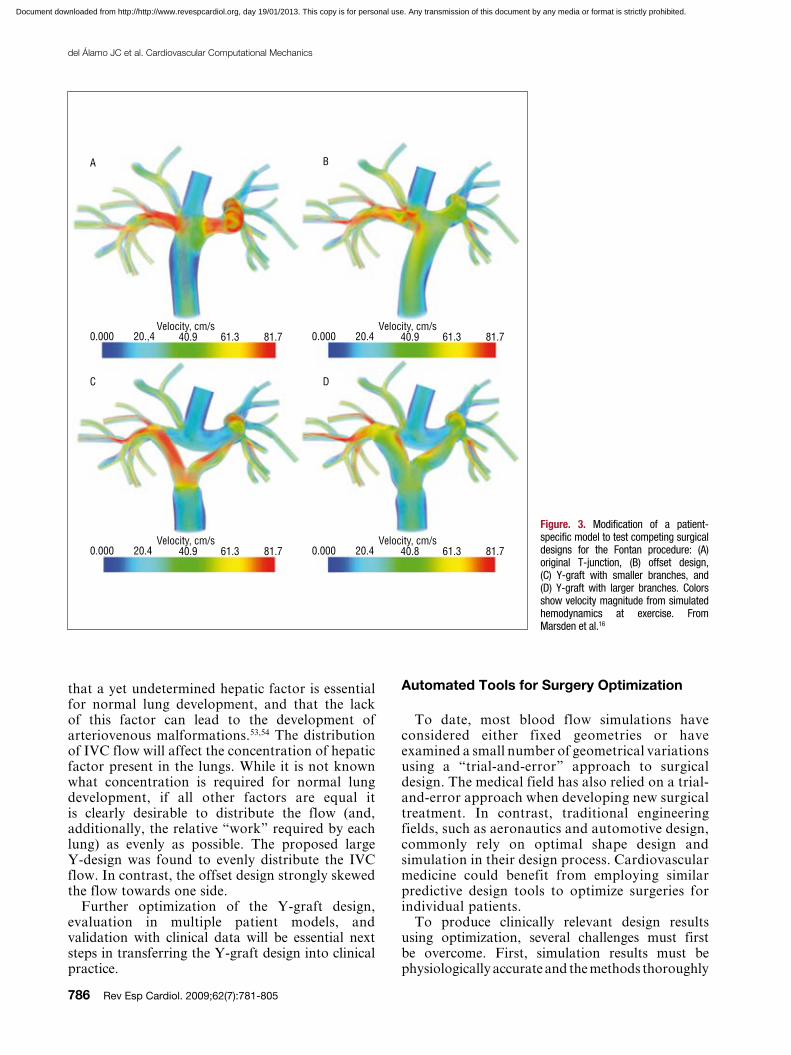
To improve on current Fontan designs, Marsden et al recently proposed a new Y-graft design for the extra-cardiac Fontan procedure.16 This new modification incorporates a Y-shaped graft to replace the cylindrical Gore-Tex tube grafts currently used to connect the IVC to the pulmonary arteries (Figures 3C and 3D). In this study, a patient-specific Fontan model was constructed from MR data. The inferior vena caval portion of the model was then replaced with 3 alternate designs: an offset between the superior and inferior vena cava, and 2 different sized Y-grafts. Several measures of performance were used to evaluate the proposed Y-graft design in simulations: energy efficiency, pressure levels, flow distribution to the lungs, and WSS. It was found that the Y-graft design demonstrated improvements in energy efficiency at rest and all levels of exercise, reduced SVC pressures and improved flow distribution.
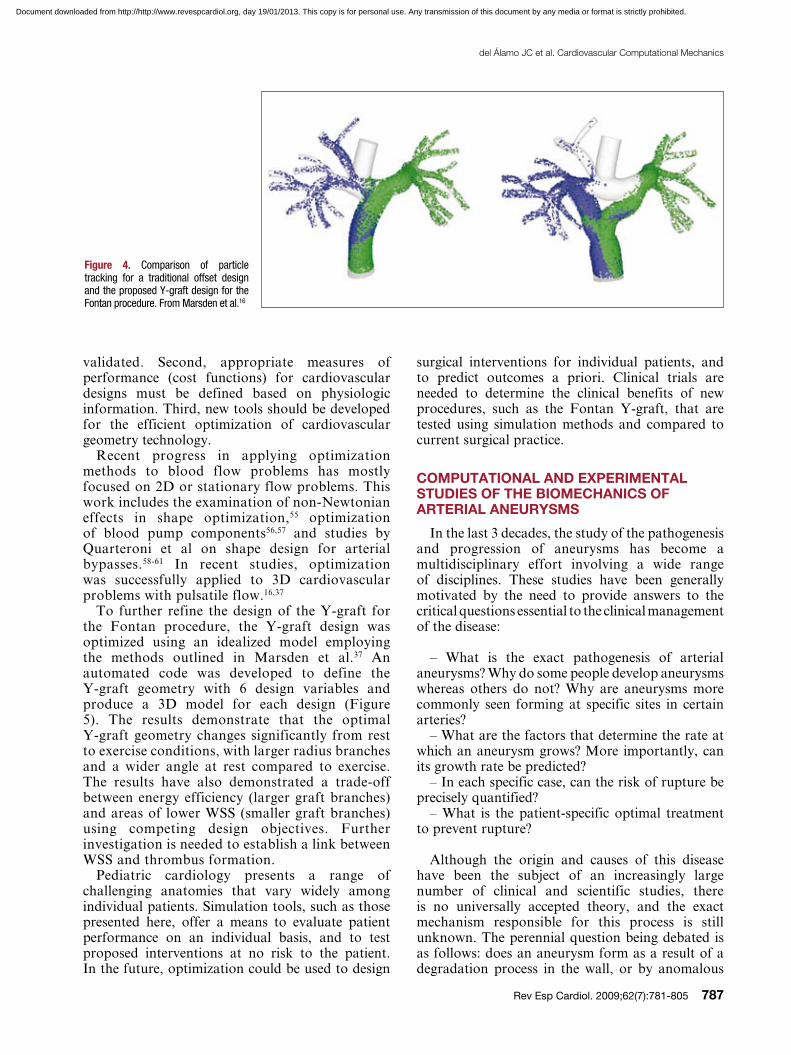
Figure 4 shows a comparison of IVC flow distribution to the right and left pulmonary arteries with the offset design and the Y-graft design. Flow distribution was quantified using advanced particle tracking methods.36 Previous studies have shown
risk to the patient. Since Fontan and Baudet first implemented the first surgical repair for tricuspid atresia in the early 1970s,51 surgical techniques for the Fontan procedure have been continuously evolving through a series of design improvements. Outcomes of the Fontan procedure have been steadily improving over the past 30 years. However, most of the advances in surgical techniques and interventions have come about as a result of a “trial-and-error” design process. Currently, new surgical techniques are evaluated by performing the new procedure on a series of patients, and then evaluating clinical outcomes. The surgical community would greatly benefit from tools that could predict the outcome of proposed interventions before they are tried on a patient.
Current surgical practice for the Fontan procedure uses an extra-cardiac conduit to bypass the right side of the heart,39 with an offset of the IVC relative to the SVC (Figure 3B). Compared to the original “T-junction” design (Figure 3A), the offset design offers advantages of reduced energy losses and the ability to perform the surgery without cardiopulmonary bypass.52
A
B
C
0 2 3 4 5 6 7 8
1
0.95
0.9
0.85
0.8
0.75
0.7
0.65
A
B
C
D
E
F
D
E
F
Fontan Efficiency Comparison
Effic
ienc
y, %
REST
LIGHT
MODERATE
Cardiac Index, L/min/m2
Figure 2. Energy efficiency comparison from patient-specific modeling of 6 Fontan patients at rest (first data point) and two levels of exercise (second data point).
Document downloaded from http://http://www.revespcardiol.org, day 19/01/2013. This copy is for personal use. Any transmission of this document by any media or format is strictly prohibited.
786 Rev Esp Cardiol. 2009;62(7):781-805
del Álamo JC et al. Cardiovascular Computational Mechanics
Automated Tools for Surgery Optimization
To date, most blood flow simulations have considered either fixed geometries or have examined a small number of geometrical variations using a “trial-and-error” approach to surgical design. The medical field has also relied on a trial-and-error approach when developing new surgical treatment. In contrast, traditional engineering fields, such as aeronautics and automotive design, commonly rely on optimal shape design and simulation in their design process. Cardiovascular medicine could benefit from employing similar predictive design tools to optimize surgeries for individual patients.
To produce clinically relevant design results using optimization, several challenges must first be overcome. First, simulation results must be physiologically accurate and the methods thoroughly
that a yet undetermined hepatic factor is essential for normal lung development, and that the lack of this factor can lead to the development of arteriovenous malformations.53,54 The distribution of IVC flow will affect the concentration of hepatic factor present in the lungs. While it is not known what concentration is required for normal lung development, if all other factors are equal it is clearly desirable to distribute the flow (and, additionally, the relative “work” required by each lung) as evenly as possible. The proposed large Y-design was found to evenly distribute the IVC flow. In contrast, the offset design strongly skewed the flow towards one side.
Further optimization of the Y-graft design, evaluation in multiple patient models, and validation with clinical data will be essential next steps in transferring the Y-graft design into clinical practice.
A
C D
B
Velocity, cm/s0.000 20.,4 40.9 61.3 81.7
Velocity, cm/s0.000 20.4 40.9 61.3 81.7
Velocity, cm/s0.000 20.4 40.8 61.3 81.7
Velocity, cm/s0.000 20.4 40.9 61.3 81.7
Figure. 3. Modification of a patient-specific model to test competing surgical designs for the Fontan procedure: (A) original T-junction, (B) offset design, (C) Y-graft with smaller branches, and (D) Y-graft with larger branches. Colors show velocity magnitude from simulated hemodynamics at exercise. From Marsden et al.16
Document downloaded from http://http://www.revespcardiol.org, day 19/01/2013. This copy is for personal use. Any transmission of this document by any media or format is strictly prohibited.
del Álamo JC et al. Cardiovascular Computational Mechanics
Rev Esp Cardiol. 2009;62(7):781-805 787
surgical interventions for individual patients, and to predict outcomes a priori. Clinical trials are needed to determine the clinical benefits of new procedures, such as the Fontan Y-graft, that are tested using simulation methods and compared to current surgical practice.
COMPUTATIONAL AND EXPERIMENTAL STUDIES OF THE BIOMECHANICS OF ARTERIAL ANEURYSMS
In the last 3 decades, the study of the pathogenesis and progression of aneurysms has become a multidisciplinary effort involving a wide range of disciplines. These studies have been generally motivated by the need to provide answers to the critical questions essential to the clinical management of the disease:
– What is the exact pathogenesis of arterial aneurysms? Why do some people develop aneurysms whereas others do not? Why are aneurysms more commonly seen forming at specific sites in certain arteries?
– What are the factors that determine the rate at which an aneurysm grows? More importantly, can its growth rate be predicted?
– In each specific case, can the risk of rupture be precisely quantified?
– What is the patient-specific optimal treatment to prevent rupture?
Although the origin and causes of this disease have been the subject of an increasingly large number of clinical and scientific studies, there is no universally accepted theory, and the exact mechanism responsible for this process is still unknown. The perennial question being debated is as follows: does an aneurysm form as a result of a degradation process in the wall, or by anomalous
validated. Second, appropriate measures of performance (cost functions) for cardiovascular designs must be defined based on physiologic information. Third, new tools should be developed for the efficient optimization of cardiovascular geometry technology.
Recent progress in applying optimization methods to blood flow problems has mostly focused on 2D or stationary flow problems. This work includes the examination of non-Newtonian effects in shape optimization,55 optimization of blood pump components56,57 and studies by Quarteroni et al on shape design for arterial bypasses.58-61 In recent studies, optimization was successfully applied to 3D cardiovascular problems with pulsatile flow.16,37
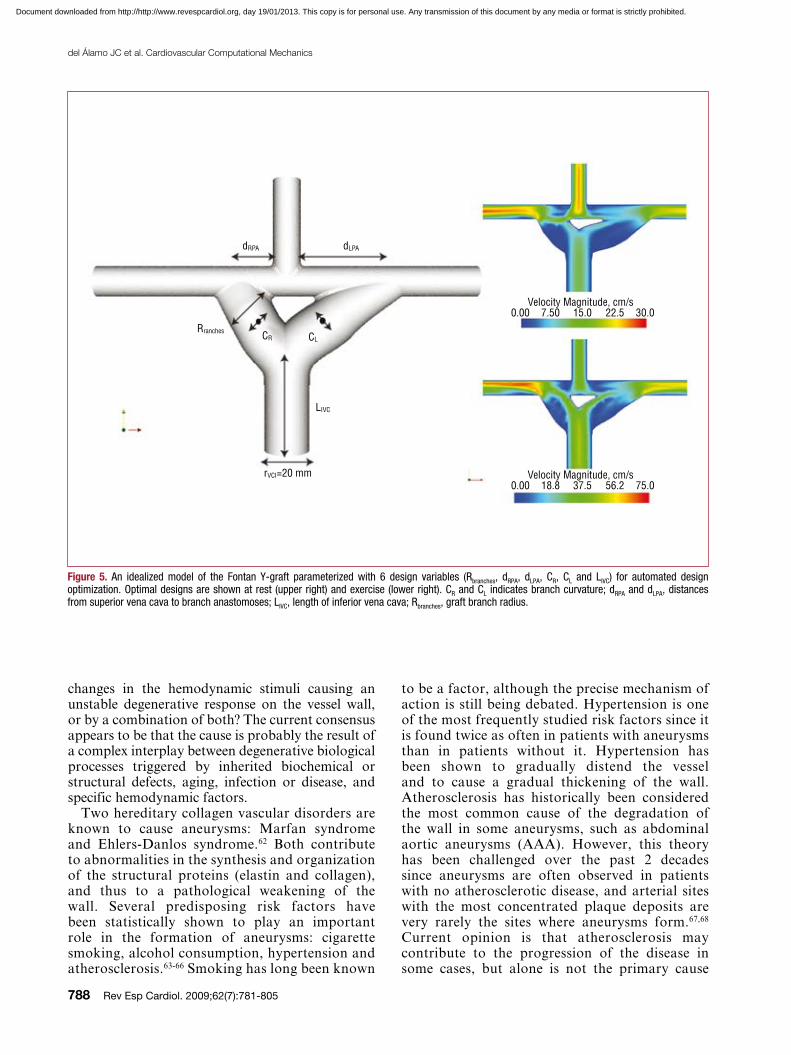
To further refine the design of the Y-graft for the Fontan procedure, the Y-graft design was optimized using an idealized model employing the methods outlined in Marsden et al.37 An automated code was developed to define the Y-graft geometry with 6 design variables and produce a 3D model for each design (Figure 5). The results demonstrate that the optimal Y-graft geometry changes significantly from rest to exercise conditions, with larger radius branches and a wider angle at rest compared to exercise. The results have also demonstrated a trade-off between energy efficiency (larger graft branches) and areas of lower WSS (smaller graft branches) using competing design objectives. Further investigation is needed to establish a link between WSS and thrombus formation.
Pediatric cardiology presents a range of challenging anatomies that vary widely among individual patients. Simulation tools, such as those presented here, offer a means to evaluate patient performance on an individual basis, and to test proposed interventions at no risk to the patient. In the future, optimization could be used to design
Figure 4. Comparison of particle tracking for a traditional offset design and the proposed Y-graft design for the Fontan procedure. From Marsden et al.16
Document downloaded from http://http://www.revespcardiol.org, day 19/01/2013. This copy is for personal use. Any transmission of this document by any media or format is strictly prohibited.
788 Rev Esp Cardiol. 2009;62(7):781-805
del Álamo JC et al. Cardiovascular Computational Mechanics
to be a factor, although the precise mechanism of action is still being debated. Hypertension is one of the most frequently studied risk factors since it is found twice as often in patients with aneurysms than in patients without it. Hypertension has been shown to gradually distend the vessel and to cause a gradual thickening of the wall. Atherosclerosis has historically been considered the most common cause of the degradation of the wall in some aneurysms, such as abdominal aortic aneurysms (AAA). However, this theory has been challenged over the past 2 decades since aneurysms are often observed in patients with no atherosclerotic disease, and arterial sites with the most concentrated plaque deposits are very rarely the sites where aneurysms form.67,68 Current opinion is that atherosclerosis may contribute to the progression of the disease in some cases, but alone is not the primary cause
changes in the hemodynamic stimuli causing an unstable degenerative response on the vessel wall, or by a combination of both? The current consensus appears to be that the cause is probably the result of a complex interplay between degenerative biological processes triggered by inherited biochemical or structural defects, aging, infection or disease, and specific hemodynamic factors.
Two hereditary collagen vascular disorders are known to cause aneurysms: Marfan syndrome and Ehlers-Danlos syndrome.62 Both contribute to abnormalities in the synthesis and organization of the structural proteins (elastin and collagen), and thus to a pathological weakening of the wall. Several predisposing risk factors have been statistically shown to play an important role in the formation of aneurysms: cigarette smoking, alcohol consumption, hypertension and atherosclerosis.63-66 Smoking has long been known
dRPA dLPA
Rranches CR CL
rVCI=20 mm
Velocity Magnitude, cm/s0.00 7.50 15.0 22.5 30.0
Velocity Magnitude, cm/s0.00 18.8 37.5 56.2 75.0
LIVC
Figure 5. An idealized model of the Fontan Y-graft parameterized with 6 design variables (Rbranches, dRPA, dLPA, CR, CL and LIVC) for automated design optimization. Optimal designs are shown at rest (upper right) and exercise (lower right). CR and CL indicates branch curvature; dRPA and dLPA, distances from superior vena cava to branch anastomoses; LIVC, length of inferior vena cava; Rbranches, graft branch radius.
Document downloaded from http://http://www.revespcardiol.org, day 19/01/2013. This copy is for personal use. Any transmission of this document by any media or format is strictly prohibited.
del Álamo JC et al. Cardiovascular Computational Mechanics
Rev Esp Cardiol. 2009;62(7):781-805 789
the aorta, below the renal arteries and proximal to its bifurcation into the iliac arteries. Ruptured AAA is the 13th-leading cause of death in the USA, causing an estimated 15 000 deaths per year. The peak incidence is among men of around 70 years of age, and the prevalence among men over 60 years is 2%-6%. Despite increased survival following diagnosis, incidence and crude mortality seem to be increasing. Rupture of the AAA occurs in 1%-3% of men aged 65 or more and mortality is 70%-95%.72,73 In the following, we will analyze AAA as a representative case of the fusiform type to illustrate how recent improvements in computational and experimental mechanics are contributing to the clinical management of this disease.
During the past 3 decades, a widely proposed hypothesis has been that specific changes in the hemodynamic forces acting on the vessel wall could be a key contributing factor to the progression of the disease.74-78 Thus, much attention has been devoted to analyzing the characteristics of the stresses produced by the blood flow in the aneurysm wall, as well as to classifying the specific features of the blood flow in the arterial segments where aneurysms are known to typically form. In this section, we review recent progress in this area and provide a critical assessment of the contribution that these computational and experimental biomechanical studies have made to the current understanding of the pathogenesis of the disease and to its current clinical management.
Mechanical Causes for the Formation of AAA
Since age is the most dominant factor in AAA, it seems reasonable to assume that the primary cause of their formation resides in the specific changes in vessel architecture (length, diameter, and wall structure) due to the normal aging process combined with the changes they induce in hemodynamics. The postulate is that under certain specific conditions this combination may lead to an unstable response whereby a portion of the wall of the abdominal aorta is subjected to abnormal stresses causing its degradation and gradual enlargement. A large body of work has been devoted to the mechanisms underlying aging in human arteries.79 When elastic systemic arteries age, their diameters increase, they become stiffer, and their walls thicken. However, the major structural changes caused by aging occur in the median layer which thins out and loses its orderly arrangement of elastin laminas and fibers which become fragmented and unorganized.80 The degeneration of elastic fibers is accompanied by an increase in the collagenous substance (the stiffer structural component). As the ratio of elastin to collagen decreases, the vessel progressively loses
of wall weakening. The proteolytic enzymatic degradation of the aortic wall connective tissue and several disease processes, such as mycotic infection and cystic medial necrosis, are also known to be contributing causes. Furthermore, recent evidence suggests that alterations in the levels of collagenase, elastase, and antiprotease may contribute to wall weakening and thus to the formation of the aneurysm. Once an aneurysm forms, the hemodynamic forces exerted by the pulsatile blood flow on the weakened arterial wall generally, but not always, cause a gradual expansion. As the wall geometry, composition and strength progressively degrade through the enlargement process, the aneurysm ruptures when the distended artery wall fails to support the mechanical stresses resulting from the internal blood flow.
Owing to the lack of knowledge of the role that the various factors play in the enlargement process, no accurate method currently exists to predict the aneurysm growth rate in a specific patient, nor to determine its critical size (or shape) at the point of rupture. For lack of any other reliable method, aneurysm diameter and its measured growth rate are the current standard parameters by which physicians estimate the risk of rupture.69,70 Depending on their location, treatment is currently recommended for aneurysms exceeding a maximal diameter, or a certain growth rate, leaving physicians to face the dilemma of either subjecting patients with small aneurysms to a complex surgery with high morbidity and complications, or to an unknown increased risk of rupture.71
In mechanical terms, the formation of an arterial aneurysm resembles the familiar problem found in structural engineering of plastic deformation, permanent bulging and subsequent rupture of a pipe under the effect of an oscillatory internal pressure, a process which often involves failure due to fatigue. However, in the case of arteries, the problem is far more difficult to analyze due to the fact that their walls are composed of a complex structure of living cells and a structural network of sheets and fibers of polymerized proteins capable of not only actively modifying their mechanical properties in response to changes in the mechanical stimuli from the internal blood flow, but more importantly, of undergoing permanent transformations (remodeling) as a result of inflammatory processes, infection, degenerative processes, and even aging.
Most fusiform aneurysms are found in portions of elastic muscular arteries in locations proximal to major bifurcations or branch points. The most commonly found fusiform aneurysm in the human body forms in the abdominal portion of
Document downloaded from http://http://www.revespcardiol.org, day 19/01/2013. This copy is for personal use. Any transmission of this document by any media or format is strictly prohibited.

790 Rev Esp Cardiol. 2009;62(7):781-805
del Álamo JC et al. Cardiovascular Computational Mechanics
area of their lumen. The progressive changes in transmitted wave speed caused by aging together with the increase in the ratio of cross-sectional areas may then result in an increase in peak systolic pressure in the abdominal aorta causing an increase in wall stresses. Over time, the increased wall tension will compound and accelerate the initiation and propagation of cracks in the elastic sheets in the median muscular layer mentioned above, and this results in an irreversible increase in arterial diameter. The permanent increase in arterial diameter leads to a further decrease in area ratio, with the associated increase in pressure wave amplitude, and thus to the unstable progression of the disease.
The pathological changes described that occur with aging can be compounded or accelerated by hypertension, excessive alcohol consumption, cigarette smoking, lack of exercise, and other dietetic or environmental factors. Hypertension can be viewed as an accelerated form of aging, causing similar degenerative arterial dilatation, stiffening and increased wave speed, but at an earlier age.79,85-87 The observed increase in the peak systolic pressure in the abdominal aorta in older patients with hypertension results from the above-mentioned process of a faster wave traveling down the artery merging with a stronger wave reflected from the bifurcation.88 Cigarette smoking is also believed to produce effects similar to those of hypertension. It not only causes transient elevation in blood pressure and stiffening of the arterial walls, but more importantly, induces the release of proteolytic enzymes which disturb the balance between proteases and their inhibitors, resulting in an increase in collagen production and the consequent permanent stiffening of the wall.89,90
The above hypothesis, which is based on the interplay between the evolution of the pressure pulse and pathological changes in the arterial wall caused by aging and other known risk factors, has not been fully tested and is an area in which further research is essential. To determine the various scenarios of geometric change and degradation of the material properties of the wall that lead to the formation of aneurysms upstream of bifurcations, such as the AAA discussed here, computational and experimental biomechanic studies involving the analysis of the flow-structure interaction in realistic arterial geometries using specific constitutive material properties of the arterial walls could prove useful.
In vitro studies of the response of vascular endothelial cells (VEC) have shown that the regulatory function of these cells can be greatly altered by anomalous flow shear stresses.67,91-93 These studies have provided the basis for an
its elasticity. The stiffening of the wall causes an increase in pulse wave speed.79
One of the most well-established hypotheses for explaining the mechanism of arterial degeneration with age is based on failure due to fatigue in the wall components. Nichols and O’Rourke79 suggest that the fatigue involved in cyclic stresses causes fracture in the load-bearing elastic sheets. Due to cyclic stress fatigue, the polymerized structure of the elastin sheet and fibers reorganize, leading to failure at tension levels below those they were previously able to withstand. Once the aneurysm begins to develop, dilatation of the median layer is then accompanied by a remodeling process whereby the collagenous content in the muscular layer increases, and the wall become stiffer.81 As the arterial wall dilatates and stiffens, the permanently stretched smooth muscle cells are progressively deprived of the cyclic stimulation needed for the synthesis of connective tissue and their healthy proliferation. This leads to a progressive loss of connectivity and apoptosis of the smooth muscle cells resulting in the gradual thinning and ultimate destruction of the muscular layer.82 To predict the growth rate of AAA due to the mechanism described above, information is required not only on the magnitude of the progressive changes in systolic pressure inside the bulge (resulting from the possible presence of the intraluminar thrombus (ITL) and the changes in the geometry and stiffness of the wall), but more importantly, on the dynamics of the arterial remodeling process already described, which could also be compounded and accelerated by inflammation, infection and other causes.83 Although there has been much recent progress in improving understanding of the various biochemical processes involved in the degradation of the wall, no precise quantitative models describing the dynamics of this process have yet been developed.
In the abdominal portion of the aorta, the amplitude of the pressure wave (pulse) is considerably modified as a result of the wave reflecting in the bifurcation, and the increase in amplitude may also initiate and accelerate the formation of aneurysms in the older population. The amplitude of the reflected wave in the abdominal aorta increases as the ratio between the cross-sectional area of the bifurcated arteries (iliac) and the parent vessel decreases. With aging, these arteries also slightly elongate and gradually change their shape. Over time, the iliac arteries become more tortuous and the cross-section of their lumen may decrease considerably.84 Atherosclerotic deposits of plaque in this portion of the iliac arteries could further decrease the cross-sectional
Document downloaded from http://http://www.revespcardiol.org, day 19/01/2013. This copy is for personal use. Any transmission of this document by any media or format is strictly prohibited.
del Álamo JC et al. Cardiovascular Computational Mechanics
Rev Esp Cardiol. 2009;62(7):781-805 791
Thus, the flow-shear endothelium-mediated initiation hypothesis has motivated a great number of numerical and experimental fluid mechanics studies aimed at determining the characteristics of the flow shear stresses on the walls of AAA at different stages of their development. These studies have mainly consisted of experiments and numerical simulations using ideal symmetric and nonsymmetric shapes of fusiform aneurysms, and using realistic geometries reconstructed from the patient-specific 3D volume rendering of high-resolution CT scans and angiographies,97-103,105,108,109,113-121 among many others. Although all these numerical and experimental studies suffer from the inherited uncertainties which result from the difficulties involved in setting up the appropriate initial and boundary conditions, as well as accounting for the exact elastic properties of the wall discussed in the previous section, they have clearly shown that once a fusiform aneurysm forms, the flow is dominated by the onset of an unsteady, massive separation from the walls which occurs immediately after the peak systole (Figure 6). When the flow separates from the walls during the deceleration portion of the cardiac cycle, a large vortex forms in the cavity and the blood slowly recirculates in the cavity. Meanwhile regions of near stagnation are formed in the proximal and distal ends of the cavity (Figure 6).
Recent experiments by Salsac et al107,109 have shown that this separation occurs even during the very early stages of aneurysm growth (a ratio of less than 1:1 between maximum diameter and parent diameter). Salsac and others,109,122 have also shown that as the aneurysm generally grows nonsymmetrically, the location and magnitude of the regions of high gradients of temporal and spatial blood flow shear stresses, as well as the extent of the regions of low, but oscillatory, shear stresses along the wall increase significantly with growth. Figure 7 shows that the results of numerically simulated blood flow agree well with the experimental measurements. Both experiments and simulations show that the aneurysm wall is subjected to abnormal WSS during the major portion of the cardiac cycle. They also show that, during diastole, the blood remains almost stagnant near the proximal and distal ends of the aneurysm where the WSS drops to near zero values.
The hypothesis that the effect of large gradients of fluid shear and other anomalous conditions resulting from the separated flow on endothelial activity determine the expansion process is called into question by the fact that, in more than 90% of all AAA, an intraluminal thrombus forms early in the expansion process in those regions of the cavity where there is slow recirculation. This
alternative, or even complementary, mechanism responsible for the origin of these aneurysms. As mentioned, during the normal course of aging, the abdominal aortic artery gradually undergoes conformational changes in its geometry (increasing its length and diameter, wall thickening, etc). Over time, the relatively unconstricted nature of this artery inside the abdominal cavity may lead in some cases to the formation of bends, kinks, and other morphological changes which in turn, create “disturbed flow” conditions inside the vessel (ie, unsteady flow separation and weak turbulence). It is argued that the anomalous response of the VEC to the high shear stresses, very low shear stresses, low, but oscillating, shear stresses, and the anomalous temporal and spatial gradients of WSS associated with these disturbed flow conditions could contribute to unstable progressive degradation of the arterial wall and to the formation of the aneurysm.
This VEC-shear activation hypothesis has triggered a large number of computational and experimental flow studies aimed at characterizing the spatial and temporal variation of the flow shear stresses on the arterial wall characteristic of the various arterial configurations94-109 and many others. Unfortunately, due to the lack of specific models quantifying the response of the endothelial cells to each of the above-mentioned anomalies in flow shear stresses, these computational flow studies have been unable to fully confirm this hypothesis. Current studies of the mechano-transduction mechanism controlling the biochemical and mechanical response of VEC to anomalous flow conditions are opening promising avenues to quantify this effect.110-112
Progression and Enlargement Rate
The formation of an aneurysm leads to a small permanent dilatation in the wall, and thus its natural form of progression would be expected to be one of gradual expansion. However, this is not always observed clinically. Some aneurysms are found to grow steadily at an undetermined rate, whereas others seem to grow rapidly, reach a certain size, and then undergo a slowdown in their growth rate. One of the most valuable pieces of information required by physicians for the optimal clinical management of the disease is the aneurysm growth rate, and this realization has motivated a great deal of computational and experimental mechanics research in this area, including a very large number of flow dynamic studies.
It appears reasonable to expect that the very same factors that lead to the formation of the aneurysm also determine the enlargement process.
Document downloaded from http://http://www.revespcardiol.org, day 19/01/2013. This copy is for personal use. Any transmission of this document by any media or format is strictly prohibited.

792 Rev Esp Cardiol. 2009;62(7):781-805
del Álamo JC et al. Cardiovascular Computational Mechanics
Patient-Specific Prediction of the Risk of Aneurysm Rupture
The risk of rupture in each case must be weighed against operative morbidity. Therefore, a patient-specific assessment of the risk of rupture is the most important information that clinicians need to better manage any aneurysms and to improve the guidelines for intervention.
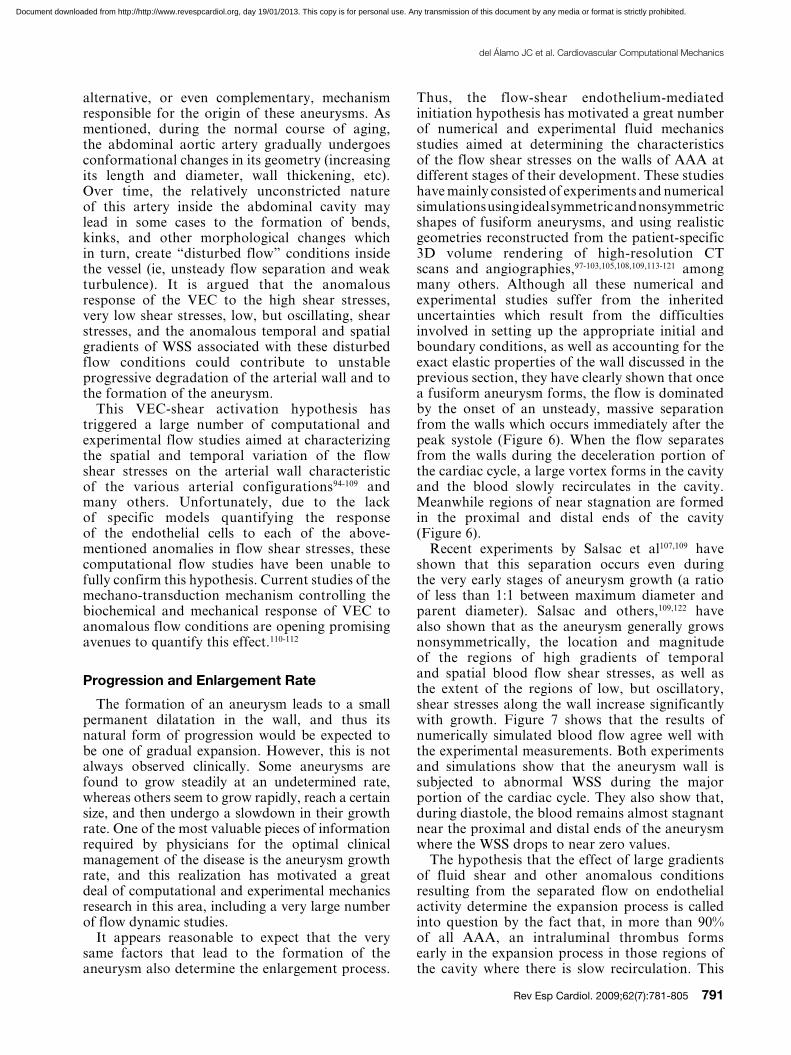
Calculating the risk of rupture requires measuring the tensile stresses on the aneurysm wall and knowledge of the corresponding stress failures. Thus, it is clear that this is an area where computational and experimental solid and fluid mechanics could genuinely contribute to the better management of this disease. Over the last 10 years, there have been a large number of studies aimed at modeling flow-structure interaction in idealized geometries of aneurysms as well as in 3D reconstructions of aneurysms obtained from CT scans or other medical imaging techniques.123-129 The results of these studies represent a great improvement over the population-based statistical criteria currently used in the clinical setting. For example, they have shown that the wall tensile stresses depend on the specific curvatures and asymmetries of the aneurysm wall. Wall tension was found to be greater on the flatter surface (which would typically correspond to the posterior surface of an AAA due to the presence of the spinal column) and at the inflection points of the bulge (where the surface curvature changes from concave to convex). These results are consistent with the fact that a large number of AAA rupture in the posterior part of the side wall (Figure 8). In addition, these computational studies have shown that even though the presence of the intraluminal thrombus has great biochemical effects on the further degeneration of the wall, the observed re-channeling of the blood flow leads to a dramatic reduction in wall tension providing a protection mechanism against rupture. Figure 8 shows the values of Von Mises stresses along the aneurysm wall indicating the most likely locations of rupture. The Von Mises criterion is a formula for combining the 3 stresses at any location of the wall into an equivalent stress, which can then be compared to the yield stress of the material to determine the risk of rupture. Figure 8 shows that in both symmetric and nonsymmetric cases with varying degrees of dilatation and eccentricity, the intraluminal thrombus leads to marked reductions in Von Mises stresses and therefore of the risk of rupture.
To precisely calculate the wall tension (Von Mises stresses) throughout the entire aneurysm in each patient-specific case, the following are required: a) a precise description of the
thrombus covers the aneurysm wall and causes the destruction of the endothelial layer by hypoxia. After the intraluminal thrombus forms the blood is no longer in contact with the vessel walls and flows through an internal lumen with an approximate cross-sectional area equal to the original abdominal aortic artery. During the subsequent expansion, new layers of thrombus form, and the internal lumen remains with an approximately constant cross-sectional area. Thus, given the formation of a thrombus, the flow-shear endothelium-mediated processes clearly do not play any role in further aneurysm growth.
Máx: 1.06
1
0.9
0.8
0.7
0.6
0.5
0.4
0.3
0.2
0.1
0Min: 0
Figure 6. Velocity field at peak systole inside an abdominal aortic aneurysm. The blood flow is from bottom to top. The velocity field is illustrated by the vector maps and has been normalized with the velocity at peak systolic in a healthy aorta. Note the formation of slowly recirculating regions (blue) with near stagnation in the proximal and distal sections of the cavity. Over time, these flow conditions lead to the formation of an intraluminal thrombus which eventually may occupy the whole bulge (blue region). Adapted from Tang et al.212
Document downloaded from http://http://www.revespcardiol.org, day 19/01/2013. This copy is for personal use. Any transmission of this document by any media or format is strictly prohibited.

del Álamo JC et al. Cardiovascular Computational Mechanics
Rev Esp Cardiol. 2009;62(7):781-805 793
precise information not only on wall geometry, but more importantly, on the precise composition and structure of the wall at each location, and therefore of its mechanical properties, including yield stresses. Yield stress, considered as the failure stress of the aneurysm wall, is unfortunately an unknown property of the material. This is due to the fact that, after enlargement of the vessel, the wall undergoes remodeling and in most cases its composition is unknown. The reduced ability of current numerical analysis to compute the precise distribution of tensional stresses in the aneurysm wall has motivated many researchers to look into surrogate methods to determine the risk of rupture. The purpose of all these studies is to find robust correlations that
3D geometry of the aneurysm wall; b) the 3D geometry of the intraluminal thrombus (if present); c) more importantly, the values of the wall thickness throughout the entire aneurysm; and d) mathematical models that characterize the nonlinear anisotropic biomechanical properties of the tissue at each location along the wall. The accuracy of the computed wall tension distribution shown in Figure 9 depends on how rigorously these 4 components are defined in the analysis. Although the setting of the proper initial and boundary conditions, and the relatively complex shape of the elastic walls present some difficulties when computing the flow, the real shortcomings arise from the current inability of the various medical imaging techniques to provide
Near Zero WSSOccurs at Proximaland Distal Endsof the Cavity Q/
Q m
ax
1.21
0.80.60.40.2
0–0.2–0.4
0 0.1 0.2 0.3 0.4 0.5 0.6 0.7 0.8 0.9 1t/T
0.1 0.2 0.3 0.4 0.5 0.6 0.7 0.8 0.9
3
2.5
2
1.5
1
0.5
0
–0.5
y/d
t/T
Max: 1.995
1.5
1
0.5
0
–0.5
–1
–1.5
–2Min: 2.104
1
0.8
0.6
0.4
0.2
0
–0.2
–0.4
–0.6
–0.8
Figure 7. Distribution of wall shear stresses (WSS) exerted by the blood flow in the abdominal aortic aneurysm shown in Figure 6. Top part, numerical simulation; bottom part, experimental measurements. The vertical axis is the position along the wall normalized by the diameter of the aorta at the proximal end of the aneurysm. The horizontal axis is time-normalized by the cardiac period. The color represents the magnitude of the blood shear stresses which have been normalized by the maximum WSS of the healthy aorta at peak systole. Observe that during diastole the WSS are near-zero in both the proximal and distal regions of the aneurysm. Adapted from Tang et al.213
Document downloaded from http://http://www.revespcardiol.org, day 19/01/2013. This copy is for personal use. Any transmission of this document by any media or format is strictly prohibited.

794 Rev Esp Cardiol. 2009;62(7):781-805
del Álamo JC et al. Cardiovascular Computational Mechanics
have been associated with a considerable increase in HF incidence in the last decade.135,136 Therefore, the accurate diagnosis and timely treatment of HF in its early stages have become major goals in the prevention of the epidemic progression of this syndrome.55,137,138 The demand for accurate diagnostic modalities is also increasing due to the development of new sophisticated therapies such as cardiac resynchronization therapy (CRT), which can only target specific groups of patients.55,138-141 Furthermore, the presence of symptoms of HF in patients with normal systolic function, for which there are few evidence-based therapies, has contributed to more complex clinical decisions.138,142,143 Better knowledge of the pathology and time course of HF syndrome, as well as new diagnostic and therapeutic tools, are required.
The development of advanced tools for the diagnosis and therapy of HF is limited by the difficulty of obtaining accessible quantitative indices of cardiac physiology in the clinical setting.138,144 Mechanical indices that quantify the
link specific features of its geometry or particular features of the flow with rupture, and which could provide a better criterion than the current one which is based solely on maximum diameter.130,131
NON-INVASIVE CHARACTERIZATION OF INTRAVENTRICULAR FLOW: A PROSPECTIVE TOOL FOR UNDERSTANDING THE HEMODYNAMICS OF HEART FAILURE
The increasing prevalence of heart failure (HF) has become a challenging health problem in developed countries. In Spain, HF is the third leading single cause of death after acute ischemic heart disease and stroke, with an average 20 000 deaths per year between 2001 and 2007, involving a 1% increase per year in the same period.132 In the USA, more than 5 million people suffer symptomatic HF, with an incidence of 550 000 new cases every year, leading to nearly $40 billion in health care costs in 2008.133,134 An aging population and improved survival rates among other heart disease patients
A B
No ILT
40% ILT
100% ILT
σ M
ises
With
Thr
ombu
s
1
0.75
0.5
0.25
0σ
Mis
es W
ithou
t Thr
ombu
s
1
0.75
0.5
0.25
0
σ M
ises
With
Thr
ombu
s
σ M
ises
With
out T
hrom
bus D/d=3.18
D/d=1.36
Asymmetric AAA (e=1)
0 20 40 60 80 100Thrombus, %
100%
0 20 40 60 80 100
D/d=1.36
D/d=3.18
100%
Symmetric AAA (e=0)Fringe Levels2.179e+052.026e+051.873e+051.720e+051.566e+051.413e+051.260e+051.107e+059.533e+048.000e+046.467e+04
Fringe Levels1.641e+051.481e+051.321e+051.161e+051.001e+058.411e+046.810e+045.210e+043.609e+042.009e+044.079e+03
Fringe Levels9.803e+048.837e+047.871e+046.905e+045.939e+044.973e+044.007e+043.041e+042.075e+041.110e+041.436e+03
Thrombus, %
Figure 8. Effect of the intraluminal thrombus (ILT) in reducing the risk of rupture. (A) Von Mises stresses in the wall of an abdominal aortic aneurysm (AAA) for the case of no ILT, and for the cases when the ILT occupies 40% and 80% of the enlarged volume of the arterial lumen. Note that the maximum values of the stresses (calculated at peak systole) are not only reduced in the presence of the ILT, but also that their location shifted to the neck. (B) Reduction in the value of the maximum Von Mises stresses with the % of volume occupied by the ILT for a symmetric AAA (top part) and nonsymmetric AAA (bottom part). The stresses have been normalized using the value in a healthy aorta. Adapted from Tang et al.214
Document downloaded from http://http://www.revespcardiol.org, day 19/01/2013. This copy is for personal use. Any transmission of this document by any media or format is strictly prohibited.
del Álamo JC et al. Cardiovascular Computational Mechanics
Rev Esp Cardiol. 2009;62(7):781-805 795
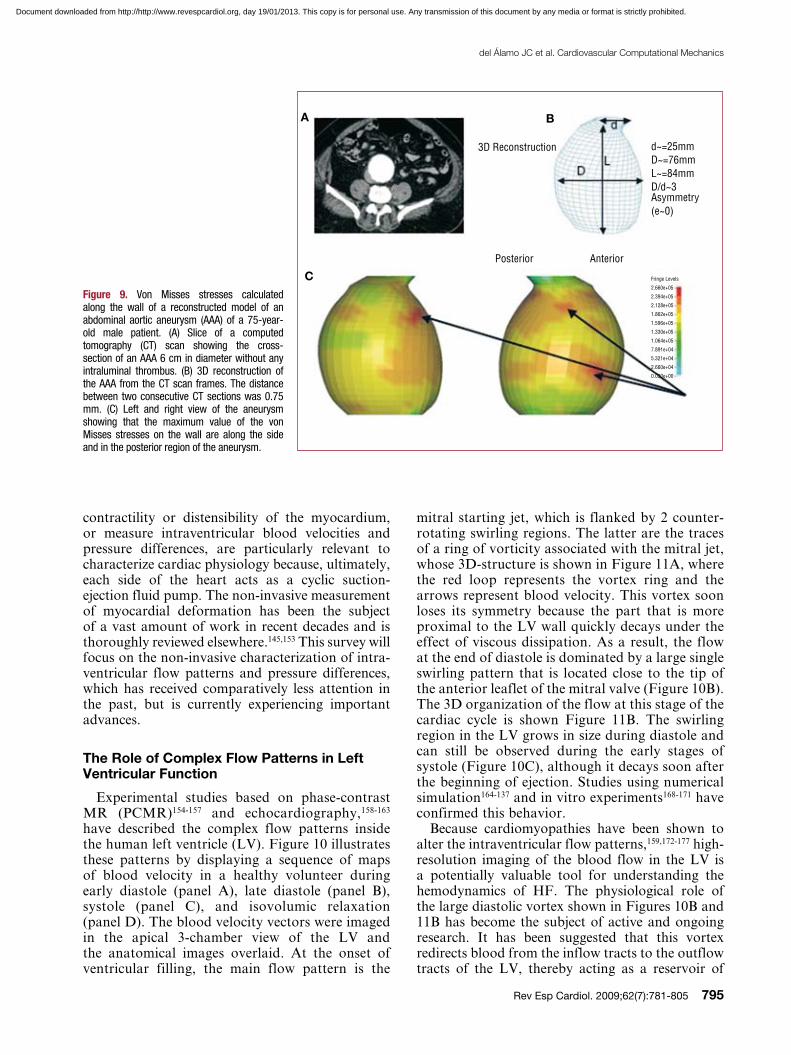
mitral starting jet, which is flanked by 2 counter-rotating swirling regions. The latter are the traces of a ring of vorticity associated with the mitral jet, whose 3D-structure is shown in Figure 11A, where the red loop represents the vortex ring and the arrows represent blood velocity. This vortex soon loses its symmetry because the part that is more proximal to the LV wall quickly decays under the effect of viscous dissipation. As a result, the flow at the end of diastole is dominated by a large single swirling pattern that is located close to the tip of the anterior leaflet of the mitral valve (Figure 10B). The 3D organization of the flow at this stage of the cardiac cycle is shown Figure 11B. The swirling region in the LV grows in size during diastole and can still be observed during the early stages of systole (Figure 10C), although it decays soon after the beginning of ejection. Studies using numerical simulation164-137 and in vitro experiments168-171 have confirmed this behavior.
Because cardiomyopathies have been shown to alter the intraventricular flow patterns,159,172-177 high-resolution imaging of the blood flow in the LV is a potentially valuable tool for understanding the hemodynamics of HF. The physiological role of the large diastolic vortex shown in Figures 10B and 11B has become the subject of active and ongoing research. It has been suggested that this vortex redirects blood from the inflow tracts to the outflow tracts of the LV, thereby acting as a reservoir of
contractility or distensibility of the myocardium, or measure intraventricular blood velocities and pressure differences, are particularly relevant to characterize cardiac physiology because, ultimately, each side of the heart acts as a cyclic suction-ejection fluid pump. The non-invasive measurement of myocardial deformation has been the subject of a vast amount of work in recent decades and is thoroughly reviewed elsewhere.145,153 This survey will focus on the non-invasive characterization of intra-ventricular flow patterns and pressure differences, which has received comparatively less attention in the past, but is currently experiencing important advances.
The Role of Complex Flow Patterns in Left Ventricular Function
Experimental studies based on phase-contrast MR (PCMR)154-157 and echocardiography,158-163 have described the complex flow patterns inside the human left ventricle (LV). Figure 10 illustrates these patterns by displaying a sequence of maps of blood velocity in a healthy volunteer during early diastole (panel A), late diastole (panel B), systole (panel C), and isovolumic relaxation (panel D). The blood velocity vectors were imaged in the apical 3-chamber view of the LV and the anatomical images overlaid. At the onset of ventricular filling, the main flow pattern is the
3D Reconstruction d~=25mmD~=76mmL~=84mmD/d~3Asymmetry(e~0)
Posterior Anterior
Fringe Levels
2.660e+05
2.394e+05
2.128e+05
1.862e+05
1.596e+05
1.330e+05
1.064e+05
7.891e+04
5.321e+04
2.660e+04
0.000e+00
Figure 9. Von Misses stresses calculated along the wall of a reconstructed model of an abdominal aortic aneurysm (AAA) of a 75-year-old male patient. (A) Slice of a computed tomography (CT) scan showing the cross-section of an AAA 6 cm in diameter without any intraluminal thrombus. (B) 3D reconstruction of the AAA from the CT scan frames. The distance between two consecutive CT sections was 0.75 mm. (C) Left and right view of the aneurysm showing that the maximum value of the von Misses stresses on the wall are along the side and in the posterior region of the aneurysm.
A B
C
Document downloaded from http://http://www.revespcardiol.org, day 19/01/2013. This copy is for personal use. Any transmission of this document by any media or format is strictly prohibited.

796 Rev Esp Cardiol. 2009;62(7):781-805
del Álamo JC et al. Cardiovascular Computational Mechanics
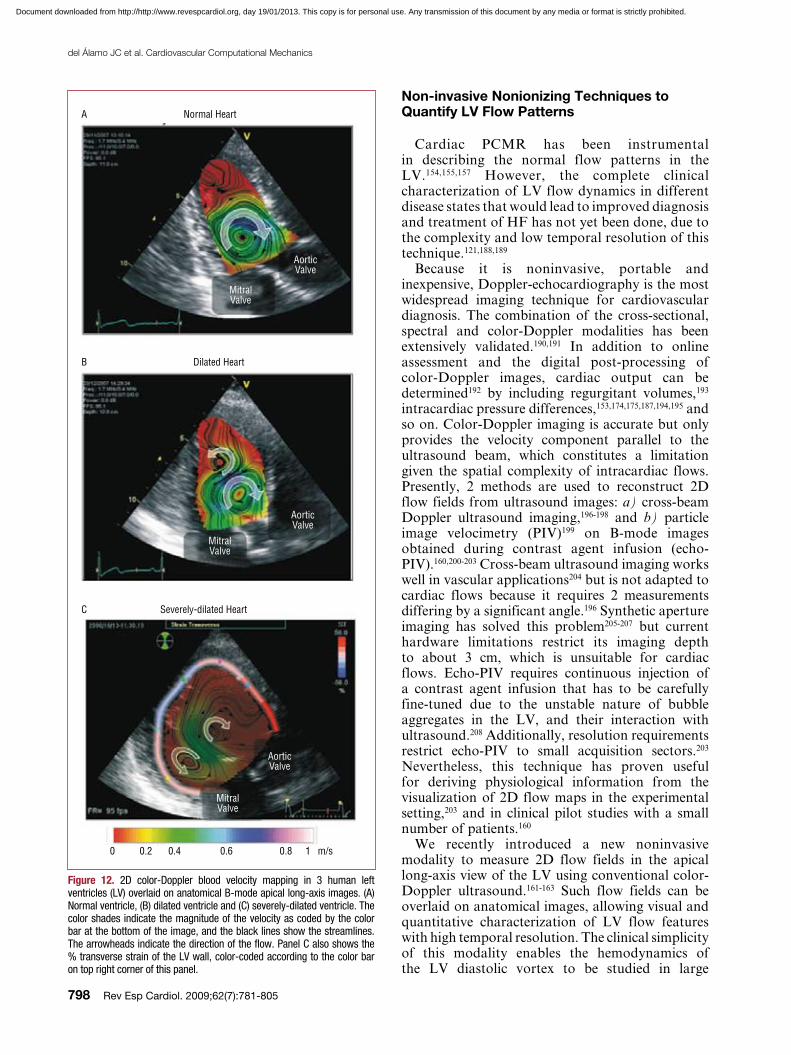
than in a normal LV (Figure 11C). Therefore, this part of the ring is subject to less viscous dissipation and does not decay as rapidly as in a normal LV. This picture is supported by Figure 12, which shows blood velocity maps in 1 healthy human LV and 2 dilated ones during late diastole. These maps indicate that only 1 clockwise vortex corresponding to an asymmetric vortex ring remains in the healthy LV (Figure 11B). However, additional counter-rotating vortices corresponding to a symmetric vortex ring persist in patients with DCM (Figure 11C). Counter-rotating vortices have been associated with higher energy losses in numerical simulations.166 Furthermore, they oppose the efficient redirection of blood from the mitral valve to the aortic valve that occurs naturally in healthy hearts. Figure 12 suggests that the size and circulation of the abnormal vortex, relative to those of the physiological one, increase with the severity of the disease. These results have led us to hypothesize that altered flow patterns may cause higher power requirements during early ejection, thereby reducing the pumping efficiency of the LV.
Several studies have illustrated that the LV diastolic vortex is a time-evolving flow pattern that follows a complex trajectory within the LV.155-158,160-163 Therefore, the time-dependent position, geometry and swirl strength of the vortex are important factors that may influence overall cardiac function. The results obtained by one of our groups indicate that these properties depend on the duration of the
mechanical energy that is released into the blood stream during ejection.156 This hypothesis implies that the diastolic vortex in the normal LV is the result of an epigenetic evolutionary process that minimizes the dissipation of mechanical energy in the flow and optimizes the efficiency of myocardial pumping.
Our current understanding of the hemodynamic irregularities that occur in patients with altered diastolic function is beginning to benefit considerably from clinical pilot studies based on the non-invasive characterization of the LV diastolic vortex. Ishizu et al159 have found that the size of this vortex increases by approximately 2 factors in patients with pseudonormalized transmitral flow patterns. By comparing PCMR data from 17 normal LVs to 1 dilated ventricle, Bolger et al157 have concluded that the fraction of mechanical energy that is stored by the LV vortex may be lower in patients with dilated cardiomyopathy (DCM). More recently, Hong et al141 have shown that the strength, size and temporal pulsatility of the diastolic vortex are lower in patients with DCM than in healthy volunteers. Recent studies by one of our groups161-163 suggest that the hemodynamic irregularities observed in DCM patients may be caused by the slower loss of symmetry of the early diastolic vortex ring, as opposed to the rapid loss of symmetry observed in normal LVs (Figure 10 and Figure 11). The physical argument for this behavior is that the posterior part of the vortex ring is farther from the wall in a dilated LV
Early DiastoleA Late DiastoleB C Systole D Isovolumic Relaxation
m/s1
0.8
0.6
0.4
0.2
0
Figure 10. Blood velocity mapping in a normal left ventricle overlaid on a sequence of anatomical B-mode apical long-axis images during (A) rapid filling, (B) late filling (C) ejection onset, and (D) isovolumic relaxation. The vectors indicate the direction and magnitude of the velocity as coded in the color bars (m/s).
Document downloaded from http://http://www.revespcardiol.org, day 19/01/2013. This copy is for personal use. Any transmission of this document by any media or format is strictly prohibited.

del Álamo JC et al. Cardiovascular Computational Mechanics
Rev Esp Cardiol. 2009;62(7):781-805 797
estimated as WS ≈ ρa × VS ≈ 0.8 J, where ρa ≈ 90 mm Hg is the characteristic aortic pressure and VS ≈ 70 mL is the characteristic LV stroke volume. Consistent with these estimations, a recent study has shown that the LV stroke work only increases by approximately 1% when the direction of rotation of the LV diastolic vortex is synthetically reversed in a numerical simulation by altering the orientation of the inflow tract relative to the LV axis.186
It should be noted, however, that the diastolic vortex may still play an important role in the hemodynamics of the LV even if its energy is low compared to the stroke work. In fact, the centrifugal pressure difference across the vortex radius can be estimated as DPV ≈ ρ g2/R2 ≈ 1 mm Hg, where g ≈ 0.1 m2/s is the characteristic circulation (swirl momentum) of the vortex. This pressure difference is comparable to measured values of the diastolic and systolic intraventricular pressure differences,174,187 indicating that the LV vortex may play an important mechanical role in the balance forces acting on blood flow during LV filling and ejection. Furthermore, we should not discard a priori the possibility that myocardial homeostasis is affected by even a modest decrease in the energetic efficiency of the LV sustained over a long period. Further work is required to clarify the role of the LV swirling flow patterns in the hemodynamics of cardiac pumping. Non-invasive, nonionizing blood velocity imaging techniques are unique tools to tackle these issues because they can be applied in clinical studies with minimal risk.
LV filling phases, which can be adjusted by changing the atrioventricular (AV) and biventricular (VV) delays (not shown). It has been demonstrated that the response to CRT is improved by optimizing the timing of the VV and AV intervals.178-183 However, an ideal procedure for echocardiographic AV and VV optimization has not yet been defined due to the challenges of coordinating echocardiographic and electrophysiological data.140,184,185 Therefore, better knowledge of the dependence of the LV vortex properties on AV and VV synchrony may increase our understanding of the benefits of CRT. It may also potentially improve current protocols for VV and AV optimization by enabling LV contraction to take place under the most favorable hemodynamic conditions.
Despite evidence supporting a role of the LV diastolic vortex in optimizing myocardial pumping, the functional merit of this flow pattern is still being debated. The controversy is motivated by the fact that the mechanical energy stored by the diastolic vortex (EV) can only account for a small fraction of the mechanical work performed by the ventricle per cardiac cycle (the stroke work, WS). Using consensus values for the properties of the LV vortex,154,159,161-163 EV can be estimated as EV ≈ ρpi2DR2U2/2 ≈ 0.01 J, where ρ ≈ 1000 kg/m3 is the density of blood, D ≈ 1 cm is the diameter of the vortex ring, R ≈ 0.5 cm is the cross-sectional radius of the vortex core and U ≈ 30 cm/s is the characteristic swirl velocity around the vortex. On the other hand, the stroke work can be easily
Early DiastoleA Late Diastole (Normal LV)B Late Diastole (DCM)C
Outflow Inflow Outflow Inflow Outflow Inflow
Figure 11. Simplified sketch of the dynamics of the left ventricle (LV) vortex ring during diastole. (A) A symmetric vortex ring generates around the mitral jet during early filling (see Figure 10A). (B) In a normal ventricle, the part of the vortex ring that is closer to the posterior wall of the LV decays due to viscous friction with the wall. As a result, the vortex ring becomes asymmetric during late diastole, creating a large single vortex that redirects blood from the inflow to the outflow of the ventricle (see Figure 10B and Figure 12A). (C) In a dilated ventricle, the posterior part of the vortex ring does not decay as fast as in the normal case. Consequently, the vortex ring does not lose its symmetry during late diastole, leading to additional counter rotating vortices contrary to the natural blood redirection in the LV (see Figures 12B and 12C). DCM indicates dilated cardiomyopathy.
Document downloaded from http://http://www.revespcardiol.org, day 19/01/2013. This copy is for personal use. Any transmission of this document by any media or format is strictly prohibited.
798 Rev Esp Cardiol. 2009;62(7):781-805
del Álamo JC et al. Cardiovascular Computational Mechanics
Non-invasive Nonionizing Techniques to Quantify LV Flow Patterns
Cardiac PCMR has been instrumental in describing the normal flow patterns in the LV.154,155,157 However, the complete clinical characterization of LV flow dynamics in different disease states that would lead to improved diagnosis and treatment of HF has not yet been done, due to the complexity and low temporal resolution of this technique.121,188,189
Because it is noninvasive, portable and inexpensive, Doppler-echocardiography is the most widespread imaging technique for cardiovascular diagnosis. The combination of the cross-sectional, spectral and color-Doppler modalities has been extensively validated.190,191 In addition to online assessment and the digital post-processing of color-Doppler images, cardiac output can be determined192 by including regurgitant volumes,193 intracardiac pressure differences,153,174,175,187,194,195 and so on. Color-Doppler imaging is accurate but only provides the velocity component parallel to the ultrasound beam, which constitutes a limitation given the spatial complexity of intracardiac flows. Presently, 2 methods are used to reconstruct 2D flow fields from ultrasound images: a) cross-beam Doppler ultrasound imaging,196-198 and b) particle image velocimetry (PIV)199 on B-mode images obtained during contrast agent infusion (echo-PIV).160,200-203 Cross-beam ultrasound imaging works well in vascular applications204 but is not adapted to cardiac flows because it requires 2 measurements differing by a significant angle.196 Synthetic aperture imaging has solved this problem205-207 but current hardware limitations restrict its imaging depth to about 3 cm, which is unsuitable for cardiac flows. Echo-PIV requires continuous injection of a contrast agent infusion that has to be carefully fine-tuned due to the unstable nature of bubble aggregates in the LV, and their interaction with ultrasound.208 Additionally, resolution requirements restrict echo-PIV to small acquisition sectors.203 Nevertheless, this technique has proven useful for deriving physiological information from the visualization of 2D flow maps in the experimental setting,203 and in clinical pilot studies with a small number of patients.160
We recently introduced a new noninvasive modality to measure 2D flow fields in the apical long-axis view of the LV using conventional color-Doppler ultrasound.161-163 Such flow fields can be overlaid on anatomical images, allowing visual and quantitative characterization of LV flow features with high temporal resolution. The clinical simplicity of this modality enables the hemodynamics of the LV diastolic vortex to be studied in large
Severely-dilated HeartC
Dilated HeartB
Normal HeartA
AorticValve
MitralValve
AorticValve
MitralValve
AorticValve
MitralValve
0 0.2 0.4 0.6 0.8 1 m/s
Figure 12. 2D color-Doppler blood velocity mapping in 3 human left ventricles (LV) overlaid on anatomical B-mode apical long-axis images. (A) Normal ventricle, (B) dilated ventricle and (C) severely-dilated ventricle. The color shades indicate the magnitude of the velocity as coded by the color bar at the bottom of the image, and the black lines show the streamlines. The arrowheads indicate the direction of the flow. Panel C also shows the % transverse strain of the LV wall, color-coded according to the color bar on top right corner of this panel.
Document downloaded from http://http://www.revespcardiol.org, day 19/01/2013. This copy is for personal use. Any transmission of this document by any media or format is strictly prohibited.
del Álamo JC et al. Cardiovascular Computational Mechanics
Rev Esp Cardiol. 2009;62(7):781-805 799
Salsac, Dr Gador Canton, and Rubing Tang. Many of the ideas expressed in this review resulted from discussions about their research. Conversations with Drs Steve Sparks, Erik Owens, and Niren Angle in the area of abdominal aortic aneurysms are also acknowledged. Dr Christian Geindreau performed the simulations shown in Figure 9, which corresponds to one of Dr Sparks’ patients. Juan C. del Álamo is indebted to Drs Marta Alhama, Javier Bermejo, Cristina Cortina, Esther Pérez-David, and Raquel Yotti at the Hospital Gregorio Marañón in Madrid for inspiring discussions on cardiac physiology.
REFERENCES
1. Ku JP, Draney MT, Arko FR, Lee WA, Chan FP, Pelc NJ, et al. In vivo validation of numerical prediction of blood flow in arterial bypass grafts. Ann Biomed Eng. 2002;30:743-52.
2. Leuprecht A, Perktold K, Prosi M, Berk T, Trubel W, Schima H. Numerical study of hemodynamics and wall mechanics in distal end-to-side anastomoses of bypass grafts. J Biomech. 2002;35:225-36.
3. Steele BN, Draney MT, Ku JP, Taylor CA. Internet-based system for simulation-based medical planning for cardiovascular disease. IEEE Trans Inf Technol Biomed. 2003;7:123-9.
4. Wilson N, Arko FR, Taylor C. Patient-specific operative planning for aorto-femoral reconstruction procedures. In Medical Image Computing and Computer-Assisted Intervention - MICCAI 2004. 7th International Conference. Proceedings. Vol. 3217. Heidelberg: Springer Berlin; 2004:422-429. [Lecture Notes in Computer Science.]
5. Perktold K, Hofer M, Rappitsch G, Loew M, Kuban BD, Friedman MH. Validated computation of physiologic flow
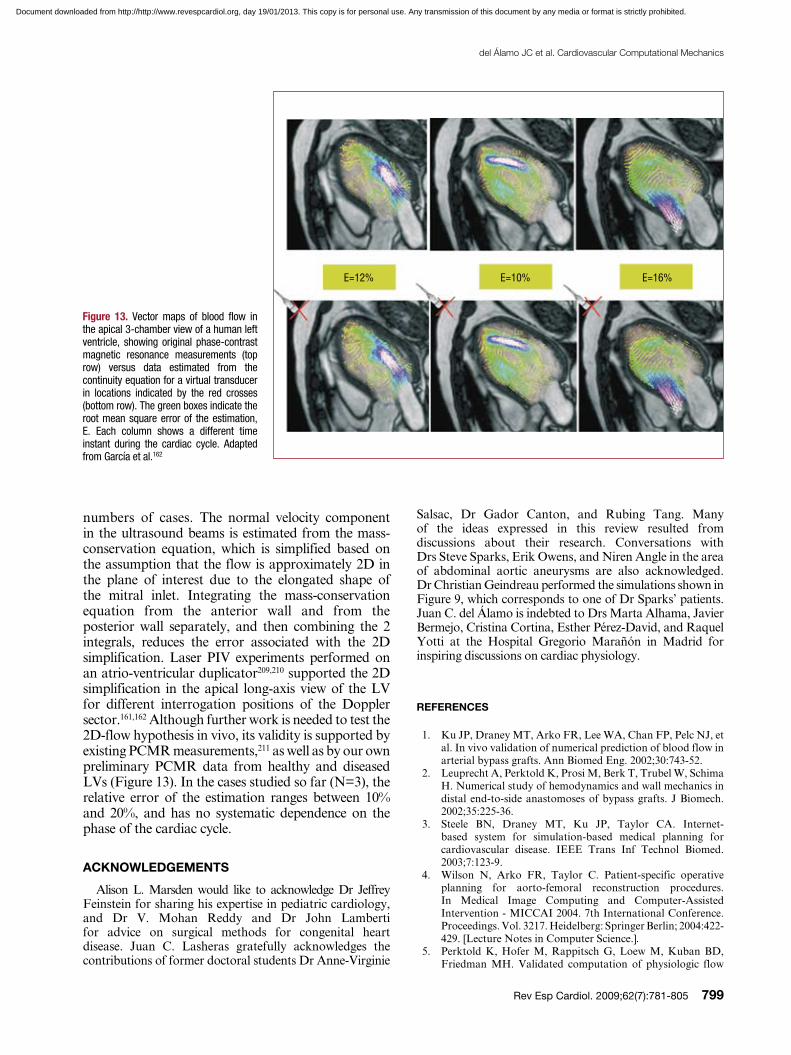
numbers of cases. The normal velocity component in the ultrasound beams is estimated from the mass-conservation equation, which is simplified based on the assumption that the flow is approximately 2D in the plane of interest due to the elongated shape of the mitral inlet. Integrating the mass-conservation equation from the anterior wall and from the posterior wall separately, and then combining the 2 integrals, reduces the error associated with the 2D simplification. Laser PIV experiments performed on an atrio-ventricular duplicator209,210 supported the 2D simplification in the apical long-axis view of the LV for different interrogation positions of the Doppler sector.161,162 Although further work is needed to test the 2D-flow hypothesis in vivo, its validity is supported by existing PCMR measurements,211 as well as by our own preliminary PCMR data from healthy and diseased LVs (Figure 13). In the cases studied so far (N=3), the relative error of the estimation ranges between 10% and 20%, and has no systematic dependence on the phase of the cardiac cycle.
ACKNOWLEDGEMENTS
Alison L. Marsden would like to acknowledge Dr Jeffrey Feinstein for sharing his expertise in pediatric cardiology, and Dr V. Mohan Reddy and Dr John Lamberti for advice on surgical methods for congenital heart disease. Juan C. Lasheras gratefully acknowledges the contributions of former doctoral students Dr Anne-Virginie
E=12% E=10% E=16%
Figure 13. Vector maps of blood flow in the apical 3-chamber view of a human left ventricle, showing original phase-contrast magnetic resonance measurements (top row) versus data estimated from the continuity equation for a virtual transducer in locations indicated by the red crosses (bottom row). The green boxes indicate the root mean square error of the estimation, E. Each column shows a different time instant during the cardiac cycle. Adapted from García et al.162
Document downloaded from http://http://www.revespcardiol.org, day 19/01/2013. This copy is for personal use. Any transmission of this document by any media or format is strictly prohibited.
800 Rev Esp Cardiol. 2009;62(7):781-805
del Álamo JC et al. Cardiovascular Computational Mechanics
sites of neointimal hyperplasia after stent implantation in rabbit iliac arteries. Am J Physiol Heart Circ Physiol. 2005;288:H2465-H2475.
22. LaDisa JF, Olson LE, Douglas HA, Warltier DC, Kersten JR, Pagel PS. Alterations in regional vascular geometry produced by theoretical stent implantation influence distributions of wall shear stress: analysis of a curved coronary artery using 3D computational fluid dynamics modeling. Biomed Eng Online. 2006;5:40.
23. Wang KC, Dutton RW, Taylor CA. Improving geometric model construction for blood flow modeling - Geometric image segmentation and image-based model construction for computational hemodynamics. IEEE Eng Med Biol Mag. 1999;18:33-3.
24. Bekkers EJ, Taylor CA. Multiscale vascular surface model generation from medical imaging data using hierarchical features. IEEE Trans Med Imaging. 2008;27:331-41.
25. Steinman DA. Image-based computational fluid dynamics modeling in realistic arterial geometries. Ann Biomed Eng. 2002;30:483-97.
26. Moore JA, Steinman DA, Holdsworth DW, Ethier CR. Accuracy of computational hemodynamics in complex arterial geometries reconstructed from magnetic resonance imaging. Ann Biomed Eng. 1999;27:32-41.
27. Cebral JR, Lohner R. From medical images to anatomically accurate finite element grids. Int J Numer Methods Eng. 2001;51:985-1008.
28. Cebral JR, Yim PJ, Lohner R, Soto O, Choyke PL. Blood flow modeling in carotid arteries with computational fluid dynamics and MR imaging. Acad Radiol. 2002;9:1286-99.
29. Figueroa CA, Vignon-Clementel IE, Jansen KE, Hughes TJR, Taylor CA. A coupled momentum method for modeling blood flow in three-dimensional deformable arteries. Comput Methods Biomech Biomed Engin. 2006;195:5685-706.
30. Bazilevs Y, Calo VM, Zhang Y, Hughes TJR. Isogeometric fluid-structure interaction analysis with applications to arterial blood flow. Computational Mechanics. 2006;38:310-22.
31. Zhang YJ, BazilevS Y, GoswaMi S, Bajaj CL, Hughes TJR. Patient-specific vascular NURBS modeling for isogeometric analysis of blood flow. Comput Methods Biomech Biomed Engin. 2007;196:2943-59.
32. Perktold K, Rappitesch G. Computer simulation of local blood flow and vessel mechanics in a compliant carotid artery bifurcation model. J. Biomech. 1995;28:845–56.
33. Spilker RL, Feinstein JA, Parker DW, Reddy VM, Taylor CA. Morphometry-based impedance boundary conditions for patient-specific modeling of blood flow in pulmonary arteries. Ann Biomed Eng. 2007;35:546-59.
34. Vignon-Clementel IE, Figueroa CA, Jansen KE, Taylor CA. Outflow boundary conditions for three-dimensional finite element modeling of blood flow and pressure in arteries. Comput Methods Biomech Biomed Engin. 2006;195:3776-96.
35. Balossino R, Pennati G, Migliavacca F, Formaggia L, Veneziani A, Tuveri M, et al. Computational models to predict stenosis growth in carotid arteries: Which is the role of boundary conditions? Comput Methods Biomech Biomed Engin. 2009;12:113-23.
36. Shadden SC, Taylor CA. Characterization of coherent structures in the cardiovascular system. Ann Biomed Eng. 2008;36:1152-62.
37. Marsden AL, Feinstein JA, Taylor CA. A computational framework for derivative-free optimization of cardiovascular geometries. Comput Methods Biomech Biomed Engin. 2008;197:1890-905.
38. Whitehead KK, Pekkan K, Kitajima HD, Paridon SM, Yoganathan AP, Fogel MA. Nonlinear power loss during exercise in single-ventricle patients after the Fontan -
in a realistic coronary artery branch. J Biomech. 1998;31: 217-28.
6. Tang BT, Cheng CP, Draney MT, Wilson NM, Tsao PS, Herfkens RJ, et al. Abdominal aortic hemodynamics in young healthy adults at rest and during lower limb exercise: quantification using image-based computer modeling. Am J Physiol Heart Circ Physiol. 2006;291:H668-H676.
7. Taylor CA, Hughes TJR, Zarins CK. Finite element modeling of blood flow in arteries. Comput Methods Biomech Biomed Engin. 1998;158:155-196.
8. Taylor CA, Hughes TJR, Zarins CK. Effect of exercise on hemodynamic conditions in the abdominal aorta. J Vasc Surg. 1999;29:1077-89.
9. Taylor CA, Cheng CP, Espinosa LA, Tang BT, Parker D, Herfkens RJ. In vivo quantification of blood flow and wall shear stress in the human abdominal aorta during lower limb exercise. Ann Biomed Eng. 2002;30:402-8.
10. Castro MA, Putman CM, Cebral JR. Computational fluid dynamics modeling of intracranial aneurysms: Effects of parent artery segmentation on intra-aneurysmal hemodynamics. AJNR Am J Neuroradiol. 2006;27:1703-9.
11. Castro MA, Putman CM, Cebral JR. Patient-specific computational fluid dynamics modeling of anterior communicating artery aneurysms: A study of the sensitivity of intra-aneurysmal flow patterns to flow conditions in the carotid arteries. AJNR Am J Neuroradiol. 2006;27:2061-8.
12. Shojima M, Oshima M, Takagi K, Torii R, Hayakawa M, Katada K, et al. Magnitude and role of wall shear stress on cerebral aneurysm - Computational fluid dynamic study of 20 middle cerebral artery aneurysms. Stroke. 2004;35:2500-5.
13. Jou LD, Quick CM, Young WL, Lawton MT, Higashida R, Martin A, et al. Computational approach to quantifying hemodynamic forces in giant cerebral aneurysms. AJNR Am J Neuroradiol. 2003;24:1804-10.
14. Marsden AL, Vignon-Clementel IE, Chan FP, Feinstein JA, Taylor CA. Effects of exercise and respiration on hemodynamic efficiency in CFD simulations of the total cavopulmonary connection. Ann Biomed Eng. 2007;35: 250-63.
15. Marsden AL, Bernstein AJ, Spilker RL, Chan FP, Taylor CA, Feinstein JA. Large differences in efficiency among Fontan patients demonstrated in patient specific models of blood flow simulations. Circulation. 2007;116:II_480.
16. Marsden AL, Bernstein AJ, Reddy VM, Shadden SC, Spilker RL, Chan FP, et aL. Evaluation of a novel Y-shaped extracardiac Fontan baffle using computational fluid dynamics. J Thorac Cardiovasc Surg. 2009;137:394-U187.
17. Bove EL, de Leval MR, Migliavacca F, Guadagni G, Dubini G. Computational fluid dynamics in the evaluation of hemodynamic performance of cavopulmonary connections after the Norwood procedure for hypoplastic left heart syndrome. J Thorac Cardiovasc Surg. 2003;126:1040-7.
18. Migliavacca F, Dubini G, Bove EL, de Leval MR. Computational fluid dynamics simulations in realistic 3-D geometries of the total cavopulmonary anastomosis: The influence of the inferior caval anastomosis. J Biomech Eng. 2003;125:805-13.
19. Khunatorn Y, Mahalingam S, DeGroff CG, Shandas R. Influence of connection geometry and SVC-IVC flow rate ratio on flow structures within the total cavopulmonary connection: A numerical study. J Biomech Eng. 2002;124:364-77.
20. LaDisa JF, Guler I, Olson LE, Hettrick DA, Kersten JR, Warltier DC, et al. Three-dimensional computational fluid dynamics modeling of alterations in coronary wall shear stress produced by stent implantation. Ann Biomed Eng. 2003;31:972-80.
21. LaDisa JF, Olson LE, Molthen RC, Hettrick DA, Pratt PF, Hardel MD, et al. Alterations in wall shear stress predict
Document downloaded from http://http://www.revespcardiol.org, day 19/01/2013. This copy is for personal use. Any transmission of this document by any media or format is strictly prohibited.
del Álamo JC et al. Cardiovascular Computational Mechanics
Rev Esp Cardiol. 2009;62(7):781-805 801
58. Lagana K, Dubini G, Migliavacca F, Pietrabissa R, Pennati G, Veneziani A, et al. Multiscale modelling as a tool to prescribe realistic boundary conditions for the study of surgical procedures. Biorheology. 2002:359-64.
59. Agoshkov V, Quarteroni A, Rozza G. A mathematical approach in the design of arterial bypass using unsteady Stokes equations. SIAM J Sci Comput. 2006;28:139-165.
60. Agoshkov V, Quarteroni A, Rozza G. Shape design in aorto-coronaric bypass anastomoses using perturbation theory. SIAM J Numer Anal. 2006;44:367-84.
61. Rozza G. On optimization, control and shape design of an arterial bypass. Int J Numer Methods Fluids. 2005;47: 1411-9.
62. Wilmink ABM, Quick CRG, Hubbard CSF, Day NE. The association between connective tissue laxity and the risk of an abdominal aortic aneurysm. Eur J Endovasc Surg. 2000;20:290-5.
63. Juvela S. Risk factor for multiple intracranial aneurysms. Stroke. 2000;31:392–7.
64. Krex D, Schackert HK, Schackert G. Genesis of cerebral aneurysms-an update. Acta Neurochir. 2001;143:429-49.
65. Singh K, Bønaa KH, Jacobsen BK, Bjørk L, Solberg S. Prevalence of and risk factors for abdominal aortic aneurysms in a population-based study. Am J Epidemiol. 2001;154: 236–44.
66. Wanhainen A, Bergqvist D, Boman K, Nilsson TK, Rutegard J. Risk factors associated with abdominal aortic aneurysm: A population-based study with historical and current data. J. Vasc. Surg. 2005;41:390–6.
67. Chiu JJ, Chen LJ, Lee PL, Lee CI, Lo LW, et al. Shear stress inhibits adhesion molecule expression in vascular endothelial cells induce by coculture with smooth muscle cells. Blood. 2003;1:2667–74.
68. Lee AJ, Fowkes FG, CarsonMn, Leng GC, Allan PL. Smoking, atherosclerosis and risk of abdominal aortic aneurysm. Eur Heart J. 1997;18:545–6.
69. Ujiie H, Tachibana H, Hiramatsu O, Hazel AL, Matsumoto T. Effects of size and shape (aspect ratio) on the hemodynamics of saccular aneurysms: a possible index for surgical treatment of intracranial aneurysms. Neurosurgery. 1999;45:119–30.
70. Nader-Sepahi A, Casimiro M, Sen J, Kitchen ND. Is aspect ratio a reliable predictor for intracranial aneurysm rupture? Neurosurgery. 2004;54:1343–8.
71. Stringfellow MM, Lawrence PE, Stringfellow RG. The influence of aortaaneurysms geometry upon stress in aneurysms wall. J Surg Res. 1987;42:425–33.
72. Lindholt JS, Juul S, Fasting H, Henneberg EW. Screening for abdominal aortic aneurysms: single centre randomised controlled trial. BMJ. 2005;330:750-2B.
73. Lindholt JS, Juul S, Fasting H, Henneberg EW. Preliminary ten year results from a randomised single centre mass screening trial for abdominal aortic aneurysm. Eur J Vasc Endovasc Surg. 2006;32:608-14.
74. Ku DN, Giddens DP, Zarins CK, Glagov S. Pulsatile flow and athersclerosia in the human carotid bifurcation. Positive correlation between plaque location and low oscillating shear stresses. Arteriosclerosis. 1985;5:293–302.
75. Glagov S, Zarins CK, Giddens DG, Ku DN. Hemodynamics and atherosclerosis, insights and perspectives gained from studies of human arteries. Arch Pathol Lab Med. 1988;112:1018–31.
76. Hademenos GJ, Massoud TF, Vinuela F. Quantitation of intracranial aneurysm neck size from diagnostic angiograms based on a biomathematical model. Neurol Res. 1995;17: 322-8.
77. Fox JL, Hugh AE. Location of atheroma: a theory based on boundary layer separation. Br Heart J. 1996;26:288–99.
78. Malek M, Alper SL, Izumo S. Hemodynamic shear stress and its role in atherosclerosis. JAMA. 1999;282:2035–42.
Insights from computational fluid dynamics. Circulation. 2007;116:I165-71.
39. de Leval MR, Kilner P, Gewillig M, Bull C. Total cavopulmonary connection a logical alternative to atriopulmonary connection for complex Fontan operations experimental studies and early clinical experience. J Thorac Cardiovasc Surg. 1988;96:682-95.
40. Marino BS. Outcomes after the Fontan procedure. Curr Opin Pediatr. 2002;14:620-6.
41. Joshi VM, Carey A, Simpson P, Paridon SM. Exercise performance following repair of hypoplastic left heart syndrome: A comparison with other types of Fontan patients. Pediatr Cardiol. 1997;18:357-60.
42. Ryu K, Healy TM, Ensley AE, Sharma S, Lucas C, Yoganathan AP. Importance of accurate geometry in the study of the total cavopulmonary connection: Computational simulations and in vitro experiments. Ann Biomed Eng. 2001;29:844-53.
43. deLeval MR, Dubini G, Migliavacca F, Jalali H, Camporini G, Redington A, Pietrabissa R. Use of computational fluid dynamics in the design of surgical procedures: Application to the study of competitive flows in cavopulmonary connections. J Thorac Cardiovasc Surg. 1996:111:502-13.
44. Dubini G, deLeval MR, Pietrabissa R, Montevecchi FM, Fumero R. A numerical fluid mechanical study of repaired congenital heart defects. Application to the total cavopulmonary connection. J Biomech. 1996;29:111-21.
45. Sahni O, Muller J, Jansen KE, Shephard MS, Taylor CA. Efficient anisotropic adaptive discretization of the cardiovascular system. Comput Methods Biomech Biomed Engin. 2006;195:5634-55.
46. Westerho.N, Bosman F, Devries CJ, Noorderg A. Analog studies of human systemic arterial tree. J Biomech. 1969;2:121-43.
47. Westerhof N, Lankhaar JW, Westerhof BE. The arterial Windkessel. Med Biol Eng Comput. 2009;47:131-41.
48. Hjortdal VE, Emmertsen K, Stenbog E, Frund T, Schmidt MR, Kromann O, et al. Effects of exercise and respiration on blood flow in total cavopulmonary connection - A real-time magnetic resonance flow study. Circulation. 2003;108: 1227-31.
49. Pedersen EM, Stenbog EV, Frund T, Houlind K, Kromann O, Sorensen KE, et al. Flow during exercise in the total cavopulmonary connection measured by magnetic resonance velocity mapping. Heart. 2002;87:554-8.
50. deGroff CG. Modeling the fontan circulation: Where we are and where we need to go. Pediatr Cardiol. 2008;29:3-12.
51. Fontan F, Baudet E. Surgical repair of tricuspid atresia. Thorax. 1971;26:240-8.
52. Petrossian E, Reddy VM, Collins KK, Culbertson CB, MacDonald MJ, Lamberti JJ, et al. The extracardiac conduit Fontan operation using minimal approach extracorporeal circulation: Early and midterm outcomes. J Thorac Cardiovasc Surg. 2006:1054-63.
53. Pike NA, Vricella LA, Feinstein JA, Black MD, Reitz BA. Regression of severe pulmonary arteriovenous malformations after Fontan revision and “Hepatic factor” rerouting. Ann Thorac Surg. 2004;78:697-9.
54. Justino H, Benson LN, Freedom RM. Development of unilateral pulmonary arteriovenous malformations due to unequal distribution of hepatic venous flow. Circulation. 2001;103:E39-E40.
55. Hunt SA, Abraham WT, Chin MH, Feldman AM, Francis GS, Ganiats TG, et al. ACC/AHA 2005 Guideline Update for the Diagnosis and Management of Chronic Heart Failure in the Adult. Circulation. 2005;112:E154-235.
56. Antaki JF, Ghattas O, Burgreen GW, He BC. Computational flow optimization of rotary blood pump components. Artificial Organs. 1995;19:608-615.
57. Burgreen GW, Antaki JF, Wu ZJ, Holmes AJ. Computational fluid dynamics as a development tool for rotary blood pumps. Artif Organs. 2001;25:336-40.
Document downloaded from http://http://www.revespcardiol.org, day 19/01/2013. This copy is for personal use. Any transmission of this document by any media or format is strictly prohibited.
802 Rev Esp Cardiol. 2009;62(7):781-805
del Álamo JC et al. Cardiovascular Computational Mechanics
102. Finol EA, Keyhani K, Amon CH. The effect of asymmetry in abdominal aortic aneurysms under physiologically realistic pulsatile flow conditions. J Biomech Eng. 2003;125:207–17.
103. Finol EA, Amon CH. Flow dynamics in abdominal aortic aneurysms. Acta Cient Venez. 2003;54:43–9.
104. Peattie RA, Riehle TJ, Bluth EI. Pulsatile flow in fusiform models of abdominal aortic aneurysms: flow fields, velocity patterns and flow-induced wall stresses. ASME J Biomech Eng. 2004;126:438–46.
105. Yip TH, Yu SCM. Cyclic transition to turbulence in rigid abdominal aortic aneurysm models. Fluid Dyn Res. 2001;29:81–113.
106. Morris L, Delassus P, Walsh M, McGloughlin T. A mathematical model to predict the in vivo pulsatile drag forces acting on bifurcated stent grafts used in endovascular treatment of abdominal aortic aneurysms (AAA). J Biomech. 2004;37:1087–95.
107. Salsac AV, Sparks SR, Chomaz JM, Lasheras JC. Evolution of the wall shear stresses during the progressive enlargement of symmetric abdominal aortic aneurysms. J Fluid Mech. 2006;560:19–51.
108. Salsac AV, Sparks SR, Lasheras JC. Changes in pressure and wall tension occurring during the enlargement of abdominal aortic aneurysms. J Vasc Surg. 2004;18:14–21.
109. Salsac AV, Sparks SR, Chomaz JM, Lasheras JC. Evolution of the wall shear stresses during the progressive enlargement of symmetric abdominal aortic aneurysms. J Fluid Mech. 2006;560:19-51.
110. Wu CC, Su FC, Li YS, Wang Y, Chiu JJ, Usami S, et al. Role of directionality of shear stress in endothelial cell remodeling. Biorheology. 2008;45:95-6.
111. Chiu JJ, Usami S, Chien S. Vascular endothelial responses to altered shear stress: Pathologic implications for atherosclerosis. Ann Med. 2009;41:19-28.
112. del Álamo JC, Norwich GN, Li YSJ, Lasheras JC, Chien S. Anisotropic rheology and directional mechanotransduction in vascular endothelial cells. Proc Natl Acad Sci U S A. 2008;105:15411-6.
113. Schrader T, Peattie RA, Bluth EI, Comstock CE. A qualitative investigation of turbulence in flow through a model abdominal aortic aneurysm. Invest Radiol. 1992;27:515–9.
114. Budwig R, Elger D, Hooper H, Slippy J. Steady flow in abdominal aortic aneurysm models. J Biomech Eng. 1993;11:418–23.
115. Peattie RA, Schrader T, Bluth EI, Comstock CE. Development of turbulence in steady flow through models of abdominal aortic aneurysms. J Ultrasound Med. 1994;13:467–72.
116. Asbury CL, Ruberti JW, Bluth EI, Peattie RA. Experimental investigation of steady flow in rigid models of abdominal aortic aneurysms. J Ann Biomed Eng. 1995;23:23–39.
117. Yu SCM, Zhao JB. A particle image velocimetry study on the pulsatile flow characteristics in straight tubes with an asymmetric bulge. Proc Inst Mech Eng C. 2000;214:655–71.
118. Zhao Y, Chen BP, Miao H, Yuan S, Li YS. Improved significance test for DNA microarray data: temporal effects of shear stress on endothelial genes. Physiol Genomics. 2002;12:1–11.
119. Yip TH, Yu SCM. Cyclic flow characteristics in an idealized asymmetric abdominal aortic aneurysm model. Proc Inst Mech Eng H. 2003;217:27–39.
120. Taylor Tw AYT. Three-dimensional simulation of blood flow in an abdominal aortic aneurysm—steady and unsteady flow cases. J Biomech Eng. 1994;116:89–97.
121. Taylor CA, Draney MT. Experimental and computational methods in cardiovascular fluid mechanics. Annu Rev Fluid Mech. 2004;36:197-231.
122. Finol EA, Amon CH. Flow dynamics in abdominal aortic aneurysms. Acta Cient Venez. 2003;54:43–9.
123. Raghavan ML, Vorp DA, Federle MP, Makaroun MS, Webster MW. Wall stress distribution on three-dimensionally
79. Nichols WW, O’Rourke MF. McDonald’s Blood Flow in Arteries: Theoretical, Experimental and Clinical Principles. London:Hodder Arnold; 1990.
80. Lakatta EG, Mitchell JH, Pomerance A, Rowe G. Human aging: changes in structure and functions. J Am Col. Cardiol. 1987;10:A42–7.
81. Thubrikar MJ, Labrosse M, Robicsek F, Al-Soudi J, Fowler B. Mechanical properties of abdominal aortic aneurysm wall. J Med EngTechnol. 2001;25:133–42.
82. López-Candales A, Holmes D, Liao S, Scott M, Wickline SA, Thompson RW. Decrease vascular smooth muscle cell density in median degeneration of human abdominal aortic aneurysms. Am J Pathol. 1997;150:993–1007.
83. Ghorpade A, Baxter BT. Biochemistry and molecular regulation of matrix macromolecules in abdominal aortic aneurysms. In The Abdominal Aortic Aneurysm: Genetics, Pathophysiology, and Molecular Biology. Ann NY Acad Sci. 1996;800:138–50.
84. Greenwald SE, Berry CL. Improving vascular grafts: the importance of mechanical and hemodynamic properties. J Pathol. 2000;190:292–9.
85. Carlson RG, Lillehei CW, Edwards J. Cystic medical necrosis of ascending aorta in relation to age and hypertension. Am J Cardiol. 1970;25:411–5.
86. Merillon JP, Motte G, Masquet C, Azancot I, Aumont MC, et al. Changes in the physical properties of the arterial system with age and in permanent arterial hypertension: their interpretation. Cardiovasc. Res. 1982;16:646–56.
87. Ting T, Brin KP, Lin SJ, Wang SP, Chang MS, Chiang BN et al. Arterial hemodynamics in human hypertension. J Clin Invest. 1986;78:1462–71.
88. O’Rourke MF. Arterial Function in Health and Disease; Edinburgh: Churchill Livingstone;1982.
89. Bonita R. Cigarette smoking, hypertension and the risk of subarachnoid hemorrhage: a population-based case-control study. Stroke. 1986;17:831–5.
90. Juvela S. Risk factor for multiple intracranial aneurysms. Stroke. 2000;31:392–7.
91. Davies PF, Remuzzi A, Gordon EJ, Dewey CF, Gibrone MA. Turbulent fluid shear stress induces vascular endothelial turnover in vivo. Proc Natl Acad Sci. USA. 1986;83:2114–7.
92. Chappell DC, Varner SE, Nerem RM, Medford RM, Alexander RW. Oscillatory shear stress stimulates adhesion molecule expression in cultured human endothelium. Circ Res. 1998;82:532–9.
93. Malek M, Alper SL, Izumo S. Hemodynamic shear stress and its role in atherosclerosis. JAMA. 1999;282:2035–42.
94. Scherer P. Flow in axisymmetrical glass model aneurysms. J Biomech. 1973;6:695–700.
95. Perktold K. On the paths of fluid particles in an axisymmetrical aneurysm. J Biomech. 1986;20:311–7.
96. Fukushima T, Matsuzawa T, Homma T. Visualization and finite element analysis of pulsatile flow in models of the abdominal aortic aneurysm. Biorheology. 1989;26:109–30.
97. Viswanath N, Rodkiewicz CM, Zajac S. On the abdominal aortic aneurysms: pulsatile state considerations. Med Eng Phys. 1997;19:343–51.
98. Egelhoff CJ, Budwig RS, Elringer DF, Khraishi TA, Johansen KH. Model studies of the flow in abdominal aortic aneurysms during resting and exercise conditions. J Biomech. 1999;32:1319–29.
99. Yu SCM, Zhao JB. A steady flow analysis on the stented and nonstented sidewall aneurysm models. Med Eng Phys. 1999;21:133–41.
100. Finol EA, Amon CH. Blood flow in abdominal aortic aneurysms: pulsatile flow hemodynamics. J Biomech Eng. 2001;123:474–84.
101. Finol EA, Amon CH. Flow-induced wall shear stress in abdominal aortic aneurysms: Parts I and II. Comput Methods Biomech Biomed Eng. 2002;5:309–28.
Document downloaded from http://http://www.revespcardiol.org, day 19/01/2013. This copy is for personal use. Any transmission of this document by any media or format is strictly prohibited.

del Álamo JC et al. Cardiovascular Computational Mechanics
Rev Esp Cardiol. 2009;62(7):781-805 803
140. Stanton T, Hawkins NM, Hogg KJ, Goodfield NER, Petrie MC, McMurray JJV. How should we optimize cardiac resynchronization therapy? Eur Heart J. 2008;29:2458-72.
141. Chung ES, Leon AR, Tavazzi L, Sun JP, Nihoyannopoulos P, Merlino J, et al. Results of the predictors of response to CRT (PROSPECT) trial. Circulation. 2008;117:2608-16.
142. Zile MR, Brutsaert DL. New concepts in diastolic dysfunction and diastolic heart failure: Part II - Causal mechanisms and treatment. Circulation. 2002;105:1503-8.
143. Owan TE, Hodge DO, Herges RM, Jacobsen SJ, Roger VL, Redfield MM. Trends in prevalence and outcome of heart failure with preserved ejection fraction. N Engl J Med. 2006;355:251-9.
144. Haddad F, Hunt SA, Rosenthal DN, Murphy DJ. Right ventricular function in cardiovascular disease, part I - Anatomy, physiology, aging, and functional assessment of the right ventricle. Circulation. 2008;117:1436-48.
145. Abraham TP, Dimaano VL, Liang HY. Role of tissue Doppler and strain echocardiography in current clinical practice. Circulation. 2007;116:2597-609.
146. Artis NJ, Oxborough DL, Williams G, Pepper CB, Tan LB. Two-dimensional strain imaging: A new echocardiographic advance with research and clinical applications. Int J Cardiol. 2008;123:240-8.
147. Axel L. Biomechanical dynamics of the heart with MRI. Annu Rev Biomed Eng. 2002;4:321-47.
148. Dandel M, Hetzer R. Echocardiographic strain and strain rate imaging - Clinical applications. Int J Cardiol. 2009;132: 11-24.
149. Dokainish H. Tissue Doppler imaging in the evaluation of left ventricular diastolic function. Curr Opin Cardiol 2004;19: 437-41.
150. McVeigh ER. MRI of myocardial function: Motion tracking techniques. Magn Reson Imaging. 1996;14:137-50.
151. Nikitin NP, Witte KKA. Application of tissue Doppler imaging in cardiology. Cardiology. 2004;101:170-84.
152. Perk G, Tunick PA, Kronzon I. Non-Doppler two-dimensional strain imaging by echocardiography - From technical considerations to clinical applications. J Am Soc Echocardiogr. 2007;20:234-43.
153. Thomas JD, Popovic ZB. Assessment of left ventricular function by cardiac ultrasound. J Am Coll Cardiol. 2006;48:2012-25.
154. Kim WY, Walker PG, Pedersen EM, Poulsen JK, Oyre S, Houlind K, Yoganathan AP. Left ventricular blood flow patterns in normal subjects: a quantitative analysis by three-dimensional magnetic resonance velocity mapping. J Am Coll Cardiol. 1995;26:224-38.
155. Wigstrom L, Ebbers T, Fyrenius A, Karlsson M, Engvall J, Wranne B, et al. Particle trace visualization of intracardiac flow using time-resolved 3D phase contrast MRI. Magn Reson Med. 1999;41:793-9.
156. Kilner PJ, Yang GZ, Wilkes AJ, Mohiaddin RH, Firmin DN, Yacoub MH. Asymmetric redirection of flow through the heart. Nature. 2000;404:759-61.
157. Bolger AF, Heiberg E, Karlsson M, Wigstrom L, Engvall J, Sigfridsson A, et al. Transit of blood flow through the human left ventricle mapped by cardiovascular magnetic resonance. J Cardiovasc Magn Reson. 2007;9:741-7.
158. Rodevand O, Bjornerheim R, Edvardsen T, Smiseth OA, Ihlen H. Diastolic flow pattern in the normal left ventricle. J Am Soc Echocardiogr. 1999;12:500-7.
159. Ishizu T, Seo Y, Ishimitsu T, Obara K, Moriyama N, Kawano S, et al. The wake of a large vortex is associated with intraventricular filling delay in impaired left ventricles with a pseudonormalized transmitral flow pattern. Echocardiography. 2006;23:369-75.
160. Hong GR, Pedrizzetti G, Tonti G, Li P, Wei Z, Kim JK, et al. Characterization and Quantification of Vortex Flow in the Human Left Ventricle by Contrast Echocardiography
reconstructed models of human abdominal aortic aneurysm. J Vascular Surg. 2000;31:760–9.
124. Fillinger MF, Marra SP, Raghavan ML. Prediction of rupture risk in abdominal aortic aneurysm during observation: wall stress versus diameter. J Vasc Surg. 2003;37:724–32.
125. Di Martino ES, Vorp DA. Effect of variation in intraluminal thrombus constitutive properties on abdominal aortic aneurysm wall stress. Ann Biomed Eng. 2003;31:804–9.
126. Di Martino E, Mantero S, Inzoli F, Melissano G, Astore D, Chiesa R et al. Biomechanics of abdominal aortic aneurysm in the presence of endoluminal thrombus: experimental characterization and structure static computational analysis. Eur J Vasc Endovasc Surg. 1998;15:290–9.
127. Di Martino ES, Guadagni G, Fumero A, Ballerini G, Spirito R, Biglioli P, et al. Fluidstructure interaction within realistic three-dimensional models of the aneurysmatic aorta as a guidance to assess the risk of rupture of the aneurysm. Med EngPhys. 2001;23:647–55.
128. Raghavan ML, Fillinger M, Marra SP, Naegelein BP, Kennedy FE. Automated methodology for determination of stress distribution in human abdominal aortic aneurysm. ASME J Biomech Eng. 2005;127:868–70.
129. Li Z, Kleinstreuer C. A new wall stress equation for aneurysm-rupture prediction. Ann Biomed Eng. 2005;33:209–13.
130. Cebral JR, Castro MA, Burgess JE, Pergolizzi RS, Sheridan MJ, Putman CM. Characterization of cerebral aneurysms for assessing risk of rupture by using patient-specific computational hemodynamics models. Am J Neuroradiol. 2005;26:2550–9.
131. Sforza DM, Putman CM, Cebral JR. Hemodynamics of Cerebral Aneurysms. Annu Rev Fluid Mech. 2009;41:91-107.
132. Defunciones según la causa de muerte. Instituto Nacional de Estadística; 2009. Available at: http://www.ine.es/jaxi/menu.do?type=pcaxis&path=/t15/p417&file=inebase&L=0:
133. Rosamond W, Flegal K, Furie K, Go A, Greenlund K, Haase N, et al. Heart disease and stroke statistics - 2008 update - A report from the American Heart Association Statistics Committee and Stroke Statistics Subcommittee. Circulation. 2008;117:E25-E146.
134. Schocken DD, Benjamin EJ, Fonarow GC, Krumholz HM, Levy D, Mensah GA, et al. Prevention of heart failure - A scientific statement from the American Heart Association councils on epidemiology and prevention, clinical cardiology, cardiovascular nursing, and high blood pressure research; Quality of care and outcomes research interdisciplinary working group; and functional genomics and translational biology interdisciplinary working group. Circulation. 2008;117:2544-65.
135. Kenchaiah S, Narula J, Vasan RS. Risk factors for heart failure. Med Clin North Am. 2004;88:1145-72.
136. Barker WH, Mullooly JP, Getchell W. Changing incidence and survival for heart failure in a well-defined older population, 1970-1974 and 1990 1994. Circulation. 2006;113:799-805.
137. Young JB. The global epidemiology of heart failure. Med Clin North Am. 2004;88:1135-43.
138. Dickstein K, Cohen-Solal A, Filippatos G, McMurray JJV, Ponikowski P, Poole-Wilson PA, et al. ESC Guidelines for the diagnosis and treatment of acute and chronic heart failure 2008 The Task Force for the Diagnosis and Treatment of Acute and Chronic Heart Failure 2008 of the European Society of Cardiology. Developed in collaboration with the Heart Failure Association of the ESC (HFA) and endorsed by the European Society of Intensive Care Medicine (ESICM). Eur J Heart Fail. 2008;10:933-89.
139. Anderson LJ, Miyazaki C, Sutherland GR, Oh JK. Patient selection and echocardiographic assessment of dyssynchrony in cardiac resynchronization therapy. Circulation. 2008;117:2009-23.
Document downloaded from http://http://www.revespcardiol.org, day 19/01/2013. This copy is for personal use. Any transmission of this document by any media or format is strictly prohibited.
804 Rev Esp Cardiol. 2009;62(7):781-805
del Álamo JC et al. Cardiovascular Computational Mechanics
simultaneous biventricular resynchronization for severe heart failure - Evaluation by tissue Doppler imaging. Circulation. 2002;106:2078-84.
180. Kedia N, Ng K, Apperson-Hansen C, Wang CH, Tchou P, Wilkoff BL, et al. Usefulness of atrioventricular delay optimization using Doppler assessment of mitral inflow in patients undergoing cardiac resynchronization therapy. Am J Cardiol. 2006;98:780-5.
181. Hardt SE, Yazdi SHF, Bauer A, Filusch A, Korosoglou G, Hansen A, et al. Immediate and chronic effects of AV-delay optimization in patients with cardiac resynchronization therapy. Int J Cardiol. 2007;115:318-25.
182. Garrigue S, Bordachar P, Reuter S, Jais P, Kobeissi A, Gaggini G, et al. Comparison of permanent left ventricular and biventricular pacing in patients with heart failure and chronic atrial fibrillation: prospective haemodynamic study. Heart. 2002;87:529-34.
183. Bordachar P, Garrigue S, Lafitte S, Reuter S, Jais P, Haissaguerre M, et al. Interventricular and intra-left ventricular electromechanical delays in right ventricular paced patients with heart failure: implications for upgrading to biventricular stimulation. Heart. 2003;89:1401-5.
184. Gorcsan J, Abraham T, Agler DA, Bax JJ, Derumeaux G, Grimm RA, et al. Echocardiography for cardiac resynchronization therapy: Recommendations for performance and reporting - A report from the American Society of Echocardiography Dyssynchrony writing group - Endorsed by the Heart Rhythm Society. J Am Soc Echocardiogr. 2008;21:191-213.
185. Flaker G, Weachter R. In cardiac resynchronization therapy: Should we opt for AV optimization? J Cardiovasc Electrophysiol. 2007;18:296-7.
186. Watanabe H, Sugiura S, Hisada T. The looped heart does not save energy by maintaining the momentum of blood flowing in the ventricle. Am J Physiol Heart Circ Physiol. 2008;294:H2191-6.
187. Yotti R, Bermejo J, Antoranz JC, Rojo-Álvarez JL, Allue C, Silva J, et al. Noninvasive assessment of ejection intraventricular pressure gradients. J Am Coll Cardiol. 2004;43:1654-62.
188. Elkins C, Alley M. Magnetic resonance velocimetry: applications of magnetic resonance imaging in the measurement of fluid motion. Exp Fluids. 2007;43:823-58.
189. Kilner PJ, Gatehouse PD, Firmin DN. Flow measurement by magnetic resonance: a unique asset worth optimising. J Cardiovasc Magn Reson. 2007;9:723-8.
190. Thornbury JR. Eugene W. Caldwell Lecture. Clinical efficacy of diagnostic imaging: love it or leave it. Am J Roentgenol. 1994;162:1-8.
191. Cheitlin MD, Armstrong WF, Aurigemma GP, Beller GA, Bierman FZ, Davis JL, et al. ACC/AHA/ASE 2003 guideline update for the clinical application of echocardiography—summary article: a report of the American College of Cardiology/American Heart Association Task Force on Practice Guidelines (ACC/AHA/ASE Committee to Update the 1997 Guidelines for the Clinical Application of Echocardiography). J Am Coll Cardiol. 2003;42:954-70.
192. Ihlen H, Amlie JP, Dale J, Forfang K, Nitterhauge S, Otterstad JE, et al. Determination of cardiac-output by doppler echocardiography. Br Heart J. 1984;51:54-60.
193. Enriquezsarano M, Bailey KR, Seward JB, Tajik AJ, Krohn MJ, Mays JM. Quantitative doppler assessment of valvular regurgitation. Circulation. 1993;87:841-8.
194. Bermejo J, Antoranz JC, Yotti R, Moreno M, García-Fernández MA. Spatio-temporal mapping of intracardiac pressure gradients. A solution to Euler’s equation from digital postprocessing of color Doppler M-mode echocardiograms. Ultrasound Med Biol. 2001;27:621-30.
195. Cortina C, Bermejo J, Yotti R, Desco MM, Rodríguez-Pérez D, Antoranz JC, et al. Noninvasive assessment of
Using Particle Image Velocimetry. J Am Coll Cardiol Img. 2008;1:705-17.
161. García D, del Álamo JC, Cortina C, Yotti R, Tanné D, Bertrand E, et al. Full intraventricular flow mapping by conventional color-doppler echocardiography. J Biomech. 2008;41:S151-S151.
162. García D, del Álamo JC, Tanné D, Yotti R, Cortina C, Bertrand E, et al. Two-dimensional intraventricular flow mapping by digital processing conventional color-Doppler echocardiography images. Eur. Heart J. 208. 29 S1 901.
163. del Álamo JC, García D, Tanne D, Cortina C, Yotti R, Fernández-Avilés F, et al. Two-Dimensional Intraventricular Mapping of Pressure and Vorticity by Digital Processing Conventional Color-Doppler Sequences. J Am Coll Cardiol. 2009:A375-A375.
164. Watanabe H, Sugiura S, Kafuku H, Hisada T. Multiphysics simulation of left ventricular filling dynamics using fluid-structure interaction finite element method. Biophys J. 2004;87:2074-85.
165. Cheng Y, Oertel H, Schenkel T. Fluid-structure coupled CFD simulation of the left ventricular flow during filling phase. Ann Biomed Eng. 2005;33:567-76.
166. Pedrizzetti G, Domenichini F. Nature optimizes the swirling flow in the human left ventricle. Phys Rev Lett. 2005;95:108101.
167. Oertel H, Spiegel K, Donisi S. Modelling the human cardiac fluid mechanics. Karlsruhe: Universität Karlsruhe; 2006.
168. Cooke J, Hertzberg J, Boardman M, Shandas R. Characterizing vortex ring behavior during ventricular filling with Doppler echocardiography: an in vitro study. Ann Biomed Eng. 2004;32:245-56.
169. Pierrakos O, Vlachos PP. The effect of vortex formation on left ventricular filling and mitral valve efficiency. J Biomech Eng. 2006;128:527-39.
170. Domenichini F, Querzoli G, Cenedese A, Pedrizzetti G. Combined experimental and numerical analysis of the flow structure into the left ventricle. J Biomech. 2007;40:1988-94.
171. Kheradvar A, Milano M, Gharib M. Correlation between vortex ring formation and mitral annulus dynamics during ventricular rapid filling. ASAIO J. 2007;53:8-16.
172. Pasipoularides A, Shu M, Shah A, Womack MS, Glower DD. Diastolic right ventricular filling vortex in normal and volume overload states. Am J Physiol Heart Circ Physiol. 2003;284:H1064-72.
173. Pasipoularides A, Shu M, Shah A, Tucconi A, Glower DD. RV instantaneous intraventricular diastolic pressure and velocity distributions in normal and volume overload awake dog disease models. Am J Physiol Heart Circ Physiol. 2003;285:H1956-H1965.
174. Yotti R, Bermejo J, Antoranz JC, Desco MM, Cortina C, Rojo-Álvarez JL, et al. A noninvasive method for assessing impaired diastolic suction in patients with dilated cardiomyopathy. Circulation. 2005;112:2921-9.
175. Yotti R, Bermejo J, Desco MM, Antoranz JC, Rojo-Álvarez JL, Cortina C, et al. Doppler-derived ejection intraventricular pressure gradients provide a reliable assessment of left ventricular systolic chamber function. Circulation. 2005;112:1771-9.
176. Little WC. Diastolic dysfunction beyond distensibility: adverse effects of ventricular dilatation. Circulation. 2005;112: 2888-90.
177. Yang GZ, Merrifield R, Masood S, Kilner PJ. Flow and myocardial interaction: an imaging perspective. Phil Trans R Soc B. 2007;362:1329-41.
178. van Gelder BM, Bracke FA, Meijer A, Lakerveld LJM, Pijls NHJ. Effect of optimizing the VV interval on left ventricular contractility in cardiac resynchronization therapy. Am J Cardiol. 2004;93:1500-3.
179. Sogaard P, Egeblad H, Pedersen AK, Kim WY, Kristensen BO, Hansen PS, Mortensen PT. Sequential versus
Document downloaded from http://http://www.revespcardiol.org, day 19/01/2013. This copy is for personal use. Any transmission of this document by any media or format is strictly prohibited.

del Álamo JC et al. Cardiovascular Computational Mechanics
Rev Esp Cardiol. 2009;62(7):781-805 805
206. Jensen JA, Nikolov SI, Gammelmark KL, Pedersen MH. Synthetic aperture ultrasound imaging. Ultrasonics. 2006;44 Suppl 1:e5-15.
207. Udesen J, Nielsen MB, Nielsen KR, Jensen JA. Examples of in vivo blood vector velocity estimation. Ultrasound Med Biol. 2007;33:541-8.
208. Vennemann P, Lindken R, Westerweel J. In vivo whole-field blood velocity measurement techniques. Exp Fluids. 2007;42:495-511.
209. Mouret F, Kadem L, Bertrand E, Dumesnil JG, Pibarot P, Rieu R. Mitral prosthesis opening and flow dynamics in a model of left ventricle: an in vitro study on a monoleaflet mechanical valve. Cardiovasc Eng. 2005;5:13-20.
210. Tanne D, Bertrand E, Kadem L, Pibarot P, Rieu R. Assessment of left heart and pulmonary circulation flow dynamics by a new pulsed mock circulatory system. Exp Fluids, 2009 [In press].
211. Thompson RB, McVeigh ER. Fast measurement of intracardiac pressure differences with 2D breath-hold phase-contrast MRI. Magn Reson Med. 2003;49:1056-66.
212. Tang R, Geindreau C, Lasheras JC. Abstract: BB.00002: Effects of the Transient Blood Flow-Wall Interaction on the Wall Stress Distribution in Abdominal Aortic Aneurysm (AAA). Proceedings of the 59 Meeting of the Fluid Dynamics Division of the American Physical Society. 2006:BB.00002.
213. Tang R, Geindreau C, Lasheras JC. Rupture Risk Prediction of Abdominal Aortic Aneurysms (AAA). Proceedings of the 60 Meeting of the Fluid Dynamics Division of the American Physical Society. 2007:KF.00007.
214. Tang R, Bar-Yoseph PZ, Lasheras J. Fluid Characteristics in Abdominal Aortic Aneurysms (AAA) and Its Correlation to Thrombus Formation. Proceedings of the 61 Meeting of the Fluid Dynamics Division of the American Physical Society. 2008:HL.00002.
the right ventricular filling pressure gradient. Circulation. 2007;116:1015-23.
196. Dunmire B, Beach KW, Labs K, Plett M, Strandness DE. Cross-beam vector Doppler ultrasound for angle-independent velocity measurements. Ultrasound Med Biol. 2000;26: 1213-35.
197. Capineri L, Scabia M, Masotti L. A Doppler system for dynamic vector velocity maps. Ultrasound Med Biol. 2002;28:237-48.
198. Kripfgans OD, Rubin JM, Hall AL, Fowlkes JB. Vector Doppler imaging of a spinning disc ultrasound Doppler phantom. Ultrasound Med Biol. 2006;32:1037-46.
199. Willert CE, Gharib M. Digital Particle Image Velocimetry. Exp Fluids. 1991;10:181-93.
200. Bohs LN, Geiman BJ, Anderson ME, Gebhart SC, Trahey GE. Speckle tracking for multi-dimensional flow estimation. Ultrasonics. 2000;38:369-75.
201. Lin LC, Ho YL, Kao SL, Wu CC, Liau CS, Lee YT. Power Doppler-derived speckle tracking image of intraventricular flow in patients with anterior myocardial infarction: correlation with left ventricular thrombosis. Ultrasound Med Biol. 2000;26:341-6.
202. Kim HB, Hertzberg JR, Shandas R. Echo PIV for flow field measurements in vivo. Biomed Sci Instrum. 2004;40:357-63.
203. Sengupta PP, Khandheria BK, Korinek J, Jahangir A, Yoshifuku S, Milosevic I, et al. Left ventricular isovolumic flow sequence during sinus and paced rhythms. J Am Coll Cardiol. 2007;49:899-908.
204. Arigovindan M, Suhling M, Jansen C, Hunziker P, Unser M. Full motion and flow field recovery from echo Doppler data. IEEE Trans Med Imaging. 2007;26:31-45.
205. Jensen JA, Oddershede N. Estimation of velocity vectors in synthetic aperture ultrasound imaging. IEEE Trans Med Imaging. 2006;25:1637-44.
Document downloaded from http://http://www.revespcardiol.org, day 19/01/2013. This copy is for personal use. Any transmission of this document by any media or format is strictly prohibited.