journal of bene t-cost analysis ... · alison f. del rossi and joni hersch journal of bene t-cost...
TRANSCRIPT

Journal of Benet-Cost Analysishttp://journals.cambridge.org/BCA
Additional services for Journal of Benet-CostAnalysis:
Email alerts: Click hereSubscriptions: Click hereCommercial reprints: Click hereTerms of use : Click here
The Private and Social Benets of Double Majors
Alison F. Del Rossi and Joni Hersch
Journal of Benet-Cost Analysis / Volume 7 / Issue 02 / June 2016, pp 292 - 325DOI: 10.1017/bca.2016.14, Published online: 30 August 2016
Link to this article: http://journals.cambridge.org/abstract_S2194588816000142
How to cite this article:Alison F. Del Rossi and Joni Hersch (2016). The Private and Social Benets ofDouble Majors. Journal of Benet-Cost Analysis, 7, pp 292-325 doi:10.1017/bca.2016.14
Request Permissions : Click here
Downloaded from http://journals.cambridge.org/BCA, IP address: 129.59.111.41 on 01 Sep 2016

J. Benefit Cost Anal. 2016; 7(2):292–325doi:10.1017/bca.2016.14
c© Society for Benefit-Cost Analysis, 2016
Alison F. Del Rossi and Joni Hersch*
The Private and Social Benefits ofDouble Majors
Abstract: With increased emphasis on encouraging students to pursue degrees inscience, technology, engineering, and math (STEM), there is a general concern thatsociety is losing the benefits associated with liberal arts education. One possibleapproach to achieving the benefits of higher paying STEM degrees along with thesocial benefits of liberal arts training is to encourage double majoring among col-lege students. Double majoring is common at about 20% of college graduates, yetmost double majors are in related areas that provide limited educational diversity.We examine private and social benefits of double majoring using data from the2010 National Survey of College Graduates. The strongest positive relations asso-ciated with combining a liberal arts major with a business or STEM major are onresearch and development activities and on job match. In addition, we find thatstudents who double major in business and STEM earn a premium over those sin-gle majors. However, combining a liberal arts major with STEM or business fieldsdoes not increase earnings, indicating little private earnings incentive for studentsto combine STEM or business majors with liberal arts.
Keywords: college major; double major; education externalities; liberal arts; returnsto education; social returns.
JEL classifications: I26 (returns to education); J240 (particular labor markets);H40 (publicly provided goods); H23 (externalities).
1 Introduction
There is substantial evidence that the earnings of engineering, physical science, andother technical/mathematical majors are higher than those of individuals who majorin arts, humanities, and education, holding fixed a wide range of other factors.1
Alison F. Del Rossi: Department of Economics, St. Lawrence University, Canton,NY 13617, USA, Phone: 315-229-5449, e-mail: [email protected]*Corresponding author: Joni Hersch, Vanderbilt Law School and Institute for theStudy of Labor (IZA), 131 21st Avenue South, Nashville, TN 37203, USA,Phone: 615-343-7717, e-mail: [email protected]
1 Daymont and Andrisani (1984); Eide (1994); Brown and Corcoran (1997); Loury (1997); Weinberger(1999); Graham and Smith (2005); Morgan (2008); Carnevale, Strohl and Melton (2011); Altonji, Blomand Meghir (2012); and Corbett and Hill (2012).

The private and social benefits of double majors 293
The expected private and social benefits to science, technology, engineering, andmath (STEM) fields have prompted various political initiatives aimed at increas-ing the number of STEM graduates.2 But it has also created concerns about thepossible decline in liberal arts fields and prompted discussions about rethinking orre-envisioning the arts, humanities, and social sciences.3 The American Academyof Arts & Sciences (AAAS) report, The Heart of the Matter, released in June 2013,received extensive media attention and generated substantial debate. Despite thebenefits of STEM education, the AAAS report argues that too narrow of a focuson science and math at the cost of greater breadth of knowledge may hamper inno-vation, reduce long run economic growth, and reduce democratic participation aswe lose shared knowledge of history and civics. The AAAS report also arguesthat reading, writing, speaking, and critical thinking skills that students learn fromhumanities and social science courses are key to individuals adapting to a chang-ing society and to being flexible in their future career paths. In effect, the AAASreport argues that there are both private and social returns that should be taken intoaccount in allocating resources across fields in higher education.
One possible solution to the decline in liberal arts education, which may con-currently mitigate the weakening of educational breadth or narrowness of skill sets,may be provided by encouraging double majoring among college students. Doublemajoring is common at about 20% of college graduates. The AAAS report laudsefforts, such as new interdisciplinary majors and novel major/minor combinations,which promote “greater integration across curricular domains” (p. 34). Greater inte-gration may be efficiently achievable through double majoring by choosing majorsamong existing options. Of course, in the absence of a private economic payoffto double majoring, students might forgo taking on additional work or challenges.Furthermore, there may be institutional barriers to double majoring in diverse fields.
We use data from the 2010 National Survey of College Graduates (NSCG) toprovide recent evidence about whether there is a private economic payoff to dou-ble majoring. In addition to examining the relation between double majors and the
2 For instance, President Obama proposed the creation of a STEM Master Teacher Corps in July 2012.More recently, as part of an executive agenda to improve the economic situation of working womenand promote equality in the workplace, the President has proposed new programs that will lead to morewomen pursuing degrees in science and technology. See Sarah Wheaton, “Obama to Promote ExpandedEconomic Opportunities for Women,” The New York Times, March 20, 2014, http://nyti.ms/1qXHypj.3 For example, see Tamar Lewin, “As Interest Fades in the Humanities, Colleges Worry,” The New YorkTimes, October 30, 2013, http://www.nytimes.com/2013/10/31/education/as-interest-fades-in-the-humanities-colleges-worry.html, and William Pannapacker, “No More Digitally Challenged Liberal-ArtsMajors,” The Chronicle of Higher Education, November 18, 2013, http://chronicle.com/article/No-More-Digitally-Challenged/143079/. We note that despite these concerns, the National Center for Educa-tion Statistics IPEDS data (http://nces.ed.gov/programs/digest/d13/tables/dt13 318.20.asp) indicate thathumanities and social science majors have remained fairly steady over the past 20 years, suggesting theconcerns are more about the future of the arts, humanities, and social science fields.

294 Alison F. Del Rossi and Joni Hersch
private financial benefits of education, we also seek to address the concerns regard-ing broader societal benefits of diverse educational backgrounds and to obtain ageneral sense of the overall societal desirability of double majors.
The components of a benefit-cost assessment of double majors consist of bothmonetized and nonmonetized effects. Starting with costs, if students take longerto graduate with a double major than with a single major, the principal additionalprivate costs include the opportunity cost of delayed entry into the labor market andthe direct costs of additional tuition, fees, and room and board. In addition, doublemajoring may crowd out students from some educational opportunities if there arecapacity constraints at universities or in majors within a university. There may alsobe costs associated with the extra effort, although Pitt and Tepper (2012) find thatstudents report little to no added stress from pursuing a double major. Overall, theempirical evidence we present later suggests that the costs associated with doublemajoring do not loom particularly large.
The benefit components are more diverse and are amenable to our empiricalanalysis. To identify the benefits of double majoring, we distinguish three cate-gories consistent with the approach advocated in the Office of Management andBudget (2003) guidelines: monetized benefits, quantified but not monetized bene-fits, and benefits that are not quantified.4 We first address the monetary returns todifferent types of double majors in terms of the incremental rates of return that theyyield.5 If those who double major are self-selected based on their greater ability, theprivate return to encouraging greater double majoring may be small, or even neg-ative. Second, we estimate the relation of different double majors with a series ofmeasures that capture many of the broader possible dividends of double majors bothfor the individual and society, including research and development, job matching,and job satisfaction. Although these effects are not monetized, they do highlightthe factors that appear to be most influential, particularly effects on research anddevelopment and job matching.
Our analysis provides updated information on the monetized benefits compo-nent – whether double majors have higher earnings relative to those with singlemajors in a field, as well as estimates of the returns to different combinations of
4 In particular, the Office of Management and Budget (2003) instructs agencies to “include separateschedules of the monetized benefits and costs,” “list the benefits and costs you can quantify but cannotmonetize,” and “describe benefits and costs you cannot quantify.” This approach implements proceduresassociated with the recognition in Section 1(b)(6) of Executive Order 12866, October 4, 1993, that “somecosts and benefits are difficult to quantify . . . ”.5 As in Blomquist et al. (2014), and in much of the economics literature, we use the term “returns” todescribe the estimated differences in earnings for different majors and other education measures. Werecognize that the estimated differences in earnings – the returns – may be due to both the major choiceitself (different skills and knowledge gained from different majors) and to differential selection intovarious majors by ability.
The private and social benefits of double majors 295
double majors. We specifically address whether combining a liberal arts major –which we define as an arts, humanities, or social science major – with the higherpaying STEM or business majors provides an economic payoff. Although theAAAS report makes no mention of individual economic returns from studyingthe liberal arts, the broader skill set and knowledge and the ability to adapt andbe flexible, all discussed in the report, could lead to better job opportunities andhigher earnings. We also examine the broader ramifications of double majors onjob-related research and development activities, job matching, and job satisfaction,making it possible to evaluate the extent to which double majoring across variouscombinations of fields relates to overall social benefits.6
Whether or not double majoring is associated with higher earnings is addressedin Del Rossi and Hersch (2008). Using data from the 2003 NSCG, Del Rossi andHersch show that double majors have higher earnings than single majors, with thelargest gains occurring among those who have double majors across disparate areas.In addition to examining a broader set of social measures, this paper makes distinc-tive contributions beyond the analysis of Del Rossi and Hersch (2008). First, we usedata from the more recent 2010 NSCG in our analysis. This allows for an examina-tion of possible differences in returns to majors that may have arisen from changesin the economic environment following the Great Recession.7 Second, given thecontinued gender differences in choice of college majors, we allow for the returnsto different single and double major combinations to vary by gender.
In support of proponents who claim an advantage to educational breadth, wegenerally find that double majoring across disciplinary groups is associated withhigher returns than double majoring within a disciplinary group. Despite the addi-tional skills that supporters claim liberal arts majors develop, we find little evidencethat the combination of a liberal arts major with a business or STEM major is asso-ciated with higher returns to the earnings of college graduates than graduates witha single major in business or STEM fields.
Even when there is not a substantial private return to double majors, there couldbe important societal benefits. Although there has been substantial research esti-mating the private returns to education and some research estimating the returnsto specific college majors, there is little investigation of the social returns to edu-cation in addition to private benefits. An exception is Blomquist, Coomes, Jepsen,
6 The AAAS report describes a broader range of social benefits to liberal arts education than we areable to address with available data. For instance, an important social benefit of education is greatercivic engagement such as voter participation and volunteering. Our data do not allow us to analyze civicengagement directly. We make use of available information on individuals’ perceptions of the impor-tance and value of the social contribution of their job and do not find differences by double majoring.7 For example, those with double majors may be able to move more readily between industries andoccupations in response to downsizing that occurred in the recession.

296 Alison F. Del Rossi and Joni Hersch
Koford and Troske (2014), who find substantial social benefits to community col-lege education. Blomquist et al. (2014) compare the societal gains to communitycollege education versus high school education. Our objective is similarly focusedon examining broader societal benefits to education, but our context differs in thatwe seek to identify whether the private benefits to double majoring provide suffi-cient incentive to induce students to choose double majors in a way to enhance thesocial value provided by broader based liberal arts training.
In terms of social benefits, we find that certain fields and disparate double majorcombinations have stronger relations with research and development (R&D) activ-ities and job match, but little evidence that job satisfaction varies significantly bymajor. Mirroring some of the earnings results, compared to single STEM majors,double major combinations that include a STEM major are generally no more likelyto have positive social benefits of more research and development and often havelower likelihood of a close job match. Broadly speaking, graduating with a liberalarts major tends to be related to lower job match quality compared to other fields,while graduating with a double major in liberal arts and business may enhanceresearch and development compared to graduating with a single major in liberalarts or business.
These findings of enhanced R&D associated with combining liberal arts andbusiness supports the AAAS arguments that educational breadth is socially valu-able. But the fairly limited private earnings benefit to this combination suggestslittle incentive for students to pursue this double major combination.
2 Background
Although there has been substantial research on the economic returns to collegemajors, there is far less understanding of how students choose majors, and littleinformation on the choice of double majoring. Bettinger (2010) provides a valuablesummary of the two conceptual frameworks that have been used to explain howstudents choose their college major. As Bettinger discusses, one framework drawson psychology and sociology and relates personality types to careers, which canthen inform students of suitable college majors. The second framework draws onthe human capital model, in which students make educational decisions (such ascollege attendance and major) to maximize their expected lifetime utility. Clearly,selection into majors is a fundamental concern, and data availability leads mostanalyses of college major choice to take a selection on observables approach. Alarge step forward in analyzing major choice is provided by Kirkeboen, Leuven andMogstad (2016), who use Norwegian data on students’ ex ante ranking of degree

The private and social benefits of double majors 297
programs combined with exogenous institutional cutoffs on application scores intoprograms to credibly estimate the return to a college major relative to the individualstudent’s next best alternative.
Double majoring was ignored in the economics literature prior to the work ofDel Rossi and Hersch (2008). Since their research was conducted, there have beenadditional studies examining double majors. The same concerns about selectionbias that arise in choice of majors similarly hold for the decision to double majoror to select a combination of majors.
Accordingly, the empirical literature following Del Rossi and Hersch (2008)has likewise taken a selection on observables approach to estimate the returnsto double majoring relative to having a single major in a field.8 Hemelt (2010)performs an analysis similar to that of Del Rossi and Hersch (2008) also usingthe 2003 NSCG and finds a premium from double majoring similar to theirs thatranges from 2.6 to 3.2% for individuals whose highest degree is a bachelor’s.Like Del Rossi and Hersch (2008), Hemelt (2010) finds that the highest gains todouble majoring come from combining majors that are more technical or practical– business, computer science, and engineering. Pitt and Tepper (2012), in examin-ing average earnings by single majors and combinations of majors using the 2003NSCG, find that combining a humanities degree with majors in business, socialsciences, and education is associated with higher average salaries, supporting thearguments of the AAAS report.9 Other studies on double majoring are based onevidence from single universities rather than national samples and do not examineearnings consequences associated with double majors.10
As the AAAS study emphasizes, education has a variety of social benefits apartfrom the direct effect on worker earnings which our data permit us to explore.Research and development is expected to be strongly related to STEM training,
8 We note, however, that for students who double major, one of their single majors may be consideredtheir next best alternative, making our analysis in the spirit of Kirkeboen et al. (2016) who demonstratethat information on the next best alternative is required to identify payoffs to fields of study.9 Pitt and Tepper (2012) examine a wide range of issues surrounding double majoring including, butnot limited to: students’ perceptions of gains in creativity and integration, involvement with faculty-mentored research, reported purpose for choosing a double major, reported job match, and graduatedegree attainment.10 Zafar (2012) examines how subjective beliefs about outcomes associated with majors influence thechoice of double major combinations. The study finds that the most important motivations for choiceof both majors are enjoying the coursework and parental approval, and that students pair majors toenhance their job market prospects. Zafar finds no support for the “one major for me, one for my par-ents” hypothesis, as the results show that students care about their parents’ view of both of their majors.Russell, Dolnicar and Ayoub (2008) find, in contrast to Del Rossi and Hersch (2008), that in the Aus-tralian system, it is evidently more difficult to graduate with two majors within the same time as for asingle major. Riley (2008) finds that both male and female students who double major have higher gen-eral ability, and female students who double major are more balanced in their specific abilities (measuredas the absolute difference between verbal and quantitative SAT scores).
298 Alison F. Del Rossi and Joni Hersch
but supporters of liberal arts argue that a broader education that focuses on devel-oping critical thinking skills and complex problem solving as well as creativitycould enhance STEM training and lead to even more R&D, including better productdevelopment and design.11 In Pitt and Tepper (2012), students with double majorsthat cross disparate fields of study self-report greater gains in creativity from theirdouble major; the gains seem to be tied to those with an arts and humanities majoras one of their majors. Our data provide information on work activities related toR&D, and we examine whether different major combinations are more likely to beinvolved in R&D activities.
Another economic productivity relationship involves the relation of educationwith job match quality. Types of college major may influence whether worker skillsare matched appropriately to their jobs, which in turn affects both societal produc-tivity and individual earnings. There is substantial literature focusing on whetherworkers are mismatched with their jobs, with most of the concern over whetherworkers are overeducated (e.g., see the survey by McGuinness, 2006). Overedu-cation is associated with higher turnover and lower job satisfaction, and becauseeducation is heavily publicly subsidized, overeducation is also wasteful of soci-etal resources. One way that double majoring can lower the extent of mismatch isby providing workers with greater versatility in skills. Because future demand forspecific skills is uncertain, double majoring may also facilitate worker transitionsas the economy changes.12 On the other hand, double majoring may be a form ofovereducation. Using the 2003 NSCG, Pitt and Tepper (2012) find that on average,individuals with double majors are less likely to report a close relationship betweentheir job and their major.
Studies suggest that education has additional ramifications in addition to thepecuniary benefits of higher earnings (e.g., Oreopoulos & Salvanes, 2011). Weassess the impact on well-being by exploring how different double major combi-nations are related to job satisfaction. In addition to providing greater versatilityin skills that may improve job match quality, double majoring can enhance job
11 For recent examples of such arguments and the discussion of the value of liberal arts inter-personal skills to businesses, see Geoff Colvin, “Liberal Arts Majors, Rejoice! Technologistsare Learning They Need More than STEM to Create Appealing Products,” August 8, 2015,Salon, http://www.salon.com/2015/08/08/liberal arts majors rejoice technologist are learning the value of the humanities for creating more appealing products/, and George Anders, “That ‘Useless’ Lib-eral Arts Degree Has Become Tech’s Hottest Ticket,” Forbes, August 17, 2015, http://www.forbes.com/sites/georgeanders/2015/07/29/liberal-arts-degree-tech/.12 For a discussion of the downside of narrowly focusing on specialized education if demand for spe-cific skills is unpredictable, see Peter Cappelli, “Why Focusing Too Narrowly in College Could Back-fire,” Wall Street Journal, November 15, 2013, http://www.wsj.com/articles/SB10001424127887324139404579016662718868576.

The private and social benefits of double majors 299
satisfaction by creating socially valued links with a greater range of coworkers.There is also substantial evidence that job satisfaction is negatively related toworker turnover, which imposes costs on both the worker and the firm(e.g., Clark, 2001).
3 Description of the data
We use data from the 2010 NSCG, which is one of the surveys included in theScientists and Engineering Statistical Data System (SESTAT) sponsored by theNational Science Foundation. These surveys provide detailed information on edu-cation, labor market characteristics, and demographics.13 This nationally repre-sentative data set of college graduates oversamples groups of special interest tothe SESTAT program (specifically, those in science and engineering fields). Wetake into account the sample design using the provided probability weights for allreported estimates so that our estimates are representative of the entire college-educated population. All of our analyses are presented separately for males andfemales.
In addition to providing coverage of the entire college-educated population,most important for our purposes is that the NSCG survey respondents report theirprimary major field and field of second major (if any) for their first bachelor’sdegree choosing from 140 fields of study.14 We classify graduates as having a dou-ble major if they report both a major field of study and a second major that is dif-ferent than their first reported major field for their first bachelor’s degree awarded.
We group the 140 major fields available for first and second majors intofour categories of majors: education, liberal arts, business, and STEM. Educationincludes all teacher education majors. The liberal arts category includes majorsin the arts, humanities, and social sciences (excluding economics). The arts majorsinclude dramatic arts, fine arts, music, and other visual and performing arts. Human-ities majors include philosophy, religion, English literature or writing, other foreignlanguages and literatures, and history. The groupings of these two areas follow
13 For more information on SESTAT and to download data, see http://www.nsf.gov/statistics/sestat/.The 2010 NSCG is a stratified random sample of individuals who as of the survey reference date(October 1, 2010) were less than 76 years old, not institutionalized, living in the United States or ina U.S. territory, and had earned a bachelor’s degree or higher in any field by the survey reference date.14 The survey specifically asks the respondent to report a second major, if any. The variable definitionsdocument still has the phrase “second major, or minor,” which was asked in earlier waves of the survey(including the 1993 NSCG). With the exception of the relatively small, restricted use sample of theBaccalaureate and Beyond Longitudinal Study 1993/1994 (which was last followed in 2003), no othernational survey reports information on individuals’ second majors.

300 Alison F. Del Rossi and Joni Hersch
closely the definition of arts and humanities defined in the AAAS report. Thesocial science fields include anthropology, archeology, political science, psychol-ogy, and sociology. The business majors category includes traditional businessadministration, marketing and management, accounting, and economics.15 STEMfields include the natural and physical sciences, computer science, engineering, andmathematics.16
For individuals who earned a double major, these four categories – education,liberal arts, business, and STEM – yield ten possible double major combinations.However, due to the small number who double major in education with businessor with STEM fields and due to finding no significant differences in coefficientestimates on different education double majors, we combine all education dou-ble majors into one group. Therefore, there are eleven mutually exclusive possiblemajor categories used in the analysis – four single major groups and seven doublemajor combinations.
We examine earnings, R&D activities, job match, and job satisfaction. We useannual salary on the principal job as our key earnings measure.17 Respondents indi-cate whether or not certain work activities take up at least 10% of their time, andwe define an indicator for respondents who spend 10% or more of their time onany R&D activities (which include basic research, applied research, development,and design). For job match, survey respondents report whether their job is closely,somewhat, or not related to the field of their highest degree, and we define an indi-cator variable for those reporting that their principal job is closely related. Respon-dents rate their overall satisfaction with their job on a four point scale from verydissatisfied to very satisfied. We define an indicator for those reporting that theyare very satisfied. Each of these variables is regressed on a set of single majorsand double major combinations and a wide range of educational, employment, anddemographic variables available in the NSCG. We emphasize that our estimates
15 Our decision to include economics in the business major category, rather than with other socialsciences in the liberal arts category, is a reflection of the fact that many liberal arts colleges do notoffer an undergraduate business major. In institutions that do not offer an undergraduate business major,students who would otherwise choose to major in business frequently major in economics, and in theseinstitutions, business-related courses such as finance and accounting are often offered as part of theeconomics major. Moreover, economics majors tend to earn more than other social science majors (e.g.,Carnevale, Cheah & Strohl, 2012), and economics, found to be the second most frequently chosen fieldfor double majoring by Pitt and Tepper (2012), is seen as a “utilitarian” or “business-related” major bystudents (pp. 11–12).16 A full mapping of majors from the 2010 NSCG survey to our categories will be available online.17 The specific question on which this measure is based is: “Before deductions, what was your basicannual salary on this job [that is, the principal job] as of the week of October 1, 2010?” The questionincludes the instruction in parentheses: “Do not include bonuses, overtime, or additional compensationfor summertime teaching or research.” Those who are not salaried are asked to estimate their earnedincome, excluding business expenses.

The private and social benefits of double majors 301
provide information on the correlation between major or combination of majorsand earnings, R&D activities, job match, and job satisfaction, but these are notestimates of causal effects.
In addition to including information on majors and combinations of majors, theregressions control for educational attainment beyond the first bachelor’s degreederived from type and field of highest degree, with mutually exclusive indicatorsfor those with an MBA, master’s in a nonbusiness field, PhD, MD, JD, or otherprofessional degree. We also define an indicator variable for whether the respondenthas an additional bachelor’s degree (which would differ from a double major in thatthe additional bachelor’s degree would be awarded at a different time than the firstbachelor’s degree).
The regressions also control for demographic characteristics of race (withmutually exclusive categories of white, Black/African American, Asian, Ameri-can Indian/Alaskan native, Native Hawaiian/Pacific Islander, more than one race;white is the omitted category in the regressions), whether Hispanic or Latino ethnic-ity, and whether married or living in a marriage-like relationship (hereafter simplyreferred to as “married”). We control for employment characteristics as follows.An indicator variable for whether the respondent is a part-time worker, derivedfrom working less than 35 hours per week, is included. We also control in theregressions for tenure on the job and its square. Because information on total actualwork experience is not available, we proxy experience by age, and control for ageand its square.18 Additional control variables included in earnings regressions areindicators for class of worker (self-employed or private employer, with govern-ment employer as the excluded category) and for whether the principal employer islocated in the South.
Because the measures we examine – earnings, R&D activities, job match, andjob satisfaction – are available only for those who are employed, we make thefollowing sample restrictions to create our regression sample. First, because weexamine degree fields for the first bachelor’s degree, we eliminate observations forwhich field of first bachelor’s degree is not reported. We also restrict the sampleto those who are employed, have not previously retired, are not currently full-timestudents in a degree program, and have earnings greater than or equal to $4000.We also drop the few observations that report “other” as their type of employer.Appendix A indicates the number of observations that are eliminated by each of the
18 As an alternative to age, we used potential experience defined as elapsed time between current ageand year of highest degree. Regressions based on this measure of potential experience instead of ageyield estimates that are essentially the same in terms of magnitude and statistical significance of thereturns to different single and double major categories.

302 Alison F. Del Rossi and Joni Hersch
restrictions for both males and females. These restrictions result in sample sizes of30,615 employed males and 22,506 employed females. As we also examine statis-tics for the full sample (not restricted to those employed), Appendix A also showsthe sample sizes and effects of restrictions for all respondents.19
4 Types of majors and comparisons of single anddouble majors
Before turning to our regression estimates, we begin by examining sample charac-teristics by single or double major status for the full sample, regardless of employ-ment status. We expect that if stronger students self-select into double majoring,the observable characteristics that are positively correlated with student ability willalso be higher. For example, double majoring may be associated with the type ofeducational institution, which in turn is related to institutional selectivity and thecorresponding ability of the students. Furthermore, advantages associated with dou-ble majoring may be reflected in a greater likelihood of employment or of earninga graduate degree.
Thus, we start by presenting in Table 1 the following statistics, stratified bysingle or double major as well as by sex for the full sample: labor force participa-tion rate, employment rate, highest degree (e.g., additional BA degree, MBA, JD,PhD, etc.), and parents’ education. We also provide information on age, ethnicity,and race. To examine whether double majoring is related to institution type, we usethe groupings defined in Hersch (2013), which show how Carnegie classificationsmap into measures of college selectivity. These groupings (and labels as used inHersch) are as follows: Private Research I and II (tier 1); Private Liberal Arts I(tier 2); Public Research I (tier 3); and remaining U.S. institutions that are not spe-cial focus (tier 4), with a fifth category for not classified bachelor’s degrees (e.g.,special focus, non-U.S., or not available).
As Table 1 demonstrates, double majors are older on average than singlemajors, reflecting a declining rate of double majoring over time. Double majorsare more likely to have a JD, nonbusiness master’s degree, or a PhD (statisti-cally significant for females only) than single majors, but are not more likely toattain other graduate degrees, providing mixed evidence of the correlation between
19 What we term the “full sample” also eliminates respondents for which the first bachelor’s degreeinformation is missing and those who are enrolled full time in a degree program.

The private and social benefits of double majors 303
Table 1 Means or percentages by single or double major, full sample.
Males FemalesSinglemajors
Doublemajors
Singlemajors
Doublemajors
Labor force participant 88.67** 83.84 80.08** 75.61
Employed 84.65** 79.77 75.73** 71.65
Additional BA degree 3.08 2.63 3.06 3.21
MBA 8.37 8.89 3.76* 5.44
MA, not MBA 16.09* 18.71 22.90** 28.92
PhD 4.40 4.67 2.14** 2.91
MD 2.92 3.08 1.31 1.24
JD 3.34** 5.68 2.23** 3.84
Other professional degree 0.14 0.13 0.31 0.30
Bachelor’s degree tier 1 6.44 7.75 5.01 6.09
Bachelor’s degree tier 2 3.98** 6.01 4.49** 6.78
Bachelor’s degree tier 3 20.28+ 18.03 19.19** 15.65
Bachelor’s degree tier 4 54.08 54.91 58.14 59.43
Bachelor’s degree not classified 15.22+ 13.30 13.17 12.05
Father, less than bachelor’s 58.96** 64.27 59.09 61.45
Father, bachelor’s degree 22.80** 18.37 21.32 19.53
Father, graduate degree 18.24 17.35 19.59 19.02
Mother, less than bachelor’s 70.07+ 72.83 69.28 69.67
Mother, bachelor’s degree 20.23** 15.93 19.97 19.56
Mother, graduate degree 9.70 11.24 10.74 10.77
Age 47.07** 51.08 44.83** 48.62
(13.22) (13.33) (12.92) (13.50)
Hispanic/Latino 6.20 6.86 7.28 6.89
White 83.92 83.72 81.81* 84.39
Black/African American 5.38+ 7.00 8.05 7.02
Asian 8.66+ 7.27 7.43 6.77
American Indian/Alaskan Native 0.36 0.61 0.36 0.31
Native Hawaiian/Other Pacific Islander 0.37** 0.10 0.30 0.36
Multiple races 1.31 1.30 2.04** 1.15
N 32,493 7,994 24,101 7,220
Note: Authors’ calculations from the 2010 National Survey of College Graduates. Standard deviationsfor continuous variables are given in parentheses. All values are calculated using NSCG sampleweight. The following indicates statistically significant differences in means across those with singlemajors compared to those with double majors: + p < 0.10; * p < 0.05; ** p < 0.01.

304 Alison F. Del Rossi and Joni Hersch
double majoring and ability.20 Type of institution matters as well, as those withdouble majors are more likely to be graduates of selective private liberal arts col-leges than those with single majors and less likely to have graduated from a publicresearch institution. The greater concentration of private liberal arts college grad-uates among double majors may reflect greater ability of those students. Alterna-tively, as tier 3 schools are also selective, the differences in the likelihood of singleor double major achievement between tier 2 and tier 3 graduates may reflect barriersto double majoring at large, public research universities and the administrative easeof double majoring and encouragement of multidisciplinary exploration at liberalarts colleges.
Parents’ education is often used as a proxy for socioeconomic background orability, but among females, there are no significant differences in mother’s edu-cation by single or double major status. Among males, there is a greater share ofmothers and fathers with less than a bachelor’s degree and a smaller share of moth-ers and fathers with bachelor’s degrees amongst graduates with a double major.Notably, and somewhat surprisingly, employment and labor force participation ratesare higher for single majors than double majors. One possible explanation for thelower employment and labor force participation rates may be related to the higheraverage age of double majors in that a greater share may be retired, but when werestrict to those under age 65, we continue to find these rates are lower for doublemajors, although the differences are not statistically significant for females.21
For the rest of our analysis, we focus on the employed sample. To furtherexplore additional costs associated with double majoring as well as possible dif-ferences in ability, Table 2 reports the mean years between high school graduationand completion of the first bachelor’s degree, by single and double majoring choice
20 Consistent with the analysis of means, probit regressions controlling for age, race and parents’ edu-cation show that double majoring has a positive and statistically significant relation with the probabilityof attaining a graduate degree for both males and females. In probit regressions of the probability ofattaining specific types of graduate degrees, having a double major has a positive and significant relationon having a JD or nonbusiness master’s degree for males. For females, double majoring has a positiveand significant relation with the probability of attaining a JD, MBA, nonbusiness master’s degree, and amuch smaller significant relation on the probability of attaining a PhD.21 To directly examine which individual characteristics are associated with double majoring, we esti-mated regressions by sex of the probability of graduating with a double major, controlling for demo-graphics and institution type. With the exception of a positive association with age, we find little evi-dence that demographics matter, while institution type is strongly associated with double majoring, withthose who attended tier 1 and tier 2 schools more likely to graduate with a double major. These resultswill be made available online. We also note at this point that, as expected from the regression predict-ing the probability of graduating with a double major, our efforts to instrument for double majoringin the earnings regression were not successful. The NSCG includes little information that would affectthe decision to double major but not also affect earnings. We used location in high school and parents’education as instruments but found, as in Del Rossi and Hersch (2008), the first stage showed very littleexplanatory power of the excluded instruments.

The private and social benefits of double majors 305
Table 2 Mean years between high school and first bachelor’s degree.
Males FemalesSinglemajors
Doublemajors
Allmajors
Singlemajors
Doublemajors
Allmajors
Bachelor’s degree tier 1 5.02+ 4.59 4.93 4.65 4.52 4.62
Bachelor’s degree tier 2 4.61+ 4.21 4.52 4.78 4.57 4.73
Bachelor’s degree tier 3 5.57 5.60 5.58 5.83 5.41 5.76
Bachelor’s degree tier 4 6.53+ 6.10 6.46 7.31 7.26 7.30
Bachelor’s degree not classified 6.33 6.12 6.30 7.79 7.28 7.69
All observations 6.13* 5.77 6.07 6.83 6.61 6.79
Note: Authors’ calculations from the 2010 National Survey of College Graduates. All values arecalculated using NSCG sample weight. The following indicates statistically significant differences inmeans across double major status within gender: + p < 0.10; * p < 0.05.
and type of bachelor’s institution. Across single and double majoring status, grad-uates of tier 1 and tier 2 schools spend less time between high school graduationand bachelor’s degree completion, and the differences in years are not statisticallydifferent between tier 1 and tier 2 schools. Tier 4 institutions and the not classi-fied schools have the longest mean times to completion.22 With the exception oftier 3 for males, the average time between high school and first bachelor’s degreecompletion within each tier is less for those with double majors, but these mean dif-ferences are not significantly different except for three instances noted in Table 2.For females, none of the differences in mean time across single and double majorsare statistically significant. Interestingly, female college graduates take longer onaverage than males to achieve their first bachelor’s degree. There is little evidencefrom the statistics in Table 2 that double majoring in general leads to students tak-ing additional time to graduate, so there are unlikely to be added time and tuitioncosts to double majoring.
Appendix B provides sample characteristics for the variables used in the regres-sion. As noted in Appendix B, 17% of males and 19% of females earned a doublemajor with that difference statistically significant at the 1% level; the rate of doublemajoring pooling males and females is 18%, the same rate found in the 2003 NSCGby Del Rossi and Hersch (2008).
Table 3 reports the distribution of majors for males and females. All differencesin means for males and females are statistically significant at the 1% level, except
22 For females who graduate with a single major, the difference in mean years between tier 4 andnot classified institutions is statistically significant; for all other columns, the mean years between highschool and first bachelor’s degree are not statistically different across these two types of institutions.

306 Alison F. Del Rossi and Joni Hersch
Table 3 Distribution of majors.
Males Females
Education 4.38** 12.54
Liberal arts 24.52** 31.61
Business 24.01** 15.92
STEM 30.08** 20.78
Two liberal arts 4.00** 5.90
Two business 3.70 2.90
Two STEM 3.48** 1.70
Any education double major 1.63** 4.88
Business and liberal arts 1.72 1.74
Business and STEM 1.37** 0.56
STEM and liberal arts 1.11** 1.46
N 30,615 22,506
Note: Authors’ calculations from the 2010 National Survey of College Graduates. The percent bygender in each major or combination of majors is reported. All values are calculated using NSCGsample weight. ** indicates statistically significant difference in means across gender: p < 0.01.
for double majors with two business majors and double majors in business and lib-eral arts. Females are almost three times more likely to major in education, and theyhave higher rates of majoring in liberal arts fields. These differences are mirroredby the higher rates of majoring in STEM fields for males, who are approximately45% more likely to earn a single major in a STEM field and twice as likely to earna double major in two STEM fields as females. Males are also more likely to singlemajor in business fields (close to 50% higher than the female rate).
Notably, a substantial share of the sample reports liberal arts as either their sin-gle major or as one of their double majors – 31% for males and 41% for females(not including any education–liberal arts double majors). In terms of types of dou-ble major combinations, few graduate with the disparate combination of liberalarts and business or liberal arts and STEM that would seem to provide the mostbroad or diverse range of skills and perspectives. The higher percentage of dou-ble majors within the same category compared to double majors across differentcategories may reflect institutional barriers that make completing requirements fortwo majors that are offered in different colleges difficult, such as differences ingeneral education or core requirements, academic calendars, and course times.For example, science lab times and performance-based courses may cut acrosstime blocks and limit student opportunities to fulfill requirements associated withother majors.

The private and social benefits of double majors 307
5 Empirical specification and hypotheses
The principal monetized benefit of education, and the primary focus of economicsresearch, is on the returns to education. Accordingly, we begin by estimating con-ventional log earnings equations augmented with indicators for college major fieldsof the general form indicated in equation (1):
ln Yi = X iβ + Siγ + Diδ + εi (1)
Yi represents individual i’s earnings, and X i is a vector of demographic, educa-tional, and employment-related characteristics, such as race, graduate degree, andemployer type. The vector Si includes indicators for field of major for those witha single major. The vector Di includes indicators for various double major com-binations. These single and double major categories are mutually exclusive. Thecoefficient parameters to be estimated are the vectors β, γ and δ, and εi is the ran-dom error term. We estimate corresponding equations by probit for our other com-ponents of benefits by replacing earnings with indicators of R&D activities, jobmatch quality, and job satisfaction, where we examine whether respondents spend10% or more of their work time on R&D activities, whether their job is closelyrelated to their highest degree field, and whether respondents are very satisfied withtheir principal job.
Our hypotheses with respect to the benefit components are of two types,although the following discussion emphasizes the expected relation of doublemajoring with monetary returns. First, we test hypotheses comparing the returnsto a single major to that of a double major which includes that single major as oneof the two majors. For example, we compare the returns to having a single major inbusiness with the returns to having a double major in which one of the two majorsis in a business field and the other major is outside of the business field. We mightexpect that the return when a second major is added would be greater than thereturn to a single major due to additional breadth and skills. This result would lendsupport to the argument that students can diversify their marketable skill set with aliberal arts major. However, if double majoring leads to lower grades or sacrificesdeeper knowledge of a field, double majors may have lower returns than those withcorresponding single majors. Also, the reason for double majoring may affect thereturn to the double major. For example, pairing a chemistry major with an educa-tion major may be associated with lower pay than a single major in chemistry if thereason for the double major is to gain certification as a science teacher.
Our second set of hypotheses compares returns to double major combinationsthat are likely to provide different types of knowledge and approaches with thosemajor combinations that would largely provide similar training. Double majoring

308 Alison F. Del Rossi and Joni Hersch
within closely related fields may have limited value in terms of providing broaderknowledge and different perspectives, approaches, or skill sets. Del Rossi andHersch (2008) found that the return to having dissimilar majors is greater thanthe return to having similar majors, and we examine whether this result holds upfor more recent data and whether this is true across all disparate combinations.23
6 Earnings, R&D, job match, and job satisfactionregression results
The first columns of Tables 4A and 4B report results from the earnings regressionsfor males and females, respectively. The regressions show the usual results withrespect to the demographic and job-related variables. The regressions also showsubstantially higher earnings among those with professional and graduate degreesrelative to those whose highest degree is a bachelor’s, with females receiving largerreturns than males for nonbusiness master’s degrees, PhDs, and other professionaldegrees. We also find that returns to the different single and double major categoriesare very similar for males and females. In fact, in a pooled regression there are nostatistically significant interactions of single or double major combinations with themale indicator variable. That is, although the distribution of majors across malesand females is significantly different, the returns to majors are not. This patternof results is different from a number of earlier studies including Brown and Cor-coran (1997) and Eide (1994), but more recent studies report mixed findings. Forinstance, Graham and Smith (2005) find that whether males and females receivesimilar returns to science and engineering majors depends on whether or not theywork in a science and engineering occupation. McDonald and Thornton (2007) findthat average starting salaries for male college graduates exceed that of females formost fields through 2001. Zhang (2008) finds that both the distribution of collegemajors and the returns to those majors contribute to the gender earnings gap. Mor-gan (2008) finds that within-major pay penalties are virtually zero for professionaland scientific fields but present for business, social science, and humanities majors.
23 As in Del Rossi and Hersch (2008), we also investigate whether or not having any double majorpair is associated with higher earnings by estimating earnings regressions with an indicator for havinga double major rather than indicators for major categories. In contrast to Del Rossi and Hersch (2008),who found that having a double major is associated with earnings that are 1.4 to 2.3% higher, we do notfind a statistically significant relation between having any double major and earnings. The lack of higherreturns to having any double major during the recession relative to the returns in the strong economyof 2003 may represent the greater value of double majors in a tighter economic environment. Theseregression results will be available online.

The private and social benefits of double majors 309
Table 4A Benefits to double majors, males.
Earnings R&D Job match Job satisfaction
Liberal arts 0.042 0.085+ −0.150** −0.085+
(0.044) (0.049) (0.050) (0.048)
Business 0.196** 0.022 −0.078 −0.082
(0.048) (0.051) (0.053) (0.050)
STEM 0.293** 0.246** −0.011 −0.062
(0.041) (0.044) (0.048) (0.046)
Two liberal arts 0.049 0.134* −0.190** −0.086
(0.058) (0.057) (0.057) (0.055)
Two business 0.197** 0.128+ −0.012 −0.151*
(0.073) (0.067) (0.071) (0.063)
Two STEM 0.277** 0.281** −0.023 −0.052
(0.048) (0.040) (0.052) (0.049)
Any education double major −0.003 0.028 −0.093 0.006
(0.081) (0.077) (0.071) (0.076)
Business and liberal arts 0.302** 0.193** −0.204** −0.078
(0.085) (0.066) (0.072) (0.070)
Business and STEM 0.368** 0.175** −0.044 −0.104+
(0.060) (0.061) (0.065) (0.057)
STEM and liberal arts 0.302** 0.231** −0.106+ −0.102*
(0.052) (0.047) (0.057) (0.052)
Additional BA degree 0.009 −0.019 0.149** −0.066*
(0.038) (0.038) (0.033) (0.032)
MBA 0.318** −0.017 0.118** 0.016
(0.034) (0.030) (0.028) (0.030)
MA, not MBA 0.119** 0.032 0.245** 0.083**
(0.021) (0.020) (0.016) (0.019)
PhD 0.290** 0.286** 0.350** 0.118**
(0.029) (0.022) (0.014) (0.023)
MD 0.807** −0.209** 0.461** 0.222**
(0.044) (0.026) (0.009) (0.026)
JD 0.566** −0.187** 0.409** 0.100*
(0.050) (0.036) (0.015) (0.039)
Other professional degree 0.379** −0.174* 0.392** 0.232**
(0.087) (0.074) (0.034) (0.074)
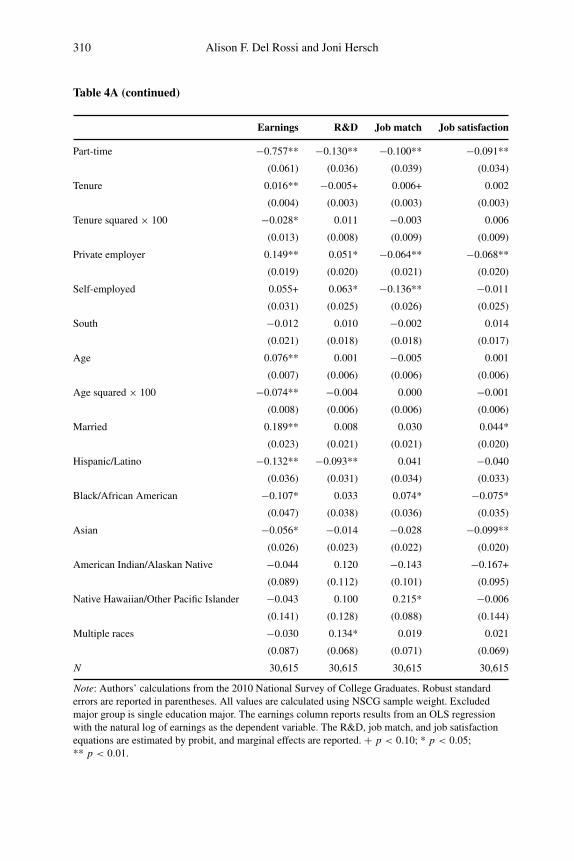
310 Alison F. Del Rossi and Joni Hersch
Table 4A (continued)
Earnings R&D Job match Job satisfaction
Part-time −0.757** −0.130** −0.100** −0.091**
(0.061) (0.036) (0.039) (0.034)
Tenure 0.016** −0.005+ 0.006+ 0.002
(0.004) (0.003) (0.003) (0.003)
Tenure squared × 100 −0.028* 0.011 −0.003 0.006
(0.013) (0.008) (0.009) (0.009)
Private employer 0.149** 0.051* −0.064** −0.068**
(0.019) (0.020) (0.021) (0.020)
Self-employed 0.055+ 0.063* −0.136** −0.011
(0.031) (0.025) (0.026) (0.025)
South −0.012 0.010 −0.002 0.014
(0.021) (0.018) (0.018) (0.017)
Age 0.076** 0.001 −0.005 0.001
(0.007) (0.006) (0.006) (0.006)
Age squared × 100 −0.074** −0.004 0.000 −0.001
(0.008) (0.006) (0.006) (0.006)
Married 0.189** 0.008 0.030 0.044*
(0.023) (0.021) (0.021) (0.020)
Hispanic/Latino −0.132** −0.093** 0.041 −0.040
(0.036) (0.031) (0.034) (0.033)
Black/African American −0.107* 0.033 0.074* −0.075*
(0.047) (0.038) (0.036) (0.035)
Asian −0.056* −0.014 −0.028 −0.099**
(0.026) (0.023) (0.022) (0.020)
American Indian/Alaskan Native −0.044 0.120 −0.143 −0.167+
(0.089) (0.112) (0.101) (0.095)
Native Hawaiian/Other Pacific Islander −0.043 0.100 0.215* −0.006
(0.141) (0.128) (0.088) (0.144)
Multiple races −0.030 0.134* 0.019 0.021
(0.087) (0.068) (0.071) (0.069)
N 30,615 30,615 30,615 30,615
Note: Authors’ calculations from the 2010 National Survey of College Graduates. Robust standarderrors are reported in parentheses. All values are calculated using NSCG sample weight. Excludedmajor group is single education major. The earnings column reports results from an OLS regressionwith the natural log of earnings as the dependent variable. The R&D, job match, and job satisfactionequations are estimated by probit, and marginal effects are reported. + p < 0.10; * p < 0.05;** p < 0.01.

The private and social benefits of double majors 311
Table 4B Benefits to double majors, females.
Earnings R&D Job match Job satisfaction
Liberal arts 0.082* 0.049 −0.198** −0.052
(0.033) (0.033) (0.034) (0.032)
Business 0.209** −0.038 −0.099* −0.029
(0.042) (0.039) (0.042) (0.039)
STEM 0.329** 0.111** 0.019 −0.008
(0.031) (0.031) (0.033) (0.030)
Two liberal arts 0.133** 0.078+ −0.183** −0.004
(0.045) (0.041) (0.043) (0.040)
Two business 0.251** 0.074 0.002 −0.067
(0.088) (0.067) (0.070) (0.065)
Two STEM 0.339** 0.186** −0.054 −0.004
(0.046) (0.040) (0.044) (0.039)
Any education double major 0.133** 0.100* −0.151** −0.039
(0.047) (0.048) (0.050) (0.047)
Business and liberal arts 0.126 0.132+ −0.178* −0.007
(0.108) (0.072) (0.077) (0.076)
Business and STEM 0.317** 0.129+ −0.225** 0.014
(0.085) (0.077) (0.076) (0.072)
STEM and liberal arts 0.252** 0.124** −0.105* −0.037
(0.055) (0.046) (0.050) (0.045)
Additional BA degree 0.012 −0.033 0.099** −0.021
(0.037) (0.035) (0.033) (0.036)
MBA 0.330** 0.094* 0.032 −0.020
(0.040) (0.040) (0.039) (0.040)
MA, not MBA 0.195** 0.109** 0.245** 0.077**
(0.020) (0.019) (0.016) (0.019)
PhD 0.386** 0.375** 0.260** 0.036
(0.029) (0.023) (0.021) (0.027)
MD 0.809** −0.061 0.379** 0.205**
(0.059) (0.040) (0.010) (0.037)
JD 0.611** −0.135** 0.332** 0.045
(0.072) (0.040) (0.022) (0.047)
Other professional degree 0.611** 0.059 0.366** 0.169**
(0.044) (0.057) (0.013) (0.059)

312 Alison F. Del Rossi and Joni Hersch
Table 4B (continued)
Earnings R&D Job match Job satisfaction
Part-time −0.810** −0.161** −0.098** −0.048*
(0.031) (0.018) (0.022) (0.021)
Tenure 0.026** 0.001 0.006+ 0.003
(0.004) (0.003) (0.003) (0.003)
Tenure squared × 100 −0.055** −0.004 0.006 0.009
(0.012) (0.011) (0.012) (0.010)
Private employer 0.065** 0.044* −0.133** −0.054**
(0.022) (0.019) (0.020) (0.019)
Self-employed −0.040 0.016 −0.209** −0.039
(0.035) (0.026) (0.029) (0.027)
South −0.064** −0.015 −0.042* 0.005
(0.022) (0.018) (0.019) (0.018)
Age 0.047** −0.004 0.011+ 0.000
(0.007) (0.006) (0.006) (0.006)
Age squared × 100 −0.050** 0.001 −0.017* 0.001
(0.008) (0.007) (0.007) (0.007)
Married 0.045* −0.022 0.054** 0.094**
(0.020) (0.018) (0.019) (0.018)
Hispanic/Latino −0.120** 0.039 0.013 0.048
(0.042) (0.032) (0.032) (0.033)
Black/African American 0.013 0.011 −0.080* −0.125**
(0.038) (0.031) (0.032) (0.029)
Asian −0.001 −0.011 −0.013 −0.159**
(0.032) (0.027) (0.029) (0.024)
American Indian/Alaskan Native −0.115* 0.013 −0.059 −0.090
(0.057) (0.108) (0.099) (0.088)
Native Hawaiian/Other Pacific Islander 0.030 0.065 0.283** −0.112
(0.100) (0.126) (0.054) (0.109)
Multiple races 0.035 0.124* −0.141* −0.083
(0.077) (0.060) (0.067) (0.058)
N 22,506 22,506 22,506 22,506
Note: Authors’ calculations from the 2010 National Survey of College Graduates. Robust standarderrors are reported in parentheses. All values are calculated using NSCG sample weight. Excludedmajor group is single education major. The earnings column reports results from an OLS regressionwith the natural log of earnings as the dependent variable. The R&D, job match, and job satisfactionequations are estimated by probit, and marginal effects are reported. + p < 0.10; * p < 0.05;** p < 0.01.

The private and social benefits of double majors 313
In a comparison of returns to different majors, Tables 4A and 4B results showthat, relative to the excluded category of a single major in education, most otherfields are associated with higher earnings. The returns for males to single liberalarts majors, double liberal arts majors, and double majors that include educationare not statistically different from the single education major, and the business andliberal arts double major for females has an insignificant coefficient. For males,business majors (single or having two business majors) have the lowest additionalreturn of 22% more than single education majors, and the business–STEM doublemajor combination is associated with the highest returns – 44% more than singleeducation majors.24 For females, on the low end of returns, individuals with a singleliberal arts major have earnings that are 8% higher than single education majors,and at the high end, single STEM, two STEM majors, and the business and STEMdouble major combination all have returns close to 40% greater than the return to asingle education major.25
The rest of the columns in Tables 4A and 4B present marginal effects fromprobit regressions on other benefit components. From the R&D regressions, fewvariables beyond education-related variables are related to the likelihood of R&Dactivities on the job. The likelihood of R&D activities is higher for private employ-ees for both males and females and for male self-employed individuals comparedto government employees. For both genders, PhD recipients are more likely to doR&D on the job, and JDs are less likely to do R&D. For males, those with eitheran MD or other professional degree are less likely to do R&D, while for femaleshaving a master’s degree (MBA or other) leads to a higher likelihood of doing R&Dwork.
In terms of undergraduate fields of study and R&D, not surprisingly, havinga single major in STEM or a double major involving a STEM major is associatedwith higher likelihood of R&D activities on the job. Of particular interest is whethercombining liberal arts with STEM is associated with a higher probability of R&D.Individuals with double majors involving at least one liberal arts major do havea greater likelihood of R&D on the job than single education majors and singlebusiness majors and, for females, also a greater likelihood than a single liberal artsmajor.
24 The percent returns to the indicator variables for degrees and major categories are calculated bysubtracting one from the exponential of the coefficient of an indicator variable and multiplying by 100(appropriate when the dependent variable is a natural log). For example, the percent return to a STEMmajor for females is calculated as (exp(0.329)− 1)× 100 = 39%.25 Appendix C provides an overview of various robustness tests performed in analyzing the earningsreturns to double majoring. The results and discussion in the text are consistent across variations in sam-ple composition (under age 66, full-time workers only, highest degree bachelor’s degree, and graduatedegree recipients) and differing measures of earnings.

314 Alison F. Del Rossi and Joni Hersch
Next, Tables 4A and 4B show results of estimating the probability of the prin-cipal job being closely related to an individual’s highest degree. Those who earngraduate degrees, and those who complete a second bachelor’s degree, have betterjob matches. Job match likelihood is also higher with age and, for females, beingmarried. But the relation between college major and job match varies by the field.Relative to an education major, having a liberal arts major (single or in a combina-tion with any other major) is associated with a lower likelihood of a close job matchfor males and females. For females, for whom job match quality is actually higheron average, having a single business major, an education double major, or businessand STEM double major are all associated with a lower likelihood that the job isclosely related to the highest degree.
The last columns of Table 4A and 4B report estimates for job satisfaction. Formales, all graduate degrees are associated with a higher likelihood of being very sat-isfied with one’s job, while for females, a nonbusiness master’s degree, an MD, andother professional degree are associated with greater job satisfaction. Being mar-ried is associated with greater job satisfaction for both males and females. Those ofminority race have lower job satisfaction. In terms of college majors, for females,there are no statistically significant relationships of job satisfaction with single ordouble major combinations; that is, job satisfaction does not vary by college major.For males, compared to those with single education majors, individuals with a sin-gle liberal arts major, two business majors, a business and STEM double major, orthe STEM–liberal arts major combination are less likely to be very satisfied withtheir job, with the magnitude of the difference ranging from 8 percentage pointsfor single liberal arts majors to 14 percentage points for those with two businessmajors. There are no significant differences in magnitude of these effects acrossmajor groupings.
7 Comparing single majors to double majors
In Tables 5A and 5B, we summarize the results of tests of the equality of coeffi-cients for each of our benefit components for males and females, respectively, bycomparing the returns to a single major in a field to that of having a double majorthat includes that single major as one of the two majors. For example, for the earn-ings regressions, we compare the returns to a single major in the liberal arts to thereturns to having a double major where one major is in the liberal arts and onemajor is in a STEM field. In the tables, a “+” (“−”) indicates that the double majorcombination has a statistically significant higher (lower) coefficient estimate at the10% level or better than the single major to which it is being compared.
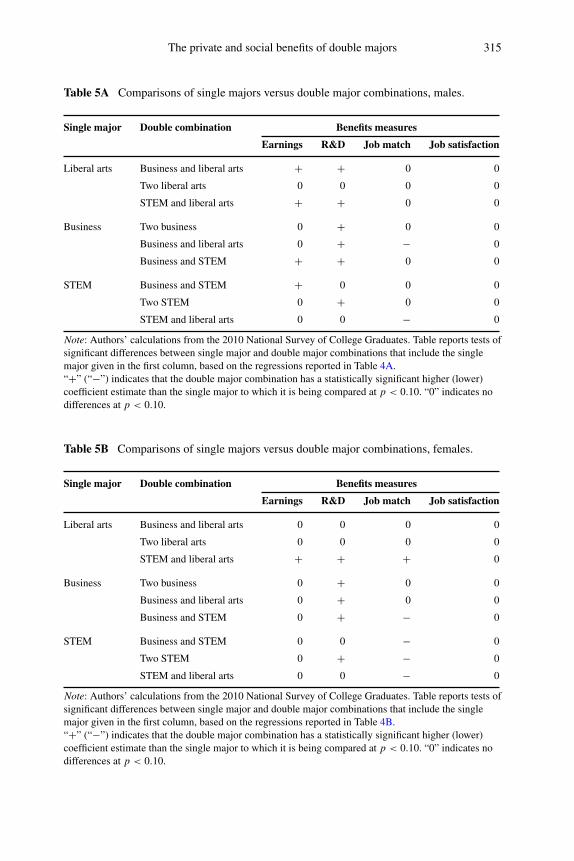
The private and social benefits of double majors 315
Table 5A Comparisons of single majors versus double major combinations, males.
Single major Double combination Benefits measuresEarnings R&D Job match Job satisfaction
Liberal arts Business and liberal arts + + 0 0
Two liberal arts 0 0 0 0
STEM and liberal arts + + 0 0
Business Two business 0 + 0 0
Business and liberal arts 0 + − 0
Business and STEM + + 0 0
STEM Business and STEM + 0 0 0
Two STEM 0 + 0 0
STEM and liberal arts 0 0 − 0
Note: Authors’ calculations from the 2010 National Survey of College Graduates. Table reports tests ofsignificant differences between single major and double major combinations that include the singlemajor given in the first column, based on the regressions reported in Table 4A.“+” (“−”) indicates that the double major combination has a statistically significant higher (lower)coefficient estimate than the single major to which it is being compared at p < 0.10. “0” indicates nodifferences at p < 0.10.
Table 5B Comparisons of single majors versus double major combinations, females.
Single major Double combination Benefits measuresEarnings R&D Job match Job satisfaction
Liberal arts Business and liberal arts 0 0 0 0
Two liberal arts 0 0 0 0
STEM and liberal arts + + + 0
Business Two business 0 + 0 0
Business and liberal arts 0 + 0 0
Business and STEM 0 + − 0
STEM Business and STEM 0 0 − 0
Two STEM 0 + − 0
STEM and liberal arts 0 0 − 0
Note: Authors’ calculations from the 2010 National Survey of College Graduates. Table reports tests ofsignificant differences between single major and double major combinations that include the singlemajor given in the first column, based on the regressions reported in Table 4B.“+” (“−”) indicates that the double major combination has a statistically significant higher (lower)coefficient estimate than the single major to which it is being compared at p < 0.10. “0” indicates nodifferences at p < 0.10.

316 Alison F. Del Rossi and Joni Hersch
We start with the earnings results, which reflect the private value of doublemajoring. For males, double majoring relative to a single major is associated withhigher earnings in some fields. Relative to a single major in the liberal arts, earningsare higher for those with one major in the liberal arts and one in business or onein STEM (and the returns are of the same magnitude for those double majors);and the business–STEM double major combination has significantly higher returnsfor males than either a single STEM major or a single business major, with thebigger incremental differences comparing single business to the business–STEMdouble major category. For females, having a second major, whether it is in thesame category or in a different category, does not result in higher returns to thebachelor’s degree, except for the higher return to those who graduate with a doublemajor in STEM and the liberal arts compared to graduates with a single major inthe liberal arts. This combination of STEM and liberal arts may lead to smallerincreased earnings for females than a single STEM major, although the differenceis not quite statistically significant at conventional levels (p = 0.109).
Turning to R&D, not surprisingly, individuals who have a double major with aSTEM major are more likely to do R&D in their principal job compared to thosewith a single liberal arts, business, or STEM major. However, the reverse is not true– combining a business major or liberal arts major with a STEM major does notincrease the likelihood of R&D activities compared to those with single majors inSTEM. The combination of liberal arts and business yields some interesting results.For males, the combination of business and liberal arts is associated with a greaterlikelihood of R&D than a single business major or a single liberal arts major. Simi-larly, for females, the business–liberal arts double major has a greater likelihood ofR&D than a single business major.
Next, the relationship between major categories and job match quality variessubstantially across gender. Table 5A shows that males who have either a STEM–liberal arts or a business–liberal arts double major combination have a lower like-lihood of a close job match than individuals with either a single business or singleSTEM major. That is, the versatility of skills gained by adding a liberal arts majorseems to reduce job match quality for males. For females, job match is higher forSTEM–liberal arts majors than for single liberal arts majors. However, females whograduate with a double major in business and STEM, liberal arts and STEM, or eventwo STEM degrees, have lower job match likelihood than single STEM majors.
As noted above in the discussion of Tables 4A and 4B, job satisfaction doesnot vary across single or double major combinations for females, and even when itdoes vary by major for males, with satisfaction lower for some majors comparedto single education majors, there are no significant differences in coefficients whencomparing single majors to double major combinations.

The private and social benefits of double majors 317
8 Comparing double major combinations
Tables 6A and 6B provide levels of statistical significance for tests of differencein returns to having various double major combinations. The question addressedis whether there are differences in returns to earnings and likelihood of R&D, jobmatch, and job satisfaction between those who have two majors within a disci-plinary group and those who have two majors that cross disciplinary groups. Interms of earnings, the hypothesis being tested is whether employers reward employ-ees who have a wide range of skills that might be learned by combining very dif-ferent majors. R&D may increase when individuals have a background that encour-ages interdisciplinary thinking and enables them to see problems from a wide rangeof cross-disciplinary perspectives. In contrast, having a broader background that isless focused on a particular field or occupation may reduce job match. In the tables,a “+” (“−”) indicates that the double major combination that crosses disciplinarygroup has a statistically significant higher (lower) coefficient estimate at the 10%level or better than the within disciplinary group major.
What is clear from these tests for male college graduates (Table 6A) is thatthere is a consistent positive relation on earnings of having a double major thatcontains at least one major from business or STEM fields, and that a double majorthat combines the two fields has higher earnings than a double major within eitherfield. The business–liberal arts and STEM–liberal arts combinations have higherearnings than two liberal arts majors, but no higher returns to earnings than dou-bling within STEM or within business. There are few differences in returns acrosssimilar or dissimilar double major combinations for females (Table 6B). Only theSTEM–liberal arts combination has statistically significant higher returns than thetwo liberal arts majors group when comparing double majors within disciplinarygroups to cross-discipline double majors.
In contrast to females, for which there are no differences in estimated coef-ficients in the R&D equation, males who graduate with a STEM and liberal artsdouble major have a greater likelihood of R&D work activities, which is signif-icantly higher than those who have two liberal arts majors. Combining businessand STEM majors results in a lower likelihood of R&D for males than two STEMmajors. There are no other significant differences for males in terms of likelihoodof R&D.
There are mixed results in terms of job match for males. Combining STEM andliberal arts disciplines is related to higher job match for males than having two lib-eral arts majors, but combining liberal arts with either business or STEM is relatedto a lower likelihood of job match than doubling within business or within STEMfor males. For females, combining business with either a liberal arts or STEM major

318 Alison F. Del Rossi and Joni Hersch
Table 6A Comparisons of double major combinations, males.
Within disciplinarygroup
Across disciplinarygroup
Benefits measures
Earnings R&D Job match Job satisfaction
Two liberal arts Business and liberal arts + 0 0 0
STEM and liberal arts + + + 0
Two business Business and liberal arts 0 0 − 0
Business and STEM + 0 0 0
Two STEM Business and STEM + − 0 0
STEM and liberal arts 0 0 − 0
Notes: Authors’ calculations from the 2010 National Survey of College Graduates. Table reports testsof significant differences between double major combinations that cross disciplinary groups and doublemajors within a disciplinary group based on the regressions reported in Table 4A.“+” (“−”) indicates that the double major combination that crosses disciplinary groups has astatistically significant higher (lower) coefficient estimate than the double major combination within adisciplinary group at p < 0.10. “0” indicates no differences at p < 0.10.
Table 6B Comparisons of double major combinations, females.
Within disciplinarygroup
Across disciplinarygroup
Benefits measures
Earnings R&D Job match Job satisfaction
Two liberal arts Business and liberal arts 0 0 0 0
STEM and liberal arts + 0 0 0
Two business Business and liberal arts 0 0 − 0
Business and STEM 0 0 − 0
Two STEM Business and STEM 0 0 − 0
STEM and liberal arts 0 0 0 0
Source: Authors’ calculations from the 2010 National Survey of College Graduates. Table reports testsof significant differences between double major combinations that cross disciplinary groups and doublemajors within a disciplinary group based on the regressions reported in Table 4A.“+” (“−”) indicates that the double major combination that crosses disciplinary groups has astatistically significant higher (lower) coefficient estimate than the double major combination within adisciplinary group at p < 0.10. “0” indicates no differences at p < 0.10.
is related to a smaller likelihood of job match than having two business majors, andthe combination of business and STEM is associated with lower job match qual-ity than two STEM degrees. For females, the disparate skills earned from those

The private and social benefits of double majors 319
two majors seem to be associated with a lower likelihood of close match of degreeand jobs.
Although, for males, a number of majors are associated with lower job satis-faction relative to a single education major, there are no significant differences inthe coefficient estimates and, for females, no coefficient differences are statisticallysignificant.
9 Conclusions
Increased emphasis on STEM fields has caused concern that society is losing ben-efits associated with broader liberal arts education. Measured solely by monetaryreturns to education, STEM and business majors earn substantially more than lib-eral arts majors. Double majoring is one educational strategy that may combineadvantages of technical training with liberal arts education, allowing access tohigher paying occupations as well as cultivating critical thinking and communica-tion skills. Using data from the 2010 NSCG, we examine whether double majoringis associated with private and social benefits beyond that associated with a singlemajor in the same field, and whether combinations of double majors that cut acrossdisciplines are associated with higher earnings than double majors within a disci-pline. The benefits measures we examine are earnings, R&D, job match with fieldof degree, and job satisfaction.
The strongest private and social benefits to double majoring relate to earningsand R&D. For both males and females, R&D activity is higher among those withdouble majors that include business relative to those with a single business degree,and is higher for those who double major in two STEM fields relative to a sin-gle STEM major. For males, the business and STEM double major combination isassociated with higher earnings than either business or STEM as a single major,and graduates with liberal arts and either STEM or business as a second major earnmore than those with liberal arts degrees. There is little evidence that double majorshave greater job match quality or job satisfaction than those with single majors inone of the same fields.
In Pitt and Tepper (2012), students report that their main purpose of doublemajoring is to enhance their job market or graduate school prospects, but even so,they tend to choose combinations that are complementary and have an overlap inrequirements. We do find that double majors within the broad groups of STEM,business, and the liberal arts are more common than cross-group double majors.However, our analysis shows that these combinations, perhaps a result of institu-tional barriers creating difficulties in majoring across colleges or schools within a

320 Alison F. Del Rossi and Joni Hersch
larger institution, are not associated with higher earnings and that, especially formale individuals, there are higher returns for graduating with a double major inmore disparate fields than for graduating with a double major within a field. Maleswho combine business and STEM have higher earnings than those with doublemajors that are both within STEM or both within business. Even if there is upwardbias in returns due to selection into certain major combinations in that more ablestudents double major, there is no consistent general earnings advantage to doublemajoring, and there are almost no significant differences in returns across doublemajor combinations for females. As with the comparison of double majors to sin-gle majors, the combinations of double majors are not strongly associated with jobmatch quality or job satisfaction.
There is little evidence from analysis of the 2010 NSCG that encouraging stu-dents to pursue double majors that include a liberal arts major will be associatedwith higher earnings. However, contrary to popular belief and some parents’ wor-ries, we did not find that combining a liberal arts major with a business or STEMmajor is associated with significantly lower earnings.
Our analysis supports the continued push to increase the number of STEMmajors, either as single majors or as double majors, both from the private benefit,or earnings, perspective, and from the perspective of the social benefits of R&D.Without a financial benefit, few STEM majors will have incentive to broaden theireducational curriculum into the arts, humanities, or social sciences, but we find lit-tle evidence that graduating with the different skills and knowledge gained from aliberal arts major has additional social benefits compared to a single STEM majorbased on our measures of R&D, job match, and job satisfaction. In contrast, thepairing of a business major and a liberal arts major appears to have a positive asso-ciation with more R&D activities compared to either major alone. From our earn-ings regressions, we did not find a financial incentive to pair these majors comparedto a single business major.
In sum, there is little evidence of costs to double majoring, but there are nowidespread, dramatic individual or societal benefits to pursuing double majorseither. For the few major combinations that are associated with higher social benefitcomponents, there are not corresponding private incentives to pursue those combi-nations. Despite the lack of higher earnings from most double major combinations,double majoring is quite common, with nearly 20% of college graduates earninga double major. The large share of students who choose to double major suggestsa high value of consumption benefits or overestimation of the private economicbenefits of double majors.

The private and social benefits of double majors 321
Appendix A. Construction of sample
Males Females
Initial sample 43,339 33,849
Missing information about first bachelor’s −1,424 −917
Enrolled in full-time degree program −1,428 −1,611
Full sample 40,487 31,321
Not employed in survey week −6,684 −6,879
Previously retired −2,804 −1,379
Earnings less than $4000 −302 −488
Type of employer “other” −82 −69
Employed sample 30,615 22,506
Note: Authors’ calculations from the 2010 National Survey of College Graduates.
Appendix B. Sample means or percentages forregression sample
Males Females
Double major 17.02** 19.15
Earnings 90,680** 59,270
(80,624) (49,676)
Ln(Earnings) 11.16** 10.76
(0.70) (0.70)
Research and development (R&D) 49.99** 40.69
Job closely related to degree 54.09** 59.10
Very satisfied with job 44.51 44.99
Additional BA degree 2.97 3.46
MBA 8.32** 4.34
MA, not MBA 15.10** 23.80
PhD 4.26** 2.53
MD 3.31** 1.64
JD 4.02* 3.12
Other professional degree 0.17** 0.40
Continued on next page.

322 Alison F. Del Rossi and Joni Hersch
(Continued).
Part-time 5.94** 18.04
Tenure 8.70** 7.25
(9.00) (7.59)
Private employer 56.72** 50.56
Self-employed 22.69** 15.59
Government employer 20.58* 33.85
South 31.52 31.01
Age 43.85** 42.36
(11.30) (11.12)
Married 77.20** 68.46
Hispanic/Latino 6.68 7.61
Black/African American 5.31** 8.32
Asian 9.06** 6.92
American Indian/Alaskan Native 0.34 0.27
Native Hawaiian/Other Pacific Islander 0.36 0.29
Multiple races 1.48+ 2.00
White 83.45 82.19
N 30,615 22,506
Note: Authors’ calculations from the 2010 National Survey of College Graduates. Standard deviationsfor continuous variables are given in parentheses. All values are calculated using NSCG sampleweight. The following indicates statistically significant differences in means across gender:+ p < 0.10; * p < 0.05; ** p < 0.01.
Appendix C. Robustness tests
We examined a number of alternative samples for the earnings regressions. Werestricted the sample to those under age 66. Estimated returns to single and doublemajors were not noticeably affected by this change in terms of magnitude and statis-tical significance. We also estimated an earnings regression for males and femaleswho are full-time workers. Again, there is little effect on the returns to educa-tion variables, with two exceptions: for males, having a double major in educationor having an additional bachelor’s degree has positive and statistically significanteffects on earnings.
For all benefits components, we estimated models for the samples of males andfemales whose highest degree is a bachelor’s degree and whose highest degree is agraduate degree. The results are very similar in terms of significance and magnitudeof coefficient estimates for the bachelor’s degree only samples, while for those

The private and social benefits of double majors 323
who earned a graduate degree, some bachelor’s degree majors become statisticallyinsignificant, especially for the nonearnings regressions.
As a further check on the robustness of our results, we examined the effect ofmajor categories on two alternative measures of earnings: the log of hourly wageand the log of total earnings from all jobs as the dependent variable.26 For bothalternative dependent variables, the magnitude and significance of the returns tomajors are quite similar to the results reported using the other earnings measurebased on annual salary on the principal job. One interesting difference is that forboth the log wage and log total earnings regressions, the double major of businessand liberal arts has a greater return than single business majors for males. In fact,for the total earnings equation for males, the highest return is that of the business–liberal arts double major. Interestingly, this double major combination for females isnot statistically significant for any of the dependent variables we examined. Delvinginto this result further, males with a business–liberal arts double major are morelikely to major in a social science field within the liberal arts category than females(74% versus 65%), and on the business side of this double major, close to 65% ofmales and 44% of females have a major in economics. These differences in majorchoice can help explain why this particular double major has the potential for higherreturns for males.
References
Altonji, Joseph G., Blom, Erica & Meghir, Costas (2012). Heterogeneity in Human CapitalInvestments: High School Curriculum, College Major, and Careers. Annual Review ofEconomics, 4(1), 185–223.
American Academy of Arts and Science (2013). The Heart of the Matter. Cambridge, MA,http://www.humanitiescommission.org/ pdf/hss report.pdf.
Bettinger, Eric (2010). To Be or Not to Be: Major Choices in Budding Scientists. In Charles T.Clotfelter (Ed.), American Universities in a Global Market (pp. 69–98). Chicago: Uni-versity of Chicago Press.
Blomquist, Glenn C., Coomes, Paul A., Jepsen, Christopher, Koford, Brandon C. & Troske.,Kenneth R. (2014). Estimating the Social Value of Higher Education: Willingness toPay for Community and Technical Colleges. Journal of Benefit-Cost Analysis, 5(1),3–41.
Brown, Charles & Corcoran, Mary (1997). Sex-Based Differences in School Content and theMale–Female Wage Gap. Journal of Labor Economics, 15(3, Part 1), 431–465.
26 Wage is calculated as the real annual salary from the principal job (the measure of earnings used inTables 4A and 4B) divided by the product of the usual weekly hours and number of weeks worked peryear. The sample selection differs from the previous sample in that we exclude individuals whose hourlywage is less than $5. The total earnings measure includes earnings from all jobs in the previous year.The sample for those regressions eliminates individuals with total earnings less than $4000.

324 Alison F. Del Rossi and Joni Hersch
Carnevale, Anthony P., Cheah, Ban & Strohl, Jeff (2012). Hard Times: College Majors,Unemployment and Earnings: Not All College Degrees Are Created Equal. Washing-ton, DC: Center on Education and the Workplace, Georgetown University, http://cew.georgetown.edu/unemployment/.
Carnevale, Anthony P., Strohl, Jeff & Melton, Michelle (2011). What’s It Worth? The Eco-nomic Value of College Majors. Washington, DC: Center on Education and the Work-place, Georgetown University, http://cew.georgetown.edu/whatsitworth.
Clark, Andrew E. (2001). What Really Matters In a Job? Hedonic Measurement Using QuitData. Labour Economics, 8(2), 223–242.
Corbett, Christianne & Hill, Catherine (2012). Graduating to a Pay Gap: The Earnings ofWomen and Men One Year after College Graduation. Washington, DC: American Asso-ciation of University Women, http://www.aauw.org/research/graduating-to-a-pay-gap.
Daymont, Thomas N. & Andrisani, Paul J. (1984). Job Preferences, College Major, and theGender Gap in Earnings. Journal of Human Resources, 19(3), 408–428.
Del Rossi, Alison F. & Hersch, Joni (2008). Double Your Major, Double Your Return? Eco-nomics of Education Review, 27(4), 375–386.
Eide, Eric (1994). College Major Choice and Changes in the Gender Wage Gap. Contempo-rary Economic Policy, 12(2), 55–64.
Graham, John W. & Smith, Steven A. (2005). Gender Differences in Employment and Earn-ings in Science and Engineering in the U.S. Economics of Education Review, 24(3),341–354.
Hemelt, Steven W. (2010). The College Double Major and Subsequent Earnings. EducationEconomics, 18(2), 167–189.
Hersch, Joni (2013). Opting Out Among Women with Elite Education. Review of Economicsof the Household, 11(4), 469–506.
Kirkeboen, Lars, Leuven, Edwin & Mogstad, Magne (2016). Field of Study, Earnings, andSelf-Selection. Quarterly Journal of Economics, (first published online May 3, 2016,doi:10.1093/qje/qjw019).
Loury, Linda D. (1997). The Gender Earnings Gap Among College Educated Workers.Industrial and Labor Relations Review, 50(4), 580–593.
McDonald, Judith A. & Thornton, Robert J. (2007). Do New Male and Female CollegeGraduates Receive Unequal Pay? The Journal of Human Resources, 42(1), 32–48.
McGuinness, Seamus (2006). Overeducation in the Labour Market. Journal of EconomicSurveys, 20(3), 387–417.
Morgan, Laurie A. (2008). Major Matters: A Comparison of the Within-Major Gender PayGap Across College Majors for Early-Career Graduates. Industrial Relations, 47(4),625–650.
Office of Management and Budget, OMB Circular A-4: Regulatory Analysis, September 17,2003, https://www.whitehouse.gov/omb/circulars a004 a-4/.
Oreopoulos, Philip & Salvanes, Kjell G. (2011). Priceless: The Nonpecuniary Benefits ofSchooling. Journal of Economic Perspectives, 25(1), 159–184.
Pitt, Richard N. & Tepper, Steven A. (2012). Double Majors: Influences, Identities andImpacts. Prepared for the Teagle Foundation, Curb Center, Vanderbilt University.
Riley, Sarah (2008). Renaissance Man Meets the Pin Factory: A Theory of Diverse Spe-cialization under Uncertainty. (PhD Dissertation) Chapel Hill, NC: University of NorthCarolina Chapel Hill.
Russell, A. Wendy, Dolnicar, Sara & Ayoub, Marina (2008). Double Degrees: Double theTrouble or Twice the Return? Higher Education, 55(5), 575–591.

The private and social benefits of double majors 325
U.S. Department of Education. 2009. Profile of 2007–08 First-Time Bachelor’s DegreeRecipients in 2009, Table 2.8, page 66–70. U.S. National Center for Education Statis-tics, http://nces.ed.gov/pubs2013/2013150.pdf.
Weinberger, Catherine J. (1999). Mathematical College Majors and the Gender Gap inWages. Industrial Relations, 38(3), 407–413.
Zafar, Basit (2012). Double Majors: One for Me, One for the Parents? Economic Inquiry,50(2), 287–308.
Zhang, Liang (2008). Gender and Racial Gaps in Earnings Among Recent College Gradu-ates. The Review of Higher Education, 32(1), 51–72.