journal of arid environments · 2005). a number of major droughts events are well documented...
TRANSCRIPT

lable at ScienceDirect
Journal of Arid Environments 75 (2011) 566e575
Contents lists avai
Journal of Arid Environments
journal homepage: www.elsevier .com/locate/ jar idenv
Characteristics of Australian droughts under enhanced greenhouse conditions:Results from 14 global climate models
D.G.C. Kirono a,*, D.M. Kent a, K.J. Hennessy a, F. Mpelasoka b
aCSIRO Marine and Atmospheric Research, Climate Adaptation Flagship, PB1, Aspendale, VIC 3195, AustraliabCSIRO Water for a Healthy Country Flagship, GPO Box 1666, Canberra, ACT, Australia
a r t i c l e i n f o
Article history:Received 8 October 2009Received in revised form16 December 2010Accepted 21 December 2010
Keywords:AustraliaClimate changeDroughtPotential evapotranspirationRainfallReconnaissance Drought Index
* Corresponding author. Tel.: þ61 3 9239 4651; faxE-mail address: [email protected] (D.G.C. Kiron
0140-1963/$ e see front matter � 2010 Published bydoi:10.1016/j.jaridenv.2010.12.012
a b s t r a c t
This paper presents characteristics of droughts simulated by global climate models (GCMs) underenhanced greenhouse gases conditions. We used a drought index called the Reconnaissance DroughtIndex (RDI) which takes both rainfall and potential evapotranspiration into account to investigatevariations of droughts among 12 regions in Australia. The RDI was applied to simulated climate variablesfrom 14 GCMs performed for the IPCC 4th Assessment Report.
The results show a general increase in drought areal extent and/or frequency for most regions.However, the increases are not significant over the North West, North Queensland, Queensland EastCoast and Central Queensland. For most regions, the change beyond 2030 is larger than that prior to2030, but the uncertainty in the projections also increases with time. By 2030, there is a likely (>66%probability) risk of twice or more drought affected area and/or twice as often drought frequency overSouth West Western Australia. By 2050, this will include the Murray-Darling Basin, South Australia andVictoria, and by 2070 this will extend to New South Wales and Tasmania. For North Queensland sucha risk is unlikely (<33% probability) for the next 100 years. This information can be considered indicativein long-term planning focussing on sustainability.
� 2010 Published by Elsevier Ltd.
1. Introduction
The hydroclimatic variability in Australia is among the highest inthe world (McMahon et al., 1992; Nicholls et al., 1997) and droughtsare a normal component of the climate of Australia (McKernan,2005). A number of major droughts events are well documentedincluding the Federation drought (1895e1902), the World War IIdrought (1937e1945), and the recent drought (post-1995) that haslasted for almost a decade, particularly over the southeasternAustralia. These droughts had significant impacts on the Australianenvironment (Bond et al., 2008; Humphries and Baldwin, 2003;Recher et al., 2009) and the country’s economy (ProductivityCommission, 2008; BoM, 2009a). For example, in the World WarII drought there was loss of nearly 30 million sheep between 1942and 1945 (BoM, 2009a), and the drought in the southeast Australiain 1994, 2002 and 2006 reduced the agricultural Gross NationalProduct by about 30% (ABARE, 2008).
The cost of droughts to Australian government occur mainlythrough monetary payments, subsidies to agricultural and
: þ61 3 9239 4688.o).
Elsevier Ltd.
industrial sectors, exit assistance for farmers, professional adviceand planning grants, counselling and so on (www.daff.gov.au). Thedecision-making process for the provision of such assistance areassisted by the exceptional circumstances (EC) evaluation. The ECapplication process requires State or Territory Governments todetermine if there is an EC occurring in their jurisdiction that maywarrant EC assistance (DAFF, 2008). For the declaration of EC, sixcore criteria need to be satisfied: meteorological conditions, agro-nomic and stock conditions, water supplies, environmentalimpacts, farm income levels, and the scale of the event (DAFF, 2008;White et al., 1998). The agreed framework stated that EC would bedeclared when the combined impact on farmers of these corecriteria constituted a rare and severe occurrence and that meteo-rological conditions would be the threshold or primary condition(DAFF, 2008).
With regard to meteorological conditions, the event must berare, that is, it must not have occurredmore than once on average inevery 20e25 years and be of >12 months duration. Meteorologicaldrought condition can be defined based on rainfall data using, forexample, the Rainfall Deciles (RDDI) method (Gibbs and Maher,1967; BoM, 2009b) and the Standardised Precipitation Index (SPI)(Baros and Bowden, 2008; McKee et al., 1993). However, ananalysis of the 2002e2003 drought in Australia indicated that
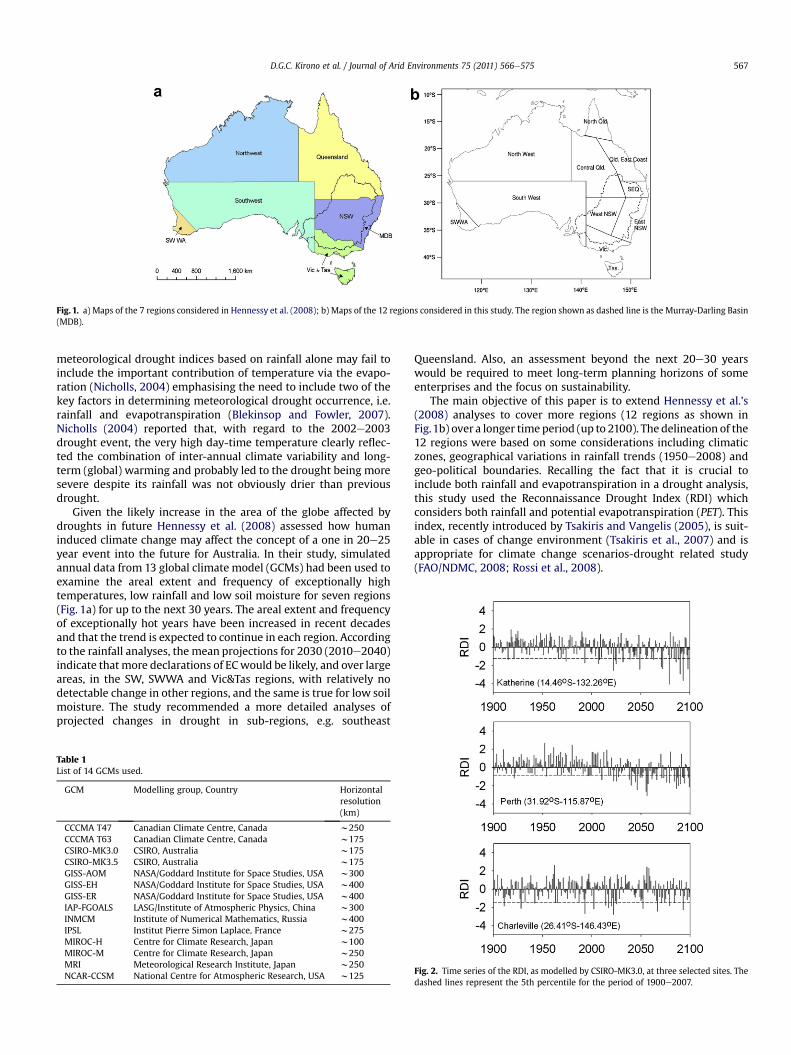
Fig. 1. a) Maps of the 7 regions considered in Hennessy et al. (2008); b) Maps of the 12 regions considered in this study. The region shown as dashed line is the Murray-Darling Basin(MDB).
D.G.C. Kirono et al. / Journal of Arid Environments 75 (2011) 566e575 567
meteorological drought indices based on rainfall alone may fail toinclude the important contribution of temperature via the evapo-ration (Nicholls, 2004) emphasising the need to include two of thekey factors in determining meteorological drought occurrence, i.e.rainfall and evapotranspiration (Blekinsop and Fowler, 2007).Nicholls (2004) reported that, with regard to the 2002e2003drought event, the very high day-time temperature clearly reflec-ted the combination of inter-annual climate variability and long-term (global) warming and probably led to the drought being moresevere despite its rainfall was not obviously drier than previousdrought.
Given the likely increase in the area of the globe affected bydroughts in future Hennessy et al. (2008) assessed how humaninduced climate change may affect the concept of a one in 20e25year event into the future for Australia. In their study, simulatedannual data from 13 global climate model (GCMs) had been used toexamine the areal extent and frequency of exceptionally hightemperatures, low rainfall and low soil moisture for seven regions(Fig. 1a) for up to the next 30 years. The areal extent and frequencyof exceptionally hot years have been increased in recent decadesand that the trend is expected to continue in each region. Accordingto the rainfall analyses, the mean projections for 2030 (2010e2040)indicate that more declarations of ECwould be likely, and over largeareas, in the SW, SWWA and Vic&Tas regions, with relatively nodetectable change in other regions, and the same is true for low soilmoisture. The study recommended a more detailed analyses ofprojected changes in drought in sub-regions, e.g. southeast
Table 1List of 14 GCMs used.
GCM Modelling group, Country Horizontalresolution(km)
CCCMA T47 Canadian Climate Centre, Canada w250CCCMA T63 Canadian Climate Centre, Canada w175CSIRO-MK3.0 CSIRO, Australia w175CSIRO-MK3.5 CSIRO, Australia w175GISS-AOM NASA/Goddard Institute for Space Studies, USA w300GISS-EH NASA/Goddard Institute for Space Studies, USA w400GISS-ER NASA/Goddard Institute for Space Studies, USA w400IAP-FGOALS LASG/Institute of Atmospheric Physics, China w300INMCM Institute of Numerical Mathematics, Russia w400IPSL Institut Pierre Simon Laplace, France w275MIROC-H Centre for Climate Research, Japan w100MIROC-M Centre for Climate Research, Japan w250MRI Meteorological Research Institute, Japan w250NCAR-CCSM National Centre for Atmospheric Research, USA w125
Queensland. Also, an assessment beyond the next 20e30 yearswould be required to meet long-term planning horizons of someenterprises and the focus on sustainability.
The main objective of this paper is to extend Hennessy et al.’s(2008) analyses to cover more regions (12 regions as shown inFig.1b) over a longer time period (up to 2100). The delineation of the12 regions were based on some considerations including climaticzones, geographical variations in rainfall trends (1950e2008) andgeo-political boundaries. Recalling the fact that it is crucial toinclude both rainfall and evapotranspiration in a drought analysis,this study used the Reconnaissance Drought Index (RDI) whichconsiders both rainfall and potential evapotranspiration (PET). Thisindex, recently introduced by Tsakiris and Vangelis (2005), is suit-able in cases of change environment (Tsakiris et al., 2007) and isappropriate for climate change scenarios-drought related study(FAO/NDMC, 2008; Rossi et al., 2008).
Fig. 2. Time series of the RDI, as modelled by CSIRO-MK3.0, at three selected sites. Thedashed lines represent the 5th percentile for the period of 1900e2007.

D.G.C. Kirono et al. / Journal of Arid Environments 75 (2011) 566e575568
Similar to that in Hennessy et al.’s (2008) study, the develop-ment of regional drought projections is facilitated by the use ofglobal climate model (GCM) simulations since, in the absence offine resolution climate simulation (which may be capable of betterrepresenting some of the topographical and other interactionsmore accurately), GCMs are the only available tools for estimatingthe future response of regional climates to anthropogenic radiativeforcing. Despite some conjecture that GCM simulations of futureclimate are not yet ready, particularly for direct application to long-term water management and adaptation planning (Kundzewiczand Stakhiv, 2010; Wilby, 2010), there is also considerable confi-dence that the GCMs provide credible quantitative estimates of
Fig. 3. Simulated percentage area affected by drought in the twelve regions for 1900e2100show the range between the lowest and highest 10% of model results, all smoothed by thirtperiod statistically differs (with p < 0.1) to the mean of drought extent in 1900e2007.
future climate change, particularly at continental and larger scales(IPCC, 2007). It seems likely that “the real climate system willrespond to increased greenhouse gas concentrations in manyrespects in a way similar to that models suggest” (Räisänen, 2007),thus supporting previous suggestion that climate models are usefultools at least to sub-continental scales (McAvaney et al., 2001).
The simulations inherit uncertainties, however, which arelinked to uncertainties in global greenhouse gas emissions andglobal climate sensitivity to these emissions, as well as regionalclimate sensitivity. Given such uncertainty, one should opt fordecisions that are robust, over the range of potential futureoutcomes. Thus, to be useful for such exercise, this study also
, based on 14 GCMs. The solid lines are the multi-model means while the dashed linesy-year averages. Circle symbols denote that the mean drought extent at that particular

Fig. 4. Probability distribution for drought extent in 2030, 2050, 2070 based on 14 GCMs.
D.G.C. Kirono et al. / Journal of Arid Environments 75 (2011) 566e575 569

Table 2Likelihood to have 10% or more drought affected area in 2030, 2050 and 2070.(Likelihood scale are taken from IPCC (2007), i.e. Very Likely is >90% probability,Likely is >66% probability, About as likely as not is 33e66% probability, Unlikely is<33% probability, Very unlikely is <10% probability).
Regions 2030 2050 2070
North QLD Unlikely Unlikely UnlikelyCentral QLD Very Unlikely Unlikely UnlikelyMDB About as likely as not About as likely as not LikelyEast NSW About as likely as not About as likely as not LikelyWest NSW About as likely as not About as likely as not LikelyNW Unlikely About as likely as not About as
likely as notQLD Coast Unlikely About as likely as not About as
likely as notSouth West About as likely as not Likely LikelySEQ Unlikely About as likely as not About as
likely as notSWWA Likely Likely Very likelyTas About as likely as not Likely LikelyVic About as likely as not Likely Likely
D.G.C. Kirono et al. / Journal of Arid Environments 75 (2011) 566e575570
conducts a simple risk analysis so that uncertainty in futuredrought projections can be expressed in units of probability orlikelihood. Details about the methods and data used in this studyare described in the following section.
2. Methodology
2.1. The Reconnaissance Drought Index (RDI)
The RDI is based on the ratio between two aggregated quantitiesof rainfall (P) and PET. It is similar to the “Aridity Index” proposed bythe United Nations (FAO/UNESCO/WMO, 1977; Jones and Reid,2001). A mathematical representation of the RDI is as summarisedbelow (Equations (1) through (3)), and a detailed representation ofthe RDI can be found in Tsakiris and Vangelis (2005) and Tsakiriset al. (2007). The RDI can be calculated for any period of time from1 month to the entire year, but this paper focuses on the 12 month(annual) RDI. The initial value of annual RDI (ao) is calculated as
aoi ¼X12
j¼1
Pij=X12
j¼1
PETij (1)
where Pij and PETij represent rainfall and potential evapotranspi-ration of the jth month of the ith years and N is the total number ofyears of the available data. The normalised RDI can then be calcu-lated as:
RDIðiÞn ¼�aðiÞ0 =a0
�� 1 (2)
and the standardised RDI is calculated as:
RDIðiÞst ¼ ðyi � yiÞ=s (3)
where the a0 is the arithmetic mean of ao values calculated forN years of data and yi is the lnðaðiÞ0 Þ, yi is its arithmetic mean and s isthe standard deviation of yi. The above formulation is based on theassumption that ao values follow a lognormal distribution. Thechoice of the lognormal distribution is not constraining but itassists in devising a unique procedure instead of various proce-dures depending on the probability distribution function, whichbest fits the data (Tsakiris et al., 2007). All analyses and resultspresented on this paper are based on the standardised RDI(henceforth is referred as RDI for abbreviation).
2.2. Data
We use monthly data of 14 GCMs (Table 1) out of the 23 GCMsbecause they have climate variables needed for the calculation ofPET. The data of the 23 GCMs are available in the database of theCoupled Model Intercomparison Project 3 (CMIP3) (http://www-pcmdi.llnl.gov). Most of the GCMs used in this study fairly wellcapture the observed climatological patterns over the Australiancontinent (Suppiah et al., 2007;Watterson, 2008) and therefore wehave used simulations from the 14 GCMs to investigate simulatedchanges in the characteristics of droughts in Australia. The PET wasderived using offline calculations from monthly time series ofclimate variables (temperature, humidity, solar radiation, andrainfall) using the Morton model (Morton, 1983). The Mortonmodel was used to construct the Australian Bureau of Meteorologyatlas for evaporation (BoM, 2001) and future projections forpotential evaporation (CSIRO, 2001; CSIRO and BoM, 2007).
For 1900e2000, the simulations were based on observedatmospheric emissions of greenhouse gases and sulphate aerosols,while for 2001e2100, the simulations were forced by the SRES-A1B(IPCC, 2000) emission scenario for eleven GCMs and by the SRES-A2
emission scenario for three GCMs. This provides a representation ofsome of the uncertainties related to greenhouse gas emissions andregional climate sensitivity to global climate e resulted from thechange in those emissions scenarios.
2.3. Definition of drought year
Following Hennessy et al. (2008), drought events are defined asbeing of one year duration and occurring once every 20 years, onaverage. If there were a hundred years of RDI data that were sortedfrom the driest to the wettest, the five driest years would fall belowthe 5th percentile and the five wettest above the 95th percentile.Here, the critical threshold for defining drought at a particularlocation is the 5th percentile of the RDI of that location for theperiod 1900e2007. For each grid cell of each GCM, the thresholdsfor drought were calculated. Projected changes at each grid cell foreach GCM for the next 100 years were then calculated relative tothese thresholds.
To illustrate this point, time series of RDI as modelled by CSIRO-MK3.0 are provided (Fig. 2) for three selected locations: Katherine(14.46�Se132.26�E), Perth (31.92�Se115.87�E) and Charleville(26.41�Se146.43�E). In this figure, the 5th percentile for the periodof 1900e2007 is overlaid. Any year having an RDI of less than thisthreshold is categorised as a drought year. These three sites arerepresentative of different climatic zones. According to a modifiedKoeppen climate classification system (BoM, 2009b) Katherine,Perth and Charleville are each located in tropical, temperate andgrassland climatic zones, respectively. The annual average forrainfall (and evaporation) for each of these sites is around 1000(2900), 800 (1800) and 490 (2400) mm, respectively (BoM, 2009b).
The 5th percentile varies with sites, i.e. �1.21, �0.86 and �1.49for Katherine, Perth and Charleville, respectively. But by definition,the number of drought years within the period of 1900e2007 arethe same for all the sites, i.e. around 6. From 2008 onward, thenumber of drought years vary with site and drought events arelikely to occur more frequently in the future. For example, withinthe period of 2010e2030 the CSIRO-MK3.0 model suggests theoccurrence of 3, 6 and 5 drought events at Katherine, Perth andCharleville, respectively.
2.4. Future projections
After time series of drought/non-drought year for eachgrid cell ofeach GCM were prepared, the projections for the areal extent and

D.G.C. Kirono et al. / Journal of Arid Environments 75 (2011) 566e575 571
frequencyof droughts over each region canbe constructed. The arealextent is calculated each year as the percentage area of a regionaffected by a drought event while the frequency is the regional-average number of drought years within a thirty-year period. Low,mean and high future scenarios are then given for each region. Themean is the 14-model average whereas the low and high scenariosare the lowest and highest 10% of the range of model results.
2.5. Risk analysis
There are inherent uncertainties in the projections associatedwith the future evolution of greenhouse gas concentrations in the
Fig. 5. Simulated drought frequency in a thirty-year window, based on 14 GCMs. The solidlowest and highest 10% of model results. Circle symbols denote that the drought frequency atfrequency in 1990 (1975e2004).
atmosphere and the response of the climate of a region to such anincrease in greenhouse gas. In the face of this problem, quantifyingthe uncertainties in climate change and its downstream conse-quences in units of probability or likelihood will help identifyrobust adaptation strategies. Thus in addition to the aboveprojections, we also analyse the risks of experiencing a particularthreshold in 2030, 2050 and 2070. In this paper, we choosea probability of having a double area affected by drought and/orhaving a drought that occur twice as often. Thus, the thresholds are10% or more drought affected area and or a one in 10 year droughtevent. These thresholds, however, can be easily changed to suit anyone needs.
lines are the multi-model means while the dashed lines show the range between thethat particular 30-year period statistically differs (with p < 0.1) to the mean of drought

Table 3Likelihood to have a one in ten year drought event. (Likelihood scale are taken fromIPCC (2007), i.e. Very Likely is >90% probability, Likely is >66% probability, About aslikely as not is 33e66% probability, Unlikely is<33% probability, Very unlikely is<10%probability).
Region 2030 2050 2070
North QLD Unlikely Unlikely UnlikelyCentral QLD Very Unlikely Unlikely About as likely as notMDB About as likely
as notLikely Likely
East NSW About as likelyas not
About as likely as not Likely
West NSW Unlikely About as likely as not About as likely as notNW Unlikely About as likely as not About as likely as notQLD Coast Unlikely About as likely as not UnlikelySouth West About as likely
as notLikely Likely
SEQ About as likelyas not
About as likely as not About as likely as not
SWWA Likely Likely Very likelyTas About as likely
as notAbout as likely as not Likely
Vic About as likelyas not
Likely Likely
D.G.C. Kirono et al. / Journal of Arid Environments 75 (2011) 566e575572
To do this analysis, Monte Carlo techniques (repeated randomsampling) were employed to stochastically generate probabilisticestimates of future drought extent and drought frequency. Thisrandom sampling was repeated 1000 times in year 2030, 2050, and2070 to get an adequate samplingdensity over the projected range ofuncertainty. Simulations samples were subsequently used to calcu-late cumulative distributions for future area affected by drought.Wethen used the IPCC’s (2007) terminology for any likelihood of theoutcome. For example, anoutcome isvirtually certain if its probabilityof occurrence is greater than 99%, and an outcome is exceptionallyunlikely if its probability of occurrence is smaller than 1%.
3. Results
3.1. Estimated future variation in areal extent of drought
The percent area experiencing drought (as simulated by 14climate models) for 1900e2100 is plotted in Fig. 3. This figureshows the multi-model mean and the range between the lowestand highest ten percent of multi-model results. In each region,about 5.6% of the area was affected by drought over the period1900e2007. By 2030, themean affected area indicates small changein most regions except SWWA (17.4%), South West (11.0%), Vic.(11.4%) and Tas (9.5%), and these are relatively consistent withresults reported in Hennessy et al. (2008). By 2050, large increase inarea can also be seen for SEQ (10.7%), West NSW (11.9%), East NSW(11.3%) and MDB (12.3%). By 2100, for most regions the mean areabeing doubled from about 5.6% to more than 10%. Exception is forNorth Qld region.
To examine whether the estimated future mean significantlydiffers to the estimated present (1900e2007) mean, we applied thet-test technique. The test returns the probability associated witha Student’s t-Test to determine whether two samples (which in ourcase are the present and future period) are likely to have come fromthe same two underlying populations that have the same mean.From 2015 onward, the multi-model mean is assigned witha ‘significance’ symbol if the mean of drought extent at thatparticular period statistically differs to the mean of drought extentin 1900e2007. Apparently, the changes in mean area, relative to1900e2007, are almost all statistically significant. The exceptionsare the North Qld and Central Qld regionswhere the changes can beinsignificant. In the North West, North Qld, Qld. East Coast, andCentral Qld, the low and high scenarios are around 2e12% by 2100whereas in other regions the low and high scenarios around10e20% or more in 2100.
The probability of the most to the least likely drought extent in2030, 2050 and 2070 are presented in Fig. 4. These cumulativeprobability graphs rank the data in the Monte Carlo simulationfrom the highest to the lowest value, and graph each point with itscorresponding percentile. It indicates, for example, in 2030 there isaround 18% probability that the drought extent in MDB will besimilar to the present (i.e. about 5.6%) or less, suggesting the risk ofincrease in drought extent is relatively high. But by 2050 and 2070,the risk will be greater as there is only about 14% probability thatthe drought extent will remain the same as present or less in MDB.For North West, North Qld, and Central Qld, the chances of eitherincrease or decrease in drought extent are almost even.
One can also use these results to examine the risk of a certainoutcome. In this paper, the risks of having 10% or more droughtaffected area in 2030, 2050 and 2070 are presented in Table 2.Number of regions with likely risk (>66% probability) seems toincrease with time. In 2030, the likely risk is shown for SWWAregion only. By 2050, regions with likely risk will also include SouthWest, Tas. and Vic., whereas by 2070 these will expand to MDB,West NSW and East NSW.
In each region, the risk of having 10% or more drought affectedarea is also greater throughout time. In SWWA a likely risk in 2030will become a very likely risk in 2070 and in Central QLD a veryunlikely risk in 2030 will become an unlikely risk in 2070. Exceptionis for North QLD where the risk of having 10% or more drought areawill remain unlikely for the next 100 years.
3.2. Simulated future variation in frequency of drought
Fig. 5 depicts drought frequency in a thirty-year window period.This figure shows the multi-model mean and the range betweenthe lowest and highest ten percent of multi-model results. From2015 onward, the multi-model mean is assigned with a ‘signifi-cance’ symbol if the mean of drought frequency at that particularperiod statistically differs to the mean of drought frequency in 1990(1975e2004). Increases in the frequency of drought occurrence areapparent, although for some regions the changes are not so clear.For North West, North Qld, Qld. East Coast and Central Qld, thefuture drought frequency in a thirty-year period is not significantlydissimilar from the frequency in the 1990 (1975e2004). Theregions with possible significant increase include SWWA, SouthWest, MDB and Vic where the mean drought frequency in thefuture differs significantly from that in 1990. The mean droughtfrequency for each of these regions is likely to be 4 ormore by 2050.The low and high scenario suggests a frequency of around 2 to 6 ormore. All of these indicate the possibility of more frequent droughtevent.
Cumulative probability of drought frequency in 2030, 2050 and2070 as obtained from the Monte Carlo simulations are also con-structed. Overall, they are relatively similar with those for thedrought spatial extent shown in Fig. 4, namely: (a) the probabilityto have a certain outcome is greater with time, and (b) the chancesof either increase or decrease in drought frequency are relativelyeven for North West, North Qld, and Central Qld (not shown here).
By 2030, there is no likely risk of having three drought events ina thirty-year period, hence a one in ten year drought event, exceptfor SWWA region (Table 3). By 2050, there is a likely risk for MDB,South West, SWWA and Vic regions and there is about as likely asnot or unlikely risk for the rest of the regions. By 2070, there is verylikely risk for SWWA region and likely risk for MDB, East NSW, SouthWest, Vic. and Tas.

Fig. 6. Simulated percentage area affected by drought in the MDB region (based on 14GCMs). The top and bottom panel is each based on the RDI and rainfall, respectively.The solid lines are the multi-model means while the dashed lines show the rangebetween the lowest and highest 10% of model results, all smoothed by thirty-yearaverages. Circle symbols denote that the mean drought extent at that particular periodstatistically differs to the mean of drought extent in 1900e2007.
D.G.C. Kirono et al. / Journal of Arid Environments 75 (2011) 566e575 573
4. Discussions and conclusion
Drought is a regional phenomenon and given the size ofAustralia, the impacts of human induced climate change ondrought may differ across regions. In this paper we have extendedHennessy et al.’s (2008) assessment on the impact of humaninduced climate change on the characteristics of Australiandroughts. While the previous analysis was conducted for sevenregions and for up to 2030, our study covered 12 regions and overa period of up to 2100. We used simulations from 14 GCMs tocalculate a meteorological drought index called the ReconnaissanceDrought Index (RDI) (Tsakiris et al., 2007). An advantage of thisindex is that it takes both rainfall and potential evapotranspiration(PET) into account.
Over Australia, a 3e5% decrease in future rainfall is projected(CSIRO and BoM, 2007). Also, a 1 �C warmer climate is expected,with potential evaporation may increase for 2e6% by 2030. The2002e2003 severe drought experience tells us that the drought canbe very severe, even though the rainfall may not be unusually low,likely because of warmer temperatures (Nicholls, 2004), suggestingthat the relatively warm temperatures in the future can probablyled to the drought being more severe. Thus, the inclusion of PET isnecessary as meteorological drought indices based on rainfall alonemay fail to include the important contribution of temperature viaevaporation in Australia (Nicholls, 2004).
To illustrate the above point, Fig. 6 plots the percent areaaffected by drought based on the RDI and based on rainfall for theMurray-Darling Basin (MDB). In the future, the mean affected areabased on the RDI are larger than that based on the rainfall alone. In2030, it is 8.6% and 6.5% for the former and the latter. In 2050 it is12.3% compared to 8.7%, and in 2070 it is 14.7% compared to 9.9%.Such a difference in mean is also found in other regions (not shown
here) and it tends to increase with time. In the early 21st century,the projected change in drought extent based on the RDI isgenerally 1% higher than that based on the rainfall. By 2100, suchdifference are likely to be around 3% or more depending on theregion of interest. Implications of this result is that future projec-tions of drought may depend on the specific index of drought usedand research to address the sensitivity of projections of futuredrought to index definition is further required.
Some of the results in this study are in agreement with thoseobtained in Hennessy et al.’s (2008) study, i.e. there is a likelyincrease in future drought areal extent and frequency for mostregions. However, there are some additional insights that can beoffered from this study. First, a further breakdown of a region withlarge spatial variation in climate trends provides a clearer separa-tion as to what the future will look like for each of the sub-regions.As an illustration, the projections for Queensland (Qld) as a wholeindicate little change in both affected area and in frequency. Whenthe Qld region is further broken into a number of sub-regions, theprojections indicate little change in North Qld but rather largechange in the Qld East Coast, Central Qld and South East Qldregions. This result is relatively consistent with the observed trendin rainfall (BoM, 2009b), i.e. positive in North Qld and negative inother three sub-regions.
Second, we applied t-test technique to determine whether theestimated futuremean significantly differs to the estimated presentmean. Although increases in estimated future mean area andfrequency are statistically significant for most regions there aresome exceptions including the North West, North Qld, Qld EastCoast and Central Qld regions.
Third, for some regions the likely change beyond 2030 is largerthan that prior to 2030. For example, during 2030 the meanprojections indicate little change in the affected area of the MDB(Hennessy et al., 2008 and this study), but after 2030 the meanprojections indicate a larger change. The uncertainty in theprojections also increases with time and is linked to the increase inthe uncertainty of anthropogenic emission scenarios, especiallybeyond 2030 (IPCC, 2000). Through a Monte Carlo analysis, wequantify the likelihood to experience a given outcome. In 2030 it isonly SWWA region that shows a likely (>66% probability) risk ofhaving 10% or more drought affected area and a likely risk of havinga one in ten year drought event. By 2050, this will include MDB,South West and Vic regions, while by 2070, this will also coverNSW, and Tas regions. For North Qld such a risk is unlikely (<33%probability) for the next 100 years.
According to the existing Australian drought policy, an excep-tional circumstance (EC) can be declared when the event is rare, i.e.must not have occurred more than once on average in every 20e25years (DAFF, 2008). The above findings imply that the existingtrigger for EC declaration may not be appropriate in the future forsome regions (e.g. SWWA) but still be appropriate for other regions(e.g. North Qld). If the existing criteriawill still be used in the future,say by 2100, then ECwould be likely be declared over twice the areain MDB, West NSW, East NSW, South West, Tas. and Vic.
Following the IPCC’s (2007) suggestion, that GCM providecredible quantitative estimates of future climate change, all of thesefindings assume that the GCMs used in this study are reliable. Forexample, most of the GCMs considered in this study fairly wellcapture the observed mean patterns of mean sea-level pressure,temperature and rainfall over the whole Australian region (Suppiahet al., 2007; Watterson, 2008). Previous studies also suggest thatmost models reproduced the observed probability density func-tions of daily rainfall, minimum temperature and maximumtemperature in each of the 12 regions being studied (Perkins et al.,2007); most GCMs can reproduce the observed spatial mean annualrainfall pattern across the Murray-Darling Basin and southeast

D.G.C. Kirono et al. / Journal of Arid Environments 75 (2011) 566e575574
Australia and the observed daily rainfall distribution (Chiew et al.,2009); some GCMs can generally reproduce the observed spatialmean annual rainfall and PET across each of the 12 regionsconsidered here even though there is a tendency for GCMs tounderestimate and/or fail to simulate the observed inter-annualvariability and/or long-term trend (Kirono and Kent, 2010); andthat few GCMs are able to reproduce the observed changes in theSouthern Hemisphere circulation related to the genesis of thestorms that affect southern Australia (Frederiksen et al. 2010). Sincemany of the major droughts in Australia, particularly over easternand northern Australia have been associated with El Niño SouthernOscillation (ENSO) events, it is crucial that GCMs to adequatelysimulate ENSO and its teleconnections with rainfall over a givenregion. A study by Cai et al. (2009) suggest that the majority ofGCMs produce the observed teleconnection between Australianrainfall and the ENSO, even though the modelled teleconnection isrelatively weaker than observation. As a broad assessment of theresponse of the selected 12 Australian region to the enhancedgreenhouse gases, therefore, results from this work can be regardedas indication for the future. It is also worthnothing that the overallresults of this study appear to be consistent with those projectedglobally (Dai, 2010).
The changes in the areal extent and frequency of droughts canhave big implications on water management, agriculture industryand aquatic ecosystems. It is hoped that drought projections fromthis study can be useful information for long-term planning forsome enterprises. The probability or likelihood of areal extent anddrought frequency presented here can be subsequently consideredin risk-based impact assessment and management, wherebythresholds for climatic changes and/or specific impacts are inte-grated with probability distributions for climate, environmental,and socioeconomic variables that influences system outcomes(Jones, 2001). This in turn will help for identifying robust decisionsin the face of the inherent uncertainties associated with climatevariability and anthropogenic climate change.
Acknowledgements
We acknowledge the modelling groups, the Program for ClimateModel Diagnosis and Intercomparison (PCMDI) and the WCRP’sWorking Group on Coupled Modelling (WGCM) for their roles inmaking available the WCRP CMIP3 multi-model dataset. Support ofthis dataset is provided by the Office of Science, U.S. Departmentof Energy. This work was co-founded by the Australian Departmentof Climate Change through the Australian Climate Change ScienceProgram (ACCSP). Dr. Ramasamy Suppiah is thanked for hisconstructive comments in the internal peer reviewing process ofthis paper. The authors also thank two anonymous peer reviewersand Dr. David Thomas for their constructive comments that lead tothe improvement of this paper.
References
ABARE, 19 February 2008. Australian Crop Production Report. Australian Bureau ofAgricultural and Resource Economics, 23 pp.
Baros, A.N., Bowden, G.J., 2008. Toward long-lead operational forecasts of drought:An experimental study in the Murray-Darling River Basin. Journal of Hydrology357, 349e367.
Blekinsop, B., Fowler, H.J., 2007. Changes in drought frequency, severity and dura-tion for the British Isles projected by the PRUDENCE regional climate models.Journal of Hydrology 342, 50e71.
BOM, 2001. Climatic Atlas of Australia: Maps of Evaporation. In: Wang, Q.J.,McConachy, F.L.N., Chiew, F.H.S., James, R., de Hoedt, G.C., Wright, W.J. (Eds.).Bureau of Meteorology, Melbourne.
BoM, 2009a. The Effects of Major Drought. Australian Bureau of Meteorology. http://www.bom.gov.au./lam/climate/levelthree/cpeople/drought4.htm (assessed on26.06.09).
BoM, 2009b. Climate. Australian Bureau of Meteorology. http://www.bom.gov.au/climate/ (assessed on 26.06.09).
Bond, N.R., Lake, P.S., Arthington, A.H., 2008. The impacts of drought on freshwaterecosystems: an Australian perspective. Hydrobiologia 600, 3e16.
Cai, W., Sullivan, A., Cowan, T., 2009. Rainfall telleconnections with Indo-PacificVariability in the WCRP CMIP3 Models. Journal of Climate 22, 5046e5071.doi:10.1175/2009JCLI2694.1.
Chiew, F.H.S., Teng, J., Kirono, D.G.C., 2009. Influence of global climate modelselection on runoff impacts assessment. Journal of Hydrology 379, 172e180.
CSIRO, 2001. Climate change projections for Australia. CSIRO Atmospheric Research,Melbourne. http://www.cmar.csiro.au/e-print/open/projections2001.pdf.
CSIRO, BoM, 2007. Climate Change in Australia, Technical Report. http://www.climatechangeinaustralia.com.au/resources.php, 148 pp.
DAFF, 2008. Exceptional Circumstances. http://www.daff.gov.au/agriculture-food/drought/ec. Accessed in 2008.
Dai, A., 2010. Drought under global warming: a review. Advanced Review, WileyInterdisciplinary Reviews, Climate Change. doi:10.1002/wcc.81. wire-s.wiley.com/climatechange.
FAO/UNESCO/WMO, 1977. World Map of Desertification. Food and AgriculturalOrganization, Rome.
FAO/NDMC, 2008. The Near East Drought Planning Manual: Guidelines for DroughtMitigation and Preparedness Planning. C.L. Knutson (Lead Author), Food andAgriculture Organization of the United Nations Regional Office for the Near East(Cairo, Egypt) and the National Drought Mitigation Centre (USA). FAO, Rome,Italy, 52 pp.
Frederiksen, C.S., Frederiksen, J.S., Sisson, J.M., Osbrough, S.L., 2010. Australianwinter circulation and rainfall changes and projections. International Journal ofClimate Change Strategies and Management. To appear.
Gibbs, W.J., Maher, J.V., 1967. Rainfall deciles as drought indicators. Bulletin No 48.Bureau of Meteorology, Melbourne, Australia.
Hennessy, K., Fawcett, R., Kirono, D., Mpelasoka, F., Jones, D., Bathols, J., Whetton, P.,Stafford Smith, M., Howden, M., Mitchell, C., Plummer, N., 2008. An Assessmentof the Impact of Climate Change on the Nature and Frequency of ExceptionalClimatic Events. CSIRO and Bureau of Meteorology. http://www.bom.gov.au/droughtec, 33 pp.
Humphries, P., Baldwin, D.S., 2003. Drought and aquatic ecosystems: an introduc-tion. Freshwater Biology 48, 1141e1146.
IPCC, 2000. Emissions scenarios. In: Nakicenovic, N., Swart, R. (Eds.), Special Report ofthe Intergovernmental Panel onClimate Change. CambridgeUniversity Press, UK.
IPCC, 2007. Climate change 2007: the physical science basis. In: Solomon, S., et al.(Eds.), Contribution of Working Group I to the Fourth Assessment Report of theIntergovernmental Panel on Climate Change. Cambridge University Press.http://www.ipcc.ch.
Jones, R.N., 2001. An environmental risk assessment/management framework forclimate change impact assessments. Natural Hazard 23, 197e230.
Jones, P.D., Reid, P.A., 2001. Temperature trends in regions affected by increasingaridity/humidity. Geophysical Research Letters 28, 3919e3922.
Kirono, D.G.C., Kent, D.M., 2010. Assessment of rainfall and potential evaporationfrom global climate models and its implications for Australian regional droughtprojection. International Journal of Climatology, Published online in WileyInterScience. www.interscience.wiley.com. doi:10.1002/joc.2165.
Kundzewicz, Z.W., Stakhiv, E.Z., 2010. Are climate models “ready for prime time” inwater resources management applications, or is more research needed?Editorial: Hydrological Sciences Journal 55 (7), 1085e1089.
McKee, T.B., Doesken, N.J., Kleist, J., 1993. The relationship of drought frequency andduration to time scales. In Eighth Conference on Applied Climatology, 17e22January, Anaheim, CA, 179e184.
McAvaney, B.J., et al., 2001. Model evaluation. In: Houghton, J.T., et al. (Eds.), ClimateChange 2001: The Scientific Basis. Cambridge University Press, pp. 471e524.
McKernan, M., 2005. Drought. The Red Marauder. Allen and Unwin, Crows Nest,NSW, Australia.
McMahon, T.A., Finlayson, B.L., Haines, A.T., Srikanthan, R., 1992. Global runoff econtinental comparisons of annual flows and peak discharges. Catena Paper-back. Cremlingen-Destedt.
Morton, F.I., 1983. Operational estimates of areal evapotranspiration and theirsignificance to the science and practice of hydrology. Journal of Hydrology 66,1e76.
Nicholls, N., Drosdowsky, W., Lavery, B., 1997. Australian rainfall variability andchange. Weather 52, 66e71.
Nicholls, N., 2004. The changing nature of Australian droughts. Climatic Change 63,323e336.
Perkins, S.E., Pitman, A.J., Holbrook, N.J., McAveney, J., 2007. Evaluation of the AR4climate models’ simulated daily maximum temperature, minimum tempera-ture and precipitation over Australia using probability density functions. Jour-nal of Climate 20, 4356e4376.
Productivity Commission, 2008. Inquiry into Government Drought Support. DraftInquiry Report by the Productivity Commission. http://www.pc.gov.au/projects/inquiry/drought/draft, 354 pp.
Räisänen, J., 2007. How reliable are climate models? Tellus 59A, 2e29.Recher, H.F., Lunney, D., Matthews, A., 2009. Small mammal population in a euca-
lypt forest affected by fire and drought. I. Long-term patterns in an era ofclimate change. Wildlife Research 36, 143e158.
Rossi, G., Nicolosi, V., Cancelliere, 2008. Recent methods and techniques formanaging hydrological droughts. Options Méditerranéennes Series A 80,251e265.

D.G.C. Kirono et al. / Journal of Arid Environments 75 (2011) 566e575 575
Suppiah, R., Hennessy, K.J., Whetton, P.H., McInnes, K.L., Macadam, I., Bathols, J.M.,Ricketts, J.H., Page, C.M., 2007. Australian climate change projections derivedfrom simulations performed for the IPCC 4th assessment report. AustralianMeteorological Magazine 56, 131e152.
Tsakiris, G., Vangelis, H., 2005. Establishing a Drought Index Incorporating Evapo-transpiration. European Water 9, 3e11.
Tsakiris, G., Pangalou, D., Vangelis, H., 2007. Regional drought assessment based onthe Reconnaissance Drought Index (RDI). Water Resources Management 21,821e833.
Watterson, I.G., 2008. Calculation of probability density functions for temperatureand precipitation change under global warming. Journal of GeophysicalResearch 113, D12106. doi:10.1029/2007JD009254.
White, D.H., Howden, S.M., Walcott, J.J., Cannon, R.M., 1998. A framework for esti-mating the extent and severity of drought, based on a grazing system in south-eastern Australia. Agricultural Systems 57, 259e270. doi:10.1016/S0308-521X(98)00018-3.
Wilby, R., 2010. Evaluating climate model outputs for hydrological applications e
opinion. Hydrological Sciences Journal 55 (7), 1090e1093.