jolly's java and bakery january, 2001 - template.net · 1.0 executive summary jolly's...
TRANSCRIPT

Jolly's Java and BakeryJanuary, 2001
This sample business plan has been made available to users of Business Plan Pro™, business planning software published by Palo Alto Software. Our sample plans were developed by existing companies or new business start-ups as research instruments to determine market viability, or funding availability. Names, locations and numbers may have been changed, and substantial portions of text may have been omitted to preserve confidentiality and proprietary information.
You are welcome to use this plan as a starting point to create your own, but you do not have permission to reproduce, publish, distribute or even copy this plan as it exists here.
Requests for reprints, academic use, and other dissemination of this sample plan should be emailed to the marketing department of Palo Alto Software at [email protected]. For product information visit our Website: www.paloalto.com or call: 1-800-229-7526.
Copyright Palo Alto Software, Inc., 2001

Confidentiality Agreement
The undersigned reader acknowledges that the information provided by _______________ in this business plan is confidential; therefore, reader agrees not to disclose it without the express written permission of _______________.
It is acknowledged by reader that information to be furnished in this business plan is in all respects confidential in nature, other than information which is in the public domain through other means and that any disclosure or use of same by reader, may cause serious harm or damage to _______________.
Upon request, this document is to be immediately returned to _______________.
___________________ Signature
___________________Name (typed or printed)
___________________Date
This is a business plan. It does not imply an offering of securities.

Table Of Contents
1.0 Executive Summary . . . . . . . . . . . . . . . . . . . . . . . . . . . . . . . 11.1 Mission . . . . . . . . . . . . . . . . . . . . . . . . . . . . . . . . . 11.2 Keys To Success . . . . . . . . . . . . . . . . . . . . . . . . . . . . 1
2.0 Company Summary . . . . . . . . . . . . . . . . . . . . . . . . . . . . . . . 22.1 Company ownership . . . . . . . . . . . . . . . . . . . . . . . . . . . 22.2 Company History . . . . . . . . . . . . . . . . . . . . . . . . . . . . 2
3.0 Product/Service Description . . . . . . . . . . . . . . . . . . . . . . . . . . 3
4.0 Market Analysis . . . . . . . . . . . . . . . . . . . . . . . . . . . . . . . . . 44.1 Market Segmentation . . . . . . . . . . . . . . . . . . . . . . . . . . 4
4.1.1 Market Analysis . . . . . . . . . . . . . . . . . . . . . . . . 54.2 Target Market Segment Strategy . . . . . . . . . . . . . . . . . . . . 5
4.2.1 Market Needs . . . . . . . . . . . . . . . . . . . . . . . . . 64.3 Service Business Analysis . . . . . . . . . . . . . . . . . . . . . . . . 6
4.3.1 Competition and Buying Patterns . . . . . . . . . . . . . . . 6
5.0 Strategy and Implementation . . . . . . . . . . . . . . . . . . . . . . . . . 75.1 Competitive Edge . . . . . . . . . . . . . . . . . . . . . . . . . . . . 75.2 Marketing Strategy . . . . . . . . . . . . . . . . . . . . . . . . . . . 7
6.0 Management Team . . . . . . . . . . . . . . . . . . . . . . . . . . . . . . . 96.1 Personnel Plan . . . . . . . . . . . . . . . . . . . . . . . . . . . . . 9
7.0 Financial Plan . . . . . . . . . . . . . . . . . . . . . . . . . . . . . . . . . 107.1 Break-even Analysis . . . . . . . . . . . . . . . . . . . . . . . . . . 107.2 Projected Profit and Loss . . . . . . . . . . . . . . . . . . . . . . . . 117.3 Projected Cash Flow . . . . . . . . . . . . . . . . . . . . . . . . . . 127.4 Balance Sheet . . . . . . . . . . . . . . . . . . . . . . . . . . . . . 137.5 Business Ratios . . . . . . . . . . . . . . . . . . . . . . . . . . . . 14

1.0 Executive Summary
Jolly's Java and Bakery (JJB) is a start-up coffee and bakery retail establishment located in southwest Washington. JJB expects to catch the interest of a regular loyal customer base with its broad variety of coffee and pastry products. JJB will be operating in a town with very little coffee shop competition.
$0
$100,000
$200,000
$300,000
$400,000
$500,000
$600,000
$700,000
2001 2002 2003
Sales
Gross
Net
Highlights
1.1 Mission
JJB aims to offer high quality coffee, espresso, and pastry products at a competitive price to meet the demand of the middle- to higher-income local market area residents and tourists.
1.2 Keys To Success
Keys to success for JJB will include:
1. Providing the highest quality product with personal customer service.2. Competitive pricing.
Jolly's Java and Bakery
This sample plan produced in Business Plan Pro™ software. www.paloalto.com 1-800-229-7526 Page 1
2.0 Company Summary
JJB is a bakery and coffee shop managed by two partners. These partners represent sales/management and finance/administration areas, respectively. The partners will provide funding from their own savings, which will cover start-up expenses and provide a financial cushion for the first months of operation. A ten-year Small Business Administration (SBA) loan will cover the rest of the required financing. The company plans to build a strong market position in the town, due to the partners' industry experience and mild competitive climate in the area.
2.1 Company ownership
JJB is incorporated in the state of Washington. It is equally owned by its two partners.
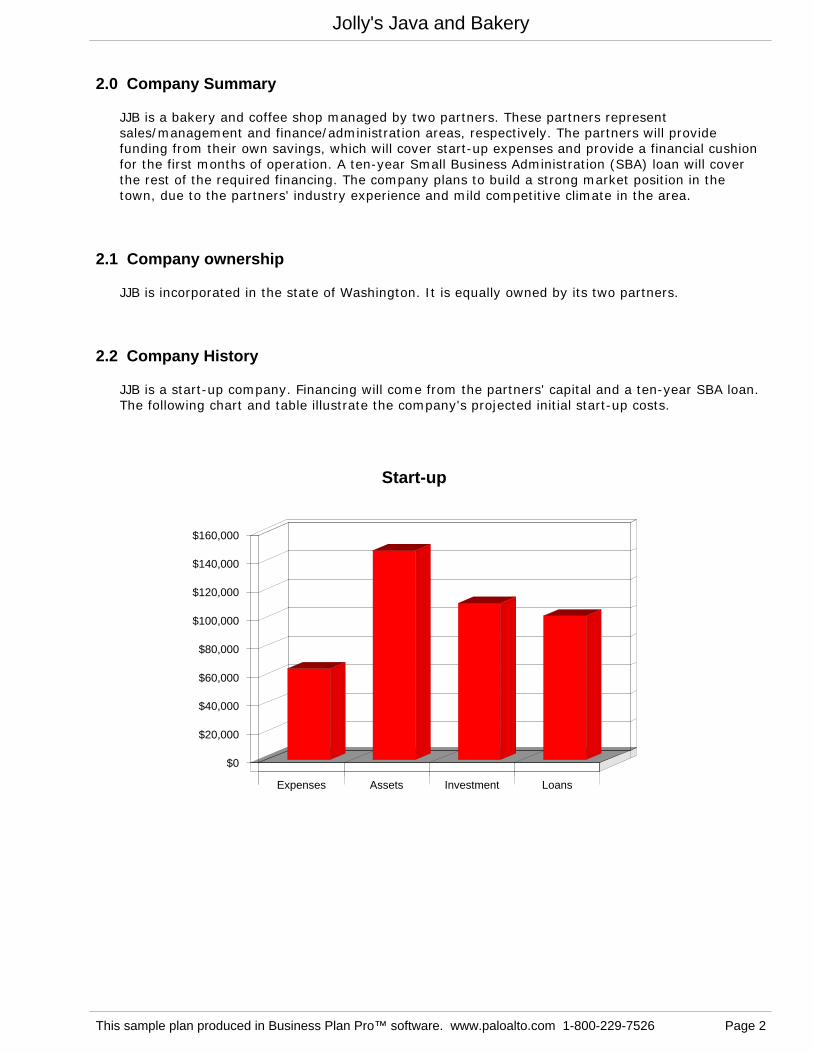
2.2 Company History
JJB is a start-up company. Financing will come from the partners' capital and a ten-year SBA loan. The following chart and table illustrate the company's projected initial start-up costs.
$0
$20,000
$40,000
$60,000
$80,000
$100,000
$120,000
$140,000
$160,000
Expenses Assets Investment Loans
Start-up
Jolly's Java and Bakery
This sample plan produced in Business Plan Pro™ software. www.paloalto.com 1-800-229-7526 Page 2

Table 2.2: Start-up
Start-up PlanStart-up ExpensesLegal $3,000Premise renovation $20,000Expensed equipment $40,000Other $1,000Total Start-up Expense $64,000
Start-up Assets NeededCash Requirements $70,000Other Short-term Assets $12,000Total Short-term Assets $82,000
Long-term Assets $65,000Total Assets $147,000
Total Start-up Requirements: $211,000Left to finance: $0
Start-up Funding Plan
InvestmentPatterson $55,000Fields $55,000Other $0Total investment $110,000
Short-term LiabilitiesUnpaid Expenses $1,000Short-term Loans $0Interest-free Short-term Loans $0Subtotal Short-term Liabilities $1,000Long-term Liabilities $100,000Total Liabilities $101,000
Loss at Start-up ($64,000)Total Capital $46,000Total Capital and Liabilities $147,000Checkline $0
3.0 Product/Service Description
JJB offers a broad range of coffee and espresso products, all from high quality Columbian grown imported coffee beans. JJB caters to all of its customers by providing each customer coffee and espresso products made to suit the customer, down to the smallest detail.
The bakery provides freshly prepared bakery and pastry products at all times during business operations. Six to eight moderate batches of bakery and pastry products are prepared during the day to assure fresh baked goods are always available.
Jolly's Java and Bakery
This sample plan produced in Business Plan Pro™ software. www.paloalto.com 1-800-229-7526 Page 3

4.0 Market Analysis
JJB's focus is on meeting the demand of a regular local resident customer base, as well as a significant level of tourist traffic from nearby highways.
4.1 Market Segmentation
JJB focuses on the middle- and upper-income markets. These market segments consume the majority of coffee and espresso products.
Local Residents
JJB wants to establish a large regular customer base. This will establish a healthy, consistent revenue base to ensure stability of the business.
Tourists
Tourist traffic comprises approximately 35% of the revenues. High visibility and competitive products and service are critical to capture this segment of the market.
Jolly's Java and Bakery
This sample plan produced in Business Plan Pro™ software. www.paloalto.com 1-800-229-7526 Page 4
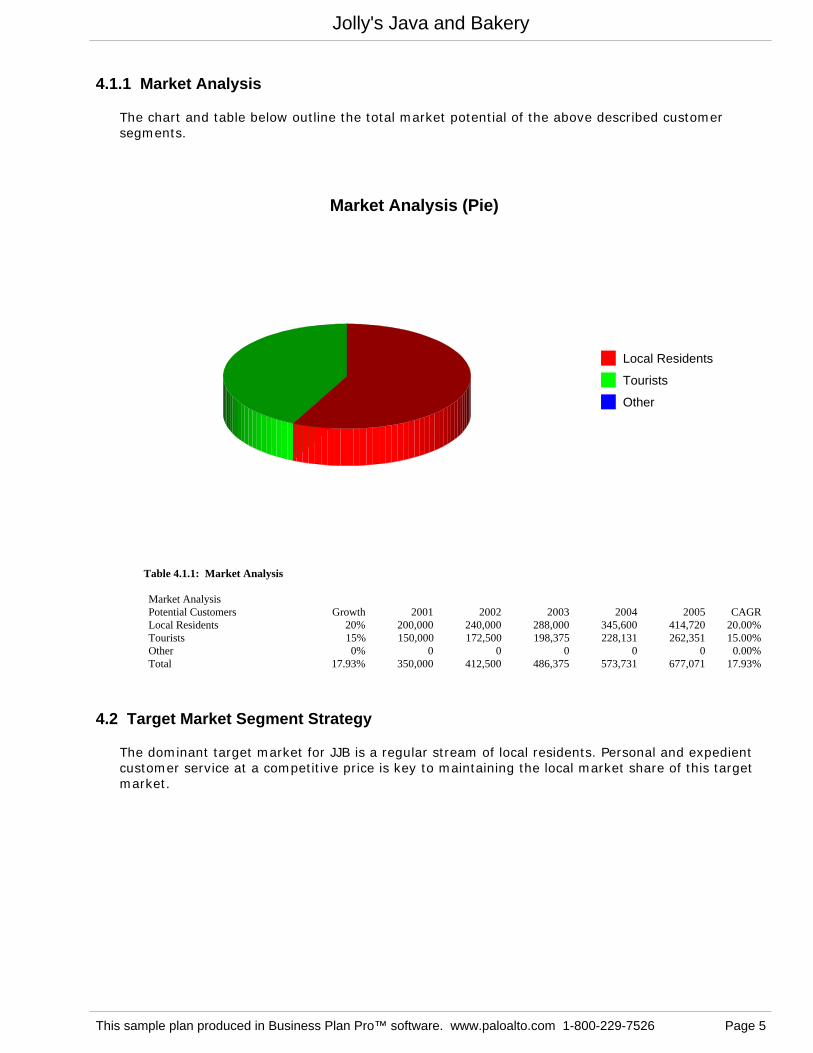
4.1.1 Market Analysis
The chart and table below outline the total market potential of the above described customer segments.
Local Residents
Tourists
Other
Market Analysis (Pie)
Table 4.1.1: Market Analysis
Market AnalysisPotential Customers Growth 2001 2002 2003 2004 2005 CAGRLocal Residents 20% 200,000 240,000 288,000 345,600 414,720 20.00%Tourists 15% 150,000 172,500 198,375 228,131 262,351 15.00%Other 0% 0 0 0 0 0 0.00%Total 17.93% 350,000 412,500 486,375 573,731 677,071 17.93%
4.2 Target Market Segment Strategy
The dominant target market for JJB is a regular stream of local residents. Personal and expedient customer service at a competitive price is key to maintaining the local market share of this target market.
Jolly's Java and Bakery
This sample plan produced in Business Plan Pro™ software. www.paloalto.com 1-800-229-7526 Page 5

4.2.1 Market Needs
Because Washington has a cool climate for eight months out of the year, hot coffee products are very much in demand. During the remaining warmer four months of the year, iced coffee products are in significantly high demand, along with a slower but consistent demand for hot coffee products. Much of the day's activity occurs in the morning hours before ten a.m., with a relatively steady flow for the remainder of the day.
4.3 Service Business Analysis
The retail coffee industry in the U.S. has recently experienced rapid growth. The cool marine climate in southwest Washington stimulates consumption of hot beverages throughout the year. Coffee drinkers in the Pacific Northwest are finicky about the quality of beverages offered at the numerous coffee bars across the region. Despite low competition in the immediate area, JJB will position itself as a place where customers can enjoy a cup of delicious coffee with a fresh pastry in a relaxing environment.
4.3.1 Competition and Buying Patterns
Competition in the local area is somewhat sparse and does not provide nearly the level of product quality and customer service as JJB. Local customers are looking for a high quality product in a relaxing atmosphere. They desire a unique, classy experience.
Leading competitors purchase and roast high quality, whole-bean coffees and, along with Italian-style espresso beverages, cold-blended beverages, a variety of pastries and confections, coffee-related accessories and equipment, and a line of premium teas, sell these items primarily through company-operated retail stores. In addition to sales through company-operated retail stores, leading competitors sell coffee and tea products through other channels of distribution (specialty operations).
Larger chains vary their product mix depending upon the size of each store and its location. Larger stores carry a broad selection of whole bean coffees in various sizes and types of packaging, as well as an assortment of coffee- and espresso-making equipment and accessories such as coffee grinders, coffee makers, espresso machines, coffee filters, storage containers, travel tumblers and mugs. Smaller stores and kiosks typically sell a full line of coffee beverages, a more limited selection of whole-bean coffees, and a few accessories such as travel tumblers and logo mugs. During fiscal year 2000, industry retail sales mix by product type was approximately 73% beverages, 14% food items, eight percent whole-bean coffees, and five percent coffee-making equipment and accessories.
Technologically savvy competitors make fresh coffee and coffee-related products conveniently available via mail order and online. Additionally, mail order catalogs offering coffees, certain food items, and select coffee-making equipment and accessories, have been made available by a few larger competitors. Websites offering online stores that allow customers to browse for and purchase coffee, gifts, and other items via the Internet have become more commonplace as well.
Jolly's Java and Bakery
This sample plan produced in Business Plan Pro™ software. www.paloalto.com 1-800-229-7526 Page 6

5.0 Strategy and Implementation
JJB will succeed by offering consumers high quality coffee, espresso, and bakery products with personal service at a competitive price.
5.1 Competitive Edge
JJB's competitive edge is the relatively low level of competition in the local area in this particular niche.
5.2 Marketing Strategy
As the chart and table show, JJB anticipates sales of about $491,000 in the first year, $567,000 in the second year, and $655,000 in the third year of the plan.
$0
$100,000
$200,000
$300,000
$400,000
$500,000
$600,000
$700,000
2001 2002 2003
Espresso Drinks
Pastry Items
Other
Sales by Year
Jolly's Java and Bakery
This sample plan produced in Business Plan Pro™ software. www.paloalto.com 1-800-229-7526 Page 7

Table 5.2: Sales Forecast
Sales ForecastUnit Sales 2001 2002 2003Espresso Drinks 135,000 148,500 163,350Pastry Items 86,000 94,600 104,060Other 0 0 0Total Unit Sales 221,000 243,100 267,410
Unit Prices 2001 2002 2003Espresso Drinks $3.00 $3.15 $3.31Pastry Items $1.00 $1.05 $1.10Other $0.00 $0.00 $0.00
SalesEspresso Drinks $405,000 $467,775 $540,280Pastry Items $86,000 $99,330 $114,726Other $0 $0 $0Total Sales $491,000 $567,105 $655,006
Direct Unit Costs 2001 2002 2003Espresso Drinks $0.25 $0.26 $0.28Pastry Items $0.50 $0.53 $0.55Other $0.00 $0.00 $0.00
Direct Cost of Sales 2001 2002 2003Espresso Drinks $33,750 $38,981 $45,023Pastry Items $43,000 $49,665 $57,363Other $0 $0 $0Subtotal Direct Cost of Sales $76,750 $88,646 $102,386
Jolly's Java and Bakery
This sample plan produced in Business Plan Pro™ software. www.paloalto.com 1-800-229-7526 Page 8

6.0 Management Team
Austin Patterson has extensive experience in sales, marketing, and management, and was vice president of marketing with both Jansonne & Jansonne and Burper Foods. David Fields brings experience in the area of finance and administration, including a stint as chief financial officer with both Flaxfield Roasters and the national coffee store chain, BuzzCups.
6.1 Personnel Plan
As the personnel plan shows, JJB expects to make significant investments in sales, sales support, and product development personnel.
Table 6.1: Personnel
Personnel PlanPersonnel 2001 2002 2003Managers $100,000 $105,000 $110,250Baristas $120,000 $126,000 $132,300Other $0 $0 $0Total Payroll $220,000 $231,000 $242,550
Total Headcount 8 8 8Payroll Burden $33,000 $34,650 $36,383Total Payroll Expenditures $253,000 $265,650 $278,933
Jolly's Java and Bakery
This sample plan produced in Business Plan Pro™ software. www.paloalto.com 1-800-229-7526 Page 9

7.0 Financial Plan
JJB expects to raise $110,000 of its own capital, and to borrow $100,000 guaranteed by the SBA as a ten-year loan. This provides the bulk of the current financing required.
7.1 Break-even Analysis
JJB's Break-even Analysis is based on the average of the first-year figures for total sales by units, and by operating expenses. These are presented as per-unit revenue, per-unit cost, and fixed costs. These conservative assumptions make for a more accurate estimate of real risk. JJB should break even by the third month of its operation as it steadily increases its sales.
($30,000)
($20,000)
($10,000)
$0
$10,000
$20,000
$30,000
$40,000
0 6000 12000 18000 24000 30000
Monthly break-even point
Break-even point = where line intersects with 0
Break-even Analysis
Table 7.1: Break-even Analysis
Break-even Analysis:Monthly Units Break-even 15,369Monthly Sales Break-even $33,812
Assumptions:Average Per-Unit Revenue $2.20Average Per-Unit Variable Cost $0.35Estimated Monthly Fixed Cost $28,433
Jolly's Java and Bakery
This sample plan produced in Business Plan Pro™ software. www.paloalto.com 1-800-229-7526 Page 10

7.2 Projected Profit and Loss
As the Profit and Loss table shows, JJB expects to continue its steady growth in profitability over the next three years of operations.
Table 7.2: Profit and Loss
Profit and Loss (Income Statement) 2001 2002 2003
Sales $491,000 $567,105 $655,006Direct Cost of Sales $76,750 $88,646 $102,386Other $0 $0 $0
------------ ------------ ------------Total Cost of Sales $76,750 $88,646 $102,386Gross Margin $414,250 $478,459 $552,620Gross Margin % 84.37% 84.37% 84.37%Operating expenses: Advertising/Promotion $2,400 $10,000 $45,000Rent $24,000 $25,200 $26,460Payroll Expense $220,000 $231,000 $242,550Payroll Burden $33,000 $34,650 $36,383Depreciation $60,000 $69,000 $79,350Utilities $1,200 $1,260 $1,323Other $600 $0 $0
------------ ------------ ------------Total Operating Expenses $341,200 $371,110 $431,066Profit Before Interest and Taxes $73,050 $107,349 $121,554Interest Expense Short-term $0 $0 $0Interest Expense Long-term $9,673 $8,887 $7,637Taxes Incurred $15,844 $24,616 $28,479Extraordinary Items $0 $0 $0Net Profit $47,533 $73,847 $85,438Net Profit/Sales 9.68% 13.02% 13.04%
Jolly's Java and Bakery
This sample plan produced in Business Plan Pro™ software. www.paloalto.com 1-800-229-7526 Page 11
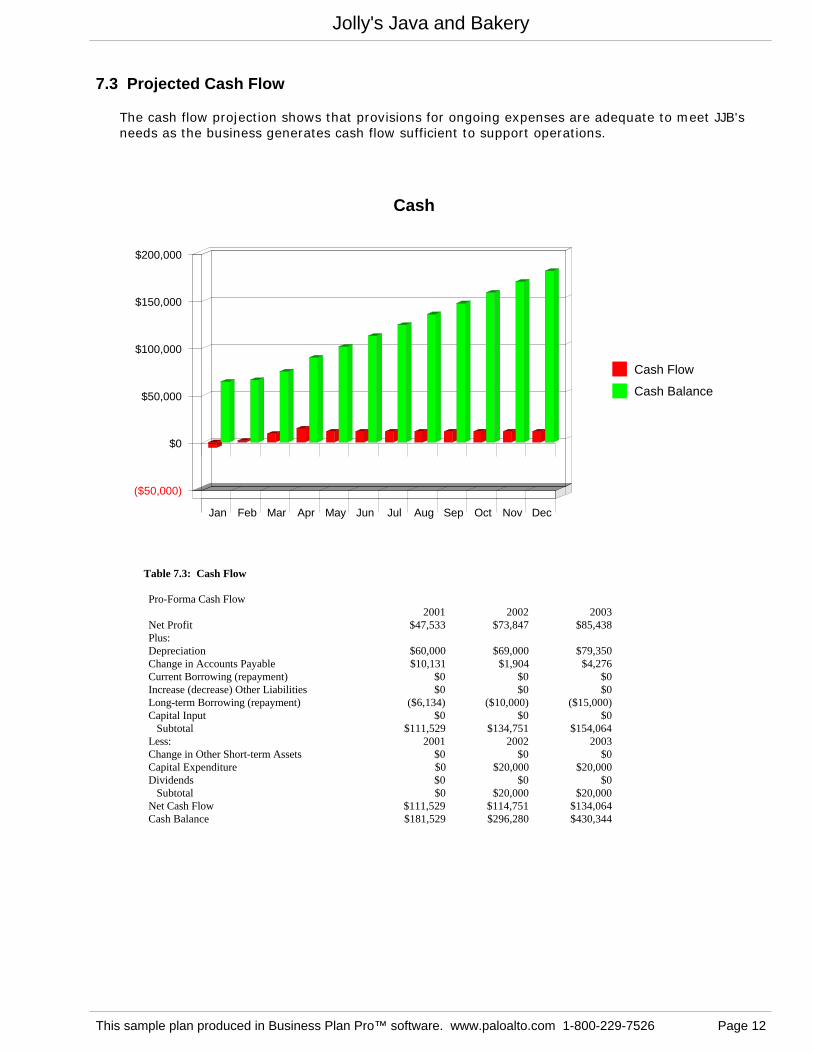
7.3 Projected Cash Flow
The cash flow projection shows that provisions for ongoing expenses are adequate to meet JJB's needs as the business generates cash flow sufficient to support operations.
($50,000)
$0
$50,000
$100,000
$150,000
$200,000
Jan Feb Mar Apr May Jun Jul Aug Sep Oct Nov Dec
Cash Flow
Cash Balance
Cash
Table 7.3: Cash Flow
Pro-Forma Cash Flow 2001 2002 2003
Net Profit $47,533 $73,847 $85,438Plus:Depreciation $60,000 $69,000 $79,350Change in Accounts Payable $10,131 $1,904 $4,276Current Borrowing (repayment) $0 $0 $0Increase (decrease) Other Liabilities $0 $0 $0Long-term Borrowing (repayment) ($6,134) ($10,000) ($15,000)Capital Input $0 $0 $0 Subtotal $111,529 $134,751 $154,064Less: 2001 2002 2003Change in Other Short-term Assets $0 $0 $0Capital Expenditure $0 $20,000 $20,000Dividends $0 $0 $0 Subtotal $0 $20,000 $20,000Net Cash Flow $111,529 $114,751 $134,064Cash Balance $181,529 $296,280 $430,344
Jolly's Java and Bakery
This sample plan produced in Business Plan Pro™ software. www.paloalto.com 1-800-229-7526 Page 12

7.4 Balance Sheet
The following is a projected Balance Sheet for JJB.
Table 7.4: Balance Sheet
Pro-forma Balance Sheet
AssetsShort-term Assets 2001 2002 2003Cash $181,529 $296,280 $430,344Other Short-term Assets $12,000 $12,000 $12,000Total Short-term Assets $193,529 $308,280 $442,344Long-term AssetsCapital Assets $65,000 $85,000 $105,000Accumulated Depreciation $60,000 $129,000 $208,350Total Long-term Assets $5,000 ($44,000) ($103,350)Total Assets $198,529 $264,280 $338,994
Liabilities and Capital 2001 2002 2003
Accounts Payable $11,131 $13,035 $17,311Short-term Notes $0 $0 $0Other Short-term Liabilities $0 $0 $0Subtotal Short-term Liabilities $11,131 $13,035 $17,311
Long-term Liabilities $93,866 $83,866 $68,866Total Liabilities $104,996 $96,901 $86,177
Paid in Capital $110,000 $110,000 $110,000Retained Earnings ($64,000) ($16,467) $57,380Earnings $47,533 $73,847 $85,438Total Capital $93,533 $167,380 $252,818Total Liabilities and Capital $198,529 $264,280 $338,994Net Worth $93,533 $167,380 $252,818
Jolly's Java and Bakery
This sample plan produced in Business Plan Pro™ software. www.paloalto.com 1-800-229-7526 Page 13

7.5 Business Ratios
The following table represents key ratios for the retail bakery and coffee shop industry. These ratios are determined by the Standard Industry Classification (SIC) Index.
Table 7.5: Ratios
Ratio Analysis 2001 2002 2003 Industry Profile
Sales Growth 0.00% 115.50% 115.50% 7.60%
Percent of Total Assets 2001 2002 2003 Industry ProfileAccounts Receivable 0.00% 0.00% 0.00% 4.50%Inventory 0.00% 0.00% 0.00% 3.60%Other Short-term Assets 6.04% 4.54% 3.54% 35.60%Total Short-term Assets 97.48% 116.65% 130.49% 43.70%Long-term Assets 2.52% -16.65% -30.49% 56.30%Total Assets 100.00% 100.00% 100.00% 100.00%
Other Short-term Liabilities 0.00% 0.00% 0.00% 32.70%Subtotal Short-term Liabilities 5.61% 4.93% 5.11% 23.10%Long-term Liabilities 47.28% 31.73% 20.31% 28.50%Total Liabilities 52.89% 36.67% 25.42% 61.20%Net Worth 47.11% 63.33% 74.58% 38.80%
Percent of Sales 2001 2002 2003 Industry ProfileSales 100.00% 100.00% 100.00% 100.00%Gross Margin 84.37% 84.37% 84.37% 60.50%Selling, General & Administrative Expenses 74.69% 71.35% 71.32% 39.80%Advertising Expenses 0.49% 1.76% 6.87% 3.20%Profit Before Interest and Taxes 14.88% 18.93% 18.56% 0.70%
Ratios 2001 2002 2003 Industry ProfileCurrent 17.39 23.65 25.55 0.98Quick 17.39 23.65 25.55 0.65Total Debt to Total Assets 52.89% 36.67% 25.42% 61.20%Pre-Tax Return on Net Worth 88.44% 69.44% 51.10% 1.70%Pre-Tax Return on Assets 41.67% 43.98% 38.11% 4.30%
Jolly's Java and Bakery
This sample plan produced in Business Plan Pro™ software. www.paloalto.com 1-800-229-7526 Page 14

Table 5.2 Sales Forecast
Sales ForecastUnit Sales Jan Feb Mar Apr May Jun Jul Aug Sep Oct Nov DecEspresso Drinks 5,000 7,500 10,000 12,500 12,500 12,500 12,500 12,500 12,500 12,500 12,500 12,500Pastry Items 2,000 3,000 6,000 8,333 8,333 8,333 8,333 8,333 8,333 8,333 8,333 8,333Other 0 0 0 0 0 0 0 0 0 0 0 0Total Unit Sales 7,000 10,500 16,000 20,833 20,833 20,833 20,833 20,833 20,833 20,833 20,833 20,833
Unit Prices Jan Feb Mar Apr May Jun Jul Aug Sep Oct Nov DecEspresso Drinks $3.00 $3.00 $3.00 $3.00 $3.00 $3.00 $3.00 $3.00 $3.00 $3.00 $3.00 $3.00Pastry Items $1.00 $1.00 $1.00 $1.00 $1.00 $1.00 $1.00 $1.00 $1.00 $1.00 $1.00 $1.00Other $0.00 $0.00 $0.00 $0.00 $0.00 $0.00 $0.00 $0.00 $0.00 $0.00 $0.00 $0.00
SalesEspresso Drinks $15,000 $22,500 $30,000 $37,500 $37,500 $37,500 $37,500 $37,500 $37,500 $37,500 $37,500 $37,500Pastry Items $2,000 $3,000 $6,000 $8,333 $8,333 $8,333 $8,333 $8,333 $8,333 $8,333 $8,333 $8,333Other $0 $0 $0 $0 $0 $0 $0 $0 $0 $0 $0 $0Total Sales $17,000 $25,500 $36,000 $45,833 $45,833 $45,833 $45,833 $45,833 $45,833 $45,833 $45,833 $45,833
Direct Unit Costs Jan Feb Mar Apr May Jun Jul Aug Sep Oct Nov DecEspresso Drinks $0.25 $0.25 $0.25 $0.25 $0.25 $0.25 $0.25 $0.25 $0.25 $0.25 $0.25 $0.25Pastry Items $0.50 $0.50 $0.50 $0.50 $0.50 $0.50 $0.50 $0.50 $0.50 $0.50 $0.50 $0.50Other $0.00 $0.00 $0.00 $0.00 $0.00 $0.00 $0.00 $0.00 $0.00 $0.00 $0.00 $0.00
Direct Cost of Sales Jan Feb Mar Apr May Jun Jul Aug Sep Oct Nov DecEspresso Drinks $1,250 $1,875 $2,500 $3,125 $3,125 $3,125 $3,125 $3,125 $3,125 $3,125 $3,125 $3,125Pastry Items $1,000 $1,500 $3,000 $4,167 $4,167 $4,167 $4,167 $4,167 $4,167 $4,167 $4,167 $4,167Other $0 $0 $0 $0 $0 $0 $0 $0 $0 $0 $0 $0Subtotal Direct Cost of Sales $2,250 $3,375 $5,500 $7,292 $7,292 $7,292 $7,292 $7,292 $7,292 $7,292 $7,292 $7,292
Appendix: Jolly's Java and Bakery
This sample plan produced in Business Plan Pro™ software. www.paloalto.com 1-800-229-7526 Page 1

Table 6.1 Personnel
Personnel PlanPersonnel Jan Feb Mar Apr May Jun Jul Aug Sep Oct Nov DecManagers $8,333 $8,333 $8,333 $8,333 $8,333 $8,333 $8,333 $8,333 $8,333 $8,333 $8,333 $8,333Baristas $10,000 $10,000 $10,000 $10,000 $10,000 $10,000 $10,000 $10,000 $10,000 $10,000 $10,000 $10,000Other $0 $0 $0 $0 $0 $0 $0 $0 $0 $0 $0 $0Total Payroll $18,333 $18,333 $18,333 $18,333 $18,333 $18,333 $18,333 $18,333 $18,333 $18,333 $18,333 $18,333
Total Headcount 8 8 8 8 8 8 8 8 8 8 8 8Payroll Burden $2,750 $2,750 $2,750 $2,750 $2,750 $2,750 $2,750 $2,750 $2,750 $2,750 $2,750 $2,750Total Payroll Expenditures $21,083 $21,083 $21,083 $21,083 $21,083 $21,083 $21,083 $21,083 $21,083 $21,083 $21,083 $21,083
Appendix: Jolly's Java and Bakery
This sample plan produced in Business Plan Pro™ software. www.paloalto.com 1-800-229-7526 Page 2

Table 7.2 Profit and Loss
Profit and Loss (Income Statement)Jan Feb Mar Apr May Jun Jul Aug Sep Oct Nov Dec
Sales $17,000 $25,500 $36,000 $45,833 $45,833 $45,833 $45,833 $45,833 $45,833 $45,833 $45,833 $45,833Direct Cost of Sales $2,250 $3,375 $5,500 $7,292 $7,292 $7,292 $7,292 $7,292 $7,292 $7,292 $7,292 $7,292Other $0 $0 $0 $0 $0 $0 $0 $0 $0 $0 $0 $0
------------ ------------ ------------ ------------ ------------ ------------ ------------ ------------ ------------ ------------ ------------ ------------Total Cost of Sales $2,250 $3,375 $5,500 $7,292 $7,292 $7,292 $7,292 $7,292 $7,292 $7,292 $7,292 $7,292Gross Margin $14,750 $22,125 $30,500 $38,542 $38,542 $38,542 $38,542 $38,542 $38,542 $38,542 $38,542 $38,542Gross Margin % 86.76% 86.76% 84.72% 84.09% 84.09% 84.09% 84.09% 84.09% 84.09% 84.09% 84.09% 84.09%Operating expenses: Advertising/Promotion $200 $200 $200 $200 $200 $200 $200 $200 $200 $200 $200 $200Rent $2,000 $2,000 $2,000 $2,000 $2,000 $2,000 $2,000 $2,000 $2,000 $2,000 $2,000 $2,000Payroll Expense $18,333 $18,333 $18,333 $18,333 $18,333 $18,333 $18,333 $18,333 $18,333 $18,333 $18,333 $18,333Payroll Burden $2,750 $2,750 $2,750 $2,750 $2,750 $2,750 $2,750 $2,750 $2,750 $2,750 $2,750 $2,750Depreciation $5,000 $5,000 $5,000 $5,000 $5,000 $5,000 $5,000 $5,000 $5,000 $5,000 $5,000 $5,000Utilities $100 $100 $100 $100 $100 $100 $100 $100 $100 $100 $100 $100Other $50 $50 $50 $50 $50 $50 $50 $50 $50 $50 $50 $50
------------ ------------ ------------ ------------ ------------ ------------ ------------ ------------ ------------ ------------ ------------ ------------Total Operating Expenses $28,433 $28,433 $28,433 $28,433 $28,433 $28,433 $28,433 $28,433 $28,433 $28,433 $28,433 $28,433Profit Before Interest and Taxes ($13,683) ($6,308) $2,067 $10,108 $10,108 $10,108 $10,108 $10,108 $10,108 $10,108 $10,108 $10,108Interest Expense Short-term $0 $0 $0 $0 $0 $0 $0 $0 $0 $0 $0 $0Interest Expense Long-term $829 $825 $821 $817 $813 $808 $804 $800 $795 $791 $787 $782Taxes Incurred ($3,628) ($1,783) $311 $2,323 $2,324 $2,325 $2,326 $2,327 $2,328 $2,329 $2,330 $2,332Extraordinary Items $0 $0 $0 $0 $0 $0 $0 $0 $0 $0 $0 $0Net Profit ($10,884) ($5,350) $934 $6,969 $6,972 $6,975 $6,978 $6,981 $6,985 $6,988 $6,991 $6,995Net Profit/Sales -64.03% -20.98% 2.60% 15.20% 15.21% 15.22% 15.23% 15.23% 15.24% 15.25% 15.25% 15.26%
Appendix: Jolly's Java and Bakery
This sample plan produced in Business Plan Pro™ software. www.paloalto.com 1-800-229-7526 Page 3
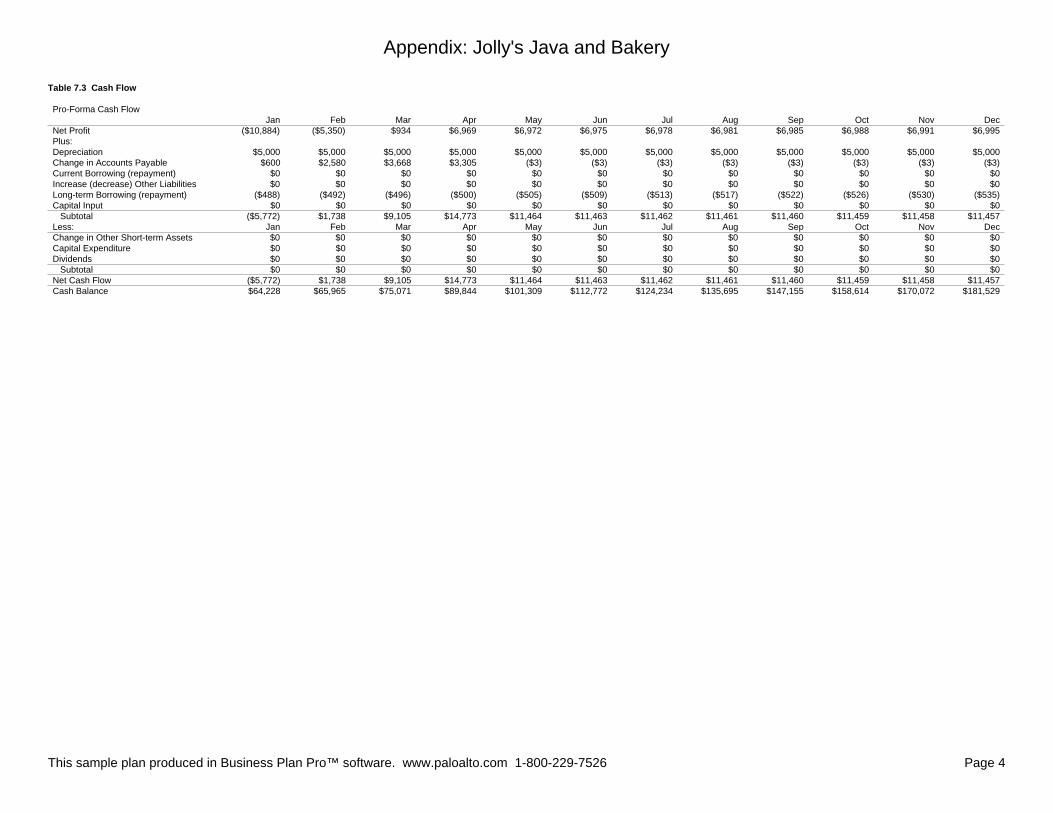
Table 7.3 Cash Flow
Pro-Forma Cash FlowJan Feb Mar Apr May Jun Jul Aug Sep Oct Nov Dec
Net Profit ($10,884) ($5,350) $934 $6,969 $6,972 $6,975 $6,978 $6,981 $6,985 $6,988 $6,991 $6,995Plus:Depreciation $5,000 $5,000 $5,000 $5,000 $5,000 $5,000 $5,000 $5,000 $5,000 $5,000 $5,000 $5,000Change in Accounts Payable $600 $2,580 $3,668 $3,305 ($3) ($3) ($3) ($3) ($3) ($3) ($3) ($3)Current Borrowing (repayment) $0 $0 $0 $0 $0 $0 $0 $0 $0 $0 $0 $0Increase (decrease) Other Liabilities $0 $0 $0 $0 $0 $0 $0 $0 $0 $0 $0 $0Long-term Borrowing (repayment) ($488) ($492) ($496) ($500) ($505) ($509) ($513) ($517) ($522) ($526) ($530) ($535)Capital Input $0 $0 $0 $0 $0 $0 $0 $0 $0 $0 $0 $0 Subtotal ($5,772) $1,738 $9,105 $14,773 $11,464 $11,463 $11,462 $11,461 $11,460 $11,459 $11,458 $11,457Less: Jan Feb Mar Apr May Jun Jul Aug Sep Oct Nov DecChange in Other Short-term Assets $0 $0 $0 $0 $0 $0 $0 $0 $0 $0 $0 $0Capital Expenditure $0 $0 $0 $0 $0 $0 $0 $0 $0 $0 $0 $0Dividends $0 $0 $0 $0 $0 $0 $0 $0 $0 $0 $0 $0 Subtotal $0 $0 $0 $0 $0 $0 $0 $0 $0 $0 $0 $0Net Cash Flow ($5,772) $1,738 $9,105 $14,773 $11,464 $11,463 $11,462 $11,461 $11,460 $11,459 $11,458 $11,457Cash Balance $64,228 $65,965 $75,071 $89,844 $101,309 $112,772 $124,234 $135,695 $147,155 $158,614 $170,072 $181,529
Appendix: Jolly's Java and Bakery
This sample plan produced in Business Plan Pro™ software. www.paloalto.com 1-800-229-7526 Page 4

Table 7.4 Balance Sheet
Pro-forma Balance Sheet
AssetsShort-term Assets Jan Feb Mar Apr May Jun Jul Aug Sep Oct Nov DecCash $64,228 $65,965 $75,071 $89,844 $101,309 $112,772 $124,234 $135,695 $147,155 $158,614 $170,072 $181,529Other Short-term Assets $12,000 $12,000 $12,000 $12,000 $12,000 $12,000 $12,000 $12,000 $12,000 $12,000 $12,000 $12,000Total Short-term Assets $76,228 $77,965 $87,071 $101,844 $113,309 $124,772 $136,234 $147,695 $159,155 $170,614 $182,072 $193,529Long-term AssetsCapital Assets $65,000 $65,000 $65,000 $65,000 $65,000 $65,000 $65,000 $65,000 $65,000 $65,000 $65,000 $65,000Accumulated Depreciation $5,000 $10,000 $15,000 $20,000 $25,000 $30,000 $35,000 $40,000 $45,000 $50,000 $55,000 $60,000Total Long-term Assets $60,000 $55,000 $50,000 $45,000 $40,000 $35,000 $30,000 $25,000 $20,000 $15,000 $10,000 $5,000Total Assets $136,228 $132,965 $137,071 $146,844 $153,309 $159,772 $166,234 $172,695 $179,155 $185,614 $192,072 $198,529
Liabilities and CapitalJan Feb Mar Apr May Jun Jul Aug Sep Oct Nov Dec
Accounts Payable $1,600 $4,180 $7,848 $11,153 $11,150 $11,148 $11,145 $11,142 $11,139 $11,136 $11,133 $11,131Short-term Notes $0 $0 $0 $0 $0 $0 $0 $0 $0 $0 $0 $0Other Short-term Liabilities $0 $0 $0 $0 $0 $0 $0 $0 $0 $0 $0 $0Subtotal Short-term Liabilities $1,600 $4,180 $7,848 $11,153 $11,150 $11,148 $11,145 $11,142 $11,139 $11,136 $11,133 $11,131
Long-term Liabilities $99,512 $99,020 $98,523 $98,023 $97,518 $97,009 $96,496 $95,979 $95,457 $94,931 $94,401 $93,866Total Liabilities $101,112 $103,200 $106,371 $109,176 $108,669 $108,157 $107,641 $107,121 $106,596 $106,067 $105,534 $104,996
Paid in Capital $110,000 $110,000 $110,000 $110,000 $110,000 $110,000 $110,000 $110,000 $110,000 $110,000 $110,000 $110,000Retained Earnings ($64,000) ($64,000) ($64,000) ($64,000) ($64,000) ($64,000) ($64,000) ($64,000) ($64,000) ($64,000) ($64,000) ($64,000)Earnings ($10,884) ($16,235) ($15,300) ($8,332) ($1,360) $5,615 $12,593 $19,575 $26,559 $33,547 $40,538 $47,533Total Capital $35,116 $29,765 $30,700 $37,668 $44,640 $51,615 $58,593 $65,575 $72,559 $79,547 $86,538 $93,533Total Liabilities and Capital $136,228 $132,965 $137,071 $146,844 $153,309 $159,772 $166,234 $172,695 $179,155 $185,614 $192,072 $198,529Net Worth $35,116 $29,765 $30,700 $37,668 $44,640 $51,615 $58,593 $65,575 $72,559 $79,547 $86,538 $93,533
Appendix: Jolly's Java and Bakery
This sample plan produced in Business Plan Pro™ software. www.paloalto.com 1-800-229-7526 Page 5