john billings: developing a new predictive risk model
TRANSCRIPT

John Billings
July, 2013
New York University
Robert F. Wagner Graduate School of Public Service
DEVELOPING A NEW
PREDICTIVE RISK MODEL

July, 2013
New York University
Robert F. Wagner Graduate School of Public Service
DEVELOPING A NEW
PREDICTIVE RISK MODELS
CONTINUING WORK ON

WHAT I’M GOING TO TALK ABOUT

WHAT I’M GOING TO TALK ABOUT
• What to predict?
– Costs
– Future admissions
– Something else
WHAT I’M GOING TO TALK ABOUT
• What to predict?
• How to assess performance of the model?
– Avoid “over-fitting”
– Positive predictive value (PPV)
– Sensitivity, receiver operating curve C statistic, etc.
WHAT I’M GOING TO TALK ABOUT
• What to predict?
• How to assess performance of the model?
• What data bases to use?
– Inpatient
– A&E
– Outpatient
– GP electronic medical records
– Social care information
–
–
WHAT I’M GOING TO TALK ABOUT
• What to predict?
• How to assess performance of the model?
• What data bases to use?
• What variables to use?
– Demographics
– Prior utilization (frequency/recentness)
– Prior cost
– Diagnostic history
– Test results (GP electronic medical records)
– Other stuff (missed appointments, unplanned A&E follow-up visits,
etc)
WHAT I’M GOING TO TALK ABOUT
• What to predict?
• How to assess performance of the model?
• What data bases to use?
• What variables to use?
• Who is in the denominator?
– Patients with prior emergency admission (PARR)
– Patients with any HES history (inpatient, A&E, outpatient)
– All registered patients
WHAT I’M GOING TO TALK ABOUT
• What to predict?
• How to assess performance of the model?
• What data bases to use?
• What variables to use?
• Who is in the denominator?
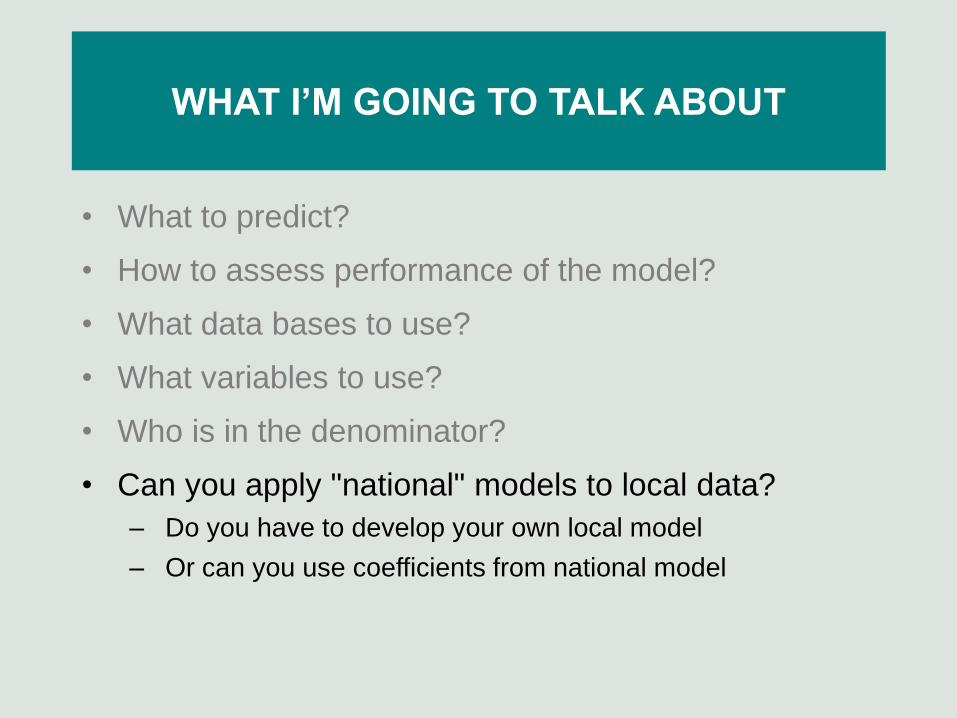
• Can you apply "national" models to local data?
– Do you have to develop your own local model
– Or can you use coefficients from national model
WHAT I’M GOING TO TALK ABOUT
• What to predict?
• How to assess performance of the model?
• What data bases to use?
• What variables to use?
• Who is in the denominator?
• Can you apply "national" models to local data?
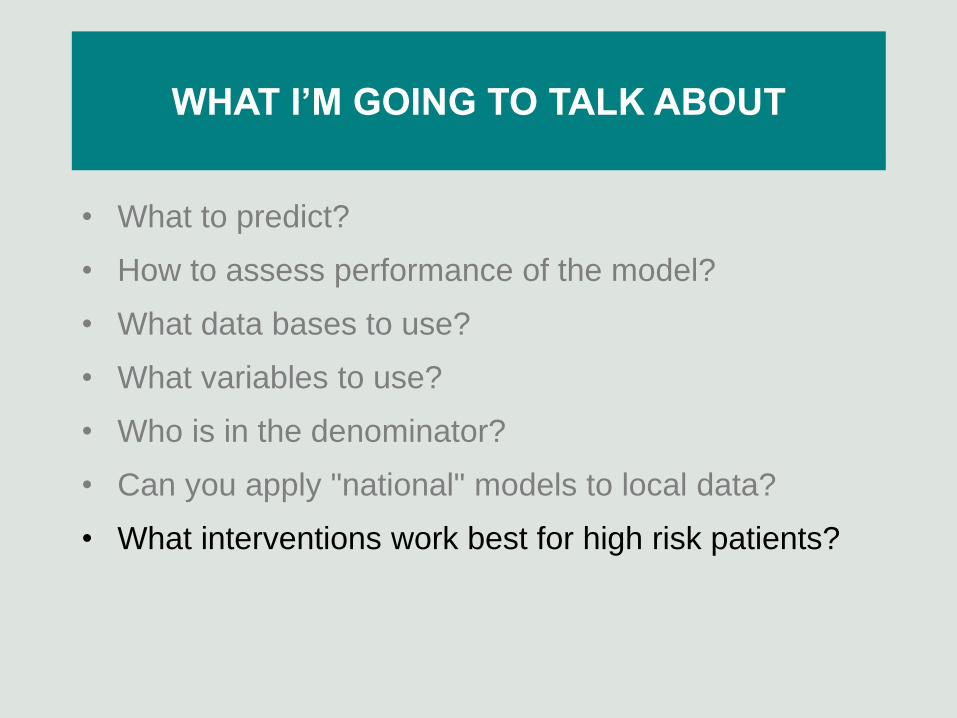
• What interventions work best for high risk patients?
WHAT I’M GOING TO TALK ABOUT
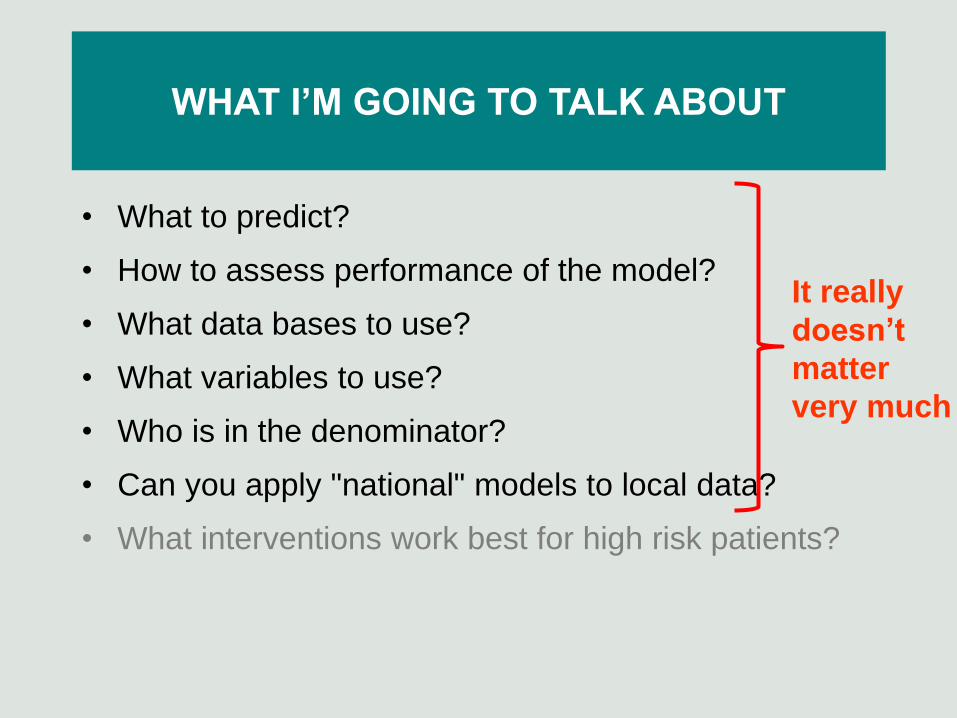
• What to predict?
• How to assess performance of the model?
• What data bases to use?
• What variables to use?
• Who is in the denominator?
• Can you apply "national" models to local data?
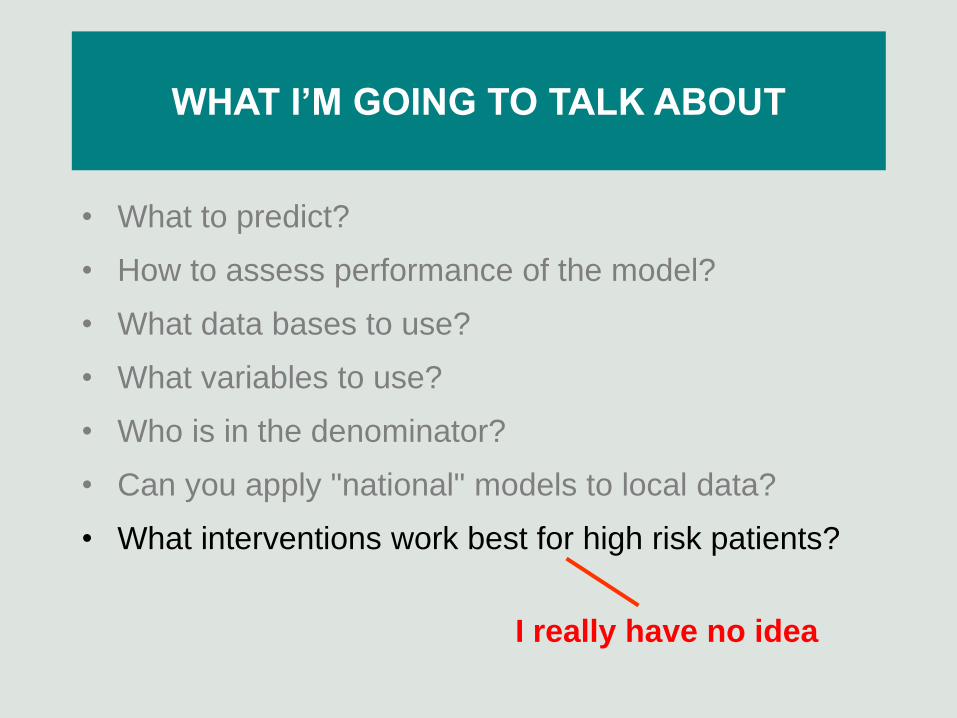
• What interventions work best for high risk patients?
It really
doesn’t
matter
very much
WHAT I’M GOING TO TALK ABOUT
• What to predict?
• How to assess performance of the model?
• What data bases to use?
• What variables to use?
• Who is in the denominator?
• Can you apply "national" models to local data?
• What interventions work best for high risk patients?
I really have no idea
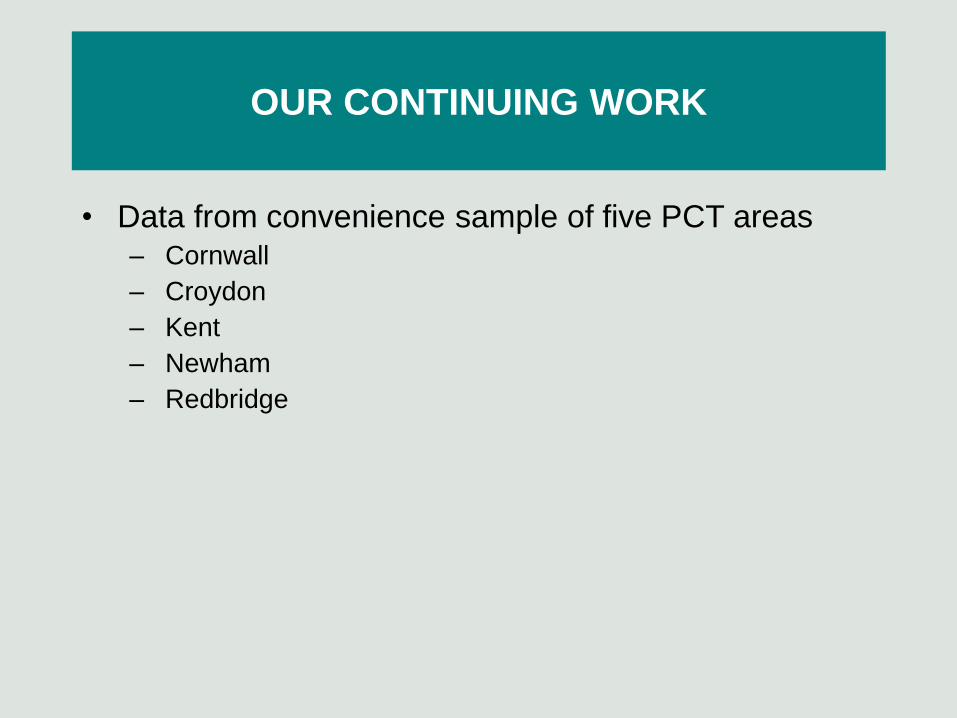
OUR CONTINUING WORK
• Data from convenience sample of five PCT areas ‒ Cornwall
‒ Croydon
‒ Kent
‒ Newham
‒ Redbridge
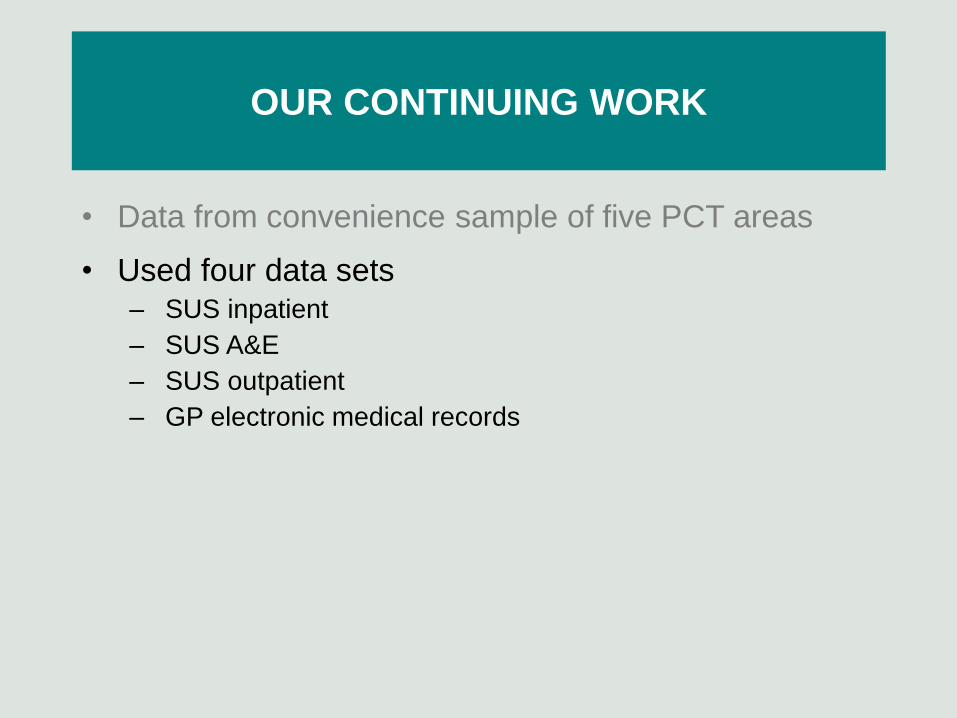
OUR CONTINUING WORK
• Data from convenience sample of five PCT areas
• Used four data sets ‒ SUS inpatient
‒ SUS A&E
‒ SUS outpatient
‒ GP electronic medical records
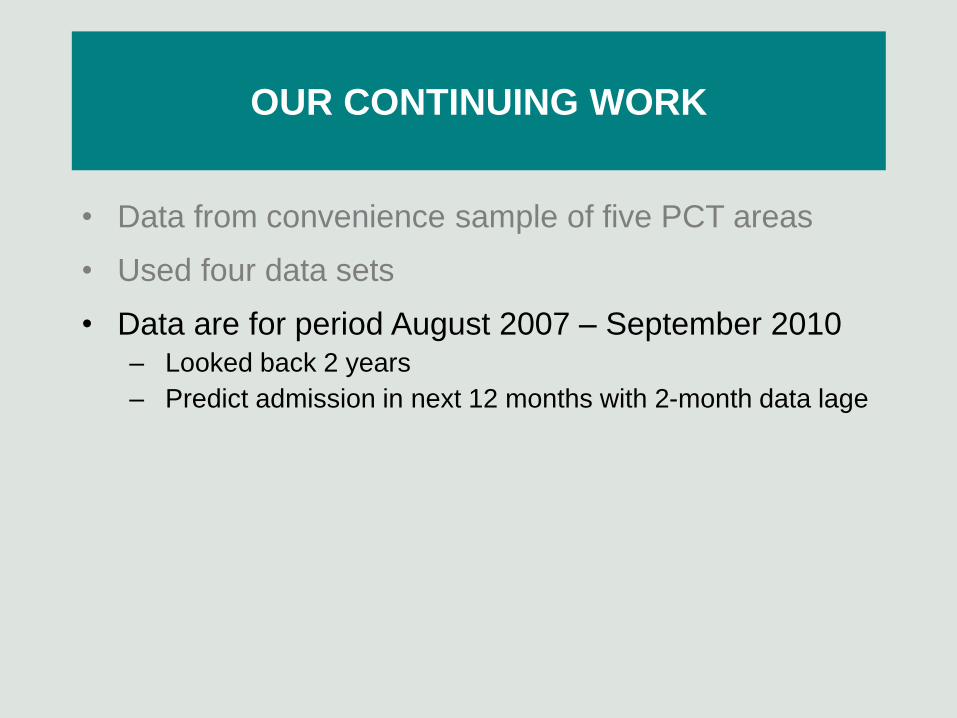
OUR CONTINUING WORK
• Data from convenience sample of five PCT areas
• Used four data sets
• Data are for period August 2007 – September 2010 ‒ Looked back 2 years
‒ Predict admission in next 12 months with 2-month data lage
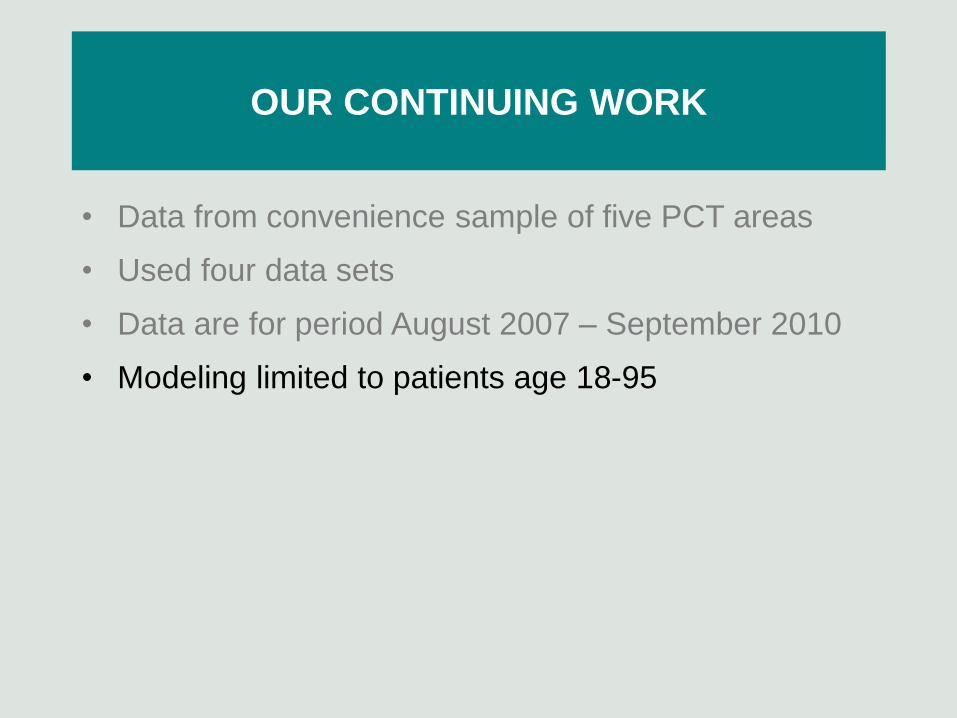
OUR CONTINUING WORK
• Data from convenience sample of five PCT areas
• Used four data sets
• Data are for period August 2007 – September 2010
• Modeling limited to patients age 18-95

WHAT TO PREDICT?
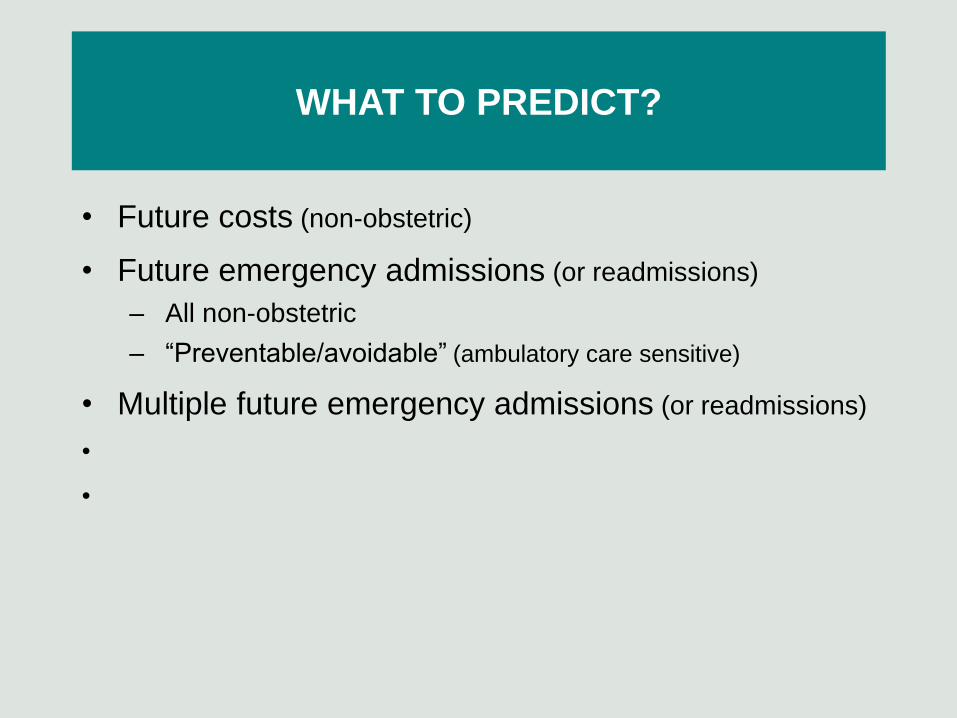
WHAT TO PREDICT?
• Future costs (non-obstetric)
• Future emergency admissions (or readmissions)
– All non-obstetric
– “Preventable/avoidable” (ambulatory care sensitive)
• Multiple future emergency admissions (or readmissions)
•
•
HOW TO ASSESS PERFORMANCE
OF THE MODEL
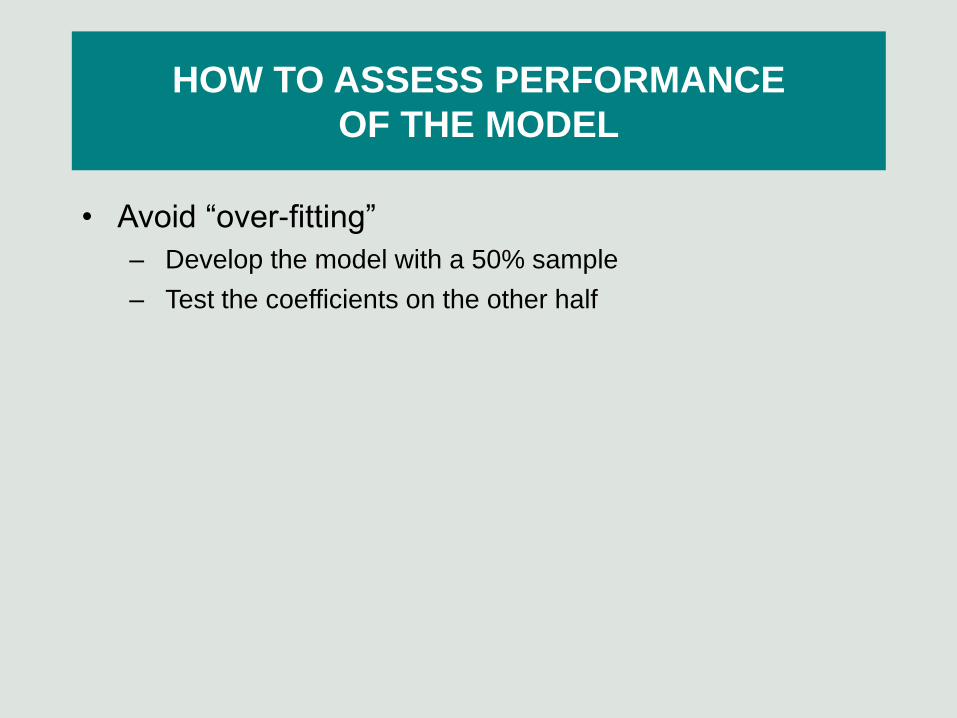
HOW TO ASSESS PERFORMANCE
OF THE MODEL
• Avoid “over-fitting”
– Develop the model with a 50% sample
– Test the coefficients on the other half
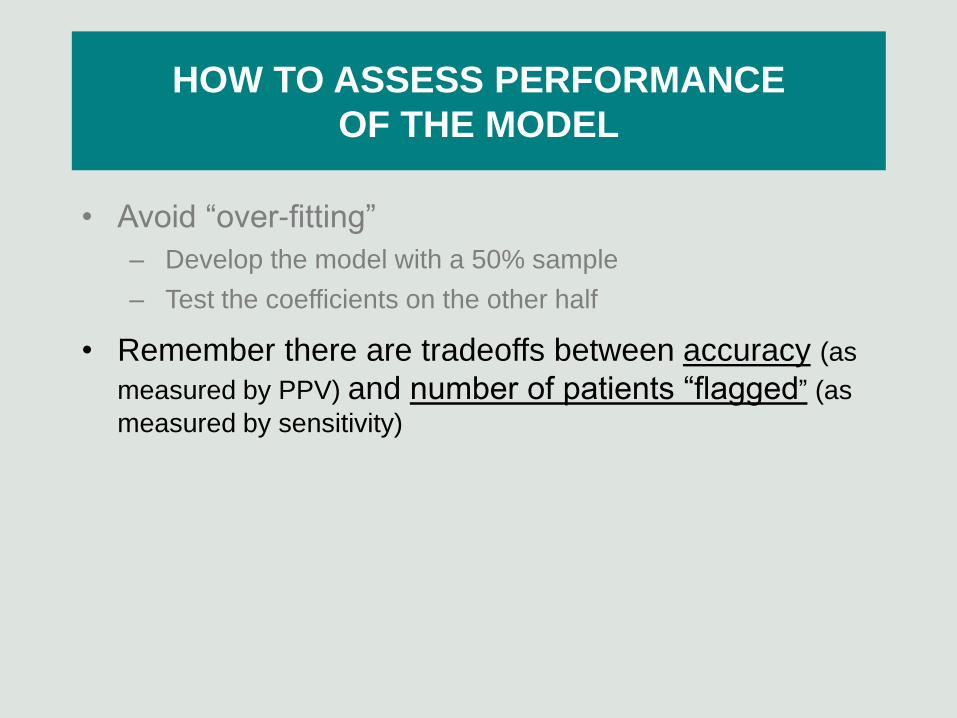
HOW TO ASSESS PERFORMANCE
OF THE MODEL
• Avoid “over-fitting”
– Develop the model with a 50% sample
– Test the coefficients on the other half
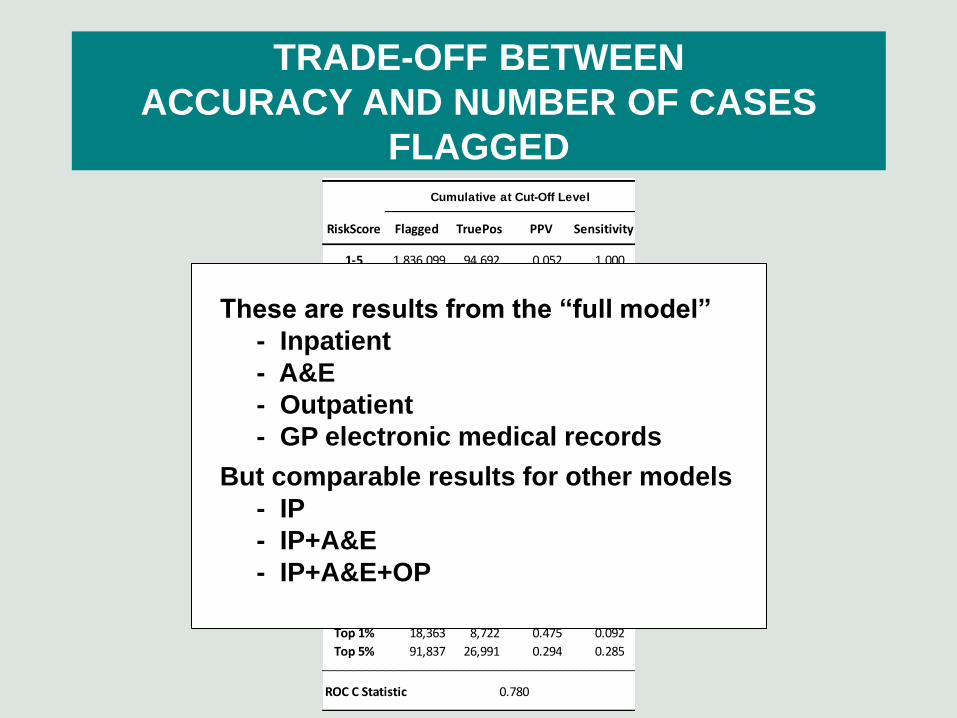
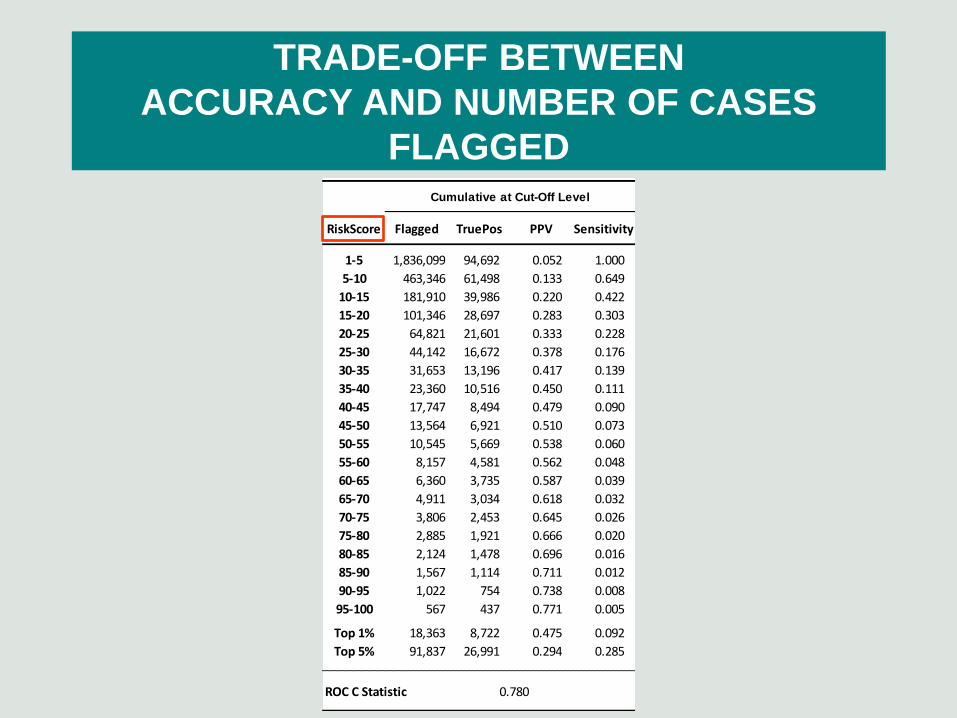
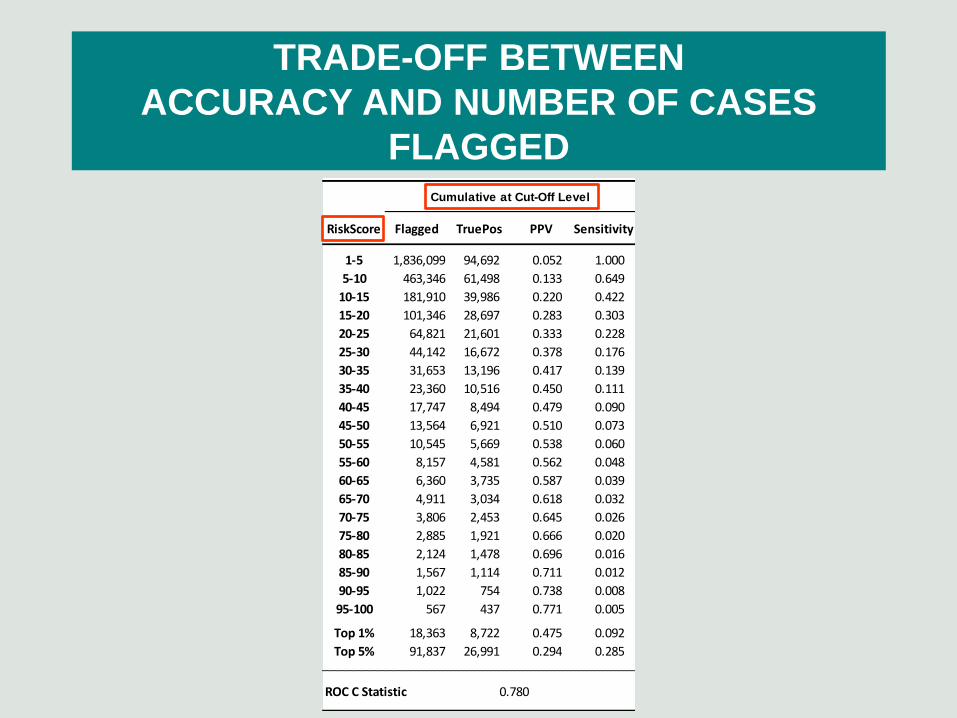
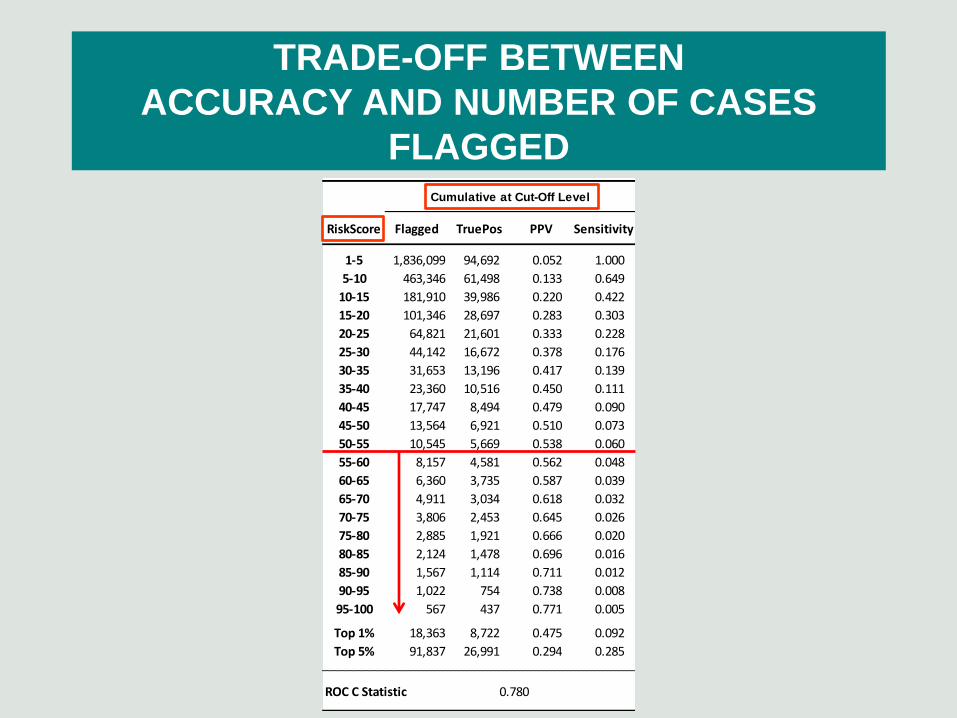
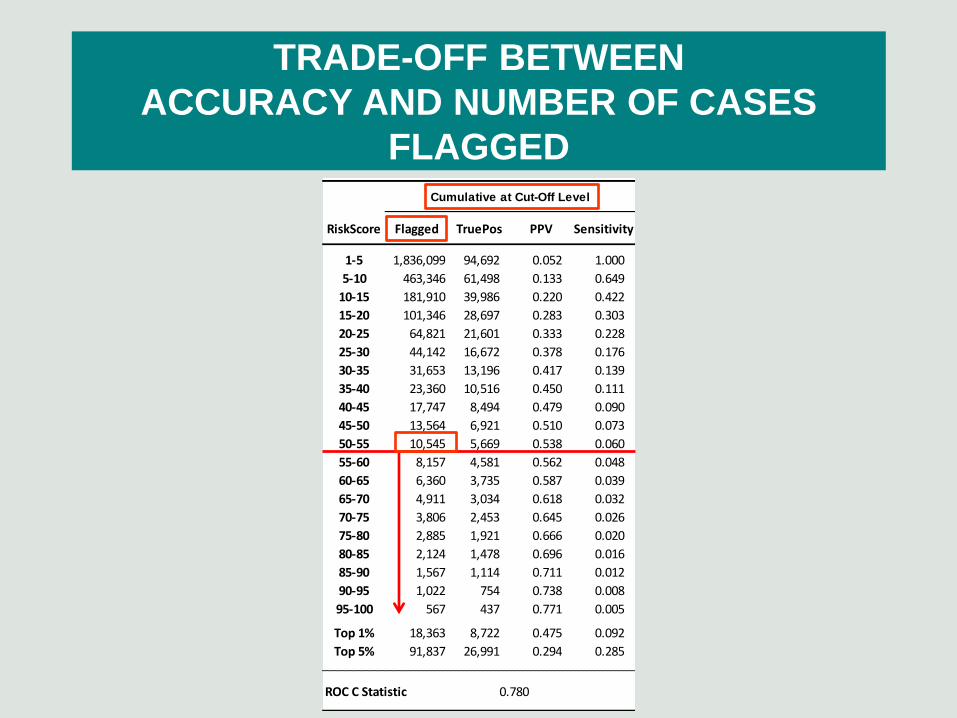
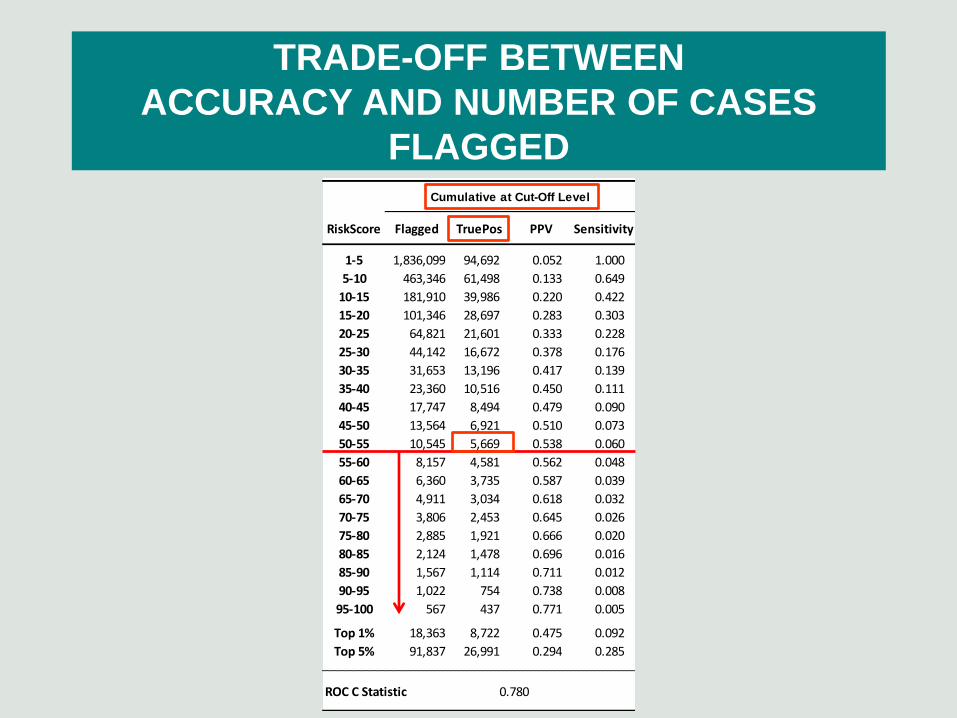
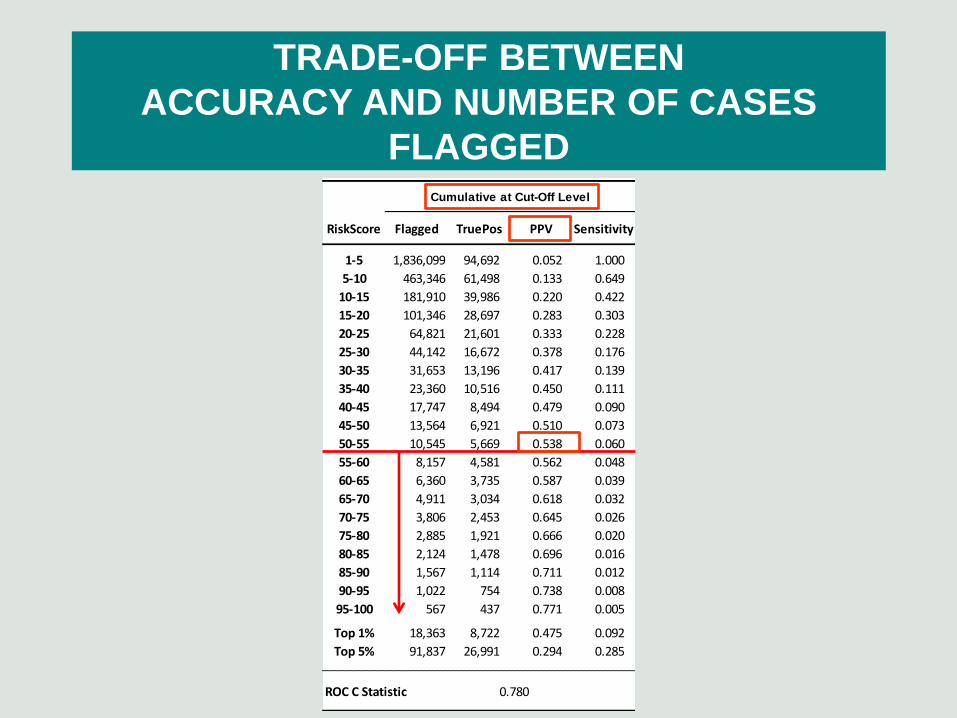
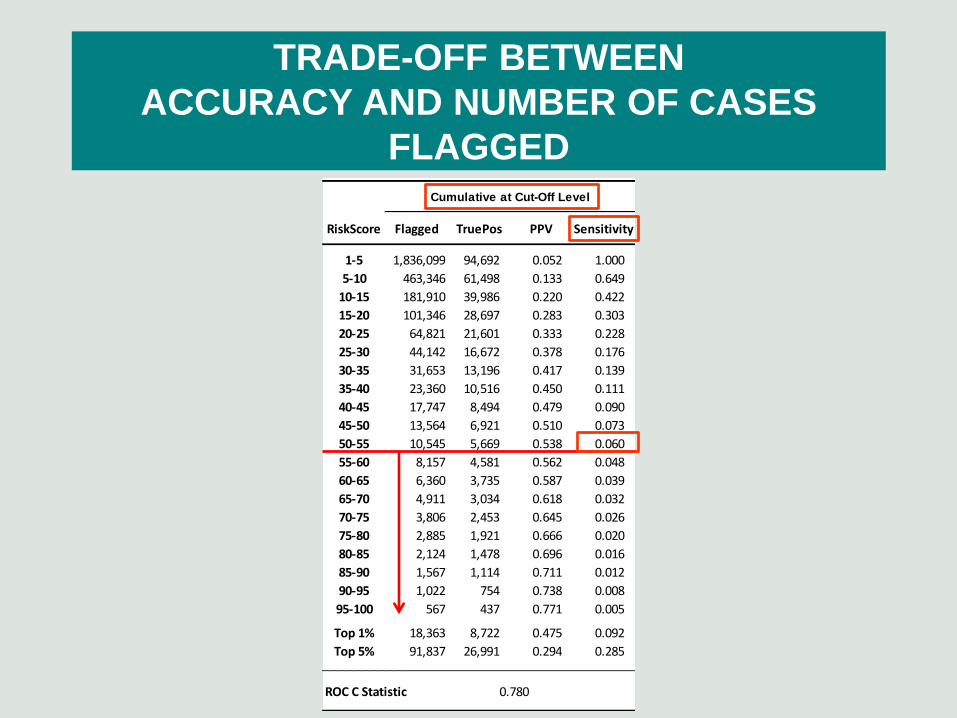
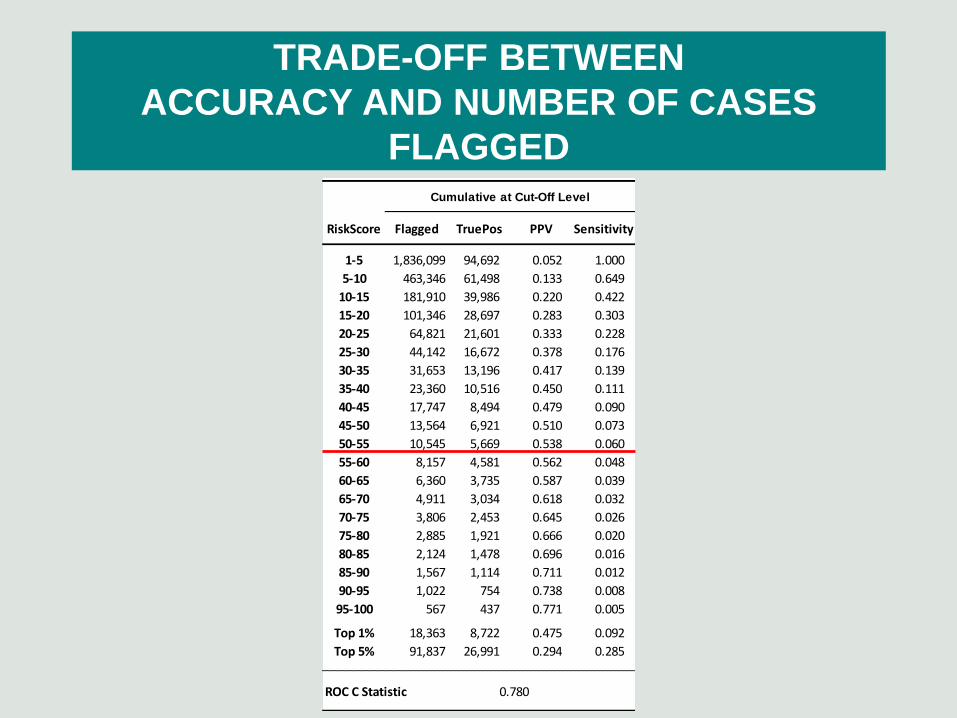
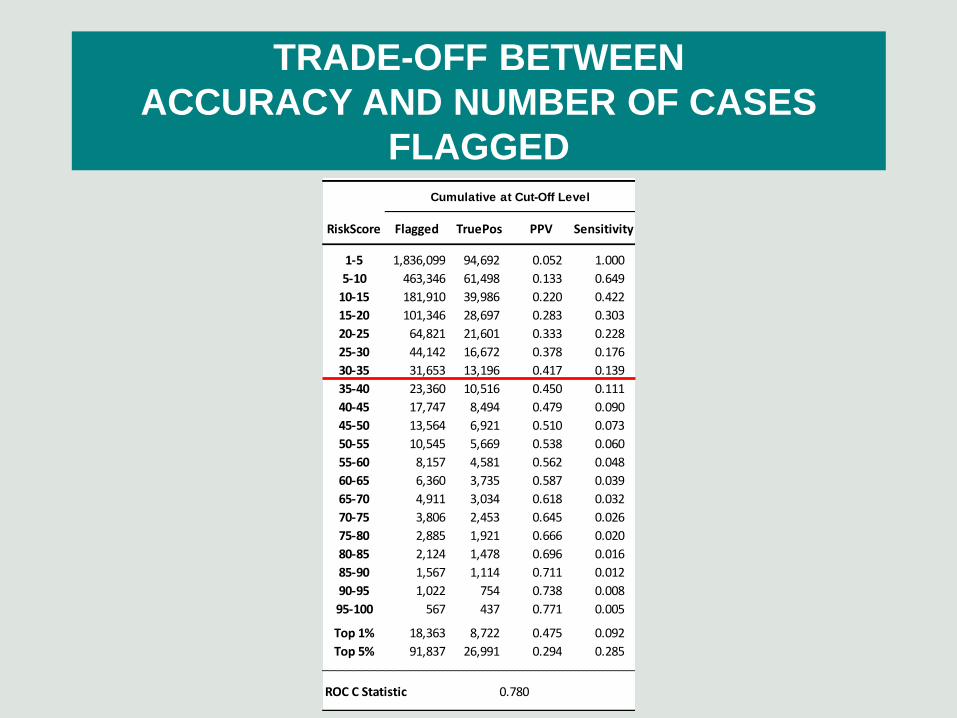
• Remember there are tradeoffs between accuracy (as
measured by PPV) and number of patients “flagged” (as
measured by sensitivity)
TRADE-OFF BETWEEN
ACCURACY AND NUMBER OF CASES
FLAGGED Cumulative at Cut-Off Level
RiskScore Flagged TruePos PPV Sensitivity
1-5 1,836,099 94,692 0.052 1.000
5-10 463,346 61,498 0.133 0.649
10-15 181,910 39,986 0.220 0.422
15-20 101,346 28,697 0.283 0.303
20-25 64,821 21,601 0.333 0.228
25-30 44,142 16,672 0.378 0.176
30-35 31,653 13,196 0.417 0.139
35-40 23,360 10,516 0.450 0.111
40-45 17,747 8,494 0.479 0.090
45-50 13,564 6,921 0.510 0.073
50-55 10,545 5,669 0.538 0.060
55-60 8,157 4,581 0.562 0.048
60-65 6,360 3,735 0.587 0.039
65-70 4,911 3,034 0.618 0.032
70-75 3,806 2,453 0.645 0.026
75-80 2,885 1,921 0.666 0.020
80-85 2,124 1,478 0.696 0.016
85-90 1,567 1,114 0.711 0.012
90-95 1,022 754 0.738 0.008
95-100 567 437 0.771 0.005
Top 1% 18,363 8,722 0.475 0.092
Top 5% 91,837 26,991 0.294 0.285
ROC C Statistic 0.780
These are results from the “full model”
- Inpatient
- A&E
- Outpatient
- GP electronic medical records
But comparable results for other models
- IP
- IP+A&E
- IP+A&E+OP
TRADE-OFF BETWEEN
ACCURACY AND NUMBER OF CASES
FLAGGED Cumulative at Cut-Off Level
RiskScore Flagged TruePos PPV Sensitivity
1-5 1,836,099 94,692 0.052 1.000
5-10 463,346 61,498 0.133 0.649
10-15 181,910 39,986 0.220 0.422
15-20 101,346 28,697 0.283 0.303
20-25 64,821 21,601 0.333 0.228
25-30 44,142 16,672 0.378 0.176
30-35 31,653 13,196 0.417 0.139
35-40 23,360 10,516 0.450 0.111
40-45 17,747 8,494 0.479 0.090
45-50 13,564 6,921 0.510 0.073
50-55 10,545 5,669 0.538 0.060
55-60 8,157 4,581 0.562 0.048
60-65 6,360 3,735 0.587 0.039
65-70 4,911 3,034 0.618 0.032
70-75 3,806 2,453 0.645 0.026
75-80 2,885 1,921 0.666 0.020
80-85 2,124 1,478 0.696 0.016
85-90 1,567 1,114 0.711 0.012
90-95 1,022 754 0.738 0.008
95-100 567 437 0.771 0.005
Top 1% 18,363 8,722 0.475 0.092
Top 5% 91,837 26,991 0.294 0.285
ROC C Statistic 0.780
HOW TO ASSESS PERFORMANCE
OF THE MODEL
• Avoid “over-fitting”
– Develop the model with a 50% sample
– Test the coefficients on the other half
• Remember there are tradeoffs between accuracy (as
measured by PPV) and number of patients “flagged” (as
measured by sensitivity)
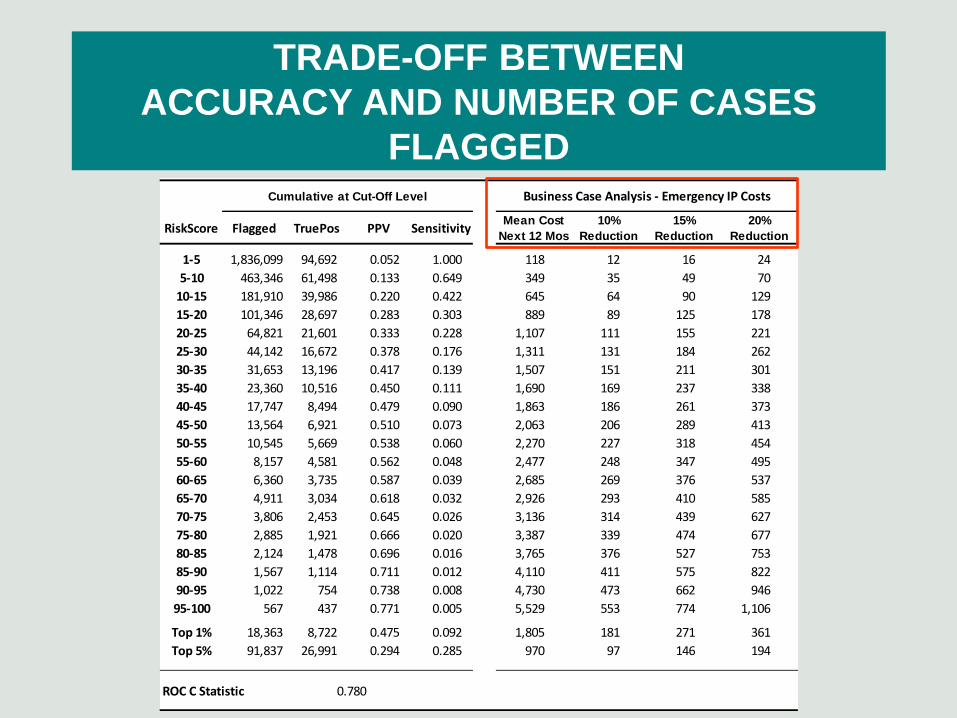
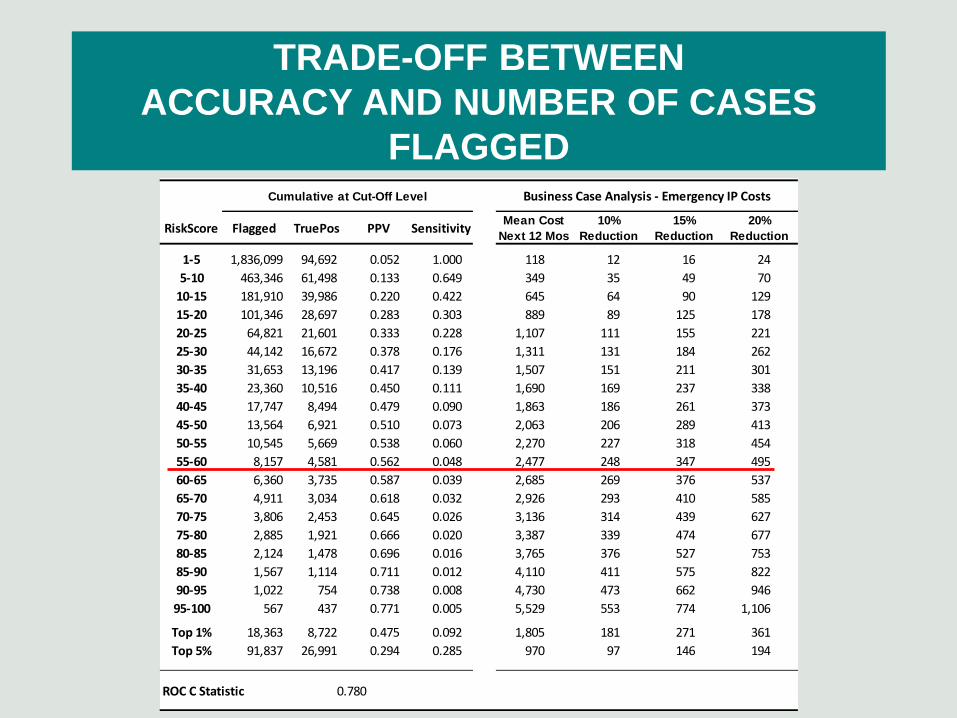
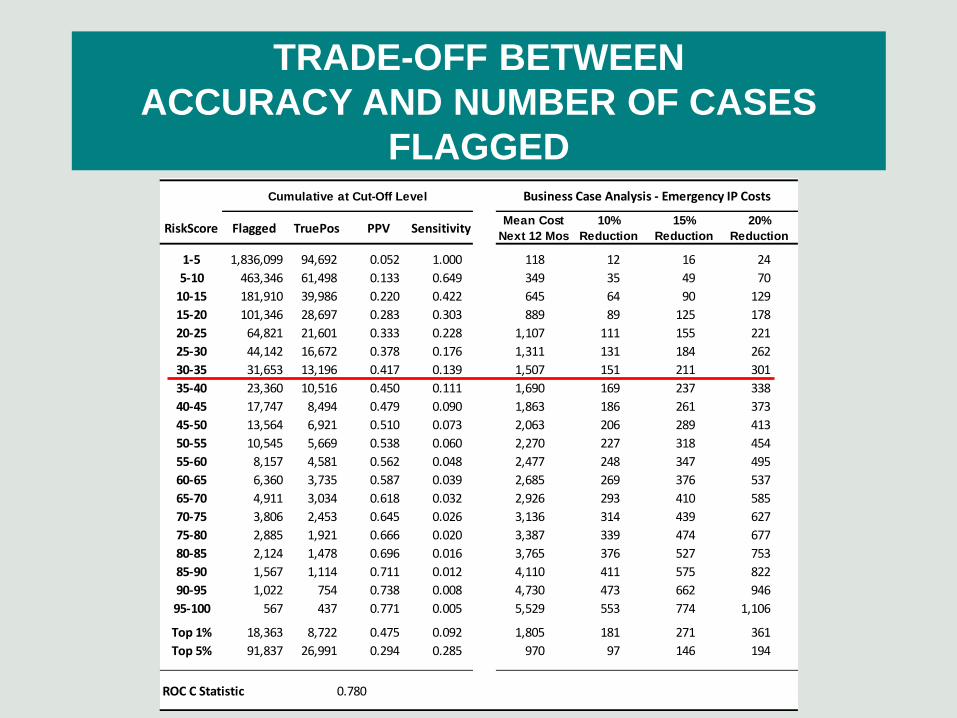
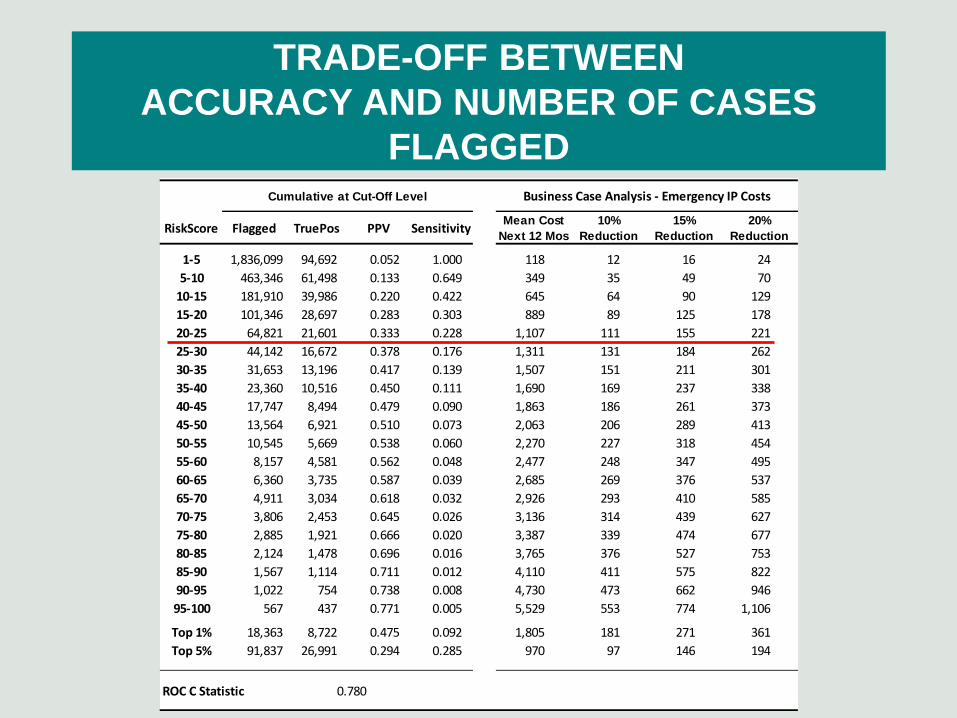
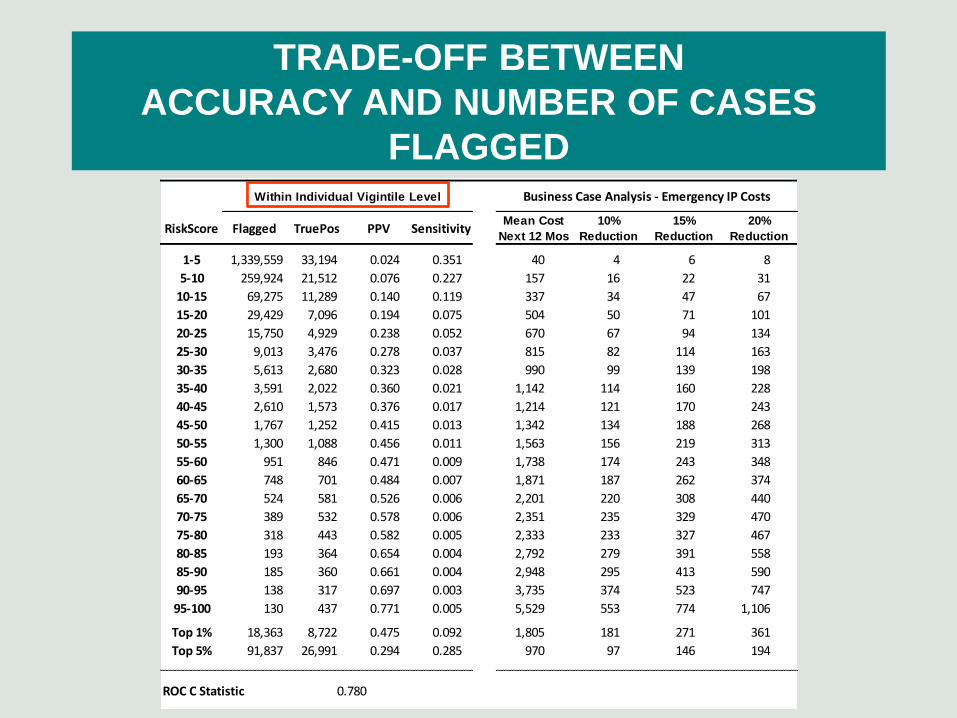
• For most users, accuracy is likely to be most important (this is not a screening test to identify some dread disease)
– From a “business case” perspective, it is important not to
target patients who will not have a future admission
TRADE-OFF BETWEEN
ACCURACY AND NUMBER OF CASES
FLAGGED Cumulative at Cut-Off Level Business Case Analysis - Emergency IP Costs
RiskScore Flagged TruePos PPV SensitivityMean Cost
Next 12 Mos
10%
Reduction
15%
Reduction
20%
Reduction
1-5 1,836,099 94,692 0.052 1.000 118 12 16 24
5-10 463,346 61,498 0.133 0.649 349 35 49 70
10-15 181,910 39,986 0.220 0.422 645 64 90 129
15-20 101,346 28,697 0.283 0.303 889 89 125 178
20-25 64,821 21,601 0.333 0.228 1,107 111 155 221
25-30 44,142 16,672 0.378 0.176 1,311 131 184 262
30-35 31,653 13,196 0.417 0.139 1,507 151 211 301
35-40 23,360 10,516 0.450 0.111 1,690 169 237 338
40-45 17,747 8,494 0.479 0.090 1,863 186 261 373
45-50 13,564 6,921 0.510 0.073 2,063 206 289 413
50-55 10,545 5,669 0.538 0.060 2,270 227 318 454
55-60 8,157 4,581 0.562 0.048 2,477 248 347 495
60-65 6,360 3,735 0.587 0.039 2,685 269 376 537
65-70 4,911 3,034 0.618 0.032 2,926 293 410 585
70-75 3,806 2,453 0.645 0.026 3,136 314 439 627
75-80 2,885 1,921 0.666 0.020 3,387 339 474 677
80-85 2,124 1,478 0.696 0.016 3,765 376 527 753
85-90 1,567 1,114 0.711 0.012 4,110 411 575 822
90-95 1,022 754 0.738 0.008 4,730 473 662 946
95-100 567 437 0.771 0.005 5,529 553 774 1,106
Top 1% 18,363 8,722 0.475 0.092 1,805 181 271 361
Top 5% 91,837 26,991 0.294 0.285 970 97 146 194
ROC C Statistic 0.780
TRADE-OFF BETWEEN
ACCURACY AND NUMBER OF CASES
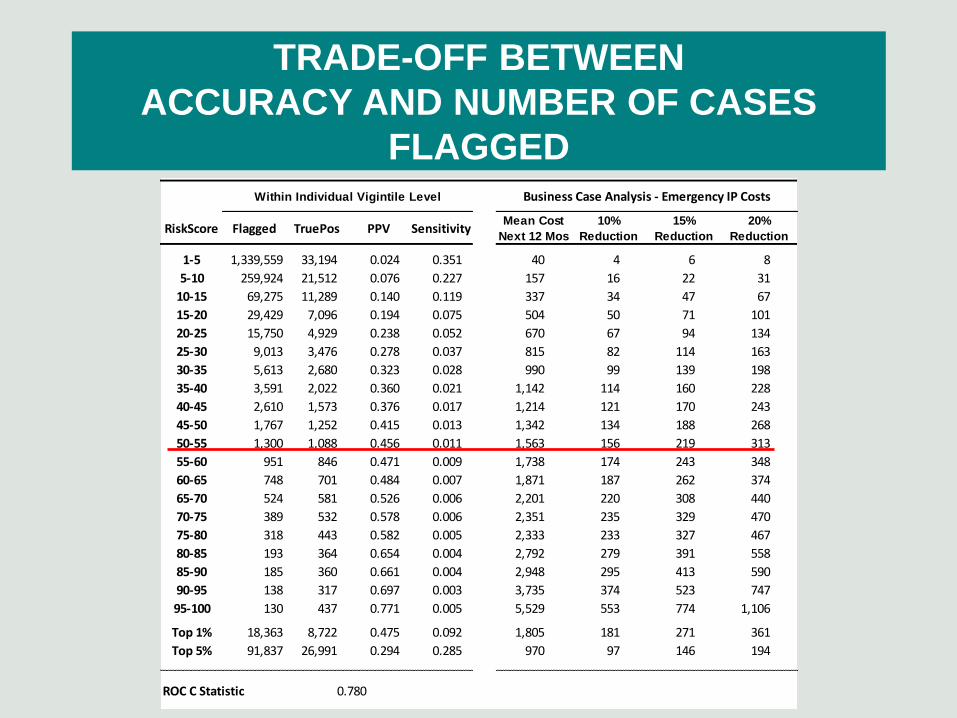
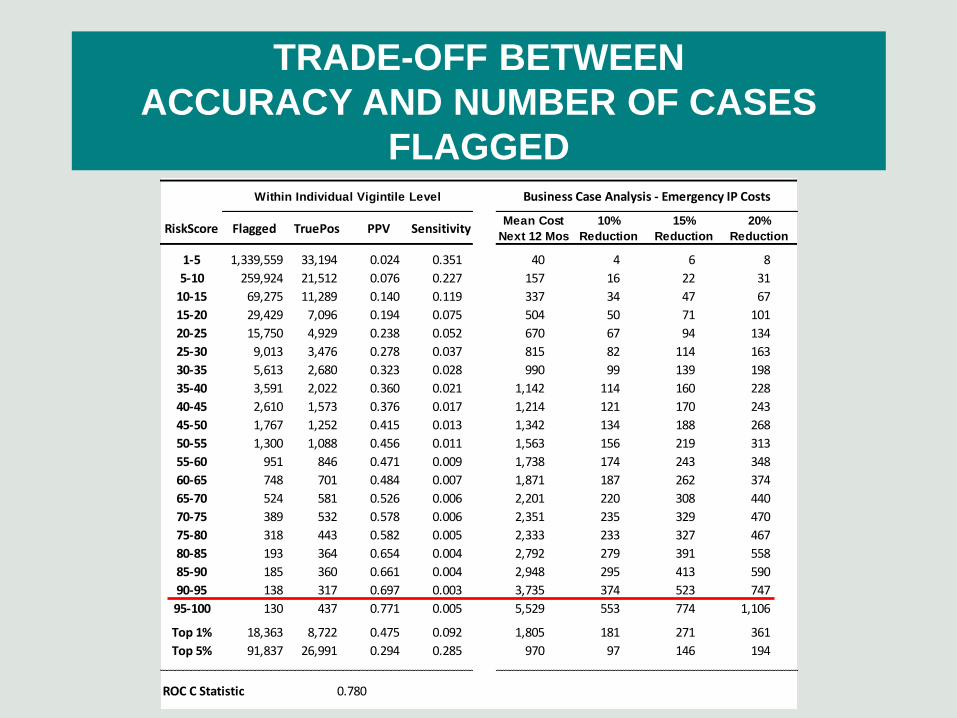
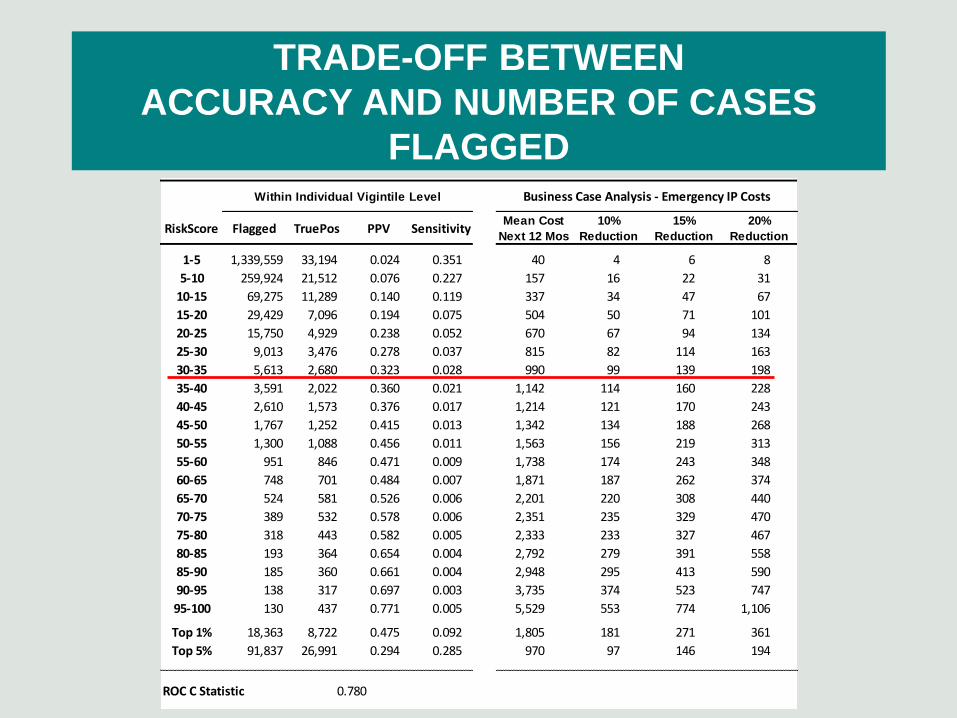
FLAGGED Within Individual Vigintile Level Business Case Analysis - Emergency IP Costs
RiskScore Flagged TruePos PPV SensitivityMean Cost
Next 12 Mos
10%
Reduction
15%
Reduction
20%
Reduction
1-5 1,339,559 33,194 0.024 0.351 40 4 6 8
5-10 259,924 21,512 0.076 0.227 157 16 22 31
10-15 69,275 11,289 0.140 0.119 337 34 47 67
15-20 29,429 7,096 0.194 0.075 504 50 71 101
20-25 15,750 4,929 0.238 0.052 670 67 94 134
25-30 9,013 3,476 0.278 0.037 815 82 114 163
30-35 5,613 2,680 0.323 0.028 990 99 139 198
35-40 3,591 2,022 0.360 0.021 1,142 114 160 228
40-45 2,610 1,573 0.376 0.017 1,214 121 170 243
45-50 1,767 1,252 0.415 0.013 1,342 134 188 268
50-55 1,300 1,088 0.456 0.011 1,563 156 219 313
55-60 951 846 0.471 0.009 1,738 174 243 348
60-65 748 701 0.484 0.007 1,871 187 262 374
65-70 524 581 0.526 0.006 2,201 220 308 440
70-75 389 532 0.578 0.006 2,351 235 329 470
75-80 318 443 0.582 0.005 2,333 233 327 467
80-85 193 364 0.654 0.004 2,792 279 391 558
85-90 185 360 0.661 0.004 2,948 295 413 590
90-95 138 317 0.697 0.003 3,735 374 523 747
95-100 130 437 0.771 0.005 5,529 553 774 1,106
Top 1% 18,363 8,722 0.475 0.092 1,805 181 271 361
Top 5% 91,837 26,991 0.294 0.285 970 97 146 194
ROC C Statistic 0.780
TRADE-OFF BETWEEN
ACCURACY AND NUMBER OF CASES
FLAGGED Within Individual Vigintile Level Business Case Analysis - Emergency IP Costs
RiskScore Flagged TruePos PPV SensitivityMean Cost
Next 12 Mos
10%
Reduction
15%
Reduction
20%
Reduction
1-5 1,339,559 33,194 0.024 0.351 40 4 6 8
5-10 259,924 21,512 0.076 0.227 157 16 22 31
10-15 69,275 11,289 0.140 0.119 337 34 47 67
15-20 29,429 7,096 0.194 0.075 504 50 71 101
20-25 15,750 4,929 0.238 0.052 670 67 94 134
25-30 9,013 3,476 0.278 0.037 815 82 114 163
30-35 5,613 2,680 0.323 0.028 990 99 139 198
35-40 3,591 2,022 0.360 0.021 1,142 114 160 228
40-45 2,610 1,573 0.376 0.017 1,214 121 170 243
45-50 1,767 1,252 0.415 0.013 1,342 134 188 268
50-55 1,300 1,088 0.456 0.011 1,563 156 219 313
55-60 951 846 0.471 0.009 1,738 174 243 348
60-65 748 701 0.484 0.007 1,871 187 262 374
65-70 524 581 0.526 0.006 2,201 220 308 440
70-75 389 532 0.578 0.006 2,351 235 329 470
75-80 318 443 0.582 0.005 2,333 233 327 467
80-85 193 364 0.654 0.004 2,792 279 391 558
85-90 185 360 0.661 0.004 2,948 295 413 590
90-95 138 317 0.697 0.003 3,735 374 523 747
95-100 130 437 0.771 0.005 5,529 553 774 1,106
Top 1% 18,363 8,722 0.475 0.092 1,805 181 271 361
Top 5% 91,837 26,991 0.294 0.285 970 97 146 194
ROC C Statistic 0.780
WHAT DATA BASES TO USE?
WHAT DATA BASES TO USE?
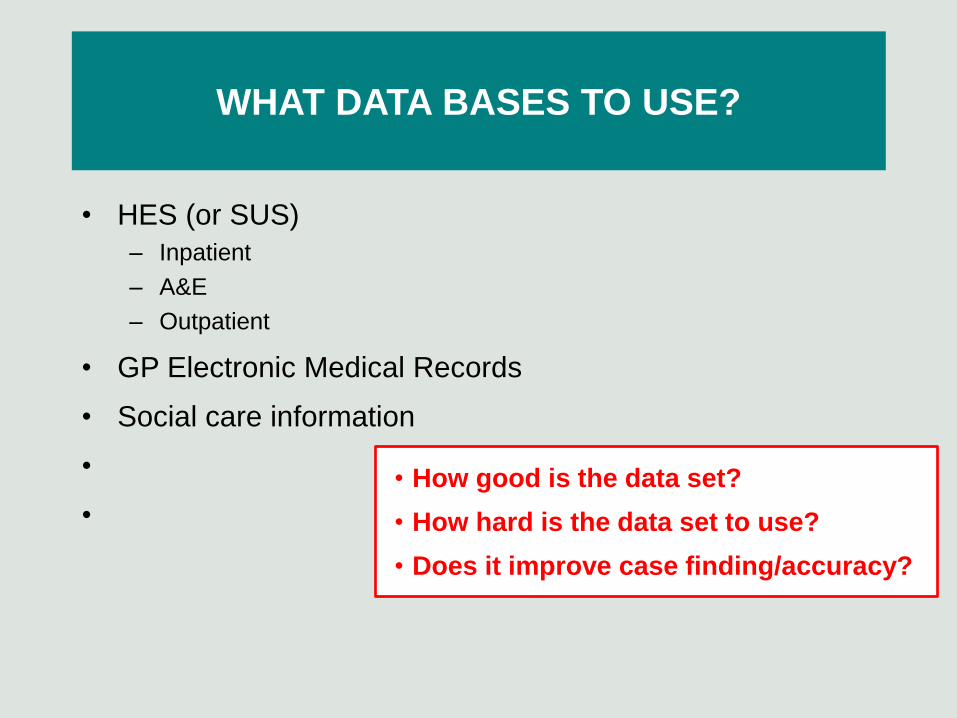
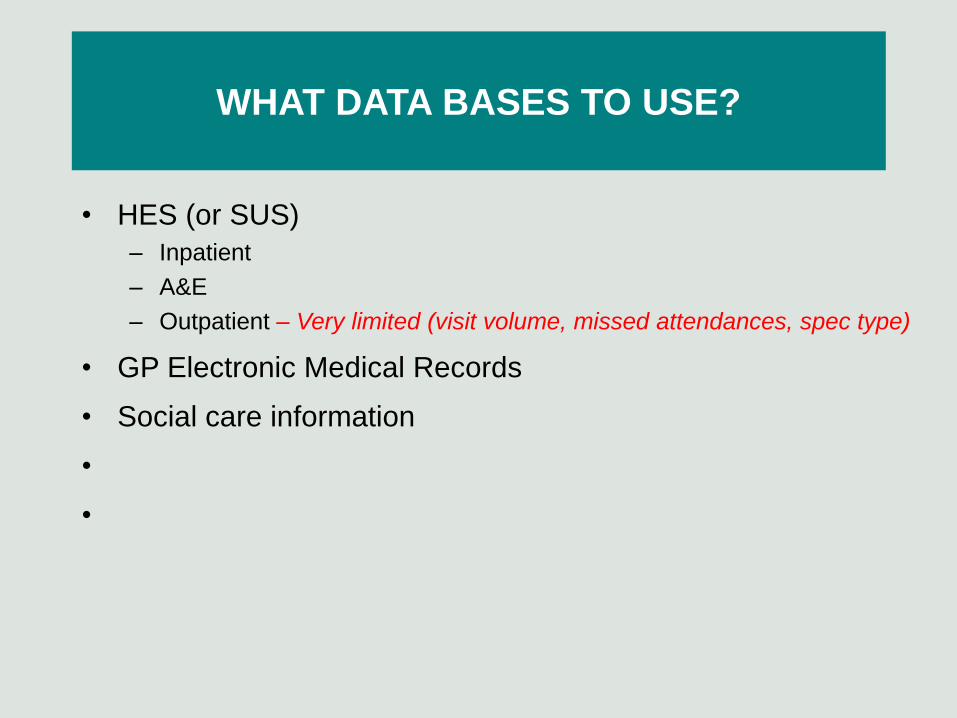
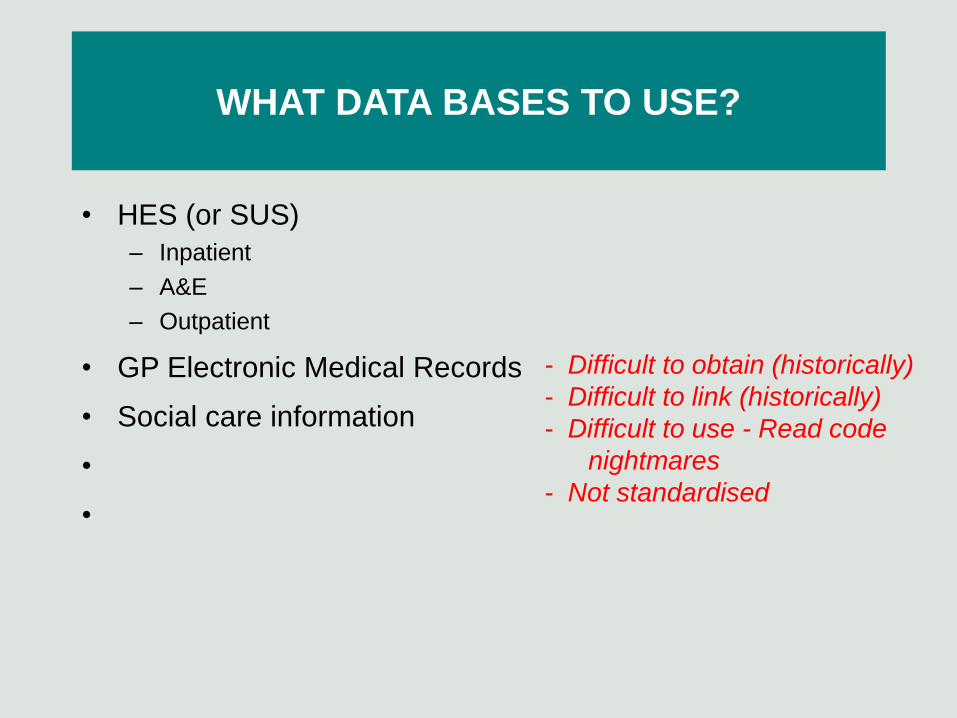
• HES (or SUS)
– Inpatient
– A&E
– Outpatient
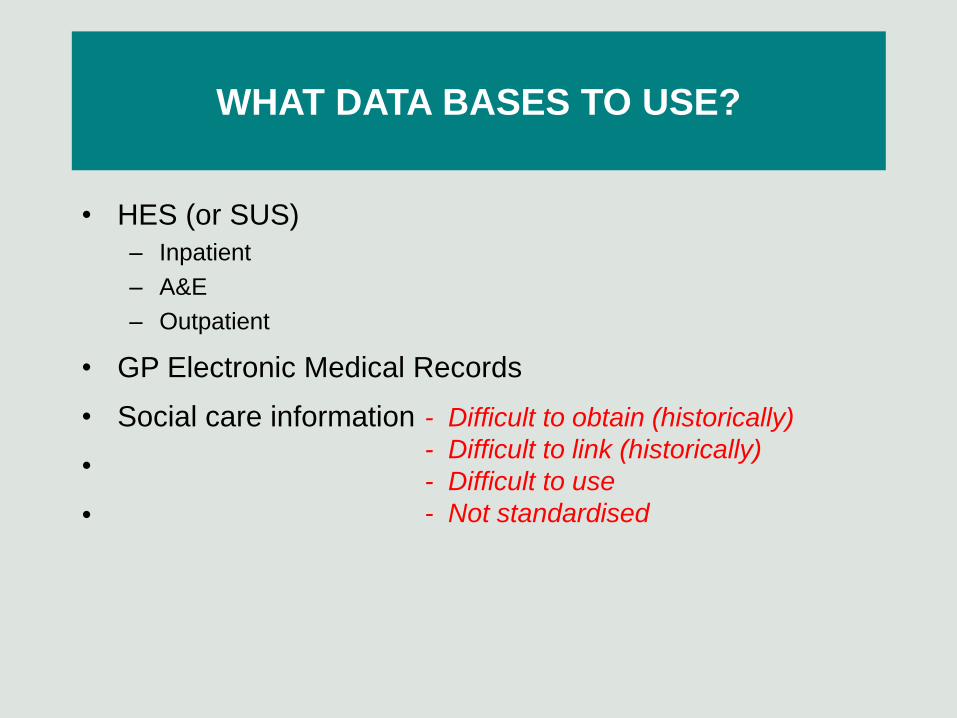
• GP Electronic Medical Records
• Social care information
•
•
• How good is the data set?
• How hard is the data set to use?
• Does it improve case finding/accuracy?
WHAT DATA BASES TO USE?
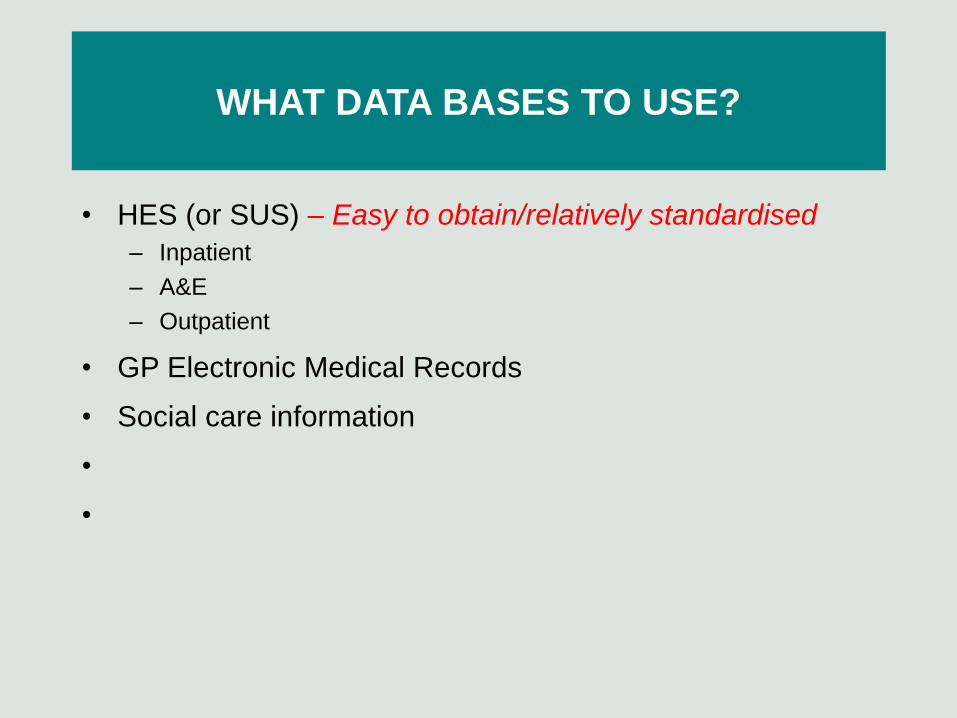
• HES (or SUS) – Easy to obtain/relatively standardised
– Inpatient
– A&E
– Outpatient
• GP Electronic Medical Records
• Social care information
•
•
WHAT DATA BASES TO USE?
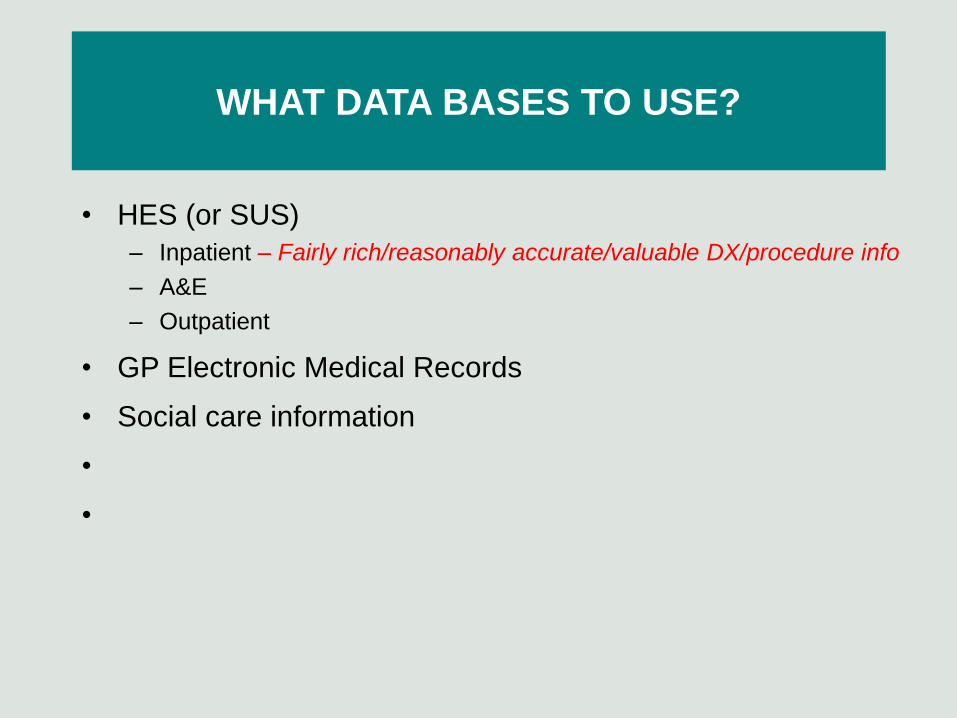
• HES (or SUS)
– Inpatient – Fairly rich/reasonably accurate/valuable DX/procedure info
– A&E
– Outpatient
• GP Electronic Medical Records
• Social care information
•
•
WHAT DATA BASES TO USE?
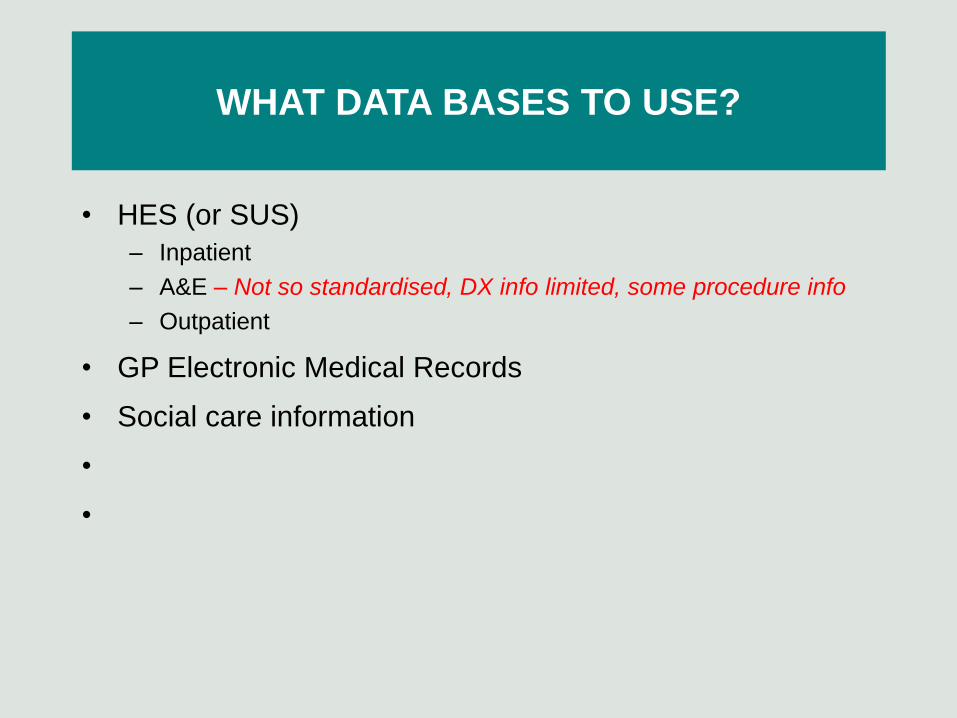
• HES (or SUS)
– Inpatient
– A&E – Not so standardised, DX info limited, some procedure info
– Outpatient
• GP Electronic Medical Records
• Social care information
•
•
WHAT DATA BASES TO USE?
• HES (or SUS)
– Inpatient
– A&E
– Outpatient – Very limited (visit volume, missed attendances, spec type)
• GP Electronic Medical Records
• Social care information
•
•
WHAT DATA BASES TO USE?
• HES (or SUS)
– Inpatient
– A&E
– Outpatient
• GP Electronic Medical Records
• Social care information
•
•
- Difficult to obtain (historically)
- Difficult to link (historically)
- Difficult to use - Read code
nightmares
- Not standardised
WHAT DATA BASES TO USE?
• HES (or SUS)
– Inpatient
– A&E
– Outpatient
• GP Electronic Medical Records
• Social care information
•
•
- Difficult to obtain (historically)
- Difficult to link (historically)
- Difficult to use
- Not standardised
WHAT DATA BASES TO USE? IMPROVING CASE FINDING/ACCURACY
WHAT DATA BASES TO USE? IMPROVING CASE FINDING/ACCURACY
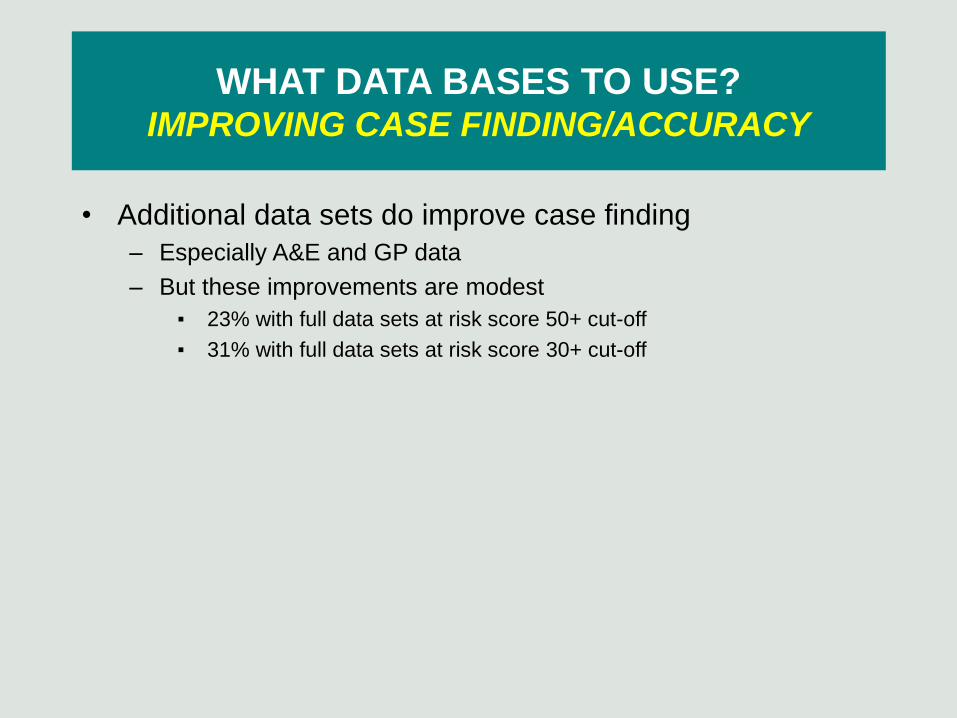
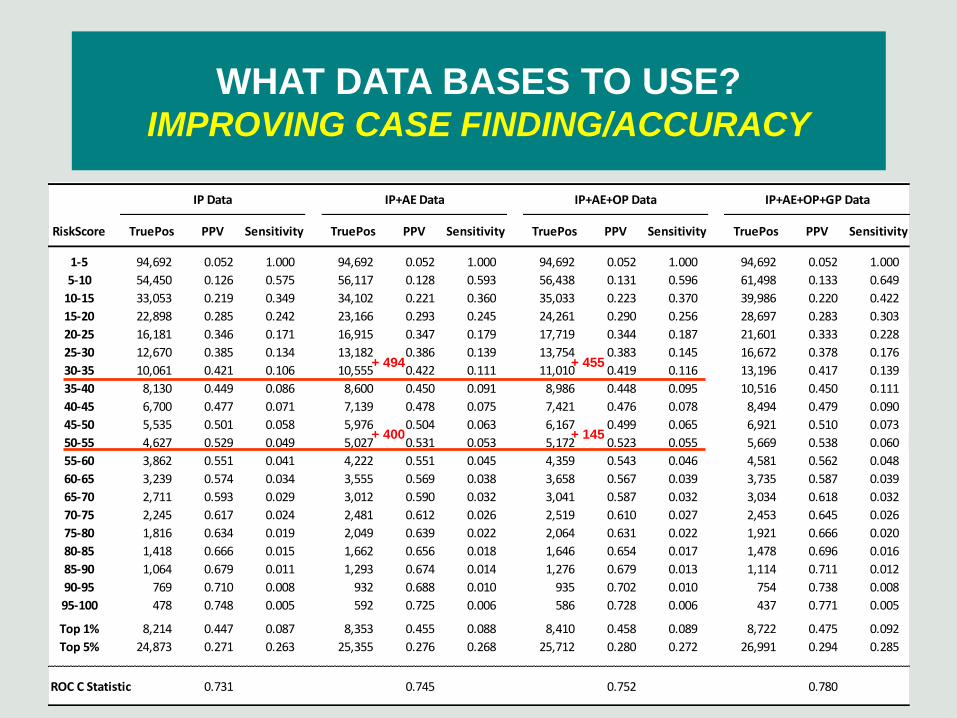
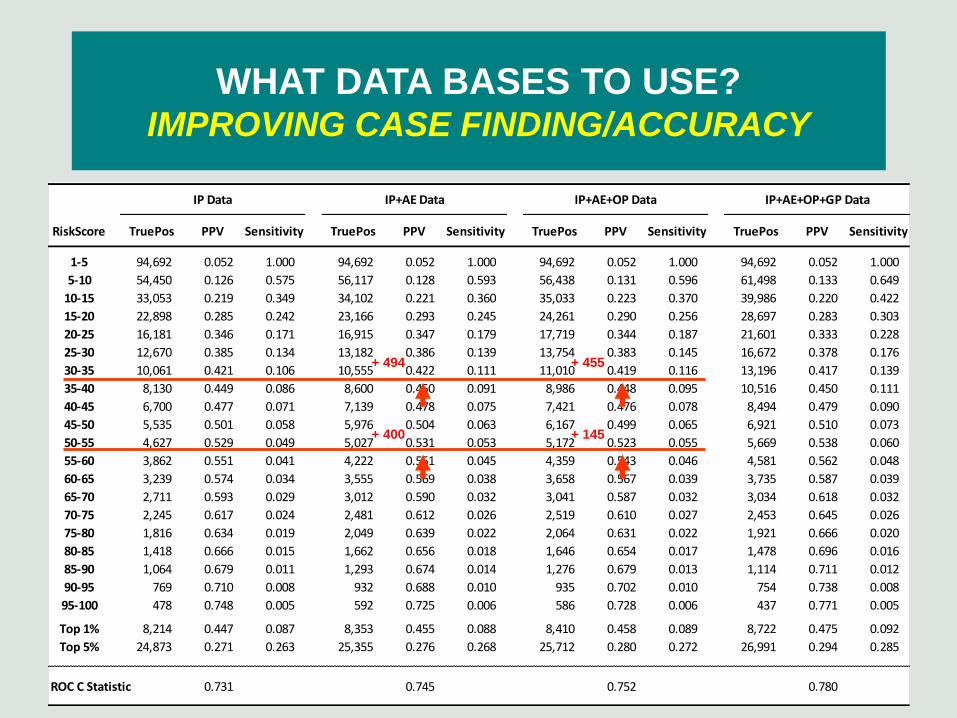
• Additional data sets do improve case finding
– Especially A&E and GP data
– But these improvements are modest
▪ 23% with full data sets at risk score 50+ cut-off
▪ 31% with full data sets at risk score 30+ cut-off
WHAT DATA BASES TO USE? IMPROVING CASE FINDING/ACCURACY
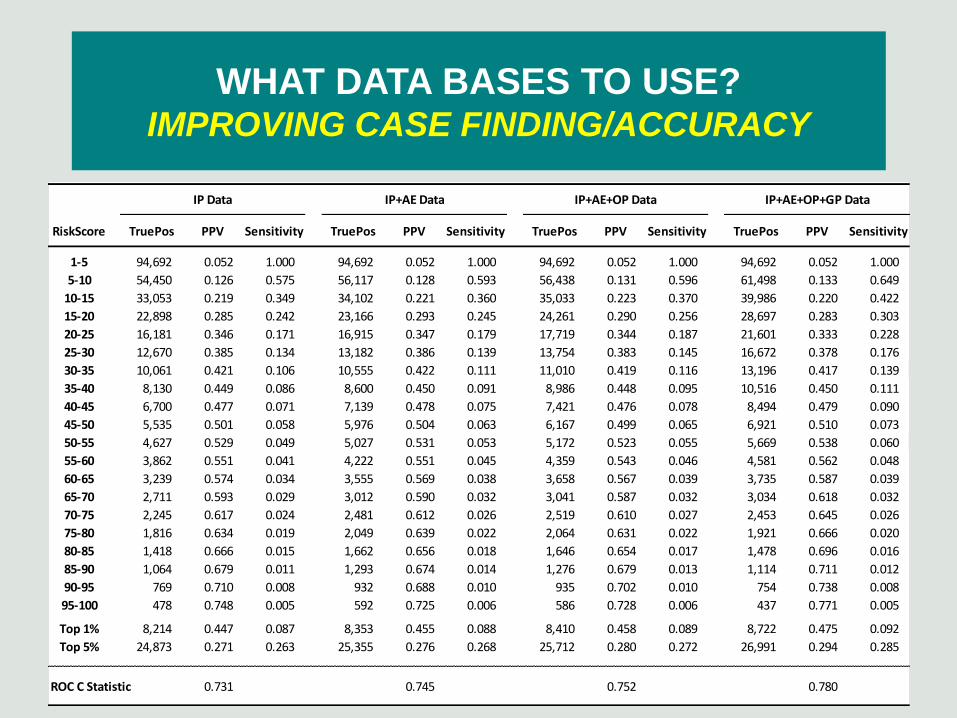
IP Data IP+AE Data IP+AE+OP Data IP+AE+OP+GP Data
RiskScore TruePos PPV Sensitivity TruePos PPV Sensitivity TruePos PPV Sensitivity TruePos PPV Sensitivity
1-5 94,692 0.052 1.000 94,692 0.052 1.000 94,692 0.052 1.000 94,692 0.052 1.000
5-10 54,450 0.126 0.575 56,117 0.128 0.593 56,438 0.131 0.596 61,498 0.133 0.649
10-15 33,053 0.219 0.349 34,102 0.221 0.360 35,033 0.223 0.370 39,986 0.220 0.422
15-20 22,898 0.285 0.242 23,166 0.293 0.245 24,261 0.290 0.256 28,697 0.283 0.303
20-25 16,181 0.346 0.171 16,915 0.347 0.179 17,719 0.344 0.187 21,601 0.333 0.228
25-30 12,670 0.385 0.134 13,182 0.386 0.139 13,754 0.383 0.145 16,672 0.378 0.176
30-35 10,061 0.421 0.106 10,555 0.422 0.111 11,010 0.419 0.116 13,196 0.417 0.139
35-40 8,130 0.449 0.086 8,600 0.450 0.091 8,986 0.448 0.095 10,516 0.450 0.111
40-45 6,700 0.477 0.071 7,139 0.478 0.075 7,421 0.476 0.078 8,494 0.479 0.090
45-50 5,535 0.501 0.058 5,976 0.504 0.063 6,167 0.499 0.065 6,921 0.510 0.073
50-55 4,627 0.529 0.049 5,027 0.531 0.053 5,172 0.523 0.055 5,669 0.538 0.060
55-60 3,862 0.551 0.041 4,222 0.551 0.045 4,359 0.543 0.046 4,581 0.562 0.048
60-65 3,239 0.574 0.034 3,555 0.569 0.038 3,658 0.567 0.039 3,735 0.587 0.039
65-70 2,711 0.593 0.029 3,012 0.590 0.032 3,041 0.587 0.032 3,034 0.618 0.032
70-75 2,245 0.617 0.024 2,481 0.612 0.026 2,519 0.610 0.027 2,453 0.645 0.026
75-80 1,816 0.634 0.019 2,049 0.639 0.022 2,064 0.631 0.022 1,921 0.666 0.020
80-85 1,418 0.666 0.015 1,662 0.656 0.018 1,646 0.654 0.017 1,478 0.696 0.016
85-90 1,064 0.679 0.011 1,293 0.674 0.014 1,276 0.679 0.013 1,114 0.711 0.012
90-95 769 0.710 0.008 932 0.688 0.010 935 0.702 0.010 754 0.738 0.008
95-100 478 0.748 0.005 592 0.725 0.006 586 0.728 0.006 437 0.771 0.005
Top 1% 8,214 0.447 0.087 8,353 0.455 0.088 8,410 0.458 0.089 8,722 0.475 0.092
Top 5% 24,873 0.271 0.263 25,355 0.276 0.268 25,712 0.280 0.272 26,991 0.294 0.285
ROC C Statistic 0.731 0.745 0.752 0.780
WHAT DATA BASES TO USE? IMPROVING CASE FINDING/ACCURACY
IP Data IP+AE Data IP+AE+OP Data IP+AE+OP+GP Data
RiskScore TruePos PPV Sensitivity TruePos PPV Sensitivity TruePos PPV Sensitivity TruePos PPV Sensitivity
1-5 94,692 0.052 1.000 94,692 0.052 1.000 94,692 0.052 1.000 94,692 0.052 1.000
5-10 54,450 0.126 0.575 56,117 0.128 0.593 56,438 0.131 0.596 61,498 0.133 0.649
10-15 33,053 0.219 0.349 34,102 0.221 0.360 35,033 0.223 0.370 39,986 0.220 0.422
15-20 22,898 0.285 0.242 23,166 0.293 0.245 24,261 0.290 0.256 28,697 0.283 0.303
20-25 16,181 0.346 0.171 16,915 0.347 0.179 17,719 0.344 0.187 21,601 0.333 0.228
25-30 12,670 0.385 0.134 13,182 0.386 0.139 13,754 0.383 0.145 16,672 0.378 0.176
30-35 10,061 0.421 0.106 10,555 0.422 0.111 11,010 0.419 0.116 13,196 0.417 0.139
35-40 8,130 0.449 0.086 8,600 0.450 0.091 8,986 0.448 0.095 10,516 0.450 0.111
40-45 6,700 0.477 0.071 7,139 0.478 0.075 7,421 0.476 0.078 8,494 0.479 0.090
45-50 5,535 0.501 0.058 5,976 0.504 0.063 6,167 0.499 0.065 6,921 0.510 0.073
50-55 4,627 0.529 0.049 5,027 0.531 0.053 5,172 0.523 0.055 5,669 0.538 0.060
55-60 3,862 0.551 0.041 4,222 0.551 0.045 4,359 0.543 0.046 4,581 0.562 0.048
60-65 3,239 0.574 0.034 3,555 0.569 0.038 3,658 0.567 0.039 3,735 0.587 0.039
65-70 2,711 0.593 0.029 3,012 0.590 0.032 3,041 0.587 0.032 3,034 0.618 0.032
70-75 2,245 0.617 0.024 2,481 0.612 0.026 2,519 0.610 0.027 2,453 0.645 0.026
75-80 1,816 0.634 0.019 2,049 0.639 0.022 2,064 0.631 0.022 1,921 0.666 0.020
80-85 1,418 0.666 0.015 1,662 0.656 0.018 1,646 0.654 0.017 1,478 0.696 0.016
85-90 1,064 0.679 0.011 1,293 0.674 0.014 1,276 0.679 0.013 1,114 0.711 0.012
90-95 769 0.710 0.008 932 0.688 0.010 935 0.702 0.010 754 0.738 0.008
95-100 478 0.748 0.005 592 0.725 0.006 586 0.728 0.006 437 0.771 0.005
Top 1% 8,214 0.447 0.087 8,353 0.455 0.088 8,410 0.458 0.089 8,722 0.475 0.092
Top 5% 24,873 0.271 0.263 25,355 0.276 0.268 25,712 0.280 0.272 26,991 0.294 0.285
ROC C Statistic 0.731 0.745 0.752 0.780
+ 494
+ 400
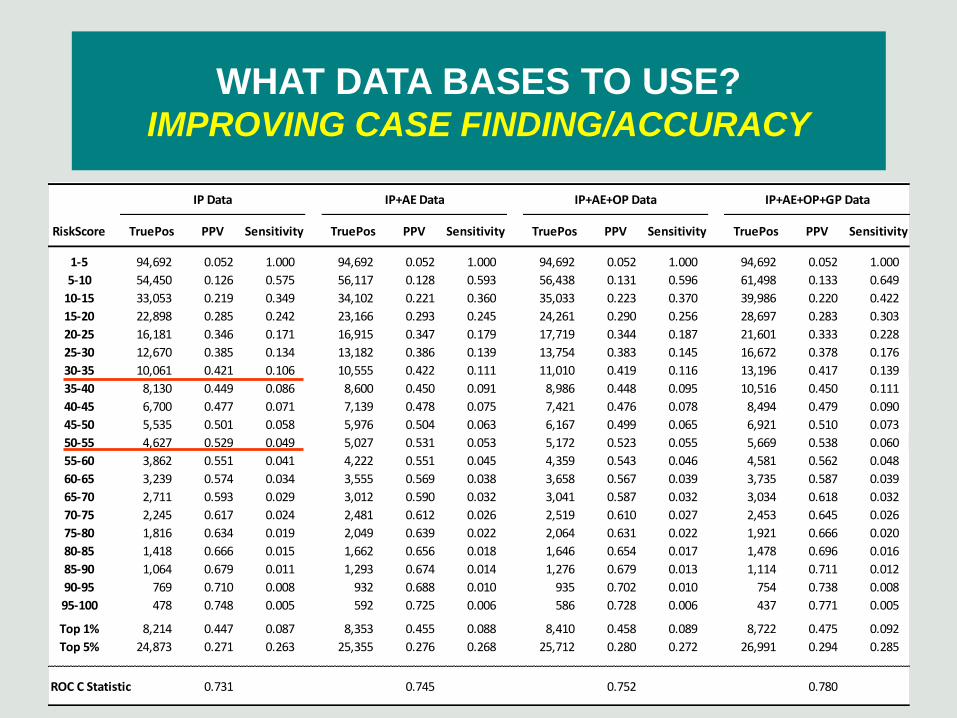
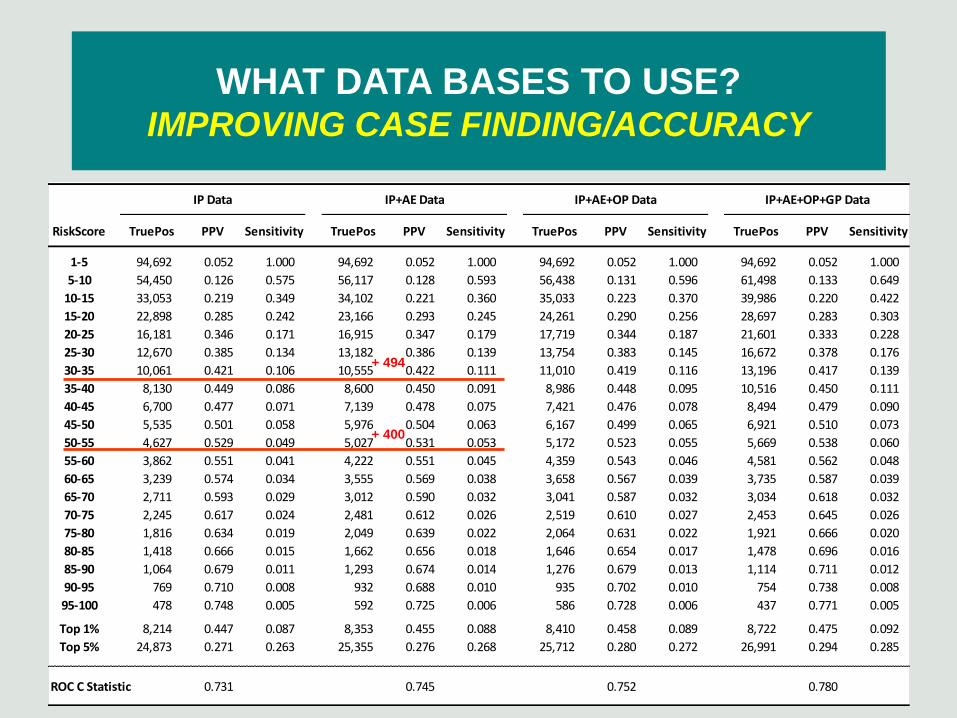
+ 455
+ 145
+ 2186
+ 497
WHAT DATA BASES TO USE? IMPROVING CASE FINDING/ACCURACY
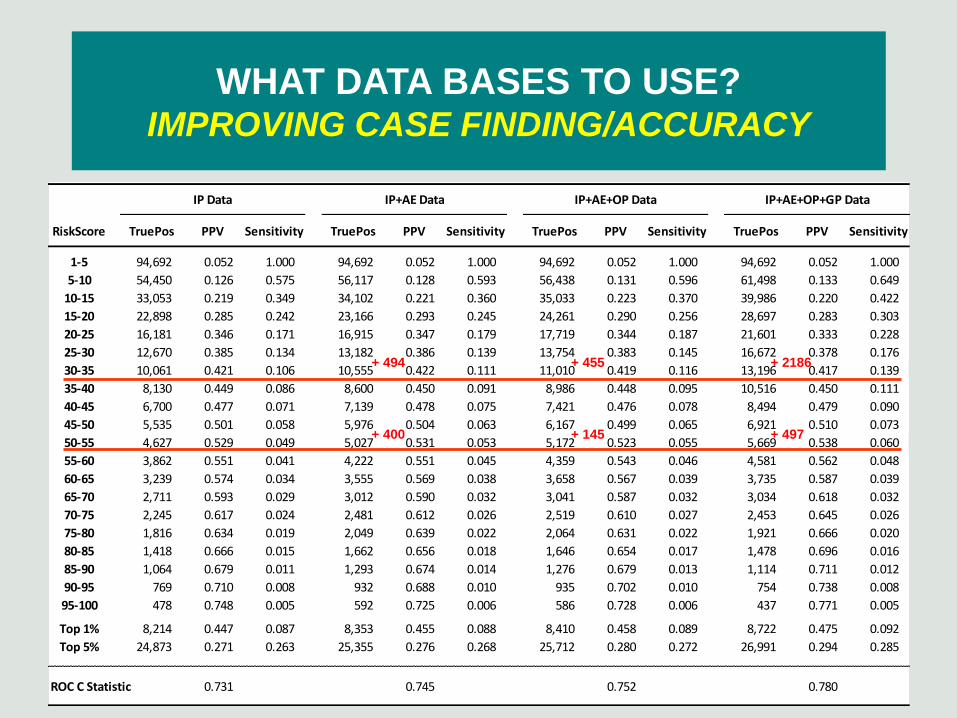
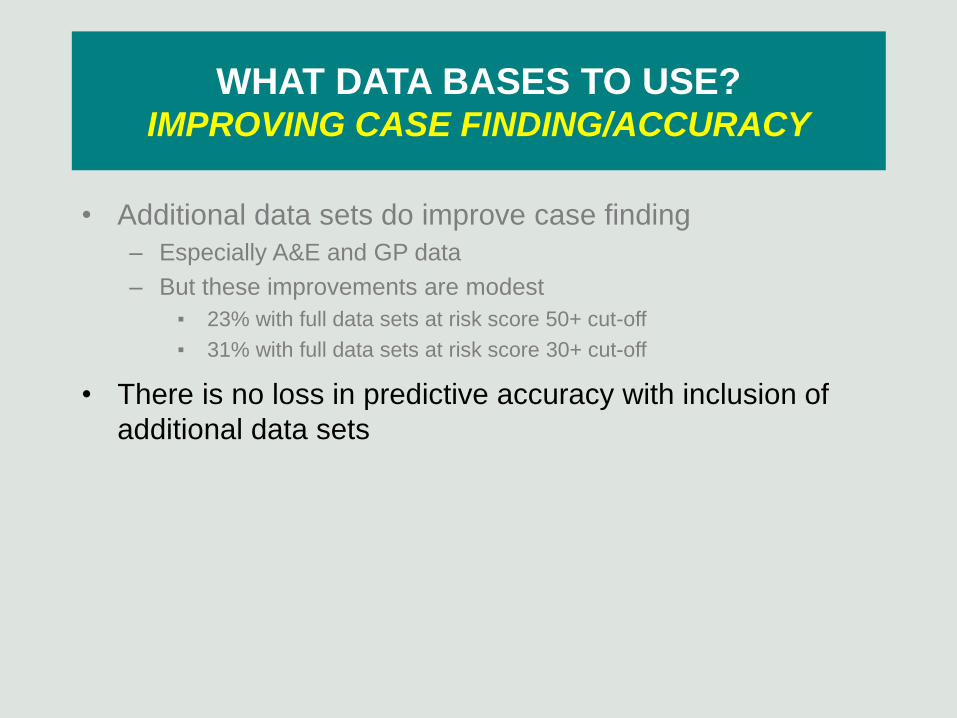
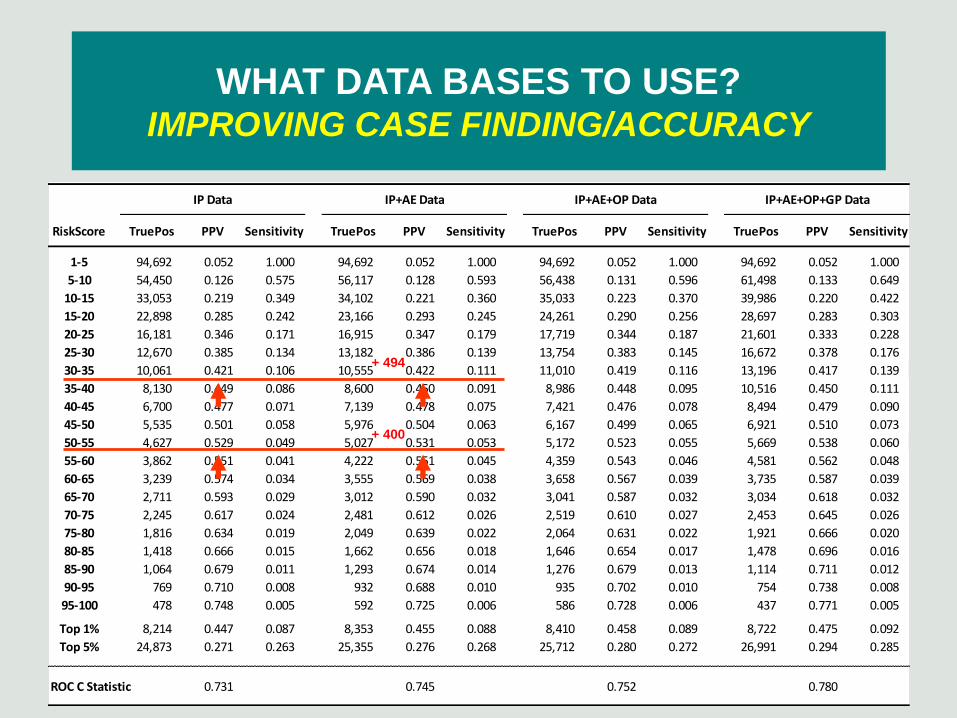
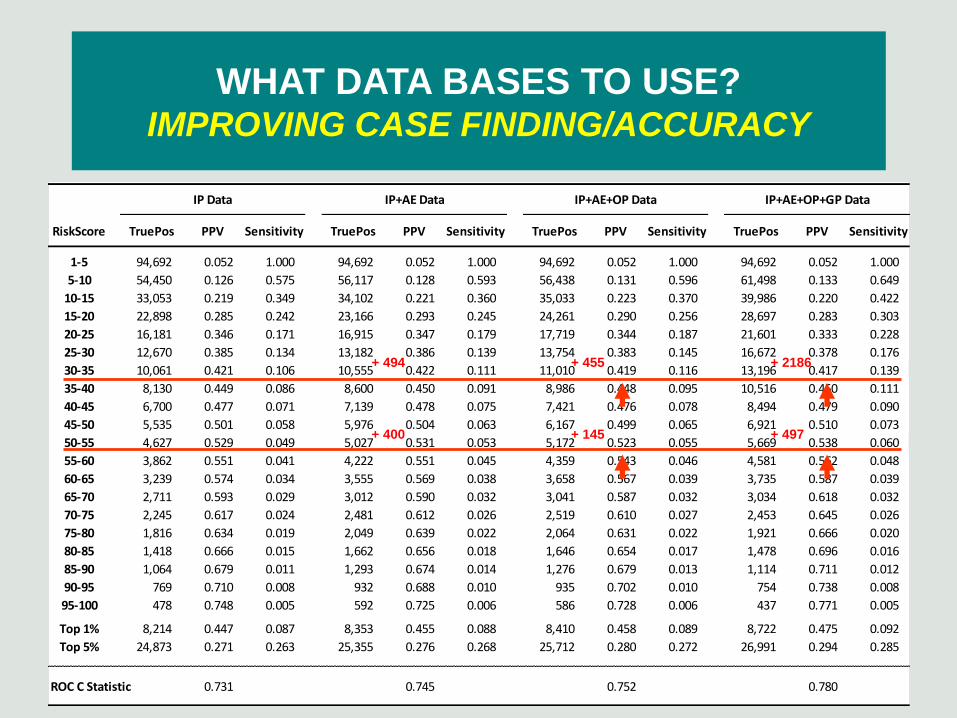
• Additional data sets do improve case finding
– Especially A&E and GP data
– But these improvements are modest
▪ 23% with full data sets at risk score 50+ cut-off
▪ 31% with full data sets at risk score 30+ cut-off
• There is no loss in predictive accuracy with inclusion of
additional data sets
WHAT DATA BASES TO USE? IMPROVING CASE FINDING/ACCURACY
IP Data IP+AE Data IP+AE+OP Data IP+AE+OP+GP Data
RiskScore TruePos PPV Sensitivity TruePos PPV Sensitivity TruePos PPV Sensitivity TruePos PPV Sensitivity
1-5 94,692 0.052 1.000 94,692 0.052 1.000 94,692 0.052 1.000 94,692 0.052 1.000
5-10 54,450 0.126 0.575 56,117 0.128 0.593 56,438 0.131 0.596 61,498 0.133 0.649
10-15 33,053 0.219 0.349 34,102 0.221 0.360 35,033 0.223 0.370 39,986 0.220 0.422
15-20 22,898 0.285 0.242 23,166 0.293 0.245 24,261 0.290 0.256 28,697 0.283 0.303
20-25 16,181 0.346 0.171 16,915 0.347 0.179 17,719 0.344 0.187 21,601 0.333 0.228
25-30 12,670 0.385 0.134 13,182 0.386 0.139 13,754 0.383 0.145 16,672 0.378 0.176
30-35 10,061 0.421 0.106 10,555 0.422 0.111 11,010 0.419 0.116 13,196 0.417 0.139
35-40 8,130 0.449 0.086 8,600 0.450 0.091 8,986 0.448 0.095 10,516 0.450 0.111
40-45 6,700 0.477 0.071 7,139 0.478 0.075 7,421 0.476 0.078 8,494 0.479 0.090
45-50 5,535 0.501 0.058 5,976 0.504 0.063 6,167 0.499 0.065 6,921 0.510 0.073
50-55 4,627 0.529 0.049 5,027 0.531 0.053 5,172 0.523 0.055 5,669 0.538 0.060
55-60 3,862 0.551 0.041 4,222 0.551 0.045 4,359 0.543 0.046 4,581 0.562 0.048
60-65 3,239 0.574 0.034 3,555 0.569 0.038 3,658 0.567 0.039 3,735 0.587 0.039
65-70 2,711 0.593 0.029 3,012 0.590 0.032 3,041 0.587 0.032 3,034 0.618 0.032
70-75 2,245 0.617 0.024 2,481 0.612 0.026 2,519 0.610 0.027 2,453 0.645 0.026
75-80 1,816 0.634 0.019 2,049 0.639 0.022 2,064 0.631 0.022 1,921 0.666 0.020
80-85 1,418 0.666 0.015 1,662 0.656 0.018 1,646 0.654 0.017 1,478 0.696 0.016
85-90 1,064 0.679 0.011 1,293 0.674 0.014 1,276 0.679 0.013 1,114 0.711 0.012
90-95 769 0.710 0.008 932 0.688 0.010 935 0.702 0.010 754 0.738 0.008
95-100 478 0.748 0.005 592 0.725 0.006 586 0.728 0.006 437 0.771 0.005
Top 1% 8,214 0.447 0.087 8,353 0.455 0.088 8,410 0.458 0.089 8,722 0.475 0.092
Top 5% 24,873 0.271 0.263 25,355 0.276 0.268 25,712 0.280 0.272 26,991 0.294 0.285
ROC C Statistic 0.731 0.745 0.752 0.780
+ 494
+ 400
+ 455
+ 145
+ 2186
+ 497
WHAT DATA BASES TO USE? IMPROVING CASE FINDING/ACCURACY
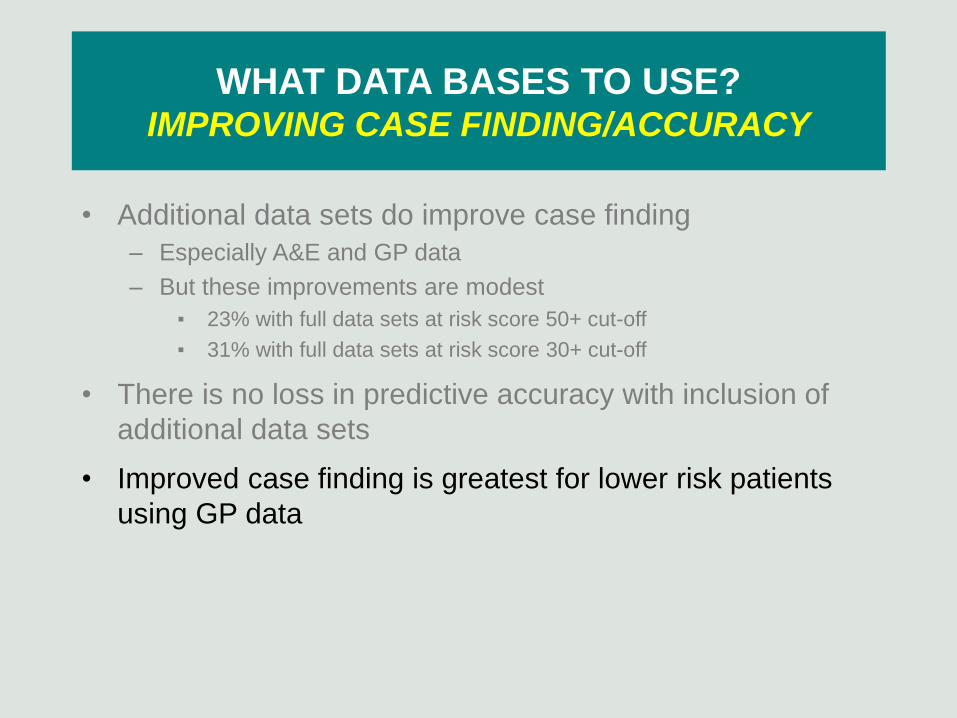
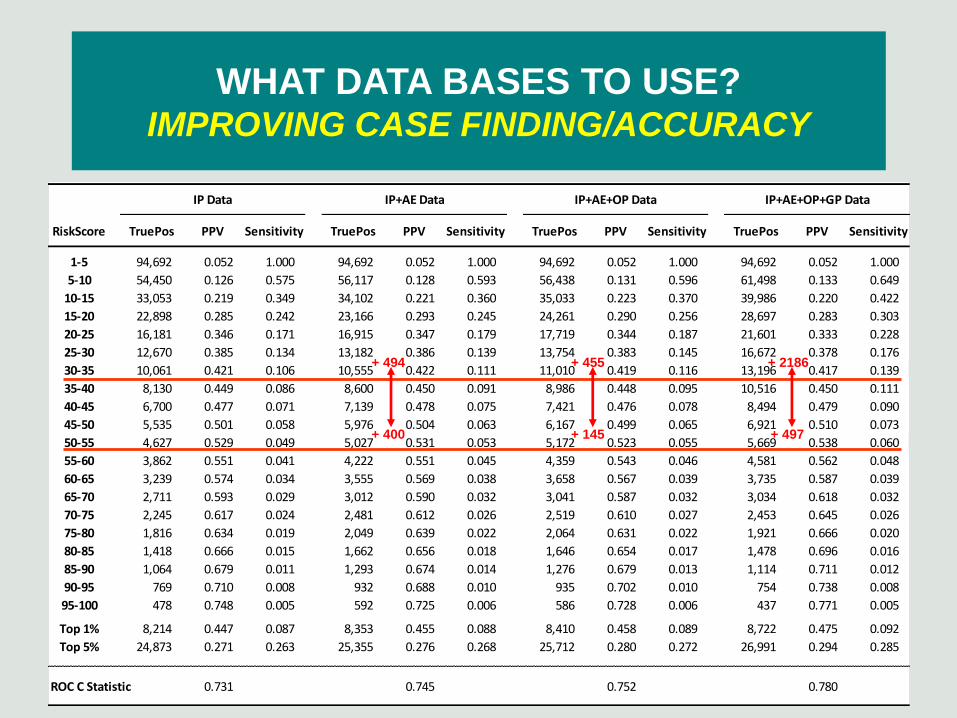
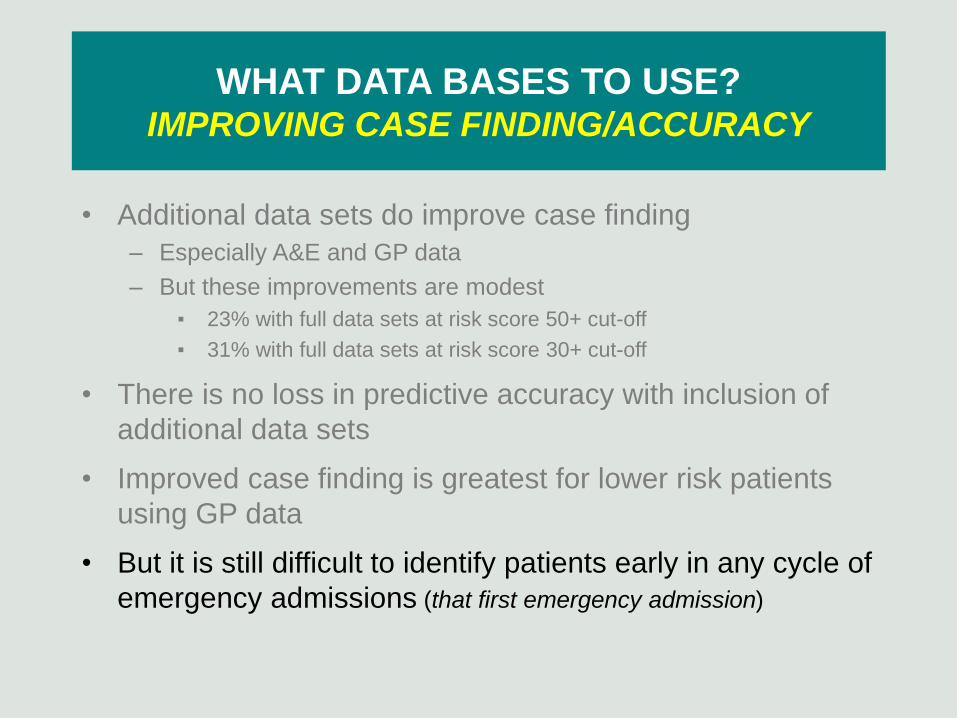
• Additional data sets do improve case finding
– Especially A&E and GP data
– But these improvements are modest
▪ 23% with full data sets at risk score 50+ cut-off
▪ 31% with full data sets at risk score 30+ cut-off
• There is no loss in predictive accuracy with inclusion of
additional data sets
• Improved case finding is greatest for lower risk patients
using GP data
WHAT DATA BASES TO USE? IMPROVING CASE FINDING/ACCURACY
IP Data IP+AE Data IP+AE+OP Data IP+AE+OP+GP Data
RiskScore TruePos PPV Sensitivity TruePos PPV Sensitivity TruePos PPV Sensitivity TruePos PPV Sensitivity
1-5 94,692 0.052 1.000 94,692 0.052 1.000 94,692 0.052 1.000 94,692 0.052 1.000
5-10 54,450 0.126 0.575 56,117 0.128 0.593 56,438 0.131 0.596 61,498 0.133 0.649
10-15 33,053 0.219 0.349 34,102 0.221 0.360 35,033 0.223 0.370 39,986 0.220 0.422
15-20 22,898 0.285 0.242 23,166 0.293 0.245 24,261 0.290 0.256 28,697 0.283 0.303
20-25 16,181 0.346 0.171 16,915 0.347 0.179 17,719 0.344 0.187 21,601 0.333 0.228
25-30 12,670 0.385 0.134 13,182 0.386 0.139 13,754 0.383 0.145 16,672 0.378 0.176
30-35 10,061 0.421 0.106 10,555 0.422 0.111 11,010 0.419 0.116 13,196 0.417 0.139
35-40 8,130 0.449 0.086 8,600 0.450 0.091 8,986 0.448 0.095 10,516 0.450 0.111
40-45 6,700 0.477 0.071 7,139 0.478 0.075 7,421 0.476 0.078 8,494 0.479 0.090
45-50 5,535 0.501 0.058 5,976 0.504 0.063 6,167 0.499 0.065 6,921 0.510 0.073
50-55 4,627 0.529 0.049 5,027 0.531 0.053 5,172 0.523 0.055 5,669 0.538 0.060
55-60 3,862 0.551 0.041 4,222 0.551 0.045 4,359 0.543 0.046 4,581 0.562 0.048
60-65 3,239 0.574 0.034 3,555 0.569 0.038 3,658 0.567 0.039 3,735 0.587 0.039
65-70 2,711 0.593 0.029 3,012 0.590 0.032 3,041 0.587 0.032 3,034 0.618 0.032
70-75 2,245 0.617 0.024 2,481 0.612 0.026 2,519 0.610 0.027 2,453 0.645 0.026
75-80 1,816 0.634 0.019 2,049 0.639 0.022 2,064 0.631 0.022 1,921 0.666 0.020
80-85 1,418 0.666 0.015 1,662 0.656 0.018 1,646 0.654 0.017 1,478 0.696 0.016
85-90 1,064 0.679 0.011 1,293 0.674 0.014 1,276 0.679 0.013 1,114 0.711 0.012
90-95 769 0.710 0.008 932 0.688 0.010 935 0.702 0.010 754 0.738 0.008
95-100 478 0.748 0.005 592 0.725 0.006 586 0.728 0.006 437 0.771 0.005
Top 1% 8,214 0.447 0.087 8,353 0.455 0.088 8,410 0.458 0.089 8,722 0.475 0.092
Top 5% 24,873 0.271 0.263 25,355 0.276 0.268 25,712 0.280 0.272 26,991 0.294 0.285
ROC C Statistic 0.731 0.745 0.752 0.780
+ 494
+ 400
+ 455
+ 145
+ 2186
+ 497
WHAT DATA BASES TO USE? IMPROVING CASE FINDING/ACCURACY
• Additional data sets do improve case finding
– Especially A&E and GP data
– But these improvements are modest
▪ 23% with full data sets at risk score 50+ cut-off
▪ 31% with full data sets at risk score 30+ cut-off
• There is no loss in predictive accuracy with inclusion of
additional data sets
• Improved case finding is greatest for lower risk patients
using GP data
• But it is still difficult to identify patients early in any cycle of
emergency admissions (that first emergency admission)
WHAT DATA BASES TO USE? IMPROVING CASE FINDING/ACCURACY
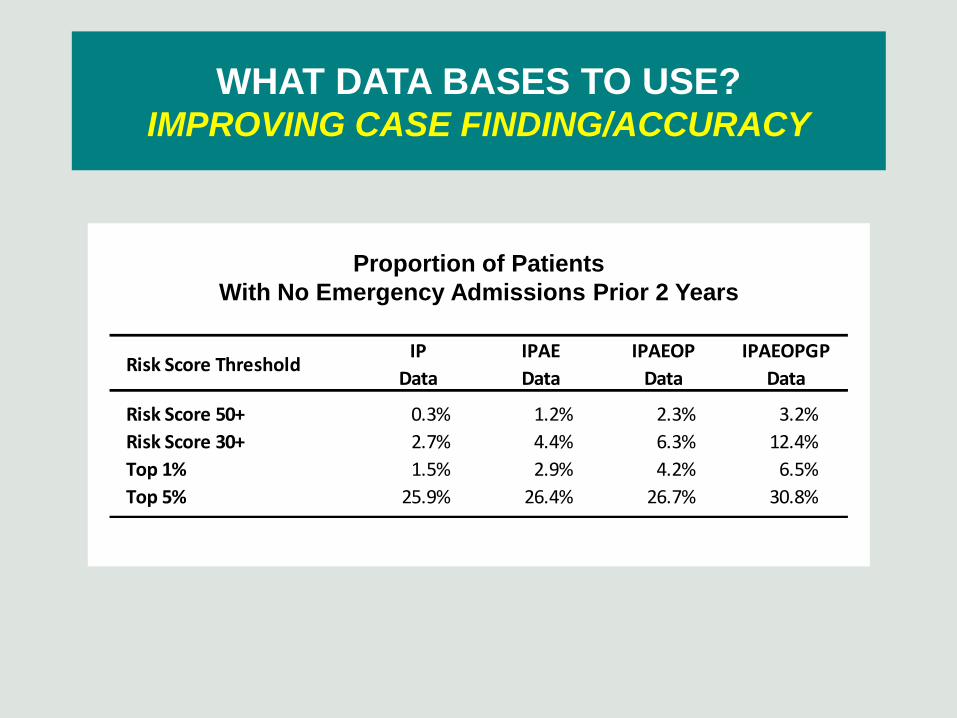
Proportion of Patients
With No Emergency Admissions Prior 2 Years
Risk Score ThresholdIP
Data
IPAE
Data
IPAEOP
Data
IPAEOPGP
Data
Risk Score 50+ 0.3% 1.2% 2.3% 3.2%
Risk Score 30+ 2.7% 4.4% 6.3% 12.4%
Top 1% 1.5% 2.9% 4.2% 6.5%
Top 5% 25.9% 26.4% 26.7% 30.8%
WHAT DATA BASES TO USE? IMPROVING CASE FINDING/ACCURACY
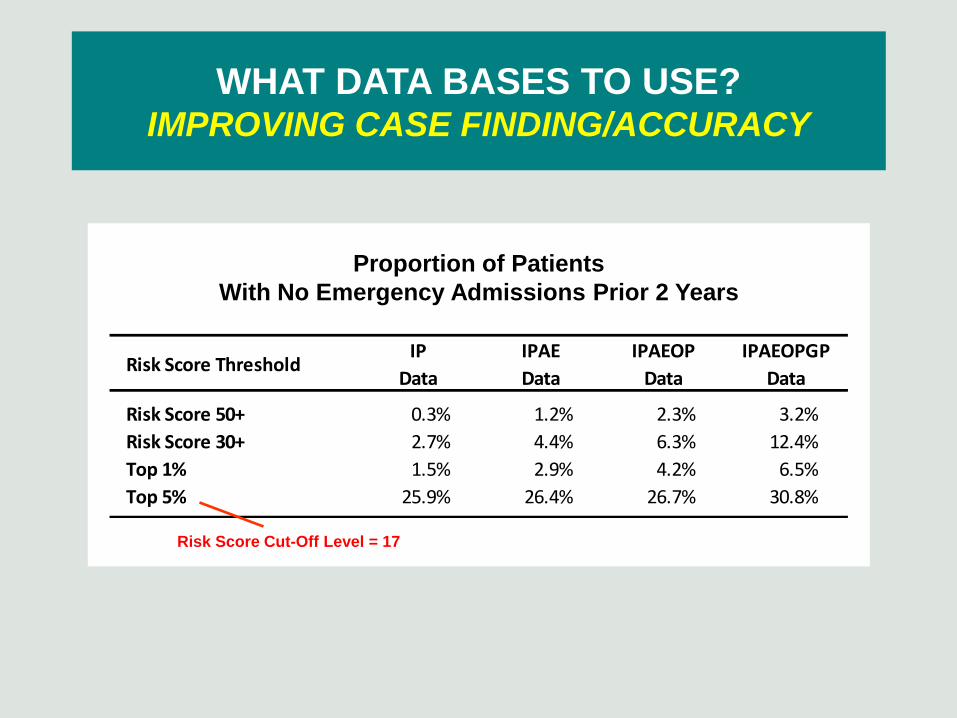
Proportion of Patients
With No Emergency Admissions Prior 2 Years
Risk Score ThresholdIP
Data
IPAE
Data
IPAEOP
Data
IPAEOPGP
Data
Risk Score 50+ 0.3% 1.2% 2.3% 3.2%
Risk Score 30+ 2.7% 4.4% 6.3% 12.4%
Top 1% 1.5% 2.9% 4.2% 6.5%
Top 5% 25.9% 26.4% 26.7% 30.8%
Risk Score Cut-Off Level = 17

WHAT VARIABLES TO USE?
WHAT VARIABLES TO USE?
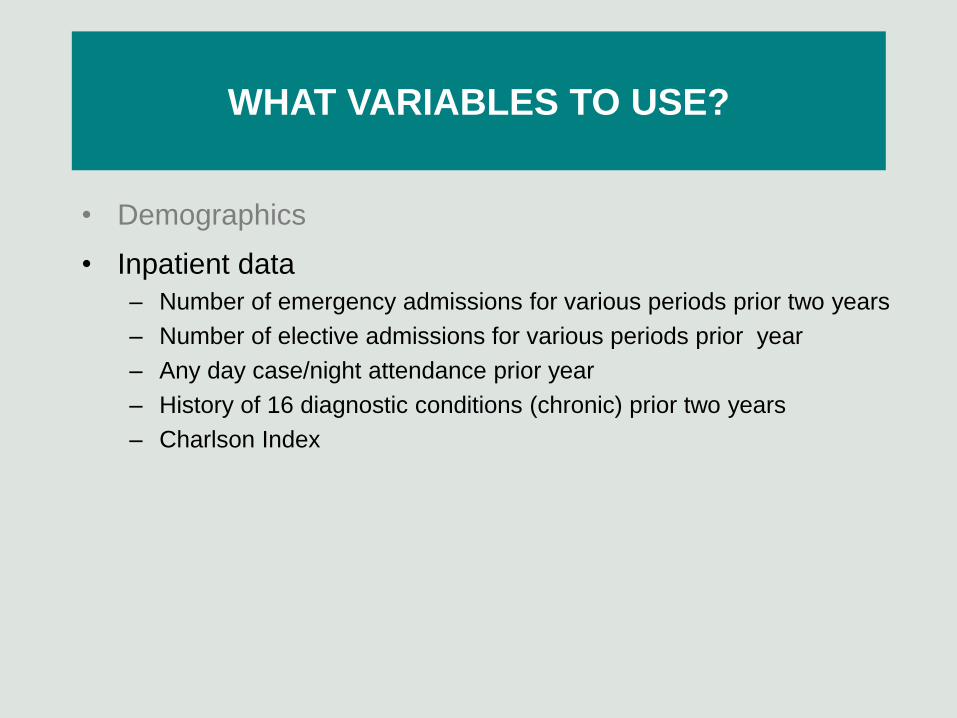
• Demographics
– Age
– Gender
– IMD (GP practice)
– Months registered at current GP practicre
WHAT VARIABLES TO USE?
• Demographics
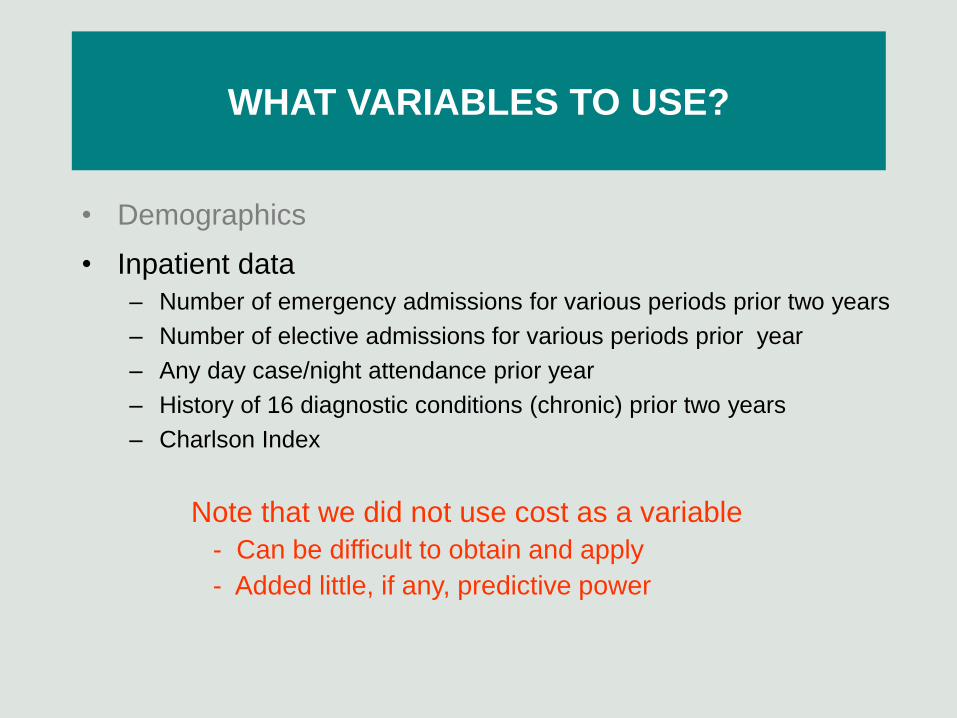
• Inpatient data
– Number of emergency admissions for various periods prior two years
– Number of elective admissions for various periods prior year
– Any day case/night attendance prior year
– History of 16 diagnostic conditions (chronic) prior two years
– Charlson Index
WHAT VARIABLES TO USE?
• Demographics
• Inpatient data
– Number of emergency admissions for various periods prior two years
– Number of elective admissions for various periods prior year
– Any day case/night attendance prior year
– History of 16 diagnostic conditions (chronic) prior two years
– Charlson Index
Note that we did not use cost as a variable
- Can be difficult to obtain and apply
- Added little, if any, predictive power
WHAT VARIABLES TO USE?
• Demographics
• Inpatient data
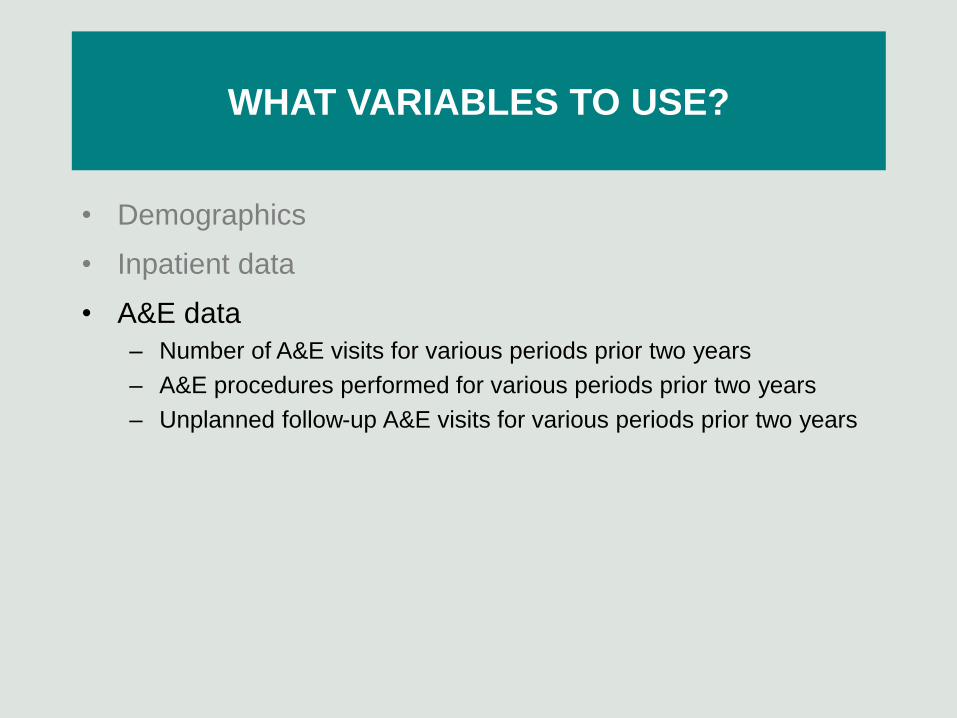
• A&E data
– Number of A&E visits for various periods prior two years
– A&E procedures performed for various periods prior two years
– Unplanned follow-up A&E visits for various periods prior two years
WHAT VARIABLES TO USE?
• Demographics
• Inpatient data
• A&E data
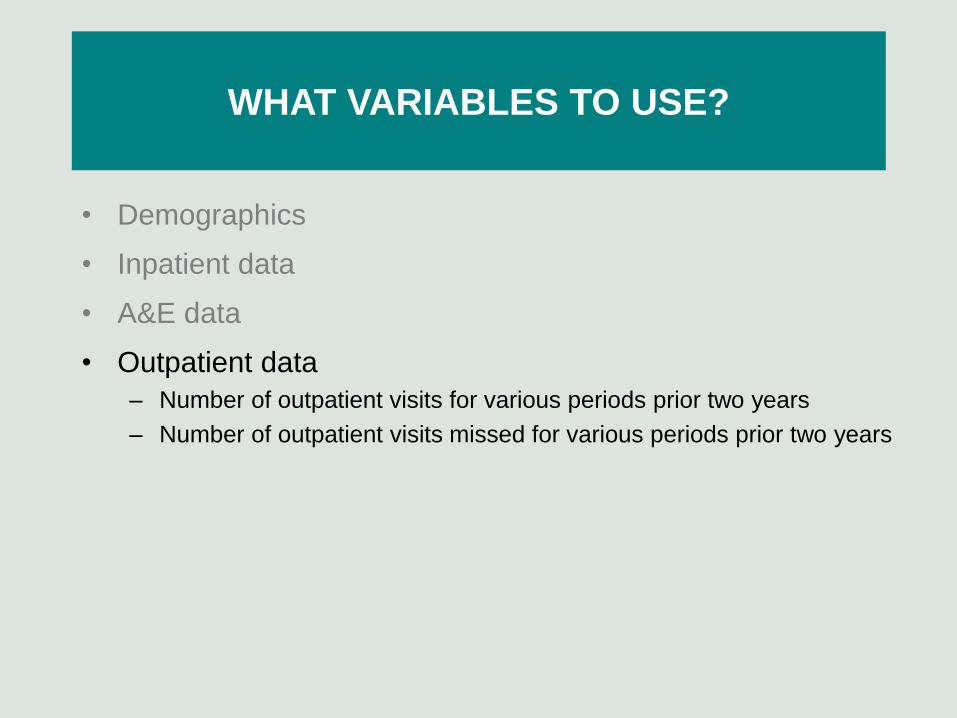
• Outpatient data
– Number of outpatient visits for various periods prior two years
– Number of outpatient visits missed for various periods prior two years
WHAT VARIABLES TO USE?
• Demographics
• Inpatient data
• A&E data
• Outpatient data
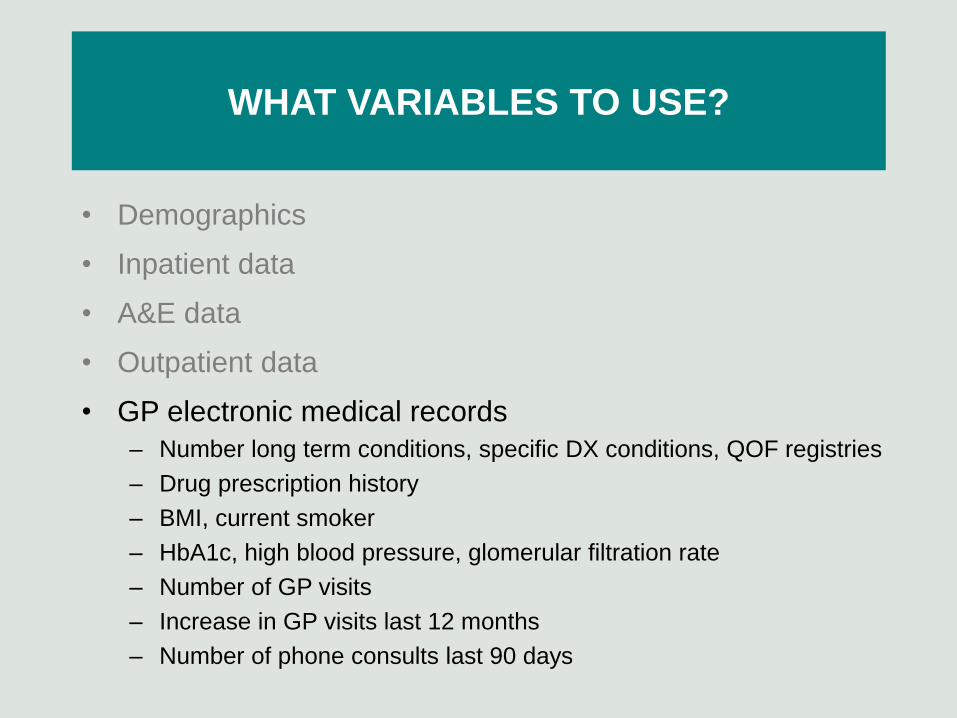
• GP electronic medical records
– Number long term conditions, specific DX conditions, QOF registries
– Drug prescription history
– BMI, current smoker
– HbA1c, high blood pressure, glomerular filtration rate
– Number of GP visits
– Increase in GP visits last 12 months
– Number of phone consults last 90 days

WHAT VARIABLES TO USE?
A full list of variables used and their definitions
will available imminently at Nuffield website

WHO IS IN THE DENOMINATOR?

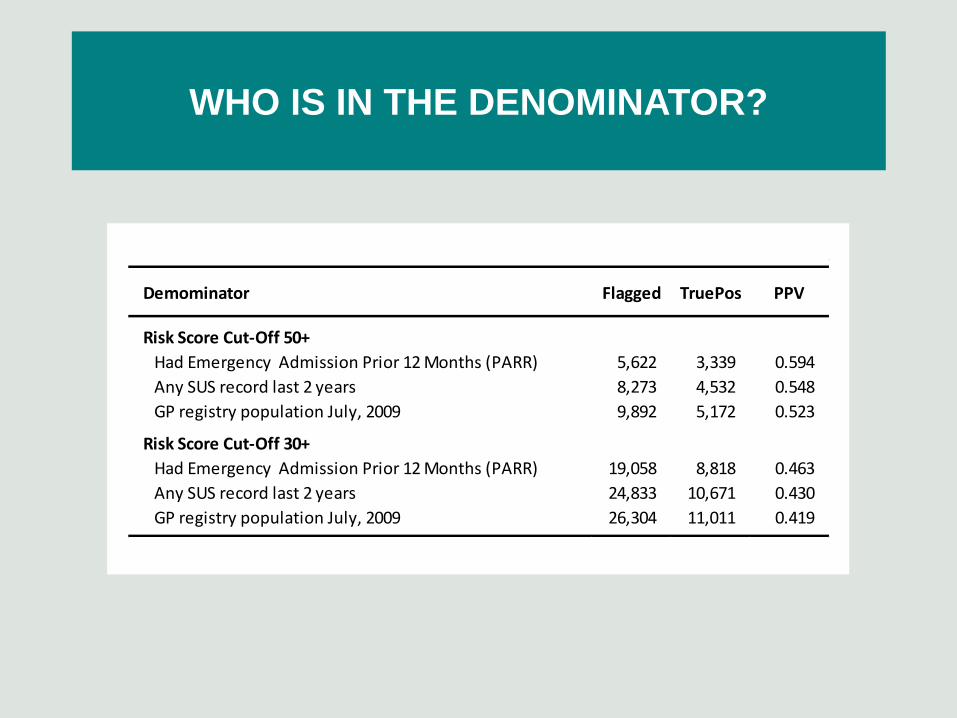
WHO IS IN THE DENOMINATOR?
• Patients with prior emergency admissions [PARR]
• Patients with any HES history [inpatient, A&E, outpatient]
• All registered patients
WHO IS IN THE DENOMINATOR?
Demominator Flagged TruePos PPV
Risk Score Cut-Off 50+
Had Emergency Admission Prior 12 Months (PARR) 5,622 3,339 0.594
Any SUS record last 2 years 8,273 4,532 0.548
GP registry population July, 2009 9,892 5,172 0.523
Risk Score Cut-Off 30+
Had Emergency Admission Prior 12 Months (PARR) 19,058 8,818 0.463
Any SUS record last 2 years 24,833 10,671 0.430
GP registry population July, 2009 26,304 11,011 0.419

CAN YOU APPLY “NATIONAL” MODELS
TO LOCAL DATA?
CAN YOU APPLY “NATIONAL” MODELS
TO LOCAL DATA?
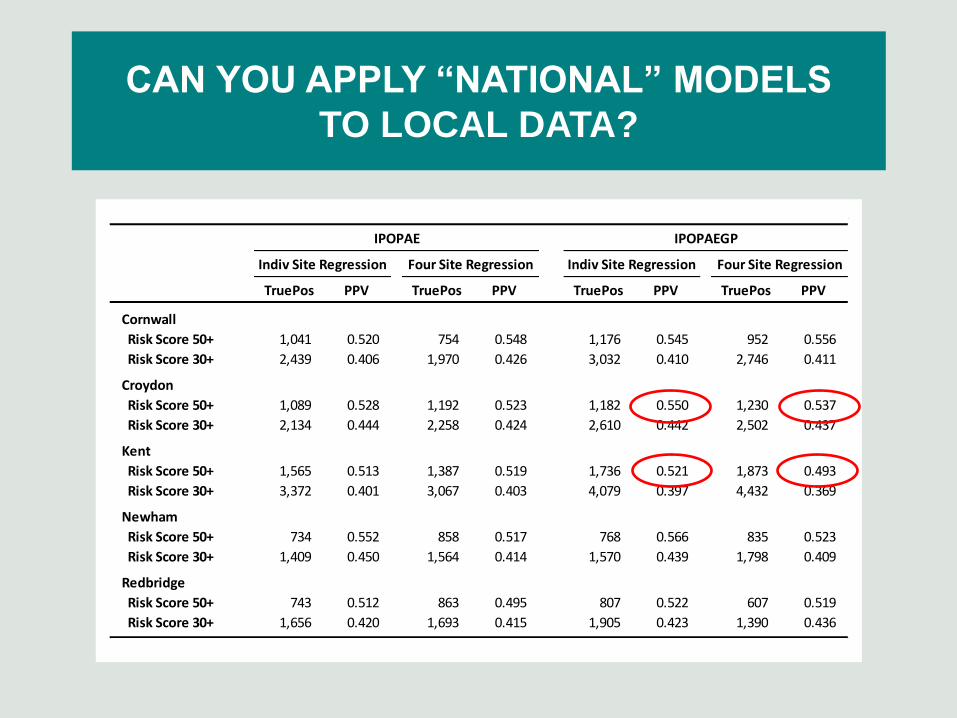
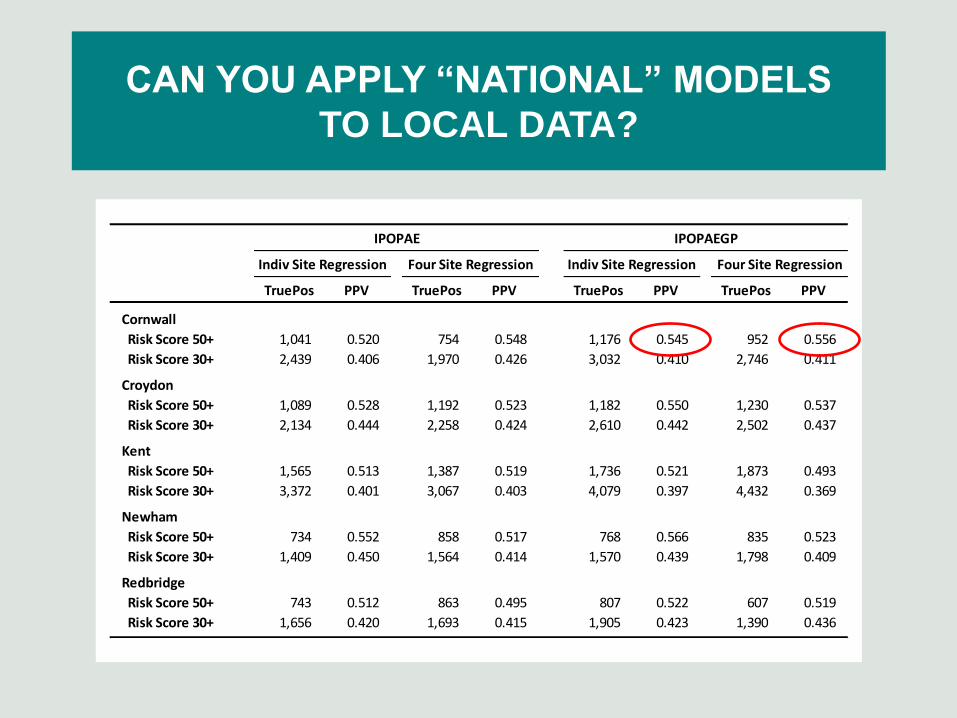
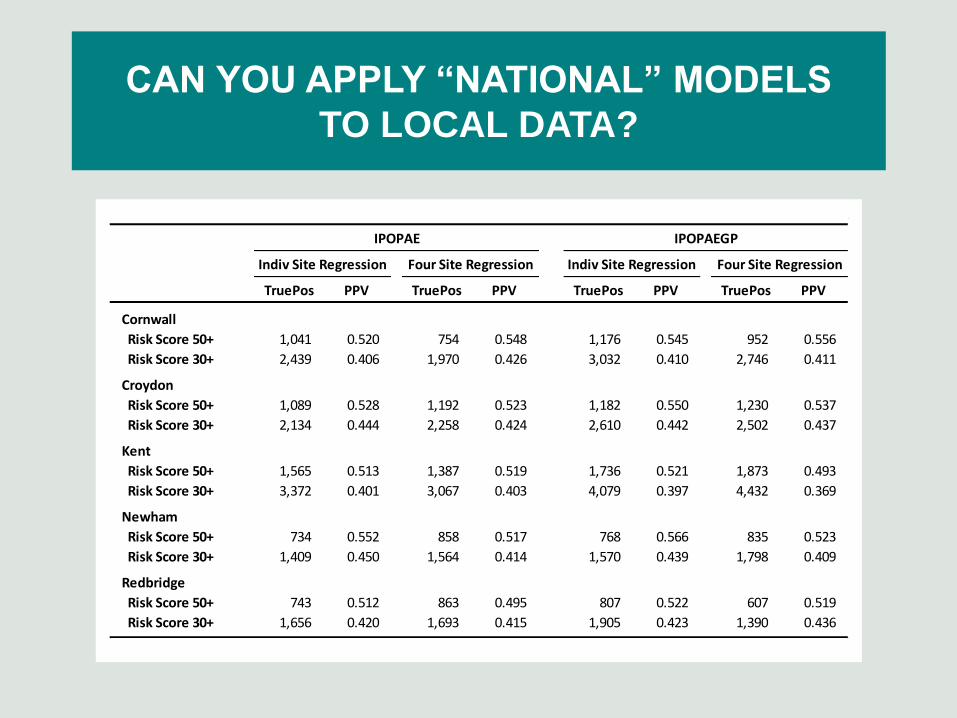
• For each of the five sites:
– We created individual site models
– Created models using the other four sites, and then applied the 4-site
coefficients to local data
– Then compared case finding and accuracy

CAN YOU APPLY “NATIONAL” MODELS
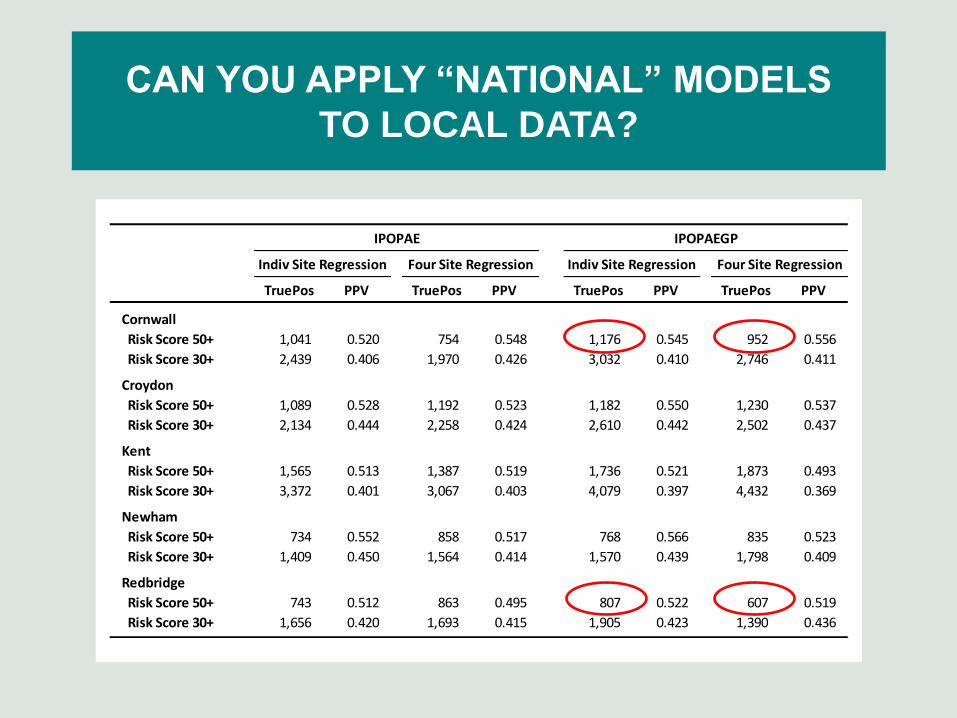
TO LOCAL DATA?
IPOPAE IPOPAEGP
Indiv Site Regression Four Site Regression Indiv Site Regression Four Site Regression
TruePos PPV TruePos PPV TruePos PPV TruePos PPV
Cornwall
Risk Score 50+ 1,041 0.520 754 0.548 1,176 0.545 952 0.556
Risk Score 30+ 2,439 0.406 1,970 0.426 3,032 0.410 2,746 0.411
Croydon
Risk Score 50+ 1,089 0.528 1,192 0.523 1,182 0.550 1,230 0.537
Risk Score 30+ 2,134 0.444 2,258 0.424 2,610 0.442 2,502 0.437
Kent
Risk Score 50+ 1,565 0.513 1,387 0.519 1,736 0.521 1,873 0.493
Risk Score 30+ 3,372 0.401 3,067 0.403 4,079 0.397 4,432 0.369
Newham
Risk Score 50+ 734 0.552 858 0.517 768 0.566 835 0.523
Risk Score 30+ 1,409 0.450 1,564 0.414 1,570 0.439 1,798 0.409
Redbridge
Risk Score 50+ 743 0.512 863 0.495 807 0.522 607 0.519
Risk Score 30+ 1,656 0.420 1,693 0.415 1,905 0.423 1,390 0.436
CAN YOU APPLY “NATIONAL” MODELS
TO LOCAL DATA?
IPOPAE IPOPAEGP
Indiv Site Regression Four Site Regression Indiv Site Regression Four Site Regression
TruePos PPV TruePos PPV TruePos PPV TruePos PPV
Cornwall
Risk Score 50+ 1,041 0.520 754 0.548 1,176 0.545 952 0.556
Risk Score 30+ 2,439 0.406 1,970 0.426 3,032 0.410 2,746 0.411
Croydon
Risk Score 50+ 1,089 0.528 1,192 0.523 1,182 0.550 1,230 0.537
Risk Score 30+ 2,134 0.444 2,258 0.424 2,610 0.442 2,502 0.437
Kent
Risk Score 50+ 1,565 0.513 1,387 0.519 1,736 0.521 1,873 0.493
Risk Score 30+ 3,372 0.401 3,067 0.403 4,079 0.397 4,432 0.369
Newham
Risk Score 50+ 734 0.552 858 0.517 768 0.566 835 0.523
Risk Score 30+ 1,409 0.450 1,564 0.414 1,570 0.439 1,798 0.409
Redbridge
Risk Score 50+ 743 0.512 863 0.495 807 0.522 607 0.519
Risk Score 30+ 1,656 0.420 1,693 0.415 1,905 0.423 1,390 0.436

WHAT INTERVENTIONS WORK BEST
FOR HIGH RISK PATIENTS?

WHAT INTERVENTIONS WORK BEST
FOR HIGH RISK PATIENTS?
I really have no idea…

WHAT INTERVENTIONS WORK BEST
FOR HIGH RISK PATIENTS?
Well, actually I have plenty of ideas…
- just no strong evidence on much
WHAT TO DO
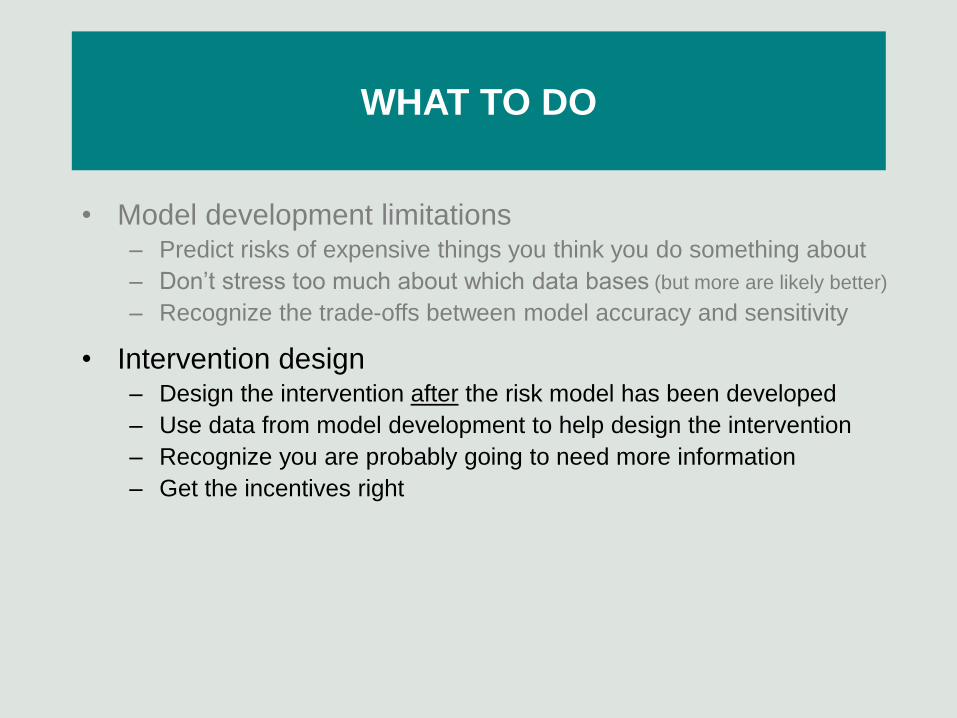
• Model development limitations – Predict risks of expensive things you think you do something about
– Don’t stress too much about which data bases (but more are likely better)
– Recognize the trade-offs between model accuracy and sensitivity
WHAT TO DO
• Model development limitations – Predict risks of expensive things you think you do something about
– Don’t stress too much about which data bases (but more are likely better)
– Recognize the trade-offs between model accuracy and sensitivity
• Intervention design – Design the intervention after the risk model has been developed
– Use data from model development to help design the intervention
– Recognize you are probably going to need more information
– Get the incentives right
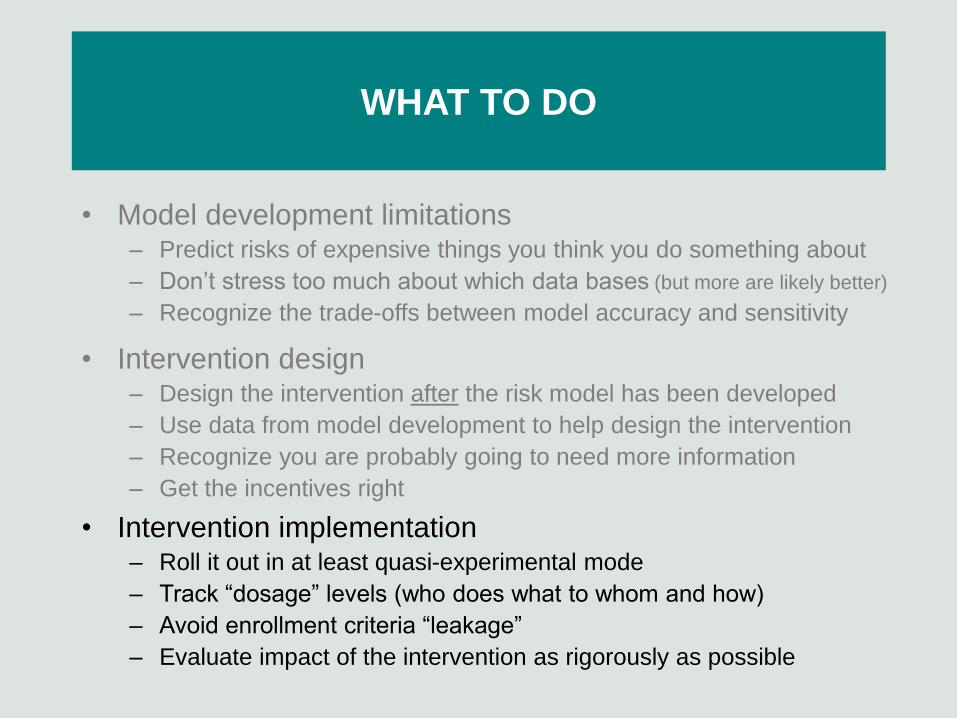
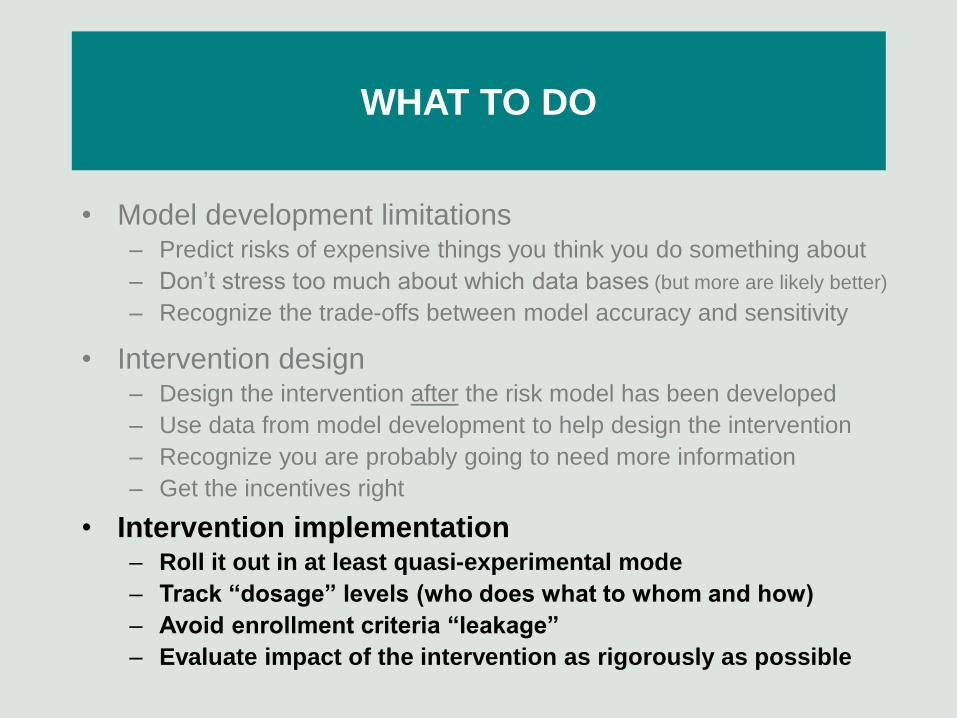
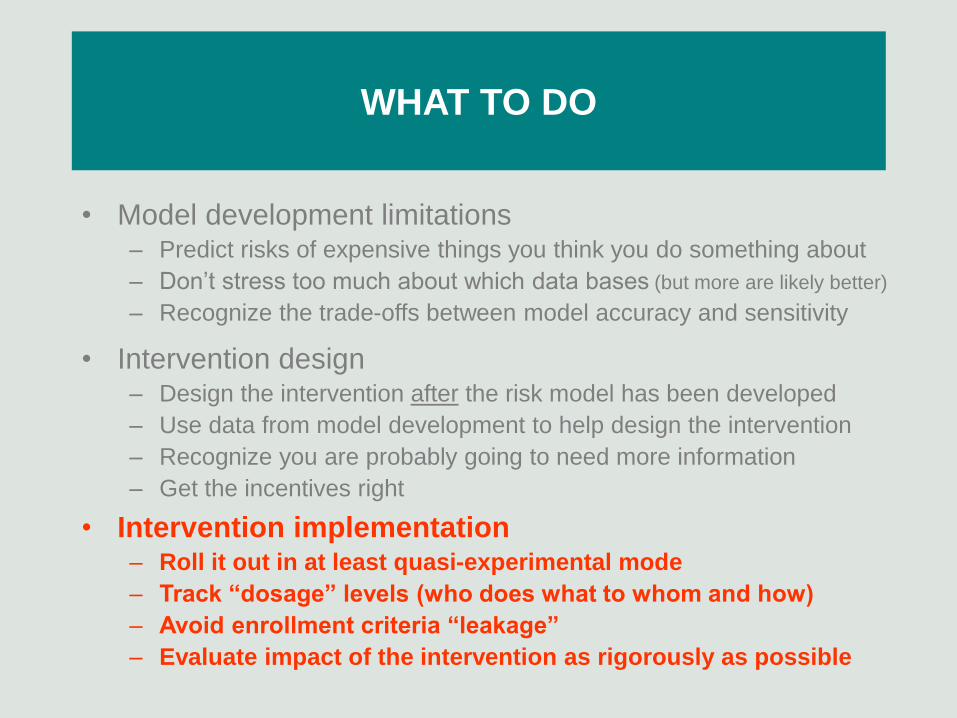
• Intervention implementation – Roll it out in at least quasi-experimental mode
– Track “dosage” levels (who does what to whom and how)
– Avoid enrollment criteria “leakage”
– Evaluate impact of the intervention as rigorously as possible
WHAT TO DO
• Model development limitations – Predict risks of expensive things you think you do something about
– Don’t stress too much about which data bases (but more are likely better)
– Recognize the trade-offs between model accuracy and sensitivity
• Intervention design – Design the intervention after the risk model has been developed
– Use data from model development to help design the intervention
– Recognize you are probably going to need more information
– Get the incentives right
• Intervention implementation – Roll it out in at least quasi-experimental mode
– Track “dosage” levels (who does what to whom and how)
– Avoid enrollment criteria “leakage”
– Evaluate impact of the intervention as rigorously as possible
