jmic paris conf may 2015 pres rochelle turner
TRANSCRIPT
Global Travel & Tourism Data
JMIC: Value of Meetings Conference, Paris 15 May 2015
Rochelle Turner, Head of Research, [email protected]
WTTC Mission
“To maximise the sustainable growth of the industry by informing governments and wider society of the enormous economic and social benefit that Travel & Tourism brings to the world community”
Why research?
“The single biggest gap in knowledge [for governments] is how tourism can impact the economic development of a country. I don’t just mean in terms of the basic rise in GDP as a result of having tourism, but how, if done properly, it can open up a country in many other ways...if you don’t get it right, then in a world in which everyone is competing for capital investment and business, you are going to do less well”.
Rt Hon Tony Blair, WTTC Asian Summit, Sept 2013
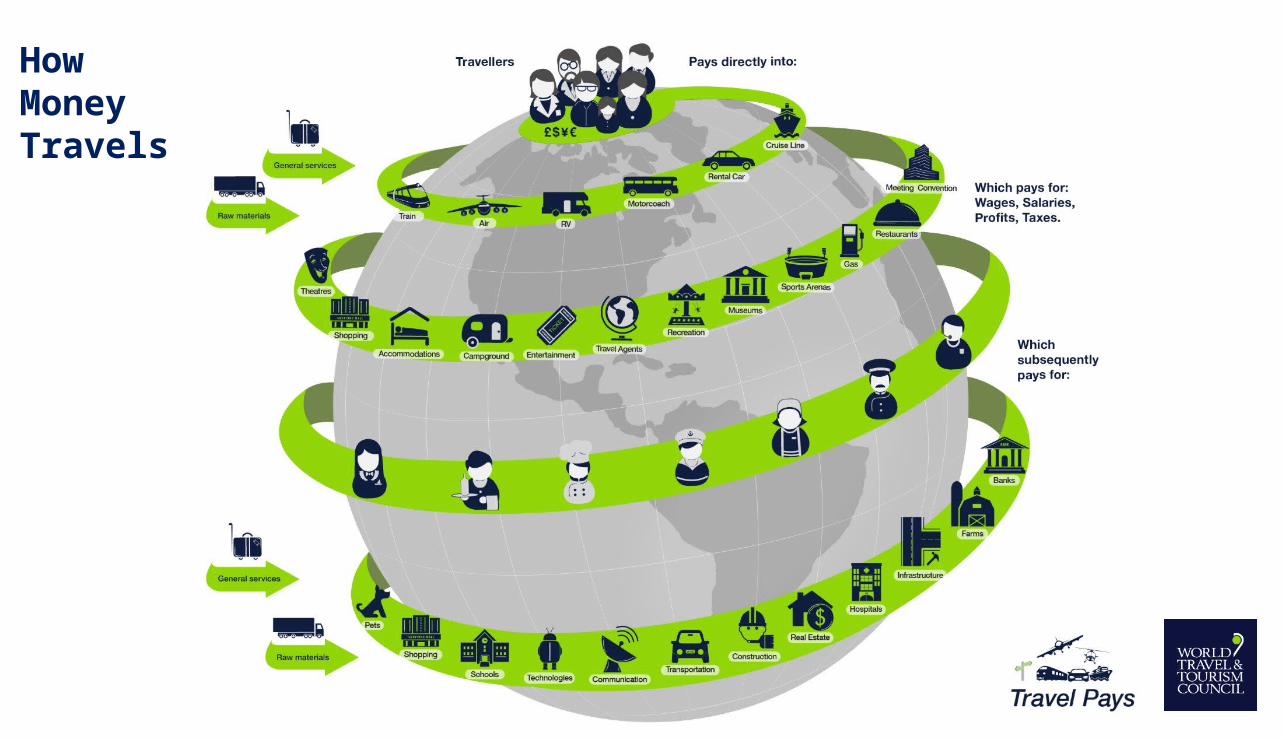
How MoneyTravels
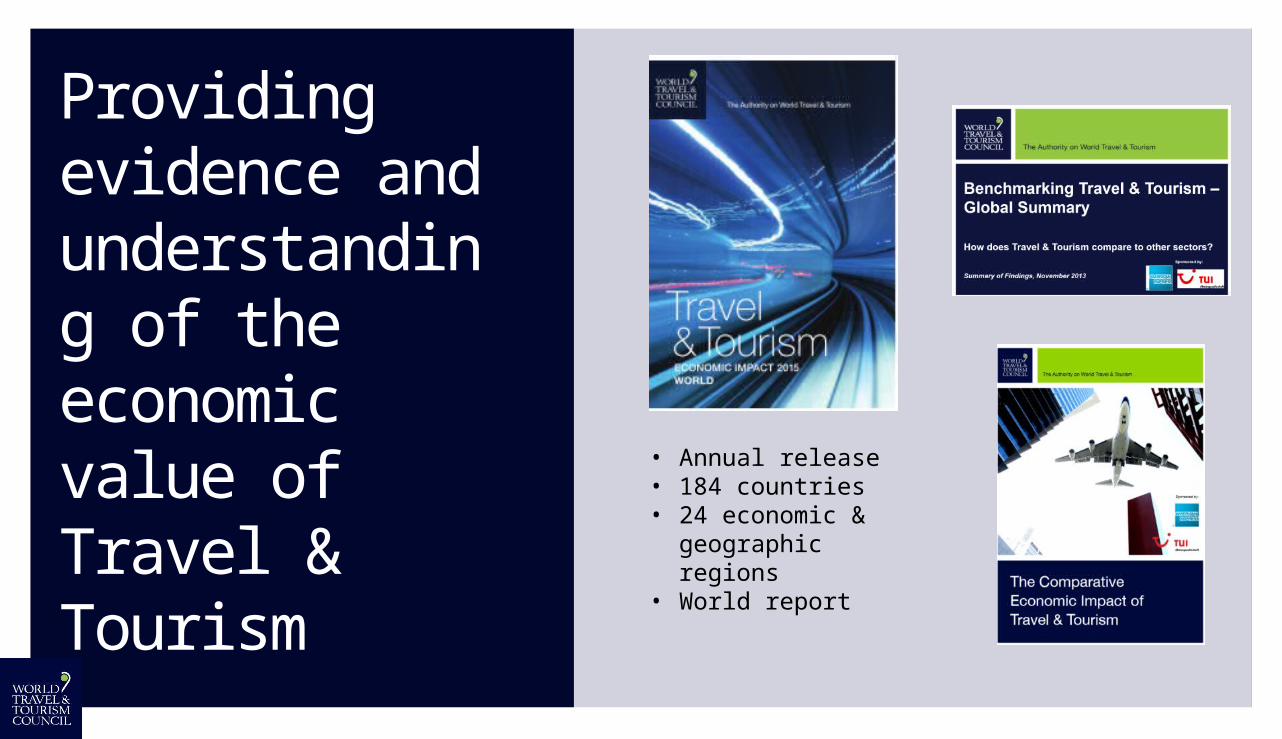
Providing evidence and understanding of the economic value of Travel & Tourism • Annual release
• 184 countries• 24 economic &
geographic regions• World report
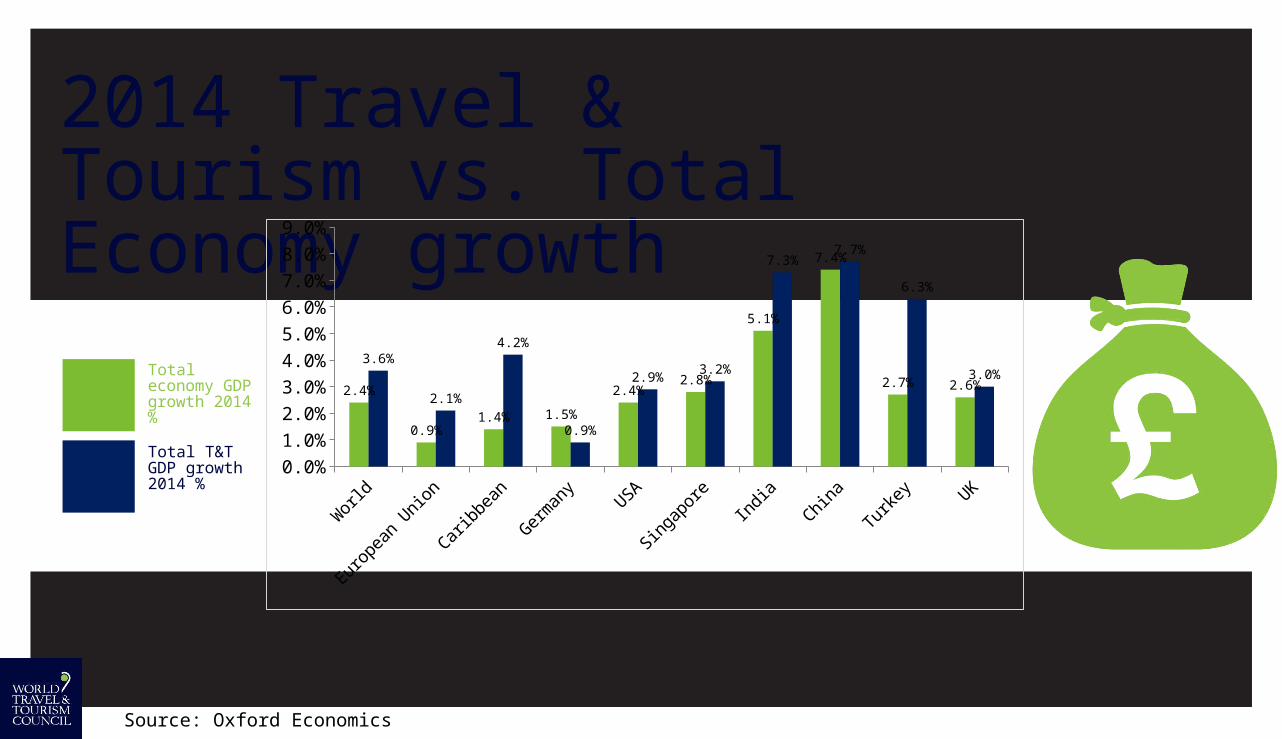
2014 Travel & Tourism vs. Total Economy growth
Total economy GDP growth 2014 %
Total T&T GDP growth 2014 %
Wor
ld
Europ
ean
Union
Caribb
ean
Germ
any
USA
Singap
ore
India
China
Turk
ey UK0.0%
1.0%
2.0%
3.0%
4.0%
5.0%
6.0%
7.0%
8.0%
9.0%
2.4%
0.9%1.4% 1.5%
2.4%2.8%
5.1%
7.4%
2.7% 2.6%
3.6%
2.1%
4.2%
0.9%
2.9%3.2%
7.3%7.7%
6.3%
3.0%
Source: Oxford Economics
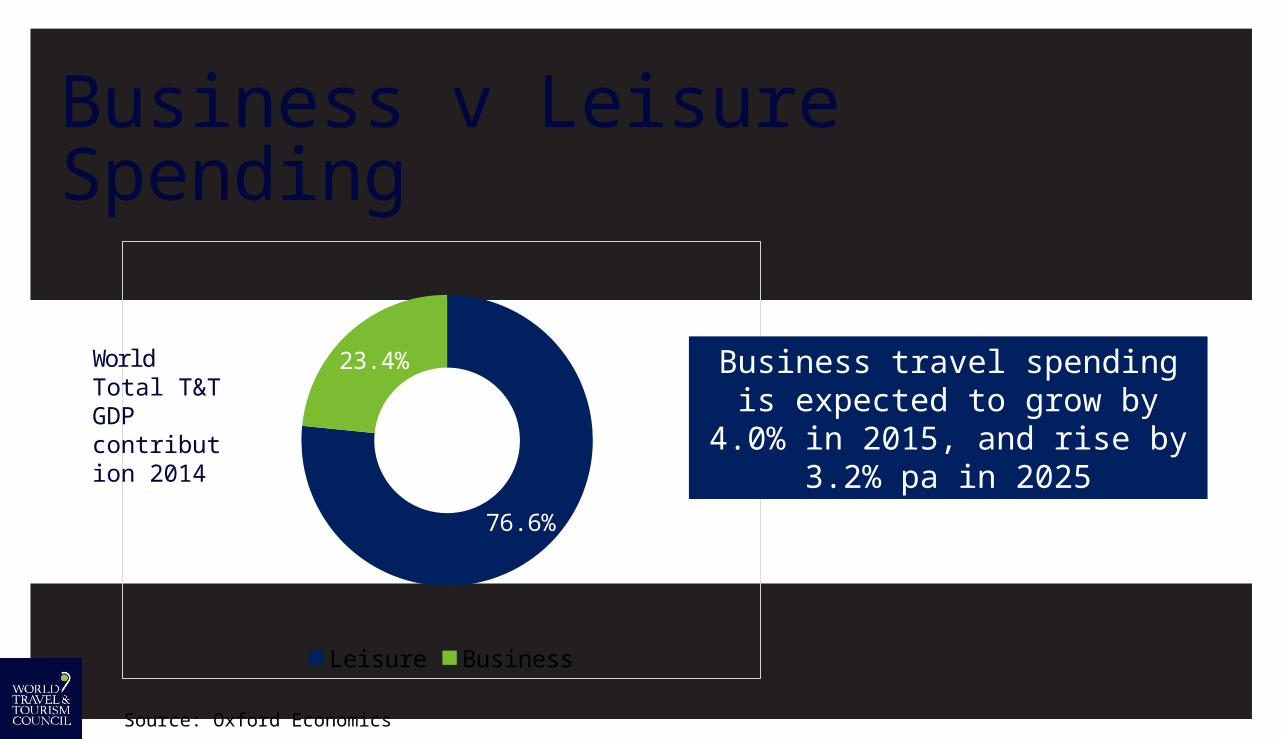
Business v Leisure Spending
Source: Oxford Economics
76.6%
23.4%
Leisure Business
Business travel spending is expected to grow by 4.0% in 2015,
and rise by 3.2% pa in 2025
World Total T&T GDP contribution 2014
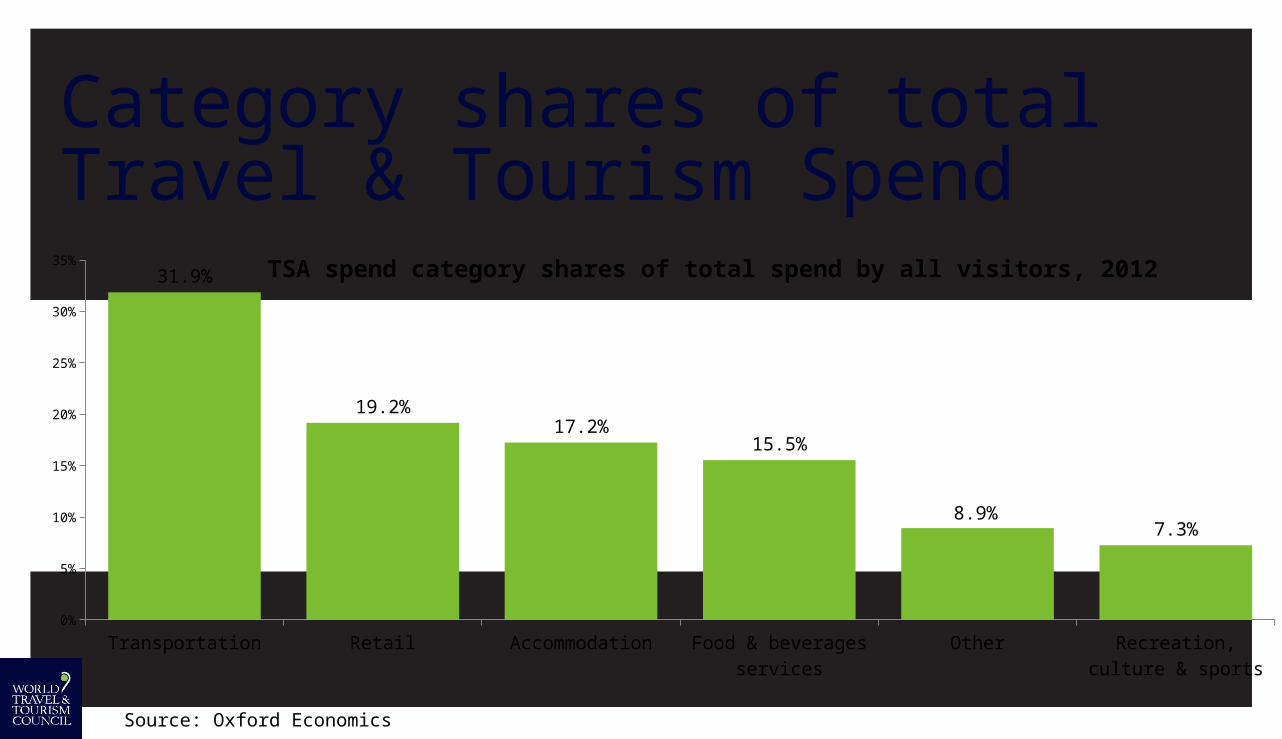
Category shares of total Travel & Tourism Spend
Source: Oxford Economics
TSA spend category shares of total spend by all visitors, 2012
Transportation Retail Accommodation Food & beverages services
Other Recreation, culture & sports
0%
5%
10%
15%
20%
25%
30%
35%
31.9%
19.2%17.2%
15.5%
8.9%7.3%
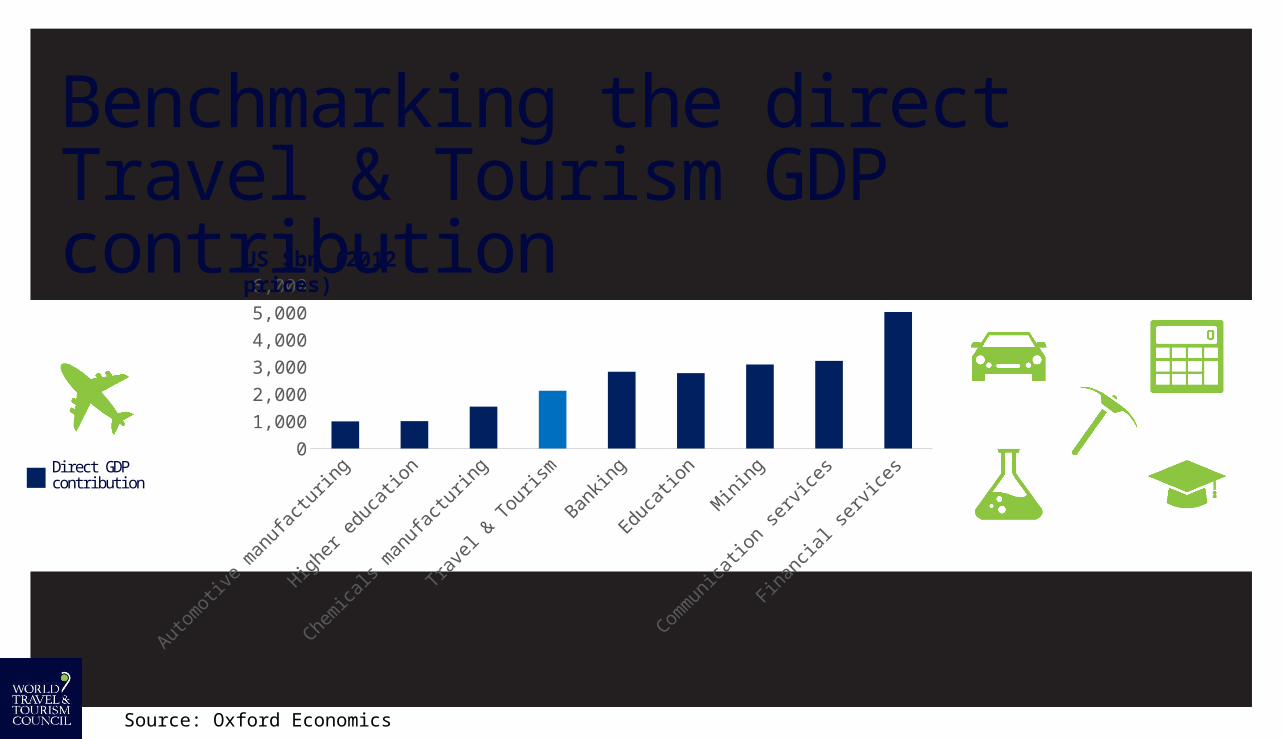
Benchmarking the direct Travel & Tourism GDP contribution
Source: Oxford Economics
Autom
otive m
anufact
uring
Higher e
ducatio
n
Chemica
ls m
anufact
uring
Trave
l & T
ourism
Banking
Educatio
n
Min
ing
Comm
unicatio
n serv
ices
Financia
l serv
ices
0
1,000
2,000
3,000
4,000
5,000
6,000
US $bn (2012 prices)
Direct GDP contribution
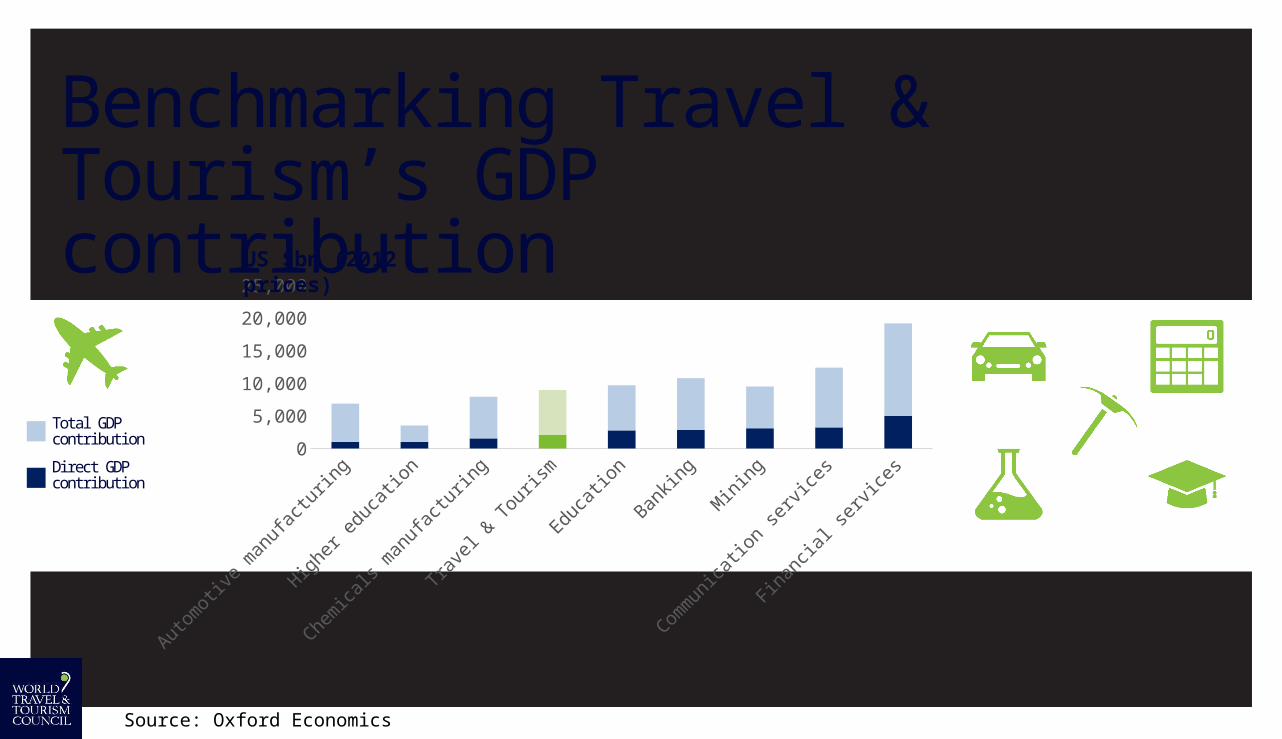
Benchmarking Travel & Tourism’s GDP contribution
Source: Oxford Economics
Autom
otive m
anufact
uring
Higher e
ducatio
n
Chemica
ls m
anufact
uring
Trave
l & T
ourism
Educatio
n
Banking
Min
ing
Comm
unicatio
n serv
ices
Financia
l serv
ices
0
5,000
10,000
15,000
20,000
25,000
US $bn (2012 prices)
Total GDP contribution
Direct GDP contribution
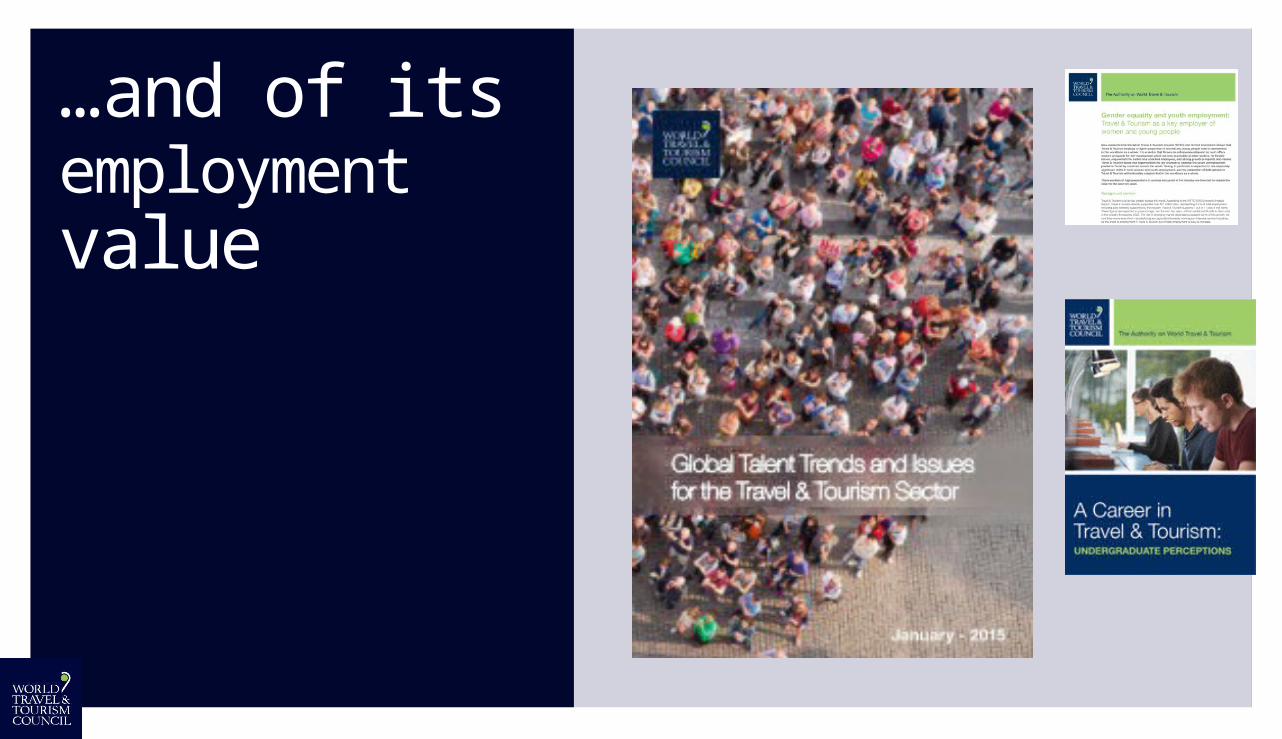
…and of its employment value
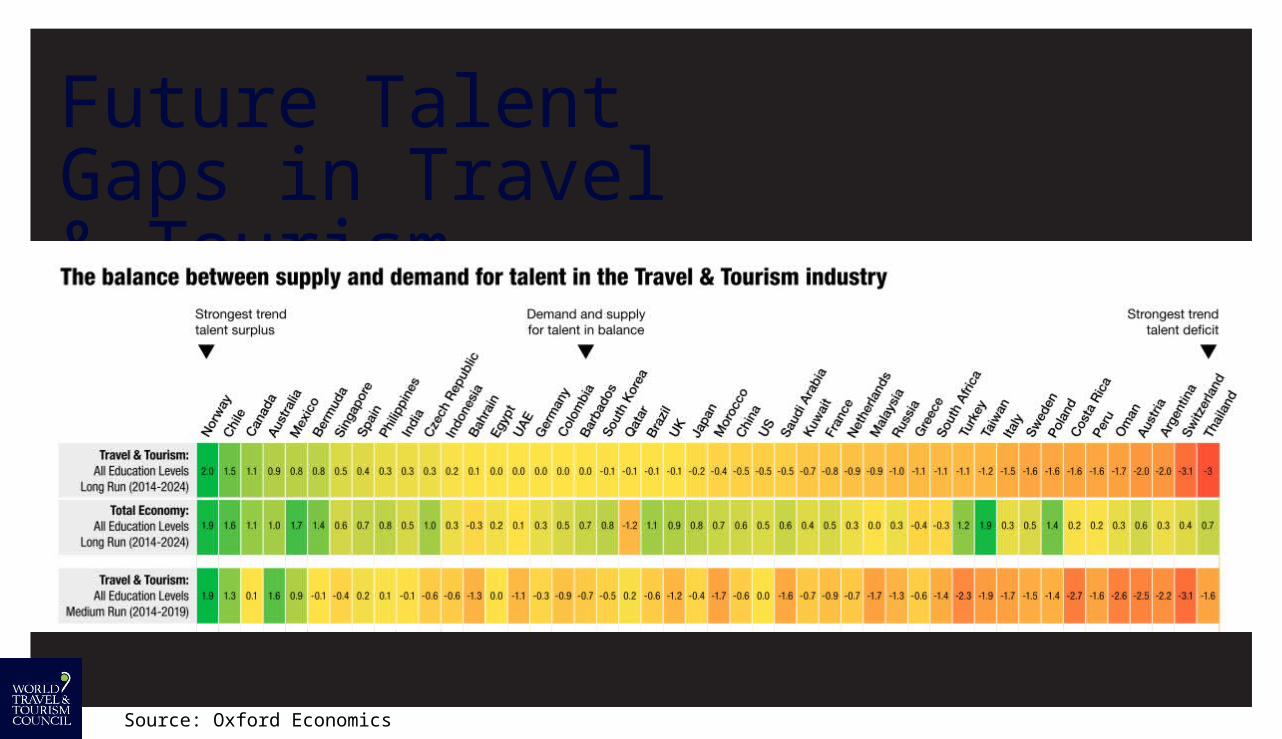
Future Talent Gaps in Travel & Tourism
Source: Oxford Economics
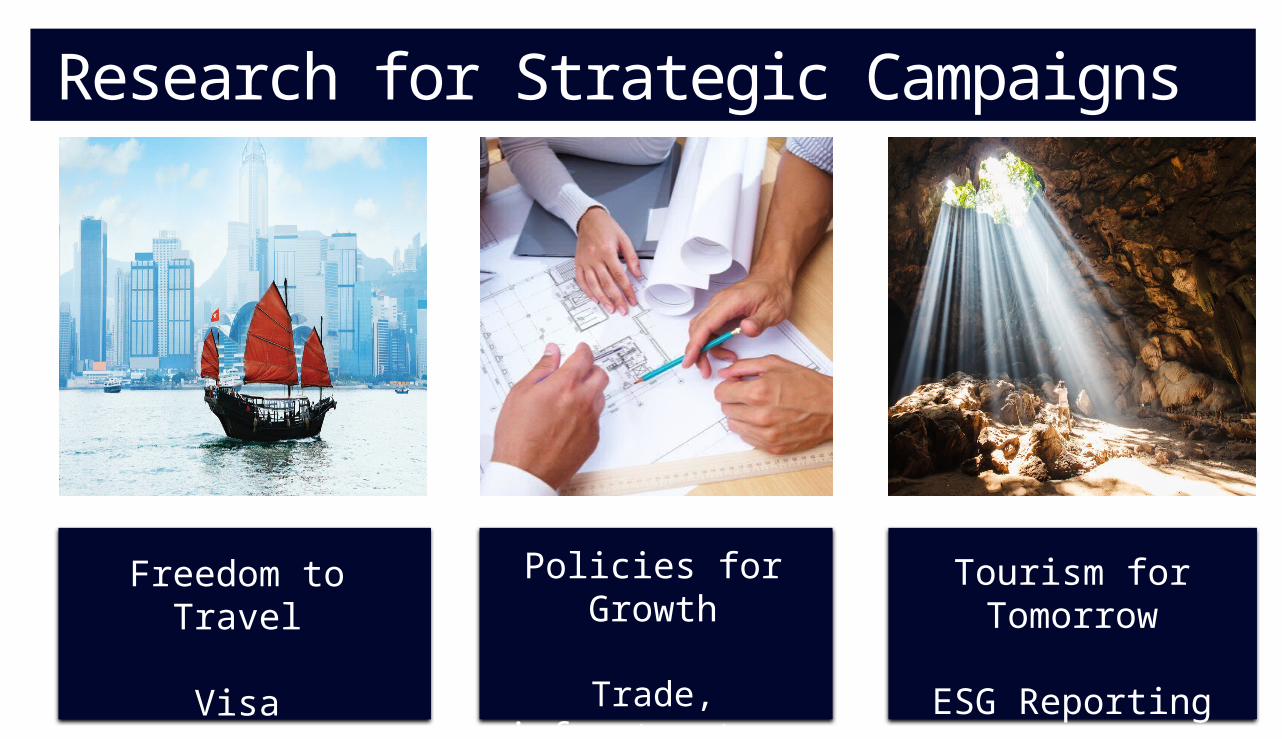
Research for Strategic Campaigns
Freedom to Travel
Visa facilitation
Policies for Growth
Trade, infrastructure investment, HR, tax
Tourism for Tomorrow
ESG Reporting
Research for Strategic Campaigns
Speaking with One Voice
The Authority onWorld Travel & Tourism
Thank you
www.wttc.org/research