jing, hao and pinchin, james and hill, chris and moore...
TRANSCRIPT

Jing, Hao and Pinchin, James and Hill, Chris and Moore, Terry (2014) Collaborative Wi-Fi fingerprint training for indoor positioning. In: 27th International Technical Meeting of The Satellite Division of the Institute of Navigation, 8-12 Sept 2014, Tampa, Florida.
Access from the University of Nottingham repository: http://eprints.nottingham.ac.uk/33478/1/ION2014_HaoJing.pdf
Copyright and reuse:
The Nottingham ePrints service makes this work by researchers of the University of Nottingham available open access under the following conditions.
This article is made available under the University of Nottingham End User licence and may be reused according to the conditions of the licence. For more details see: http://eprints.nottingham.ac.uk/end_user_agreement.pdf
A note on versions:
The version presented here may differ from the published version or from the version of record. If you wish to cite this item you are advised to consult the publisher’s version. Please see the repository url above for details on accessing the published version and note that access may require a subscription.
For more information, please contact [email protected]
Collaborative Wi-Fi fingerprint training for indoor positioning
Hao Jing1,2, James Pinchin1, Chris Hill1, Terry Moore1
1 Nottingham Geospatial Institute, University of Nottingham, UK
ABSTRACT:
As the scope of location-based applications and services
further reach into our everyday lives, the demand for
more robust and reliable positioning becomes ever more
important. However indoor positioning has never been a
fully resolved issue due to its complexity and necessity to
adapt to different situations and environment. Inertial
sensor and Wi-Fi signal integrated indoor positioning
have become good solutions to overcome many of the
problems. Yet there are still problems such as inertial
heading drift, wireless signal fluctuation and the time
required for training a Wi-Fi fingerprint database. The
collaborative Wi-Fi fingerprint training (cWiDB) method
proposed in this paper enables the system to perform
inertial measurement based collaborative positioning or
Wi-Fi fingerprinting alternatively according to the current
situation. It also reduces the time required for training the
fingerprint database. Different database training methods
and different training data size are compared to
demonstrate the time and data required for generating a
reasonable database. Finally the fingerprint positioning
result is compared which indicates that the cWiDB is able
to achieve the same positioning accuracy as conventional
training methods but with less training time and a data
adjustment option enabled.
KEYWORD: collaborative positioning, indoor
positioning, Wi-Fi fingerprint, SLAM
1. INTRODUCTION
With the advancement in smartphone technologies
nowadays, location based services (LBS) are no longer
just a trendy fashion of future fantasies. As LBS
applications expand from military and government
departments into commercial and normal everyday lives,
the positioning and navigation coverage also moves
gradually into more complicated environments and out of
the working range of conventional Global Navigation
Satellite Systems (GNSS). Over the years, different
signals and methods have been be explored to achieve
robust positioning in diverse environments [1-2]. Low
cost inertial sensors, i.e. the accelerometers within
smartphones, are handy gadgets to provide basic
acceleration and heading data for pedestrian dead
reckoning (PDR) navigation. Wireless network signal
based positioning, such as Wi-Fi fingerprinting, have
become widely applied in indoor positioning due to the
high availability of Wi-Fi signals in urban environments
[3-4].
A common problem with inertial navigation systems
(INS) is the severe gyro drift that becomes increasingly
obvious as time increases. Therefore a correction is
usually applied [5-6]. On the other hand, Wi-Fi based
positioning accuracy is not time related. However
wireless signals can be unstable due to hardware and
environmental influence, which causes inaccuracy in
positioning [7]. A popular positioning method based on
Wi-Fi signals is the Wi-Fi fingerprinting method, which
provides positioning based on received signal strength
(RSS) patterns in designated areas [8-9]. The user is
required to train a database during the offline phase by
collecting RSS from wireless access points (AP) in a
number of selected locations known as fingerprints.
During the positioning phase, the user compares the
observed RSS to the pre-trained fingerprints for
positioning estimation. The positioning accuracy relies on
the applied positioning algorithm as well as the accuracy
and up-to-date details of the fingerprint database.
Therefore, in order to achieve accurate positioning,
training for the database can be very time consuming. On
the other hand, this method is inconvenient for a new
environment or an environment where internal layout or
AP locations may change frequently [9-10].
To reduce the time and human labour required for
database training, Wi-Fi Simultaneous localisation and
mapping (SLAM) has been applied [11-12] to enable a
quicker way of learning the signal pattern around a new
environment based on inertial measurements and building
information. SLAM was originally applied in robotic
navigation where robots learn the relative environmental
features during navigation and enable quicker and more
accurate positioning as the process carries on [13]. It
allows the system to navigate in a new environment with
no a prior knowledge of the environment. Features could
also be learned with respect to maps when available.
SLAM has also been applied to learn other features of the
building for improved navigation solutions [14].
Whether positioning based on fingerprinting or Wi-Fi
SLAM, it is vital that the positions associated with the
fingerprints are accurate. Otherwise, the positioning
solution could only become more and more biased.

Collaborative positioning improves user positioning
accuracy and reliability by applying network constraints
when the user has no prior knowledge of the signal
fingerprints. A number of nearby users may form a
network and the ranging measurements are measured
between each user of the network. Corrections are applied
to adjust each user position until they all obey the relative
ranging constraint [15].
A SLAM-like collaborative Wi-Fi fingerprint database
training (cWiDB) approach is introduced in this paper to
enable a quicker and more accurate collection of RSS
fingerprints. A network of mobile users that are in the
same indoor environment achieves position estimations
through pedestrian dead reckoning (PDR) measurements
obtained from mobile devices. The PDR solutions of the
users are constrained by relative ranging measurements
among each other, which reduce the inertial measurement
errors and biases, improving the positioning accuracy
significantly as introduced in [16]. Meanwhile, each user
collects Wi-Fi RSS and stores the measurement with the
positioning estimation. A Gaussian Process (GP)
regression [17] is carried out at certain epochs to generate
fingerprints for the whole indoor environment based on
the collected data. The collaborative positioning enhances
positioning accuracy in a complicated environment thus
can provide the positions for fingerprint training.
Moreover, positioning robustness and flexibility is
improved significantly, while users have the option of
performing PDR, collaborative ranging or Wi-Fi based
positioning based on available sensors and number of
users.
This paper firstly introduces a Wi-Fi fingerprint
training method through collaborative positioning. This is
compared to a database ground truth to analyse how much
data is needed for dynamic training. Various different
training data is compared to verify the improvement
collaborative positioning and Wi-Fi data collection is
proposed to enable quicker data collection and reduce
database training time. Finally, the positioning results
based on the generated database are compared for analysis
on the required amount of data for efficient database
training.
2. WI-FI INDOOR POSITIONING
2.1 Wi-Fi positioning methods
Wireless network based positioning generally relies on
two different methods: multi-lateration and scene analysis.
Lateration requires the user to achieve ranging
estimations from the receiver to multiple signal
transmitters based on the signal strength path loss model,
( ) (1)
where is the RSS at a reference distance, usually 1m
away from the transmitter, is the space loss factor
which varies in different environments, is the wall
attenuation factor and is the number of obstructions in
between the receiver and transmitter, is a zero mean
normally distributed noise. The position of the receiver is
calculated based on the distance and angle between the
transmitters and the receiver. Due to interference,
multipath and obstruction inside buildings, wireless
signals tend to be quite noisy. The actual observation
( ) and the estimated ( ) from the model can
differ more than 20dB which could lead to errors up to ten
metres. This in result reduces the multi-lateration
positioning accuracy, especially in an indoor environment.
A typical scene analysis method is the fingerprinting
method, which consists of two steps. The first step is the
training phase, where someone must select a number of
training points within the area of interest and collect the
actual signal strength ( ) from all of the transmitters
or access points (AP) which forms a signal pattern of the
specific location. This not only takes into account the
distance between the current location and the AP, but also
the obstruction and interference in between, hence is
unique for each location. These RSS patterns which
indicate a specific location or area of the building are
known as fingerprints and stored into a database. During
the positioning phase, the user obtains the current set of
RSS readings at the location that needs to be positioned
and compare it with the fingerprints in the database.
Usually the location of k fingerprints with the closest RSS
to the current RSS, known as k-nearest neighbours (kNN),
is obtained to estimate the current position.
Fingerprinting is able to take into account the fact that
signals can be interfered by walls and furniture. As long
as the affecting factor remains the same, the signal pattern
will remain relatively stable. In fact, the uniqueness of
fingerprints gives credit to the varying signal pattern
produced by the disturbance from walls etc. Therefore,
fingerprinting usually achieves better positioning
performance. The biggest problem with fingerprinting is
that training for the database requires a huge amount of
human labour, which increases the risk of human error
and also time cost. Moreover, the database needs to be re-
trained and updated each time the infrastructure changes
to maintain a valid database for positioning.
The collaborative training method discussed in this
paper greatly reduces the training time and human effort
by integrating the training data from multiple users at
different locations and different training time. The
fingerprint database for the building is then generated
based on the training data using Gaussian Process (GP)
regression. This enables a quick and efficient way of
training the fingerprint database, which is also much
easier to maintain and update.
2.2 Training the fingerprint database
Usually, the database is trained by selecting a number
of locations, known as training points (TPs), which covers
the entire area of interest. The user would put a data
collection device, e.g. laptop, mobile phones etc., at each
TP and collect a series of RSS vectors from each AP in
the building. A large number of RSS should be collected
at each location to gather enough information on the
variance and stability of the signal from each AP over

time. Each fingerprint vector is structured as
( ) .
( )is the position of the nth TP, is the mean
RSS of the mth AP at the nth TP, is the standard
deviation of the mth AP at nth TP, is the unique
identification of the AP, usually the MAC address. The
uniqueness of the fingerprint is enhanced by the number
of APs found and the amount of RSS collected.
Fingerprint-based positioning is achieved by searching
through the database and finding the location that is most
similar to the current RSS vector. Thus to achieve more
accurate positioning results, the fingerprints should cover
the floor plan in more detail, i.e. the more TPs the better.
However, no matter how much TPs are selected, it is
almost impossible to precisely cover the entire floor plan.
A common way of selecting TPs is to divide the area into
evenly distributed square grids. The RSS data is collected
within each grid and assume that the RSS remains the
same within the grid. Typical grid sizes are 1m×1m,
2m×2m [18]. Smaller grids ensure a more detailed
database. However it will also be more time consuming.
A way of making up the data loss due to large grid
size is to select sparse TPs and then generate the RSS at
denser grid sizes by applying Gaussian Process (GP) as
described in [12]. This is valid based on the assumption
that the RSS from a certain AP is spatially correlated
within a certain distance according to the path loss model.
If are samples drawn from a noisy process
( ) (2)
where each is an input sample and is the target or
observation value, is assumed to be a zero mean
normally distributed noise. Gaussian process estimates the
posterior distributions over functions f from the training
data which is specified by a mean function ( ) and a
covariance function, or kernel ( ). This is specified
by the kernel which describes the correlation between two
input values and . In this paper, the squared
exponential kernel is applied,
( ) (
| |
) (3)
where is the signal variance, is a length scale that
defines the strength of correlation over a distance. The
covariance function for observations is defined as
( ) (4)
where is the Gaussian observation noise, K is the
covariance matrix of the input values thus ( )
( ). The RSS observations and their locations are
input into the system to train for the hyperparameters
⟨
⟩ which define the functions based on the
training data. Theses parameters are then used to predict
RSS for other locations in the building during the
prediction process based on the predicative distribution
( ) ∫ ( ( )) ( ( ) ) ( ) (5)
The locations of the TPs are input as while the RSS
are the target values . The building is divided into
1m×1m grids are included in and the RSS at each
location is predicated based on the trained functions.
The covariance of the predicted function is given by the
covariance function.
3. METHODOLOGY
3.1 Database structure
Wi-Fi SLAM builds a relationship between the RSS of
the mobile receiver and its estimated location. The signal
measurement noise is assumed to be normally distributed
and independent. The receiver scans for the Wi-Fi RSS
while moving in the area of interest and associate this
data with the location that it was collected. The
collaborative training method is a SLAM-like method
which performs positioning and trains the Wi-Fi
fingerprints simultaneously through multiple users.
The fingerprint positioning solution is achieved by
comparing the current RSS from available APs at an
unknown location to the fingerprints in the database.
Therefore, whether the fingerprints can accurately reflect
its position is vitally important. As described in Section
2.2, the fingerprint structure typically consists of a
reference location and the RSS from each AP at the
location. Signal strength fluctuation means that the signal
strength could vary over a range of 5dB to 10dB or even
more at any single location when the equipment is static.
Thus one single RSS is barely sufficient to act as a precise
location indicator.
For gather a general idea of how much signal
fluctuation to expect at a specific location, the training
time should extend over ten minutes or even hours and
days. This increases the time and labour cost. Training for
the database collaboratively and during a positioning
phase saves a huge amount of time and effort. However it
does means that only one RSS will be collected at a
specific location, or a scatter of RSS within a small area.
Therefore the generated fingerprints will take the form of
the basic structure without the signal fluctuation indicator
. Although this could mean that less information is
provided as a positioning indicator initially, but further
data accumulates quickly as training is operated
collaboratively.
3.2 Collaborative training
Training for the fingerprint database is a very time
consuming task and has to be redone to maintain
positioning reliability when changes have taken place.
The collaborative Wi-Fi fingerprint training method is
introduced to reduce the training effort by integrating the
information collected by a number of users into one
system. This method firstly relies on the collaborative
positioning among a number of mobile users to produce
the reference positions for the RSS fingerprints.
Fingerprints record the estimated position of the actual

RSS, the MAC address of each visible AP and the
corresponding RSS.
The collaborative positioning algorithm is constrains
the measurement error by applying a relative ranging
constraint. Each user in the collaborative network
propagates forward based on the PDR prediction model as
in Eq.(6).
[
] [
( ) ( )
( ) ( )
] (6)
where ( ) is the user position at time k, ( ) is
the step length estimation between time k-1 and k, ( )
is the heading estimation during the step. Ranging
estimations between users are obtained from other
wireless signals and applied as a constraint to eliminate
the inertial measurement error. The position estimation of
each user within the network will be forced to a relative
geometry which fits the ranging estimation. This in result
increases the positioning accuracy and serves as the
estimated position of the measured RSS.
The cWiDB method gathers the Wi-Fi RSS data from
during the collaborative positioning process and stores the
fingerprint data as training data. When a descent amount
of training data have been collected to cover a certain area,
the data is used to generate a fingerprint database for the
area of interest. The GP output mean will be used as the
fingerprint RSS for each location.
3.3.1 Fingerprint combination
The ranging measurement builds a link here between
the collected RSS data. The training data from the users
can be combined and applied in three different ways.
If the distance between the two users is above a
separation threshold, it would be regarded that the users
are not in the same area of interest. Their training data
would be stored separately and used to generate
individual database.
If their distance is within the separation threshold but
above the integration threshold, their training data would
be considered to be within the same area of interest. It
would then be applied to generate a single database.
If the any of the collected training data distance is
within the integration threshold, they would be regarded
as correlated and adjusted to form one fingerprint for the
database.
3.3.2 Fingerprint confidence factor
The standard deviations of all history training data that
are within the integration threshold is obtained
periodically and acts as a confidence indicator for the
fingerprints in the location. If the training data for any
location appears to continuously differ from historical
data and remains a high value, it is considered that
the Wi-Fi properties at that location have changed.
Previous fingerprints will no longer be reliable and valid
information for positioning, hence replaced by new
fingerprints generated from new training data.
As the users are spread out in various locations within
the area, the fingerprint database can be generated fairly
quickly. The confidence factor for old fingerprints will be
updated based on new data. The procedure is shown as
below in Figure 1.
User1: Obtain position estimation
and collect Wi-Fi RSS
User n: Obtain position estimation
and collect Wi-Fi RSS
Is the distance within certain threshold?
Dis > thresholdSepar. Thre> Dis > integ.
threDis < Separ.Thres
Generate separate FPDB
Generate single FPDB
Generate Confidence indicator σ
Combine and update
Updated FPDB
...
Figure 1 Flowchart for generating a database
4. TRIALS AND RESULTS
4.1 Conventional database
To understand the required density and location setup
of the training data to generate an accurate fingerprint
database, different training methods are compared. The
same Toshiba laptop, where the wireless adapter is Intel®
Centrino® Advanced-N 6200, is used throughout the
trials. Four APs are located on Floor A of NGB, each
transmitting signals at both the 2.4GHz and 5GHz
frequency. As the signal characteristics are different on
each frequency, thus the two different frequency signals
will be treated separately. Hence a full database consists 8
MAC address groups, each denoted as AP1a (2.4GHz),
AP1b (5GHz), AP2a, AP2b, AP3a, AP3b, AP4a and
AP4b respectively, as indicated in Figure 2.
First of all, the conventional static training method is
applied to establish a ground truth for the fingerprint
database. These TPs are combined of two groups. The
first group of 56 TPs are selected to cover the entire
accessible areas in the Nottingham Geospatial Building
(NGB) Floor A, which is around two TPs in a small office
room and four to six TPs in a large room. The second
group of 56 TPs in located in two specific rooms where
one room represents an average meeting room with no
obstruction and the other a heavily obstructed store room
with metal shelves. The density of these TPs is 1m×1m,
which is very detailed. During training, a laptop is placed
at each location to collect the Wi-Fi RSS data for around
fifteen to thirty minutes until at least 100 vectors from
each of the four APs on Floor A are collected. The mean
and standard deviation of all the collected RSS for each
AP at each location is obtained and stored into the
database. GP is then applied based on the training data to
generate a denser database. The resulting database will be
referred to as the static GP fingerprint database, denoted
as sDB. This is the best possible solution for fingerprint
database training as it covers the entire training area in
detail but it is also very time consuming. Training for the
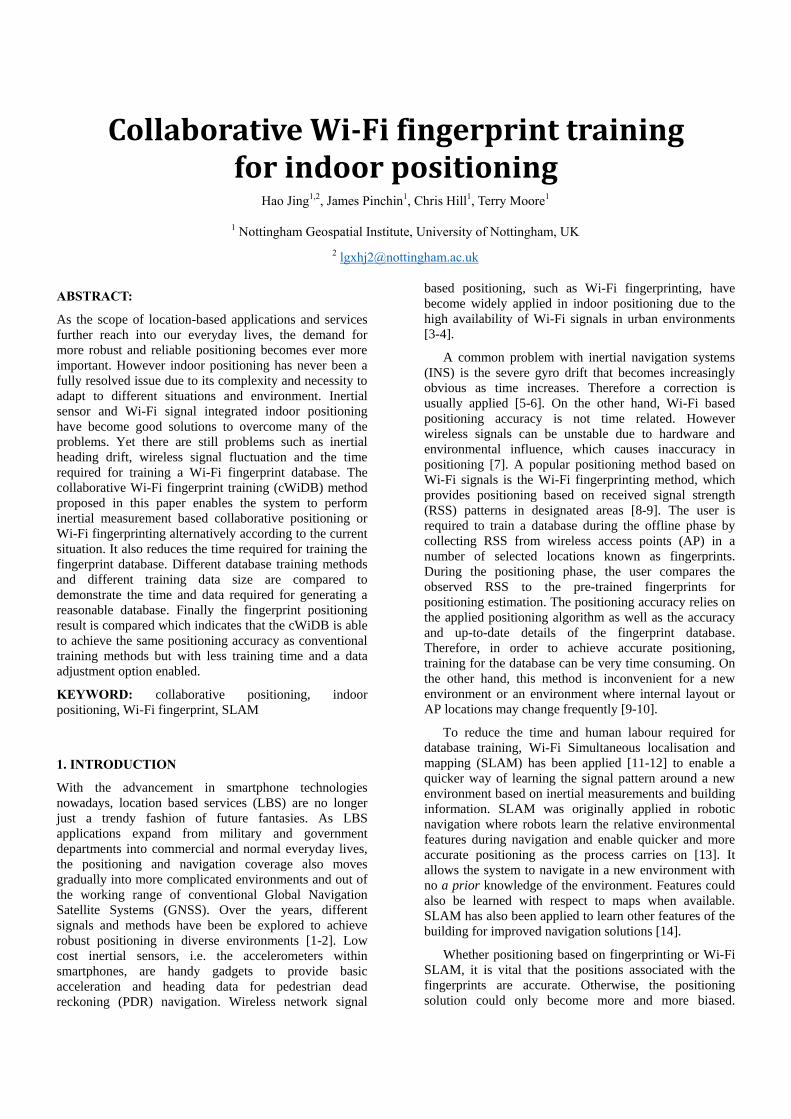
112 points requires almost five days. The selected TPs are
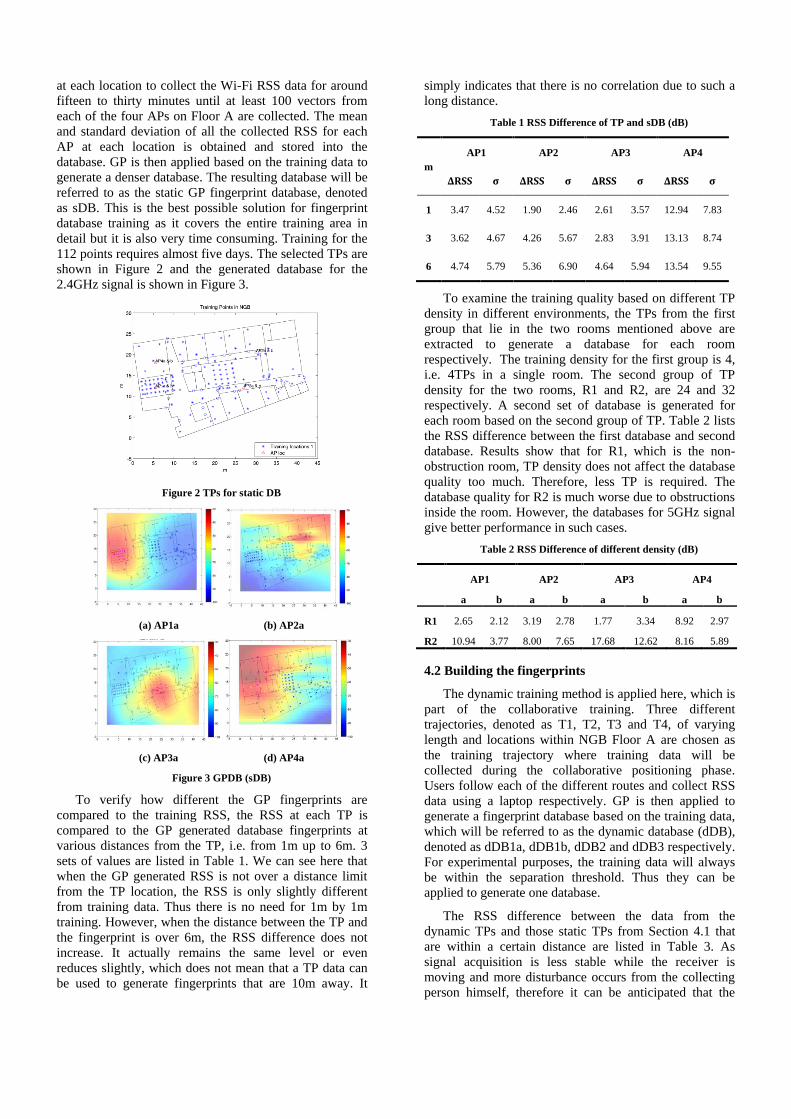
shown in Figure 2 and the generated database for the
2.4GHz signal is shown in Figure 3.
Figure 2 TPs for static DB
(a) AP1a (b) AP2a
(c) AP3a (d) AP4a
Figure 3 GPDB (sDB)
To verify how different the GP fingerprints are
compared to the training RSS, the RSS at each TP is
compared to the GP generated database fingerprints at
various distances from the TP, i.e. from 1m up to 6m. 3
sets of values are listed in Table 1. We can see here that
when the GP generated RSS is not over a distance limit
from the TP location, the RSS is only slightly different
from training data. Thus there is no need for 1m by 1m
training. However, when the distance between the TP and
the fingerprint is over 6m, the RSS difference does not
increase. It actually remains the same level or even
reduces slightly, which does not mean that a TP data can
be used to generate fingerprints that are 10m away. It
simply indicates that there is no correlation due to such a
long distance.
Table 1 RSS Difference of TP and sDB (dB)
m
AP1 AP2 AP3 AP4
ΔRSS σ ΔRSS σ ΔRSS σ ΔRSS σ
1 3.47 4.52 1.90 2.46 2.61 3.57 12.94 7.83
3 3.62 4.67 4.26 5.67 2.83 3.91 13.13 8.74
6 4.74 5.79 5.36 6.90 4.64 5.94 13.54 9.55
To examine the training quality based on different TP
density in different environments, the TPs from the first
group that lie in the two rooms mentioned above are
extracted to generate a database for each room
respectively. The training density for the first group is 4,
i.e. 4TPs in a single room. The second group of TP
density for the two rooms, R1 and R2, are 24 and 32
respectively. A second set of database is generated for
each room based on the second group of TP. Table 2 lists
the RSS difference between the first database and second
database. Results show that for R1, which is the non-
obstruction room, TP density does not affect the database
quality too much. Therefore, less TP is required. The
database quality for R2 is much worse due to obstructions
inside the room. However, the databases for 5GHz signal
give better performance in such cases.
Table 2 RSS Difference of different density (dB)
AP1 AP2 AP3 AP4
a b a b a b a b
R1 2.65 2.12 3.19 2.78 1.77 3.34 8.92 2.97
R2 10.94 3.77 8.00 7.65 17.68 12.62 8.16 5.89
4.2 Building the fingerprints
The dynamic training method is applied here, which is
part of the collaborative training. Three different
trajectories, denoted as T1, T2, T3 and T4, of varying
length and locations within NGB Floor A are chosen as
the training trajectory where training data will be
collected during the collaborative positioning phase.
Users follow each of the different routes and collect RSS
data using a laptop respectively. GP is then applied to
generate a fingerprint database based on the training data,
which will be referred to as the dynamic database (dDB),
denoted as dDB1a, dDB1b, dDB2 and dDB3 respectively.
For experimental purposes, the training data will always
be within the separation threshold. Thus they can be
applied to generate one database.
The RSS difference between the data from the
dynamic TPs and those static TPs from Section 4.1 that
are within a certain distance are listed in Table 3. As
signal acquisition is less stable while the receiver is
moving and more disturbance occurs from the collecting
person himself, therefore it can be anticipated that the

dynamic training data is noisier. The RSS difference is
within 15dB up to 3m between the TPs, which is within
the RSS fluctuation range itself. Again, once the distance
is over 4m, the variance drops and correlation fails.
Table 3 RSS Difference between dynamic and static TPs (dB)
1m 2m 3m 4m
ΔRSS 9.85 12.55 13.39 19.36
σ 10.61 10.49 15.91 8.58
Figure 4 show the four different training trajectories
where data is collected in 2-3 second intervals along the
path and the colours specify the RSS of the collected data.
Red indicates high RSS (highest is -30dB) and blue
indicates low RSS (lowest -100dB).
(a) dDB1a AP1a AP1b
(b) dDB1b AP1a AP1b
(c) dDB2 AP1a AP1b
(d) dDB3 AP1a AP1b
Figure 4 Training data from AP1 for all dDB
Due to signal fluctuation, the RSS from one single AP
is always a random value that lies within a range when
collected at a static point. This is the reason why
conventional training requires the receiver to collect RSS
data over a long period of time and record the standard
deviation. However in dynamic training, only one RSS
data can be collected at each location. The final database
could be biased if the RSS fluctuation range is not taken
into account. Another problem in dynamic training is that
some of the signals from certain APs are very weak and
unstable at some locations, hence no data is collected
during dynamic training, resulting in a fingerprint vector
such as
( ) .
These empty RSS vectors are set to -100dB. A large
amount of empty data at a certain location indicates
unstable signal which is usually because the AP is too far
away or too much disturbance in between, thus should
best be ignored in positioning. However, from the training
data, we can see that 5GHz signals reflect more accurately
the signal strength throughout the building with respect to
the AP. On the other hand, the RSS from AP(a) is much
more noisier and can be misleading in reflecting the
locations. The training data for DB3 from AP1a in one of
the rooms varied as much as 30dB, as shown in Figure
4(d).
Figure 5 shows the RSS difference between dDB1a
and sDB of AP1 and AP3. Areas that are not covered by
dynamic training data can be ignored. We can still see
that signal fluctuation and other disturbances cause the
RSS to differ and especially in the area near the AP. The
difference between the 5GHz signal database is also
smaller
(a) AP1a (b) AP1b
(c) AP3a (d) AP3b
Figure 5 RSS Difference between DB and sDB for dDB1a
To improve the data quality of dDB, the training data
from different paths are integrated collaboratively to
generate one database. This enables the combination of
data collected at different locations and also at different
times, denoted as cDB. cDB generates database from
more sufficient data and longer time span. This in result
captures the RSS fluctuation and environment
disturbances.
Collaborative training greatly extends the training data
coverage, such as combining the training data of DB1a
and DB1b. It also increases the RSS data for a small area
of interest. Instead of computing the standard deviation of
the RSS at one single TP as in the conventional method, a
cluster of RSS data within the integration threshold is

regarded to reflect one common location. Therefore, as
more collaborative training data is collected, more RSS
can be found that are within the integration threshold.
This information can then be used to derive the
confidence indicator for specific locations.
4.3 Database results
To analyse the training quality of the dynamic
database, the RSS difference between dDB and sDB as
well as cDB and sDB is compared. First of all, the
fingerprint locations and RSS that are covered by training
points are extracted. In regards to Figure 5, the RSS
difference for all APs between each dDB and sDB is
listed in Table 4.
Table 4 RSS Difference between dDB and sDB (dB)
dDB1a dDB1b dDB2 dDB3
ΔRSS
σ ΔRS
S σ
ΔRSS
σ ΔRS
S σ
1 a 6.60 5.01 8.04 5.28
10.29
5.26 12.8
5
10.81
b 5.60 3.88 9.22 6.33 4.59 3.44 4.99 4.70
2
a 4.02 3.26 4.97 4.54 7.42 6.25 6.64 7.64
b 9.62 8.68 8.40 6.45 16.4
1 9.52 8.28 6.91
3 a 7.67 5.76 7.36 4.81 9.22 6.32 8.67 8.21
b 9.52 7.53 9.68 8.90 6.88 5.17 7.07 6.21
4 a 5.49 3.33
14.39
8.99 8.51 6.07 15.9
7 8.18
b 7.20 5.14 7.71 5.13 4.28 3.35 5.24 4.07
Each dDB lies within the separation threshold
therefore can be combined to generate one database. The
training data for dDB1a and dDB1b are combined to
generate cDB1; dDB1 and dDB2 are combined to generate
cDB2; dDB1, dDB2 and dDB3 are combined to generate
cDB3.
Table 5 lists the mean RSS difference between each
cDB and sDB. The overall RSS difference is reduced
when the training data from different path are combined.
Table 5 RSS Difference between cDB and sDB
cDB1 cDB2 cDB3
ΔRSS σ ΔRSS σ ΔRSS σ
1 a 5.75 6.15 8.45 6.38 3.50 7.89
b 5.48 3.77 4.88 4.23 2.93 4.63
2 a 4.70 3.94 5.30 4.59 1.53 6.52
b 11.01 7.98 8.18 6.96 5.63 6.65
3 a 7.39 5.42 7.19 7.47 5.25 6.36
b 3.98 6.27 6.06 4.70 1.67 4.74
4 a 4.55 3.27 5.30 3.22 7.26 6.43
b 5.70 2.87 6.45 4.74 5.89 4.81
As an example, Figure 6 shows the RSS difference
between DB1a, DB1b and sDB, as well as the RSS
difference of the combine database cDB1 and sDB.
Combining the training data extends the fingerprint
coverage and produces overall fingerprints that agree
better with the ground truth.
(a) DB1a and sDB (b) DB1b and sDB
(c) cDB1 and sDB
Figure 6 RSS Difference between dDB and sDB
However, users in the collaborative network may
come across each other and the collected training data
sometimes lie within the integration threshold. This may
happen at the same time when two users are very close to
each other, or at different times when a user enter an area
where previous data has already been collected by another
user. These data can be integrated to update the database
with a confidence factor based on how much variance is
seen in the data. If the data are collected within a short
period, the variance will be regarded as signal fluctuation.
However, if the timespan lengthens and the RSS
difference between new data and history data remains a
high level, the system should consider discarding the old
data and update the database with new data only. As an
example, the training data for dDB3 for collected in two
parts. Part1 consists of data collected in the first round in
the building and part2 is the collected in the second round.
RSS variance can already by identified between the two
part data.
(a) dDB3 part1 and sDB (b) dDB3 part2 and sDB
(c) d- DB3 and sDB
Figure 7 RSS Difference between dDB3 Parts and sDB (AP4a)
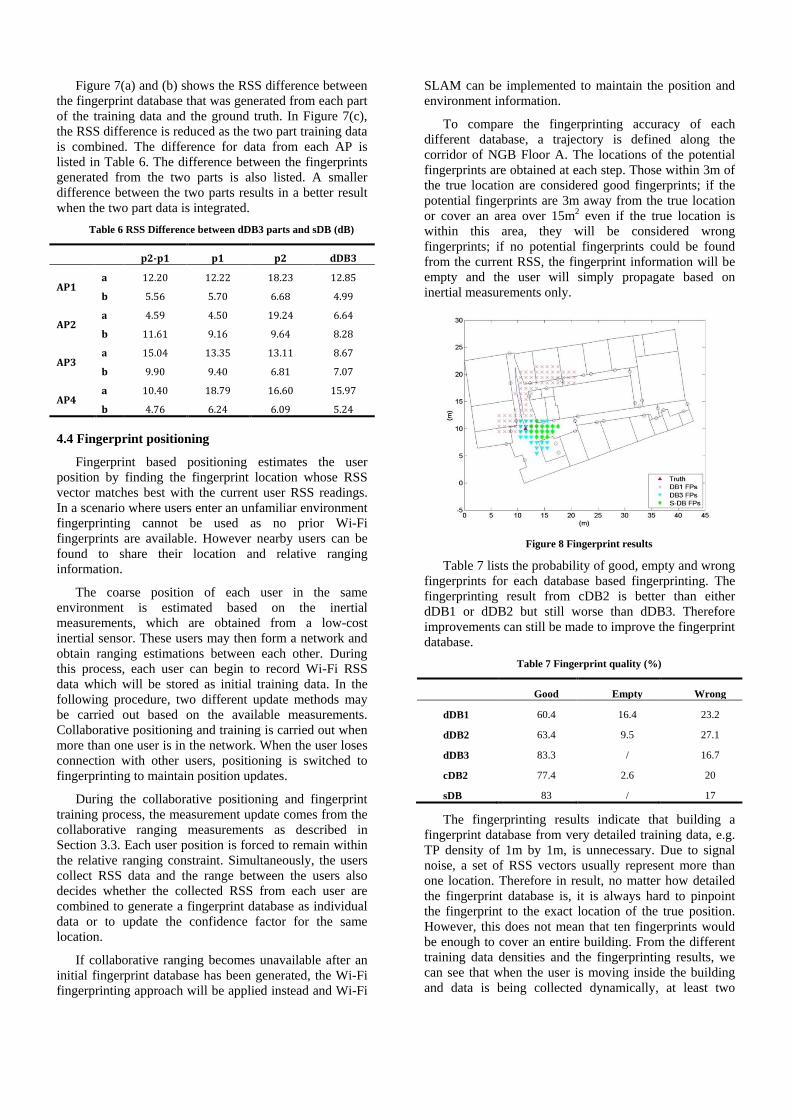
Figure 7(a) and (b) shows the RSS difference between
the fingerprint database that was generated from each part
of the training data and the ground truth. In Figure 7(c),
the RSS difference is reduced as the two part training data
is combined. The difference for data from each AP is
listed in Table 6. The difference between the fingerprints
generated from the two parts is also listed. A smaller
difference between the two parts results in a better result
when the two part data is integrated.
Table 6 RSS Difference between dDB3 parts and sDB (dB)
p2-p1 p1 p2 dDB3
AP1 a 12.20 12.22 18.23 12.85
b 5.56 5.70 6.68 4.99
AP2 a 4.59 4.50 19.24 6.64
b 11.61 9.16 9.64 8.28
AP3 a 15.04 13.35 13.11 8.67
b 9.90 9.40 6.81 7.07
AP4 a 10.40 18.79 16.60 15.97
b 4.76 6.24 6.09 5.24
4.4 Fingerprint positioning
Fingerprint based positioning estimates the user
position by finding the fingerprint location whose RSS
vector matches best with the current user RSS readings.
In a scenario where users enter an unfamiliar environment
fingerprinting cannot be used as no prior Wi-Fi
fingerprints are available. However nearby users can be
found to share their location and relative ranging
information.
The coarse position of each user in the same
environment is estimated based on the inertial
measurements, which are obtained from a low-cost
inertial sensor. These users may then form a network and
obtain ranging estimations between each other. During
this process, each user can begin to record Wi-Fi RSS
data which will be stored as initial training data. In the
following procedure, two different update methods may
be carried out based on the available measurements.
Collaborative positioning and training is carried out when
more than one user is in the network. When the user loses
connection with other users, positioning is switched to
fingerprinting to maintain position updates.
During the collaborative positioning and fingerprint
training process, the measurement update comes from the
collaborative ranging measurements as described in
Section 3.3. Each user position is forced to remain within
the relative ranging constraint. Simultaneously, the users
collect RSS data and the range between the users also
decides whether the collected RSS from each user are
combined to generate a fingerprint database as individual
data or to update the confidence factor for the same
location.
If collaborative ranging becomes unavailable after an
initial fingerprint database has been generated, the Wi-Fi
fingerprinting approach will be applied instead and Wi-Fi
SLAM can be implemented to maintain the position and
environment information.
To compare the fingerprinting accuracy of each
different database, a trajectory is defined along the
corridor of NGB Floor A. The locations of the potential
fingerprints are obtained at each step. Those within 3m of
the true location are considered good fingerprints; if the
potential fingerprints are 3m away from the true location
or cover an area over 15m2 even if the true location is
within this area, they will be considered wrong
fingerprints; if no potential fingerprints could be found
from the current RSS, the fingerprint information will be
empty and the user will simply propagate based on
inertial measurements only.
Figure 8 Fingerprint results
Table 7 lists the probability of good, empty and wrong
fingerprints for each database based fingerprinting. The
fingerprinting result from cDB2 is better than either
dDB1 or dDB2 but still worse than dDB3. Therefore
improvements can still be made to improve the fingerprint
database.
Table 7 Fingerprint quality (%)
Good Empty Wrong
dDB1 60.4 16.4 23.2
dDB2 63.4 9.5 27.1
dDB3 83.3 / 16.7
cDB2 77.4 2.6 20
sDB 83 / 17
The fingerprinting results indicate that building a
fingerprint database from very detailed training data, e.g.
TP density of 1m by 1m, is unnecessary. Due to signal
noise, a set of RSS vectors usually represent more than
one location. Therefore in result, no matter how detailed
the fingerprint database is, it is always hard to pinpoint
the fingerprint to the exact location of the true position.
However, this does not mean that ten fingerprints would
be enough to cover an entire building. From the different
training data densities and the fingerprinting results, we
can see that when the user is moving inside the building
and data is being collected dynamically, at least two
fingerprints is required to cover a regular shaped and
sized room. At least one fingerprint is needed to cover an
area of 10m2 in a corridor or open foyer.
Fingerprint positioning accuracy not only depends on
the accuracy of the database but also the fingerprint
weighting method. Therefore different fingerprinting
methods may vary according to accuracy and positioning
requirements. The database generated from this method
could be specified according to user needs.
5. CONCLUSIONS AND FUTURE WORK
Indoor positioning faces more challenge due to
complicated environment and lack of positioning signals
such as GNSS signals. Therefore a robust indoor
positioning system needs to cope with different
positioning situations adaptively and adjust positioning
methods according to available signals. This paper
introduces a collaborative Wi-Fi fingerprint database
training method which reduces the time and human labour.
The collaborative training method is based on a
collaborative positioning method which positions users
using inertial measurements and relative ranging
information. The fingerprint databases that were
generated by conventional and dynamic methods and
from different training density and location were
compared for database quality as well as positioning
accuracy.
Results show that training for the fingerprint database
simultaneously during collaborative positioning is able to
achieve the same accuracy level as conventional training
method. The proposed cWiDB training method achieves
efficient positioning as multiple users are able to provide
reliable positioning and greatly reduce the training time.
Furthermore, most indoor PDR positioning relies on the
availability of an internal map of the building. This
collaborative approach eliminates the need of such
information thus saves time and manpower. As Wi-Fi
signals develop in recent years, 5GHz signal become
more common in both office and home wireless
connection. Their signal characteristics differ to those
signals in the 2.4GHz band and give better fingerprinting
performance in the indoor environment mostly due to
their shorter ranging ability.
The application of cWiDB also enables the system to
start up without prior knowledge of the Wi-Fi fingerprint
which is useful for users who enter a new environment.
The training data is collected during the positioning
process. Based on the relative distance between the
collected data, the system decides whether to combine the
training data and generate a database with larger coverage
or update old database with new confidence factor.
The system may be further developed so that the RSS
difference between users can be applied to update the
measurement weight during collaborative positioning and
work in a SLAM-like method. This enables further
flexibility between collaborative positioning based on
inertial measurement or Wi-Fi data. The received signal
quality for different devices should also be considered as
this directly affects the integration quality of training data
from different users.
REFERENCE
[1] Harle, R. "A survey of indoor inertial positioning
systems for pedestrians," IEEE Communications Surveys
& Tutorials, vol. 15(3), pp.1281-1293, 2013.
[2] Niculescu, D. and Nath B. "Position and orientation in
ad hoc networks," Ad hoc networks, vol.2(2), pp.133-151,
2004.
[3] Evennou, F. and François M. "Advanced integration
of WiFi and inertial navigation systems for indoor mobile
positioning." Eurasip journal on applied signal
processing, pp.1-11, 2006.
[4] Mok, E. and Cheung, B.K. “An improved neural
network training algorithm for Wi-Fi fingerprinting
positioning,” ISPRS International Journal of Geo-
Information, vol.2, pp.854-868, 2013.
[5] Abdulrahim, K., Hide, C., Moore, T and Hill, C.
"Aiding low cost inertial navigation with building heading
for pedestrian navigation." Journal of Navigation,
vol.64(02), pp.219-233, 2011.
[6] Weimann, F., Abwerzger, G. and Hofmann-Wellenhof,
B. "A pedestrian navigation system for urban and indoor
environments." Proceedings of the 20th International
Technical Meeting of the Satellite Division of The
Institute of Navigation (ION GNSS 2007), 2007.
[7] Kaemarungsi, K. and Krishnamurthy, P. "Analysis of
WLAN’s received signal strength indication for indoor
location fingerprinting." Pervasive and mobile computing,
vol. 8(2), pp.292-316, 2012.
[8] Mok, E. and Retscher, G. "Location determination
using WiFi fingerprinting versus WiFi trilateration."
Journal of Location Based Services, vol.1(2), pp.145-159,
2007.
[8] Leppakoski, H., S. Tikkinen, and J. Takala.
"Optimizing radio map for WLAN fingerprinting."
Ubiquitous Positioning Indoor Navigation and Location
Based Service (UPINLBS), Kirkkonummi, pp.1-8, 2010.
[9] Viel, B. and Asplund, M. "Why is fingerprint-based
indoor localization still so hard?" 2014 IEEE
International Conference on Pervasive Computing and
Communications Workshops (PERCOM Workshops),
pp.443-448, 2014.
[10] Bak, S., Jeon, S., Suh, J., Yu, C. and Han, D.
"Characteristics of a large-scale WiFi radiomap and their
implications in indoor localization," 2013 Fourth
International Conference on the Network of the Future
(NOF), Pohang , pp.1-5, 2013.
[11] Faragher, R.M. and Harle, R.K. “SmartSLAM – an
efficient smartphone indoor positioning system exploiting
machine learning and opportunistic sensing.” Proceedings
of the 24th International Technical Meeting of the Satellite
Division of the Institute of Navigation (ION GNSS+ 2013),
Nashville, 2013.
[12] Ferris, B., Haehnel, D. and Fox, D. "Gaussian
processes for signal strength-based location estimation."
In Proc. of Robotics Science and Systems, 2006.
[13] Dissanayake, M.W.M.G, Newman, P., Clark, S.,
Durrant-Whyte, H.F. and Csorba, M. "A solution to the
simultaneous localization and map building (SLAM)
problem," IEEE Transactions on Robotics and
Automation, vol.17(3), pp.229-241, 2001.
[14] Robertson, P., Puyol, M.G., and Angermann, M.
"Collaborative pedestrian mapping of buildings using
inertial sensors and FootSLAM." Proceedings of the 24th
International Technical Meeting of the Satellite Division
of the Institute of Navigation (ION GNSS 2011), Portland,
2011.
[15] Jing, H., Pinchin, J., Hill, C. and Moore, T. “A novel
weighting approach to collaborative indoor positioning.”
Proceeding of European Navigation Conference (ENC-
GNSS 2014), Rotterdam, 2014
[16] Chan, L., Chiang, J., Chen, Y., Ke, C., Hsu, J. and
Chu, H. "Collaborative localization: Enhancing WiFi-
based position estimation with neighborhood links in
clusters." Pervasive Computing, vol.3968, pp. 50-66,
2006.
[17] Rasmussen, C. and Williams, C. "Gaussian Processes
For Machine Learning," MIT Press, 2006.
[18] Liu, W., Chen, Y., Xiong, Y. and Sun, L.
“Optimization of sampling cell size for fingerprint
positioning.” International Journal of Distributed Sensor
Networks, 2014.