jet-mixing for the production of monodisperse silver
TRANSCRIPT

Jet-Mixing for the Production of Monodisperse Silver Nanoparticles Using Reduced Amounts of Capping Agent
Journal: Reaction Chemistry & Engineering
Manuscript ID RE-ART-04-2019-000152
Article Type: Paper
Date Submitted by the Author: 08-Apr-2019
Complete List of Authors: Ranadive, Pinaki; Ohio State University, Chemical and Biomolecular EngineerParulkar, Aamena; Ohio State University, Chemical and Biomolecular EngineeringBrunelli, Nick; Ohio State University, Chemical and Biomolecular Engineer
Reaction Chemistry & Engineering

1
Jet-Mixing for the Production of Monodisperse Silver Nanoparticles Using Reduced Amounts of 1
Capping Agent 2
Authors: Pinaki Ranadive, Aamena Parulkar, and Nicholas A. Brunelli * 3
Author address: The Ohio State University, William G. Lowrie Department of Chemical and 4
Biomolecular Engineering, 151 W. Woodruff Ave., Columbus, OH 43210 5
*Corresponding author: [email protected]; Twitter: OSUChemEProfBru 6
Abstract 7
Commonly used batch reactors for nanomaterial synthesis can be difficult to scale since rapid 8
particle nucleation and growth require efficient mixing to produce monodisperse particle size distributions 9
(PSD). Monodisperse particles can be synthesized through efficiently mixing the reactants in the liquid 10
phase using a jet-mixing reactor. Using common synthesis precursors and concentrations, the jet-mixing 11
reactor produces silver nanoparticles with a diameter of 5±2 nm, as characterized by TEM, and a 12
monomodal surface plasmon resonance (SPR) in the UV-vis spectrum. In comparison, a batch synthesis 13
using the same concentrations of reactants produces nanoparticles with a diameter of 9±4 nm and bimodal 14
SPR, indicating that jet-mixing produces a more monodisperse particle size distribution than batch 15
synthesis. For the jet-mixing synthesis, the concentration of the capping agent can be reduced to a value of 16
0.05 mM while retaining a narrow full-width of half-maximum (FWHM) of the SPR spectrum. 17
Interestingly, decreasing the capping agent quantity from the standard concentration of 0.2 mM to 0.05 mM 18
decreases the FWHM of the SPR, corresponding to a more monodisperse PSD at lower capping agent 19
concentration. This result is attributed to the increased stabilization at lower ion concentrations in the 20
solution. For low capping agent concentrations, additional experiments adding small amounts of sodium 21
nitrate support this observation. Overall, the jet-mixing reactor represents a viable system for the continuous 22
production of size-controlled silver nanoparticles with reduced amounts of capping agent. 23
Keywords: Jet-mixing reactor; Ag nanoparticles; Continuous synthesis; Nanomanufacturing; Capping 24
agent 25
26
Page 1 of 30 Reaction Chemistry & Engineering

2
1. Introduction 27
Important materials discoveries continue to emerge as the ability to generate nanomaterials with 28
exquisite control on the lab scale advances. However, translating these exciting discoveries into commercial 29
processes offers considerable challenge, especially because of the difficulties associated with scalability of 30
small-scale synthetic techniques. Indeed, many of these nanomaterials are synthesized in small scale batch 31
processes that allow precise control over many important synthetic conditions, including reaction 32
temperature, mixture composition, and other parameters that can affect the final size distribution and even 33
the morphology of the nanoparticles (NPs) formed.1 The mixing dynamics in the reaction system directly 34
influence the ability to control these parameters. For small scale synthesis, it is possible to control these 35
different parameters sufficiently to produce nanomaterials with a monodisperse particle size distribution 36
(PSD). However, scaling up these syntheses to produce larger quantities of nanomaterials often results in 37
complications since controlling synthetic parameters for batch methods when operating at larger length 38
scales is difficult.2 Thus, it remains a challenge to develop methods for the scalable manufacturing of 39
nanoparticles with the same quality as achieved in small-scale synthesis. 40
The synthesis of nanomaterials is commonly accomplished using liquid-phase methods. Since 41
liquid-phase methods are broadly applicable to many materials,3 advances in nanomaterial synthesis can be 42
achieved through investigating a single material. A convenient system to investigate is the production of 43
silver nanoparticles. Silver nanoparticles have many applications, including as biosensing and bio-imaging 44
agents,4,5 catalysts in several reactions, and anti-microbial additives.5,6 Silver nanoparticles are a convenient 45
system to investigate since they exhibit localized surface plasmon resonance (SPR), in which the interaction 46
of light with the electrons in the conduction band of an Ag particle results in a specific resonant oscillation.7 47
The frequency of this oscillation provides information about several properties of the NP colloid, including 48
particle size and shape.8,9 The frequency falls into the visible range of the electromagnetic spectrum for 49
nanomaterial systems such as Ag and Au, and hence can be characterized by UV-vis spectroscopy. 50
Interestingly, the extent of broadness of the SPR spectrum, measured by its full width at half maximum 51
Page 2 of 30Reaction Chemistry & Engineering

3
(FWHM), is indicative of the polydispersity of the sample.10 Generally, a broader PSD will have a larger 52
FWHM in the UV-vis spectrum. 53
Typically, these metal nanoparticles are synthesized by the injection of a reducing agent into a 54
solution containing a nanoparticle precursor to induce nanoparticle nucleation and growth.3 Each of the 55
components in the mixture needs to be balanced carefully since the concentration of each can impact the 56
final product properties, including the particle size and the PSD. Controlling the PSD is often important 57
since the NP performance is often a function of size. Although not all applications require monodisperse 58
PSDs,11 most applications benefit from having monodisperse particle sizes. For example, a recent study 59
demonstrated that large Ag nanoclusters were more selective for the partial oxidation of propylene.12 In 60
addition to the performance of NP, a uniform PSD can also affect the stability of NP solutions. A 61
monodisperse PSD tends to increase the colloidal stability of the distribution post-synthesis according to 62
derivations of the classical nucleation theory (CNT), limiting particle growth phenomena such as Ostwald 63
ripening.3 This can be important as the colloidal stability can affect the shelf life for these materials. 64
Synthesizing NPs with a well-characterized and stable PSD can be challenging since the PSD can 65
broaden either during or after the synthesis, making it necessary to prevent aggregation and Ostwald 66
ripening from altering the PSD. Two common methods to control PSD are using reverse micelles and using 67
capping agents.13–16 Reverse micelles utilize surfactants to produce a bi-phasic system consisting 68
predominantly of an organic phase with dispersed droplets of an aqueous phase containing the reactants. 69
The organic medium between micelles isolates NPs, preventing agglomeration15 and allowing control over 70
the final particle size.16 However, the requirement of an organic solvent makes reverse micelles biologically 71
and environmentally less friendly. In contrast, nanoparticle synthesis can be accomplished in a single phase 72
through utilizing capping agents. Capping agents are ionic species or bulky molecules that provide an 73
electrostatic or steric barrier, respectively, between individual NPs in solution to prevent agglomeration. 74
This method is a preferred choice in toxicity studies17 and is also used by commercial vendors.12,13 75
The beneficial aspects of utilizing a capping agent needs to be balanced with the cost of the capping 76
agent when considering the scalable manufacture of nanomaterials. From an economic perspective, the 77
Page 3 of 30 Reaction Chemistry & Engineering
4
amount of capping agent utilized should be the minimum that can produce the desired product quality. From 78
a scientific perspective, the concentration of the capping agent plays an important role in determining NP 79
stability. At too low of a capping agent concentration, the surface of the NPs is not sufficiently “capped” 80
and aggregation takes place because of van der Waals attraction. Interestingly, it can be problematic to use 81
an excessive amount of capping agent since many common capping agents like trisodium citrate (TSC) are 82
ionic. At high concentrations, the capping agent can dissociate in solution, increasing the ion concentration 83
of the solution. According to the DLVO theory, high ion concentration can lower the electrostatic barrier 84
between two particles, promoting aggregation.18,19 Hence, it is hypothesized that there is a “just right”20 85
concentration of capping agent at which NPs may remain stable. At this intermediate concentration, steric 86
or electrostatic repulsion prevents aggregation, leading to stable colloidal nanoparticles in solution. Besides 87
affecting NP stability, capping agents remaining in solution can also have other undesired effects such as 88
altering the particle morphology1,21 or hindering catalytic activity.22 Most importantly, considering the 89
holistic goal of scaling up NP syntheses, reducing the amount of capping agent used can reduce the overall 90
process cost. Hence, it is desirable to optimize the amount of capping agent used for synthesizing a 91
monodisperse PSD. Current synthetic methods report utilization of capping agent concentrations that are 92
equal to or higher than the concentration of metal precursor in solution.10,13,16–22 It is unclear if this 93
concentration represents an optimum for the synthesis or is the concentration required for batch processes 94
to maintain a narrow PSD. 95
In addition to using an optimal amount of capping agent, a narrow PSD requires creating uniform 96
reaction conditions to enable uniform nucleation and growth. Uniform conditions can be generated through 97
inducing intense mixing to reduce the timescale for mixing (tmix) below the timescale for reaction (treaction). 98
For solution-phase Ag NP synthesis, the process involves the reduction of Ag+ ions to Ag0 atoms that 99
nucleate and grow to form NPs. The reduction is commonly achieved through using a reducing agent33 such 100
as NaBH434–37 that is highly active and reacts on the timescale of milliseconds.38 This rapid reaction time 101
makes it necessary to create intense mixing so that uniform reaction conditions can be obtained. When 102
Page 4 of 30Reaction Chemistry & Engineering
5
scaling up the batch process, it is challenging to generate the intense mixing necessary to produce a narrow 103
PSD, often resulting in batch-to-batch variability. 39,40 104
Efficient mixing requires controlling the process at all spatial scales, including macromixing, 105
mesomixing, and micromixing.41 Macromixing refers to achieving composition homogeneity within the 106
bulk of the fluid, mesomixing occurs at the different scales of eddies in the fluid, and micromixing at the 107
molecular level between fluid lamellae. Each spatial scale has an associated time-scale that add in series to 108
comprise the overall tmix. In a batch reactor, the volume is large enough that the overall mixing process can 109
be limited by macromixing.2 Poor macromixing for batch reactors can cause non-uniformity in the reactant 110
concentrations and temperature throughout the volume of the batch. Hence, fast reactions such as redox or 111
neutralization reactions, progress with different rates spatially in the reactor,42 resulting in a wide PSD for 112
NP synthesis solutions. From previous work for colloidal syntheses, a direct link exists between tmix and 113
the PSD of the NPs synthesized.43 The importance of macromixing can be mitigated through reducing the 114
dimensions of the reactor as is possible in microfluidic and millifluidic devices.44 Microfluidic technologies 115
for nanoparticle synthesis take advantage of the small tmix that is a result of their compact volume.45,46 While 116
continuous flow microfluidic devices can obviate macromixing, it is still important to achieve efficient 117
mesomixing and micromixing when using highly active reducing agents. 118
Several continuous syntheses at both ambient conditions and high temperatures, and in gas and 119
liquid phase, have been explored for Ag NPs.28,32,47–55 Two notable geometries are a coaxial mixing system 120
and an impinging jet reactor. The coaxial mixing system used high flow rates to increase mixing and 121
produce nanoparticles48 that would be promising if issues with radial mixing can be overcome. Impinging 122
jet reactor was able to prevent clogging, but the size distribution obtained by the continuous process was 123
broad.49 Continuous flow synthesis of nanomaterials would be promising if the reactor could achieve better 124
mixing dynamics. Another reactor type, the segmented flow reactor is known to offer a narrow size 125
distribution because of minimized axial dispersion, but liquid cross-mixing between individual segments 126
because of menisci on the walls may actually broaden the PSD.52,56 Recently, our research group 127
Page 5 of 30 Reaction Chemistry & Engineering

6
demonstrated the continuous synthesis of zeolitic imidazolate frameworks (ZIFs) using a continuous jet-128
mixing reactor.57 The jet-mixing reactor enabled efficient mixing for the rapid nucleation and growth of 129
ZIFs, resulting in narrow PSD that caused the ZIFs to be stable colloidal suspensions. The jet-mixing reactor 130
also had a small reactor volume that efficiently synthesized the nanomaterials with high yields and high 131
productivities. 132
In this work, the jet-mixing reactor is used to synthesize Ag NPs in a continuous manner. The 133
nanoparticles are analyzed using common characterization methods, including transmission electron 134
microscopy (TEM), Ultraviolet-visible absorption (UV-vis) spectroscopy, and dynamic light scattering 135
(DLS). The properties of Ag NPs obtained by batch synthesis are compared to those obtained by jet-mixing 136
synthesis. Both the batch and jet-mixing synthesis are examined for batch-to-batch variability. For the jet-137
mixing reactor, the effect of the flow rate, the concentration of the reducing agent, and the capping agent 138
on the PSD of Ag NPs is examined. With jet-mixing reactor, a reduced capping agent concentration is found 139
to be sufficient to stabilize the nanoparticles. To understand the stabilization, experiments are conducted to 140
study the effect of the ion concentration of the solution. Overall, this work demonstrates that the jet-mixing 141
reactor is a promising continuous system for the synthesis of silver nanoparticles. 142
2. Experimental Methods 143
2.1. Chemicals 144
All chemicals are used as received without further purification, including: silver nitrate (AgNO3; 145
>99%, ACS grade; VWR Life Science), trisodium citrate dihydrate (TSC; > 99%, ACS grade, BDH 146
Chemicals), sodium nitrate (NaNO3; 98% Beantown Chemical), and sodium borohydride (NaBH4) solution 147
(12 wt%) in 14 M NaOH (Sigma Aldrich). All solutions are prepared using deionized (DI) water. 148
2.2. Reactor design 149
The design of the reactor has been adapted from a gas-phase synthesis58 and has been used by our 150
group for successful ZIF-8 synthesis in liquid phase.57 The reactor design and assembly are shown in Figure 151
1. The reactor is manufactured in-house from a thermally and chemically resistant polyether ether ketone 152
(PEEK) cube (1” x 1” x 1”). The cube consists of three cylindrical flow channels (one main line and two 153
Page 6 of 30Reaction Chemistry & Engineering

7
jets) that intersect in a perpendicular manner in the center of the device. A flow channel with diameter 154
(dmain) of 0.04 inch (1.02 mm) goes through the entire length of the reactor and is called the main line. Two 155
identical jet lines with a diameter (djet) of 0.02 inch (0.51 mm) impinge perpendicularly at the center of 156
device with the main line. Although the jets impinge from opposite sides of the main line, both jet lines are 157
drilled starting from one side of the cube to ensure that the jet lines are properly aligned, as has been done 158
for confined impinging jet reactors.41 The channels are threaded at the ends to enable connection of clear 159
polytetrafluoroethylene (PTFE, ID 0.03”) tubing using appropriate microfluidic PEEK fittings. The main 160
line delivers the reducing agent solution while the jet-line delivers the silver substrate and capping agent 161
solution. The reactants are pumped using two KD Scientific 100KD syringe pumps. For the jet lines, a Y-162
adapter is used to split the flow from the syringe pump into two streams, each of which connects to one of 163
the jets. From control experiments, it has been determined that Ag NP synthesis is insensitive to differences 164
in flow between the two jets (Section 5). The combined jet lines and main line flows comprise the product 165
solution that flows out downstream of the reactor. The outlet product stream is collected in a flask covered 166
with aluminum foil and stored in an ice bath. 167
2.3. Batch synthesis of silver nanoparticles (Ag NPs) 168
Initial studies involve comparing Ag NPs synthesized using concentrations utilized for batch 169
methods reported previously.36,59 For the Ag NP synthesis, an aqueous solution of 0.2 mM AgNO3 and 0.2 170
mM TSC is prepared at room temperature. An equal volume of aqueous solution of 0.6 mM NaBH4 is 171
prepared. The NaBH4 solution is prepared in an ice bath and cooled for 20 minutes before use. All batch 172
experiments are carried out in a 250 mL round-bottom flask. In a standard batch synthesis, 50 mL of the 173
NaBH4 (0.6 mM) solution that has been cooled is placed in the 250 mL flask and stirred at 200 RPM using 174
a PTFE-coated stir bar. To this solution is added the AgNO3 and TSC solution (50 mL). As previous 175
literature reports, stirring is stopped after 2 minutes and the solution is stored in the refrigerator at 4-6°C.16,60 176
Further details on the synthesis procedure can be found in the supplementary information (Section 1). A 177
different order of reagent addition involving the addition of the NaBH4 solution to the AgNO3 and TSC 178
Page 7 of 30 Reaction Chemistry & Engineering

8
solution in batch, was also tested. Both methods produce comparable nanoparticles, as suggested by the 179
UV-vis spectra in Figure S14. 180
2.4. Flow synthesis of silver nanoparticles using a jet-mixing reactor 181
The standard jet-mixing synthesis is performed using a solution with concentrations of 0.2 mM 182
AgNO3 and 0.2 mM TSC in water and a separate solution with 0.6 mM NaBH4 in water. The solutions are 183
loaded into separate syringes. The syringe with NaBH4 is connected to the main line and the silver salt and 184
TSC solution is connected to the jet line. For the standard experiment, the syringe pumps are set to a flow 185
rate of 48 mL/h. These are the flow rates that are determined to provide sufficiently intense mixing to 186
produce a monodisperse PSD, as shown in the supplementary information in Figure S1. The experiment to 187
find these flowrates is described in the SI (Section 2). The beaker in which the jet-mixing product is 188
collected is placed in an ice bath. The collection beaker in jet-mixing or the round-bottom flask in batch are 189
both covered with aluminum foil to limit photolytic reduction of AgNO3.60 Further details on the synthesis 190
procedure can be found in the SI (Section 1.1 and 1.3). 191
2.5. Material characterization 192
All analyses are performed within one hour of synthesis. The product Ag NP solution is 193
characterized primarily via UV-vis, DLS, and TEM. UV-vis analysis is performed using a ThermoFisher 194
Evolution 300 UV-vis spectrophotometer with a Xenon lamp using a bandwidth of 2 nm and a scan speed 195
of 600 nm/min. After the particles have been synthesized, the product solution (1 mL) is diluted with DI 196
water (1 mL) in a 1 cm pathlength quartz cuvette. Fifteen minutes after synthesis, the UV-vis spectrum for 197
the sample is recorded. The data are analyzed through fitting the data to determine the wavelength 198
maximum (λmax) and the full width at half maximum (FWHM) of the UV-vis spectrum, as described in the 199
supplementary information (Section 3). The PSD is also investigated using DLS analysis using a 200
Brookhaven Instruments Corporation BI-200SM Goniometer. The sample (1 mL) is filtered using a 0.2 μm 201
PTFE syringe filter before DLS is performed using a 637 nm laser beam at a detector angle of 90° with a 202
dust cut-off of 20 µm. The solvent is set as water and the temperature at 20°C. Three runs are conducted 203
for each sample with the average being recorded to calculate the PSD. Analysis is done via the Brookhaven 204
Page 8 of 30Reaction Chemistry & Engineering

9
Instruments Dynamic Light Scattering software. For most samples, the PSD is corroborated through using 205
a FEI Tecnai G2 Spirit TEM at a voltage of 80 kV and magnification of 115,000x in bright-field mode. 206
TEM samples are prepared on 150 mesh holey-carbon copper grids by dropping 15 μL of sample on the 207
grid 1 hour after collection and letting dry for up to 2 hours in a partially covered Petri dish to prevent 208
contamination. Particle size analysis is performed using ImageJ software.61 More information about the 209
analysis is included in the supplementary information (Section 3). 210
3. Results and Discussion 211
3.1. Theoretical comparison of the mixing time scales in the batch and jet-mixing reactor 212
The mixing time (τmix) can be estimated for an idealized turbulent mixer as: 213
𝜏#$% = 3.3 *𝑀𝐿-
𝑃 /
01
(1) 214
Where, M is the mass of fluid in the dissipation region, L is the characteristic length of the dissipation 215
region, and P is the mechanical power introduced into dissipation volume. The power input into the system 216
is the total kinetic energy of the incoming main line (diameter, 𝑑#6$7 = 0.04") stream with flowrate Q0 217
and velocity v0, and the incoming jet line (diameter, 𝑑;<= = 0.02") stream with total flowrate Q1 and 218
velocity v1. Hence, P can be expressed as: 219
𝑃 = ∑𝜌𝑣$-𝑄$
(2) 220
L can be estimated as the diameter of the jet line. Combining these into (1), τmix can be expressed as: 221
𝜏#$% = 3.3
⎝
⎜⎛132𝜋
-𝑑#6$7- 𝑑;<=1
𝑄G1
𝑑#6$7H +4𝑄01
𝑑;<=H ⎠
⎟⎞
01
(3) 222
For the standard flowrates (Q0 = Q1 = 48 mL/h) used for synthesis, the estimated τmix is 22 ms. 223
In comparison, it has been estimated that for a 250 mL cylindrical flask (diameter = 55 mm), the time for 224
95% mixing of a water-like fluid with a 2.5 cm magnetic stir-bar at 500 RPM, is τmix = (8.3±1.4) s. This 225
Page 9 of 30 Reaction Chemistry & Engineering
10
suggests that for Ag NP synthesis, the τmix for the batch reactor is over two orders-of-magnitude slower than 226
for the jet-mixing reactor operating at standard conditions. 227
Experimentally, it is found that increasing the mixing time in the jet-mixing reactor by operating at 228
a main line and jet line flowrate of 2 mL/h with standard reagent concentrations results in an Ag NP sample 229
that has a UV-Vis spectrum with its FWHM approaching that of a standard Ag NP batch, suggesting that 230
the mixing time plays an important role in Ag NP monodispersity. The plot comparing the UV-Vis spectra 231
for the jet-mixing sample at 2 mL/h and the standard batch sample is shown in Figure S1. 232
3.2. Standard batch and jet-mixing synthesis 233
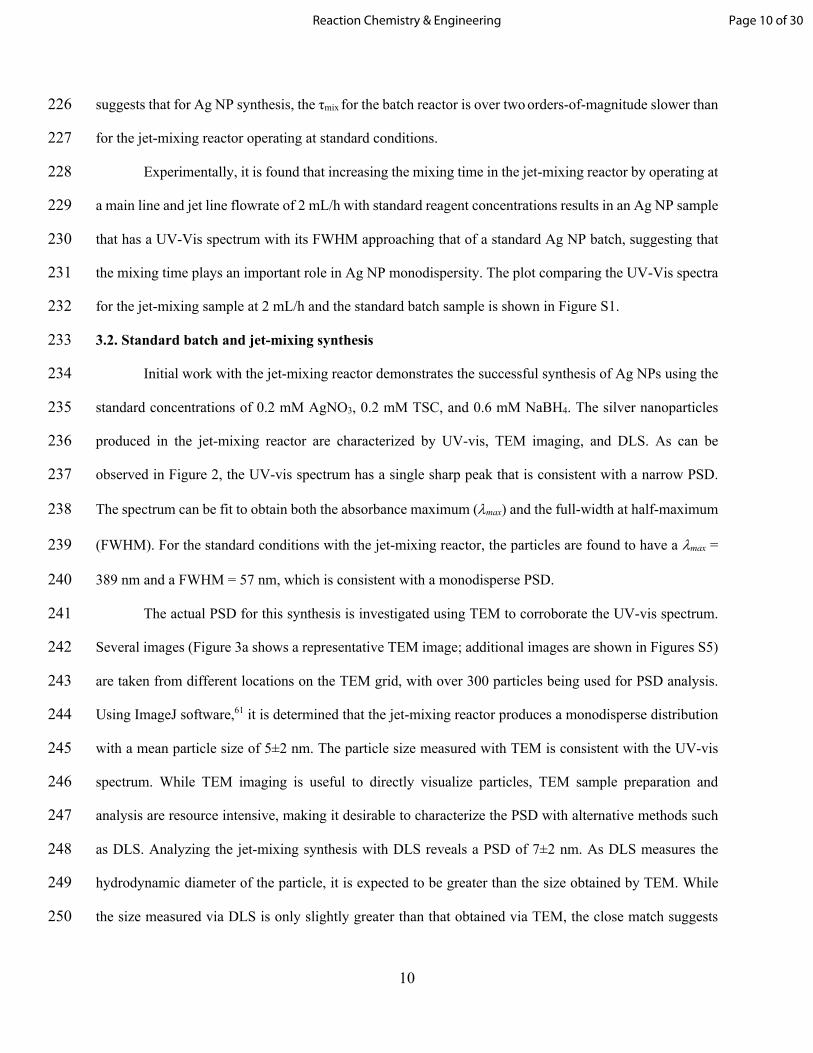
Initial work with the jet-mixing reactor demonstrates the successful synthesis of Ag NPs using the 234
standard concentrations of 0.2 mM AgNO3, 0.2 mM TSC, and 0.6 mM NaBH4. The silver nanoparticles 235
produced in the jet-mixing reactor are characterized by UV-vis, TEM imaging, and DLS. As can be 236
observed in Figure 2, the UV-vis spectrum has a single sharp peak that is consistent with a narrow PSD. 237
The spectrum can be fit to obtain both the absorbance maximum (lmax) and the full-width at half-maximum 238
(FWHM). For the standard conditions with the jet-mixing reactor, the particles are found to have a lmax = 239
389 nm and a FWHM = 57 nm, which is consistent with a monodisperse PSD. 240
The actual PSD for this synthesis is investigated using TEM to corroborate the UV-vis spectrum. 241
Several images (Figure 3a shows a representative TEM image; additional images are shown in Figures S5) 242
are taken from different locations on the TEM grid, with over 300 particles being used for PSD analysis. 243
Using ImageJ software,61 it is determined that the jet-mixing reactor produces a monodisperse distribution 244
with a mean particle size of 5±2 nm. The particle size measured with TEM is consistent with the UV-vis 245
spectrum. While TEM imaging is useful to directly visualize particles, TEM sample preparation and 246
analysis are resource intensive, making it desirable to characterize the PSD with alternative methods such 247
as DLS. Analyzing the jet-mixing synthesis with DLS reveals a PSD of 7±2 nm. As DLS measures the 248
hydrodynamic diameter of the particle, it is expected to be greater than the size obtained by TEM. While 249
the size measured via DLS is only slightly greater than that obtained via TEM, the close match suggests 250
Page 10 of 30Reaction Chemistry & Engineering

11
that the combination of UV-vis and DLS can be used to characterize the silver nanoparticles with TEM 251
providing corroborating evidence. The DLS data are shown in Figure S6 and Table S2. 252
For comparison, the standard synthesis concentrations are used in a batch process and result in the 253
formation of nanoparticles. These are characterized using UV-vis (Figure 2), TEM (Figure 3b), and DLS 254
(Figure S6 and Table S2). The UV-vis spectrum is shown in Figure 2. Similar to the jet-mixing sample, the 255
UV-vis spectrum has a prominent surface plasmon resonance (SPR) peak, confirming the synthesis of Ag 256
NPs. While the UV-vis spectrum has a sharp peak at a lmax = 389 nm, it also has a shoulder at 410 nm. 257
Since it is generally established that a longer wavelength of absorption corresponds to a larger particle size29 258
or a non-spherical morphology,23 the shoulder in the UV-vis spectrum suggests the coalescence of particles. 259
Comparing the nanoparticles made with the batch and the jet-mixing, the two spectra have similar 260
intensities, but the batch synthesis results in a bimodal distribution with a broader UV-vis spectrum. These 261
batch samples are also investigated with TEM to determine the PSD, as shown in Figure 3b. From 262
multiple TEM images, the PSD calculated from analyzing over 300 particles is found to be 9±4 263
nm. Consistent with the UV-vis data, this PSD appears to have a primary particle population 264
around 8 nm and an extended tail of larger particles between 16 nm. In addition to Figure 3b, other 265
TEM images used for PSD calculation using ImageJ are shown in Figure S7. The PSD from DLS 266
is 13±3 nm, which is comparable with the PSD determined from TEM images. The DLS data are 267
shown in Figure S6 and Table S2. 268
In comparison to batch synthesis, the jet-mixing reactor produces a more uniform PSD, as is 269
evidenced by comparing the size distribution obtained from TEM. This observation indicates the τmix is 270
important consideration for Ag NPs. It is thought that a secondary stage of particle formation avoided by 271
using jet-mixing in comparison to batch, as indicated by the UV-vis spectra of the samples produced using 272
the two methods. Further, it is observed that the jet-mixing synthesis produces a smaller mean particle size 273
than the batch process. This is attributed to the efficient micromixing in the jet-mixing reactor that creates 274
uniform nucleation conditions that induces a higher rate of nucleation. Since the total available silver 275
Page 11 of 30 Reaction Chemistry & Engineering

12
substrate is limited, the formation of a greater number of nuclei results in the growth of the nuclei being 276
stoichiometrically limited. This observation of a smaller particle size being produced via microreactor 277
synthesis as compared to batch, has been reported for other microfluidic Ag NP syntheses.37,62 The obtained 278
sizes for the batch and jet-mixing synthesis are in agreement with those previously reported in 279
literature.37,48,49,62–64 NaBH4 being among the more active reducing agents typically results in faster reaction 280
kinetics, leading to rapid nucleation and a small particle size (<10 nm). Among the microfluidic syntheses 281
with a mean size of 3 – 5 nm, the standard deviation obtained varies between 30 – 50%. The PSD obtained 282
from the jet-mixing reactor for standard operating conditions falls within this range. 283
Along with monodispersity, another important consideration for the synthesized Ag NPs is particle 284
yield. The absorbance associated with the SPR peak of the Ag NPs, obtained from the UV-vis spectrum, 285
can be correlated with NP concentration using Beer’s law.29 Using this method, the yield for the batch and 286
jet-mixing synthesis is calculated to be 88% and 82% respectively, suggesting that the material efficiency 287
of the two processes is comparable. The detailed calculation of yield is outlined in the supplementary 288
information in Section 4. 289
3.3. Reproducibility tests for the jet-mixing synthesis 290
One of the main advantages of a flow synthesis over a batch synthesis is the potential to achieve 291
greater reproducibility in the synthesis conditions (i.e., mixing) to eliminate batch-to-batch variability. 292
Specifically, it is desirable to demonstrate that the reactor performs (1) stably over a single continuous test 293
and (2) consistently across different tests. For Ag NPs, UV-vis is a facile method to test variability between 294
properties across different samples by comparing the lmax and FWHM of the SPR absorbance peak. 295
Initially, the continuous steady-state operation of the jet-mixing reactor is tested by checking the 296
variability within a single continuous run. The UV-vis spectra from a standard jet-mixing Ag NP synthesis 297
over its run-time (i.e., start of the synthesis to end of the synthesis) are monitored, to ensure that the Ag 298
NPs synthesized in a continuous run have similar properties at different sampling times. The product 299
solution from an hour-long run is collected intermittently every 15 minutes and analyzed by UV-vis after 300
Page 12 of 30Reaction Chemistry & Engineering
13
collection. The absorbance, lmax and FWHM are noted for each sample. The UV-vis spectra overlap for 301
each sample collected (samples S1 to S5) shown in Figure 4, indicating that Ag NPs with similar properties 302
are formed at all times. Quantitatively, the standard deviation of the properties of the UV-vis spectra 303
between the various samples is <5%, corroborating the uniformity in Ag NP properties. The data are 304
reported in Table S3. 305
Next, multiple batch and jet-mixing runs with the standard reagent concentrations are conducted to 306
compare the variability across the runs for the two synthesis methods using the standard conditions for each 307
method. Each synthesis is analyzed by UV-vis. It is observed that for batch synthesis, the UV-vis spectra 308
vary from batch to batch despite efforts to maintain all synthesis parameters constant. This is qualitatively 309
indicated by Figure 5a for four different runs attempted using identical conditions. Quantitatively, the 310
variability between batches is greater than 5% for the FWHM and the intensity of the UV-vis spectrum, as 311
indicated by the standard deviation of the parameters for all runs. The quantitative variability in these 312
parameters is provided in Table S4. A similar experiment with the jet-mixing reactor shows lesser 313
variability between four identical runs, as is qualitatively shown in Figure 5b, demonstrating its ability to 314
produce Ag NPs with consistent properties over multiple separate runs. The quantitative variability in these 315
parameters is provided in Table S5. It is hence concluded that jet-mixing results in more reproducible 316
synthesis of Ag NPs with monodisperse narrow PSD as compared to batch synthesis. 317
3.4. Effect of synthesis parameters in jet-mixing synthesis 318
The synthesis of nanoparticles can be tuned by modifying several reaction parameters for jet-319
mixing synthesis, the sodium borohydride concentration ([NaBH4]) and the capping agent concentration 320
([TSC]). From a commercial perspective, it is desirable to minimize the amounts of the different 321
components to reduce cost while still maintaining product quality. The reducing agent influences the 322
reaction rate. Excess reducing agents increase synthesis cost and may also contribute to higher ion 323
concentration in solution, causing eventual agglomeration of NPs.65 To determine if an optimum 324
concentration for NaBH4 exists to achieve monodisperse Ag NPs while limiting the reagent concentration 325
used, the standard jet-mixing synthesis is performed by varying the NaBH4 concentrations between 326
Page 13 of 30 Reaction Chemistry & Engineering
14
0.03 mM, the stoichiometric amount48 to 2.4 mM. The concentrations of AgNO3 and TSC are maintained 327
at 0.2 mM each. It is observed that the FWHM narrows when using increasing concentrations of NaBH4. 328
The most significant decrease in FWHM occurs for low NaBH4 concentrations whereas the FWHM changes 329
less above a NaBH4 concentration of 0.6 mM. This suggests that the standard concentration of NaBH4 used 330
for this work (0.6 mM) is effective. A summary of the FWHMs calculated from the UV-vis spectra of all 331
runs for varying NaBH4 concentration are reported in Table S6. 332
The second parameter investigated is the effect of capping agent concentration on NP synthesis. 333
The capping agent represents an important component to help stabilize nanoparticles in solution and prevent 334
agglomeration. An optimum capping agent concentration has also been previously reported for Ag NP batch 335
synthesis.19 In a synthesis in which TSC acts solely as the capping agent, it is shown that varying the 336
concentration of TSC from 0.05 mM to 1.5 mM results in agglomeration at low concentrations, coalescence 337
at high concentrations, and an intermediate concentration of the order of 0.1 mM results in NPs with a 338
narrow PSD. However, other works show a linear trend where the PSD is seen to increase or stay constant 339
with increase in the TSC concentration.62 340
For the jet-mixing reactor, the effect is studied of TSC concentration on PSD of Ag NPs. The 341
standard jet-mixing Ag NP synthesis is performed using different concentrations of TSC, ranging from 1 342
μM to 0.8 mM. Each sample is analyzed by UV-vis, and the FWHM of the spectrum is calculated, as shown 343
in Figure 6. It is observed that the FWHM decreases as the concentration of TSC is increased from 0.001 344
mM to 0.05 mM and increases again as the TSC concentration is increased further. The summary of 345
FWHMs obtained for multiple jet-mixing runs conducted for different capping agent concentrations has 346
been listed in Table S7. Comparing this result to many different reported Ag NP 347
syntheses,10,13,16,23,25,26,28,31,32 the jet-mixing reactor is able to produce uniform Ag NPs with a low molar ratio 348
of capping agent to silver substrate, as shown in Figure 7. The concentration of capping agent that results 349
in the narrowest FWHM is 0.05 mM. This is less than the typical concentration used for typical batch 350
synthesis by a factor of four. 351
Page 14 of 30Reaction Chemistry & Engineering
15
It is interesting to investigate how the batch synthesis performs at the optimum concentration 352
obtained for jet-mixing. A batch synthesis comparable to the jet-mixing synthesis at 0.05 mM TSC is carried 353
out and analyzed by UV-vis. The spectrum obtained for batch is compared against that for jet-mixing in 354
Figure 8. For the batch synthesis using 0.05 mM capping agent, the synthesis mixture has a UV-vis spectrum 355
is bi-modal, suggesting that insufficient TSC is present to prevent agglomeration. However, the jet-mixing 356
synthesis remains monomodal at 0.05 mM TSC. This observation is supported by representative TEM 357
images of batch and jet-mixing syntheses at 0.05 mM TSC, shown in Figure S9. From analyzing over 100 358
particles for each sample, the PSD is found to be 8±5 nm for batch and 7±2 nm for jet-mixing. This indicates 359
that mixing plays an important role in governing the effectiveness of the capping agent. 360
An interesting observation to note in Figure 6 is the increase in the polydispersity of the Ag NPs 361
synthesized at TSC concentrations above 0.05 mM, as indicated by the FWHM. It is hypothesized that this 362
is associated with an increase in the ion concentration of the solution. TSC is an anionic surfactant with 363
three carboxyl groups each bonded to a sodium ion. On dissolving in a polar solvent such as water, the 364
carboxylate salt in excess of that required for capping would dissociate into the sodium ions and the 365
carboxyl capping moiety. Any increase in the TSC concentration above 0.05 mM should hence lead to a 366
three-fold increase in the ion concentration in the solution, which has been known to cause agglomeration 367
for other systems.18,65 The effect of the ion concentration in the solution on PSD is investigated through a 368
series of experiments adding sodium nitrate (NaNO3) to the reaction system. NaNO3 is chosen as the salt 369
as the ions Na+ and NO3- are already present in solution and will not react with other ions in solution, as 370
compared to ions such as Cl-, which if added would cause precipitation of AgCl. Initially, the ion 371
concentration is increased prior to synthesis. NaNO3 of equal concentration (32 mM) is added to each of the 372
standard synthesis solutions of NaBH4 (0.6 mM) and AgNO3 (0.2 mM) + TSC precursor solutions used for 373
standard synthesis. The concentration of TSC is varied from 0.003 to 0.2 mM. Jet-mixing runs at standard 374
main line and jet-line flowrates of 48 mL/h are performed for each TSC concentration. The Ag NP samples 375
produced are analyzed by UV-vis 15 minutes after collection, as shown in Figure S10. For the Ag NP 376
sample with 0.05 mM TSC, the FWHM calculated from the UV-vis spectrum comes out to be 58 nm, 377
Page 15 of 30 Reaction Chemistry & Engineering
16
greater than the FWHM achieved for a comparable jet-mixing run without any salt addition (i.e., 52 nm). 378
Similarly, for the Ag NP sample with 0.2 mM TSC, the FWHM calculated is 63 nm, significantly higher 379
than that achieved for a standard jet-mixing synthesis without NaNO3 (57 nm). This observation suggests 380
the PSD is broadening. 381
This is also observed in Figure S11 showing Ag NP solutions prepared at TSC concentrations of 382
0.01 mM, 0.05 mM and 0.2 mM. The gray color of the Ag NP solution synthesized using 0.01 mM TSC 383
corroborates the aggregation of Ag and is presence of Ag in the form of bulk silver. The color of the solution 384
blue-shifts from gray to yellow on increasing the TSC concentration. The blue-shift demonstrates the 385
presence of smaller particles as the TSC concentration is increased. 386
While these results indicate that pre-synthetic addition of NaNO3 to the Ag NP precursor solutions 387
promotes agglomeration of the synthesized Ag NPs, it is possible that addition of the salt before synthesis 388
can alter the kinetics of the reduction of AgNO3. Specifically, an increase in the NO3- and Na+ ions in 389
solution may affect the rate of conversion of Ag+ to Ag0, because of the common ion effect. To account for 390
this, the standard jet-mixing synthesis at 0.2 mM TSC is repeated, but with 32 mM NaNO3 added post-391
synthesis to the Ag NP solution. The resultant mixture is analyzed by UV-vis and TEM. The UV-vis 392
spectrum of the Ag NP sample before and after addition of 32 mM NaNO3 is shown in Figure S12. It is 393
noticed that the spectrum broadens after addition of the salt, and the wavelength of maximum absorbance 394
red-shifts, indicating formation of larger particles. Further, the absorbance of the UV-vis spectrum drops 395
after salt addition, suggesting that the Ag NPs decrease in number, indicating increased aggregation. This 396
observation is corroborated by the TEM image of the sample in Figure S13 that show the presence of large 397
aggregates. To further validate our conclusion, these experiments were repeated for a higher concentration 398
(64 mM) of NaNO3. The results for these have also been shown in Figures S12 and S13 and confirm the 399
previous results for 32 mM NaNO3. These experiments demonstrate that an increase in the ion concentration 400
of the Ag NP solution caused by the addition of excess TSC could indeed increase the sample 401
polydispersity. Hence, limiting the TSC concentration used in synthesis is not only beneficial in reducing 402
the cost of synthesis but also producing NPs with a more monodisperse PSD. 403
Page 16 of 30Reaction Chemistry & Engineering
17
3.5. Stability of Ag NPs synthesized by Batch and Jet-mixing at optimum TSC concentration 404
An important consideration for the synthesis of Ag NPs is stability. While it is desirable to reduce 405
the amount of capping agent used, the resultant nanoparticles should also be stable in solution. To analyze 406
nanoparticle stability, the batch and JM solutions synthesized with 0.05 mM TSC at otherwise standard 407
conditions are monitored over a long-term period. Each solution is divided into two separate samples post-408
synthesis to check similarity in growth profiles between identical samples. Further, two separate syntheses 409
for batch and JM each are also performed for reproducibility. Equal volumes of each sample are stored in 410
the refrigerator at 4°C to prevent TSC degradation. The samples are evenly covered with aluminum foil to 411
keep out external light. The FWHM of the samples is monitored via UV-vis at fixed intervals, starting from 412
15 minutes up to 1 month after synthesis. The FWHMs obtained for both batch and JM samples at each 413
time of analysis are plotted in Figure 9. Values for FWHM for batch and JM-synthesized samples have 414
been listed in Table S8 and Table S9, respectively. While the FWHM for both batch and jet-mixing increase 415
with time, the batch synthesized sample starts out with a broad FWHM as compared to the jet-mixing 416
synthesized sample and remains so throughout the period of monitoring. The FWHM of the JM-synthesized 417
sample, after 1 month, is 18 nm smaller than the batch-synthesized sample. These results suggest that JM-418
synthesized samples at 0.05 mM TSC tend to remain monodisperse even on long storage. 419
420
4. Summary 421
A jet-mixing reactor is used to synthesize Ag NPs that are monodisperse (5±2 nm) with a narrow 422
SPR spectrum. It is viable to produce Ag NP in large quantities by increasing reactor run-time, because of 423
the consistent product quality produced and reproducible synthesis, as indicated by UV-vis. On varying the 424
concentration of capping agent TSC in the jet-mixing synthesis, it is found that there is an optimum 425
concentration of TSC (0.05 mM). At this optimum concentration, a monodisperse PSD is observed as 426
suggested by a minimum SPR FWHM and corroborated using TEM images. This concentration of capping 427
agent is lower by a factor of four than other reports while maintaining high quality particles. This optimum 428
concentration provides balanced stabilization necessary to prevent agglomeration while maintaining a low 429
Page 17 of 30 Reaction Chemistry & Engineering
18
solution ion concentration. It is shown that concentration higher than optimum results in destabilization of 430
the solution by an increase in the ion concentration causing Ag NP aggregation. External addition of NaNO3 431
to the product solution also produces the same effect, confirming the hypothesis. With the lower 432
concentration of capping agent of 0.05 mM, the nanoparticles produced using the jet-mixing reactor retain 433
a narrower FWHM than the nanoparticles produced in the batch process. Overall, the jet-mixing reactor 434
provides an efficient way to produce monodisperse particles in a continuous manner. 435
436
5. Acknowledgements 437
The authors would like to acknowledge funding from the National Science Foundation (CBET 438
1653587) and The Ohio State University Institute of Materials Research (EMR-G00018 and IMR-FG0211). 439
Images presented in this report were generated using the instruments and services at the Campus 440
Microscopy and Imaging Facility, The Ohio State University. This facility is supported in part by grant P30 441
CA016058, National Cancer Institute, Bethesda, MD. The authors would also like to acknowledge Mariah 442
Whitaker, Abhilasha Dehankar, and Kilho Lee for useful discussions. 443
444
6. Notation 445
Qr = solution flowrate in the main line. 446
Qj = the solution flowrate in the jet line. 447
[A] = Molar concentration of species A in solution. 448
449
6. References 450
1 X. Wu, P. L. Redmond, H. Liu, Y. Chen, M. Steigerwald and L. Brus, J. Am. Chem. Soc., 2008, 451
130, 9500–9506. 452
2 R. L. Hartman, J. P. McMullen and K. F. Jensen, Angew. Chem. Int. Ed., 2011, 50, 7502–19. 453
3 N. T. K. Thanh, N. Maclean and S. Mahiddine, Chem. Rev., 2014, 114, 7610–7630. 454
4 R. Bakhtiar, J. Chem. Educ., 2013, 90, 203–209. 455
Page 18 of 30Reaction Chemistry & Engineering

19
5 C. A. Dos Santos, M. M. Seckler, A. P. Ingle, I. Gupta, S. Galdiero, M. Galdiero, A. Gade and M. 456
Rai, J. Pharm. Sci., 2014, 103, 1931–1944. 457
6 N. L. Pacioni, C. D. Borsarelli, V. Rey and A. V Veglia, Silver Nanoparticle Applications, 2015. 458
7 D. Denkova, Optical characterization of plasmonic nanostructures : near-field imaging of the 459
magnetic field of light, 2014, vol. 3168. 460
8 E. Petryayeva and U. J. Krull, Anal. Chim. Acta, 2011, 706, 8–24. 461
9 B. Calderon-Jimenez, G. F. Sarmanho, K. E. Murphy, A. R. Montoro and J. R. Vega-Baudrit, J. 462
Res. Natl. Inst. Stand. Technol., 2017, 122, 1–10. 463
10 S. Agnihotri, S. Mukherji and S. Mukherji, RSC Adv., 2014, 4, 3974–3983. 464
11 M. S. Saleh, C. Hu and R. Panat, Sci. Adv., 2017, 3, e1601986. 465
12 L. M. Molina, S. Lee, K. Sell, G. Barcaro, A. Fortunelli, B. Lee, S. Seifert, R. E. Winans, J. W. 466
Elam, M. J. Pellin, I. Barke, V. Von Oeynhausen, Y. Lei, R. J. Meyer, J. A. Alonso, A. Fraile, A. 467
Kleibert, S. Giorgio, C. R. Henry, K. Meiwes-broer and S. Vajda, Catal. Today, 2011, 160, 116–468
130. 469
13 C. Petit, P. Lixon and M. P. Pileni, J. Phys. Chem., 1993, 97, 12974–12983. 470
14 B. Ajitha, Y. A. Kumar Reddy, P. S. Reddy, H.-J. Jeon and C. W. Ahn, RSC Adv., 2016, 6, 36171–471
36179. 472
15 H. Fathi, J. P. Kelly, V. R. Vasquez and O. A. Graeve, Langmuir, 2012, 28, 9267–9274. 473
16 D. Singha, N. Barman and K. Sahu, J. Colloid Interface Sci., 2014, 413, 37–42. 474
17 J. D. Martin, L. Telgmann and C. D. Metcalfe, Bull. Environ. Contam. Toxicol., 2017, 98, 589–475
594. 476
18 R. A. French, A. R. Jacobson, B. Kim, S. L. Isley and R. L. E. E. Penn, Environ. Sci. Technol., 477
2009, 43, 1354–1359. 478
19 A. Henglein and M. Giersig, J. Phys. Chem. B, 1999, 103, 9533–9539. 479
20 R. Southey, The Story of the Three Bears, Longman, Rees, etc., 1837. 480
21 S. Silvestrini, T. Carofiglio and M. Maggini, Chem. Commun., 2013, 49, 84–86. 481
Page 19 of 30 Reaction Chemistry & Engineering

20
22 Z. Niu and Y. Li, Chem. Mater., 2014, 26, 72–83. 482
23 M. Carboni, L. Capretto, D. Carugo, E. Stulz and X. Zhang, J. Mater. Chem. C, 2013, 1, 7540. 483
24 X. Dong, X. Ji, H. Wu, L. Zhao, J. Li and W. Yang, J. Phys. Chem. C, 2009, 113, 6573–6576. 484
25 J. Liu, P. Raveendran, Z. Shervani, Y. Ikushima and Y. Hakuta, Chem. - A Eur. J., 2005, 11, 485
1854–1860. 486
26 A. Taleb, C. Petit and M. P. Pileni, Chem. Mater., 1997, 9, 950–959. 487
27 C. Petit, P. Lixon and M. P. Pileni, J. Phys. Chem., 1993, 97, 12974–12983. 488
28 X. Z. Lin, A. D. Terepka and H. Yang, Nano Lett., 2004, 4, 2227–2232. 489
29 D. Paramelle, A. Sadovoy, S. Gorelik, P. Free, J. Hobley and D. G. Fernig, Analyst, 2014, 139, 490
4855. 491
30 T. C. Prathna, N. Chandrasekaran, A. M. Raichur and A. Mukherjee, Colloids Surfaces B 492
Biointerfaces, 2011, 82, 152–159. 493
31 B. Pietrobon and V. Kitaev, Chem. Mater., 2008, 20, 5186–5190. 494
32 S. T. He, Y. L. Liu and H. Maeda, J. Nanoparticle Res., 2008, 10, 209–215. 495
33 S. Iravani, H. Korbekandi, S. V. Mirmohammadi and B. Zolfaghari, Res. Pharm. Sci., 2014, 9, 496
385–406. 497
34 K. Sen Chou, Y. C. Chang and L. H. Chiu, Ind. Eng. Chem. Res., 2012, 51, 4905–4910. 498
35 W. Zhang, X. Qiao, Q. Chen, Y. Cai and H. Chen, Appl. Surf. Sci., 2012, 258, 5909–5913. 499
36 M. Wuithschick, B. Paul, R. Bienert, A. Sarfraz, U. Vainio, M. Sztucki, R. Kraehnert, P. Strasser, 500
K. Rademann, F. Emmerling and J. Polte, Chem. Mater., 2013, 25, 4679–4689. 501
37 L. Xu, J. Peng, M. Yan, D. Zhang and A. Q. Shen, Chem. Eng. Process. Process Intensif., 2016, 502
102, 186–193. 503
38 J. Polte, X. Tuaev, M. Wuithschick, A. Fischer, A. F. Thuenemann, K. Rademann, R. Kraehnert 504
and F. Emmerling, ACS Nano, 2012, 6, 5791–5802. 505
39 S. Mülhopt, S. Diabaté, M. Dilger, C. Adelhelm, C. Anderlohr, T. Bergfeldt, J. Gómez de la Torre, 506
Y. Jiang, E. Valsami-Jones, D. Langevin, I. Lynch, E. Mahon, I. Nelissen, J. Piella, V. Puntes, S. 507
Page 20 of 30Reaction Chemistry & Engineering

21
Ray, R. Schneider, T. Wilkins, C. Weiss and H.-R. Paur, Nanomaterials, 2018, 8, 311. 508
40 L. Mockus, J. J. Peterson, J. M. Lainez and G. V. Reklaitis, Org. Proc. Res. Dev., 2015, 19, 908–509
914. 510
41 B. K. Johnson and R. K. Prud’homme, AIChE J., 2003, 49, 2264–2282. 511
42 M. M. Alvarez, J. M. Zalc, T. Shinbrot, P. E. Arratia and F. J. Muzzio, AIChE J., 2002, 48, 2135–512
2148. 513
43 Brian K Johnson and R. K. Prud’homme, Aust. J. Chem., 2003, 1021–1024. 514
44 R. L. Hartman and K. F. Jensen, Lab Chip, 2009, 9, 2495. 515
45 S. Marre and K. F. Jensen, Chem. Soc. Rev., 2010, 39, 1183–202. 516
46 J. M. Ottino, Phys. Fluids, 2010, 22, 1–12. 517
47 X. Z. Lin, X. Teng and H. Yang, Langmuir, 2003, 19, 10081–10085. 518
48 R. Baber, L. Mazzei, T. K. Thanh and A. Gavriilidis, RSC Adv., 2015, 5, 95585–95591. 519
49 R. Baber, L. Mazzei, N. T. K. Thanh and A. Gavriilidis, Nanoscale, 2017, 14149–14161. 520
50 D. V. R. Kumar, M. Kasture, A. A. Prabhune, C. V. Ramana, B. L. V. Prasad and A. A. Kulkarni, 521
Green Chem., 2010, 12, 609. 522
51 K. S. Iyer, C. L. Raston and M. Saunders, Lab Chip, 2007, 7, 1800. 523
52 H. Mehenni, L. Sinatra, R. Mahfouz, K. Katsiev and O. M. Bakr, RSC Adv., 2013, 3, 22397. 524
53 J. Boleininger, A. Kurz, V. Reuss and C. So, Phys. Chem. Chem. Phys., 2006, 8, 3824–3827. 525
54 K. J. Hartlieb, M. Saunders, R. J. J. Jachuck and C. L. Raston, Green Chem., 2010, 12, 1012. 526
55 D. Mitrakos, J. Jokiniemi, U. Backman and C. Housiadas, J. Nanoparticle Res., 2008, 10, 153–527
161. 528
56 A. Günther, S. A. Khan, M. Thalmann, F. Trachsel and K. F. Jensen, Lab Chip, 2004, 4, 278–286. 529
57 A. Parulkar and N. A. Brunelli, Ind. Eng. Chem. Res., 2017, 56, 10384–10392. 530
58 D. M. Holunga, R. C. Flagan and H. A. Atwater, Ind. Eng. Chem. Res., 2005, 44, 6332–6341. 531
59 G. N. Glavee, K. J. Klabunde, C. M. Sorensen and G. C. Hadjapanayis, Langmuir, 1992, 8, 771–532
773. 533
Page 21 of 30 Reaction Chemistry & Engineering

22
60 K.-J. Wu, G. M. De Varine Bohan and L. Torrente-Murciano, React. Chem. Eng., 2017, 2, 116–534
128. 535
61 C. A. Schneider, W. S. Rasband and K. W. Eliceiri, Nat. Methods, 2012, 9, 671–675. 536
62 G. A. Patil, M. L. Bari, B. A. Bhanvase, V. Ganvir, S. Mishra and S. H. Sonawane, Chem. Eng. 537
Process. Process Intensif., 2012, 62, 69–77. 538
63 S. D. Solomon, M. Bahadory, A. V Jeyarajasingam, S. A. Rutkowsky, C. Boritz and L. Mulfinger, 539
J. Chem. Educ., 2007, 84, 322–325. 540
64 R. Baber, L. Mazzei, N. T. K. Thanh and A. Gavriilidis, J. Flow Chem., 2016, 6, 268–278. 541
65 J. F. A. de Oliveira and M. B. Cardoso, Langmuir, 2014, 30, 4879–4886. 542
543
544
Page 22 of 30Reaction Chemistry & Engineering
23
545
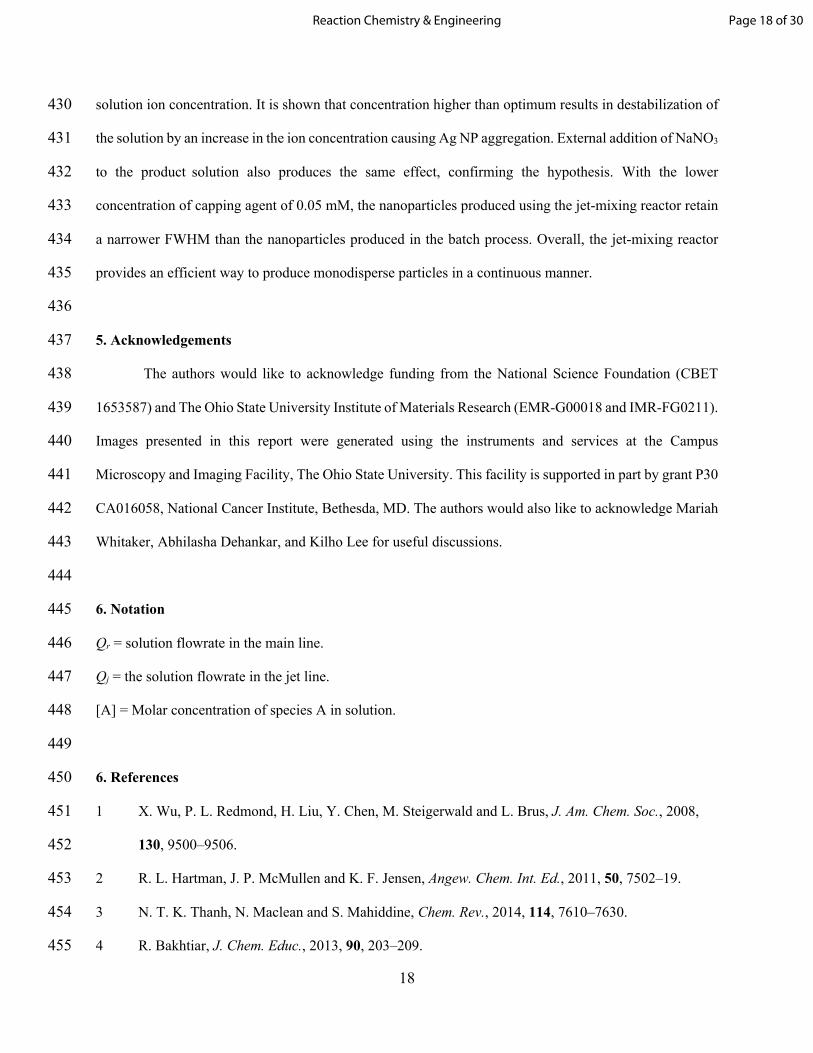
Figure 1. The reactor design showing the main line (dr = 0.04”) carrying reactant 1 and orthogonal jet lines 546
(dj = 0.02”) carrying reactant 2. The product is collected downstream of the reactor. 547
548
549
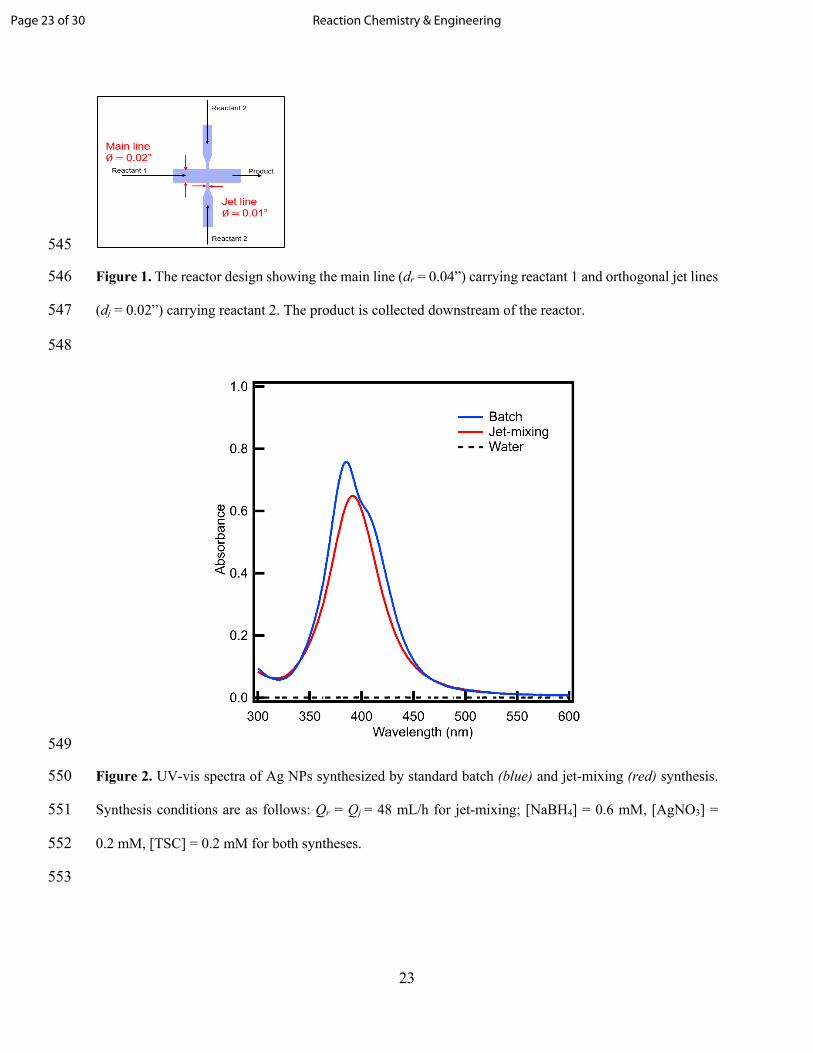
Figure 2. UV-vis spectra of Ag NPs synthesized by standard batch (blue) and jet-mixing (red) synthesis. 550
Synthesis conditions are as follows: Qr = Qj = 48 mL/h for jet-mixing; [NaBH4] = 0.6 mM, [AgNO3] = 551
0.2 mM, [TSC] = 0.2 mM for both syntheses. 552
553
Page 23 of 30 Reaction Chemistry & Engineering

24
554
Figure 3. TEM images and corresponding PSDs of standard (a) jet-mixing (5 ± 2 nm) and (b) batch (9 ± 4 555
nm) syntheses. The distributions are calculated by the size analysis of 300 particles for each synthesis, using 556
ImageJ software. Synthesis conditions are as follows: Qr = Qj = 48 mL/h for jet-mixing; [NaBH4] = 0.6 557
mM, [AgNO3] = 0.2 mM, [TSC] = 0.2 mM for both syntheses. 558
Page 24 of 30Reaction Chemistry & Engineering

25
559
Figure 4. UV-vis spectra of Ag NP samples collected at various times during a standard jet-mixing run. 560
The legend Sn @t min indicates the nth sample collected at time t min after starting run. Synthesis 561
conditions are as follows: Qr = Qj = 48 mL/h; [NaBH4] = 0.6 mM, [AgNO3] = 0.2 mM, [TSC] = 0.2 mM. 562
563
Figure 5. UV-vis spectra of six separate runs of Ag NP synthesis in a standard (a) batch synthesis in a 250 564
mL round bottom flask at 200 RPM; (b) jet-mixing synthesis with NaBH4 solution flowing through the 565
main line at 48 mL/h and AgNO3 + TSC solution flowing through the jet line at 48 mL/h. Synthesis 566
conditions are as follows: [NaBH4] = 0.6 mM, [AgNO3] = 0.2 mM, [TSC] = 0.2 mM for both syntheses. 567
Page 25 of 30 Reaction Chemistry & Engineering
26
568
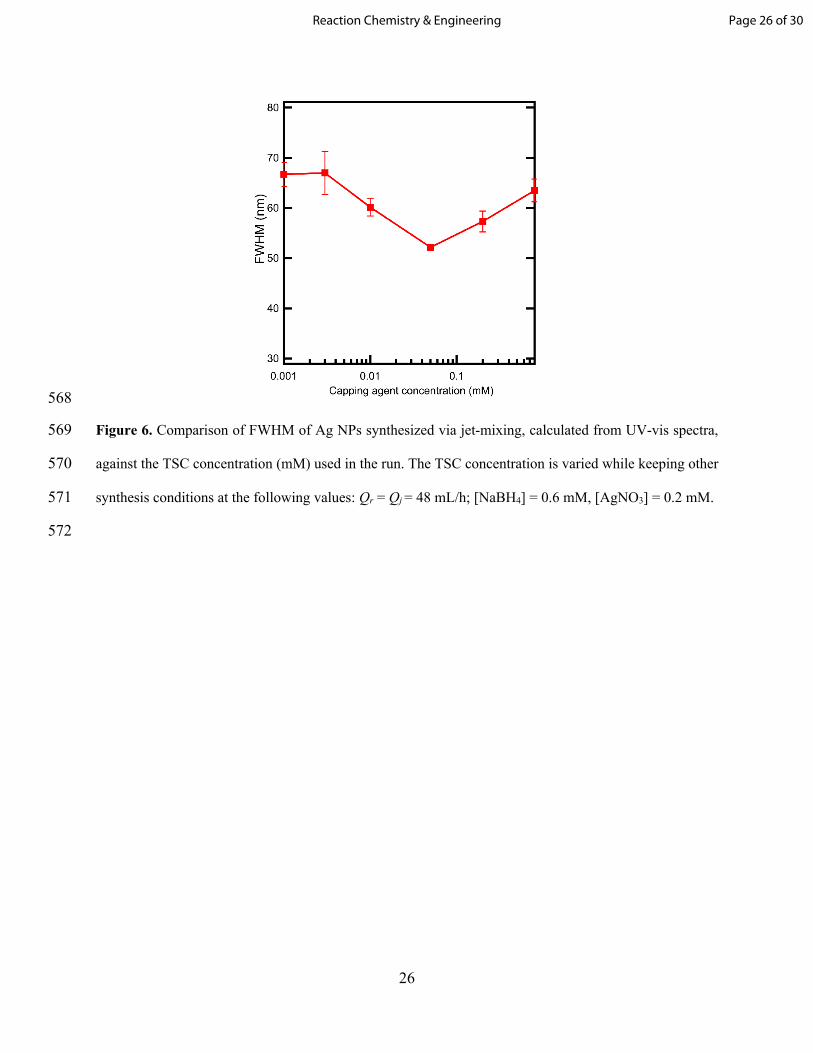
Figure 6. Comparison of FWHM of Ag NPs synthesized via jet-mixing, calculated from UV-vis spectra, 569
against the TSC concentration (mM) used in the run. The TSC concentration is varied while keeping other 570
synthesis conditions at the following values: Qr = Qj = 48 mL/h; [NaBH4] = 0.6 mM, [AgNO3] = 0.2 mM. 571
572
Page 26 of 30Reaction Chemistry & Engineering

27
573
Figure 7. Plot summarizing the FWHM of Ag NPs, obtained for different molar ratios of capping agent to 574
silver substrate. The data includes a number of studies from literature (red) and the data obtained in this 575
work (blue). Jet-mixing synthesis results in a narrow FWHM of 55 nm while requiring a low capping agent 576
concentration of 0.05 mM. Other synthesis conditions are as follows: Qr = Qj = 48 mL/h; [NaBH4] = 0.6 577
mM, [AgNO3] = 0.2 mM. The capping agent to silver substrate molar ratios have been calculated based on 578
parameters such as % vol., weight, or molar concentration of the Ag NP precursors reported in previous 579
works.10,13,16,23,25,26,28,31,32 580
581
Page 27 of 30 Reaction Chemistry & Engineering

28
582
Figure 8. UV-vis spectra comparing batch (blue) and jet-mixing (red) syntheses at 0.05 mM TSC; the 583
optimum concentration obtained for jet-mixing. Other synthesis conditions are as follows: Qr = Qj = 584
48 mL/h for jet-mixing; [NaBH4] = 0.6 mM, [AgNO3] = 0.2 mM for both syntheses. 585
586
Page 28 of 30Reaction Chemistry & Engineering

29
587
588
Figure 9. FWHM obtained via UV-Vis for standard Ag NP batch and jet-mixing syntheses with 0.05 mM 589
TSC, plotted against different times of analysis post-synthesis from 15 minutes to 1 month. Other 590
synthesis conditions are as follows: Qr = Qj = 48 mL/h for jet-mixing; [NaBH4] = 0.6 mM, [AgNO3] = 591
0.2 mM for both syntheses. 592
593
Page 29 of 30 Reaction Chemistry & Engineering
30
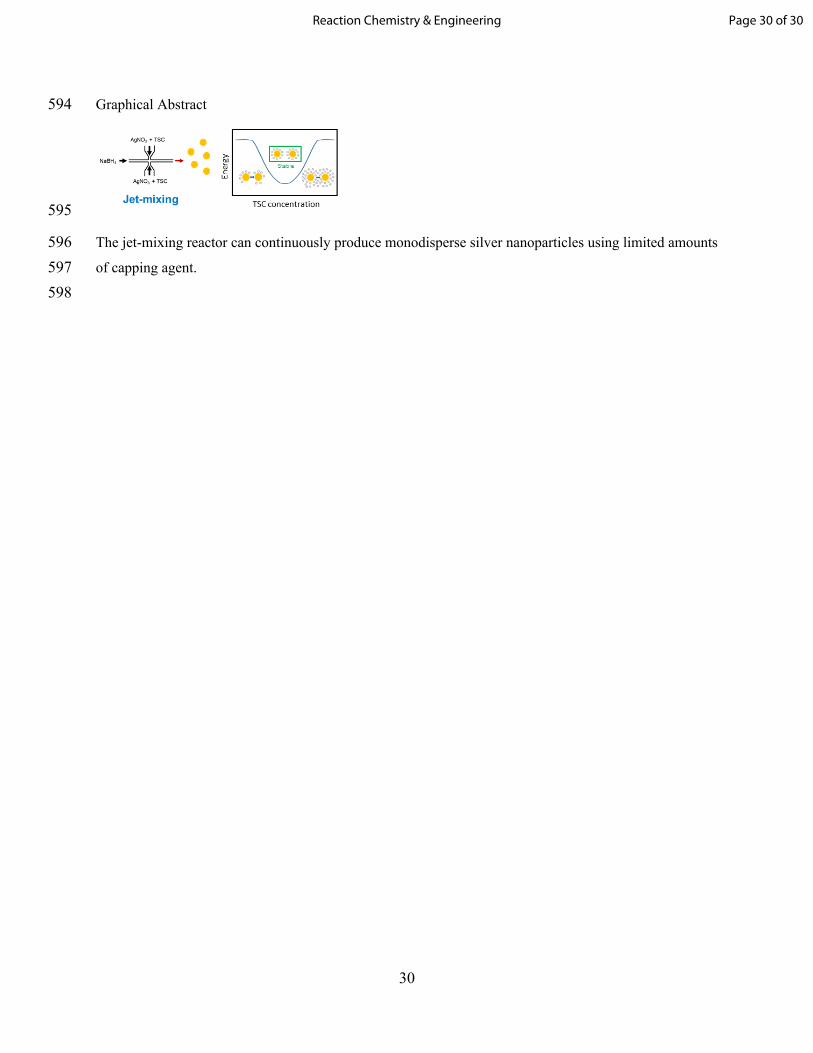
Graphical Abstract 594
595
The jet-mixing reactor can continuously produce monodisperse silver nanoparticles using limited amounts 596 of capping agent. 597 598
Page 30 of 30Reaction Chemistry & Engineering