jet a explosion experiments: laboratory testing
TRANSCRIPT

Jet A Explosion Experiments:
Laboratory Testing
Joseph E. Shepherd, J. Christopher Krok, and Julian J. Lee
Graduate Aeronautical LaboratoriesCalifornia Institute of Technology
Pasadena, CA 91125
June 26, 1997 corrected on November 21, 1997
Explosion Dynamics Laboratory Report FM97-5
Prepared for and supported by the National Transportation Safety BoardUnder Order NTSB12-97-SP-0127

Contents
1 Introduction 1
2 Airplane Fuel Tank Explosions 12.1 Previous Studies . . . . . . . . . . . . . . . . . . . . . . . . . . . . . . . 32.2 Flight conditioning or “Weathering” . . . . . . . . . . . . . . . . . . . . . 6
3 Combustion Testing 113.1 HYJET Facility . . . . . . . . . . . . . . . . . . . . . . . . . . . . . . . . 113.2 Test Conditions, Procedures, and Results . . . . . . . . . . . . . . . . . . 14
3.2.1 Preliminary Tests . . . . . . . . . . . . . . . . . . . . . . . . . . . 153.2.2 Tests at 100◦C . . . . . . . . . . . . . . . . . . . . . . . . . . . . 153.2.3 Variable Temperature series . . . . . . . . . . . . . . . . . . . . . 163.2.4 Variable volume series at 40◦C . . . . . . . . . . . . . . . . . . . . 16
3.3 Peak Pressure Estimates . . . . . . . . . . . . . . . . . . . . . . . . . . . 19
4 Pressure Trace Analysis 254.1 Simple Explosion Modeling . . . . . . . . . . . . . . . . . . . . . . . . . . 274.2 Experimental Parameters . . . . . . . . . . . . . . . . . . . . . . . . . . . 32
5 Flammability Limits 35
6 Ignition Source and Energy 37
7 Vapor pressure 387.1 Vapor Pressure Measurements . . . . . . . . . . . . . . . . . . . . . . . . 417.2 Mass Loading Effect . . . . . . . . . . . . . . . . . . . . . . . . . . . . . 45
8 Dissolved Air 468.1 Dissolved Water . . . . . . . . . . . . . . . . . . . . . . . . . . . . . . . . 48
9 Binary mixture model 48
10 Application to TWA Flight 800 52
11 Conclusions 57
A Test Conditions 64
B GC-MS Analysis 67
i

List of Figures
1 Schematic of 747-100 showing the location of Center Wing Tank. . . . . . 22 Perspective view of Center Wing Tank. . . . . . . . . . . . . . . . . . . . 23 Flammability limits of Jet A in air in the standard representation of tem-
perature vs altitude (CRC 1983). . . . . . . . . . . . . . . . . . . . . . . 34 Lower (lean) flammability limits as determined by Nestor (1967). (a) Jet
A tests with flammability limit tube (Fig. 2 of Nestor and Fig. 7 of Ott)(b) Jet A-1, batch 1 tests with flammability limit tube (Fig. 3 of Nestor)(c) Jet A-1, batch 2 tests with flammability limit vessel, static conditions(Fig. 15 of Nestor) (d) Comparison between Nestor and Ott limits in P -Tcoordinates. . . . . . . . . . . . . . . . . . . . . . . . . . . . . . . . . . . 5
5 Pressure vs altitude, standard atmosphere. . . . . . . . . . . . . . . . . . 76 Temperature vs altitude, standard atmosphere. . . . . . . . . . . . . . . 87 Nominal fuel pressure history for TWA 800 CWT. . . . . . . . . . . . . . 88 Conjectured fuel temperature history for TWA 800 CWT. . . . . . . . . 99 Nominal fuel mass history for TWA 800 CWT. . . . . . . . . . . . . . . . 910 Schematic of 747-100 CWT venting arrangement. . . . . . . . . . . . . . 1011 Flammability limit and possible ullage states during the climb of TWA 800. 1112 Elevation view of HYJET facility. . . . . . . . . . . . . . . . . . . . . . . 1213 Pressure signals in the driver and receiver for test 305. Successful initiation
of combustion, 300 ml of Jet A, 40◦C. . . . . . . . . . . . . . . . . . . . . 1314 Plan view of HYJET facility, illustrating light path for schlieren system. . 1315 Pressure histories for combustion of kerosene, tests 245 and 246. Air tem-
perature of 40◦C, pressure 0.585 bar (14 kft equivalent). Driver jet 1-indiam., 80% H2, 20% O2. . . . . . . . . . . . . . . . . . . . . . . . . . . . 16
16 Pressure histories for combustion near the lean limit of gaseous Jet A inair at a temperature of 100◦C, pressure 0.585 bar (14 kft equivalent). Tests288, 298, 289, and 290. . . . . . . . . . . . . . . . . . . . . . . . . . . . 17
17 Peak pressure as a function of fuel amount for gaseous kerosene and JetA. Fuel and air temperature 100◦C, pressure 0.585 bar (14 kft equivalent).Tests 255 to 265 and 288 to 300. . . . . . . . . . . . . . . . . . . . . . . . 17
18 Pressure histories for combustion of Jet A in air at temperatures between21 and 100◦C, pressure 0.585 bar (14 kft equivalent). The volume of liquidfuel injected was 50 ml in all cases. Tests 271 to 281. . . . . . . . . . . . 18
19 Peak pressures for combustion of gaseous Jet A in air at temperaturesbetween 21 and 100◦C, pressure 0.585 bar (14 kft equivalent). The volumeof liquid fuel injected was 50 ml in all cases. Tests 271 to 281. . . . . . . 18
20 Pressure histories for combustion of gaseous Jet A in air at a temperatureof 40◦C, and a pressure 0.585 bar (14 kft equivalent). Fuel was injected ata pressure of 0.239 bar, equivalent to 35 kft. Tests 300 to 307. . . . . . . 19
ii

21 Pressure histories for combustion of gaseous Jet A in air at a temperatureof 40◦C, and a pressure 0.585 bar (14 kft equivalent). Fuel was injectedat a pressure of 0.239 bar, equivalent to 35 kft in test 305 and 0.585 bar,equivalent to 14 kft in test 310. . . . . . . . . . . . . . . . . . . . . . . . 20
22 Pressure histories for combustion of gaseous Jet A demonstrating the effectof fuel amount and ambient temperature. Tests 305 and 289. . . . . . . . 20
23 Comparison of “exact” solutions to adiabatic explosion pressure with theapproximate model of Eq. 4. Pseudo-Jet A substance (160 g/mol) at twoinitial temperatures (40 and 100◦C) and an initial pressure of 0.585 bar. . 23
24 Comparison of computed adiabatic, constant volume explosion pressuresfor alkanes and aromatics with experimental results for Jet A at 0.585 bar,100◦C. . . . . . . . . . . . . . . . . . . . . . . . . . . . . . . . . . . . . . 24
25 Comparison of computed adiabatic, constant volume explosion pressuresfor a pseudo-fuel of fixed heat of combustion with experimental results forJet A at 0.585 bar, 100◦C. (a) results for variable H/C ratio at T = 373K. (b) results for a fixed H/C ratio for T = 313 K and 373 K. . . . . . . 25
26 Comparison of Ott’s measured peak explosion pressure rise with presentexperimental results for Jet A at 0.585 bar and 40◦C . . . . . . . . . . . 26
27 Nondimensional pressure rise functions for P◦ =0.585 and Pm = 3.0, L/R= 2, γ = 1.4 . . . . . . . . . . . . . . . . . . . . . . . . . . . . . . . . . . 32
28 Pressure history during combustion for test 308. . . . . . . . . . . . . . . 3329 Pressure derivative dP/dt during combustion for test 308. . . . . . . . . . 3330 Nondimensional pressure derivative F vs pressure P during combustion
for test 308. . . . . . . . . . . . . . . . . . . . . . . . . . . . . . . . . . . 3431 ∆P 1/3 vs time for an interval just following ignition in test 308. . . . . . 3532 Minimum ignition energy of JP-8 sprays in air as a function of ambient
temperature. from (Kuchta et al. 1971) . . . . . . . . . . . . . . . . . . . 3833 Estimated and measured vapor pressure of Jet A. Measurements reported
in the literature contrasted with CIT data. . . . . . . . . . . . . . . . . . 4034 Estimated (Reid et al. 1987) and measured vapor pressure of single com-
ponent hydrocarbons compared with Jet A. . . . . . . . . . . . . . . . . 4035 Vapor pressure of Jet A estimated from flammability limits and combus-
tion peak pressure rise. Estimated based on Nestor’s flammability limitmeasurements compared with CIT data. . . . . . . . . . . . . . . . . . . 41
36 Vapor pressure of Jet A estimated from flammability limits and combus-tion peak pressure rise. Estimates based on Ott’s peak pressure rise com-pared with CIT data. . . . . . . . . . . . . . . . . . . . . . . . . . . . . . 41
37 Vapor pressure apparatus. a) Main volume with attached fuel reservoir.b) Assembly immersed in the temperature bath. . . . . . . . . . . . . . . 43
38 Measured vapor pressure and least squares fit to functional form of Eq. 39. 4439 Vapor pressure vs temperature for two mass loadings. Comparison with
binary model using 2.5% hexane (molar) and 97.5% dodecane composition. 46
iii

40 Measured peak pressures as a function of fuel amount for Jet A at 0.585bar and 40◦C . . . . . . . . . . . . . . . . . . . . . . . . . . . . . . . . . 48
41 Vapor pressure as a function of fuel loading factor for the ideal binarymixture model with 97.5% dodecane and 2.5% hexane (molar) at 30, 40and 50◦C. . . . . . . . . . . . . . . . . . . . . . . . . . . . . . . . . . . . 50
42 Hexane fraction as a function of fuel loading factor for the ideal binarymixture model with 97.5% dodecane and 2.5% hexane (molar) at 30, 40and 50◦C. . . . . . . . . . . . . . . . . . . . . . . . . . . . . . . . . . . . 51
43 Mean molar mass as a function of fuel loading factor for the ideal binarymixture model with 97.5% dodecane and 2.5% hexane (molar) at 30, 40and 50◦C. . . . . . . . . . . . . . . . . . . . . . . . . . . . . . . . . . . . 52
44 Fuel-air mass ratio as a function of fuel loading factor for the ideal binarymixture model with 97.5% dodecane and 2.5% hexane (molar) at 30, 40and 50◦C. . . . . . . . . . . . . . . . . . . . . . . . . . . . . . . . . . . . 53
45 Problem definition for evaporation losses through the vent stringer. . . . 5346 Location of the ACM units that provide the heat sources for fuel vaporiza-
tion, conduction and natural convection within the CWT. There are threeACM units, only two are visible in this view. . . . . . . . . . . . . . . . . 55
47 Normalized total ion chromatogram for LAX Jet A liquid. . . . . . . . . 6748 Normalized total ion chromatogram for LAX Jet A vapor. Obtained from
the headspace of a 1.88 cc vial at 40◦C, mass loading of about 300 kg/m3. 68
iv

List of Tables
1 Physical properties of single component hydrocarbon fuels (Reid et al.1987; Kuchta 1985). . . . . . . . . . . . . . . . . . . . . . . . . . . . . . . 21
2 Combustion properties of single component hydrocarbon fuels (Reid et al.1987; Kuchta 1985). X indicates molar or volume fraction at NTP. . . . 21
3 Measured vapor pressure of LAX Jet A using the Caltech apparatus andprocedure. Estimated uncertainty in pressure is ± 0.2 mbar. Estimateduncertainty in temperature is ± 0.6◦C. . . . . . . . . . . . . . . . . . . . 45
4 Test conditions and key results. . . . . . . . . . . . . . . . . . . . . . . . 64
v

1 Introduction
This report describes a series of experiments and analyses on the flammability of Jet A(aviation kerosene) in air. This is a progress report on ongoing work. The emphasis so farhas been on measuring basic explosion parameters as a function of fuel amount and tem-perature. These parameters include vapor pressure, flammability limits, peak explosionpressure and pressure as a function of time during the explosion. These measurementswere undertaken in order to clear up some fundamental issues with the existing data.
The report is organized as follows: First, we give some background with data fromprevious studies and discuss the fuel weathering issues. Second, we describe the facilityused to do combustion experiments, the combustion test procedures and the results of thecombustion experiments. Third, we give estimates of peak pressure, review the standardanalysis of pressure histories and discuss the application to the present data. Fourth, wereview the standard approach to flammability limits and the issues in determining Jet Aflammability. Fifth, we discuss the problems associated with measuring vapor pressureand describe our results for Jet A. Sixth, we present a model for Jet A which illustratesthe issues in analyzing multicomponent fuels. Finally, we apply these results to TWA800 and summarize our conclusions to date.
2 Airplane Fuel Tank Explosions
The TWA 800 crash investigation is focusing on an explosion in the center fuel tank as aprimary event in initiating the structural failure of the airplane. The Center Wing Tank(CWT) on a 747-100 is located within the fuselage between the wings, see Fig. 1. Theupper and lower surfaces of the tank are extensions of the wing’s upper and lower skin.The tank is approximately 21.25-ft (6.48 m) wide, 20.17-ft (6.15 m) long and 4 to 6.5-ft(1.2 to 1.65 m) high. Wing structural members, three spars and three spanwise beams,form the vertical surfaces that bound the tank and divide it into four compartments anda dry bay, see Fig. 2. The two rear compartments are further divided by a partial ribin the center of the structure. The total volume of the fuel-containing portion of thetank is about 50 m3. The volumes of compartments containing fuel range from 4.9 to15.4 m3. The compartments communicate through a number of penetrations throughthe beams, spars and partial ribs. The total area of the communicating passagewaysbetween compartments ranges from 4.8×10⁻⁴ m2 to 6.98×10⁻² m2. On some flights, thistank is often empty except for whatever residual fuel (50 to 100 gal) remains from theprevious use. This was the case in TWA 800. The tank is vented to the atmosphereand the volume of the tank above the fuel (ullage) contains mainly air. The vaporizationand mixing of the residual fuel into this air can result in the formation of an explosivemixture within the tank.
A main concern is the range of conditions under which Jet A-air mixtures can beignited, i.e., are flammable. The standard method for describing flammability of aviationfuel is to use spark ignition sources in laboratory experiments to determine the altitude(pressure) and temperature boundaries for flame propagation. The results of previous
1

Figure 1: Schematic of 747-100 showing the location of Center Wing Tank.
PartialRib
78 in.
255 in.
242 in.
48 in.
Figure 2: Perspective view of Center Wing Tank.
tests (described in detail in the next section) are summarized in Fig. 3. Mixtures withinthe shaded region between the solid lines are considered flammable. The static tests arecarried out in situations for which the fuel vapor is created by evaporation of a large,stagnant mass of fuel into the air in the ullage. The air, fuel vapor and fuel liquid are allat a common temperature. In dynamic tests, the fuel tank is vibrated, resulting in fuelsuspended as a mist, lowering the lean limit to the dashed line.
If the temperature is sufficiently high (above 35◦C), then the mixture will be flammable.As discussed below, this appears to be the case in TWA 800. However, there are sev-eral problems with this representation of the flammability limit and its application tosituations such as TWA 800. The contents of the tank in a climbing aircraft are not inequilibrium. In TWA 800, a very limited mass of fuel was present in the tank, ratherthan the large amounts considered in previous flammability tests. The residual fuel inthe CWT of TWA 800 was subjected to extensive environmental effects, i.e., varyingtemperature and pressure, over the previous 15 hours. The fuel, air and surfaces of theCWT were all at different temperatures due to the presence of a large heat source under
2

0
10
20
30
40
50
-10.0 10.0 30.0 50.0 70.0 90.0
temperature (C)
altit
ude
(kft)
AAAAAAAAAAAAAAAAAAAAAAAAAAAAAAAAAAAAAAAAAAAAAAAAAAAAAAAAAAAAAAAAAAAAAAAAAAAAAAAAAAAAAAAAAAAAAAAAAAAAAAAAAAAAAAAAAAAAAAAAAAAAAAAAAAAAAAAAAAAAAAAAAAAAAAAA
AAAAAAAAAAAAAAAAAAAAAAAAAAAAAAAAAAAAAAAAAAAAAAAAAAAAAAAAAAAAAAAAAAAAAAAAAAAAAAAAAAAAAAAAAAAAAAAAAAAAAAAAAAAAAAAAAAAAAAAAAAAAAAAAAAAAAAAAAAAAAAAAAAAAAAAA
AAAAAAAAAAAAAAAAAAAAAAAAAAAAAAAAAAAAAAAAAAAAAAAAAAAAAAAAAAAAAAAAAAAAAAAAAAAAAAAAAAAAAAAAAAAAAAAAAAAAAAAAAAAAAAAAAAAAAAAAAAAAAAAAAAAAAAAAAAAAAAAAAAAAAAAA
AAAAAAAAAAAAAAAAAAAAAAAAAAAAAAAAAAAAAAAAAAAAAAAAAAAAAAAAAAAAAAAAAAAAAAAAAAAAAAAAAAAAAAAAAAAAAAAAAAAAAAAAAAAAAAAAAAAAAAAAAAAAAAAAAAAAAAAAAAAAAAAAAAAAAAAA
AAAAAAAAAAAAAAAAAAAAAAAAAAAAAAAAAAAAAAAAAAAAAAAAAAAAAAAAAAAAAAAAAAAAAAAAAAAAAAAAAAAAAAAAAAAAAAAAAAAAAAAAAAAAAAAAAAAAAAAAAAAAAAAAAAAAAAAAAAAAAAAAAAAAAAAA
AAAAAAAAAAAAAAAAAAAAAAAAAAAAAAAAAAAAAAAAAAAAAAAAAAAAAAAAAAAAAAAAAAAAAAAAAAAAAAAAAAAAAAAAAAAAAAAAAAAAAAAAAAAAAAAAAAAAAAAAAAAAAAAAAAAAAAAAAAAAAAAAAAAAAAAA
AAAAAAAAAAAAAAAAAAAAAAAAAAAAAAAAAAAAAAAAAAAAAAAAAAAAAAAAAAAAAAAAAAAAAAAAAAAAAAAAAAAAAAAAAAAAAAAAAAAAAAAAAAAAAAAAAAAAAAAAAAAAAAAAAAAAAAAAAAAAAAAAAAAAAAAA
AAAAAAAAAAAAAAAAAAAAAAAAAAAAAAAAAAAAAAAAAAAAAAAAAAAAAAAAAAAAAAAAAAAAAAAAAAAAAAAAAAAAAAAAAAAAAAAAAAAAAAAAAAAAAAAAAAAAAAAAAAAAAAAAAAAAAAAAAAAAAAAAAAAAAAAA
AAAAAAAAAAAAAAAAAAAAAAAAAAAAAAAAAAAAAAAAAAAAAAAAAAAAAAAAAAAAAAAAAAAAAAAAAAAAAAAAAAAAAAAAAAAAAAAAAAAAAAAAAAAAAAAAAAAAAAAAAAAAAAAAAAAAAAAAAAAAAAAAAAAAAAAA
AAAAAAAAAAAAAAAAAAAAAAAAAAAAAAAAAAAAAAAAAAAAAAAAAAAAAAAAAAAAAAAAAAAAAAAAAAAAAAAAAAAAAAAAAAAAAAAAAAAAAAAAAAAAAAAAAAAAAAAAAAAAAAAAAAAAAAAAAAAAAAAAAAAAAAAA
AAAAAAAAAAAAAAAAAAAAAAAAAAAAAAAAAAAAAAAAAAAAAAAAAAAAAAAAAAAAAAAAAAAAAAAAAAAAAAAAAAAAAAAAAAAAAAAAAAAAAAAAAAAAAAAAAAAAAAAAAAAAAAAAAAAAAAAAAAAAAAAAAAAAAAAA
AAAAAAAAAAAAAAAAAAAAAAAAAAAAAAAAAAAAAAAAAAAAAAAAAAAAAAAAAAAAAAAAAAAAAAAAAAAAAAAAAAAAAAAAAAAAAAAAAAAAAAAAAAAAAAAAAAAAAAAAAAAAAAAAAAAAAAAAAAAAAAAAAAAAAAAA
AAAAAAAAAAAAAAAAAAAAAAAAAAAAAAAAAAAAAAAAAAAAAAAAAAAAAAAAAAAAAAAAAAAAAAAAAAAAAAAAAAAAAAAAAAAAAAAAAAAAAAAAAAAAAAAAAAAAAAAAAAAAAAAAAAAAAAAAAAAAAAAAAAAAAAAA
AAAAAAAAAAAAAAAAAAAAAAAAAAAAAAAAAAAAAAAAAAAAAAAAAAAAAAAAAAAAAAAAAAAAAAAAAAAAAAAAAAAAAAAAAAAAAAAAAAAAAAAAAAAAAAAAAAAAAAAAAAAAAAAAAAAAAAAAAAAAAAAAAAAAAAAA
AAAAAAAAAAAAAAAAAAAAAAAAAAAAAAAAAAAAAAAAAAAAAAAAAAAAAAAAAAAAAAAAAAAAAAAAAAAAAAAAAAAAAAAAAAAAAAAAAAAAAAAAAAAAAAAAAA
flammable
rich
staticleandynamic
lean
Figure 3: Flammability limits of Jet A in air in the standard representation of tempera-ture vs altitude (CRC 1983).
the CWT. Each of these issues is discussed in this report.
2.1 Previous Studies
Although there are many reports on aircraft fire and explosion (Kuchta 1973, Kuchta1975, Kuchta and Clodfelter 1985, Moussa et al. 1996, Moussa 1990), there is a limitedamount of fundamental flammability data on Jet A. There is meager data in the standardreferences (Kuchta 1985, Zabetakis 1965) on explosion properties and much of the datacited in the industry standard publication (CRC 1983) is without direct attribution. Allof the combustion data on Jet A appear to derive from three technical reports: Nestor(1967); Ott (1970); Kosvic et al. (1971).
Nestor (1967) and Ott (1970) both carried out experiments on the flammability of JetA in air at various temperatures and pressures. The effects of altitude are simulated byvarying the pressure within the fuel tank. Airplane fuel tanks are vented and the pressurewithin the tank is close to the ambient pressure, see Figs. 6 and 5 for the relationshipsbetween altitude and atmospheric temperature and pressure. Kosvic et al. (1971) carriedout experiments on measuring composition of fuel vapor in the ullage (vapor volume) atvarious temperatures and pressures. Our test results are generally consistent with all ofthese but it is worthwhile examining each set of tests in more detail.
Nestor carried out the most extensive and careful work on the flammability of Jet A.He used two facilities to determine flammability limits and peak explosion pressures.
3

Limits to upward flame propagation were studied in a 4-in. diameter, 4-ft. long tube. Amixture was considered flammable if the flame propagated the entire length of tube.
Nestor’s experiments were carried out with an ullage that was 87.5% of the totalvolume of the facility. Multiple electric sparks with energies of 5 and 20 J were usedto initiate combustion. Three batches of Jet A were examined. Flammability limitpressures were found as a function of temperature (Fig. 4a, b). At sea level (1 bar),the mixtures were found to be flammable between 89 and 100◦F (31.7 to 37.8◦C). Thisrange of temperatures is due to the variability between fuel batches. At a pressureequivalent to 15 kft, the mixtures were found to be flammable between 75 and 85◦F (23.9to 29.4◦C). Although flammability limits did depend on the batch of fuel, they did notappear particularly sensitive to how the fuel was handled.
Nestor used a 2-1/2 gal. tank (9-in. diam. and 15-in high) to examine the effects ofvibration and sloshing of the fuel. A 16 to 24 J spark ignition source was used above thesurface of the liquid fuel and the fuel tank was vibrated at 15 Hz with an amplitude of1/8-in. If the ignition sparks were outside the spray and mist produced by the motion ofthe fuel, there was no noticeable effect on the flammability limits. If the ignition sparkswere inside the spray region, then a marked extension of the flammability limit occured.On the lean side, the temperatures could be decreased to 54◦F (12.2◦C) at sea level andignition was still obtained.
Nestor used a pressure rise of about 4 psi (0.27 bar) as a flammability criterion.Pressure rises of up to 40 psi (2.72 bar) were observed near the “static” flammabilitylimit temperature at sea level when spray combustion occurred. The “static” vessel data(Fig. 4c) are similar to the flame tube data (Fig. 4b) but the temperature limits are lowerin the vessel than in the tube. There is substantial scatter in Nestor’s “dynamic” data forpeak pressure (see his Figs. 13 and 23). Data from different initial pressures have beencombined on a single plot but the temperature axis has been scaled to reflect differencesfrom a nominal flammability limit temperature. Presenting the data in this fashion, aunique upper bound to the peak pressure is not apparent as it is in Ott’s presentation.The raw data is not given so it is impossible to reanalyze the data for trends in the peakpressure with initial temperature.
Ott’s study is more useful from the viewpoint of peak pressure prediction. Ott usedan 80 gallon tank (20-in diam and 60-in long) mounted horizontally on a slosh-vibrationtable. About 10 gallons of fuel (JP-8) were placed in the bottom of the tank and used fora number (2 to 8) of tests. His ignitor was a furnace system consisting of a high-voltagetransformer that produced a moving arc (Jacob’s ladder) between two 12-in long elec-trodes. Mixtures of JP-8 with air were determined to become flammable between 110 and120◦F (43.3 and 48.9◦C) at sea level. At 8 psi (0.544 bar), the limiting temperature wasbetween 90 and 95◦F (32.2 and 35.0◦C). Data for other pressures is not given explicitly,but can be deduced from his Fig. 7 and are consistently higher (Fig. 4d) than Nestor’sdata.
Ott found that sloshing decreased the flammability limit temperature from 110-120◦F(43.3-48.9◦C) to as low as 55-60◦F (12.8-15.6◦C). The maximum values of the peak pres-sure were bounded by a single curve that was proportional to the estimated vapor pres-
4

0
5
10
15
20
25
30
35
40
45
50
0 10 20 30 40 50
temperature (C)
heig
ht (
kft)
Nestor (Fig. 2), flame
Nestor (Fig. 2), no flame
Ott, inferred limit
0
5
10
15
20
25
30
0 10 20 30 40 50
temperature (C)
heig
ht (
kft)
Nestor (Fig. 3), flame
Nestor (Fig. 3), no flame
(a) (b)
0
5
10
15
20
25
30
35
40
45
0 10 20 30 40
temperature (C)
he
igh
t (k
ft)
Nestor (Fig. 15), flame
Nestor (Fig. 15), no flame
0.0
0.1
0.2
0.3
0.4
0.5
0.6
0.7
0.8
0.9
1.0
0 10 20 30 40 50
temperature (C)
pres
sure
(at
m)
Nestor (Fig. 2), flameNestor (Fig. 2), no flameOtt, inferred limitNestor (Fig. 3), flameNestor (Fig. 3), no flameNestor (Fig. 15), flameNestor (Fig. 15), no flame
(c) (d)
Figure 4: Lower (lean) flammability limits as determined by Nestor (1967). (a) Jet Atests with flammability limit tube (Fig. 2 of Nestor and Fig. 7 of Ott) (b) Jet A-1, batch1 tests with flammability limit tube (Fig. 3 of Nestor) (c) Jet A-1, batch 2 tests withflammability limit vessel, static conditions (Fig. 15 of Nestor) (d) Comparison betweenNestor and Ott limits in P -T coordinates.
sure. The peak change in pressure was apparently independent of the initial pressure inthe tank. At 100◦F (37.8◦C), a peak pressure change of approximately 40 psi (2.72 bar)was observed.
Kosvic et al. (1971) used a 110 gallon tank (2-ft diam. and 5-ft long) containing50 gallons of fuel. They studied the effect of altitude changes and fuel temperatureon the vapor composition in the ullage. No combustion experiments were carried outbut the gas concentration (in terms of total hydrocarbon content) was measured usinga gas chromatograph with a flame ionization detector. The gas concentrations weremeasured as a function of time during simulated climbs at a rate of 2000 ft/min. Twokey conclusions were: a) the ullage above the liquid Jet A would be flammable at sea
5

level at a temperature of 120◦F; b) the vapor concentration would remain close to the“equilibrium” value for a climb or descent rate of 2000 ft/min. At sea level, a fuel/airmass ratio between .06 and .07 was measured for a fuel temperature of 120◦F (48.9◦C).At 14 kft, a fuel/air mass ratio of about 0.14 was measured for a fuel temperature of120◦F. These can be compared with their estimated flammability limits (fuel/air massratio) of 0.035 (lean) and 0.29 (rich). For reference, the stoichiometric ratio is in therange of 0.065 to 0.076 for typical hydrocarbon fuels (see the subsequent discussion onpeak pressure).
We conclude that there is substantial variability in the measured flammability limitsof Jet A. In terms of temperature conditions, Nestor’s limits are lower than Ott’s andthe lower flammability limit is between and 38◦C at sea level, 24 and 29◦C at 15 kft. Inorder to interpret these in terms of mass or mole fraction, some assumptions about molarmass and vapor pressure have to be made, see Section 5. The presence of a mist extendsthe lower limit to much lower liquid temperatures if the igniter is located in the mist.Our observations of propagating flames in vapor-air mixtures at 40◦C and 0.585 bar areconsistent with the flammability limits obtained by Ott and Nestor. In the present phaseof the study we have not systematically hunted for the lean limit but it is clearly attemperatures less than 40◦C at a pressure of 0.585 bar.
All three authors note that the vapor composition and mean molar mass will be afunction of temperature but did not quantify these effects. They also stated that the ratioof fuel mass to tank volume will have some influence on the vapor composition but didnot study this issue either. These are key issues for interpreting the present experimentsand understanding combustion in nearly empty fuel tanks.
2.2 Flight conditioning or “Weathering”
Fuel in an airplane is exposed to a range of conditions during flight. The pressure andthe temperature in the atmosphere are a function of altitude as shown in Figs. 5 and 6.The pressure within the fuel tank is slightly less than ambient (the pressure differentialis about .25 psi) when cruising since the vents are located in a low pressure region on thewing tips. The temperature of the fuel and vapor depends on the rate of heat transfer tothe fuel from the surroundings. The fuel temperature is not normally measured in flightbut can be estimated from a heat transfer model or measured in a special flight test.A heat transfer model must include heat transfer from the heated cabin (nominally at70◦F), heat transfer from the air packs (air cycle machines or ACM), heat losses throughthe rear spar to the ambient atmosphere in the wheel well, and heat transfer through theside-of-body ribs from the adjacent fuel in the wing. The amount of fuel in the tank, therate at which fuel is removed and the rate of climb or descent are additional factors thatmust be considered in addition to the properties of the particular batch of fuel.
The effect of airplane operation on the fuel is important to address for the TWA 800situation. The key question is: What was the composition and concentration of fuelvapor within the tank at the time of the explosion? The answer apparently depends onthe entire history of the fuel up to the time of the explosion. There are four important
6

0.0
0.1
0.2
0.3
0.4
0.5
0.6
0.7
0.8
0.9
1.0
0 10 20 30 40 50
altitude (kft)
Pre
ssur
e (b
ar)
Figure 5: Pressure vs altitude, standard atmosphere.
aspects to this history of the fuel: 1) the properties of the batch of fuel loaded in Athens;2) the effect of the flight from Athens; 3) the effect of ground operations at JFK airport inNY; 4) the effect of the climb up to 14 kft, where the explosion took place. The nominalhistory of the key CWT fuel parameters: pressure, temperature, and mass; are shown inFigs. 7-9. Note that the fuel temperature history is mainly conjecture at this point.
Samples of the fuel loaded at Athens have been examined by the NTSB. It has aflash point of 113◦F (45◦C) which is within the range usually reported for Jet A (seethe subsequent discussion on flammability). Further characterization of the fuel is inprogress.
The flight from Athens took about 10 hours and for most of this time, the airplanewas at cruising altitude of 33 to 35 kft. The fuel in the center wing rank (CWT) wasconsumed first, and after the first several hours, it is believed that only 300 lb or slightlyless than 50 gallons1 remained in the tank. The temperature in the air at cruising altitudeis quite low (-50◦C), however the temperature in the tank is expected to be much higherdue to the heat load from the ACMs, which can increase the air temperature under theCWT up to 150◦F. The underside of the CWT is not insulated.
Nestor and Ott carried out a limited study of the effect of flight conditioning, i.e.,cycling the fuel from sea level to 35 kft and back again. However, this was done withvery large mass to volume ratios and prolonged exposure to high or low temperatureswas not considered. The fuel was aged in a vented tank for four months and retested.There was no noticeable effect of aging but it is unclear how much vapor loss would occurin the configuration used in these tests. The experiments of Kosvic et al. indicate thatwhen large fuel loadings are used, the fuel vapor concentration rapidly adjusts to changes
1The mass density of Jet A is nominally 6.74 lb/gal.
7

-60
-50
-40
-30
-20
-10
0
10
20
0 10 20 30 40 50
altitude (kft)
tem
pera
ture
(C
)
Figure 6: Temperature vs altitude, standard atmosphere.
AAAAAAAA
AAAAAAAAAA
AAAAAAAA
AAAA
0
0.1
0.2
0.3
0.4
0.5
0.6
0.7
0.8
0.9
1
0 1 2 3 4 5 6 7 8 9 10 11 12 13 14 15 16
elapsed time from Athens (hours)
pres
sure
(ba
r)
Cruise at 33-35 kft
Explosion at 13.8 kft
Athens JFK
CWT "empty"
Gate hold
usual layover
Figure 7: Nominal fuel pressure history for TWA 800 CWT.
in pressure. Kosvic et al. developed a computer simulation to model the effects of fuelwithdrawal, heat transfer, dissolved air, fuel evaporation and altitude changes to predictthe fuel-air ratio within the fuel tank ullage. However, experiments indicate much morerapid equilibration than the models predict.
The CWT was not refilled at JFK and the airplane was on the ground for about 5hours, 2 of this in a “gate hold”. For some fraction of this time, one or more of the ACMswere operating. Fifty gallons in the CWT corresponds to a layer 3/16-in thick if spreaduniformly over the bottom of the CWT. However, due to the varying elevation of thetank floor, the fuel was probably localized in a deeper puddle near the center of the tank.During the climb up in altitude after takeoff, the plane is at an angle of about 6◦ and
8

-60
-40
-20
0
20
40
60
0 1 2 3 4 5 6 7 8 9 10 11 12 13 14 15 16
elapsed time from Athens (hours)
tem
pe
ratu
re (
C)
air
fuel
Cruise at 33-35 kft
Explosion at 13.8 kft
Athens JFK
CWT "empty"
Gate hold
usual layover?
Figure 8: Conjectured fuel temperature history for TWA 800 CWT.
AAAAAAAA
AAAAAAAAAA
AAAAAAAA
AA0
5000
10000
15000
20000
25000
30000
0 1 2 3 4 5 6 7 8 9 10 11 12 13 14 15 16
elapsed time from Athens (hours)
CW
T fu
el (
lb)
Cruise at 33-35 kft
Explosion at 13.8 kft
Athens
JFK
CWT "empty"
Gate holdusual layover
Figure 9: Nominal fuel mass history for TWA 800 CWT.
fuel moves to the rear of the tank to form a layer with a maximum thickness of about4 in. at the rear spar. Preliminary flight tests indicate that the fuel temperature canreach 115◦F (46.1◦C) due to heating by the ACMs. The temperatures of the tank wallsare lower due to the thermal mass of the adjacent fuel in the wing tanks and the topsurface of the tank is cooler due to heat transfer from the cabin air conditioning system.These nonuniform conditions complicate determining the effective fuel concentration andcomposition within the tank. This is considered in more detail in Section 10.
The airplane was climbing at approximately 1000 ft/min after takeoff from JFK. Asthe pressure decreases within the CWT, air and fuel vapor flows out of the tank vents.There are four vents within the tank, two from the rear compartments and two in thefront, see Fig. 10. At an altitude of 14 kft, the pressure is about .585 bar (8.6 psi) andapproximately 40% of the fuel-air mixture originally in the tank ullage at sea level was
9

been vented. However, vapor will evaporate from the hot fuel to replace the vapor that isbeing vented. In addition, as the fuel-air mixture is vented from the tank, the remaininggas expands and cools. Heat transfer from the warm walls and hot lower surface competewith this cooling process. The preliminary flight test measurements indicate that the heattransfer between the tank and the fuel-air mixture is very efficient. As a consequence ofboth the nonuniform state of the tank and the rate processes associated with venting,the resulting locus of conditions within the CWT ullage during the climb cannot berepresented in the conventional flammability diagram (Fig. 3).
Surge tank
Vent inlets
Ventingchannel
Vent outlet
Rear Front
Center wingtank
Wing
Figure 10: Schematic of 747-100 CWT venting arrangement.
A better representation of the ullage conditions can be obtained by considering thefuel/air mass ratio in the ullage. As mentioned above, a mixture is considered flammableif this ratio exceeds a minimum value, equal to about 0.019 to 0.026 for Jet A. This value isrelatively independent of the fuel-air mixture temperature and pressure. Since fuel vaporand air are vented in equal proportions during the climb, this ratio remains unchangedif the fuel evaporation and mixing occur slowly compared to the venting process. Theother extreme is if the fuel evaporation and mixing occur rapidly compared to the venting
10

process, then the fuel-air ratio will increase with increasing altitude. These two extremesare shown on Fig. 11. Hence if the evaporation occurs rapidly, the mixture may changefrom an inert condition to a flammable one with an increase in altitude. This situationmay have occured in TWA 800.
AAAAAAAAAAAAAAAAAAAAAAAAAAAAAAAAAAAAAAAAAAAAAAAAAAAAAAAAAAAAAAAAAAAAAAAAAAAAAAAA
AAAAAAAAAAAAAAAAAAAAAAAAAAAAAAAAAAAAAAAAAAAAAAAAAAAAAAAAAAAAAAAAAAAAAAAAAAA
0
5
10
15
0 0.01 0.02 0.03 0.04 0.05
fuel-air mass ratio
altit
ude
(kft)
AAAAAAAAAAAAAAAAAAAAAAAAAAAAAAAAAAAAAAAAAAAAAAAAAAAAAAAAAAAAAAAAAAAAAAAAAAAAAAAAAAAAAAAAAAAAAAAAAAAAAAAAAAAAAAAAAAAAAAAAAAAAAAAAAAAAAAAAAAAAAAAAAAAAAAAAAAAA
AAAAAAAAAAAAAAAAAAAAAAAAAAAAAAAAAAAAAAAAAAAAAAAAAAAAAAAAAAAAAAAAAAAAAAAAAAAAAAAAAAAAAAAAAAAAAAAAAAAAAAAAAAAAAAAAAAAAAAAAAAAAAAAAAAAAAAAAAAAAAAAAAAAAAAAAAAAA
AAAAAAAAAAAAAAAAAAAAAAAAAAAAAAAAAAAAAAAAAAAAAAAAAAAAAAAAAAAAAAAAAAAAAAAAAAAAAA
13.8 kft
rapid evaporation
LFL
flammable
slow evaporation
inert
Figure 11: Flammability limit and possible ullage states during the climb of TWA 800.
At present, the issues relating to fuel temperature, flight conditioning and ventingduring climb are unresolved. There are several steps that must be taken in order tocomplete the analysis of the ullage condition at the time of the explosion. First, thetemperature history of the fuel must be defined through flight test measurements andanalysis of the thermal environment in the tank. Second, the effect of flight conditioningand evaporation during the gate hold must be determined through laboratory flammabil-ity experiments with fuel conditioned by the appropriate environmental changes. Third,the effect of venting must be examined through a combination of experiment and anal-ysis. Finally, combustion testing must be carried out using parameters that correspondto the conditions in TWA 800. In the next section we describe combustion experimentsdesigned to examine one of these parameters, the limited fuel mass present in the tank.
3 Combustion Testing
We have carried out experiments in the HYJET explosion test facility located in theGraduate Aeronautical Laboratories, California Institute of Technology.
3.1 HYJET Facility
The HYJET experimental facility is built around two pressure vessels, as shown in Fig. 12.The driver vessel has a 127-mm (5 in) inner diameter and is approximately 1.8-m (72
11

in) long (including the extension into the receiver vessel), with a volume of 0.028 m3.The receiver vessel is a 0.86-m (34 in) internal diameter cylinder closed by semi-ellipticalheads, with a length of approximately 1.6 m (64 in) between head seams and a volumeof 1.18 m3. Both vessels are of heavy construction, rated to withstand internal pressuresof up to 70 bar (1030 psi). The receiver vessel is equipped with electrical heaters anddigital controllers that enable the temperature of the receiver to be adjusted betweenroom temperature and about 100◦C.
Figure 12: Elevation view of HYJET facility.
The driver vessel is used as a jet or torch igniter2 in the present tests. A mixture ofhydrogen and air or hydrogen and oxygen is ignited by an electrical spark to produce atorch of hot products, which ignites the mixture in the receiver tank. Such a torch isan extremely effective ignition source and eliminates problems with inadequate ignitionenergy that often arise in flammability limit testing with electrical igniters. The smallvolume of the driver vessel relative to the receiver ensures that negligible pressure risein the receiver occurs due to the flow of gas from the driver into the receiver. Thismakes it very easy to identify when combustion takes place. An example of the pressuresignals in the driver and receiver are shown in Fig. 13 for a case in which combustionwas successfully initiated.
The torch enters the receiver when the combustion in the driver ruptures a membraneor diaphragm that initially separates the driver and the receiver vessels. The diaphragmand nozzle used to control the size of the torch are located at the end of the driver, whichprotrudes about 0.l63 m (25 in) into the tank. A removable nozzle adapter/diaphragmholder is located at the end of the driver. Six nozzle diameters from 6.35 to 92 mm (0.25to 3.625 in) are available. The diaphragms used in these tests are 0.125-mm (0.005 in)thick mylar. When the facility is closed, the end of the driver is located so it can beobserved by the schlieren system through 118-mm (4-5/8 in) diameter windows in theside of the tank (see Fig. 14).
2Other ignition sources will be tested in a subsequent phase of these experiments.
12

0
2
4
6
8
10
12
14
0 0.5 1 1.5
Pre
ssur
e,
ba
r
Time, s
Driver
Receiver
Figure 13: Pressure signals in the driver and receiver for test 305. Successful initiationof combustion, 300 ml of Jet A, 40◦C.
Figure 14: Plan view of HYJET facility, illustrating light path for schlieren system.
The driver and receiver vessels are instrumented with pressure and temperature trans-ducers. The pressure transducers are Kulite brand strain gauge instruments with athermal protection system constructed of sintered metal. The temperature transducersare type-K thermocouples. The thermocouple bead is rather large so that these mea-surements are not indicative of true gas temperature and are only used to evaluate thepresence or absence of combustion. Data are recorded on a PC-based data acquisition
13
system after being amplified and filtered. Typical acquisition rates are 103 Hz and dataare recorded for about 4 s. The schlieren system uses a continuous arc-lamp source. Af-ter passing through the optical system, the image is split between a Pullnix CCD videocamera and a Cordin 350 framing camera. In the present tests, the windows were oftencovered with soot and only low-contrast video recordings were obtained in many cases.
3.2 Test Conditions, Procedures, and Results
The test procedure is to install the mylar diaphragm, evacuate both vessels and then fill tothe desired gas composition using partial pressures as measured by precision mechanicalgauges (Heise). A circulation pump is used to mix the gases in the driver and a 16-inchdiameter, two-bladed fan is used to stir the contents of the receiver tank. The pump andfan are turned off before igniting the mixture in the driver vessel.
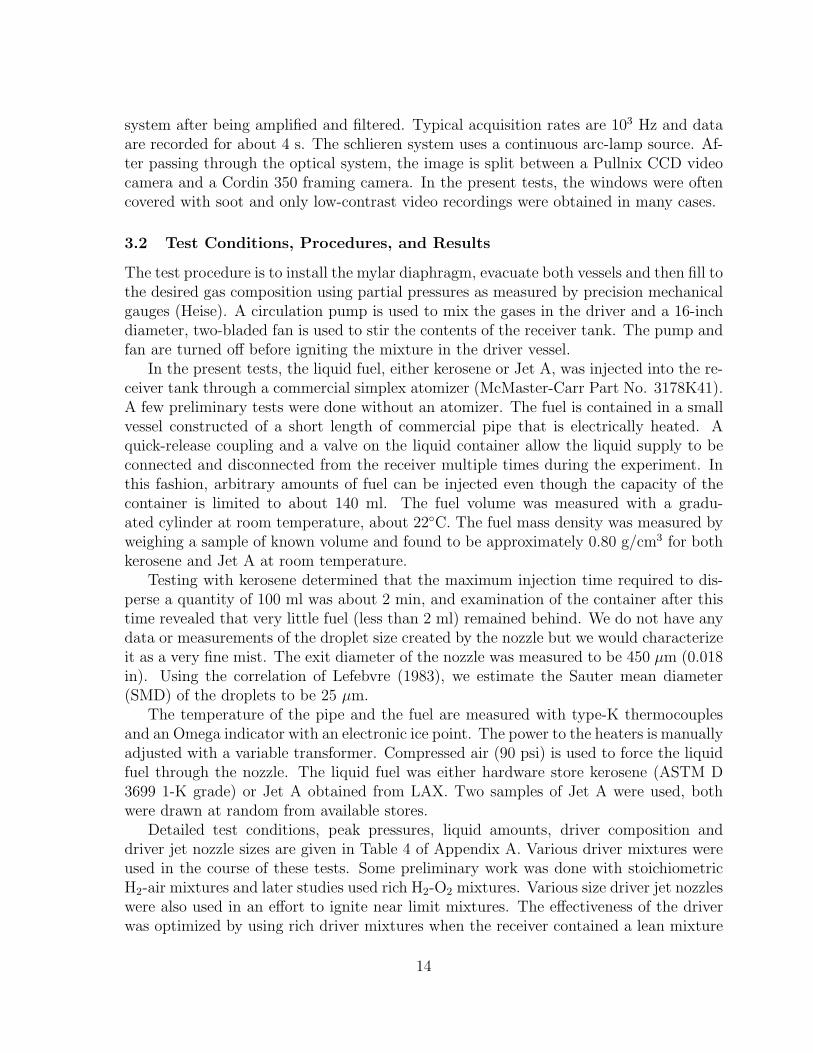
In the present tests, the liquid fuel, either kerosene or Jet A, was injected into the re-ceiver tank through a commercial simplex atomizer (McMaster-Carr Part No. 3178K41).A few preliminary tests were done without an atomizer. The fuel is contained in a smallvessel constructed of a short length of commercial pipe that is electrically heated. Aquick-release coupling and a valve on the liquid container allow the liquid supply to beconnected and disconnected from the receiver multiple times during the experiment. Inthis fashion, arbitrary amounts of fuel can be injected even though the capacity of thecontainer is limited to about 140 ml. The fuel volume was measured with a gradu-ated cylinder at room temperature, about 22◦C. The fuel mass density was measured byweighing a sample of known volume and found to be approximately 0.80 g/cm3 for bothkerosene and Jet A at room temperature.
Testing with kerosene determined that the maximum injection time required to dis-perse a quantity of 100 ml was about 2 min, and examination of the container after thistime revealed that very little fuel (less than 2 ml) remained behind. We do not have anydata or measurements of the droplet size created by the nozzle but we would characterizeit as a very fine mist. The exit diameter of the nozzle was measured to be 450 µm (0.018in). Using the correlation of Lefebvre (1983), we estimate the Sauter mean diameter(SMD) of the droplets to be 25 µm.
The temperature of the pipe and the fuel are measured with type-K thermocouplesand an Omega indicator with an electronic ice point. The power to the heaters is manuallyadjusted with a variable transformer. Compressed air (90 psi) is used to force the liquidfuel through the nozzle. The liquid fuel was either hardware store kerosene (ASTM D3699 1-K grade) or Jet A obtained from LAX. Two samples of Jet A were used, bothwere drawn at random from available stores.
Detailed test conditions, peak pressures, liquid amounts, driver composition anddriver jet nozzle sizes are given in Table 4 of Appendix A. Various driver mixtures wereused in the course of these tests. Some preliminary work was done with stoichiometricH2-air mixtures and later studies used rich H2-O2 mixtures. Various size driver jet nozzleswere also used in an effort to ignite near limit mixtures. The effectiveness of the driverwas optimized by using rich driver mixtures when the receiver contained a lean mixture
14

and lean driver mixtures when the receiver contained a rich mixture.We have carried out several series of tests to explore the issues related to flammability
in Jet A and kerosene. Each of the various test series are described in detail in subsequentsections.
3.2.1 Preliminary Tests
Tests 197 to 205 of Table 4 were exploratory and were carried out to determine thefeasibility of doing tests with kerosene and Jet A in the HYJET facility. The fuel washeated to a high temperature (over 100◦C) and injected into the tank through a 1/2-inchopening without any atomization. We have mentioned these tests only to indicate thenature of the data and no further analyses of these results will be presented.
Tests 206 to 231 were part of another test program. Tests 232 to 253 should also beconsidered as preliminary. During these tests, the effect of using different compositiondrivers, driver jet nozzle size and fuel type were examined. Many of these tests werecarried out with kerosene. These tests indicated that at low temperatures substantialdifferences in combustion behavior were found between kerosene and Jet A. Tests 254and later used either kerosene at high temperatures or Jet A.
Tests 232 and later (except 268 and 269) were carried out with the simplex atomizerand regulated fuel temperatures. The condition of the fuel within the tank was not aswell characterized in tests 232 to 253 as it was in later tests. The procedure in 232 to253 was to inject the fuel with the mixing fan on, continue to mix for 10 min and thento ignite while the fan was operating. Apparently this resulted in some fraction of thefuel being suspended as a mist since for Jet A, higher peak pressures were obtained intests 250 to 253 than in later tests (269 to 274) in which a much longer time (30-40 min)elapsed between injection and ignition.
Comparison of results with Jet A (252 and 253) and kerosene (245 and 246) at 40◦Cindicates that higher peak pressures were obtained with kerosene under these test condi-tions. Pressure traces from two tests (245 and 246) with kerosene are shown in Fig. 15.The substantially higher peak pressures (1.5 to 3 bar) in comparison with Jet A (1 bar)indicate that much more mass of fuel is participating in the combustion in the case ofkerosene than in Jet A. This suggests that the vapor pressure of kerosene is higher thanJet A at temperatures less than 60 to 80◦C. Less likely are gross differences in liquidbehavior (viscosity, surface tension) that would result in aerosol drop size differences.On the other hand, at a temperature of 100◦C, essentially identical peak pressures areobtained, indicating that the energy released from hardware-store kerosene and Jet A isvery similar.
3.2.2 Tests at 100◦C
Tests 254 to 265 used kerosene; tests 288 to 300 used Jet A. In these tests, the fuel andair were both at 100◦C and at a pressure of 0.585 bar. The fuel was injected throughthe simplex nozzle and allowed to vaporize for 10 minutes with the mixing fan running.
15

0
1
2
3
4
5
0 0.5 1 1.5
Pre
ssur
e, b
ar
Time, s
100
50 ml
Figure 15: Pressure histories for combustion of kerosene, tests 245 and 246. Air temper-ature of 40◦C, pressure 0.585 bar (14 kft equivalent). Driver jet 1-in diam., 80% H2, 20%O2.
Pressure histories for near-limit cases are shown in Fig. 16. These results indicate thatfor fuel at this temperature, the flammability limit is approximately 25 g/m3.
These tests were carried out to determine the combustion overpressure as a functionof fuel concentration under conditions where the fuel would be completely gaseous. Thepeak pressures are given as a function of fuel amount in Fig. 17.
3.2.3 Variable Temperature series
Tests 271 to 287 were carried out with a fixed amount of liquid (50 ml) and temperaturesbetween 21 and 100◦C for both fuel and air. The fuel was injected through the simplexnozzle, and the mist was allowed to evaporate and settle for 30 minutes. The mixing fanwas run for 10 minutes before ignition. Pressure histories for selected cases are shown inFig. 18. The peak pressures are summarized in Fig. 19.
3.2.4 Variable volume series at 40◦C
Tests 301 to 308 were carried out with larger amounts of fuel, up to 700 ml, at a temper-ature of 40◦C. The fuel was injected at a lower pressure (0.239 bar, equivalent to 35 kft),allowed to evaporate for 30 minutes, the tank was filled with air to a pressure of 0.585 bar(14 kft equivalent), the contents were mixed for 10 minutes and then burned. The testwas carried out in this fashion to minimize the amount of liquid fuel that was suspendedin the form of a mist within the tank. A 10 µm radius droplet has a terminal velocity of
16

0.5
1
1.5
2
2.5
3
3.5
0 0.5 1 1.5 2
Rec
eive
r P
ress
ure,
bar
Time, s
20 ml
25 ml
30 ml
40 ml
Figure 16: Pressure histories for combustion near the lean limit of gaseous Jet A in airat a temperature of 100◦C, pressure 0.585 bar (14 kft equivalent). Tests 288, 298, 289,and 290.
0
1
2
3
4
5
0 50 100 150
LAX Jet AKerosene
Pea
k R
ecei
ver
Pre
ssur
e, b
ar
ml Fuel
Figure 17: Peak pressure as a function of fuel amount for gaseous kerosene and Jet A.Fuel and air temperature 100◦C, pressure 0.585 bar (14 kft equivalent). Tests 255 to 265and 288 to 300.
about 10 mm/s in still air, yielding a characteristic time of about 86 s for the droplets tosettle out of the atmosphere of the tank onto the tank walls. By waiting approximately
17

0.5
1
1.5
2
2.5
3
3.5
0 0.2 0.4 0.6 0.8 1 1.2 1.4
Rec
eive
r P
ress
ure,
bar
Time, s
25, 45 C
60 C
65 C
70 C
80, 100 C
Figure 18: Pressure histories for combustion of Jet A in air at temperatures between 21and 100◦C, pressure 0.585 bar (14 kft equivalent). The volume of liquid fuel injected was50 ml in all cases. Tests 271 to 281.
0.5
1
1.5
2
2.5
3
3.5
4
4.5
20 40 60 80 100 120
Pea
k P
ress
ure,
bar
Temperature, Degrees C
Figure 19: Peak pressures for combustion of gaseous Jet A in air at temperatures between21 and 100◦C, pressure 0.585 bar (14 kft equivalent). The volume of liquid fuel injectedwas 50 ml in all cases. Tests 271 to 281.
20 characteristic settling times prior to filling with air, we expect that all of the dropletsexcept those less than 2 µm in diameter have settled out of suspension. Comparisonswith Ott’s results (Fig. 26) indicate that this strategy was successful at minimizing the
18

mass of suspended liquid.Pressure histories for fuel volumes between 150 and 700 ml are shown in Fig. 20. As
shown in Fig. 21, the pressure at which the fuel is injected has little influence on thepeak pressure. The difference between the two pressure traces suggests a slightly slowerflame speed for the 14 kft injection case but this could simply be test-to-test variability.
These tests indicate that the quantity of liquid fuel used has a marked effect eventhough the combustion is taking place in the gas phase. At 40◦C, only about 10% of thefuel is actually vaporized and participates in the combustion. This is shown in Fig. 22,where the results for 30 ml at 100◦C is shown to be comparable to those obtained with300 ml of fuel at 40◦C.
These results explain why we had so much difficulty attempting to get ignition inearlier tests with only 50 to 100 ml of fuel at low temperatures (less than 40◦C). At thesetemperatures, large amounts of liquid fuel are required so that a sufficient quantity ofvapor will be produced.
0.5
1
1.5
2
2.5
3
3.5
0 0.5 1 1.5
Rec
eive
r P
ress
ure,
bar
Time, s
No Fuel (100 C)
150 ml
200 ml
300, 400, 500, 700 ml
Figure 20: Pressure histories for combustion of gaseous Jet A in air at a temperature of40◦C, and a pressure 0.585 bar (14 kft equivalent). Fuel was injected at a pressure of0.239 bar, equivalent to 35 kft. Tests 300 to 307.
3.3 Peak Pressure Estimates
The peak pressure obtained in an explosion can be estimated by computing the equilib-rium products for a constant-volume, adiabatic, complete combustion process. Exper-iments with pure substances as fuels show that measured values are consistently lowerthan adiabatic estimates due to heat transfer during the burn (Shepherd and Ratzel1985) and in the case of lean mixtures, incomplete combustion. Some relevant propertiesof pure fuels are given in Tables 1 and 2.
19

0.5
1
1.5
2
2.5
3
0 0.2 0.4 0.6 0.8 1 1.2 1.4
Rec
eive
r P
ress
ure,
bar
Time, s
Inject at 14 kft
Inject at 35 kft
Figure 21: Pressure histories for combustion of gaseous Jet A in air at a temperature of40◦C, and a pressure 0.585 bar (14 kft equivalent). Fuel was injected at a pressure of0.239 bar, equivalent to 35 kft in test 305 and 0.585 bar, equivalent to 14 kft in test 310.
0.5
1
1.5
2
2.5
3
0 0.5 1 1.5
LAX Jet A in air at 14 kft
Rec
eive
r P
ress
ure,
bar
Time, s
300 ml at 40 C
30 ml at 100 C
(Injected at .239 bar)
Figure 22: Pressure histories for combustion of gaseous Jet A demonstrating the effectof fuel amount and ambient temperature. Tests 305 and 289.
20

Table 1: Physical properties of single component hydrocarbon fuels (Reid et al. 1987;Kuchta 1985).
Fuel Formula W Tc Pc Tb ∆Hlv ρl
(g/mol) (K) (bar) (K) (kJ/mol) (g/cm3)
Alkanes
hexane C6H14 86.18 507.4 29.3 341.9 28.9 0.659octane C8H18 114.2 568.8 24.5 398.8 34.4 0.703decane C10H22 142.3 617.6 20.8 447.3 39.3 0.730dodecane C12H26 170.3 658.3 18 489.5 43.6 0.748
Aromatics
benzene C6H6 78.1 562.1 48.3 353.3 30.8 0.885methylnapthalene C11H10 142.2 772 35.2 517.8 46.0 1.02diphenylmethane C13H12 168 767 29.4 537.5 - 1.006
Table 2: Combustion properties of single component hydrocarbon fuels (Reid et al. 1987;Kuchta 1985). X indicates molar or volume fraction at NTP.
Fuel ∆H◦f Q q eLFL XLFL XST XUFL fLFL
(kJ/mol) (kJ/mol) (MJ/kg) (MJ/kg) (%) (%) (%) (kg/kg)
Alkanes
C6H14 -167.4 3890. 45.1 1.61 1.2 2.16 7.4 .036C8H18 -208.5 5120. 44.8 1.68 0.95 1.65 6.5 .038C10H22 -249.9 6350. 44.6 1.64 0.75 1.33 5.6 .037C12H26 -290.9 7620. 44.7 1.58 0.6 1.12 - .036
Aromatics
C6H6 82.9 3170. 40.6 1.42 1.3 2.72 7.9 .036C11H10 116.8 5650. 39.8 1.56 0.8 1.53 - .040C13H12 89.2 6660. 39.6 1.61 0.7 1.29 - .041
21

Adiabatic explosion pressures are computed by using conservation of energy
Ereactants(T1) = Eproducts(T2) (1)
to determine the explosion temperature T2 and the ideal gas law to determine the explo-sion pressure P2
P2 = P1R2T2
R1T1(2)
For the most realistic solutions, the composition of the products is simultaneously de-termined by a chemical equilibrium computation. We use the computer code STANJAN(Reynolds 1986) for this purpose. A simple approximation to the peak pressure in leanmixtures can be found by equating the energy released in the fuel to the temperaturerise in the products, which is mainly air for lean mixtures
Maircv (T2 − T1) ≈ Mfuelq (3)
where cv is the specific heat capacity of the air and q is the specific heat of combustion.Combining this with the ideal gas law, we have
P2 − P1 ≈ P1Mfuel
Mair
q
cvT1(4)
This indicates that the two main factors are fuel/air mass ratio and the energy contentof the fuel. For Jet A, q = 42.8 MJ/kg and for hot air, cv ≈ 850 J/kg·K, yielding a value
q
cvT1= 158. (5)
for T1 = 40◦C. We compare “exact” solutions (using the pseudo-Jet A substance modelwith W = 160) to the energy balance, Eq. 1, with the approximate model, Eq. 4 forlean mixtures in Fig. 23. Clearly, this simple model is only appropriate for mixtureswith Mfuel/Mair ≤ 0.040. As the fuel/air ratio increases above this value, the increasingamount of dissociation and increase in heat capacity of the products causes the “exact”values to increasingly fall below the idealized model predictions.
We have compared our measured values with computations for both pure fuels and apseudo-Jet A substance. On a mass basis, kg fuel per kg of air, the comparison dependson two fuel properties: 1) the ratio of hydrogen to carbon atoms in the molecule; 2)the heat of combustion or equivalently, the heat of formation of the fuel. The extremesin composition are given by paraffins, which have twice as many H-atoms as C-atoms,and aromatics, which have approximately the same number of H-atoms and C-atoms.The specification for Jet A (ASTM 1665) has the maximum concentration of aromaticsto be 20%. A preliminary GC-MS analysis reported in Appendix B verifies that somearomatics are present although the majority of the compounds are straight or branchedalkanes.
22

0.5
1.5
2.5
3.5
4.5
5.5
0 0.01 0.02 0.03 0.04 0.05 0.06 0.07 0.08 0.09 0.1
fuel/air mass ratio
P (
ba
r)
STANJAN (100 C)Simple model (100 C)STANJAN (40 C)Simple model (40 C)
Figure 23: Comparison of “exact” solutions to adiabatic explosion pressure with theapproximate model of Eq. 4. Pseudo-Jet A substance (160 g/mol) at two initial temper-atures (40 and 100◦C) and an initial pressure of 0.585 bar.
Computed results (using STANJAN) for paraffin hydrocarbons (alkanes, CnH2n+2)and some aromatics are given in Fig. 24. These results are given at initial conditions of.585 bar and 100◦C in order to compare with our high-temperature experimental results.
From these comparisons, it is apparent that Jet A has a composition that is interme-diate to these extremes. An approach to this issue is to compute combustion adiabats fora series of compounds with a fixed heat of combustion, q = 42.8 MJ/kg and a variableH/C ratio. The effective heat of formation ∆fH
◦ of these compounds was determinedby solving the enthalpy balance equation. Consider a stoichiometric reaction of a generichydrocarbon fuel. The oxygen-balanced reaction is
CnHm + (n + m4 )O2 −→ nCO2 + m
2 H2O
The heat of combustion per mole of fuel is
Q = ∆fH◦fuel − n∆fH
◦CO2
− m
2∆fH
◦H2O (6)
and the specific heat of combustion q is
q =Q
Wfuel
Wfuel = 12n + m (7)
The fuel-air mass ratio f for a stoichiometric mixture is only a function of the ratio m/nof hydrogen to carbon atoms. From the oxygen-balanced reaction given previously, wehave
23

0
1
2
3
4
5
6
0.00 0.02 0.04 0.06 0.08 0.10 0.12 0.14 0.16 0.18 0.20 0.22
pres
sure
(ba
r)
fuel-air mass ratio
hexaneoctanedecane
dodecanebenzene
methyl napthalenediphenylmethaneJet A, T = 373 K
Figure 24: Comparison of computed adiabatic, constant volume explosion pressures foralkanes and aromatics with experimental results for Jet A at 0.585 bar, 100◦C.
fst ≡(
Mfuel
Mair
)st
=12 + m/n
137.3(1 + m/4n)(8)
When m/n =2 (case of alkanes), fst = 0.068 and for m/n =1 (case of aromatics), fst =0.076.
A series of computations of this type are shown in Fig. 25a. For these cases, thenumber of carbon atoms was fixed at 12 and the number of hydrogen atoms was varied.The effect of initial temperature is shown in Fig. 25b. The peak pressure is lower athigher initial temperatures since fractional change in thermal energy is smaller whenstarting at a higher initial temperature.
The peak pressure observed by Nestor and Ott are consistent with our value of 3bar (45 psi) observed at 40◦C. The values of ∆Pmax, the maximum pressure rise, ob-tained by Ott in his static tests were correlated approximately by a scaled vapor pressurecurve. This can be justified by observing that the lean combustion energy balance canbe rewritten in terms of the fuel vapor partial pressure Pfuel as
P2 − P1 =Wfuel
Wair
q
cvT1Pfuel (9)
If we assume that the fuel vapor is in equilibrium with fuel liquid, which is the case inOtt’s tests, then the fuel vapor partial pressure is equal to the fuel vapor pressure Pσ,
24

resulting in a peak pressure rise of
∆Pmax = αPσ(T1) α =Wfuel
Wair
q
cvT1(10)
0
1
2
3
4
5
6
0.00 0.02 0.04 0.06 0.08 0.10 0.12 0.14 0.16 0.18
pres
sure
(ba
r)
fuel-air mass ratio
W = 168 H/C = 2.00W = 166 H/C = 1.83W = 164 H/C = 1.66W = 162 H/C = 1.50W = 160 H/C = 1.33W = 158 H/C = 1.16W = 156 H/C = 1.00
Jet-A, 100C
0
1
2
3
4
5
6
0.00 0.02 0.04 0.06 0.08 0.10 0.12 0.14 0.16 0.18
pres
sure
(ba
r)
fuel-air mass ratio
T = 373 KT = 313 K
Jet A, T = 373 K
(a) (b)
Figure 25: Comparison of computed adiabatic, constant volume explosion pressures fora pseudo-fuel of fixed heat of combustion with experimental results for Jet A at 0.585bar, 100◦C. (a) results for variable H/C ratio at T = 373 K. (b) results for a fixed H/Cratio for T = 313 K and 373 K.
Note that this result indicates that for lean combustion, the peak pressure rise isindependent of the initial pressure, as found experimentally by Ott. Ott’s curve fits andthe present data are shown together in Fig. 26.
Equation 10 depends on the fuel molar mass Wfuel. Therefore, we need to knowboth the vapor pressure Pσ(T ) and the molar mass Wfuel as a function of temperaturein order to predict the combustion pressure rise. As discussed below, there is substantialuncertainty associated with reported values of the vapor pressure of Jet A and the molarmass has not been quantified as a function of temperature. The vapor pressure estimateof Ott results in a value of α = 460, implying a fuel molar mass of 84, substantially lowerthan the value of 144 obtained by Kosvic et al. (1971) or the value of 170 estimated by theAPI gravity correlation (p. 333 of Lefebvre 1983). In fact, the composition and molarmass of the vapor are functions (unknown at present) of the fuel temperature. Somepreliminary chemical analyses of liquid and vapor Jet A are reported in Appendix B.These results indicate that the vapor does have an average molar mass substantially lessthan the liquid but this has not been quantified at this time.
4 Pressure Trace Analysis
The pressure-time histories observed in the present experiments contain informationabout the growth of the explosion in time. These data may find application to pre-dicting the duration of the CWT explosion. However, there are significant aspects of the
25

0
1
2
3
4
5
6
7
8
0 10 20 30 40 50 60
temperature (C)
peak
pre
ssur
e ris
e (b
ar)
Ott, Center ignition
Ott, end ignition
Jet A (CIT)
Figure 26: Comparison of Ott’s measured peak explosion pressure rise with presentexperimental results for Jet A at 0.585 bar and 40◦C .
CWT that are not modeled in the present tests. These include the much larger size ofthe CWT (50 m3), subdivision of the CWT into compartments with connecting passage-ways, the presence of vents between the tank and the atmosphere, the liquid layer onthe floor of the tank and the deformation and failure of the CWT structure during theexplosion. These differences are so substantial that we feel that larger-scale testing withmore prototypic tanks is required to obtain reliable insight and quantitative evaluationof these effects.
However, it is useful to pursue the analysis of the explosion event and develop somesimple models for the pressure-time history. These models serve to illustrate some of thedifficulties in explosion analysis and motivate the need for more prototypic experimentsand also more sophisticated numerical analyses. In general, modeling and prediction ofexplosions require a numerical solution of the governing partial differential equations offluid dynamics together with a model for the chemical reactions in the flame. For acomplex structure such as the CWT, this is very challenging since the simulation mustbe carried out in three space dimensions and requires substantial computation resources.In the case of a structure such as the CWT, structural response and failure may also haveto be simultaneously considered. There are research groups who are presently solvingproblems of this type, a summary of the state of the art in numerical modeling is givenby Hjertager (1993) and validation of the results against experiments is given in Popatet al. (1996).
26

4.1 Simple Explosion Modeling
Simple models of explosions are based on assuming a geometry for the flame front, low-speed flow and laminar flame propagation. Analytical approaches are summarized byBradley and Mitcheson (1976) and numerical methods are described by Ural and Zalosh(1988). Other issues associated with modeling explosions are turbulence (Tamanini andChafee 1990), heat loss by radiation and convection (Ural and Zalosh 1988; Shepherdand Ratzel 1985), acoustic waves (Tamanini and Chafee 1992), incomplete combustionand buoyancy (Ural and Zalosh 1988; Nagy et al. 1971). Venting into the atmosphere(NFPA68 1994; Bradley and Mitcheson 1978; Cummings et al. 1984) and venting toanother tank (Mulpuru and Wilkin 1982) have been extensively discussed in the contextof hazard analysis and safety studies.
The basis for all simple models is conservation of energy for an adiabatic, constantvolume system: E = constant. This provides a unique relationship between the averagepressure P and the amount of burned gas Mb. For an ideal gas with a constant ratio ofspecific heats γ and specific heat of combustion q, this relationship is
E =pV
γ − 1− Mbq (11)
where V is the total volume of the vessel. The peak or maximum pressure Pm is obtainedwhen all of the gas is burned Mb = M◦ = ρ◦V .
∆Pm = Pm − P◦ = (γ − 1)qM◦V
(12)
The constancy of the energy E leads to the following ordinary differential equation forpressure
dP
dt= ∆Pm
1M◦
dMb
dt(13)
The rate at which gas is being burned can be computed by considering the flame ashaving an area Af (t) which is consuming unburned gas of density ρu with a laminarburning speed of Su.
dMb
dt= AfρuSu (14)
The effect of turbulence is to distort the flame front and increase the product AfSu
substantially, in some cases up to 100 times larger than the laminar values. The distortionof the flame front occurs over a wide range of length scales, determined by the natureof the turbulent flow and the interaction of the flame with the flow. Engineering modelsusually treat turbulent flame propagation by replacing the laminar burning speed withan effective “turbulent” value ST and interpreting the area Af as the area of a smoothsurface passing through the average location of the turbulent flame. Turbulent burningspeeds can be up to a factor of 20 higher than the laminar values and increase withincreasing turbulent intensity.
27

Note the distinction between burning speed and the apparent velocity that a flameis observed to propagate with during an explosion. The flame velocity Vf is locally thevector sum of the fluid velocity u and the burning speed directed along the normal n̂ tothe surface defined by the flame front
Vf = u + n̂Su (15)
Since the volume occupied by the combustion products is larger than the volume ofthe reactants, the flame propagation always results in displacement of the surroundingreactants, inducing a flow u. Therefore the apparent laminar flame speed is higher thanthe laminar burning velocity by up to a factor of ρu/ρb, where ρu is the mass density ofunburned gas and ρb is the mass density of burned gas.
As the flame propagates through a closed volume, the pressure increases uniformlyin space, compressing both burned and unburned gases. This is an approximation thatis valid as long as the flame speed is small relative to the acoustic speed. Fast flameswill produce spatial variations in pressure that are manifested as acoustic waves and inextreme cases, shock waves. The flame speed is sufficiently low in current tests so thatsuch pressure oscillations are not observed.
If we neglect the effects of heat transfer during the burn, the unburned gases arespatially uniform and conditions can be predicted by using the isentropic relationships
Tu = T◦(
P
P◦
) γ−1γ
ρu = ρ◦(
P
P◦
) 1γ
(16)
For a given fuel concentration, the flame speed is dependent on both temperature andpressure. For the purposes of engineering studies, the dependence is usually taken to be(Gaydon and Wolfhard 1979)
Su = Sou
(P
P◦
)n ( T
T◦
)2
(17)
where the parameter n is substance specific.Flame speed is also known to be a function of the the fluid motion (strain rate)
but this is beyond the present considerations. The laminar flame speed at standardconditions is a function of the fuel concentration and must be determined experimentally,along with the exponent n. Typical hydrocarbon-air flame laminar flame speeds have amaximum value of about 30 to 40 cm/s for stoichiometric mixtures. A compilation ofolder data is given in Gibbs and Calcote (1959), Davis et al. (1997) discuss the issueof strain rate corrections for toluene and benzene, data for fuels similar to octane aresummarized in Heywood (1988). The leaner the mixture, the lower the flame speed.Near the flammability limit, the flame speed decreases to about 4 to 5 cm/s. There isno data available in the literature on Jet A flame speeds other than a range of 0.3 to 0.6m/s quoted in CRC (1983). There is some data available (Richards and Lefebrve 1989)on turbulent flame speeds in kerosene sprays but this is probably only relevant to laterstages of the explosion if the liquid layer is lofted and dispersed. Estimates of the flame
28

speed in Jet A vapor-air mixtures will be made in a later phase of the present researchprogram.
Given a suitable expression for flame speed, the key remaining issue is the flamearea dependence on time Af (t). This requires experimental data or simplifying assump-tions about the shape of flame. However, before considering specific cases, the pressureequation can be reduced to a form that clearly indicates the key parameters:
dP
dt=
S◦u∆Pm
V 1/3
Su
S◦u
ρ
ρ◦
Af (t)V 2/3 (18)
From this, we infer that a characteristic value (such as the maximum) of the pressuretime derivative must scale as
(dP
dt
)max
∝ S◦u∆Pm
V 1/3 (19)
Based on this notion, the conventional way (NFPA68 1994) to analyze explosion pressuretraces is to compute a pressure rise coefficient Kg defined as
Kg ≡ V 1/3
(dP
dt
)max
. (20)
Values of Kg for various gases and vessel volumes V are tabulated in NFPA68 (1994).Although the simple scaling relationship indicates that Kg should be independent ofvolume,
Kg ∝ S◦u∆Pm (21)
the influence of scale on the turbulent flame propagation causes a weak dependence onthe size of the vessel Kg ∼ ln V . The exact dependence is substance dependent anddata is available for selected fuels in NFPA68 (1994). In a 1 m3 vessel, typical values forstoichiometric hydrocarbon-air fuels are Kg = 100 bar-m/s. The value of Kg dependsalso on the fuel type, concentration, vessel shape and initial turbulence level in the vessel.Experimental measurement is the only reliable guide in unusual situations such as the747 CWT.
For simple geometries, the area of the flame can be related to the fraction of burnedgas, which in turn can be related to the instantaneous pressure. This leads to expres-sions for the scaled area as a function of pressure and the pressure equation becomes anordinary differential equation. This is the basis for many approximate solution methodsfor the pressure history during an explosion. Dimensional analysis leads to the followingexpression
dP
dt=
S◦u∆Pm
V 1/3
Su
S◦u
F (P/P◦, Pm/P◦, γ) (22)
The function F depends on the exact choice of model. Three simple geometries andone common ad hoc model are described subsequently. All of these models use the
29

relationship (Eq. 13) between burned gas mass fraction and pressure. Since the productsof combustion are in a spatially nonuniform state, it is easier to work with the compressedreactants or unburned volume in the computation. Integration of Eq. 13 yields
P − P◦Pm − P◦
=Mb
M◦= 1 − Mu/M◦ = 1 − ρuVu
ρ◦V◦(23)
The relationship of unburned volume to flame surface area has to be separately deter-mined for each geometrical case.
Spherical The vessel is a sphere of radius R and at any time the flame is assumed tobe a sphere with radius r. The function F for this case can be computed to be
F = 3(4π
3
)1/3 ( P
P◦
)1/γ1 −
(P◦P
) 1γ(
Pm − P
Pm − P◦
)2/3
(24)
Spherical propagation is characteristic of the initial phase of any explosion and can beused to determine the initial pressure history. Integration of the pressure rise equationfor early times (P ≤ 2P◦) yields (Nagy et al. 1971) a cubic relationship
P (t) ≈ P◦ + ∆Pm
(Pm
P◦
)2 (S◦ut
R
)3
(25)
which has been used to determine initial flame speeds S◦u (or ST in the turbulent case).
The maximum value of F occurs at the end of the burn and is
Fs,max = 3(4π
3
)1/3 (Pm
P◦
)1/γ
(26)
which has a numerical value of 15.5 for Pm = 3, P◦ = 0.585 and γ = 1.4.
Cylindrical In this case, the container is cylinder of length L and radius R. Thefunction F is
F = 2(
πL
R
)1/3 ( P
P◦
)1/γ1 −
(P◦P
) 1γ(
Pm − P
Pm − P◦
)1/2
(27)
This case is relevant to jet initiation along the axis of a cylindrical vessel where theinitiation occurs rapidly compared to the flame propagation. The maximum value of Foccurs at the end of the burn and is
Fc,max = 2(
πL
R
)1/3 (Pm
P◦
)1/γ
(28)
which has a numerical value of 11.9 for Pm = 3, P◦ = 0.585, L/R = 2, and γ = 1.4.
30

Planar The planar case is appropriate to a planar flame front moving axially along atube of radius R and length L. This situation is appropriate to ignition at the end of atube. In this case, the function F is
F = π1/3(
R
L
)2/3 ( P
P◦
)1/γ
(29)
The maximum value of F occurs at the end of the burn and is
Fp,max = π1/3(
R
L
)2/3 (Pm
P◦
)1/γ
(30)
which has a numerical value of 5.9 for Pm = 3, P◦ = 0.585, L/R = 2, and γ = 1.4.
Kinney and Graham Kinney and Graham (1985) have proposed an ad hoc relation-ship for F which is based on the analysis of experimental pressure-time histories. Theypresent their model in terms of an empirical coefficient Cr which can be related to Kg.The original Kinney-Graham model is
dP
dt= Cr
(A
V
)(P − P◦)(Pm − P ) (31)
where the coefficient Cr is determined from the maximum rate of pressure rise and A/Vrepresents the surface to volume ratio of the vessel. Using the definition of Kg we findthat
Kg = Cr(∆PM)2
2A
V 2/3 (32)
Kinney and Graham suggest that for stoichiometric fuel-air mixtures a value Cr ≈ 0.6 to0.7 (m /bar s) is appropriate and go on to propose a correlation of Cr with Su which isdimensionally incorrect. Including the dependence of ∆Pm in this correlation, we proposea modified correlation
Cr ≈ 10Su
∆Pm
(33)
This leads to a formulation in terms of the function F as
F = 30(4π
3
)1/3 ( P − P◦Pm − P◦
) [1 −
(P − P◦Pm − P◦
)](34)
These four functions are compared in Fig. 27.For the idealized models, the maximum value of the pressure rise occurs at the end of
combustion while the ad hoc model of Kinney and Graham has the maximum pressurerise occuring when one-half of the mixture mass has been consumed. It is clear that awide range of values of the maximum pressure rise coefficient can be obtained simplyby choosing different flame geometries. This emphasizes the importance of experimentalstudies and more realistic flame simulations in determining pressure history during theexplosion.
31

0
2
4
6
8
10
12
14
16
0.5 1 1.5 2 2.5 3
pressure (bar)
pres
sure
ris
e fu
nctio
n F
Spherical
Cylindrical
Planar
Kinney-Graham
Figure 27: Nondimensional pressure rise functions for P◦ =0.585 and Pm = 3.0, L/R =2, γ = 1.4
4.2 Experimental Parameters
We have not compared any of the models in detail with the present measurements sincethe model assumptions are not particularly realistic. The multiple pressure peaks ob-served in many of the lean mixtures is a characteristic signature of buoyancy and theflame shape cannot be simply described in such situations. Furthermore, the effect ofheat loss during the burn is quite important in determining the peak pressure in thesesituations.
The pressure trace for test 308, 700 ml of Jet A at 40◦C, has been analyzed to illustratethe issues that arise in interpreting pressure histories to obtain effective burning velocities.Figure 28 shows the pressure-time trace for the duration of the burn only. The rate ofpressure rise is estimated by smoothing the original data and then approximating thederivative with the differences between adjacent points:
dP
dtn≈ P (tn) − P (tn−1)
tn − tn−1(35)
The resulting derivative, shown in Fig. 29 is rather noisy but has a clear maximum ofabout 14.3 bar/s which yields a value of Kg equal to 15 bar-m/s.
The value of Kg observed in the present experiments can be compared with valuesobtained in similar studies on single substance hydrocarbon fuels. Values of Kg = 100 to200 are typically quoted (NFPA68 1994; Tamanini and Chafee 1990) for stoichiometricmixtures of methane and propane in 1 m3 vessels. Using the scaling of Eq. 21, thisindicates that the effective burning velocity was about 20 to 40 cm/s in test 308, consistentwith a lean mixture.
The nondimensional pressure rise function F defined in Eq. 22 can be computedby smoothing the numerical derivatives shown in Fig. 29. The results are plotted in
32

0
0.5
1
1.5
2
2.5
3
3.5
0 0.05 0.1 0.15 0.2 0.25
time (s)
pres
sure
(ba
r)
Figure 28: Pressure history during combustion for test 308.
0
5
10
15
20
25
30
0 0.05 0.1 0.15 0.2 0.25
time (s)
dP/d
t (ba
r/s)
Figure 29: Pressure derivative dP/dt during combustion for test 308.
33

Fig. 30 after choosing a reference flame speed of 0.5 m/s. The choice of burning velocityis motivated by the apparent similarity between the F function shape and that of theKinney-Graham model. A burning velocity of 0.5 m/s results in matching the maximumvalue of F=12 for the Kinney-Graham model.
0
5
10
15
0.5 1 1.5 2 2.5 3
P (bar)
pres
sure
ris
e co
effic
ient
F
Figure 30: Nondimensional pressure derivative F vs pressure P during combustion fortest 308.
Another estimate of the burning velocity can be obtained by using the early-timeresult of Eq. 25. The standard method of reducing the data with this equation is to plot∆P 3 vs. time over a short interval after ignition as shown in Fig. 31. Fitting a straightline to the data in these coordinates, the slope of the line can be interpreted using Eq. 25to obtain the initial burning velocity. For test 308, the result is about 1.2 m/s, higher thanthe estimates obtained from either the Kg or Kinney-Graham models. These differencesreflect both the high turbulence level in the jet used to initiate the combustion and thenonspherical nature of the initial flame kernel produced by jet initiation.
Clearly, all of the methods discussed above are indirect methods of determining flamespeeds and the approximations introduced have a substantial effect on the results. Thisaccounts for the range of effective burning speed values of 0.2 to 1.2 m/s inferred fromthese tests. This values are not necessarily representative of the laminar burning velocitysince the effects of turbulence, flame instability and vessel geometry all play a role indetermining the effective burning speed. Future tests will use optical observations andspark ignition to obtain more precise measurements of the laminar burning speed.
34

0
0.2
0.4
0.6
0.8
1
1.2
0 0.02 0.04 0.06 0.08 0.1
time (s)
P1
/3
Figure 31: ∆P 1/3 vs time for an interval just following ignition in test 308.
5 Flammability Limits
A fuel-air mixture is considered flammable when it will sustain flame propagation afterit is ignited. Flammability limits are conventionally measured in terms of the minimumfuel vapor volume (or mole) fraction XLFL where LFL refers to lower flammability limitand maximum fuel vapor concentration XUFL where UFL refers to upper flammabilitylimit. There are extensive compilations of flammability limits (Zabetakis 1965; Kuchta1985) and some representative values are given in Table 2.
Note that when the amount of fuel at the LFL is expressed as a fuel/air mass ratiofLFL, the limiting value is very similar for all of the fuels in Table 2, f = 0.035 to 0.040.This is consistent with the present measurements (Fig. 17) if we define the flammabilitylimit in terms of the transition in the pressure traces observed in Fig. 16. However, thepresent pressure measurements at 100◦C indicate that incomplete combustion can occurat fuel amounts as low as f = 0.025. Measurements with kerosene (Zabetakis and Rosen1957) vapor indicated a limit concentration of about f = 0.040. Another measure of theflammability limit that is independent of substance is the energy content at the LFL,from Table 2 this falls in the range of 1.4 to 1.7 MJ/kg.
For liquid fuels, the conventional way to report flammability is to give a flash pointtemperature as determined by a standardized laboratory test (ASTM D56 1988). For apure substance, the flash point temperature Tflash can be determined from the measuredconcentration limits of flammability, the vapor pressure relation and molar mass. Thatrelationship is
35

Pσ(Tflash) = PXLFL = PfLFL
fLFL + Wfuel/Wair
(36)
where P is the total pressure. This is straightforward to apply for pure fuel and connectsthe flash point to flammability limits measured in tubes in vessels. As Nestor (1967)points out, this is not the case for Jet A.
The specification (ASTM 1655) for Jet A calls out a minimum flash temperature of38◦C, and a potential range of 40 to 60◦C (105 to 140◦F) is given in Kuchta (1973). Flashpoint values of 53 ◦C (CRC 1983), 43◦C (CRC 1967), 48 to 52◦C (Nestor 1967), and 48to 51◦C (Ott 1970) are cited in the literature. This range of values is apparently due tothe range in volatility allowed by the specification. The flammability limit temperaturesmeasured by Ott and Nestor appear (Fig. 4) to fall in the range of 32 to 38◦C, 10 to 15◦Clower than the reported flash temperatures. This is apparently due to the differencesin the standardized flash point test and the tube or vessel tests used by Nestor andOtt. The flash point test relies on visual observation of a “flash” in a small quantity ofvapor whereas the Ott and Nestor tests used visual flame propagation or temperatureand pressure transients in a large volume of vapor.
The flash point of the LAX Jet A used in the present tests was measured at Cal-tech with the Tag closed-cup flash point apparatus using the procedures described inASTM D56 (1988). A value of 48◦C was obtained for the Jet A without any type ofconditioning. This is 8◦C higher than the 40◦C condition for which explosions were con-sistently obtained in the Hyjet testing and 13◦C higher than the limit temperature of35◦C determined in the Nestor study. After the fuel has been used in the vapor pressureapparatus, the flash temperature decreased to 46◦C. The significance of the decrease inflash point is not understood but emphasizes that the relationship between flash pointand fuel handling is not obvious. The hardware store kerosene used in the preliminaryCIT tests has a flash point of 56◦C.
The fuel-air mass ratio measured by Kosvic et al. (1971) at a temperature of 120◦F(49◦C) and a pressure of 1 atm was about 0.070. This is close to a stoichiometric mixtureand a factor of two higher than the flammability limit estimate of 0.035 discussed pre-viously. The temperature flammability limits obtained by Ott and Nestor (Section 2.1)can be interpreted in terms of a fuel-air mass ratios by using Eq. 36, the measured vaporpressure discussed in Section 7 and an assumed fuel molar mass of 86. Using a rangeof 32 to 38◦C for the limit temperature at 1 bar initial pressure, we compute a fuel-airmass ratio between 0.019 and 0.026. Clearly, this computation is sensitive to the valuechosen for the vapor molar mass and further characterization of the vapor is required tosharpen up our estimates. Until that is done, it is unclear how much significance shouldbe given to the difference between the inferred limit values of f for Jet A and the valueof 0.035 found for pure substances.
Finally, there have been a number of studies on mists and sprays (Ott 1970; Nestor1967; Zabetakis and Rosen 1957) that indicate the flammability limit temperature canbe greatly reduced and the peak pressure rise substantially increased by suspending thefuel in the form of a spray or mist of liquid droplets. In this fashion, flammable mists of
36

kerosene and Jet A can be created at even lower temperatures.The flammability of sprays and vapors for a wide range of hydrocarbon compounds
was studied by Burgoyne (1963). He found that if the drop size was sufficiently small (lessthan 20 µm), a mist has similar flame propagation and limit properties as the pure vaporsubstance. Flammability limits were actually decreased with increasing droplet sizes, upto 200 µm diameter, at this size the limit fuel-air mass ratio was less than 0.005. Forsufficiently large droplets, 1 to 1.5-mm diameter, flame propagation becomes impossible.
These results are relevant to an airplane environment since a certain amount of vi-bration will occur during takeoff and in flight. In addition, the explosion process itselfcan cause lofting and atomization of the fuel, possibly resulting in a secondary explosion.
For the purposes of hazard assessment, it is apparent that the flash point is nota reliable guide to explosion hazards of aviation fuels. Explosion testing in vessels ortubes with the appropriate fuel loading is required to evaluate the minimum temperatureassociated with flammability. In addition, the possibility of mists or sprays widens theflammability envelop even further.
6 Ignition Source and Energy
The source of ignition in the TWA 800 explosion is not the focus of the present studyalthough future experiments are planned on determining ignition energy for spark-typeignition sources in Jet A-air mixtures. The present study has been carried out with atorch or jet ignition in order to study flammability rather ignition. Ignition energies formixtures of Jet A vapor and air are apparently not known. Previous studies on ignitionenergy have focused almost exclusively on fuels consisting of a pure substance.
The standard technique (Lewis and von Elbe 1961) for measuring ignition energy is tocreate an electrical discharge with the electrical energy stored in a capacitor. The storedenergy and discharge electrode spacing are varied in order to determine the minimumignition energy (MIE) required to start a propagating flame. The MIE is found to be afunction of fuel type, concentration, and electrode spacing. For hydrocarbon fuels, thesmallest value of the MIE is typically about 0.25 mJ (Lewis and von Elbe 1961; Kuchtaand Clodfelter 1985; Ballal and Lefebvre 1981) for an optimum electrode spacing of 3 to4 mm.
The smallest value of the MIE does not occur for a stoichiometric composition butrather for a rich mixture. The heavier the fuel molecule, i.e., the larger the molar mass,the richer the mixture at which the smallest MIE is found. For example, with hexane-airmixtures, the smallest MIE (0.29 mJ) is found for a mixture with 3.7% (molar) hexane inhexane-air; a stoichiometric mixture contains 2.2% hexane. As the composition is madeprogressively leaner, the MIE increases with decreasing equivalence ratio. For example,a stoichiometric mixture of hexane in air has a MIE of about 1 mJ. It is not known howthe MIE for multicomponent fuels such as Jet A vary as a function of equivalence ratio.This issue is being addressed in ongoing studies at Caltech.
Ignition energies for fuel sprays are higher than for homogeneous gas mixtures. TheMIE is a function of droplet size distribution (Dietrich et al. 1990) and depends strongly
37

1
10
100
-20 -10 0 10 20 30 40 50
temperature (C)
MIE
(m
J)
Kuchta et al correlation
JP-8, Kuchta et al 1971
Figure 32: Minimum ignition energy of JP-8 sprays in air as a function of ambienttemperature. from (Kuchta et al. 1971)
on temperature (CRC 1983). The ignition energy of JP-8 sprays has been measured(Kuchta et al. 1971) and is found to be a decreasing function of fuel and air temperature.The results of Kuchta et al. (1971) are shown in Fig. 32. These were obtained in a 4-indiam. tube with the fuel dispersed through a pneumatic spray nozzle, estimated dropsize of 5 to 10 µm. The reported energy is the stored energy in the capacitor that wasdischarged through a transformer to produce the arc. Electrode location and spacing arenot given but Kuchta et al. state that optimum values were used to give the minimumignition energy. Extrapolating to 115◦F, an ignition energy of less than 2 mJ is predicted.Based on the findings of Burgoyne (1963), this suggests that the ignition energy of a fuelvapor-air mixture is comparable to this value. Tests are in progress to examine thisconjecture.
7 Vapor pressure
The vapor pressure of Jet A has seldom actually been measured but rather most of the“data” have been estimated based on distillation curves (ASTM D86 1990) and extrap-olating measurements (ASTM D2889 1990) or (ASTM D-93) at a single temperature.The extrapolations (CRC 1983; Barnett and Hibbard 1956; CRC 1967) are convention-ally based on the Clausius-Clapeyron equation for the slope of the saturation line σ
(dP
dT
)σ
=∆Hlv
T∆vlv
(37)
This can be approximated as
38

dP
dT=
∆Hlv
RT 2 P (38)
by assuming the vapor specific volume is much greater than the liquid, ∆vlv ≈ vv andthat the vapor is an ideal gas, Pv = RT . For constant heat of vaporization ∆Hlv thisintegrates to
lnP = A − B
T(39)
The coefficients A and B are usually estimated (CRC 1967) by correlations with thedistillation curve slope and the Reid vapor pressure. The resulting vapor pressure es-timates vary widely. We compare in Fig. 33 vapor pressures reported in the literature(Lefebvre 1983; Ott 1970; Rose and Cooper 1977; CRC 1983; Tsoovkun et al. 1985) withexperimental data obtained at Caltech. We suspect that all of the values reported inthe literature (the origin of the Russian values is unknown) are simply evaluations of theapproximate vapor pressure formula, Eq. 39 with different sets of parameters A and B.
Some of the differences between the reported vapor pressures certainly are a reflectionof variations in refining processes for kerosene, Jet A, and Russian fuels. The specification(ASTM 1655) for Jet A allows for some latitude in fuel volatility. Another source ofvariation is the uncertainty associated with the prediction or extrapolation method forvapor pressure. Since the distillation curve measurements are generally rather sparse,every 5 to 10◦F, and the slope appears to change rapidly near the 10% distillation point,the slope cannot be accurately determined from conventional (ASTM D 86) data.
There appears to be almost no actual experimental data for vapor pressure and noprevious efforts to reconcile the various predictions. One measurement that is describedin detail (ASTM D323 1990) is the Reid method, which measures vapor pressure witha mechanical pressure gauge at a temperature of 100◦F and a vapor:liquid volume ratioof 4:1. The vapor pressure of Jet A at this temperature is so low that this techniqueis not very reliable but one such data point (quoted in CRC 530) is shown in Fig. 33.Additional comparisons with single component hydrocarbons are shown in Fig. 34.
The relationship (Eq. 36) between vapor pressure and molar mass at the flammabilitylimit can be used to estimate the molar mass of the fuel vapor. An example using thedata of Nestor is shown in Fig. 35. The relationship (Eq. 10) between peak explosionpressure rise and vapor pressure can also be used to estimate the molar mass of the fuelvapor. An example using the data of Ott is shown in Fig. 36. Note that both the dataand these estimates imply that the molar mass is substantially less than the bulk liquidmean of 160 and molar mass increases with increasing temperature. This is in agreementwith the trends expected on the basis of the simple model described in the next section.
Finally, the relationship of Eq. 36 can be used to estimate the range of vapor pressureto expect at the flammability limit given some bounds on the molar mass of the vapor.Nestor estimates a mean molar mass of 75 using a correlation based on a 5% distillationtemperature (ASTM D86) of 185◦F. On the other hand, Ott estimates (various methods)a molar mass of between 162 and 164 for JP-8. Using these as bounds, we compute that
39

0.1
1
10
100
20 40 60 80 100
temperature (C)
pres
sure
(m
bar)
Jet-A Lefebvre
Jet-A Ott
Kerosene, Rose and Cooper
T-1, TC-1 Russian
CRC 530
Reid VP Test
Jet A (CIT 4/11/97)
Figure 33: Estimated and measured vapor pressure of Jet A. Measurements reported inthe literature contrasted with CIT data.
1
10
100
1000
10000
0 20 40 60 80 100
temperature (C)
pres
sure
(m
bar)
HexaneOctaneDecaneDodecane2.5% Hexane - 97.5% DodecaneJet A (CIT 4/11/97)hexane CIToctane CIT
Figure 34: Estimated (Reid et al. 1987) and measured vapor pressure of single componenthydrocarbons compared with Jet A.
vapor pressure should be between 5.5 and 11 mbar for temperatures between 35 and40◦C. The measurements described below give values between 7.1 and 8.9 mbar over thistemperature range.
40

1
10
100
10 15 20 25 30 35 40
temperature (C)
pres
sure
(m
bar)
Nestor flammability limit, W = 40
Nestor flammability limit, W = 80
Nestor flammability limit, W = 120
Nestor flammability limit, W = 160
Jet A (CIT 4/11/97)
Figure 35: Vapor pressure of Jet A estimated from flammability limits and combus-tion peak pressure rise. Estimated based on Nestor’s flammability limit measurementscompared with CIT data.
1.00
10.00
100.00
20 30 40 50 60
temperature (C)
pres
sure
(m
bar)
Ott, W = 20
Ott, W = 60
Ott, W = 100
Ott, W = 140
Jet A (CIT 4/11/97)
Figure 36: Vapor pressure of Jet A estimated from flammability limits and combustionpeak pressure rise. Estimates based on Ott’s peak pressure rise compared with CIT data.
7.1 Vapor Pressure Measurements
Vapor pressure measurements were undertaken at Caltech using a simple apparatus(Fig. 37) which consisted of a volume of 1700 ml that could be connected to a fuelreservoir of 860 ml, a precision pressure gauge (MKS Baratron) and a vacuum system.
41

The main vessel was immersed in a stirred bath of ethylene glycol which was heated withelectrical heaters controlled by a feedback system connected to a thermocouple immersedin the bath. The output of the pressure gauge was recorded on a chart recorder and acomputer. The fuel temperature is measured by an Omega digital readout attached to athermocouple that is immersed into the fuel within the main vessel.
Before making a set of vapor pressure measurements, the main vessel was evacuated,closed off and checked for leaks over a period of hours. Since a set of measurements takesplace over a day-long period and some of the fuels have very low vapor pressures, the leakrate must be less than 1 mbar over 10 hours. The main vessel was made from a sectionof 4-in diameter stainless steel pipe with a closure welded on one end and a flange withan o-ring seal welded to the other end. A removable closure mates to the flange with ano-ring seal and is bolted in place. Swagelok o-ring seal fittings are used for the variouspenetrations into the removable closure. The fuel reservoir was attached to a main vesselusing Swagelok fittings and a ball valve. The reservoir can be filled completely full offuel (no air) and the ball valve closed off before attaching to the main vessel. At thebottom of the vessel, a two-inch diameter magnetic stirrer (teflon coated) is placed in arecess machined to accommodate a circular restraint. The reservoir and ethylene glycolbath are placed on top of the stirrer drive mechanism so that the fuel can be constantlystirred during the test.
The fuel is degassed before making vapor pressure measurements. This is very impor-tant for accurate measurements. The procedure is to fill the fuel reservoir, attach the fuelreservoir to the main vessel, evacuate the main vessel and cool it to 0◦C by immersing itin an ice water bath. The valve between the fuel reservoir and the main vessel is openedand after some time elapses, the pressure of the evolved air is measured. For 860 ml ofJet A, a pressure of about 66 to 72 mbar is measured, consistent with the estimates givenbelow. This gas is then pumped out of the vessel by connecting the main vessel for thevacuum line for about one minute. The vessel is then sealed off and heated to approxi-mately 30◦C. The temperature bath and fuel are stirred constantly during this process.The system is allowed to equilibrate (this is determined by observing the pressure on thechart recorder) and the pressure is measured. The vessel is then cooled to 0◦C and thepressure recorded again. Repeated cycles of cooling, evacuation, heating and cooling areperformed until the vapor pressure is repeatable at a given temperature. An incompletedegassing process is indicated by hysteresis in the pressure, i.e., the pressure will increaseat 0◦C after a cycle of heating and cooling even though the vessel remains closed. Sincethe vapor pressure is quite low (1 to 20 mbar) at the temperatures of interest, even avery small amount of dissolved air can lead to a substantial error in the measured vaporpressure.
The purpose of cooling with the ice bath before evacuation is to minimize the prefer-ential evaporation of the light components of the fuel during the degassing. By loweringthe temperature, the vapor pressure is decreased substantially compared to room tem-perature. However, the outgassing appears to be much slower at low temperature so thatcycling between low and high temperatures is needed for effective outgassing. To confirmthe effectiveness of this procedure, the total amount of fuel lost to the vacuum system is
42

Fuel reservoir
Thermocouple
Diaphragmpressure gauge
Magneticstirring bar
30 cm
Heating tape
Ethylene Glycol
Hot bath
Pressure vessel
Magnetic stirrer
Mixer
(a) (b)
Figure 37: Vapor pressure apparatus. a) Main volume with attached fuel reservoir. b)Assembly immersed in the temperature bath.
determined by measuring the fuel recovered at the end of the measurement and havingpreviously determined the capacity of the fuel reservoir. The measurements are madewith graduated cylinders. In this fashion, we have found that less than 0.6% (5 ml outof 860 ml) of the Jet A fuel is lost during the entire measurement process.
A substantial length of time (45 to 60 minutes) is needed to reach a steady or equi-librium value of vapor pressure at a given temperature despite the action of the stirrerand the temperature bath. Some of the equilibration time is associated with the thermalmass of the system but the multicomponent nature of the liquid also plays a role. Pref-erential evaporation of the light components will create concentration gradients withinthe liquid. Unless these gradients will be reduced by convection, the vaporization processwill slow down and the resulting vapor concentration will be far from equilibrium. Thisis a concern both in vapor pressure tests and combustion experiments in which the vaporis created by evaporation from a stagnant pool (Ott and Nestor experiments). Convec-tion is required because diffusion within the liquid is extraordinarily slow. The binarymass diffusivity of liquid hexane in liquid dodecane is D = 2.73 ×10⁻⁵ cm2/s at 25◦C(Reid et al. 1987). The characteristic time for diffusion across a layer of thickness δ is
43

δ2/D. For example, the time required for hexane to diffuse through a 4-in thick layer ofdodecane is 3.6 ×10⁶ s or about 1 month! In our vapor pressure experiment, the liquidis continuously stirred to minimize the gradients and in the combustion experiments,the dispersal of fuel through the nozzle drastically reduces the diffusion distance andcorresponding times.
Once the dissolved gas is removed, the vessel is removed from the ice water bath andplaced into the ethylene glycol. The vessel is allowed to warm up to room temperatureand then the heater controller is energized. The controller temperature is increased inincrements of 5◦C and the vapor pressure and actual fuel temperature are recorded afterthe pressure history indicates that equilibrium has been reached. It typically takes about10 hours to complete the entire process and measure vapor pressure up to 60◦C. Theapparatus is allowed to cool down overnight and then further cooling is obtained byplacing frozen bottles of water into the bath. The vapor pressure is measured during thecool down process as a check on the measurements made during heating. The stirrer isrun constantly during the entire process to prevent stratification of the light componentin the liquid. Note that with 860 ml of fuel in a volume of 1700 ml, the mass loading isabout 400 kg/m3 which should be sufficient to yield a “true” vapor pressure measurement.
Measurements have been taken on hexane, octane and LAX Jet A. The hexane andoctane measurements were made to verify our technique. The comparisons shown inFig. 34 with the Reidel vapor pressure correlation (Reid et al. 1987) indicate that themaximum deviations from the correlations are 4% for hexane and 6% for octane. Theresults for Jet A shown in Fig. 33 agree with the industry proposed values (CRC 1983)between 50 and 60◦C and appear to be a reasonable extrapolation for lower temperatures.The data are given in Table 3.
0
5
10
15
20
25
30
0 10 20 30 40 50 60 70
temperature (C)
pres
sure
(m
bar)
Jet A (400 kg/m3)
Fit to Clausius-Clayperon model
Figure 38: Measured vapor pressure and least squares fit to functional form of Eq. 39.
The observed dependence on temperature can be compared with the standard repre-sentation, Eq. 39, of jet fuel vapor pressure. A least squares fit to this representation has
44

Table 3: Measured vapor pressure of LAX Jet A using the Caltech apparatus and pro-cedure. Estimated uncertainty in pressure is ± 0.2 mbar. Estimated uncertainty intemperature is ± 0.6◦C.
M/V = 400 kg/m3
T Pσ T Pσ
(◦C) (mbar) (◦C) (mbar)0.1 1.0 23.0 4.20.2 1.2 24.4 4.20.3 1.3 27.5 4.91.8 1.3 28.8 5.03.0 1.3 28.9 5.04.0 1.4 32.2 5.99.1 2.0 37.6 7.219.4 3.3 42.8 9.121.0 3.7 47.7 11.221.2 4.0 52.7 14.122.2 4.1 57.7 17.422.7 4.1 62.7 21.7
M/V = 3 kg/m3
T Pσ T Pσ
(◦C) (mbar) (◦C) (mbar)0.0 0.8 31.8 4.00.6 1.5 41 5.50.9 1.5 41.5 5.71.6 1.6 52 8.02.1 1.69.2 2.010.3 2.015.7 2.416.3 2.421.1 2.823.7 3.025.2 3.0
a correlation coefficient of 0.996 and plotting the data in the appropriate coordinates in-dicates a reasonable fit to this simple form. The resulting relationship for the 400 kg/m3
case can be expressed as:
Pσ = 5.75 × 10⁶ exp(−4191/T ) P in mbar T in K (40)
Apparently, the analytical representation of the vapor pressure is not too dependent onthe function form of the multi-component nature of Jet A. Previous work on crude oilvapor pressure (Woodrow and Seiber 1988) indicates that the vapor can be treated asa mixture of simple compounds. As shown in Fig. 34, a mixture of 2.5% hexane and97.5% dodecane (mole fractions) provides an approximate match for vapor pressuresbetween 0 and 60◦C. This model is tentative and will be refined when a better chemicalcharacterization of Jet A is obtained.
7.2 Mass Loading Effect
Limited experimentation has been carried out on the effect of mass loading. By intro-ducing 6 ml of Jet A into the existing apparatus, data were obtained for a mass loadingof 3 kg/m3. Since such a small quantity of material is used in these tests, only a singledegassing exposure of about 1 minute was used at 0◦C. Over a period of 10 hours the va-por pressure was measured during a heating cycle of the apparatus. Leak tests indicatedthat an increase in pressure (due to leaks or additional outgassing) of about 0.26 mbarin 6 hours was initially observed and no measurable leak was noticed between 6 and 20
45

hours. The results are shown on Fig. 39 and in Table 3. Fitting the data to Eq. 39 yields
Pσ = 4.971 × 10⁴ exp(−2868/T ) P in mbar T in K. (41)
Both sets of data, 400 and 3 kg/m3, are compared with the predictions of the binary liquidmodel discussed subsequently. Reasonable agreement is observed between the measure-ments and the model. A better model composition and more detailed observations areneeded to complete this study.
0
5
10
15
20
25
30
0 10 20 30 40 50 60 70
temperature (C)
pres
sure
(m
bar)
Jet A 400 kg/m3
Jet A, 3 kg/m3
Binary model. M/V = 3
Binary model, large M/V
Figure 39: Vapor pressure vs temperature for two mass loadings. Comparison with binarymodel using 2.5% hexane (molar) and 97.5% dodecane composition.
8 Dissolved Air
A problem with experimental measurements of vapor pressure and an issue in modelingthe vapor space composition in the aircraft fuel tank ullage is the influence of dissolvedair in the fuel. It is well known that O2 and N2 will be released from fuels like JetA when the pressure is decreased. Preliminary experiments using the Caltech vaporpressure apparatus indicate that a significant amount of air is evolved when the pressureis reduced in the vapor space above the liquid.
Unless the experiment is carefully designed and appropriate corrections are carriedout, this effect can seriously distort low-temperature vapor pressure measurements. Theconventional treatment for pure substances, degassing the fuel by heating and vacuumexposure, is problematic for multi-component fuels. Such processes can result in removalof the light components from the mixture and an uncontrolled shift in the composition ofthe fuel. Prolonged exposure to high temperatures can cause chemical changes (Pickard1996) or cracking of the fuel. All of these factors need to be considered in designing vaporpressure experiments.
46

One standard parameter for describing gas solubility is the Ostwald coefficient βdefined as the maximum volume of gas (at a given gas pressure Pg and temperature T )that can be dissolved in a unit volume of liquid. Treating the gas as ideal, the totalnumber of moles of gas Ng dissolved in a volume Vl of liquid are
Ng =βVlPg
R̃T(42)
The total mass of dissolved gas is therefore
Mg =βVlPg
RTR =
R̃
Wg
(43)
Ostwald coefficients are a function of temperature β(T ) and are measured by standardizedtest procedures (ASTM D 2779). For Jet A between 20 and 40◦C, β ≈ 0.17 (CRC 1983).
As an example, the maximum or saturated amount of dissolved air in 50 gallons ofJet A is about 40 g. In the case of the CWT tank of a 747-100, the total tank volumeis about 50 M3, which corresponds to an air mass of 61 kg at sea level. The amountof dissolved air is negligible (less than 10−3) compared to the air present in the ullage.Even if all of this dissolved air were to come out of the solution at 14 kft, it would haveno noticeable effect on the vapor space composition. In fact, the air comes out of thesolution at a finite rate (see the discussion in Kosvic et al. (1971)) and a maximum ofabout 40% will come out of the solution at 14 kft due to the air pressure in the CWTullage. When the air comes out of the solution rapidly, a foam or froth can be formedon the surface. However, visual inspection of fuel samples about 1 inch in depth did notreveal any substantial foam when the fuel was suddenly depressurized. Nestor (1967) alsoconsidered this effect and did not find any evidence of foaming under simulated climbconditions.
The ullage volume in the vapor pressure experiments is much smaller than in thecombustion experiments so that the effect of dissolved air is much greater. Consider avolume of liquid Vl saturated with air at pressure P◦ and suddenly introduced into anevacuated container with an ullage volume Vg. Accounting for the air that remains insolution after the system reaches equilibrium, the partial pressure of air in the ullage willbe
Pair =β Vl
VgP◦
1 + β Vl
Vg
(44)
In order to measure “true vapor pressure”, the volume Vg should be as small aspossible relative to Vl so that the “light ends”, i.e., low molar mass constituents, are notdepleted from the liquid fuel. However, this will exacerbate the problem of dissolved airsince the pressure measurement does not distinguish between species. In practice, vaporvolumes vary from 1 to 4 times the liquid volume. For Vg/Vl = 2, this will result inan air partial pressure of 70 mbar, which will obscure the Jet A vapor pressure at thetemperatures of interest. This implies that Jet A has to be almost completely degassed in
47

order to obtain a reliable vapor pressure measurement when using conventional methods.One technique (Woodrow and Seiber 1988; Woodrow and Seiber 1990) that avoids someof these problems is head space gas chromatography (GC). Fuel vapor composition ismeasured by the GC and then the vapor pressure is computed using an ideal solutionmodel, as described in the next section. Since the GC technique can discriminate betweenhydrocarbons and air, the computed vapor pressure will approximate the air-free value.
8.1 Dissolved Water
Water can also be present in Jet A. The solubility is much lower than for air. Thehandbook (CRC 1983) gives a maximum solubility of .005% by volume at 20◦C. Thepressure due to this amount of water coming out of solution will be negligible in ourvapor pressure experiments.
9 Binary mixture model
The unexpected variation of peak pressure with fuel amount at 40◦C (Fig. 40) motivatedus to consider the effect of multiple components in the fuel on the vapor composition. Tothis end, a simple model using two components, one light and one heavy, is developed inthis section.
0.5
1
1.5
2
2.5
3
3.5
0 0.1 0.2 0.3 0.4 0.5
fuel loading factor (kg/m3)
peak
pre
ssur
e (b
ar)
Figure 40: Measured peak pressures as a function of fuel amount for Jet A at 0.585 barand 40◦C .
Determining the partial pressure Pi of component i in a vapor in equilibrium witha liquid mixture is in general a complex task. The simplest sort of model (Abbott and
48

van Ness 1989) assumes that the liquid and vapor are ideal mixtures, and that activitycoefficients, molar volumes and fugacities are independent of pressure. In that case,Raoult’s law gives the partial pressure as
Pi = xiPσi (45)
where Pσi is the pure substance saturated vapor pressure and xi is the mole fraction ofspecies i in the liquid mixture. If the amounts xi of each component were known, thenthe vapor pressure of the fuel could be computed as
Pσ =I∑
i=1xiPσi (46)
Consider a two-component mixture (I = 2) inside a container of total volume V . Thecontainer (“fuel tank”) is partially full of liquid and the vapor above the liquid is inequilibrium with the liquid. The total mass of the mixture within the tank is M and thea total number of moles of each component are N◦
1 and N◦2 . The initial mass M1 and M2
of each component can be computed from the number of moles and the molar masses W1
and W2:
N = N◦1 + N◦
2 M1 = W1N◦1 M2 = W2N
◦2 M = M1 + M2 (47)
The moles of each component in the liquid are N1 and N2 and in the vapor phase n1 andn2. These are related by the conservation of the amount of each substance for a closedsystem
n1 = N◦1 − N1 n2 = N◦
2 − N2 (48)
The partial pressure of each species can be computed using the ideal gas law
P1 = n1R̃T
V ′ P2 = n2R̃T
V ′ V ′ = V − Vl (49)
where Vl is the volume occupied by the liquid. Equating the partial pressures as computedby the gas law to the partial pressures computed by Raoult’s law and eliminating thevariables Ni in favor of ni, we have:
n1 =N◦
1 − n1
N◦ − n1 − n2
Pσ1V′
R̃T(50)
n2 =N◦
2 − n2
N◦ − n1 − n2
Pσ2V′
R̃T(51)
where N◦ = N◦1 + N◦
2 is the total number of moles of mixture present in the container.If the amount of liquid present is small compared to the volume of the tank, V ′ ≈ V ,which is the case of the TWA 800 situation and the CIT experiments. Otherwise, thevolume of liquid can be computed as
49

Vl =W1(N◦
1 − n1) + W2(N◦2 − n2)
ρl
(52)
where ρl is the liquid mass density. Note that although we have proceeded as though thetank were closed, the total pressure does not enter into our considerations. Therefore,these results will apply to a vented tank as long as we correct for the loss of substancethrough the vents, i.e., we need to reduce the amounts N◦
i appropriately. Given initialamounts of substance and a temperature T , Eqs. 50-51 can be solved numerically to findthe moles ni of each component in the vapor phase. If we use nondimensional variables,the solution will be a function of the choice of substances and the following parameters
TM
V
N◦1
N◦N◦
2
N◦ (53)
As an example we have computed the solution for a mock jet fuel mixture consistingof 97.5% dodecane and 2.5% hexane by molar amount. The total vapor pressure as afunction of the mass loading factor M/V is shown in Fig. 41 for temperatures of 30, 40and 50◦C.
50 C
40 C
30 C
0.0
2.0
4.0
6.0
8.0
10.0
12.0
14.0
16.0
0.01 0.10 1.00 10.00
mass loading (kg/m3 )
pres
sure
(m
bar)
50 C
40 C
30 C
high loading limit
TWA 800
Figure 41: Vapor pressure as a function of fuel loading factor for the ideal binary mixturemodel with 97.5% dodecane and 2.5% hexane (molar) at 30, 40 and 50◦C.
This figure illustrates the effect of depletion of the light component by evaporation.For small values of loading, M/V → 0, the partial pressure of hexane is limited by thedecrease of hexane in the liquid with evaporation. As the mass loading M/V is increased,evaporation of hexane results in less depletion and the partial pressure of hexane vaporincreases. The partial pressure of dodecane is almost independent of the loading sincethe effects of depletion are negligible until the mass loading of liquid becomes so small(< 5 g/m3) that the dodecane is almost all vaporized.
50

For high loading, M/V → ∞, the partial pressure of hexane and the total vaporpressure approaches limiting values which are given by Raoult’s law (Eq. 45) with themole fractions of liquid given by the initial composition of the mixture. These limitingvalues are shown as the points labeled “high loading” on Fig. 41. This example illustratesboth the importance of having a high loading value in vapor pressure measurements andthe importance of the low loading factors in determining hazards in nearly empty fueltanks. In the CIT combustion experiments, a maximum loading factor of 0.5 kg/m3 wasused. The loading factor in the CWT of TWA 800 was about 3 kg/m3. The loadingfactor was 120 kg/m3 in Nestor’s experiments and was 100 kg/m3 in Ott’s experiments.In the CIT vapor pressure experiments, the maximum loading factor is about 400 kg/m3.
As the loading factor increases, the composition shifts toward the light component.The fraction of hexane in the vapor as a function of loading factor is shown in Fig. 42. Asthe temperature increases, the composition shifts toward the heavier component. Theseshifts are reflected in the behavior of the mean molar mass, illustrated in Fig. 43. Theseresults indicate the extreme sensitivity of the behavior of fuel vapor to liquid compositionat low temperatures. Although the liquid is 97.5% dodecane, the vapor is almost 100%hexane at temperatures less than 50◦C and modest (≥ 1 kg/m3) fuel loading factors. Thisdramatically illustrates the importance of understanding the fuel composition, includingthe apparently “minor” amounts of light species.
0.0
0.1
0.2
0.3
0.4
0.5
0.6
0.7
0.8
0.9
1.0
0.01 0.10 1.00 10.00
mass loading (kg/m3 )
mol
e fr
actio
n he
xane
50 C
40 C
30 C
TWA 800
Figure 42: Hexane fraction as a function of fuel loading factor for the ideal binary mixturemodel with 97.5% dodecane and 2.5% hexane (molar) at 30, 40 and 50◦C.
The flammability of these mixtures can be estimated by computing the fuel-air massratio f and comparing it with the estimated lower limit range for Jet A of 0.019 to 0.026.In terms of the fuel vapor pressure Pσ and mean molar mass Wfuel,
51

80.0
90.0
100.0
110.0
120.0
130.0
140.0
150.0
160.0
170.0
0.01 0.10 1.00 10.00
mass loading (kg/m3 )
mea
n m
olar
mas
s (g
/mol
)
50 C
40 C
30 C
TWA 800
Figure 43: Mean molar mass as a function of fuel loading factor for the ideal binarymixture model with 97.5% dodecane and 2.5% hexane (molar) at 30, 40 and 50◦C.
f =Pσ
Pair
Wfuel
Wair
≈ Pσ
P
Wfuel
Wair
(54)
where P is the total mixture pressure and the approximation is that Pσ is much less thanP . The results are shown in Fig. 44. These results indicate that at a fixed temperature,the vapor will reach a flammable condition as the mass loading is increased, providedthat T is high enough.
The model choices of hexane and dodecane and the 2.5% hexane amount were moti-vated by the vapor pressure measurements but can not be considered realistic. A largenumber of other possibilities exist and these choices simply serve to illustrate the trendsthat are a consequence of this model. A realistic model of Jet A will require quantitativechemical analysis to define the appropriate model compounds and composition.
10 Application to TWA Flight 800
In order to evaluate the implications for TWA 800, an estimate of the fuel and airconditions in the CWT at the time of the explosion are needed. First, we will considerthe effect of the flight from Athens and the gate hold on the fuel composition. Second, wewill consider the effect of the ACM operation and climb out from JFK on the compositionof the tank ullage at the time of the explosion.
One issue that has been raised and discussed briefly in Section 2.2, is the problem offlight conditioning of the fuel. The situation is shown in Fig. 45. The fuel tank is ventedto the atmosphere through two vent stringers (Fig. 10) which extend the length of the
52

0.000
0.010
0.020
0.030
0.040
0.050
0.060
0.070
0.080
0.01 0.10 1.00 10.00
mass loading (kg/m3 )
fuel
-air
ratio
50 C
40 C
30 C
AAAAAAAAAAAAAAAAAAAAAAAA
AAAAAAAAAAAAAAAAAAAAAAAA
AAAAAAAAAAAAAAAAAAAAAAAA
AAAAAAAAAAAAAAAAAAAAAAAA
AAAAAAAAAAAAAAAAAAAAAAAA
AAAAAAAAAAAAAAAAAAAAAAAA
AAAAAAAAAAAAAAAAAAAAAAAA
AAAAAAAAAAAAAAAAAAAAAAAA
AAAAAAAAAAAAAAAAAAAAAAAA
AAAAAAAAAAAAAAAAAAAAAAAA
AAAAAAAAAAAAAAAAAAAAAAAA
AAAAAAAAAAAAAAAAAAAAAAAA
AAAAAAAAAAAAAAAAAAAAAAAA
AAAAAAAAAAAAAAAAAAAAAAAA
AAAAAAAAAAAAAAAAAAAAAAAA
AAAAAAAAAAAAAAAAAAAAAAAA
AAAAAAAAAAAAAAAAAAAAAAAA
AAAAAAAAAAAAAAAAAAAAAAAA
AAAAAAAAAAAA
TWA 800
Flammability limit
Figure 44: Fuel-air mass ratio as a function of fuel loading factor for the ideal binarymixture model with 97.5% dodecane and 2.5% hexane (molar) at 30, 40 and 50◦C.
wing. The path from the tank to the atmosphere is therefore about 100 ft. Each stringerhas a nominal cross-section of 4.75-in by 2.75-in. During level flight or ground operations,
Air
Liquid
Evaporation
Venting
Figure 45: Problem definition for evaporation losses through the vent stringer.
there is no mean flow through the vent stringer. Fuel can only be lost by diffusion alongthe vent due the concentration gradient between the tank and the atmosphere. The fluxJ of fuel vapor is determined by Fick’s law
J = −D∂C
∂x(55)
where D is the mass diffusion coefficient and C is the concentration of fuel per unitvolume. For hexane vapor in air at 1 atm and 306 K, the mass diffusion coefficient is
53

equal to (Reid et al. 1987) 9×10⁻⁶ m2/s. The mass diffusion coefficient is proportional tothe inverse pressure so that at 0.25 atm (corresponding to 35 kft altitude), D = 3.6×10⁻⁵
m2/s.The fuel mass loss associated with diffusion can be estimated by approximating the
gradient in concentration as linear. Substitution into Fick’s law yields
dM
dt= AWfuelDCtank
L(56)
where Ctank is the concentration (moles/m3) of fuel in the tank, L is the stringer lengthand A is the combined area of the two vent stringers. Using a vapor pressure of 7.5 mbarand a total pressure of 0.25 atm, we estimate a fuel loss rate of 1.4×10⁻⁷ g/s, which overa period of 16 hours would result in the loss of 8 mg of fuel, an inconsequential amount.Of far greater importance is what happens during the climb from JFK to 14 kft.
The issue of the thermal environment produced by the ACM operation during thegate hold must addressed through flight test and thermal modeling. A preliminary flighttest was carried out by Boeing (8-26-97) and temperatures at 5 locations within theCWT were measured as a function of altitude. At takeoff, temperatures within the tankranged from 85 to 96◦F (29 to 35◦C). After takeoff, a fuel temperature of 115◦F (46◦C)was measured at the rear spar for altitudes above 7 kft. The air temperatures withinthe tank decreased with increasing altitude up to about 10.5 kft and then returned tothe takeoff values above 12 kft. This is an indication of the role of heat transfer sinceif the gas within the tank expanded adiabatically (no heat transfer) during climb, thetemperature would drop by 44◦C.
Both fuel and air temperatures are above the flammability limit temperatures of 25 to28◦C measured by Ott and Nestor at a pressure of 0.585 bar, equivalent to 14 kft. Sincethe fuel and atmosphere are at different temperatures, it is not clear what the resultingaverage fuel vapor concentration would be. Experiments and/or models of the heat andmass transfer within the tank are required to address this issue.
A simple approach to the problem of effective fuel composition in the CWT is toconsider the analogy between heat and mass transfer in turbulent flows. The situationwithin the CWT during the gate hold corresponds to the physical problem of naturalconvection in an enclosure driven by the temperature difference between the bottom andthe top, see Fig. 46. Hot gas (a mixture of fuel vapor and air) will rise from the bottomof tank, reach the top, cool off and flow downwards. Fuel evaporated at the bottom willmix with the adjacent air, rise to the top of the tank, partially condense on the coolerupper surface, and drip off or re-evaporate. In this manner, a circulation or convectionpattern is set up within the compartment of the CWT. The resulting distribution of fuelvapor depends on the flow pattern and the strength of the convection. Convective flowsare conventionally characterized by a nondimensional parameter, the Rayleigh numberRa, which is defined as
Ra =gα∆TH3
νκ(57)
where g = 9.81 m/s2 is the acceleration of gravity, α is the coefficient of thermal expansion
54
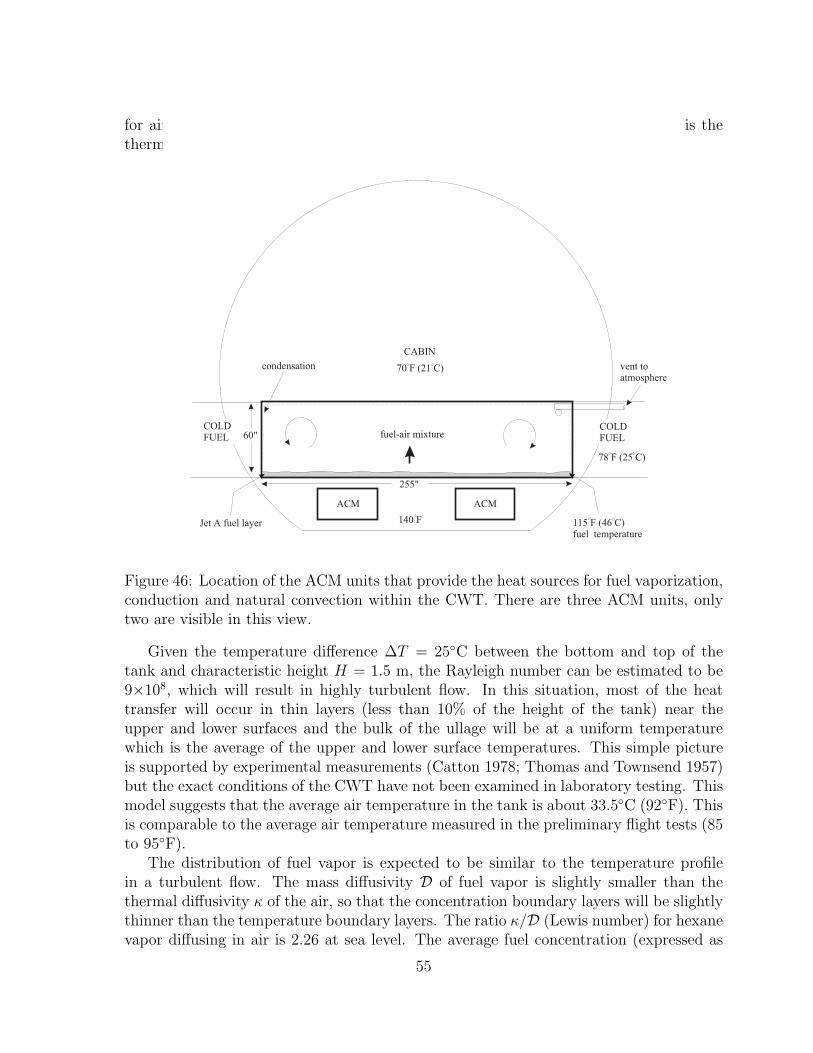
for air, 3.3×10⁻⁴ K−1, ν is the kinematic viscosity of air, 1.5×10⁻⁵ m2/s, and κ is thethermal diffusivity of air, 2.1×10⁻⁵ m2/s.
ACM
140 F
fuel-air mixture
CABIN
70 F (21 C) vent toatmosphere
condensation
Jet A fuel layer 115 F (46 C)fuel temperature
ACM
255"
COLDFUEL 60"
78 F (25 C)
COLDFUEL
Figure 46: Location of the ACM units that provide the heat sources for fuel vaporization,conduction and natural convection within the CWT. There are three ACM units, onlytwo are visible in this view.
Given the temperature difference ∆T = 25◦C between the bottom and top of thetank and characteristic height H = 1.5 m, the Rayleigh number can be estimated to be9×108, which will result in highly turbulent flow. In this situation, most of the heattransfer will occur in thin layers (less than 10% of the height of the tank) near theupper and lower surfaces and the bulk of the ullage will be at a uniform temperaturewhich is the average of the upper and lower surface temperatures. This simple pictureis supported by experimental measurements (Catton 1978; Thomas and Townsend 1957)but the exact conditions of the CWT have not been examined in laboratory testing. Thismodel suggests that the average air temperature in the tank is about 33.5◦C (92◦F). Thisis comparable to the average air temperature measured in the preliminary flight tests (85to 95◦F).
The distribution of fuel vapor is expected to be similar to the temperature profilein a turbulent flow. The mass diffusivity D of fuel vapor is slightly smaller than thethermal diffusivity κ of the air, so that the concentration boundary layers will be slightlythinner than the temperature boundary layers. The ratio κ/D (Lewis number) for hexanevapor diffusing in air is 2.26 at sea level. The average fuel concentration (expressed as
55

fuel-air mass ratio) will be the average of the concentrations at the upper and lowersurfaces. Assuming that fuel vapor is in equilibrium with the fuel liquid at the upperand lower surfaces, the vapor pressure can be computed from the estimated temperaturesof 21◦C (corresponding to the 70◦F cabin floor temperature) for the upper surface and46◦C for lower surface (corresponding to the fuel temperature of 115◦F measured in thepreliminary flight tests). If we use the M/V = 400 kg/m3 vapor pressure data obtainedat Caltech, the resulting average vapor pressure will be 7.55 mbar. Using a vapor molarmass of 86 g/mol implies a fuel-air mass ratio f = 0.022 at sea level and for rapidevaporation during climb, a value of 0.038 at 14 kft. These values should be comparedwith the flammability limit range of 0.019 to 0.026 estimated from the Nestor experimentsdiscussed in Section 2.1.
Since there was only a limited amount (50 to 100 gallons) of fuel present in the tank,the issue of fuel fractionation must be considered. Fifty gallons of Jet A in the CWTcorresponds to a loading of about 3 kg/m3. Our preliminary measurements and thebinary mixture model both indicate a decrease in fuel vapor pressure with a decreasein the loading factor. At a loading of 3 kg/m3, we estimate a fuel-air mass ratio f =0.015 at sea level and for rapid evaporation during climb, a value of 0.027 at 14 kft, ifwe do not correct for the loss of the light component of the fuel. These values bracketthe estimated flammability range and indicate that the mixture would be flammable atan altitude of 14 kft but not at sea level (see Fig. 11)
Simple estimates of the heat transfer and the experiments of Kosvic et al. suggestthat rapid evaporation during the climb phase is very plausible. Based on an average fuelpartial pressure of 5 mbar, the total mass of fuel vapor present in the CWT at sea levelis 0.9 kg. During the climb, equal proportions of fuel vapor and air will be vented outof the tank. At an altitude of 14 kft, 0.373 kg of the fuel vapor originally present wouldhave been vented from the CWT. Since the light component is now partially depleted,the vapor pressure will further decrease. The binary mixture model indicates that themean vapor pressure of the fuel will decrease about 20% to a value of 4.0 mbar. Thisdecreases the estimated maximum possible fuel-air mass ratio at 14 kft to f = 0.022, justwithin the flammable range.
From the vapor pressure measurements, we can estimate the heat of vaporization fromEq. 38, to be 435 kJ/kg. This implies an energy input of at least 162 kJ is required forfuel evaporation to make up for the vented fuel vapor. Over a period of 15 minutes, thisamounts to an average power of 180 W. This is a very modest requirement in compari-son to the heat transfer through the CWT structure due to the temperature differencebetween the bottom and top of the tank.
The limited mass of fuel will also affect the peak explosion overpressure. At 40◦C, wefound (Fig. 20) that with a loading of .5 kg/m3, a limiting peak pressure was apparentlyreached. At this condition, a peak explosion pressure of about 3 bar was obtained.Further combustion tests at lower temperatures (30 to 35◦C) are needed to determine tooverpressure variation with fuel loading at these conditions.
The maximum combustion pressure rise can be estimated in several ways. The adia-batic estimate from Eq. 9 yields an upper bound of 2.15 bar (31.6 psi) pressure rise. This
56

value does not include any potential reduction due to heat transfer or venting. A morerealistic value can be obtained by correcting Ott’s data (Fig. 26) for our value of fuel massloading and the decrease in light component due to venting during climb. At 33◦C, thepeak pressure rise is predicted to be between 1.54 and 1.98 bar (22.6 and 29.1 psi) for afuel loading of about 100 kg/m3. Based on our binary model results, we expect the vaporpressure and composition to be close to the large loading limit under these conditions.Equation 9 indicates that the peak pressure rise can be corrected for finite fuel loadingand depletion by simply multiplying by the ratio of the expected fuel-air mass ratio tothe fuel-air mass ratio present in Ott’s experiments. This yields an estimate of a peakpressure rise that is 60% of Ott’s value, or a range of 0.92 bar (13.5 psi) to 1.19 bar (17.4psi).
Even higher peak pressures are possible, depending on the nonuniformity of the vaporconcentration and the role of mists or sprays created by aircraft vibration and loftingduring the course of the explosion. In those cases, observations by Ott and Nestor indicatethat peak pressure rise up to 5 bar (73.5 psi) may be possible. Other the other hand,heat transfer and venting effects may result in further reductions of the peak pressure.Further uncertainty is introduced by the multicompartment nature of the CWT. Theseeffects can only be resolved by testing with scale models and actual CWT structures.
However, even without considering these effects, the expected pressures are sufficientlyhigh to pose a threat to the airplane integrity. Portions of the CWT structure areestimated (by Boeing) to fail for overpressures greater than about 20 psi. We concludethat failure of the CWT structure is a credible consequence of the explosion of the fuel-airmixture in the ullage at an altitude of 14 kft.
11 Conclusions
Key findings of our study are:
1. Flammability limits of Jet A are uncertain.
There is substantial variability in the measured flammability limits of Jet A. Interms of temperature conditions, the lower flammability limit is between 32 and38◦C at sea level, 24 and 29◦C at 15 kft. In terms of the fuel-air mass ratio, thelower flammability limit is estimated to fall in the range of .019 to .026. This issubstantially lower than the value of 0.035 qouted for pure hydrocarbon fuels. Thelimits depend on ignition energy and the method of observation.
2. The composition of Jet A is poorly known.
Jet A is a mixture of hydrocarbons with a broad range of molar masses. Moleculeswith as few as 5 and as many as 16 carbon atoms (molar mass of 226) are observed ina typical liquid sample (see Appendix B). The low-temperature (20 to 40◦C) vaporcontains only the lighter components, with 10 carbon atoms or fewer (molar massesless than 130). The precise composition is usually not known or regularly measuredfor Jet A so this is a difficult issue to discuss in quantitative terms. However,
57

it is very significant for understanding experimental results on flammability andexplosion. Better characterization is needed as a function of temperature and fuelloading factor.
3. Most Jet A vapor pressure data are really unreliable correlations.
The existing vapor pressure “data” is highly contradictory and probably based oncorrelations rather than measurement. The vapor pressure is likely to vary frombatch to batch and measurements can easily be contaminated by dissolved air.Measurements have been made for one batch of LAX Jet A which agree with theCRC 530 estimate and are slightly higher than the Ott data but disagree with allother reported values.
4. Jet A vapor pressure can be modeled with a binary mixture.
Experiments and a simple binary mixture model show that for the purposes ofestimating vapor pressure, a mixture of 2.5% hexane and 97.5% dodecane pro-duces a vapor pressure very close to the Jet A measured values. Further chemicalcharacterization of Jet A and combustion tests are needed to refine this model.
5. Previous studies on Jet A have not examined the effect of fuel loading (mass of fuelper ullage volume) on flammability and explosion peak pressure.
Flammability limits for multi-component liquid fuel are not a unique function oftemperature but also depend on the total mass of liquid used in the experiment.Flammability of Jet A at low temperatures (40◦C) is due to the vaporization ofthe low boiling point fractions or “light ends” in the fuel. A simple model of Jet Ausing two components, one light (hexane) and one heavy (dodecane), shows thatthe partial pressure of the light component in the vapor will be a strong functionof the ratio of liquid mass to vapor volume. Experimental measurements at twovalues of the fuel loading, 3 and 400 kg/m3 confirm this prediction. Explosion peakpressure measurements demonstrate a strong dependence on fuel loading values.
6. The flash point of Jet A is 10 to 15◦C higher than the flammability limit tempera-ture as determined by actual explosion testing.
The light components of the fuel determine the low-temperature flammability,preparation and handling of the fuel may have a significance to flammability thatwill not be reflected in the average properties of the fuel. Some evidence of this willbe reflected in changes in the flash point. However, the flash point temperaturesare not a reliable guide to assessing explosion hazards in multicomponent fuels.Flammability tests in vessels or tubes with the appropriate mass loading factorand instrumentation must be used to determine flammability. Previous tests byOtt and Nestor provide a substantial data base on flammability and the presenttests extend this to include the effects of fuel loading factor.
58

7. It is not sufficient to know the vapor pressure but the vapor composition mustalso be known in order to predict flammability from pressure and temperatureconditions.
Vapor pressure does not uniquely determine flammability limits and flash pointsas it does for pure liquids. Our simple binary mixture models illustrate how thecomposition of the vapor is a function of temperature and the liquid mass/vaporvolume ratio. Therefore experiments with different fuel mass/volume ratios willyield different flammability limits. In addition, the minimum mass of fuel requiredto obtain a flammable mixture will be a strong function of temperature. Chemicalcharacterization and our simple model illustrates that the light fractions of the fueldominate the vapor composition at low temperatures. Although previous investiga-tors have recognized that the multicomponent nature of the fuel, the consequenceshave apparently never been carefully examined.
8. The fuel vapor in the ullage of the TWA 800 CWT was flammable at the time ofthe explosion and the estimated peak pressures are sufficiently high that structuralfailure is a credible consequence of flame propagation within the tank ullage. How-ever, the magnitude of the peak pressure and the pressure-time history within theCWT cannot be predicted with any certainty given the present data.
Additional testing is required to understand the effect of fuel and air temperaturedifferences, laminar flame speeds, ignition energies, the size (scaling) of the tank,partitions between compartments and the potential for liquid fuel dispersion by theexplosion. Further lab scale testing is in progress and large scale tests are in theplanning stages.
59

References
Abbott, M. M. and H. C. van Ness (1989). Thermodynamics (2nd ed.). McGraw-Hill.
ASTM D2889 (1990). Standard Test Method for Calculation of True Vapor Pressuresof Petroleum Distillate Fuels. American Society for Testing and Materials.
ASTM D323 (1990). Standard Test Method for Vapor Pressure of Petroleum Products(Reid Method). American Society for Testing and Materials.
ASTM D56 (1988). Standard Test Method for Flash Point by Tag Closed Tester. Amer-ican Society for Testing and Materials.
ASTM D86 (1990). Standard Test Method for Distillation of Petroleum Products.American Society for Testing and Materials.
Ballal, D. and A. Lefebvre (1981). A general model of spark ignition for gaseous andliquid fuel-air mixtures. In Eighteenth Symposium (International) on Combustion,pp. 1737–1745. The Combustion Institute.
Barnett, H. and R. Hibbard (1956). Properties of aircraft fuels. Technical Note 3276,National Advisory Committee for Aeronautics, Washington.
Bradley, D. and A. Mitcheson (1976). Mathematical solutions for explosions in spher-ical vessels. Combustion and Flame 26, 201–217.
Bradley, D. and A. Mitcheson (1978). The venting of gaseous explosions in sphericalvessels. Combustion and Flame 32, 221–255.
Burgoyne, J. (1963). The flammability of mists and sprays. In 2nd Symp. on ChemicalProcess Hazards. Instn Chem. Engrs.
Catton, I. (1978). Natural convection in enclosures. In Sixth International Heat Trans-fer Conference, Volume 6, pp. 13–31.
CRC (1967, May). CRC aviation handbook–fuels and fuel systems. NAVAIR 06-5-504,Naval Air Systems Command.
CRC (1983). Handbook of aviation fuel properties. CRC Report 530, Society of Auto-motive Engineers, Warrendale, PA.
Cummings, J. C., J. H. S. Lee, A. C. Camp, and K. D. Marx (1984). Analysis ofcombustion in closed or vented rooms and vessels. Plant/Operation Progress 3 (4),239–247.
Davis, S. G., H. Wang, K. Brezinsky, and C. K. Law (1997). Benzene/toulene flamesand oxidation kinetics. In Twenty-Fifth Symposium (International) on Combustion,pp. 1025–1034. The Combustion Institute.
Dietrich, D., N. Cernansky, M. Somashekara, and I. Namer (1990). Spark ignition ofa bidisperse, n-decane fuel spray. In Twenty-Third Symposium (International) onCombustion, pp. 1383–1389. The Combustion Institute.
Gaydon, A. G. and H. G. Wolfhard (1979). Flames. Chapman and Hall.
60

Gibbs, G. and H. F. Calcote (1959). Laminar burning velocity. J. Chem. Eng. Data 4,226–237.
Heywood, J. B. (1988). Internal Combustion Engine Fandamentals. McGraw-Hill.
Hjertager, B. H. (1993). Computer modelling of turbulent gas explosions in complex2D and 3D geometries. Journal of Hazardous Materials 34, 173–197.
Kinney, G. F. and K. J. Graham (1985). Explosive Shocks in Air (2nd ed.). Springer.
Kosvic, T., L. Zung, and M. Gerstein (1971). Analysis of aircraft fuel tank fire andexplosion hazards. Technical Report AFAPL-TR-71-7, Air Force Aero PropulsionLaboratory, Wright-Patterson Air Force Base, Ohio.
Kuchta, J. M., , J. N. Murphy, A. L. Furno, and A. Bartkowski (1971). Fire hazardevaluation of thickened aircraft fuels. In Aircraft Fuels, Lubricants and Fire Safety,Volume 84 of AGARD Conference Proceedings, pp. 22–1 to 22–11.
Kuchta, J. M. (1973). Fire and Explosion Manual for Aircraft Accident Investigators.Bureau of Mines. AD-771 191.
Kuchta, J. M. (1975). Summary of ignition properties of jet fuels and other aircraftcombustible fluids. Technical Report AFAPL-TR-75-70, U.S. Bureau of Mines.
Kuchta, J. M. (1985). Investigation of fire and explosion accidents in the chemical,mining, and fuel-related industries—a manual. Bulletin 680, U.S. Bureau of Mines.
Kuchta, J. M. and R. G. Clodfelter (1985). Aircraft mishap fire pattern investigations.Final Report APWAL-TR-85-2057, Aero Propulsion Laboratory.
Lefebvre, A. H. (1983). Gas Turbine Combustion. Hemisphere.
Lewis, B. and G. von Elbe (1961). Combustion, Flames and Explosions of Gases (Sec-ond ed.)., pp. 323–346. Academic Press.
Moussa, N. (1990). Flammability of aircraft fuels. SAE Technical Paper Series 901949.Aerospace Technology Conference & Exposition, Long Beach, CA Oct 1-4.
Moussa, N., M. Whale, D. Grossmann, and X. Zhang (1996). The potential for fuel tankfire and hydrodynamic ram initiated by uncontained engine debris on commercialaircraft. Draft report for FAA, BlazeTech Corporation, Cambridge, Massachussetts.
Mulpuru, S. R. and G. B. Wilkin (1982, February). A model for vented deflagration ofhydrogen in a volume. AECL 6826, Whiteshell Nuclear Research Establishment.
Nagy, J., E. Seiler, J. Conn, and H. Verakis (1971). Explosion development in closedvessels. Report of Investigations 7507, Bureau of Mines, U.S. Department of theInterior.
Nestor, L. (1967). Investigation of turbine fuel flammability within aircraft fuel tanks.Final Report DS-67-7, Naval Air Propulsion Test Center, Naval Base, Philadelphia.
NFPA68 (1994). Guide for Venting of Deflagrations. 1 Batterymarch Park, PO BOx9101, Quincy, MA 02269-9101: National Fire Protection Association.
61

Ott, E. (1970). Effects of fuel slosh and vibration on the flammability hazards ofhydrocarbon turbine fuels within aircraft fuel tanks. Technical Report AFAPL-TR-70-65, Fire Protection Branch of the Fuels and Lubrication Division, Wright-Patterson Air Force Base, Ohio.
Pickard, J. (1996). Kinetics of the autoxidation of a jet-a fuel. Energy and Fuels 10,1074–1077.
Popat, N., C. A. Catlin, B. Arntzen, R. P. Lindstedt, B. H. Hjertager, T. Solberg,O. Saeter, and A. C. V. den Berg (1996). Investigations to improve and assessthe accuracy of computational fluid dynamic based explosion models. Journal ofHazardous Materials 45, 1–25.
Reid, R., J. Prausnitz, and B. Poling (1987). The Properties of Liquids and Gases (4thed.). McGraw-Hill.
Reynolds, W. C. (1986, January). The Element Potential Method for Chemical Equi-librium Analysis: Implementation in the Interactive Program STANJAN (3rd ed.).Dept. of Mechanical Engineering, Stanford, CA: Stanford University.
Richards, G. A. and A. H. Lefebrve (1989). Turbulent flame speeds of hydrocarbonfuel droplets in air. Combustion and Flame 78, 299–307.
Rose, J. and J. Cooper (1977). Technical Data on Fuel (7th ed.). Wiley.
Shepherd, J. E. and A. C. Ratzel (1985). Heat transfer resulting from premixed com-bustion. In C. Law, Y. Jaluria, W. W. Yuen, and K. Miyasaka (Eds.), Heat Transferin Fire and Combustion Systems, ASME HTD-45, pp. 191–201.
Tamanini, F. and J. L. Chafee (1990). Turbulent unvented gas explosions under dy-namic mixture injection conditions. In Twenty-Third Symposium (International)on Combustion, pp. 851–858. The Combustion Institute.
Tamanini, F. and J. L. Chafee (1992). Turbulent vented gas explosions with and with-out acoustically-induced instabilities. In Twenty-Fourth Symposium (International)on Combustion, pp. 1845–1851. The Combustion Institute.
Thomas, D. B. and A. A. Townsend (1957). Turbulent convection over a heated hori-zontal surface. Journal of Fluid Mechanics 2, 473–492.
Tsoovkun, N. et al. (1985). Physico-Chemical Properties of Jet Fuel. Cheemeeya,Moscow.
Ural, E. A. and R. G. Zalosh (1988, April). HICCUP: A computer code for hydrogeninjection, combustion, and cooldown using phenomenological models. EPRI NP-5721-CCM, Electric Power Research Institute.
Woodrow, J. and J. Seiber (1988). Vapor-pressure measurement of complex hydrocar-bon mixtures by headspace gas chromatography. J of Chromatography 455, 53–65.
Woodrow, J. and J. Seiber (1990). Evaluation of a method for determining vaporpressures of petroleum mixtures by headspace gas chromatography. Final Report
62

CARB-RR-90-14, Department of Environmental Toxicology, University of Califor-nia, Davis.
Zabetakis, M. and B. H. Rosen (1957). Considerations involved in handling kerosine.Proc. Am. Petrol. Inst. 37 (3), 296–306.
Zabetakis, M. G. (1965). Flammability characteristics of combustible gases and vapors.Bulletin 627, Bureau of Mines.
63

A Test Conditions
Table
4:Test
cond
Date
Run N
oF
uel
Vol.
Yfu
el
T FU
EL
PA
IRT
AIR
NA
IRP
MA
XD
river
Com
men
ts
(ml)
(C)
(bar
)(C
)(m
ol)
(bar
)
10/1
9/9
6197
Kero
sine
90
0.1
030
Hot0
.59
71.3
24.1
3.8
930%
H2-A
ir, .9
bar,
0.5
-in n
ozz
leF
uel t
em
p u
nkn
ow
n, 1
/2 n
ozz
le for
197-2
05
10/1
9/9
6198
Kero
sine
30
0.0
345
Hot0
.59
73
.22
4.0
-3
0%
H2
-Air
, .9
ba
r, 0
.5-i
n n
ozz
leN
OG
O10/1
9/9
6200
Kero
sine
50
0.0
576
Hot0
.59
74
.02
3.9
3.1
33
0%
H2
-Air, .9
ba
r, 0
.5-in
no
zzle
10/1
9/9
6201
Kero
sine
40
0.0
460
Hot0
.59
73
.42
4.0
-3
0%
H2
-Air
, .9
ba
r, 0
.5-i
n n
ozz
leN
OG
O10
/19/
962
02
Jet-
A9
00
.10
32
Ho
t0
.59
72
.02
4.1
-3
0%
H2
-Air, .9
ba
r, 0
.5-in
no
zzle
NO
GO
, L
AX
fu
el u
sed
in 2
02
-20
510
/19/
962
03
Jet-
A1
80
0.2
06
3H
ot
0.5
97
2.0
24
.1-
35
% H
2-A
ir, .9
ba
r, 0
.5-i
n n
ozz
leN
OG
O10
/20/
962
04
Jet-
A9
00
.10
73
Ho
t0
.59
86
.02
3.1
4.5
43
5%
H2
-Air
, 1
ba
r, 0
.5-i
n n
ozz
le10
/20/
962
05
Jet-
A5
00
.05
96
Ho
t0
.59
86
.02
3.1
3.4
13
5%
H2
-Air
, 1
ba
r, 0
.5-i
n n
ozz
le1/3
/97
232
Kero
sine
50
0.0
5316
1.7
0.5
94
6.5
26
.0-
30
% H
2-A
ir, 1
ba
r, 0
.5-in
no
zzle
NO
GO
Ru
ns
23
2 o
n u
sed
sim
ple
x sp
ray
no
zzle
1/3
/97
234
Kero
sine
150
0.1
5915
0.0
0.5
94
6.3
26
.0-
30
% H
2-A
ir, 1
ba
r, 0
.5-i
n n
ozz
leN
OG
O1/3
/97
236
Kero
sine
50
0.0
5205
5.0
0.5
94
0.0
26
.5-
30
% H
2-A
ir, 1
ba
r, 0
.5-i
n n
ozz
leN
OG
O1/3
/97
238
Kero
sine
100
0.1
1068
0.0
0.5
96
0.0
24
.9-
30
% H
2-A
ir, 1
ba
r, 0
.5-i
n n
ozz
leN
OG
O1/4
/97
239
Kero
sine
100
0.1
1098
2.0
0.5
96
0.8
24
.94
.71
35
% H
2-A
ir, 1
ba
r, 0
.5-i
n n
ozz
le1/4
/97
240
Kero
sine
50
0.0
5588
4.0
0.5
96
2.9
24
.72
.80
35
% H
2-A
ir, 1
ba
r, 0
.5-i
n n
ozz
le1/4
/97
241
Kero
sine
40
0.0
4448
1.3
0.5
96
0.9
24
.9-
35
% H
2-A
ir, 1
ba
r, 0
.5-i
n n
ozz
leN
OG
O1/4
/97
242
Kero
sine
70
0.0
7758
2.4
0.5
96
0.1
24
.93
.64
35
% H
2-A
ir, 1
ba
r, 0
.5-i
n n
ozz
le1/4
/97
243
Kero
sine
60
0.0
6668
1.0
0.5
96
1.1
24
.92
.72
35
% H
2-A
ir, 1
ba
r, 0
.5-i
n n
ozz
le1/4
/97
244
Kero
sine
140
0.1
5598
0.0
0.5
96
2.1
24
.84
.85
35
% H
2-A
ir, 1
ba
r, 0
.5-i
n n
ozz
lesubs
tant
ial c
onde
nsat
ion
on w
indo
ws,
fitti
ngs
leak
ing
on fu
el s
uppl
y1/5
/97
245
Kero
sine
100
0.1
0464
3.0
0.5
94
1.7
26
.43
.21
80
/20
H2
-O2
, 1
ba
r, 1
.0-in
no
zzle
rep
aire
d fu
el s
up
ply
1/5
/97
246
Kero
sine
50
0.0
5264
1.2
0.5
94
3.8
26
.21
.67
80
/20
H2
-O2
, 1
ba
r, 1
.0-i
n n
ozz
le1/5
/97
247
Kero
sine
50
0.0
5264
3.5
0.5
94
3.7
26
.21
.25
80
/20
H2
-O2
, 1
ba
r, 0
.5-i
n n
ozz
le1/6
/97
248
Kero
sine
100
0.1
0052
1.4
0.5
92
9.5
27
.42
.08
80
/20
H2
-O2
, 1
ba
r, 1
.5-in
no
zzle
cold
fu
el m
ist
1/6
/97
249
Kero
sine
100
0.1
0112
1.5
0.5
93
1.3
27
.31
.60
80
/20
H2
-O2
, 1
ba
r, 1
.0-in
no
zzle
cold
fu
el m
ist
1/7/
972
50
Jet-
A5
00
.04
95
21
.40
.59
24
.72
7.9
0.9
88
0/2
0 H
2-O
2, 1
ba
r, 1
.0-in
no
zzle
cold
fu
el m
ist, w
ea
k b
urn
1/7/
972
51
Jet-
A1
00
0.0
99
42
2.2
0.5
92
6.1
27
.81
.04
80
/20
H2
-O2
, 1
ba
r, 1
.0-in
no
zzle
cold
fu
el m
ist, w
ea
k b
urn
1/7/
972
52
Jet-
A5
00
.05
02
41
.10
.59
29
.02
7.5
0.9
98
0/2
0 H
2-O
2, 1
ba
r, 1
.0-in
no
zzle
cold
fu
el m
ist, w
ea
k b
urn
1/7/
972
53
Jet-
A1
00
0.1
00
44
2.4
0.5
92
9.2
27
.51
.08
80
/20
H2
-O2
, 1
ba
r, 1
.0-in
no
zzle
cold
fu
el m
ist, w
ea
k b
urn
1/9
/97
254
Kero
sene
40
0.0
493
106.20
.59
97.7
22.4
3.2
035%
H2-A
ir, 1 b
ar,
0.5
-in n
ozz
lefu
el s
hould
be a
ll va
por
for
254 to 2
65
1/9
/97
255
Kero
sene
50
0.0
616
103.40
.59
98
.02
2.4
3.8
03
5%
H2
-Air, 1
ba
r, 0
.5-in
no
zzle
1/1
0/9
7256
Kero
sene
80
0.0
989
102.70
.59
99.1
22.3
0.6
435%
H2-A
ir, 1 b
ar,
0.5
-in n
ozz
leN
OG
O -
5 m
in w
ait
after
inje
ctio
n
1/1
0/9
7257
Kero
sene
60
0.0
742
104.40
.59
99
.32
2.3
4.3
13
5%
H2
-Air, 1
ba
r, 0
.5-in
no
zzle
1/1
0/9
7258
Kero
sene
80
0.0
988
103.00
.59
98
.82
2.3
4.8
13
5%
H2
-Air, 1
ba
r, 0
.5-in
no
zzle
1/1
0/9
7259
Kero
sene
100
0.1
238
103.20.5
99
9.7
22
.30
.66
35
% H
2-A
ir, 1
ba
r, 0
.5-i
n n
ozz
leN
OG
O1/1
0/9
7260
Kero
sene
120
0.1
487
102.20.5
91
00
.02
2.3
0.7
13
5%
H2
-Air, 1
ba
r, 1
.0-in
no
zzle
NO
GO
(d
rive
r to
o w
ea
k?)
1/1
1/9
7261
Kero
sene
100
0.1
234
101.70.5
99
8.4
22
.44
.67
80
/20
H2
-O2
, 1
ba
r, 0
.5-i
n n
ozz
le
64

Date Run No Fuel Vol. Yfuel TFUEL PAIR TAIR NAIR PMAX Driver Comments(ml) (C) (bar) (C) (mol) (bar)
1/11/97 262 Kerosene 120 0.1484 100.00.59 99.1 22.3 4.11 80/20 H2-O2, 1 bar, 0.5-in nozzle1/11/97 263 Kerosene 140 0.1734 100.00.59 99.8 22.3 - 80/20 H2-O2, 1 bar, 0.5-in nozzle NOGO - driver too rich?1/11/97 264 Kerosene 140 0.1726 100.00.59 98.1 22.4 4.44 40/60 H2/O2, 1 bar, 0.5-in nozzle excess O2 in driver1/11/97 265 Kerosene 100 0.1245 100.00.59 101.6 22.2 4.68 40/60 H2/O2, 1 bar, 0.5-in nozzle excess O2 in driver1/12/97 266 Kerosene 100 0.107440.0 0.59 50.2 25.7 3.76 40/60 H2/O2, 1 bar, 0.5-in nozzle 30 min wait post-injection, lean driver1/12/97 267 JetA 100 0.1078 50.0 0.59 51.5 25.6 2.26 40/60 H2/O2, 1 bar, 0.5-in nozzle 30 min wait post-injection, lean driver1/12/97 268 Kerosene 100 0.107350.0 0.59 50.0 25.7 2.57 40/60 H2/O2, 1 bar, 0.5-in nozzle NO ATOMIZER, 1 hr wait with fan on1/13/97 269 JetA 50 0.0506 21.0 0.59 31.4 27.3 0.65 40/60 H2/O2, 1 bar, 0.5-in nozzle NO ATOMIZER, 1 hr wait with fan on, NO GO1/13/97 270 Kero 50 0.0507 21.5 0.59 32.3 27.2 0.65 40/60 H2/O2, 1 bar, 0.5-in No Atomizer, 1 hr wait fan on, NO GO1/14/97 271 Jet A 50 0.049520.8 0.59 24.9 27.9 0.71 80/20 H2-O2, 1 bar, 0.5-in nozzle spray fan on, 30 min fan off, mix 10 min, NO GO1/14/97 272 Jet A 50 0.050430.5 0.59 30.5 27.4 0.73 80/20 H2-O2, 1 bar, 0.5-in nozzle spray fan on, 30 min fan off, mix 10 min, NO GO New Jet A1/14/97 273 Jet A 50 0.051235.0 0.59 35.2 26.9 0.74 80/20 H2-O2, 1 bar, 0.5-in nozzle spray fan on, 30 min fan off, mix 10 min, NO GO1/15/97 274 Jet A 50 0.052140.0 0.59 40.7 26.5 0.77 80/20 H2-O2, 1 bar, 0.5-in nozzle spray fan on, 30 min fan off, mix 10 min, NO GO1/15/97 275 Jet A 50 0.052945.0 0.59 45.6 26.1 0.84 80/20 H2-O2, 1 bar, 0.5-in nozzle spray fan on, 30 min fan off, mix 10 min, NO GO1/15/97 276 Jet A 50 0.053850.0 0.59 50.6 25.7 0.93 80/20 H2-O2, 1 bar, 0.5-in nozzle spray fan on, 30 min fan off, mix 10 min, NO GO1/15/97 277 Jet A 50 0.054655.0 0.59 55.6 25.3 1.16 80/20 H2-O2, 1 bar, 0.5-in nozzle spray fan on, 30 min fan off, mix 10 min, NO GO1/15/97 278 Jet A 50 0.055460.0 0.59 60.3 24.9 1.32 80/20 H2-O2, 1 bar, 0.5-in nozzle spray fan on, 30 min fan off, mix 10 min1/15/97 279 Jet A 50 0.056265.0 0.59 65.3 24.5 1.90 80/20 H2-O2, 1 bar, 0.5-in nozzle spray fan on, 30 min fan off, mix 10 min1/16/97 280 Jet A 50 0.057270.0 0.59 71.5 24.1 2.53 80/20 H2-O2, 1 bar, 0.5-in nozzle spray fan on, 30 min fan off, mix 10 min1/16/97 281 Jet A 50 0.057875.0 0.59 75.1 23.9 2.72 80/20 H2-O2, 1 bar, 0.5-in nozzle spray fan on, 30 min fan off, mix 10 min1/16/97 282 Jet A 50 0.058780.0 0.59 80.4 23.5 3.31 80/20 H2-O2, 1 bar, 0.5-in nozzle spray fan on, 30 min fan off, mix 10 min1/16/97 283 Jet A 50 0.059685.0 0.59 85.8 23.1 3.79 80/20 H2-O2, 1 bar, 0.5-in nozzle spray fan on, 30 min fan off, mix 10 min1/17/97 284 Jet A 50 0.0621 100.00.59 101.1 22.2 3.50 80/20 H2-O2, 1 bar, 0.5-in nozzle spray fan on, 30 min fan off, mix 10 min1/17/97 285 Jet A 50 0.061495.0 0.59 96.7 22.5 3.87 80/20 H2-O2, 1 bar, 0.5-in nozzle spray fan on, 30 min fan off, mix 10 min1/17/97 286 Jet A 50 0.060690.0 0.59 91.8 22.8 3.45 80/20 H2-O2, 1 bar, 0.5-in nozzle spray fan on, 30 min fan off, mix 10 min1/17/97 287 Jet A 50 0.059985.0 0.59 87.6 23.0 3.53 80/20 H2-O2, 1 bar, 0.5-in nozzle spray fan on, 30 min fan off, mix 10 min1/18/97 288 Jet A 20 0.0249 100.00.59 102.2 22.1 1.02 80/20 H2-O2, 1 bar, 0.5-in nozzle fill, mix 10 min, ignite NO GO1/18/97 289 Jet A 30 0.0373 100.00.59 100.9 22.2 2.13 80/20 H2-O2, 1 bar, 0.5-in nozzle fill, mix 10 min, ignite weak GO1/18/97 290 Jet A 40 0.0497 100.00.59 101.2 22.2 3.10 80/20 H2-O2, 1 bar, 0.5-in nozzle fill, mix 10 min, ignite 1/18/97 291 Jet A 50 0.0622 100.00.59 101.4 22.2 3.92 80/20 H2-O2, 1 bar, 0.5-in nozzle fill, mix 10 min, ignite 1/18/97 292 Jet A 60 0.0748 100.00.59 102.3 22.1 4.30 80/20 H2-O2, 1 bar, 0.5-in nozzle fill, mix 10 min, ignite 1/18/97 293 Jet A 80 0.0998 100.00.59 102.6 22.1 4.62 80/20 H2-O2, 1 bar, 0.5-in nozzle fill, mix 10 min, ignite 1/18/97 294 Jet A 100 0.1247 100.00.59 102.4 22.1 4.62 80/20 H2-O2, 1 bar, 0.5-in nozzle fill, mix 10 min, ignite 1/18/97 295 Jet A 120 0.1494 100.00.59 101.8 22.2 4.57 40/60 H2/O2, 1 bar, 0.5-in fill, mix 10 min, ignite 1/18/97 296 Jet A 90 0.1121 100.00.59 101.8 22.2 4.75 80/20 H2-O2, 1 bar, 0.5-in nozzle fill, mix 10 min, ignite
65

Date Run No Fuel Vol. Yfuel TFUEL PAIR TAIR NAIR PMAX Driver Comments(ml) (C) (bar) (C) (mol) (bar)
1/18/97 297 Jet A 50 0.0622 100.00.59 101.2 22.2 4.09 80/20 H2-O2, 1 bar, 0.5-in nozzle fill, mix 10 min, ignite 1/18/97 298 Jet A 25 0.0311 100.00.59 101.3 22.2 1.37 80/20 H2-O2, 1 bar, 0.5-in nozzle fill, mix 10 min, ignite 1/18/97 299 Jet A 10 0.0124 100.00.59 101.0 22.2 0.71 80/20 H2-O2, 1 bar, 0.5-in nozzle fill, mix 10 min, ignite 1/18/97 300 Jet A 0 0.0000 0.00.59 99.6 22.3 0.68 80/20 H2-O2, 1 bar, 0.5-in nozzle baseline for 100 C tests, no fuel1/27/97 301 Jet A 100 0.103440.0 0.59 38.3 26.7 1.06 80/20 H2-O2, 1 bar, 0.5-in nozzle inject fuel into vacuum, wait 30, add air and mix 10 min NO GO1/27/97 302 Jet A 500 0.523560.0 0.59 42.1 26.3 3.07 80/20 H2-O2, 1 bar, 0.5-in nozzle inject fuel into vacuum, wait 30, add air and mix 10 min 1/28/97 303 Jet A 500 0.522860.0 0.59 41.7 26.4 2.87 80/20 H2-O2, 1 bar, 0.5-in nozzle inject fuel into 35 kft, wait 30, add air and mix 10 min 1/29/97 304 Jet A 400 0.418840.0 0.59 42.1 26.3 2.77 80/20 H2-O2, 1 bar, 0.5-in nozzle inject fuel into 35 kft, wait 30, add air and mix 10 min 1/30/97 305 Jet A 300 0.314840.0 0.59 42.8 26.3 2.71 80/20 H2-O2, 1 bar, 0.5-in nozzle inject fuel into 35 kft, wait 30, add air and mix 10 min 1/31/97 306 Jet A 200 0.209140.0 0.59 41.6 26.4 2.22 80/20 H2-O2, 1 bar, 0.5-in nozzle inject fuel into 35 kft, wait 30, add air and mix 10 min very weak GO2/2/97 307 Jet A 150 0.156940.0 0.59 41.8 26.4 1.33 80/20 H2-O2, 1 bar, 0.5-in nozzle inject fuel into 35 kft, wait 30, add air and mix 10 min looks self-sustaining2/3/97 308 Jet A 700 0.732440.0 0.59 41.9 26.4 3.03 80/20 H2-O2, 1 bar, 0.5-in nozzle inject fuel into 35 kft, wait 30, add air and mix 10 min
66

B GC-MS Analysis
A preliminary analysis of liquid and vapor Jet A composition was performed to getan appreciation for the typical fuel composition and the differences between liquid andvapor. This analysis was carried out3 using an HP5890/HP5989A Gas Chromatograph-Mass Spectrometer (GC-MS) with a 30 m-long HP-1 column. A 1 µl sample of theliquid was analyzed and the total ion chromatogram is shown in Fig. 47. Time refersto retention time within the GC column. This has been normalized so that the highestpeak is one. The carbon number is shown next to the main peaks in the spectrum. TheMS analysis was used to identify a number of these peaks, the major ones are n-alkanesalthough many branched compounds and some ring compounds were also found. TheMS was not set up to analyze for compounds with a molar mass less than 35 and thefirst observed peak is CO2. Integration of the TIC yields a median carbon number of 12,corresponding to dodecane, for the liquid composition.
Using the same setup, we analyzed 100 µl of headspace gas from a vial of Jet Aheated to 40◦C. The normalized total ion chromatogram is shown in Fig. 48. Note thatthe retention time axis is expanded relative to that shown in Fig. 47. The integratedTIC yields a median composition of C6 to C7, corresponding to hexane or heptane.Since the components lighter than C4 cannot be analyzed by this method, the carbonnumber of the true median composition is overestimated. The two chromatograms clearlydemonstrate the dramatic differences between liquid and vapor composition. The largenumber of components present in both phases illustrates the challenge of modeling JetA as a multicomponent fuel.
C6
C7 C
8
C9
C10 C11
C12
C15
C16
C14
C13
0
0.1
0.2
0.3
0.4
0.5
0.6
0.7
0.8
0.9
1
0 5 10 15 20 25 30
time (min)
abun
danc
e
Figure 47: Normalized total ion chromatogram for LAX Jet A liquid.
3We thank Peter Green of the Caltech Environmental Analysis Center for setting up the equipmentand advising us.
67

C5 C6
C7
C8
C9
C1
0
0
0.2
0.4
0.6
0.8
1
0 5 10 15
time (min)
abun
danc
e
Figure 48: Normalized total ion chromatogram for LAX Jet A vapor. Obtained from theheadspace of a 1.88 cc vial at 40◦C, mass loading of about 300 kg/m3.
68