experiments in an initial region of a circular free jet
TRANSCRIPT
EXPERIMENTS IN AN INITIAL REGION OF A CIRCULAR FREE JET
Yoshihiro Inoue*, Shintaro Yamashita* and Kunikazu Kondo**
* Dept. Mathematical & Design Eng., Gifu University, 1-1 Yanagido, Gifu 501-1193, JapanE-mail: [email protected], [email protected]
** Dept. Mechanical Eng., Suzuka College of Tech., Shiroko-cho, Suzuka, Mie 510-0294, JapanE-mail: [email protected]
ABSTRACTCoherent structures in the near field of an axisymmetric jet have been investigated in a water channel. Instanta-
neous velocity profiles were obtained in the axial and radial directions with the ultrasonic Doppler method. The UVP(ultrasonic velocity profile) monitor used in this study is Met-Flow model X3-PS with the ultrasonic transducers ofthe basic frequency of 4 MHz. Also, a multi-line measurement system was utilized. Two transducers were connectedto the UVP monitor and alternately switched to acquire two profiles with different angles of azimuthal direction at thesame streamwise position quasi-simultaneously. Dominant time-scale and averaged length-scale of velocity fluctu-ating fields are examined from DWT, and wavenumber-frequency spectrum is calculated by two-dimensional FFTalong the axial direction. Coherent structures in the axial and radial directions are investigated in terms of POD.Axial variation in the amplitude and wavelength of u(x, t) is well represented in the lower-order POD modes in theaxial direction, and also the radial oscillation of the mixing layer is captured by the only first POD mode with abouthalf a total energy. Azimuthal mode of radially oscillating mixing layer is estimated from a cross-correlation betweenthe random coefficients v(2)(θ, t) and v(2)(θ + ∆θ, t).
Keywords : Round Jet, Discrete Wavelet Analysis, POD, Azimuthal Mode
INTRODUCTION
A study of the jet that is one of a representative flow field offree shear flow has been done a lot so far, and the engineeringapplication field is wide. There are various kinds for a three-dimensional free jet from a difference of shape of an outlet. Ofthese, a circular jet [1], an elliptical jet [2], a rectangular jet [3]are well examined as a comparatively simple model.
This study is aimed for elucidation of space-time flow struc-ture of a three-dimensional free jet by water tank experimentusing an Ultrasonic Velocity Profile Monitor (UVP), putting acenter of interest in the flow field close to the nozzle outlet.The authors have made experiments on a square and a circularjet and reported the fluctuating flow field of a square free-jet[4]. In this report, the flow structure of a circular free jet isexamined.
A study of a circular jet is started for a long time, and Hinzedescribes the prospects of those days in the first edition of hisbook [5]. Interest for this flow field does not run out, and, forexample, many experiments such as Wygnanski & Fiedller [1]are done afterwards. With experimental environment fixed bet-ter, experimental studies are still continued with progresses ofexperimental methods [6-8], and the understanding of flow struc-ture is deepened; these studies contribute to high sophisticationof a calculation model. In particular, the development of spacemeasuring methods promotes a breakaway from conventionalmethods like point measurements, conditional measurements andso on, and it contributes greatly to understanding of the spatialstructure of various flows.
The advantage of the ultrasonic Doppler method used in this
study is to be able to get an instantaneous velocity profile on aline of ultrasonic beam in time series; the principle of the UVPmeasurements and its performance should be referred to Takeda[9]. On the other hand, a particle imaging velocimetry has abil-ity to acquire two- or three-dimensional information in space,but it is not easy to expand this in the time direction. Therefore,the UVP measurements set in an appropriate measuring posi-tion and direction are very effective to obtain the information ofspace-time correlation of the flow field. In this study, acquireddata are analyzed by Fourier transform, discrete wavelet trans-form and proper orthogonal decomposition, and, from their re-sults, the flow structure of the circular jet is clarified.
EXPERIMENTAL PROCEDURE
Apparatus
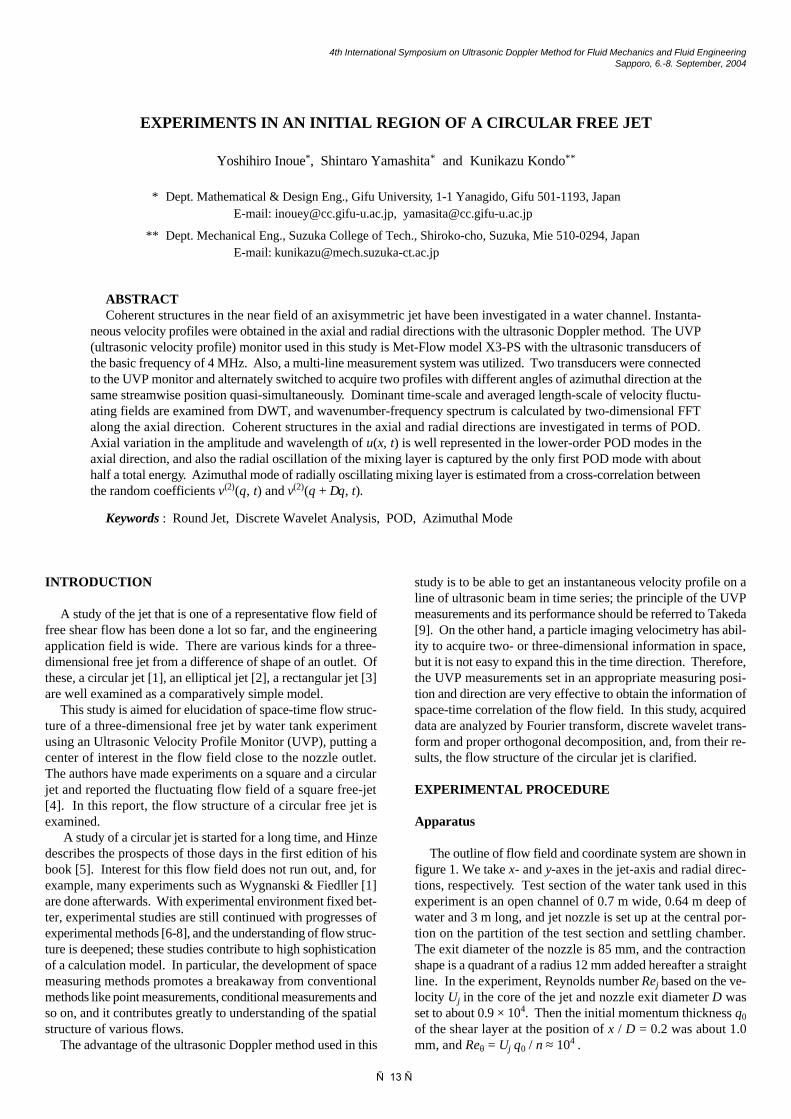
The outline of flow field and coordinate system are shown infigure 1. We take x- and y-axes in the jet-axis and radial direc-tions, respectively. Test section of the water tank used in thisexperiment is an open channel of 0.7 m wide, 0.64 m deep ofwater and 3 m long, and jet nozzle is set up at the central por-tion on the partition of the test section and settling chamber.The exit diameter of the nozzle is 85 mm, and the contractionshape is a quadrant of a radius 12 mm added hereafter a straightline. In the experiment, Reynolds number Rej based on the ve-locity Uj in the core of the jet and nozzle exit diameter D wasset to about 0.9 × 10⁴. Then the initial momentum thickness θ0of the shear layer at the position of x / D = 0.2 was about 1.0mm, and Reθ = Uj θ0 / ν ≈ 104 .
4th International Symposium on Ultrasonic Doppler Method for Fluid Mechanics and Fluid EngineeringSapporo, 6.-8. September, 2004
— 13 —
UVP measurement method
In the UVP measurement, ultrasonic transducer comprisinga function of transmission and reception is used and velocitycomponent in the traveling direction of ultrasonic beam is de-tected almost instantaneously for 128 points on the beam. Thebasic frequency of ultrasonic wave used in this experiment was4 MHz, and hydrogen bubbles generated successively from aplatinum wire of diameter of 30 µm was used for scatteringparticles. An incidence direction of the ultrasonic beam, namely,the measuring line was chosen as each direction of x- and y-axes as shown in figure 1, and the profiles along the x- and y-directions for the instantaneous velocity components of axialdirection u and radial direction v were obtained in time series.In working conditions of this experiment, the time interval ofvelocity data was about 38 ms, and the space intervals of adja-cent measuring point were 2.94 mm in the x-direction, and 2.20mm in the y-direction.
In addition to the experiment using one transducer mentionedabove, to examine the correlation of flow structure in the cir-cumferential direction the experiment using two transducers si-multaneously was also made. Azimuthal angle of the fixedmeasuring line is assumed θ, and phase angle between the mov-ing and fixed measuring lines is indicated by ∆θ (figure 1, right).In this case because multiplexer built in the UVP works, andsequential switching measurement is done, time delay of about39 ms is occurred between the measuring lines in this measure-ment. The measuring position of the axial direction was x / D =2 and 3.
If a flight direction of ultrasonic beam is assumed ξ, the quan-tity obtained by this measurement is space-time distribution ofξ component of the instantaneous velocity, and it is expressed
with Vξ (ξ) + vξ (ξ ,t). Here Vξ (ξ) shows time-averaged velocitydistribution and vξ (ξ, t) space-time distribution of fluctuatingvelocity. For data set of this space-time distribution, data analy-ses such as Fourier transform, discrete wavelet transform andproper orthogonal decomposition are performed as done in theprevious report [4], and flow structure is examined.
RESULTS AND DISCUSSION
Mean flow field
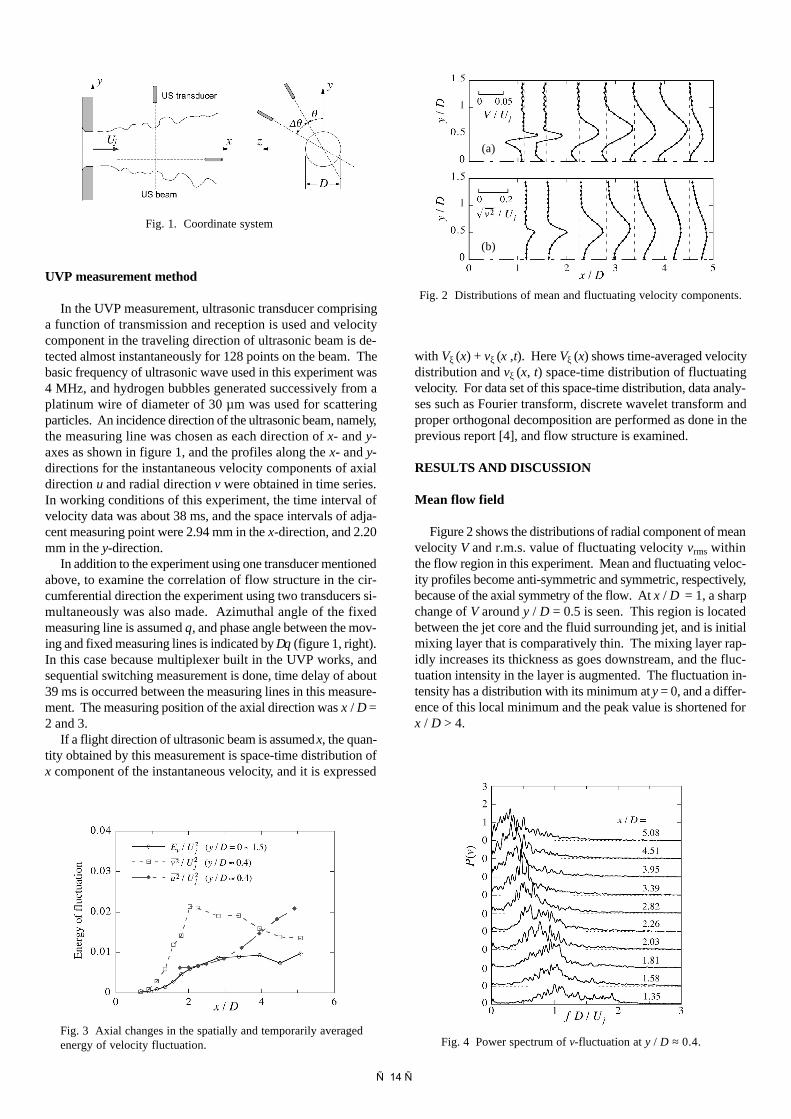
Figure 2 shows the distributions of radial component of meanvelocity V and r.m.s. value of fluctuating velocity vrms withinthe flow region in this experiment. Mean and fluctuating veloc-ity profiles become anti-symmetric and symmetric, respectively,because of the axial symmetry of the flow. At x / D = 1, a sharpchange of V around y / D = 0.5 is seen. This region is locatedbetween the jet core and the fluid surrounding jet, and is initialmixing layer that is comparatively thin. The mixing layer rap-idly increases its thickness as goes downstream, and the fluc-tuation intensity in the layer is augmented. The fluctuation in-tensity has a distribution with its minimum at y = 0, and a differ-ence of this local minimum and the peak value is shortened forx / D > 4.
Fig. 1. Coordinate system
Fig. 2 Distributions of mean and fluctuating velocity components.
(a)
(b)
Fig. 3 Axial changes in the spatially and temporarily averagedenergy of velocity fluctuation. Fig. 4 Power spectrum of v-fluctuation at y / D ≈ 0.4.
— 14 —
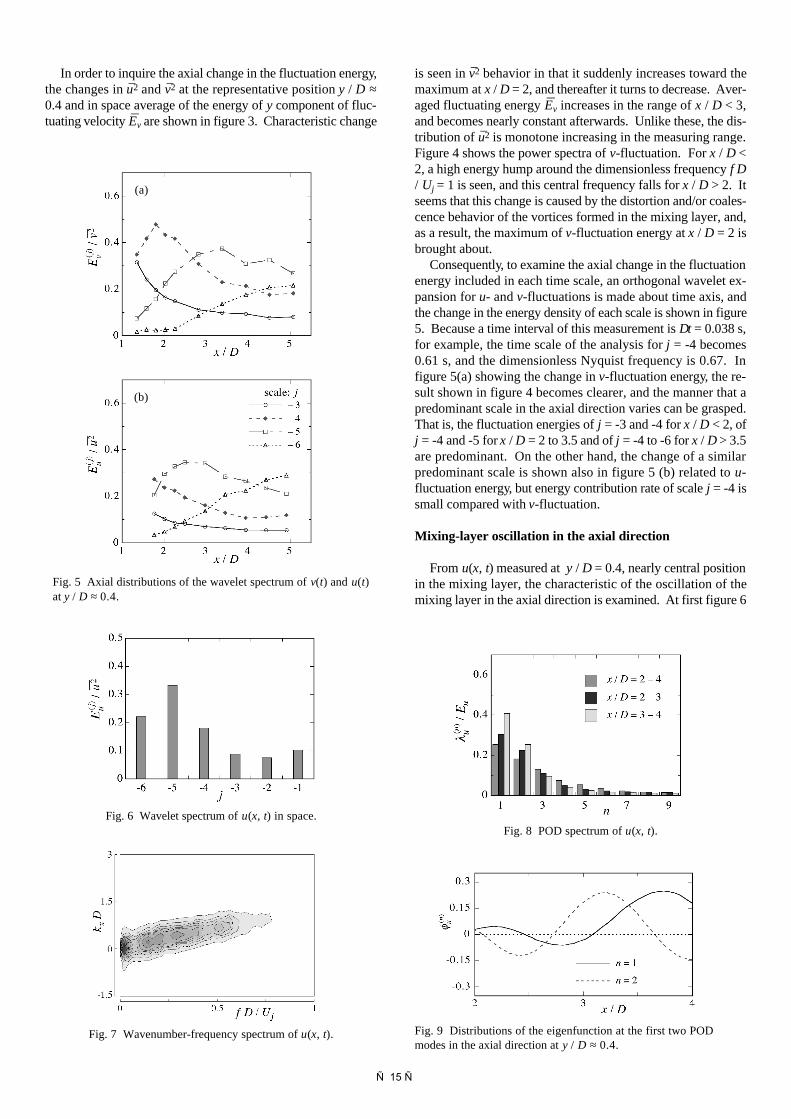
_is seen in v2 behavior in that it suddenly increases toward themaximum at x / D = 2, and thereafter it turns to decrease. Aver-_aged fluctuating energy Ev increases in the range of x / D < 3,and becomes nearly constant afterwards. Unlike these, the dis-_tribution of u2 is monotone increasing in the measuring range.Figure 4 shows the power spectra of v-fluctuation. For x / D <2, a high energy hump around the dimensionless frequency f D/ Uj = 1 is seen, and this central frequency falls for x / D > 2. Itseems that this change is caused by the distortion and/or coales-cence behavior of the vortices formed in the mixing layer, and,as a result, the maximum of v-fluctuation energy at x / D = 2 isbrought about.
Consequently, to examine the axial change in the fluctuationenergy included in each time scale, an orthogonal wavelet ex-pansion for u- and v-fluctuations is made about time axis, andthe change in the energy density of each scale is shown in figure5. Because a time interval of this measurement is ∆t = 0.038 s,for example, the time scale of the analysis for j = -4 becomes0.61 s, and the dimensionless Nyquist frequency is 0.67. Infigure 5(a) showing the change in v-fluctuation energy, the re-sult shown in figure 4 becomes clearer, and the manner that apredominant scale in the axial direction varies can be grasped.That is, the fluctuation energies of j = -3 and -4 for x / D < 2, ofj = -4 and -5 for x / D = 2 to 3.5 and of j = -4 to -6 for x / D > 3.5are predominant. On the other hand, the change of a similarpredominant scale is shown also in figure 5 (b) related to u-fluctuation energy, but energy contribution rate of scale j = -4 issmall compared with v-fluctuation.
Mixing-layer oscillation in the axial direction
From u(x, t) measured at y / D = 0.4, nearly central positionin the mixing layer, the characteristic of the oscillation of themixing layer in the axial direction is examined. At first figure 6
Fig. 5 Axial distributions of the wavelet spectrum of v(t) and u(t)at y / D ≈ 0.4.
(a)
(b)
Fig. 7 Wavenumber-frequency spectrum of u(x, t).
Fig. 6 Wavelet spectrum of u(x, t) in space.Fig. 8 POD spectrum of u(x, t).
Fig. 9 Distributions of the eigenfunction at the first two PODmodes in the axial direction at y / D ≈ 0.4.
In order to inquire the axial change in the fluctuation energy,_ _the changes in u2 and v2 at the representative position y / D ≈0.4 and in space average of the energy of y component of fluc-_tuating velocity Ev are shown in figure 3. Characteristic change
— 15 —

is the DWT spectrum obtained from the orthogonal wavelet ex-pansion made in the direction of spatial coordinate axis in therange of x / D = 2 to 5. From this figure, it can been seen thatthe energy contribution from the scale j = -5, which is the di-mensionless wavelength 2.2, is the highest, and that there existwaves around the mean wavelength in the mixing layer.
Next, the wavenumber-frequency distribution is sought fromtwo-dimensional Fourier transformation in spatiotemporal space.In this case the range of analysis was assumed x / D = 3 to 5.Figure 7 shows this result in the form of a contour map, wherefrequency f and wave number kx are made dimensionless. Theregion where the energy is high extends as a ridge linearly fromthe origin, and the phase velocity of the wave is estimated 0.77Uj for y / D = 0.4 from this slope.
As for this flow field, the time scale varies in the flow direc-tion as described in the previous section, and it seems that thespatial scale varies with this. However, two-dimensional Fou-rier spectrum mentioned above cannot express non-homogene-ity in space, and also DWT spectrum cannot. Therefore theproper orthogonal decomposition is performed for the same data
set, and at first the spatial mode in which the energy content ishigh is detected. The result analyzed in the range of x / D = 2 to4 is given in figure 9, and the energy spectrum is shown in fig-ure 8. It is understood that, from the distribution ofeigenfunction, the variations of the amplitude and wavelengthin the flow direction are captured. Even if analyzed after divid-ing the target range into x / D = 2 to 3 and 3 to 4, any differencebetween the distributions of eigenfunction was hardly seen, butas shown in figure 8 the energy density of lower order mode ishigher when analyzed after dividing, and in particular for x / D= 3 to 4.
Velocity fluctuation in the radial direction
The change of the time scale of v-fluctuation in the radialdirection is examined using the DWT in representative posi-tions x / D = 2.03, 2.82 and 3.95. It can been seen from figure10 (a) of position x / D = 2.03 that the energy contribution fromthe scale j = -4 holds more than 40 % in the mixing layer, andthat from j = -5 is large next. At x / D = 2.82 (figure 10 (b)) thecontribution from the scale j = -5 is predominant on the whole.Because the scale j = -5 is the nearest to a column mode withrespect to time scale, it seems that the column mode is domi-nant on the whole cross section of the jet at x / D = 2.82. On theother hand, the scales j = -4 and -5 make contribution of thesame degree in the center of the mixing layer, and the fluctua-
(a)
(b)
(c)
Fig. 10 Radial distributions of the wavelet spectrum of v(y, t) intime. (a) x / D = 2.03, (b) x / D = 2.82 and (c) x / D = 3.95
Fig. 11 POD spectrum of v(y, t).
Fig. 12 Distributions of the eigenfunction at the first two POD modes.
(a)
(b)
— 16 —
tion having a short time scale becomes stronger than in the jetcenter. The scale j = -5 is also predominant in x / D = 3.95(figure 10 (c)), but its energy contribution becomes low, and thefluctuation of the scale j = -6 becomes relatively high comparedwith at the upstream positions.
For the radial distribution, the spatial mode was found byapplying the proper orthogonal decomposition. Figure 11 givesthe POD spectrum, and figure 12 shows the distributions of theeigenfunction for n = 1 and 2. The distributions of eigenfunctionof low order mode in any position become similar, and only theradial width expands as goes downstream. From the energyspectra, extreme prominence of mode n = 1 is realized. How-ever, this prominence becomes low in the downstream. It seemsthat the fluctuation of n = 1 corresponds to the inward and out-ward motions of the mixing layer from the distributions of theeigenfunction, and superposition of this fluctuation and that ofn = 2 brings about a deviation of the radial position where v-fluctuation has a maximum value.
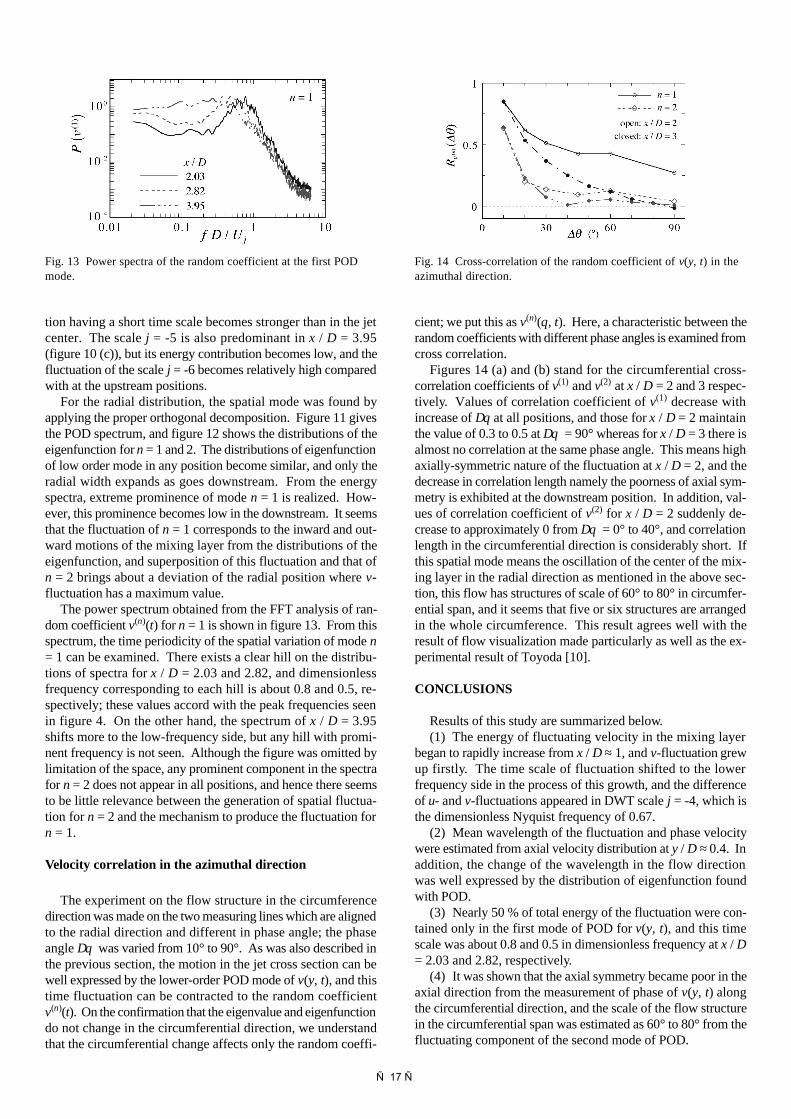
The power spectrum obtained from the FFT analysis of ran-dom coefficient v(n)(t) for n = 1 is shown in figure 13. From thisspectrum, the time periodicity of the spatial variation of mode n= 1 can be examined. There exists a clear hill on the distribu-tions of spectra for x / D = 2.03 and 2.82, and dimensionlessfrequency corresponding to each hill is about 0.8 and 0.5, re-spectively; these values accord with the peak frequencies seenin figure 4. On the other hand, the spectrum of x / D = 3.95shifts more to the low-frequency side, but any hill with promi-nent frequency is not seen. Although the figure was omitted bylimitation of the space, any prominent component in the spectrafor n = 2 does not appear in all positions, and hence there seemsto be little relevance between the generation of spatial fluctua-tion for n = 2 and the mechanism to produce the fluctuation forn = 1.
Velocity correlation in the azimuthal direction
The experiment on the flow structure in the circumferencedirection was made on the two measuring lines which are alignedto the radial direction and different in phase angle; the phaseangle ∆θ was varied from 10° to 90°. As was also described inthe previous section, the motion in the jet cross section can bewell expressed by the lower-order POD mode of v(y, t), and thistime fluctuation can be contracted to the random coefficientv(n)(t). On the confirmation that the eigenvalue and eigenfunctiondo not change in the circumferential direction, we understandthat the circumferential change affects only the random coeffi-
cient; we put this as v(n)(θ, t). Here, a characteristic between therandom coefficients with different phase angles is examined fromcross correlation.
Figures 14 (a) and (b) stand for the circumferential cross-correlation coefficients of v(1) and v(2) at x / D = 2 and 3 respec-tively. Values of correlation coefficient of v(1) decrease withincrease of ∆θ at all positions, and those for x / D = 2 maintainthe value of 0.3 to 0.5 at ∆θ = 90° whereas for x / D = 3 there isalmost no correlation at the same phase angle. This means highaxially-symmetric nature of the fluctuation at x / D = 2, and thedecrease in correlation length namely the poorness of axial sym-metry is exhibited at the downstream position. In addition, val-ues of correlation coefficient of v(2) for x / D = 2 suddenly de-crease to approximately 0 from ∆θ = 0° to 40°, and correlationlength in the circumferential direction is considerably short. Ifthis spatial mode means the oscillation of the center of the mix-ing layer in the radial direction as mentioned in the above sec-tion, this flow has structures of scale of 60° to 80° in circumfer-ential span, and it seems that five or six structures are arrangedin the whole circumference. This result agrees well with theresult of flow visualization made particularly as well as the ex-perimental result of Toyoda [10].
CONCLUSIONS
Results of this study are summarized below.(1) The energy of fluctuating velocity in the mixing layer
began to rapidly increase from x / D ≈ 1, and v-fluctuation grewup firstly. The time scale of fluctuation shifted to the lowerfrequency side in the process of this growth, and the differenceof u- and v-fluctuations appeared in DWT scale j = -4, which isthe dimensionless Nyquist frequency of 0.67.
(2) Mean wavelength of the fluctuation and phase velocitywere estimated from axial velocity distribution at y / D ≈ 0.4. Inaddition, the change of the wavelength in the flow directionwas well expressed by the distribution of eigenfunction foundwith POD.
(3) Nearly 50 % of total energy of the fluctuation were con-tained only in the first mode of POD for v(y, t), and this timescale was about 0.8 and 0.5 in dimensionless frequency at x / D= 2.03 and 2.82, respectively.
(4) It was shown that the axial symmetry became poor in theaxial direction from the measurement of phase of v(y, t) alongthe circumferential direction, and the scale of the flow structurein the circumferential span was estimated as 60° to 80° from thefluctuating component of the second mode of POD.
Fig. 13 Power spectra of the random coefficient at the first PODmode.
Fig. 14 Cross-correlation of the random coefficient of v(y, t) in theazimuthal direction.
— 17 —

REFERENCES
1. I. Wygnanski, I., H. Fiedler, 1969, Some measurements inthe self-preserving jet, J. Fluid Mech., 38, pp. 577-612.
2. H.S. Husain, F. Hussain, 1993, Elliptic jets. Part 3. Dy-namics of preferred mode coherent structure, J. Fluid Mech.,248, pp. 315-361.
3. Y. Tsuchiya, C. Horikoshi, T. Sato, 1986, On the spread ofrectangular jets, Exp. Fluids, 4, pp. 197-204.
4. Y. Inoue, S. Yamashita, K. Kondo, 2002, The ultrasonicvelocity profile measurement of flow structure in the nearfield of a square free jet, Exp. Fluids, 32, pp. 170-178.
5. J.O. Hinze, 1959, “Turbulence. An Introduction to ItsMechanism and Theory,” McGraw-Hill, New York.
6. N.R. Panchapakesan, J.L. Lumley, 1993, Turbulence mea-surements in axisymmetric jets of air and helium. Part 1.
Air jet, J. Fluid Mech., 246, pp. 197-223.7. H.J. Hussein, S.P. Capp, W.K. George, 1994, Velocity mea-
surements in a high-Reynolds-number, momentum-conserv-ing, axisymmetric, turbulent jet, J. Fluid Mech., 258, pp.31-75.
8. G. Xu, R.A. Antonia, 2002, Effect of different initial condi-tions on a turbulent round free jet, Exp. Fluids, 33, pp. 677-683.
9. Y. Takeda, 1995, Velocity profile measurement by ultra-sonic Doppler method, Exp. Thermal Fluid Sci., 10, pp.444-453.
10. K. Toyoda et al., 1999, Effect of axial azimuthal perturba-tions on entrainment, mixing and diffusion of a circular jet,Proc. 3rd ASME/JSME Joint Fluids Eng. Conf., FEDSM99-7285.
— 18 —