jennifer falbe, scd, mph kristine madsen, md, mph uc berkeley school of public health
TRANSCRIPT
EVALUATION OF THE BERKELEY “SODA TAX”Jennifer Falbe, ScD, MPH
Kristine Madsen, MD, MPH
UC Berkeley School of Public Health
MEASURE D
Excise tax on SSB Distributors
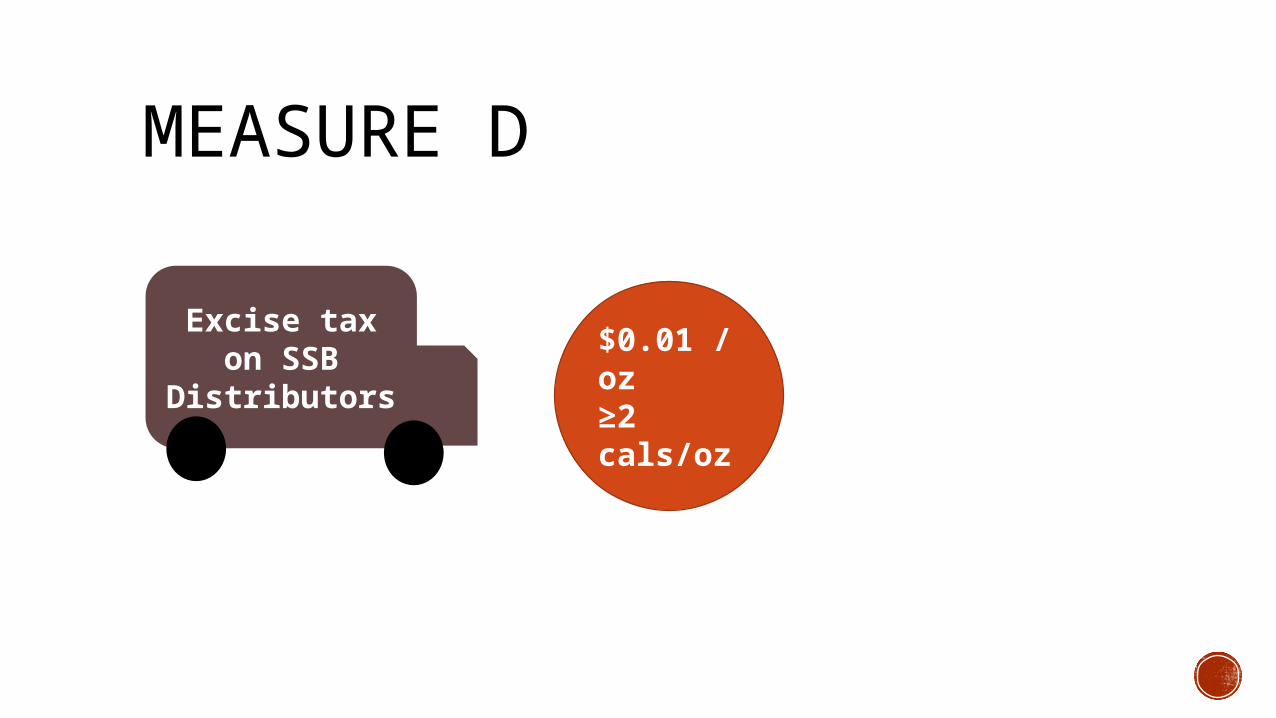
MEASURE D
$0.01 /oz ≥2 cals/oz
Excise tax on SSB Distributors
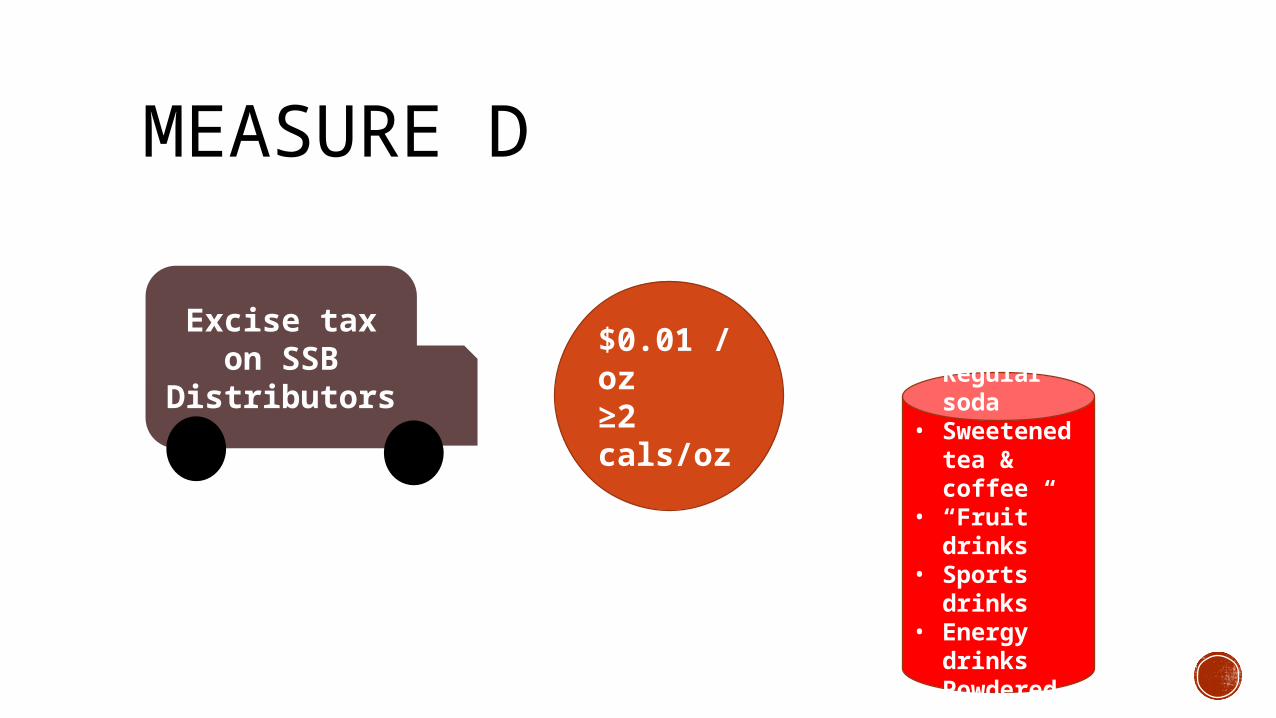
MEASURE D
$0.01 /oz ≥2 cals/oz
• Regular soda• Sweetened
tea & coffee• “Fruit” drinks• Sports drinks• Energy drinks• Powdered,
syrup or frozen
Excise tax on SSB Distributors

MEASURE D
$0.01 /oz ≥2 cals/oz
• Regular soda• Sweetened
tea & coffee• “Fruit” drinks• Sports drinks• Energy drinks• Powdered,
syrup or frozen
• Milks• 100% juice• Medical
beverages• Alcoholic
drinksExcise tax on SSB
Distributors
MEASURE DGeneral tax simple majority
MEASURE DGeneral tax simple majority 76% voted yes
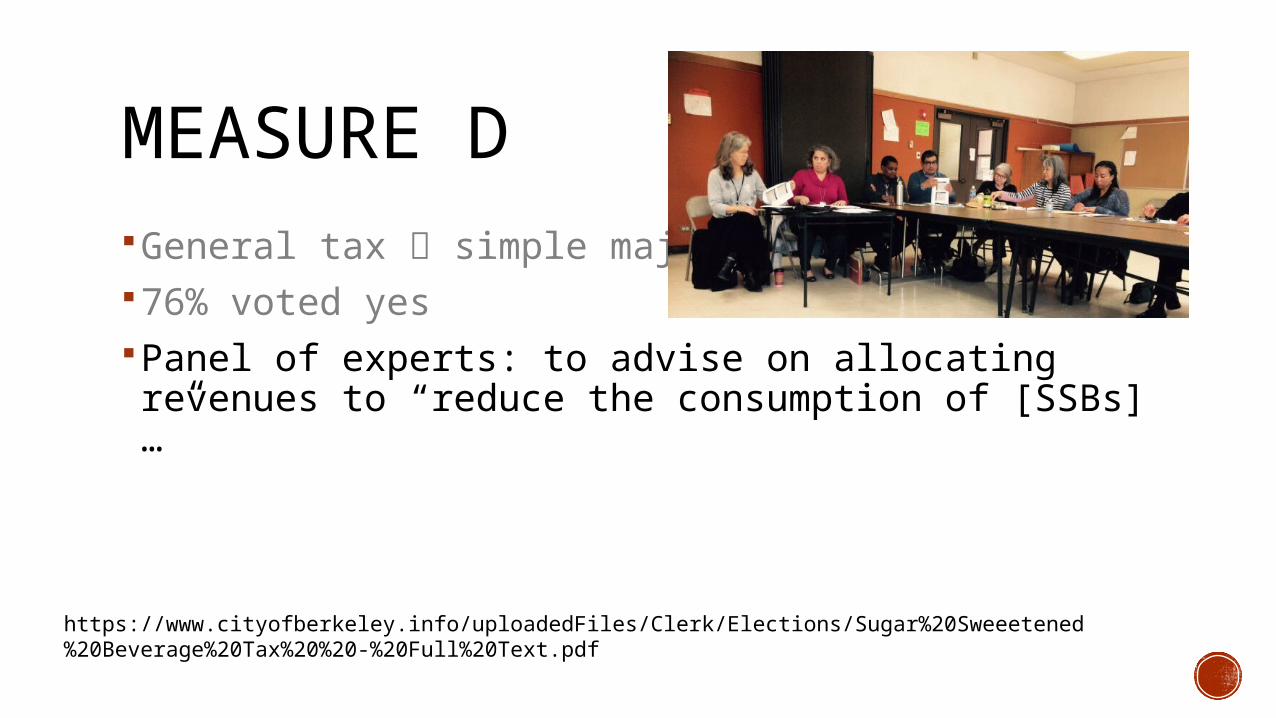
MEASURE DGeneral tax simple majority 76% voted yesPanel of experts: to advise on allocating revenues to “reduce the
consumption of [SSBs]…”
https://www.cityofberkeley.info/uploadedFiles/Clerk/Elections/Sugar%20Sweeetened%20Beverage%20Tax%20%20-%20Full%20Text.pdf

MEASURE DGeneral tax simple majority 76% voted yesPanel of experts: to advise on allocating revenues to “reduce the
consumption of [SSBs]…” Must have experience in community or school-based food and nutrition
programs, early childhood nutrition education, or researching/evaluating relevant public health issues/programs; or
Be a licensed medical practitioner
https://www.cityofberkeley.info/uploadedFiles/Clerk/Elections/Sugar%20Sweeetened%20Beverage%20Tax%20%20-%20Full%20Text.pdf

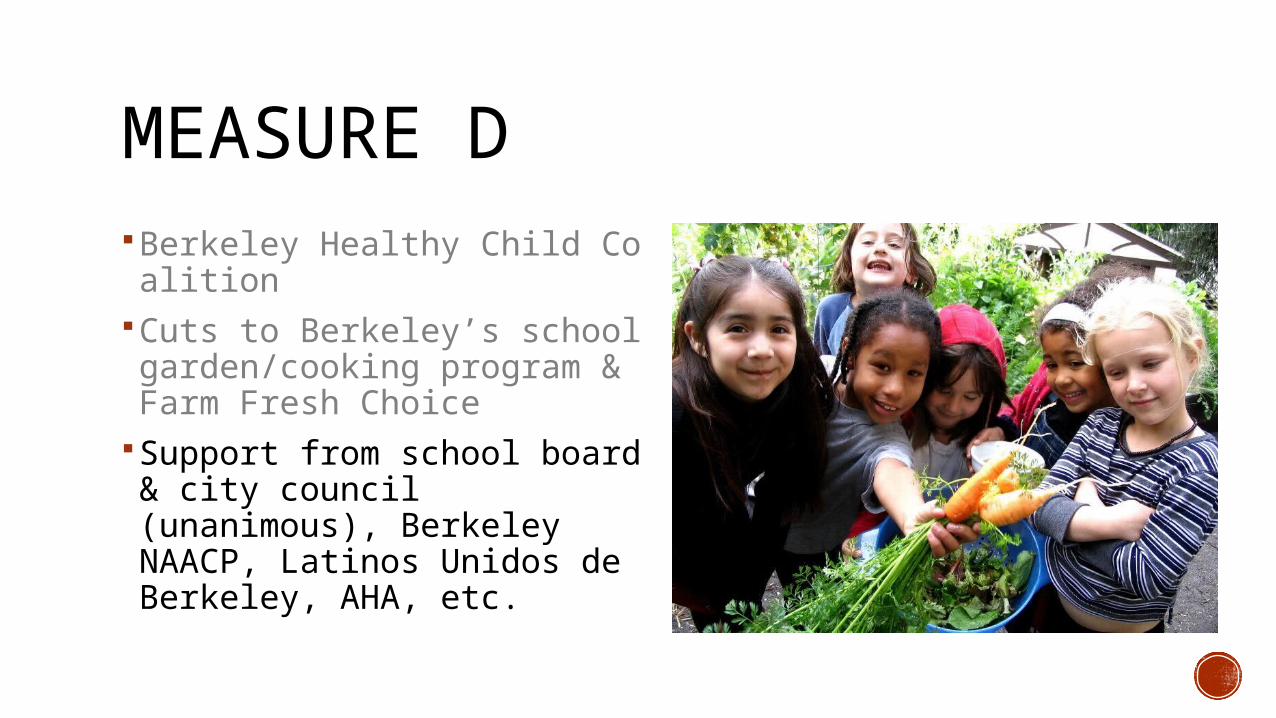
MEASURE DBerkeley Healthy Child Coalition
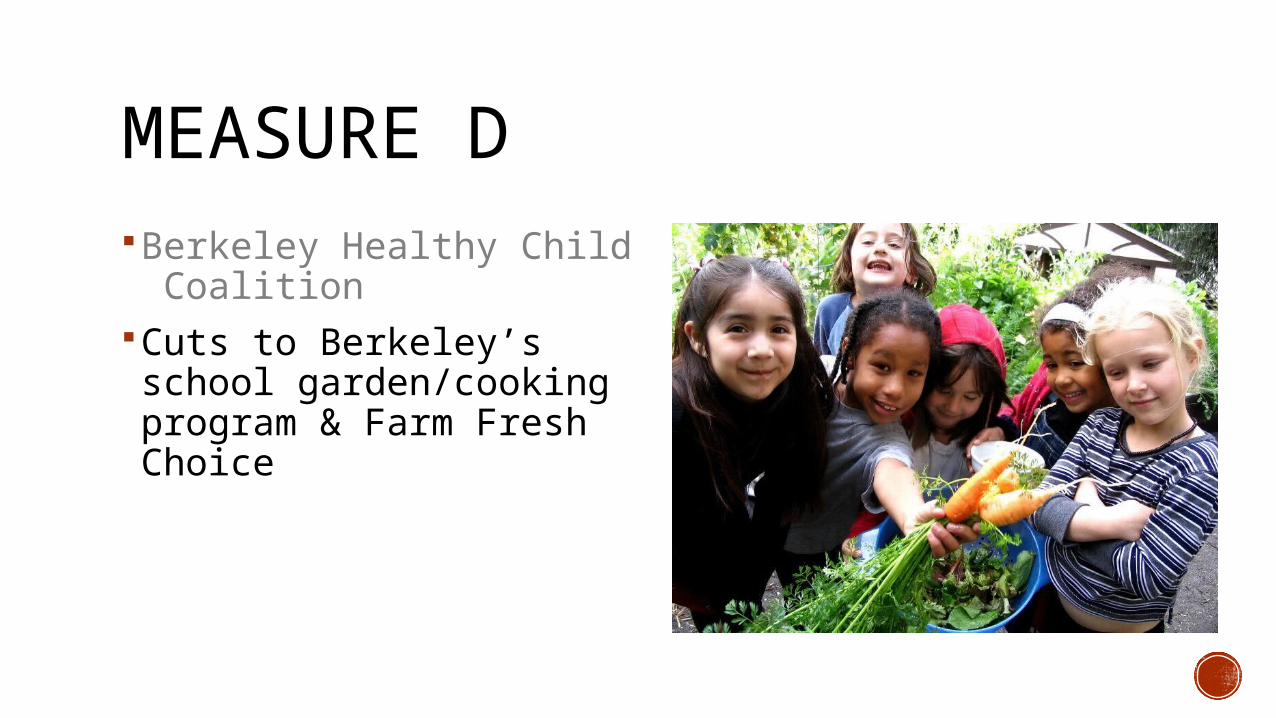
MEASURE DBerkeley Healthy Child Coalition Cuts to Berkeley’s school
garden/cooking program & Farm Fresh Choice
MEASURE DBerkeley Healthy Child Coalition Cuts to Berkeley’s school
garden/cooking program & Farm Fresh Choice
Support from school board & city council (unanimous), Berkeley NAACP, Latinos Unidos de Berkeley, AHA, etc.
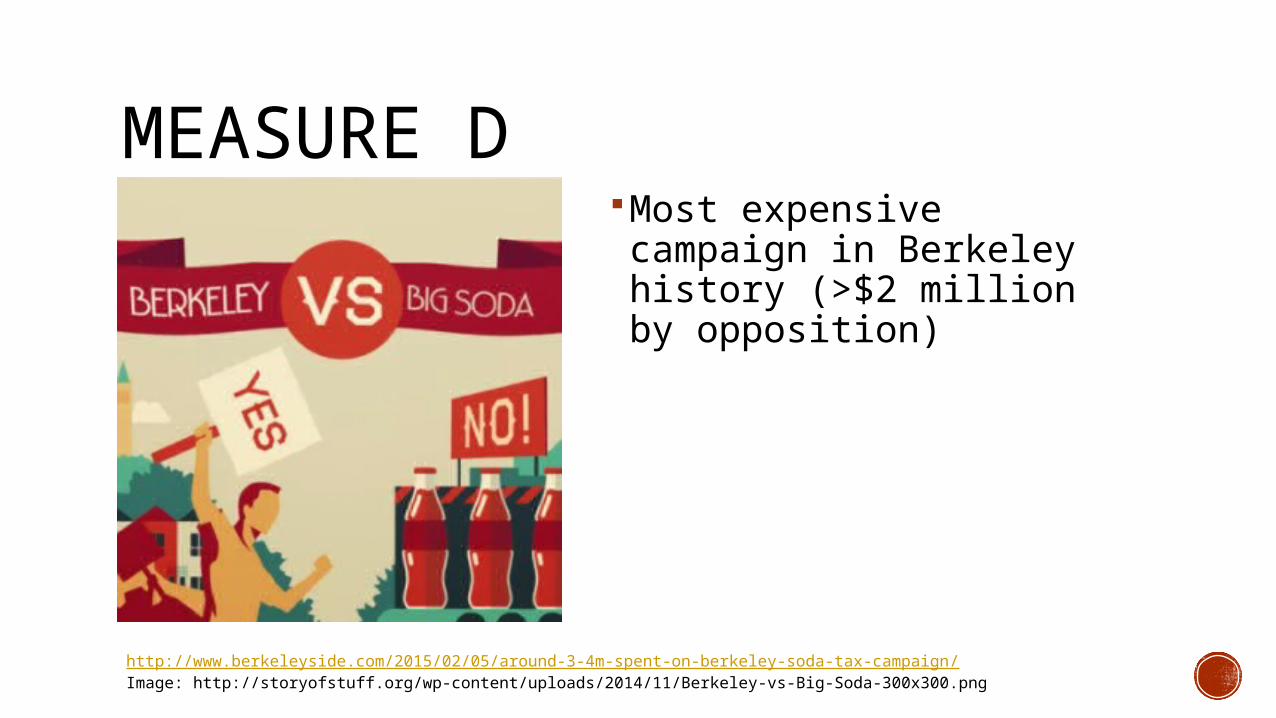
MEASURE DMost expensive campaign in
Berkeley history (>$2 million by opposition)
http://www.berkeleyside.com/2015/02/05/around-3-4m-spent-on-berkeley-soda-tax-campaign/Image: http://storyofstuff.org/wp-content/uploads/2014/11/Berkeley-vs-Big-Soda-300x300.png
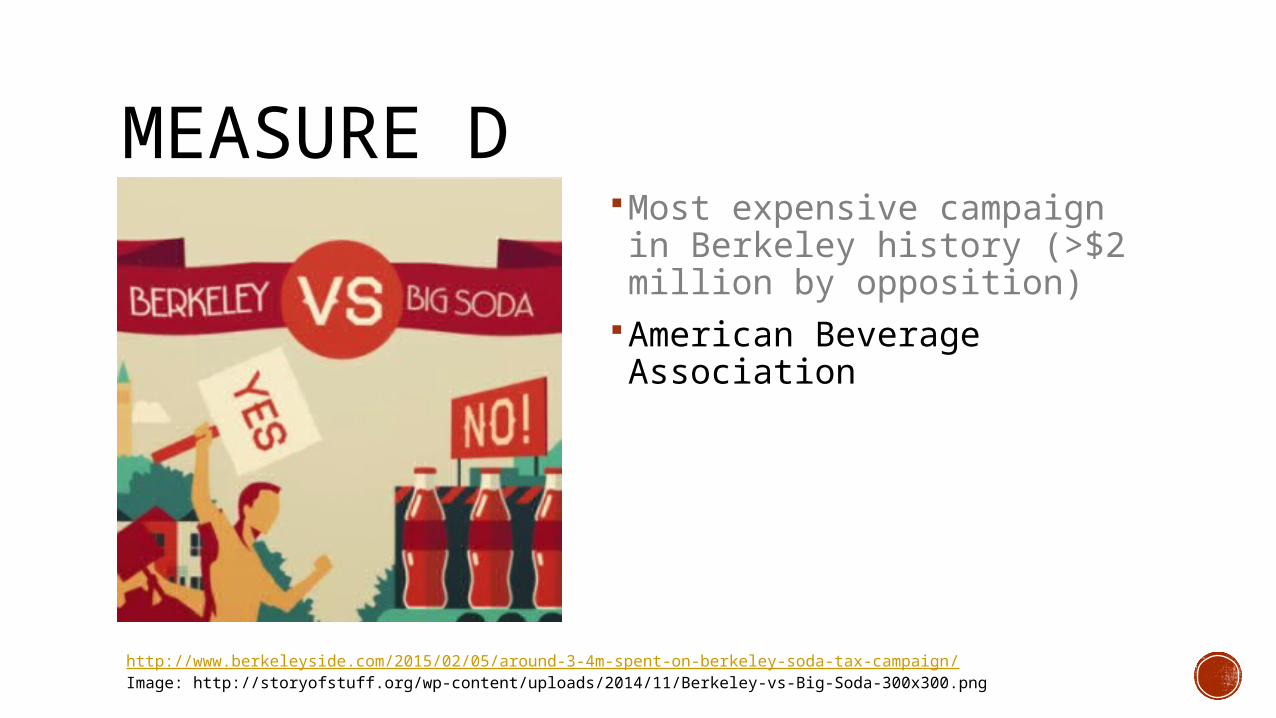
MEASURE DMost expensive campaign in
Berkeley history (>$2 million by opposition)
American Beverage Association
http://www.berkeleyside.com/2015/02/05/around-3-4m-spent-on-berkeley-soda-tax-campaign/Image: http://storyofstuff.org/wp-content/uploads/2014/11/Berkeley-vs-Big-Soda-300x300.png
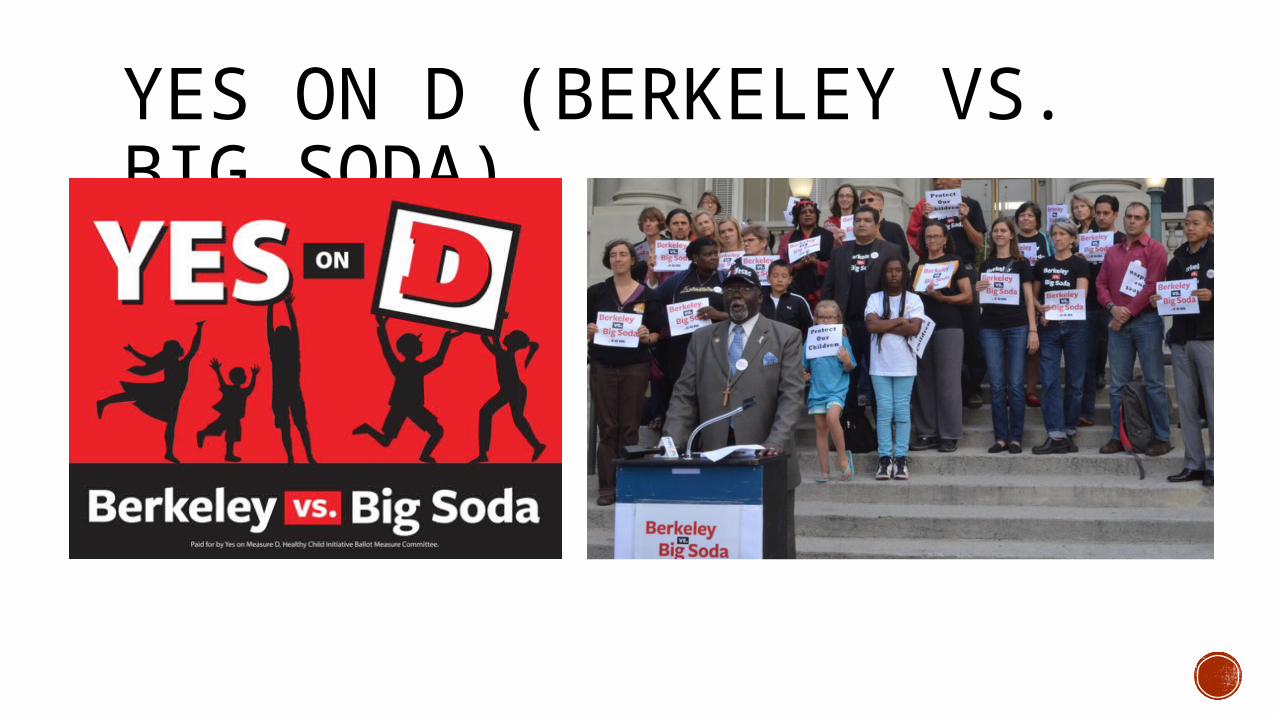
YES ON D (BERKELEY VS. BIG SODA)
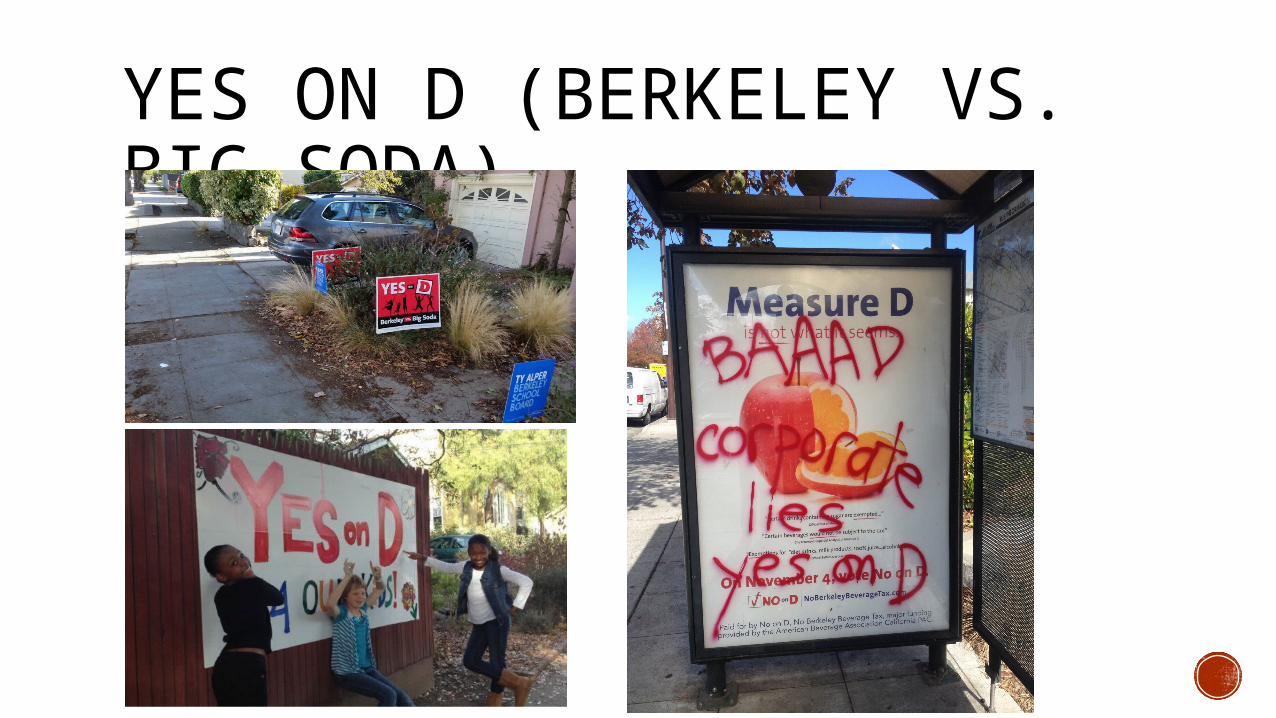
YES ON D (BERKELEY VS. BIG SODA)

NO ON D (AMERICAN BEVERAGE ASSOC)

NO ON D (AMERICAN BEVERAGE ASSOC)

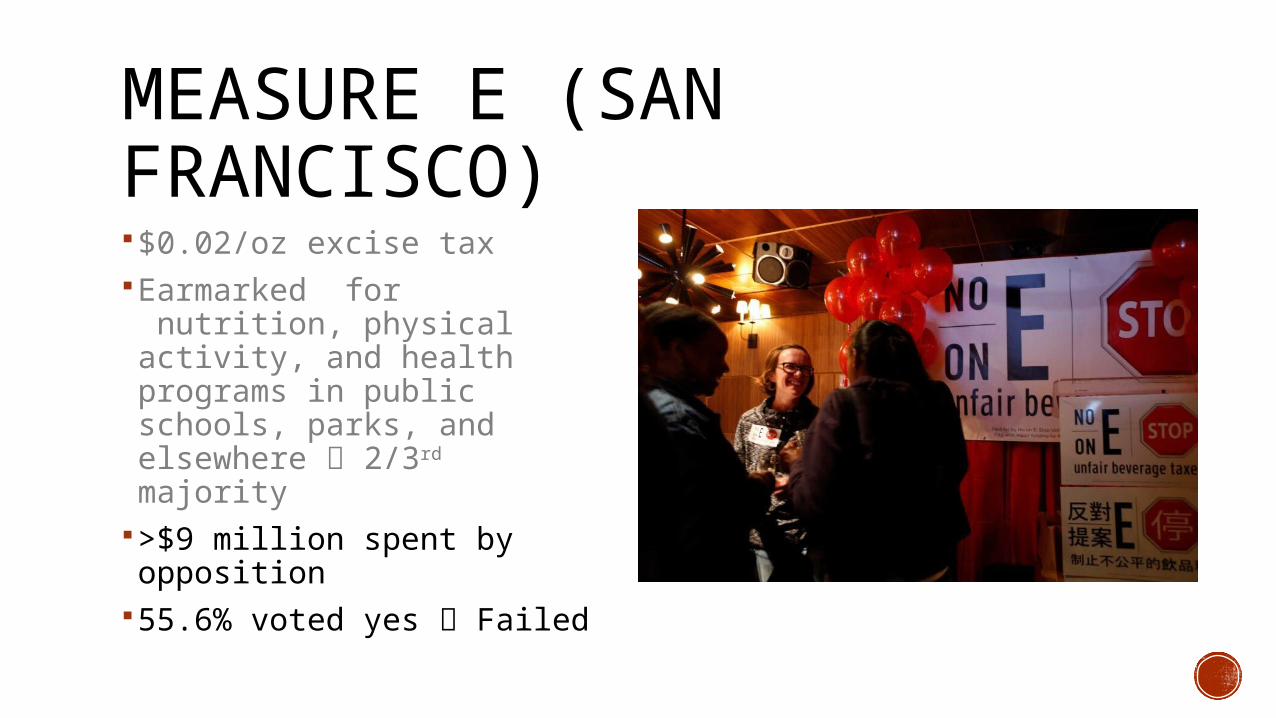
MEASURE E (SAN FRANCISCO)$0.02/oz excise taxEarmarked for nutrition,
physical activity, and health programs in public schools, parks, and elsewhere 2/3rd majority
MEASURE E (SAN FRANCISCO)$0.02/oz excise taxEarmarked for nutrition,
physical activity, and health programs in public schools, parks, and elsewhere 2/3rd majority
>$9 million spent by opposition
55.6% voted yes Failed
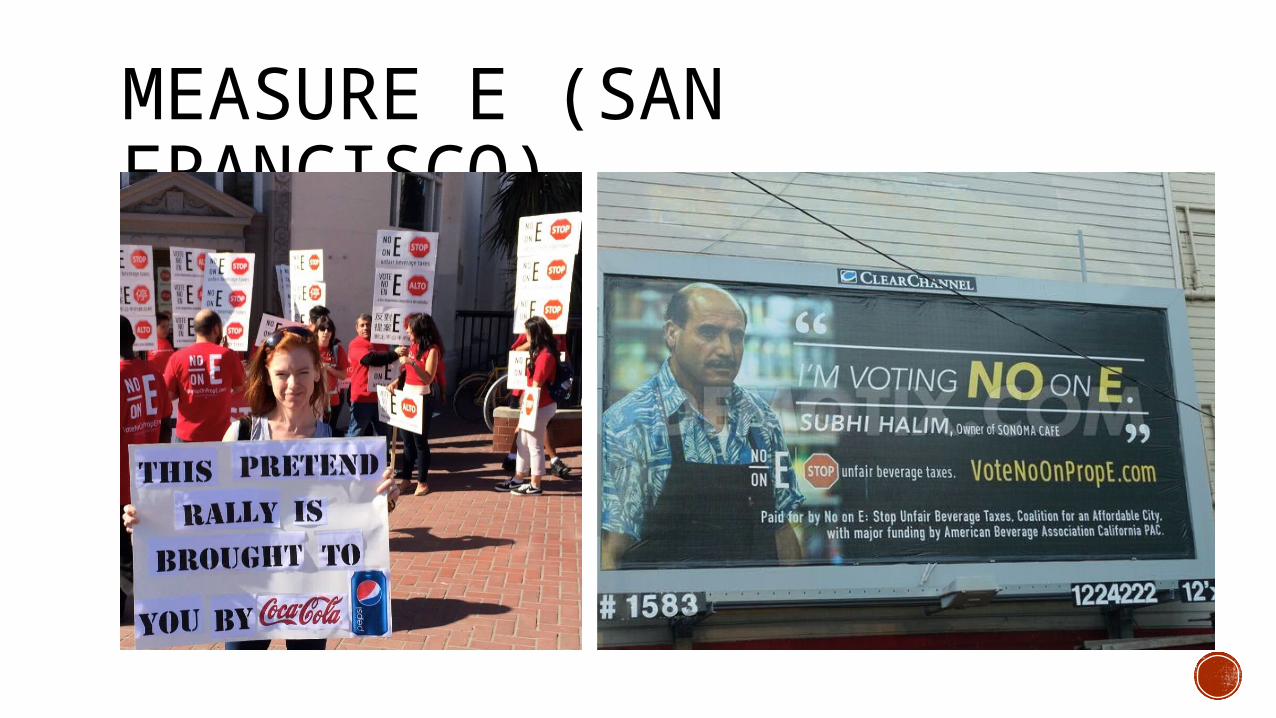
MEASURE E (SAN FRANCISCO)

BERKELEY D: IMPLEMENTATION Implementation date: January 1, 2015Actual: March, 2015 $116,000 collected in April Projected: $1.2 million in 1st year
EVALUATIONCITIES: Berkeley (intervention), SF, & Oakland (comparison)1. PRICES: Examine extent to which tax is passed-through to retail
prices.
EVALUATIONCITIES: Berkeley (intervention), SF, & Oakland (comparison)1. PRICES: Examine extent to which tax is passed-through to retail
prices.
Distributors
Retailers
EVALUATIONCITIES: Berkeley (intervention), SF, & Oakland (comparison)1. PRICES: Examine extent to which tax is passed-through to retail
prices.2. CONSUMPTION: Changes in consumption of SSBs3. Media analysis of news coverage (Berkeley Media Studies Group)
Distributors
Retailers

DESIGNNatural experiment
Prices: Longitudinal Consumption: Repeated cross-sections
DESIGNNatural experiment
Prices: Longitudinal Consumption: Repeated cross-sections
3 cities: San Francisco, Berkeley, & Oakland 2 lower-income neighborhoods per city Matched (to extent possible) on foot traffic and census tract race & income
variables
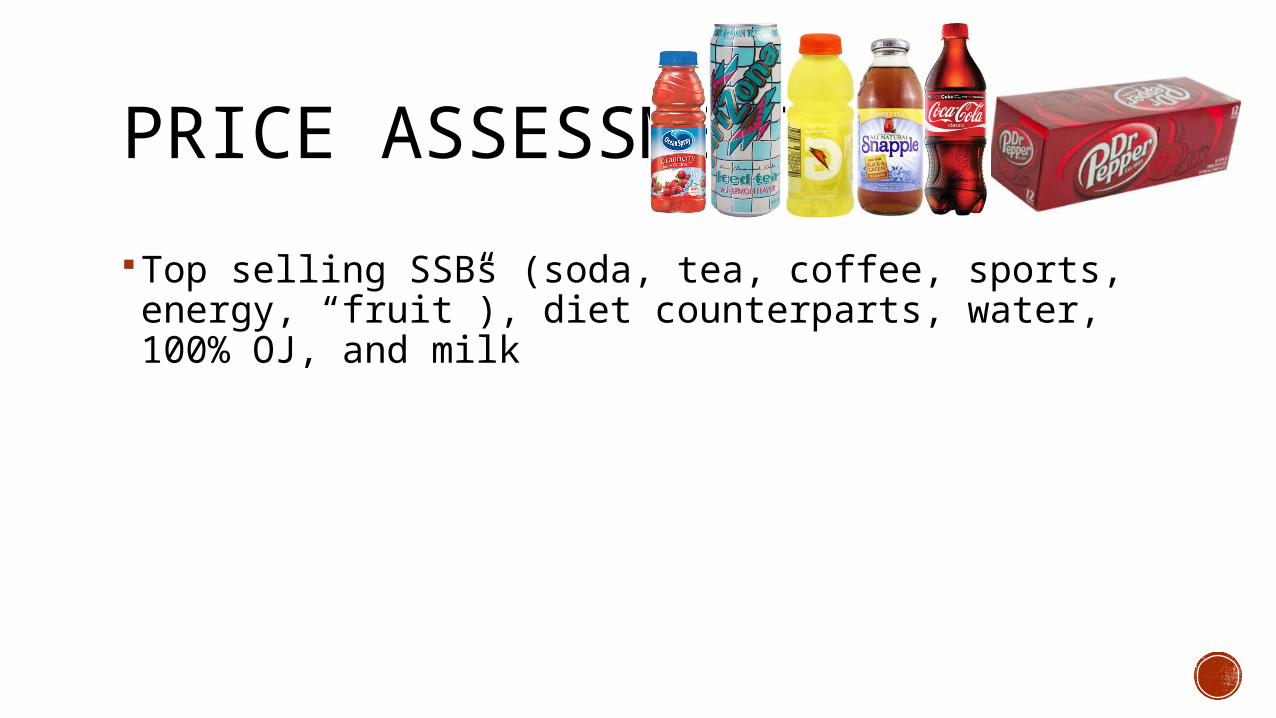
PRICE ASSESSMENT
Top selling SSBs (soda, tea, coffee, sports, energy, “fruit”), diet counterparts, water, 100% OJ, and milk
PRICE ASSESSMENT
Top selling SSBs (soda, tea, coffee, sports, energy, “fruit”), diet counterparts, water, 100% OJ, and milk
Chain grocery, small grocery, drugstores, convenience stores, liquor stores, and fast food restaurants in each neighborhood (or the closest)
PRICE ASSESSMENT
Top selling SSBs (soda, tea, coffee, sports, energy, “fruit”), diet counterparts, water, 100% OJ, and milk
Chain grocery, small grocery, drugstores, convenience stores, liquor stores, and fast food restaurants in each neighborhood (or the closest)
Most common single serving size (e.g., 20 oz bottle) in all stores and common larger sizes (e.g., 2 liters, 12 packs) in a subsample of stores
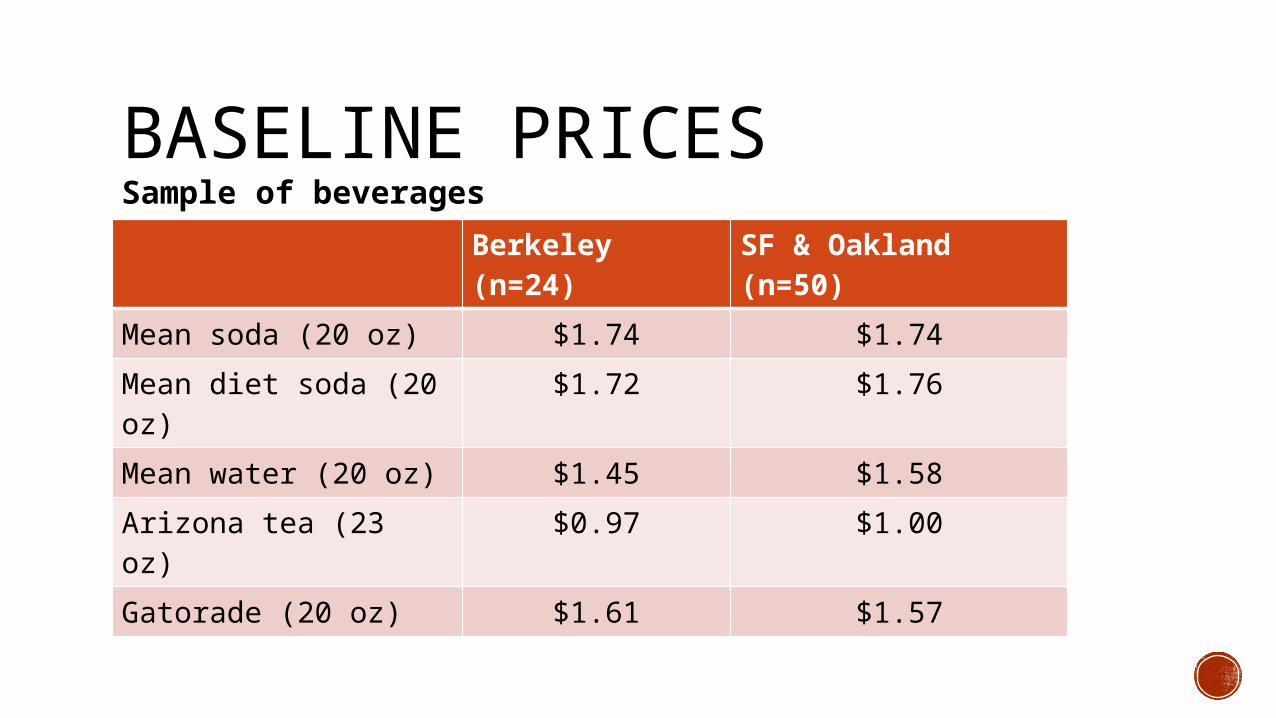
BASELINE PRICESBerkeley (n=24)
SF & Oakland (n=50)
Mean soda (20 oz) $1.74 $1.74
Mean diet soda (20 oz)
$1.72 $1.76
Mean water (20 oz) $1.45 $1.58
Arizona tea (23 oz) $0.97 $1.00
Gatorade (20 oz) $1.61 $1.57
Sample of beverages

PASS-THROUGH: EXAMPLEExample of complete pass-through12 *12 ounces *$0.01= $1.44$7.43-$5.99=$1.44
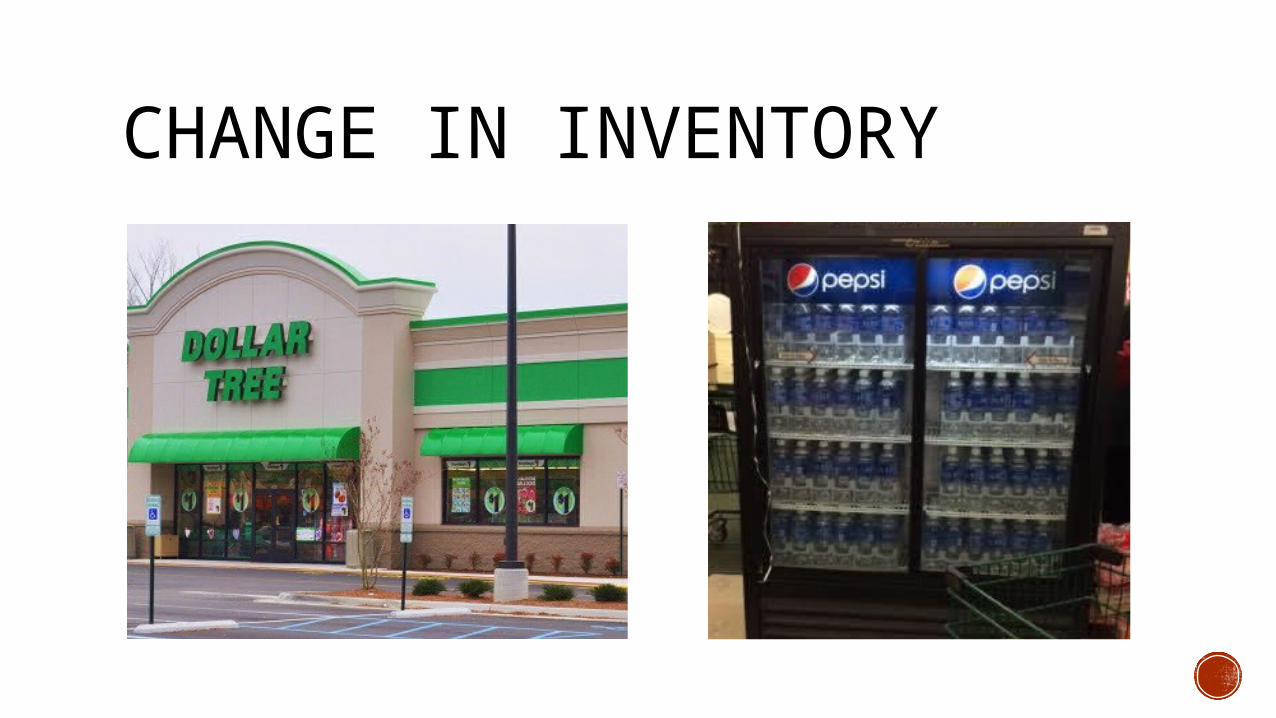
CHANGE IN INVENTORY
CONSUMPTION Intercept surveys
Beverage frequency questionnaire
CONSUMPTION Intercept surveys
Beverage frequency questionnaire Knowledge & attitudes about SSBs and the tax Demographics
CONSUMPTION Intercept surveys
Beverage frequency questionnaire Knowledge & attitudes about SSBs and the tax Demographics Post-survey: perceived changes in purchasing habits
(e.g., changing stores or cities from which they buy beverages, stocking up)
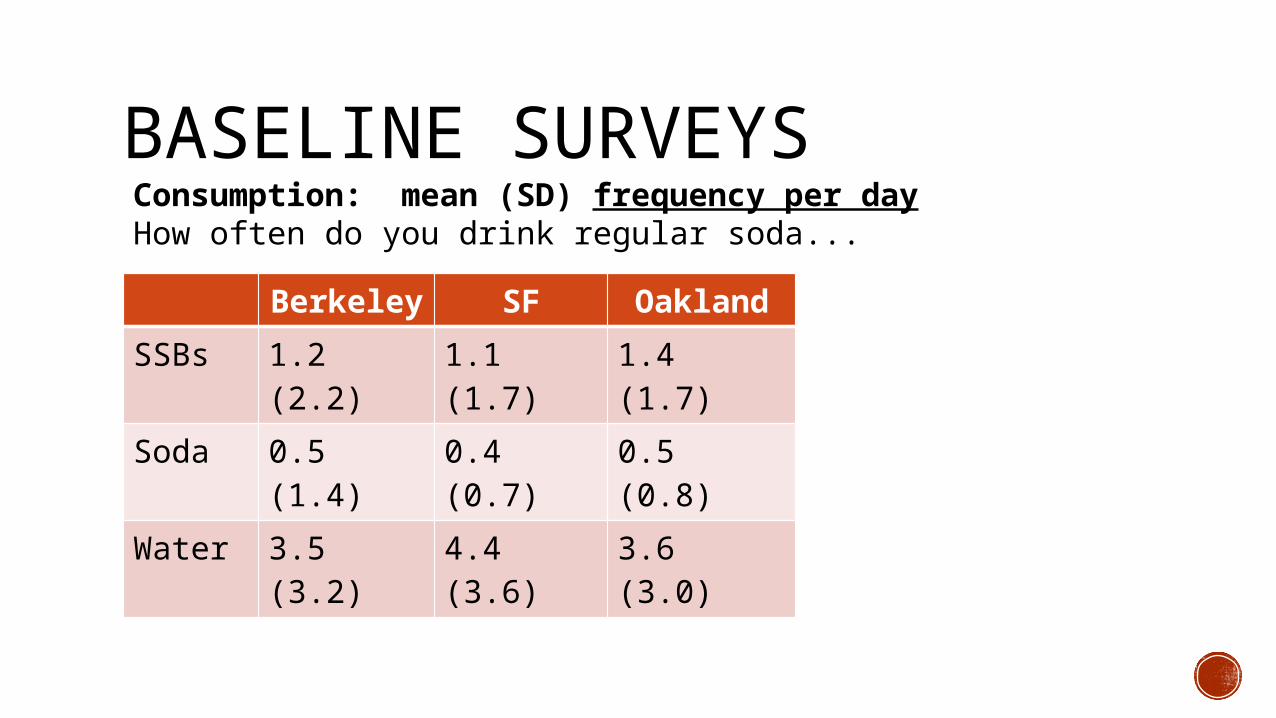
BASELINE SURVEYS
Berkeley
SF Oakland
SSBs 1.2 (2.2) 1.1 (1.7) 1.4 (1.7)
Soda 0.5 (1.4) 0.4 (0.7) 0.5 (0.8)
Water 3.5 (3.2) 4.4 (3.6) 3.6 (3.0)
Consumption: mean (SD) frequency per dayHow often do you drink regular soda...
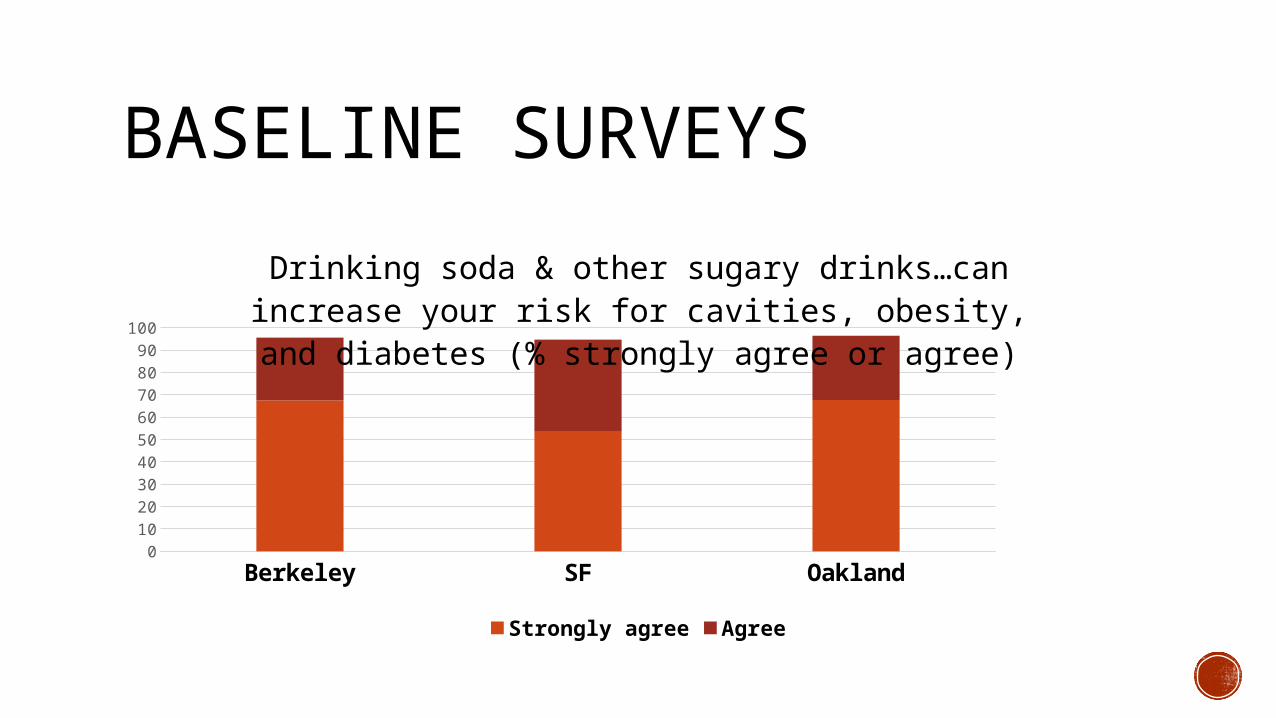
BASELINE SURVEYS
Berkeley SF Oakland0
102030405060708090
100
Drinking soda & other sugary drinks…can increase your risk for cavities, obesity, and diabetes (% strongly agree or agree)
Strongly agree Agree

BASELINE SURVEYS
020406080
100
How likely are you to support…(% responding likely or very likely)
Berkeley SF Oakland

DISCUSSIONLay press (e.g., on Pass-through and
Distributor complaints
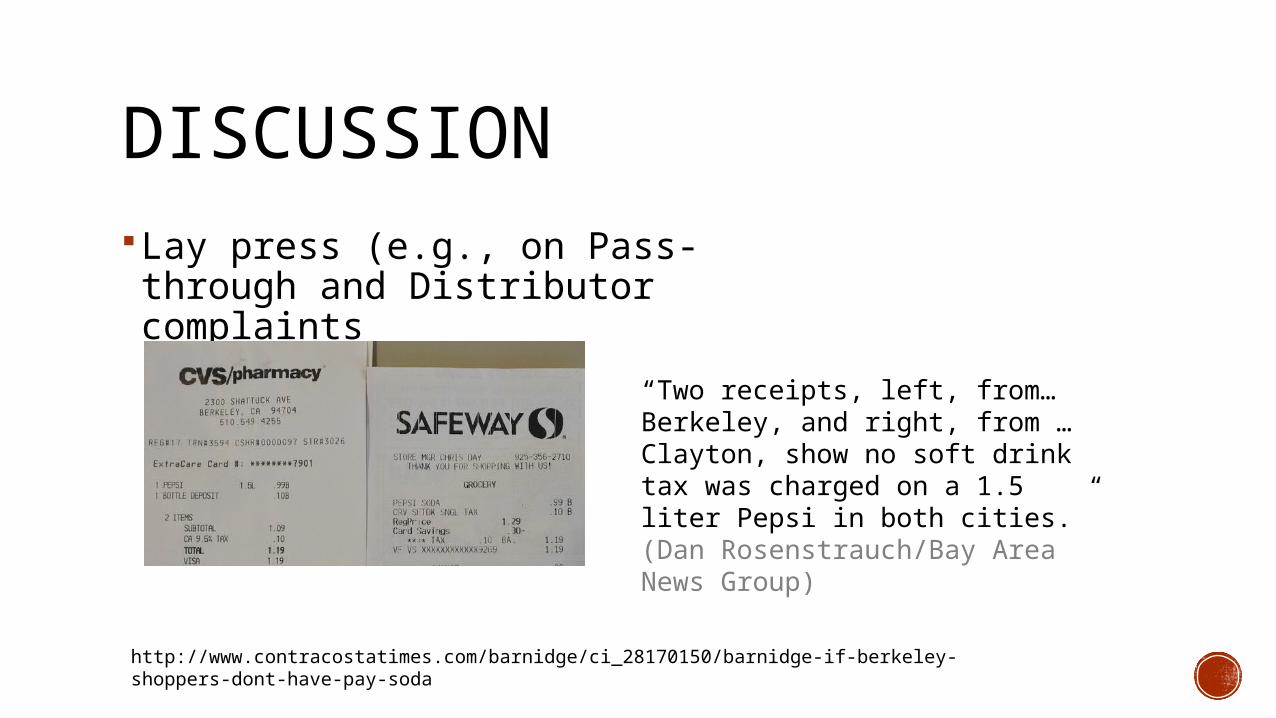
DISCUSSIONLay press (e.g., on Pass-through and
Distributor complaints
“Two receipts, left, from…Berkeley, and right, from …Clayton, show no soft drink tax was charged on a 1.5 liter Pepsi in both cities.” (Dan Rosenstrauch/Bay Area News Group)
http://www.contracostatimes.com/barnidge/ci_28170150/barnidge-if-berkeley-shoppers-dont-have-pay-soda
DISCUSSIONContinuing Evaluation: How revenues are used
DISCUSSIONContinuing Evaluation: How revenues are usedRoad map for scaling/possible lessons (to be) learned
Grass roots Coalition before launching Anticipating reaction of industry Branded as Berkeley (us) vs. Big Soda Strategy: Earmarking vs. general tax + panel of experts Simplifying impact on business owners

Contact: Jen Falbe, ScD, MPH | [email protected]