jeffrey mitchell, phd director - new mexico bankers ... bankers assn 040617.pdf · new mexico’s...
TRANSCRIPT
New Mexico’s Economy:Current Situation and Outlook
New Mexico Bankers Association Lenders ConferenceApril 2017
Jeffrey Mitchell, PhD Director
US Review & Outlook

Review: National Economy
o Annual GDP growth: 2014 (2.4%); 2015 (2.6%); 2016 (1.6%).
o Last two quarters of GDP data mixed: strong 2016Q3 (3.5% SAAR) weaker 2016Q4 (2.1% SAAR). End‐year weakness mainly due to net exports.
o Despite weak job report today (98,000 jobs), job growth has been a bright spot; unemployment rate drops to 4.5%, lowest since 2007.
o Tightening labor market adding some pressure to wages, up 2.7%.
o ISM manufacturing index and non‐manufacturing indices, and Consumer Confidence Index (U. of Mich.) remain very strong
o S&P 500 up nearly 15% over past year (10% since November election), though off over the past month.
o WTI price sitting around $52/barrel, up over the past few days.
US Nonfarm Employment and Unemployment Rate, Monthly SA
US Employment Situation
0.0
2.0
4.0
6.0
8.0
10.0
12.0
120,000
125,000
130,000
135,000
140,000
145,000
150,000
01 02 03 04 05 06 07 08 09 10 11 12 13 14 15 16 17
Total Nonfarm Employment (Left Axis) Unemployment Rate (Right Axis)
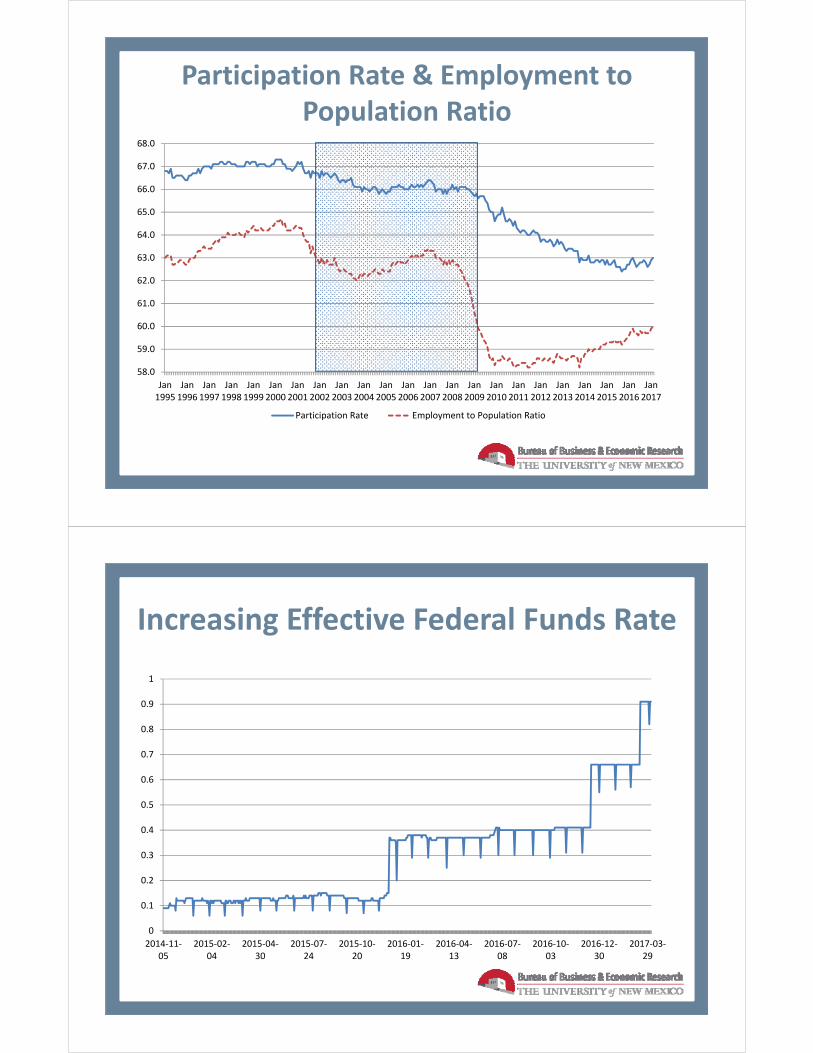
Participation Rate & Employment to Population Ratio
58.0
59.0
60.0
61.0
62.0
63.0
64.0
65.0
66.0
67.0
68.0
Jan1995
Jan1996
Jan1997
Jan1998
Jan1999
Jan2000
Jan2001
Jan2002
Jan2003
Jan2004
Jan2005
Jan2006
Jan2007
Jan2008
Jan2009
Jan2010
Jan2011
Jan2012
Jan2013
Jan2014
Jan2015
Jan2016
Jan2017
Participation Rate Employment to Population Ratio
Increasing Effective Federal Funds Rate
0
0.1
0.2
0.3
0.4
0.5
0.6
0.7
0.8
0.9
1
2014‐11‐05
2015‐02‐04
2015‐04‐30
2015‐07‐24
2015‐10‐20
2016‐01‐19
2016‐04‐13
2016‐07‐08
2016‐10‐03
2016‐12‐30
2017‐03‐29
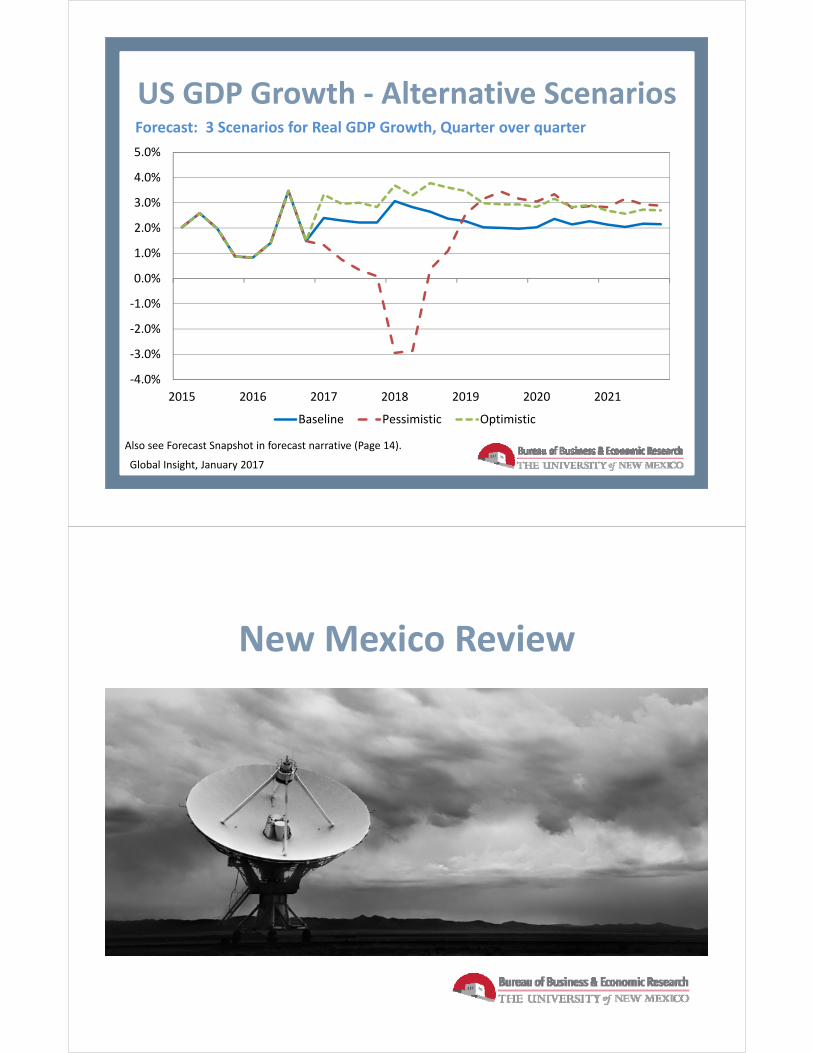
Forecast: 3 Scenarios for Real GDP Growth, Quarter over quarter
Global Insight, January 2017
Also see Forecast Snapshot in forecast narrative (Page 14).
US GDP Growth ‐ Alternative Scenarios
‐4.0%
‐3.0%
‐2.0%
‐1.0%
0.0%
1.0%
2.0%
3.0%
4.0%
5.0%
2015 2016 2017 2018 2019 2020 2021
Baseline Pessimistic Optimistic
New Mexico Review

US and New Mexico Employment Growth, 2008 ‐ Feb. 2017
46,400 jobs lost
37,000 jobs created
‐50
‐40
‐30
‐20
‐10
0
10
20
86
88
90
92
94
96
98
100
102
104
106
108
2008 2009 2010 2011 2012 2013 2014 2015 2016 2017
Thousands of Jobs
2007=100
New Mexico job creation (year over year) ‐‐ Right
New Mexico
US
New Mexico Economic Current Situationo Weak economy impacted by decline in oil prices, but we have likely
reached the bottom.
o State gained fewer than 3,000 jobs (0.4%) in 2016. Deep cuts in mining, including oil & gas (‐5,900 jobs, ‐23%) more than offset gains in healthcare (5,600 jobs, 4.2%).
o Preliminary employment data for 2017 suggest modest improvement (5,500 new jobs, 0.7%), as cuts to mining lessen. Now cuts to state government jobs drag overall growth.
o Stronger housing sales are yet to drive up residential construction.
o Labor force has begun to expand very slowly, but with few new jobs, unemployment rate is up to 6.8% ‐‐ highest in the nation.
o Failure to repeal Obamacare was a reprieve to New Mexico’s economy as healthcare has been the state’s principal driver.
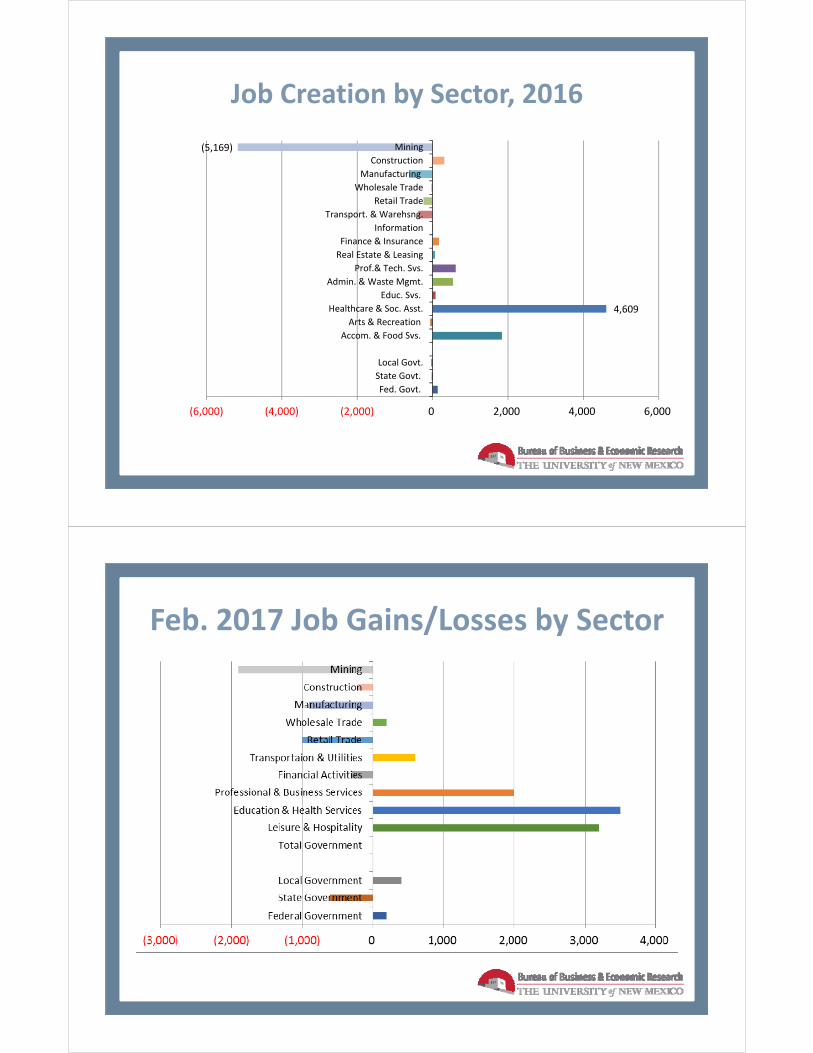
Job Creation by Sector, 2016
4,609
(5,169)
(6,000) (4,000) (2,000) 0 2,000 4,000 6,000
Fed. Govt.
State Govt.
Local Govt.
Accom. & Food Svs.
Arts & Recreation
Healthcare & Soc. Asst.
Educ. Svs.
Admin. & Waste Mgmt.
Prof.& Tech. Svs.
Real Estate & Leasing
Finance & Insurance
Information
Transport. & Warehsng.
Retail Trade
Wholesale Trade
Manufacturing
Construction
Mining
Feb. 2017 Job Gains/Losses by Sector

NM Employment Growth
‐1.50
‐1.00
‐0.50
0.00
0.50
1.00
1.50
Total Nonfarm Total Private Total Government
General Fund Revenues Accruals by Source: FY17 vs. FY16 (through January)

Residential Sales and Building Permits
Job Gains/Losses by Openings & Expansions, Closings & Contractions

New Mexico Economic Outlook: 2017‐2022
o The State has reached the bottom of the oil‐bust, but cuts to state and local government will continue to hold down job growth.
o Recent data suggests forecast a bit stronger economy than in January; preservation of Obamacare removes some of the risk.
o For 2017: 6,200 new jobs (0.8%), with most gains in Albuquerque and Las Cruces.
o 2018 – 2020: 9,700 jobs/year (1.2%). 35% of new jobs in health.
o Stronger recovery will depend on stability in oil & gas markets, resolutions of State financial imbalances, and improved residential construction markets.
o Downside risks to forecast are severe.
Forecast : Employment Growth
‐0.2%
0.0%
0.2%
0.4%
0.6%
0.8%
1.0%
1.2%
1.4%
1.6%
1.8%
2012Q3 2013Q3 2014Q3 2015Q3 2016Q3 2017Q3 2018Q3 2019Q3 2020Q3 2021Q3
January 2017
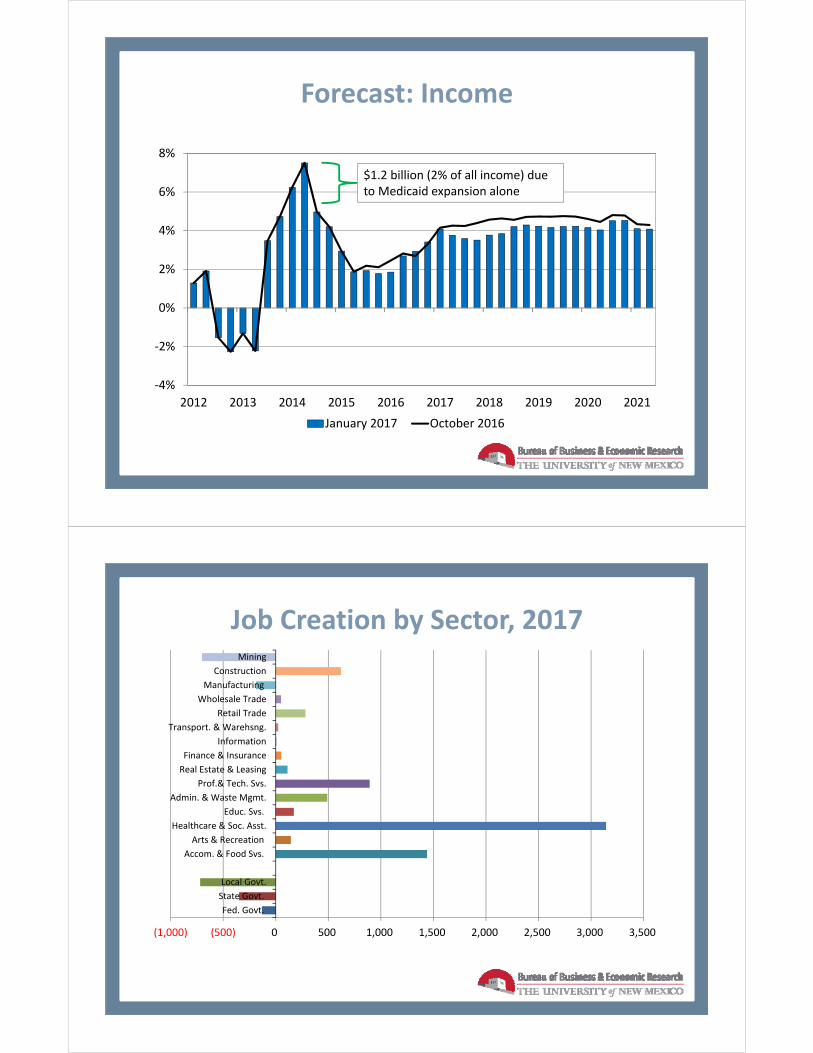
Forecast: Income
‐4%
‐2%
0%
2%
4%
6%
8%
2012 2013 2014 2015 2016 2017 2018 2019 2020 2021
January 2017 October 2016
$1.2 billion (2% of all income) due to Medicaid expansion alone
Job Creation by Sector, 2017
(1,000) (500) 0 500 1,000 1,500 2,000 2,500 3,000 3,500
Fed. Govt.
State Govt.
Local Govt.
Accom. & Food Svs.
Arts & Recreation
Healthcare & Soc. Asst.
Educ. Svs.
Admin. & Waste Mgmt.
Prof.& Tech. Svs.
Real Estate & Leasing
Finance & Insurance
Information
Transport. & Warehsng.
Retail Trade
Wholesale Trade
Manufacturing
Construction
Mining
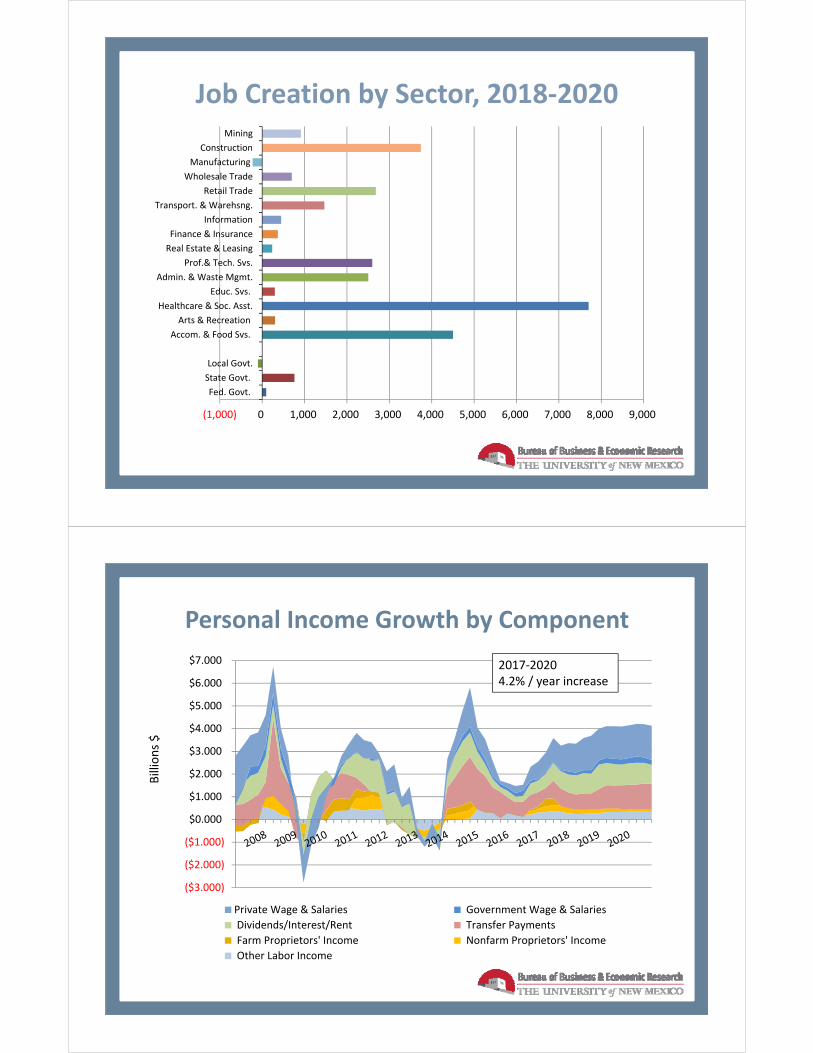
Job Creation by Sector, 2018‐2020
(1,000) 0 1,000 2,000 3,000 4,000 5,000 6,000 7,000 8,000 9,000
Fed. Govt.
State Govt.
Local Govt.
Accom. & Food Svs.
Arts & Recreation
Healthcare & Soc. Asst.
Educ. Svs.
Admin. & Waste Mgmt.
Prof.& Tech. Svs.
Real Estate & Leasing
Finance & Insurance
Information
Transport. & Warehsng.
Retail Trade
Wholesale Trade
Manufacturing
Construction
Mining
Personal Income Growth by Component
($3.000)
($2.000)
($1.000)
$0.000
$1.000
$2.000
$3.000
$4.000
$5.000
$6.000
$7.000
Billions $
Private Wage & Salaries Government Wage & Salaries
Dividends/Interest/Rent Transfer Payments
Farm Proprietors' Income Nonfarm Proprietors' Income
Other Labor Income
2017‐20204.2% / year increase

Job Creation by Region, Forecast
‐10.000
‐5.000
0.000
5.000
10.000
15.000
Albuquerque Farmington Las Cruces Santa Fe Non‐metro
New Mexico Employment Forecast, Alternative Scenarios
‐0.5%
0.0%
0.5%
1.0%
1.5%
2.0%
2015 2016 2017 2018 2019 2020 2021
Baseline Scenario Pessimistic Scenario Optimistic Scenario

New Mexico Income Forecast, Alternative Scenarios
0%
1%
2%
3%
4%
5%
6%
7%
2015 2016 2017 2018 2019 2020 2021
Baseline Scenario Pessimistic Scenario Optimistic Scenario
Key Indicators for New Mexico Financial Institutions by County, 2016Q3
Source: Federal Financial Institutions Examination Council: Uniform Bank Performance Report
Net Loans & Leases Interest Income/Loans & LeasesNet Income/Equity

Return on Assets for Commercial Banks and Savings Associations, 2006‐2016
Dallas Fed, Vol 5, Issue 4:New Mexico Banking: One State, Two Experiences
Noncurrent Loans for Commercial Banks and Savings Associations, 2006‐2016
Dallas Fed, Vol 5, Issue 4:New Mexico Banking: One State, Two Experiences

Noncurrent Loans and Leases, 2016Q3
Source: Federal Financial Institutions Examination Council: Uniform Bank Performance Report
New Mexico’s Economy:Current Situation and Outlook
New Mexico Bankers Association Lenders ConferenceApril 2017
Jeffrey Mitchell, PhD Director