jefferies winter consumer summit beaver creek...
TRANSCRIPT
Jefferies Winter Consumer Summit Beaver Creek
January 26, 2015
Forward Looking Statements
Certain matters discussed in this presentation constitute forward-looking statements within the meaning of the federal securities laws. Generally, the use of words such as “expect,” “estimate,” “believe,” “anticipate,” “will,” “forecast,” “plan,” “project,” or similar words identify forward-looking statements that we intend to be included within the safe harbor protections provided by the federal securities laws. Such statements may relate to projections or guidance concerning business performance, revenue, earnings, contingent liabilities, resolution of litigation, commodity costs, profit margins, unit growth, capital expenditures, and other financial and operational measures. Such statements are not guarantees of future performance and involve certain risks, uncertainties and assumptions, which are difficult to predict and many of which are beyond our control. Therefore, actual outcomes and results may differ materially from those matters expressed or implied in such forward-looking statements. The risks, uncertainties and assumptions that are involved in our forward-looking statements include, but are not limited to: aggressive changes in pricing or other marketing or promotional strategies by competitors, which may adversely affect sales, and new product and concept developments by food industry competitors; changes in consumer preferences or consumer buying habits including the impact of adverse economic conditions; the impact that product recalls, food quality or safety issues, incidences of foodborne illness, food contamination and other general public health concerns, including potential epidemics, could have system-wide on our restaurants or our results; failure to maintain our brand strength and quality reputation and risks related to our better ingredients marketing strategy; the ability of the company and its franchisees to meet planned growth targets and operate new and existing restaurants profitably; increases in or sustained high costs of food ingredients or other restaurant costs, which could include increased employee compensation, benefits, insurance, tax rates, regulatory compliance and similar costs, including increased costs resulting from federal health care legislation; increases in insurance claims and related costs for programs funded by the company up to certain retention limits, including medical, owned and non-owned automobiles, workers’ compensation, general liability and property; disruption of our supply chain or our commissary operations which could be caused by our sole source of supply of cheese or limited source of suppliers for other key ingredients or more generally due to weather, drought, disease, geopolitical or other disruptions beyond our control; increased risks associated with our international operations, including economic and political conditions, instability in our international markets, fluctuations in currency exchange rates, and difficulty in meeting planned sales targets and new store growth, including expansion into emerging or underpenetrated markets where we have a company-owned presence; the impact of increases in interest rates on the company or our franchisees; the credit performance of our franchise loan programs; the impact of the resolution of current or future claims and litigation; current or proposed legislation impacting our business; failure to effectively execute succession planning, and our reliance on the multiple roles of our Founder, Chairman, and Chief Executive Officer who also serves as our brand spokesperson; and disruption of critical business or information technology systems, and risks associated with systems failures and data privacy and security breaches, including theft of company, employee and customer information. These and other risk factors are discussed in detail in “Part 1. Item 1A – Risk Factors” of the Annual Report on Form 10-K for the fiscal year ended December 28, 2014. We undertake no obligation to update publicly any forward-looking statements, whether as a result of future events, new information or otherwise, except as required by law. This presentation also includes non-GAAP financial measures to describe our performance, which we believe are useful in analyzing results and facilitating comparison with prior periods. Additional information concerning non-GAAP measures is available in our Securities & Exchange filings on our website at www.papajohns.com under the heading “Investor Relations.”

Recognized Quality Leader in Pizza Category
Experienced Management Team led by Founder
Leveraging Technology Advantage and Rewards Platform
International Business should Drive Sustainable Growth
Continued Opportunity to Grow Domestic Business
Franchise Royalty and QCC Profit Streams reduce Volatility
Strong Cash Flow with Conservative Balance Sheet – Consistent Return of Free Cash Flow to Shareholders
Better Ingredients. Better Pizza. Better Investment.

• 11 Consecutive Years Positive or Flat North America Comps – Digital Sales Mix Growth
– Partnerships
– LTO Strategy
– Focus on Driving Top Line
– Pizza Quality and Service Metrics at Historic Highs
– Balanced Mix of National and Local Marketing
• 6 Consecutive Years Positive International Comps – Gaining market share and penetration
– Largely Local Marketing Driven
• Nearly 1,200 Net Units Opened Globally over Past 5 Years
Consistent Growth
Papa John’s Owns the Quality Position
• Rated #1 in customer experience for a pizza brand by the 2015 Temkin Experience Rating survey
2nd behind only Chick-fil-A among fast food chains
Ranked 8 out of 293 companies across 20 industries in a survey of 10,000 U.S. consumers
• Rated #1 in customer satisfaction among limited-service restaurants in the 2015 American Customer Satisfaction Index (ACSI) for 14th time in past 16 years
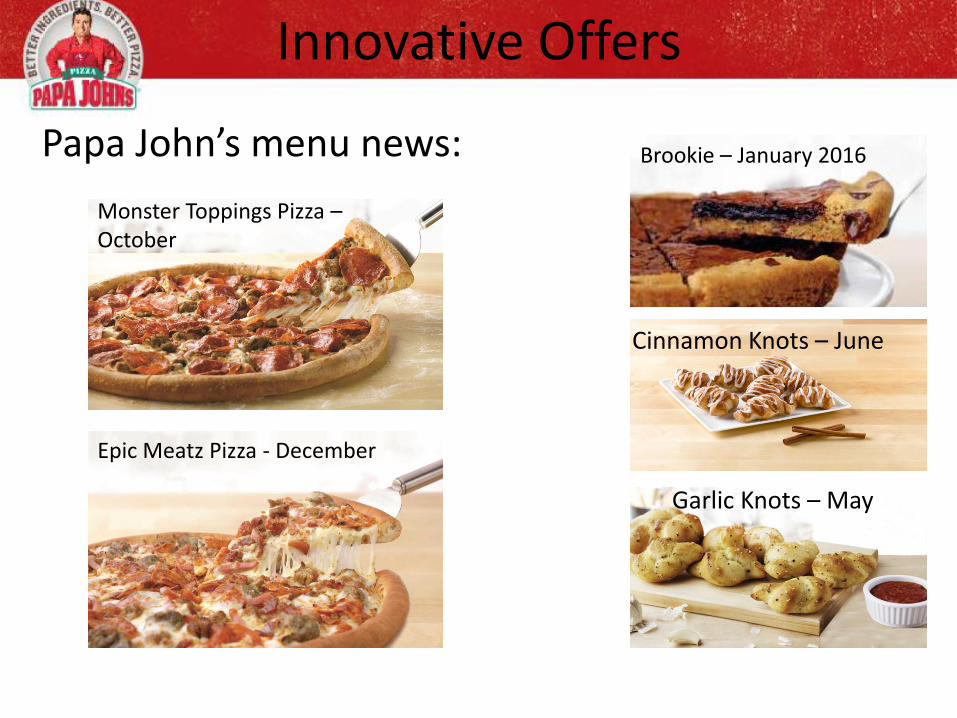
Innovative Offers
Cinnamon Knots – June
Garlic Knots – May
Papa John’s menu news: Brookie – January 2016
Monster Toppings Pizza – October
Epic Meatz Pizza - December
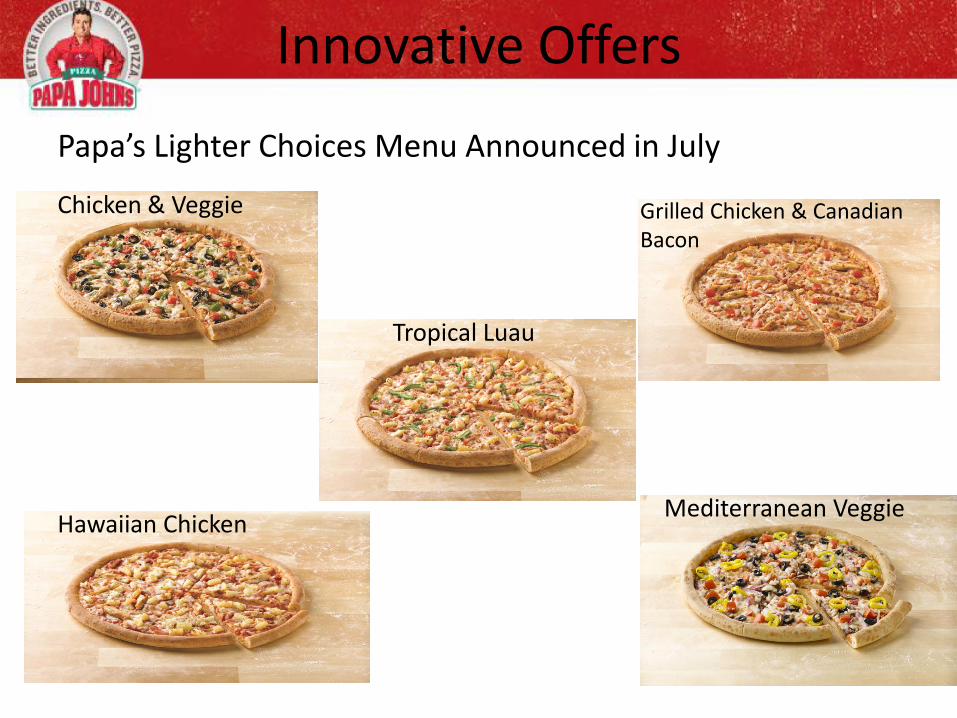
Innovative Offers
Papa’s Lighter Choices Menu Announced in July
Chicken & Veggie Grilled Chicken & Canadian Bacon
Hawaiian Chicken Mediterranean Veggie
Tropical Luau

Technology Foundation
Highest digital sales mix in category – first brand over 50% of sales
Mobile represents over 50% of total digital sales
Ongoing investments across all digital channels, including recently released iOS app upgrade and rollout of RWD website
Technology strategy and investments centered around improving the customer experience
Highest rating in The Search Agency Report “The Mobile Experience Scorecard - Restaurants & Catering”
Papa Rewards increasing loyalty in a value-driven category
Papa Rewards surpasses other major brands as favorite dining/QSR loyalty program in Bond Brand Loyalty Report
Ranked #1

International Runway
• Significant Growth Opportunity for Many Years to Come
• Infrastructure largely in place, strong flow through on royalties from incremental franchise units
– Expected growth of at least 150-200 net units per year for next several years; 970 franchise units in pipeline as of September 27, 2015(current countries only)
– Signed a 38 store development agreement in Northeast France in December 2015
– Significant growth opportunities both within and outside of current footprint; major competitors have 6,000+ units each
• International to be largely or fully franchised over long term
• Pursuing refranchising of Company-owned China market in 2016
• Steady Overall Growth in International Segment Income
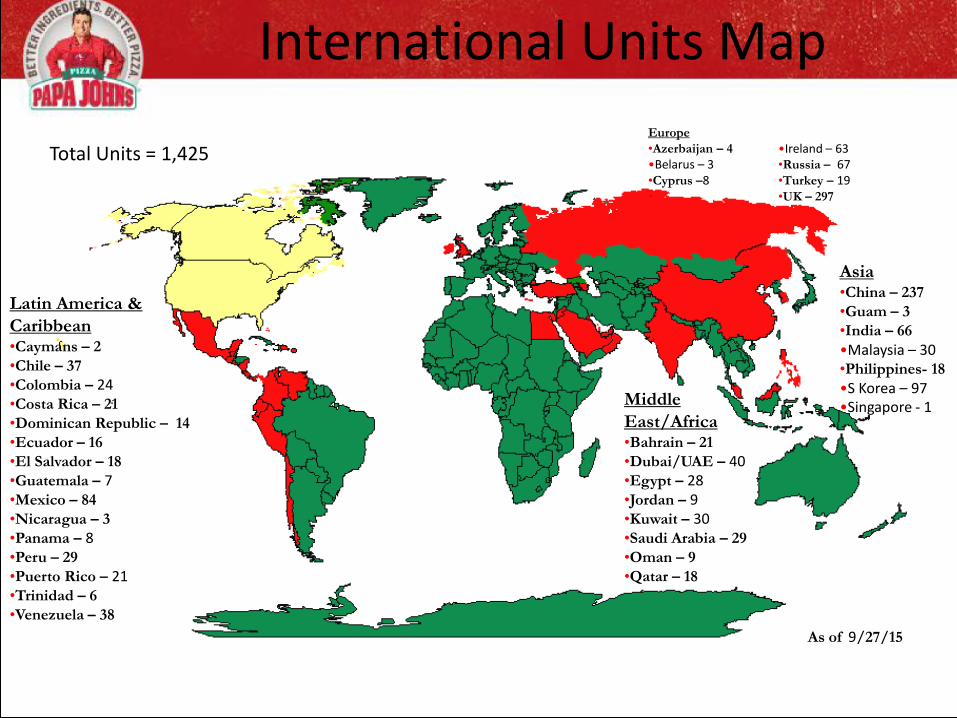
International Units Map
As of 9/27/15
Latin America &
Caribbean •Caymans – 2
•Chile – 37
•Colombia – 24
•Costa Rica – 21
•Dominican Republic – 14
•Ecuador – 16
•El Salvador – 18
•Guatemala – 7
•Mexico – 84
•Nicaragua – 3
•Panama – 8
•Peru – 29
•Puerto Rico – 21
•Trinidad – 6
•Venezuela – 38
Asia •China – 237
•Guam – 3
•India – 66
•Malaysia – 30 •Philippines- 18
•S Korea – 97 •Singapore - 1 Middle
East/Africa •Bahrain – 21
•Dubai/UAE – 40
•Egypt – 28
•Jordan – 9
•Kuwait – 30
•Saudi Arabia – 29
•Oman – 9
•Qatar – 18
Europe
•Azerbaijan – 4
•Belarus – 3 •Cyprus –8
•
•Ireland – 63 •Russia – 67
•Turkey – 19
•UK – 297
Total Units = 1,425

2016 Domestic Development Incentive Plan
Development incentives for domestic openings include:
Zero Franchise Fee
Royalty Reduction over Several Years
Set of Two Middleby Ovens
Credit toward First Food Order
Total value of over $60,000, plus royalty relief; Can open a restaurant for under $300,000
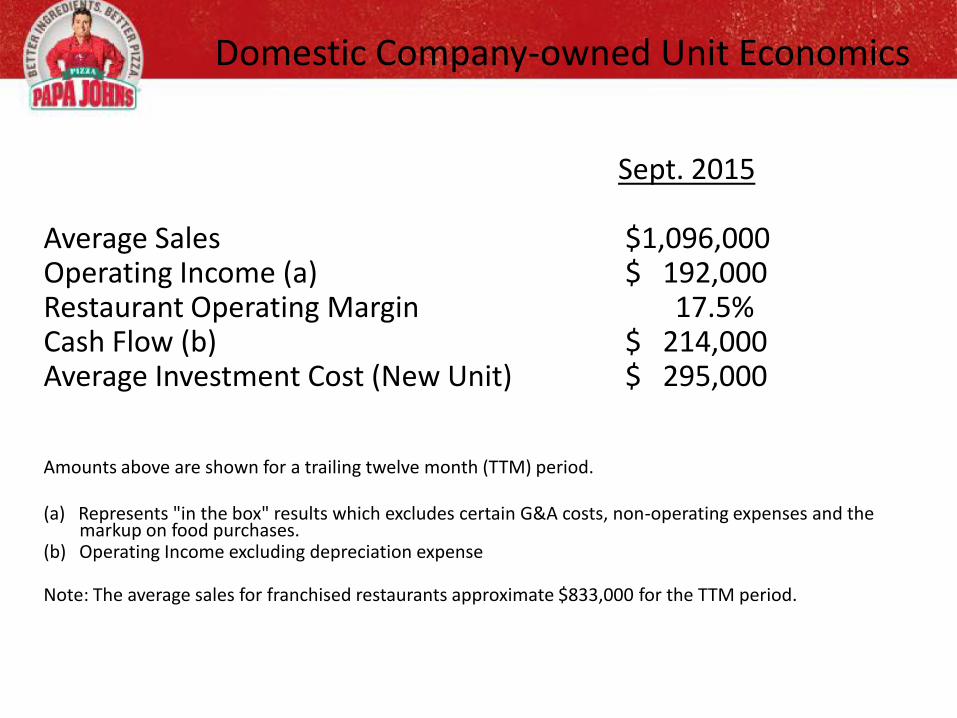
Domestic Company-owned Unit Economics
Sept. 2015 Average Sales $1,096,000 Operating Income (a) $ 192,000 Restaurant Operating Margin 17.5% Cash Flow (b) $ 214,000 Average Investment Cost (New Unit) $ 295,000 Amounts above are shown for a trailing twelve month (TTM) period. (a) Represents "in the box" results which excludes certain G&A costs, non-operating expenses and the
markup on food purchases. (b) Operating Income excluding depreciation expense Note: The average sales for franchised restaurants approximate $833,000 for the TTM period.
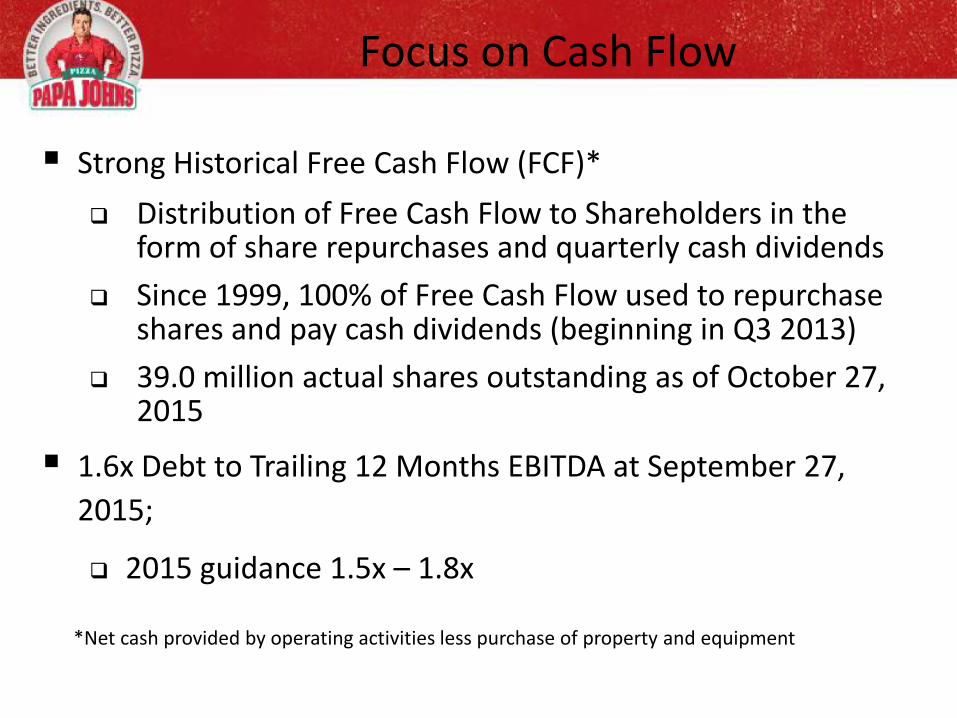
Focus on Cash Flow
Strong Historical Free Cash Flow (FCF)*
Distribution of Free Cash Flow to Shareholders in the form of share repurchases and quarterly cash dividends
Since 1999, 100% of Free Cash Flow used to repurchase shares and pay cash dividends (beginning in Q3 2013)
39.0 million actual shares outstanding as of October 27, 2015
1.6x Debt to Trailing 12 Months EBITDA at September 27,
2015;
2015 guidance 1.5x – 1.8x
*Net cash provided by operating activities less purchase of property and equipment

EPS Growth
• Steady EPS growth driven by high single/low double digit operating income growth and mid single digit growth from share repurchases
• International comp sales and unit growth to become biggest driver of EPS in the long term

FINANCIAL HIGHLIGHTS
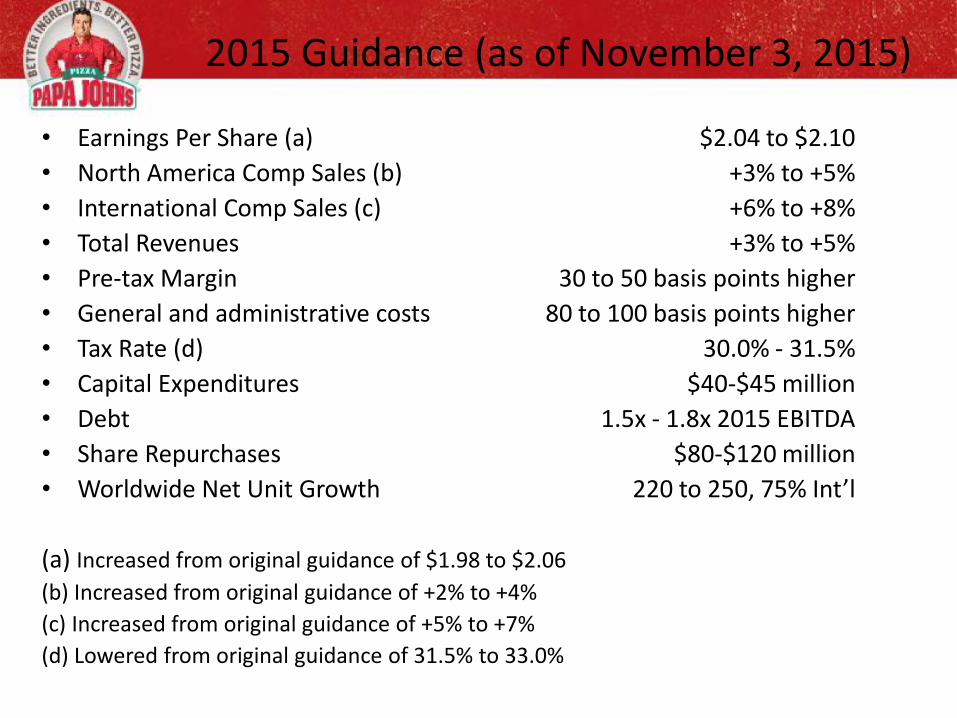
2015 Guidance (as of November 3, 2015)
• Earnings Per Share (a) $2.04 to $2.10
• North America Comp Sales (b) +3% to +5%
• International Comp Sales (c) +6% to +8%
• Total Revenues +3% to +5%
• Pre-tax Margin 30 to 50 basis points higher
• General and administrative costs 80 to 100 basis points higher
• Tax Rate (d) 30.0% - 31.5%
• Capital Expenditures $40-$45 million
• Debt 1.5x - 1.8x 2015 EBITDA
• Share Repurchases $80-$120 million
• Worldwide Net Unit Growth 220 to 250, 75% Int’l
(a) Increased from original guidance of $1.98 to $2.06
(b) Increased from original guidance of +2% to +4%
(c) Increased from original guidance of +5% to +7%
(d) Lowered from original guidance of 31.5% to 33.0%
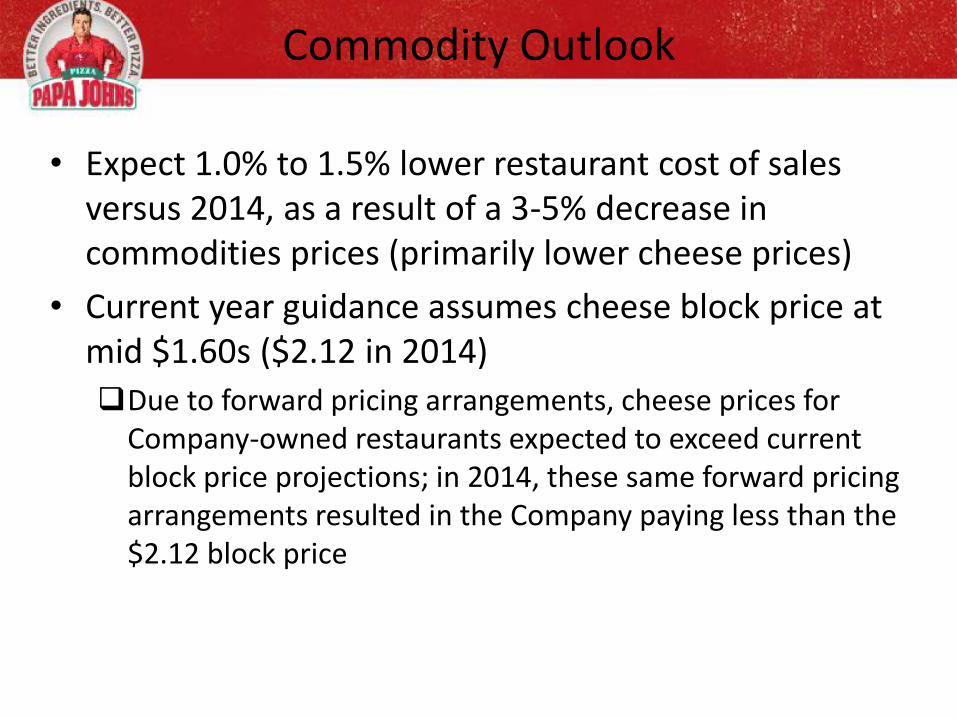
Commodity Outlook
• Expect 1.0% to 1.5% lower restaurant cost of sales versus 2014, as a result of a 3-5% decrease in commodities prices (primarily lower cheese prices)
• Current year guidance assumes cheese block price at mid $1.60s ($2.12 in 2014)
Due to forward pricing arrangements, cheese prices for Company-owned restaurants expected to exceed current block price projections; in 2014, these same forward pricing arrangements resulted in the Company paying less than the $2.12 block price
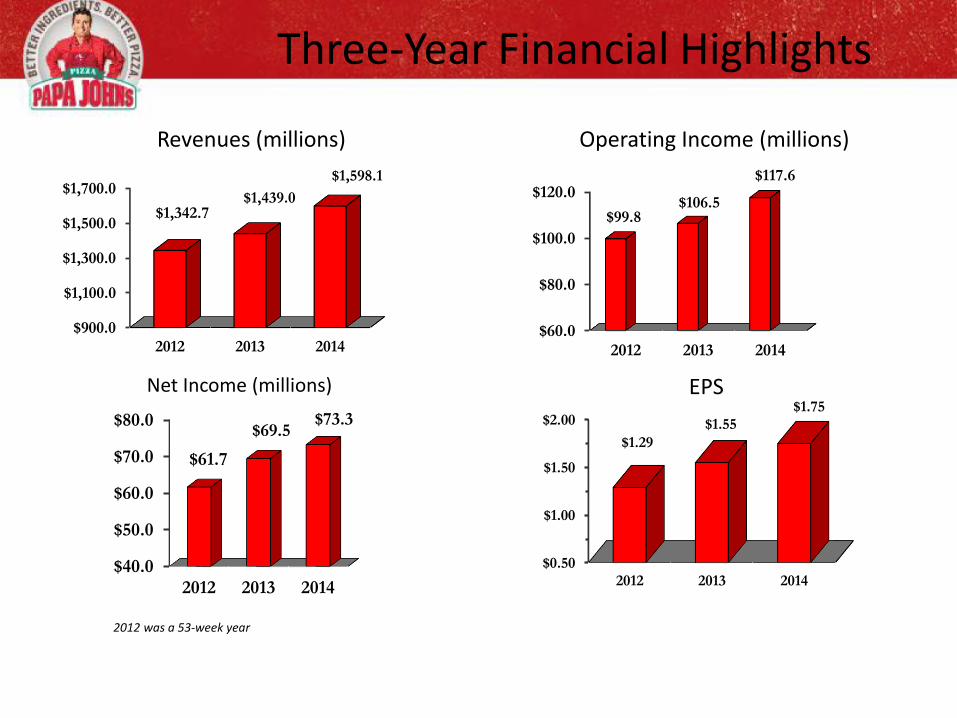
Three-Year Financial Highlights
$900.0
$1,100.0
$1,300.0
$1,500.0
$1,700.0
2012 2013 2014
$1,342.7 $1,439.0
$1,598.1
$60.0
$80.0
$100.0
$120.0
2012 2013 2014
$99.8 $106.5
$117.6
$40.0
$50.0
$60.0
$70.0
$80.0
2012 2013 2014
$61.7
$69.5 $73.3
Revenues (millions) Operating Income (millions)
Net Income (millions) EPS
$0.50
$1.00
$1.50
$2.00
2012 2013 2014
$1.29
$1.55 $1.75
2012 was a 53-week year

Worldwide Unit Growth
0
50
100
150
200
250
300
2010 2011 2012 2013 2014
103 124 143
82 54
74
113
137
183
181
North America International
177
235
280
265 237
Projected to open 220 to 250 net new units worldwide in 2015 (75% international and 25% in North America)