j.b. hunt transport services, inc. · what’s your next move?™ j.b. hunt transport services,...
TRANSCRIPT

®
What’s your next move?™
J.B. Hunt Transport Services, Inc.
2Q 2009 Results

®What’s your next move?™
Disclosure
Today’s presentation and discussion will contain forward-looking statements within the meaning of the
Private Securities Litigation Reform Act of 1995. Words such as “expects,” “anticipates,” “intends,”
“estimates,” or similar expressions are intended to identify these forward-looking statements. These
statements are based on J.B. Hunt’s current plans and expectations and involve risks and uncertainties
that could cause future activities and results of operations to be materially different from those set forth in
the forward-looking statements. For further information, please refer to J.B. Hunt’s reports and filings with
the Securities and Exchange Commission.
2

®What’s your next move?™
2Q 2009 Highlights
Seasonal improvement in volumes but broad-based cyclical weakness
JBI and JBT hurt by pricing pressures and network inefficiencies
Continued investments in JBI to solidify long-term positioning
Down-sizing of JBT to market conditions and customer needs likely nearing
completion
DCS sold more new business than any prior periods setting the stage for
attractive growth in Final-mile-delivery Channel
DCS bearing short-term costs to implement new or expanded Final-mile-
delivery contracts
ICS headcount growth to position for new opportunities
$10.3 million pretax charge to write down the value of certain tractors held
for sale; DCS mix change and JBI dray fleet upgrade
Well positioned for eventual recovery
3

®What’s your next move?™
Distinct Complementary Businesses
Intermodal (JBI) Largest, 100% 53’ high-cube container fleet
Largest drayage fleet in North America
Priority loading and unloading at major rail terminals
Dedicated (DCS) Fleet creation, conversion and augmentation
Design and implementation of value-driven supply
chain solutions
On-site management
Integrated Capacity Solutions (ICS) Non-asset based offering of dry van, flatbed,
refrigerated, expedited and LTL services
40- and 20-foot box domestic and international
containers and international intermodal services
Services to all 50 States, Canada and Mexico
Truckload (JBT) One of the largest capacity networks in North
America
Instant tracking via the Internet
GPS trailer tracking
4

®What’s your next move?™
2Q 2009 Results
• 2Q 2009 Revenue: $770 million; down 21%
• 2Q 2009 Revenue before FSC: $703 million; down 8%
• 2Q 2009 Operating Income: $47 million; down 50%*
• 2Q 2009 EPS: $0.19*, including $0.05/share charge
• Outstanding debt of $648 million vs. $825 million at 2Q08
• Segment Performance• Intermodal (JBI)
• Revenue: $425 million; down 14%
• Operating Income: $38.8 million; down 41%*
• Dedicated (DCS)
• Revenue: $174 million; down 28%
• Operating Income: $8.1 million; down 64%*
• Integrated Capacity Solutions (ICS)
• Revenue: $68 million; up 28%
• Operating Income: $4.2 million; up 85%
• Truck (JBT)
• Revenue: $108 million; down 44%
• Operating Income: ($4.0 million) vs. $3.4 million
• * 2Q 2009 includes $10.3 million pretax charge ($6.6 million for JBI and $3.7 million for DCS) to write down the value of certain tractors held for sale.
5

®What’s your next move?™
Results
6

®What’s your next move?™
Cash Generation and CAPEX
Reductions in JBT’s fleet reduces our
CAPEX needs, all else being equal
Upgrading JBI dray fleet and container and
chassis fleet for better long-term positioning
Equipment mix changes with DCS growth in
Delivery business, and run-off of Capacity
business
* 2006 CAPEX includes trailers previously under operating lease.
7

®What’s your next move?™
JBI and ICS: Load Growth Despite Weak Freight Market
8

®What’s your next move?™
Our Strategy; Before, During, After the Downturn
Use our unique network to bring our customers the low-cost, service-
sensitive advantages of intermodal (JBI)
Utilize our scale, experience, systems and network to drive growth in
services that have defensible characteristics (JBI, DCS Final Mile Delivery and
Replenishment, ICS)
Further leverage the JB Hunt brand, network and technology to penetrate
new markets (DCS, ICS)
Reduce asset-based exposure to areas with low entry barriers, high capital
requirements and undifferentiated service (JBT, DCS Capacity)
Deploy growing free cash flow to further strengthen balance sheet
9

®
What’s your next move?™
J.B. Hunt Transport Services, Inc.
Segment Discussion
®What’s your next move?™
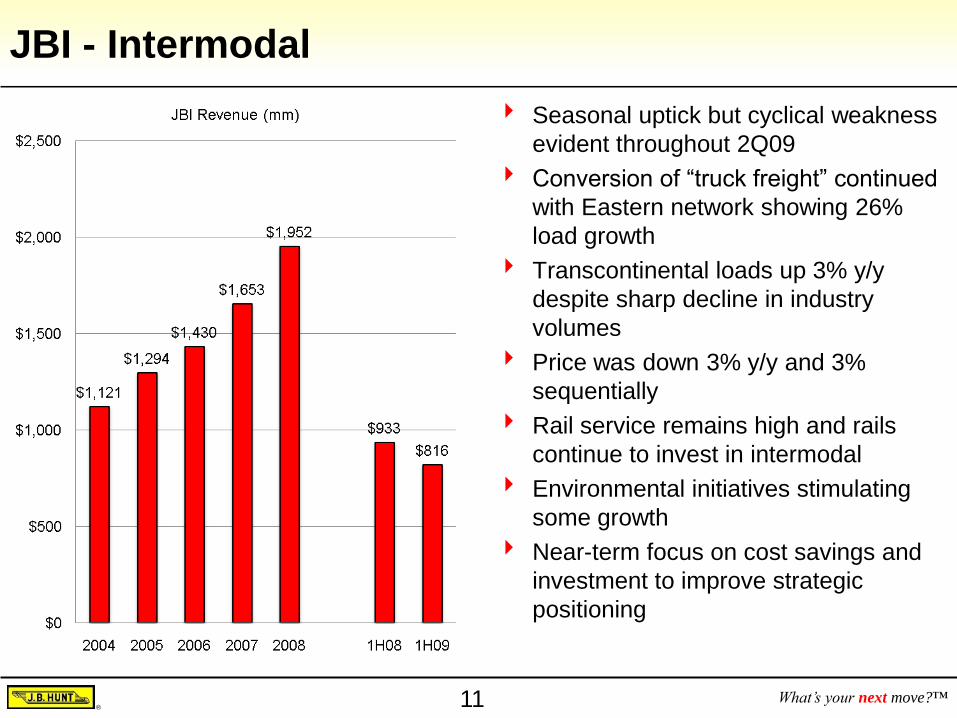
JBI - Intermodal
Seasonal uptick but cyclical weakness
evident throughout 2Q09
Conversion of “truck freight” continued
with Eastern network showing 26%
load growth
Transcontinental loads up 3% y/y
despite sharp decline in industry
volumes
Price was down 3% y/y and 3%
sequentially
Rail service remains high and rails
continue to invest in intermodal
Environmental initiatives stimulating
some growth
Near-term focus on cost savings and
investment to improve strategic
positioning
11

®What’s your next move?™
JBI Performance
12

®What’s your next move?™
Load Growth Despite Falling Diesel Prices
13

®What’s your next move?™
DCS - Dedicated
Sold more business in 2Q 09 than any
prior periods
Implementation costs on new or
expanded contracts hurting near-term
margins
Contracts typically ensure cost
recovery over life of contract
By final 1H 2010 implementation, 98%
of U.S. population will be within 150
miles of one of our delivery facilities
Worked closely with customers to
adjust service levels during period of
very weak demand
Continued run-off of Capacity channel
business that has traditionally been
more cyclical
14

®What’s your next move?™
DCS Performance
15

®What’s your next move?™
Final Mile Delivery
12 years experience in Final Mile
Channel revenue retention >95%
Targeting 100 Crossdock Service Centers
Currently operating 21
Capacity: > 2 million annual deliveries
Reach: 98% US population within 150 miles
Commercial and Residential
Restaurants, Agriculture, Home, Build-site,
Small business and retail
$110MM current annual revenue
Current customers: Best Buy, Cargill, The
Home Depot, Whirlpool, and Blue Seal
Over $100MM in signed agreements
Currently onboarding
Large & technologically advanced fleet and well-
trained employees
16

®What’s your next move?™
DCS: Traditionally Stable vs. Truckload
17

®What’s your next move?™
DCS Characteristics (Year-End 2008)
18

®What’s your next move?™
ICS – Non-asset Based
ICS stand-alone model showing
success in difficult market vs.
“overflow” model used by most
asset-based carriers
Diversification continued to support
growth and steady volume
increases throughout the quarter
Continued growth in workforce to
complete national coverage and
multi-modal offerings
9% growth in carrier base to
21,500 carriers
19

®What’s your next move?™
ICS Performance
20

®What’s your next move?™
ICS - Hitting Stride
Investment in
people and
systems
“Dividends” from
prior investments
21

®What’s your next move?™
ICS Characteristics
22

®What’s your next move?™
JBT – Truckload
Seasonal improvement in volumes
but cyclical weakness evident
throughout the quarter
Continued fleet rationalization with
20% y/y decrease in tractor count
Rates per loaded mile (excluding
FSC) decreased 8.7% y/y
Rates per loaded mile (excluding
FSC) from consistent shippers
declined 3.0% y/y
Maintenance expenses increased
due to the aging tractor fleet that is
not being replaced
23

®What’s your next move?™
JBT Performance
$0
$500
$1,000
$1,500
$2,000
$2,500
$3,000
$3,500
$4,000
1Q08 1Q09 2Q08 2Q09
Revenue per Tractor per Week
24

®What’s your next move?™
Approaching Optimal Fleet Size
25

®What’s your next move?™
Summary
Competitively differentiated
Unique intermodal network
Distinct advantages in dedicated segments
Network economics and brand strength to
penetrate new markets
Prepared to weather downturn
Strong financial position
Less cyclical business model
Diversification
Complemented by industry dynamics
Shippers need to reduce costs
Shippers demand on-time service
Increasingly complex supply-chains
Positioned for recovery
Leading positions in large and
consolidating markets
Clear value proposition for our customers
Best-in-class systems and technology
Intermodal
Dedicated Contract Services
Truckload
Integrated Capacity Solutions
26

®What’s your next move?™
Balance Sheet
27