jasper schuurman job characteristics, health and satisfaction · jasper schuurman . job...
TRANSCRIPT

Jasper Schuurman Job Characteristics, Health and Satisfaction Can Satisfaction with Social Life Overcome Negative Job Traits?
MSc Thesis 2011-012

Jasper Schuurman, 195367 Erasmus University, Rotterdam
Health Economics, 2011
Job characteristics, health and satisfaction.
Can satisfaction with social life overcome negative job traits?
1 Jasper Schuurman, 195367
Erasmus University, Rotterdam Health Economics, 2011
Table of content 1
1) Introduction 2
2) Theory 8
Defining job characteristics 8
Hackman and Oldham’s job characteristics model 10
Job demand control & support model 13
Vitamin model 19
Job characteristics and health 24
Satisfaction with social life 28
3) Data and Methods 30
Measures 32
Method of analysis 36
4) Results 39
Empirical results 41
Marginal effects 46
Test for linearity 51
Hypotheses testing 54
Discussion of the results 57
5) Conclusion & limitations 62
6) Reference 65
Appendix A: variable job type 69
Appendix B: missing values 70
Appendix C: full ordered logit regression model 71
Appendix D: means of 4 samples used for analyses 73
Appendix E: correlations coefficients of 4 samples used for analyses 78
Appendix F: ordered logit regression of 4 samples used for analyses 82
Appendix G: test for linearity 87
2 Jasper Schuurman, 195367
Erasmus University, Rotterdam Health Economics, 2011
1) Introduction
Changes in the global economy and their consequences for society have long been a fact in
human life. Due to recent trends and developments these changes are becoming increasingly
common. Factors like globalization, deregulation of labor markets and increasing competition
have forced many companies during the last decades to undertake restructuring activities and
change the relationship they have with their employees (Emberland and Rundmo, 2010).
There is growing evidence that current trends in employment conditions may be eroding
levels of job satisfaction. New working practices and rapid technological advances are
changing the nature of many jobs. Employees are regularly being required to work well
beyond their contracted hours, often unwillingly, as organizations struggle to meet tight
deadlines and targets. Work practices are becoming more automated and inflexible, leaving
employees with less and less control over their workload. Many organizations are reducing
their permanent workforce and are converting to a culture of short term contracts or out-
sourcing, thereby increasing feelings of job insecurity (Faragher et al., 2005; Shannon et al.,
2001). Although these events have a reasonable managerial rationale they have contributed to
increased levels of stress among workers. Ill-health and sickness absence due to stressors in
the work environment are therefore a serious and increasing problem in contemporary
working life (Puosette and Hanse, 2002). Considering that restructuring activities will
continue to increase if the current labor market trend continues, it is important to determine
which factors may explain its detrimental effects on health (László et al., 2010).
The detrimental effects of current labor market conditions have not remain unnoticed and
governments in many developed industrial countries have already drafted legislation to make
organizations accept greater responsibility for the impact of their work practices on the health
of their employees. Consequently, an increasing number of employers are developing formal
stress intervention/management policies. Ideally, such policies should be evidence based
(Faragher et al., 2005). The concept of a healthy workplace has garnered increased interest in
the last few years in scientific literature as well (Shannon et al., 2001). Numerous theories
now exist, developed from a wide range of perspectives, postulating a direct link between
organizational/workplace stress and wellbeing. The research database is already enormous
and is still growing at a considerable rate (Faragher et al., 2005).

3 Jasper Schuurman, 195367
Erasmus University, Rotterdam Health Economics, 2011
In the development of theory on work and health, three major trends can be identified, even
though these trends are intertwined. In the early stage, the topic received considerable
attention from the psychological literature. They focused on the psychological effects that
certain job characteristics have on mental well-being (especially job dissatisfaction, job strain
and burnout) and possible interventions to counteract these negative outcomes (Kelloway and
Barling, 1991). Most of this research is based on the Hackman and Oldham model (1976),
which describe that five job characteristic (variety, identity, significance, autonomy and
feedback) influence three key psychological states (experienced meaningfulness of the work,
experienced responsibility for the outcomes of the work and knowledge of the results of the
work activities) (Hackman and Oldham model, 1976).
In the next stage of research alternative models were developed for the Hackman and Oldham
model. The most influential model is Karasek's job demand control & support model (JDCS
model), also known as the job strain model (de Croon, et al., 2000). The Job Strain model
assumes that strain especially results from the combination of high job demands, low decision
latitude and low social support (Warren et al., 2002). An alternative theory used to describe
the relationship between job characteristics and mental health is Warr’s vitamin model.
Essentially, the model holds that mental health is affected by job characteristics in a way that
is analogous to the non-linear effects that vitamins are supposed to have on our physical
health. Some job characteristics have a positive effect on mental health and beyond a certain
point, there is no additional effect. While other job characteristics have a positive effect, but
beyond a certain point their effect is negative (de Jonge et al., 1998). Research in this stage
still focused on the psychological outcomes of work characteristics on mental well-being, but
it has facilitated the development of theory for the third stage.
In the third stage, research redirected attention from psychological outcomes to health
outcomes. Much of the empirical research examining these relationships has also used
Karasek’s job strain model and to a smaller extend Warr’s vitamin model.
4 Jasper Schuurman, 195367
Erasmus University, Rotterdam Health Economics, 2011
Research on the relationship between job characteristics and health has not remained without
criticism, where critics have questioned research on methodological as well as on practical
grounds. As for the methodological part, the majority of criticism has been on the way job
characteristics are measured. Job characteristics are too often measured in an indirect manner,
which hampers the possibility to draw solid conclusions (Karasek et al., 1988). This has
resulted in a situation, where research has developed many different measures for job
characteristics, even when the same theoretical framework was used. This might explain why
research finds so many different strengths in relationships between the effect of job
characteristics and health (Landsbergis, 1988). Andries, Kompier and Smulders, for example,
found that job demands had by far the most important influence on self-rating of health.
While Marmot et al. concluded that job control in the workplace accounts for much of the
occupational grade difference in coronary heart disease. In general, it has been stated that job
characteristics theory is oversimplified and that research fails to include all dimensions of job
characteristics (Spector and Jex, 1991; Warren et al., 2002).
Despite the fact that research finds different strengths in relationships, there seems to be
general agreement among researchers that job characteristics have an influence on both
mental well-being and health (Vahtera et al., 2000). More troublesome is the effect possible
intervention programs have, to counteract the negative influence of job characteristics on
health. Some researchers find an effect of intervention programs, like autonomous work
groups, use of more frequent staff meetings, job enrichment and job enlargement. Karasek
summarized 19 international case studies, concluding that the stress programs were generally
successful, but the criteria he used for methodological review were unstated (Shannon et al.,
2001; Hackman and Oldham, 1976).
On the other hand, examples can be found of job redesign interventions in which changes in
job characteristics did not result in changes in health. Something that would be predicted by
job characteristics theory (Spector and Jex, 1991; Warren et al., 2002). Reviews by Polanyi et
al. and Parkes and Sparkes concluded that the reported evidence that work stress can be
reduced and health improved was limited at best. Even the five-year major participatory
action project by Heaney et al. was unable to show benefit to workers.

5 Jasper Schuurman, 195367
Erasmus University, Rotterdam Health Economics, 2011
The fact that different results are found could also be explained by the variety of approaches
to intervention programs, in part because they are based on different models, and different
outcome measures (Shannon et al., 2001). Or it just might be that the implementation of these
programs has not been successful (Fried and Ferris, 1987).
Other methodological issues that research encounters between the effects of job
characteristics on health are:
1) A large amount of intervening variables have been found that affect the results between job
characteristics and health. Some examples of intervening variables that have been found to
influence results are: socioeconomic status, perceptual and affective reactions, health
behaviors (like smoking, obesity, dietary fat intake, and inactivity) and sex (Spector and Jex,
1991; Hellerstedt and Jeffery, 1997). Faragher et al. go as far to state that this can make the
evidence easily appear to be both contradictory and inconclusive (Faragher et al., 2005).
2) Most occupational studies have been based on single occupations and this severely restricts
job characteristics variance (Karasek et al., 1988; Pousette and Hanse, 2002).
3) Some researchers find that the link between job characteristics and health is country
specific (László et al., 2010), while others do not (Karasek et al., 1988).
4) The direction of the causal relationship. For instance, do high job demands lead to health
problems? Or, is strain primary such that workers with health problems are more likely to
report their job demands as higher? The general view is that adverse job characteristics lead to
health problems (de Jonge et al., 2001)
5) Studies for men and women have used different models. For women most studies have
used a gender model that concentrates on family conditions as mediators. In contrast, studies
of the effects of employment on men typically use a job model and focus on work rather than
family conditions. To understand the relationships fully of employment on men and women,
these models should be combined (Lennon and Rosenfield, 1992).
6) Most of the research focuses only on limited portions of the job characteristics (Hogan and
Martell, 1987)

6 Jasper Schuurman, 195367
Erasmus University, Rotterdam Health Economics, 2011
From a practical point of view, questions are raised as to whether the proposed interventions
can be applied in business, because employee well-being and the well-being or efficiency of
the organization are often in conflict. Economic theory predicts that organizations will spend
on health and safety up to the point where marginal benefits equal marginal costs. So even
though companies are taking more responsibility for the employee’s health, they will still put
their economic goals as their first priority. This might also explain why many intervention
programs have not been successful. However, the alternative to continue to consider
productivity as the only goal of work design is not acceptable. It places employees in the
position of having to trade off their health against their economic well-being with uncertain
terms of exchange.
All hopes should not be lost as there seems to be light at the end of the tunnel. Some
companies are moving away from traditional programs, trying to decrease stress levels by
redesigning jobs towards family-friendly policies. The term family-friendly policy includes a
wide range of employer policies and accommodations such as paid leave, maternity leave,
flex time, and day care. Considering that work-home conflict is apparently on the increase and
a contributing factor to pressure felt in today's workplace this could be a good alternative for
the traditional programs.
Surprisingly little research has been performed on work-family relations, let alone on other
factors outside of the workplace. The research on work-family conflict suggests effects on
mental and physical health. This has important health implications for the design and delivery
of employee health intervention programs. Besides the small amount of research performed
on the relationship between job characteristics, health and factors outside of the workforce,
most of the research has focused on organizational responsibilities. How can organizations
redesign jobs and constitute a work package that is good for employee well-being and at the
same time meet company goals? Rosner takes a different perspective on the topic. He believes
that stress is fundamentally an individual's problem and sees no solution other than initiatives
taken by individuals on their own behalf to improve their health (Karasek et al., 1988;
Shannon et al., 2001). This thesis will try to incorporate both perspectives, by focusing on
employer-employee relations and factors outside of the workplace. The thesis will take a
broader view on the topic by extending the topic to the social life of the individual and not
solely on work-family issues.

7 Jasper Schuurman, 195367
Erasmus University, Rotterdam Health Economics, 2011
The aim of this study is to add general knowledge to the debate on the relationship between
job characteristics and health by focusing on factors outside of the workforce. In order to
narrow down the focus of the research, results will be tested for the Netherlands only. Even
though results might be country specific (László et al., 2010). Therefore the central question
of this research is: can satisfaction with social life moderate the relationship between job
characteristics and health in the Netherlands?
The scientific relevance of the research is that it focuses on a different dimension of the
relationship between job characteristics and health, with a moderating variable influencing the
relationship that is out of the traditional scope of research. Besides, this research will try to
overcome some of the difficulties related to examining this relationship by controlling for
many confounding variables, using the same model for men and women and including
multiple occupations. The practical relevance of the study is that it might help governments to
direct attention to the factors that are important for an employee’s health and design policies
in which employees can balance their work and social life. Especially, since the general view
now is that balancing work and social life is a woman's issue and therefore not the problem of
the organization.
In the following chapters the potential for satisfaction with social life to moderate the
relationship between job characteristics and health will be examined in more detail. Chapter
two is a theoretical review on the topic. It will start with a full review of the theories most
often used to link job characteristics to health. This will be followed by a description of how
the two models predict health outcomes and hypotheses will be formulated based on these two
models. Then the construct of satisfaction with social life will be defined and describe how it
could influence the relationship between job characteristics and health. The chapter ends with
clearly defined hypotheses related to satisfaction with social life. Chapter three will describe
the methodology used to test the different hypotheses formulated. It will start by describing
the database used for the research, followed by a description of the variables used. This
chapter ends with the methods of analysis used to conduct the research. Chapter four will
describe the findings and test the hypotheses formulated in chapter two and ends with a
discussion of the results. The final chapter summarizes the research and describes some of the
limitations of this research and ends with suggestions for future research.

8 Jasper Schuurman, 195367
Erasmus University, Rotterdam Health Economics, 2011
2) Theory
This chapter discusses the theory on the relationship between job characteristics and health
and will gradually progress to the formulation of hypotheses, in order to answer the research
question. The chapter starts by defining the construct of job characteristics. Due to the
ambiguities in research on job characteristics it is necessary to have a clear definition of job
characteristics. This will be followed by a full review of the models used to link job
characteristics to health in order to identify the relevant job characteristics and link them to
health outcomes. This means a short review on Hackman and Oldham’s job characteristics
model, even though this model is not often used to link job characteristics to health. It does
however help to get a better understanding of the two models used to evaluate health, the job
demand control & support model (JDCS model) and the vitamin model. After the short review
on the Hackman and Oldham model, the JDCS model and the vitamin model will be
described in full length and will be linked to health. After this discussion the first two sets of
hypotheses are formulated. The final part of this chapter will discuss satisfaction with social
life. A clear definition will be given of what is meant with satisfaction with social life in this
thesis. Followed by the potential moderating effects on the relationships between job
characteristics and health and ends with the final set of hypotheses.
Defining job characteristics
The introduction described the development of theory on job characteristics and health. In the
first two stages of theory development, attention has been directed to the psychological
outcomes of job characteristics. Hackman and Oldham have used the following definition of
job characteristics: a set of environmental variables that are widely thought to be important
causes of employee affect and behavior (Hackman and Oldham, 1976). The definition used in
this stage of research clearly highlights the psychological view taken on the subject. With a
change of focus, health outcomes instead of psychological outcomes, a new definition is
needed in order to cover the research scope. The business dictionary uses the following
definition for job characteristics: Aspects specific to a job, such as knowledge and skills,
mental and physical demands, and working conditions that can be recognized, defined, and
assessed. (http://www.businessdictionary.com/ definition/job-factors.html).

9 Jasper Schuurman, 195367
Erasmus University, Rotterdam Health Economics, 2011
This definition focuses on the job itself and does not include a clear outcome measure, but it
provides a good basis for the definition used in this thesis. The definition of job characteristics
used in this thesis will be: Aspects specific to a job, such as knowledge and skills, mental and
physical demands, and working conditions that can be recognized, defined, and assessed that
are important causes of employee health.

10 Jasper Schuurman, 195367
Erasmus University, Rotterdam Health Economics, 2011
Hackman and Oldham’s job characteristics model
The job characteristics model was originally developed by Turner and Lawrence and has been
revised by Hackman and Lawler. The final version of the job characteristics model as used in
many theoretical reviews has been developed by Hackman and Oldham. They summarized the
job characteristics into five core dimensions:
1) Skill variety: the degree to which a job requires a variety of different activities in carrying
out the work, which involve the use of a number of different skills and talents of the person.
2) Task identity: the degree to which the job requires completion of a whole and identifiable
piece of work; that is, doing a job from beginning to end with a visible outcome.
3) Task significance: the degree to which the job has a substantial impact on the lives or work
of other people, whether in the immediate organization or in the external environment.
4) Autonomy: the degree to which the job provides substantial freedom, independence, and
discretion to the individual in scheduling the work and in determining the procedures to be
used in carrying it out.
5) Feedback: the degree to which carrying out the work activities required by the job results in
the individual obtaining direct and clear information about the effectiveness of his or her
performance (Sims et al., 1976; Fried and Ferris, 1987; Pounder, 1999; Hackman and
Oldham, 1976; Hogan and Martell, 1987)
Hackman and Oldham state that these five core dimensions of job characteristics in turn
influence the three critical psychological states:
1) Experienced meaningfulness of the work: the degree to which the individual experiences
the job as one which is generally meaningful, valuable, and worthwhile.
2) Experienced responsibility for work outcomes: the degree to which the individual feels
personally accountable and responsible for the results of the work he or she does.
3) Knowledge of results: the degree to which the individual knows and understands, on a
continuous basis, how effectively he or she is performing the job (Pounder, 1999; Hackman
and Oldham, 1976; Hogan and Martell, 1987).

11 Jasper Schuurman, 195367
Erasmus University, Rotterdam Health Economics, 2011
According to Hackman and Oldham these three critical psychological states subsequently
influence work outcomes. The Hackman and Oldham model was essentially developed to
measure job satisfaction (Jansen et al., 1996), but it has been used to measure other outcomes
like internal work motivation, growth satisfaction, work effectiveness, and absenteeism as
well. Finally, Hackman and Oldham identified three moderating variables (knowledge and
skill growth, need strength, and context satisfaction) to moderate both the relationship
between job characteristics and psychological states and between the psychological states and
work outcomes (Fried and Ferris, 1987; Hackman and Oldham, 1976). The full model, as
described in figure 1, makes it possible to redesign jobs on the five key job characteristics in
order to get more beneficial outcomes (Jansen et al., 1996).
Figure 1: Hackman and Oldham full job characteristics model
Results have tended to be generally supportive of the model Hackman and Oldham model.
However, a number of methodological, analytic, and substantive issues regarding the overall
validity of the model can be raised. The causal core of the job characteristics model is the
psychological states. Hackman and Oldham go on to argue that the work outcome should be
highest when all three of the psychological states are present. The model also specifies the
nature of the relationship between job characteristics and psychological states. The three job
characteristics of skill variety, task identity, and task significance are hypothesized to
combine additively to determine the psychological meaningfulness of the job. The job
characteristic of autonomy determines the experienced responsibility, while the job
characteristic of feedback is hypothesized to foster knowledge of results (Hugh and House,
1980; Hackman and Oldham, 1976; Hogan and Martell, 1987). The failure to find support for
the hypothesized three-way interaction of the psychological states is of some importance,
since Hackman and Oldham refer to the psychological states as the causal core of the job
characteristics model, and argue strongly that all three of the psychological states are

12 Jasper Schuurman, 195367
Erasmus University, Rotterdam Health Economics, 2011
necessary for the existence of positive work outcomes. This would mean that the model is not
capable of specifying work outcomes (Kelloway and Barling, 1991). Other researchers
however have relaxed the hypothesis of the three-way interaction and have showed that the
existence of one psychological state is sufficient for positive work outcomes (Hogan and
Martell, 1987).
A second methodological issue is the relationship between the different job characteristics.
Hackman and Oldham report that the five dimensions are not empirically independent. They
report a median intercorrelation of .26, where the median correlation of autonomy with the
other dimensions is even .36 (Hackman and Oldham, 1976). This means that in order to
determine the effect of a job characteristic on the final work outcome, one has to control for
the existing intercorrelations.
The final methodological issue, which is of great importance for this research, is how the
model can be used as a tool to assess health outcomes. First of all, the model is designed to
measure psychological work outcomes. These psychological work outcomes will in turn have
an influence on health outcomes, but this means that the model contains two mediating effects
in order to determine the effect of job characteristics on health. Second of all, the model has to
correct for the intercorrelation between the different job characteristics.
To conclude, the Hackman and Oldham model is too complex to measure the relationship
between job characteristics and health. So we need a model where the different job
characteristics are “independent” of one another. Besides, we need a model that is capable of
a more direct assessment of the relationship between job characteristics and health. In the
introduction we have seen that alternative models have been developed, based on the
Hackman and Oldham model. These models are capable to assess the effect of job
characteristics on health in a more direct manner and will be discussed in the next two
sections.
13 Jasper Schuurman, 195367
Erasmus University, Rotterdam Health Economics, 2011
Job demand control & support model
The job demand control & support model was developed by R. Karasek and his colleagues
during the 1980s (Kristensen, 1995; Landsbergis, 1988) and resolved many of the difficulties
associated with job stress research at the time. Interesting for this thesis are the difficulties
associated with the Hackman and Oldham model and health outcomes in order to find a
suitable model to test the effect of job characteristics on health. At first, Karasek’s model
consisted of only two components, namely demand and control (also known as the job
demand & control model, JDC model), in a later stage they added the dimension of social
support (also known as the job demand control & support model, JDCS model) In the JDC
model, demands are defined as psychological stressors present in the work situation and
control is defined as the opportunities of the employee to use and develop his or her skills and
authority over decisions. These definitions show that the JDC model has been originally
developed from a psychological perspective as well. According to the JDC model two basic
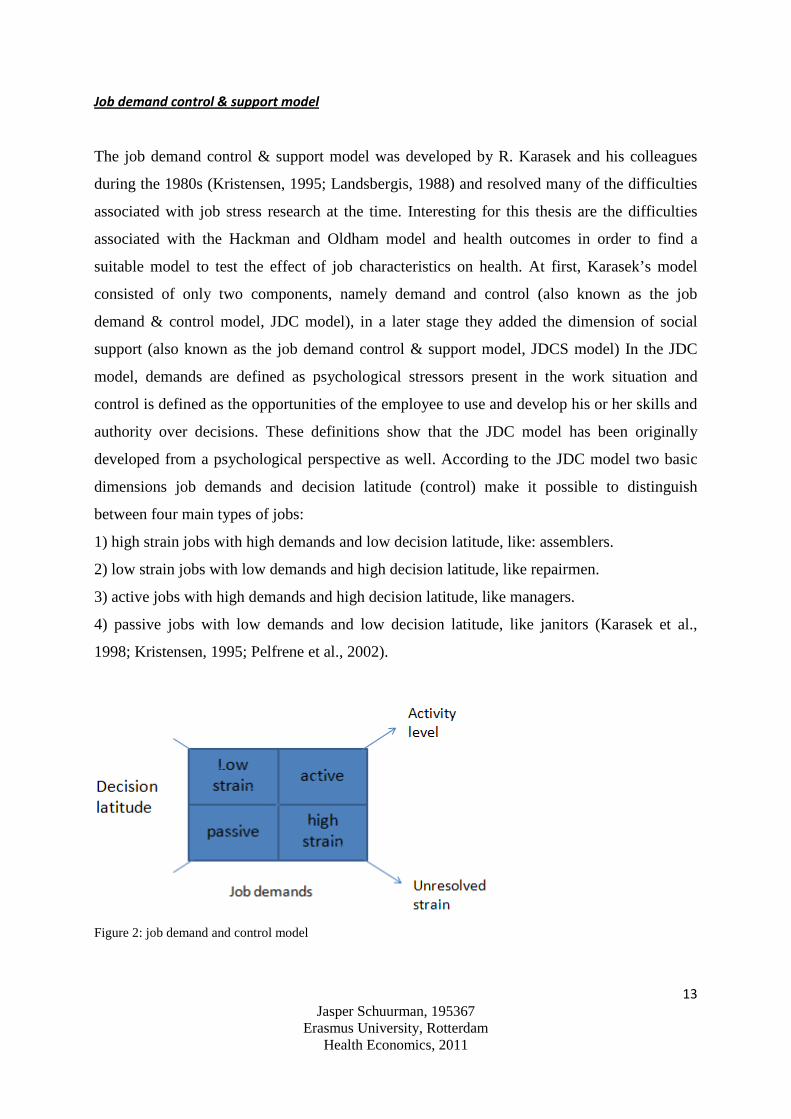
dimensions job demands and decision latitude (control) make it possible to distinguish
between four main types of jobs:
1) high strain jobs with high demands and low decision latitude, like: assemblers.
2) low strain jobs with low demands and high decision latitude, like repairmen.
3) active jobs with high demands and high decision latitude, like managers.
4) passive jobs with low demands and low decision latitude, like janitors (Karasek et al.,
1998; Kristensen, 1995; Pelfrene et al., 2002).
Figure 2: job demand and control model

14 Jasper Schuurman, 195367
Erasmus University, Rotterdam Health Economics, 2011
Figure 2 describes the job demand & control model. The model combines both dimensions in
order to distinguish between jobs increasing in strain and jobs increasing in activity level. The
activity level shows how jobs should ideally develop, in each dimension job demands match
decision latitude. So the employee is given the right amount of decision latitude to face the
demands he is given.
The strain dimensions shows how strain develops in jobs. When job demands go up and
decision latitude goes down, the strain an employee experiences increases. One might assume
that demands and latitude are highly correlated, that is authority proportionally grows with
responsibility. However, the correlation found is lower than the correlations reported by the
Hackman and Oldham model. The U.S. Quality of Employment Surveys found a correlation
of 0.17 and the longitudinal Swedish Level of Living Surveys found a correlation between
0.05 and 0.26. This is one dimension on which the job demand & control model is a better
tool to investigate the relationship between job characteristics and health than the Hackman
and Oldham model. Besides the JDC model explicitly distinguishes control as a separate
feature influencing work related outcomes. As Beehr and Newman pointed out, job stress
researchers have generally ignored the decision-making or response selection process of
employees.
The omission of control has led to confusion in the literature. For example, Ritti found higher
intellectual demands associated with greater satisfaction among engineers. In this case,
intellectual demands were not simply stressors but included the ability to use a variety of
skills and perform less routine and monotonous work. This finding is in line with predictions
of the Hackman and Oldham model, however, the model does not attribute the outcome to the
control an employee has. According to Landsbergis this distinction is vital in order to
understand the impact of job characteristics on health (Landsbergis, 1988). By means of an
example this statement can be explained best. A doctor has a very responsible job and
responsibility is often defined as a stressor, but the amount of stress experienced highly
depends on the amount of decision-making authority the doctor has. So a concept like
responsibility contains both aspects of job demands and decision-making authority.

15 Jasper Schuurman, 195367
Erasmus University, Rotterdam Health Economics, 2011
There are several authors that have resolved this deficiency in the Hackman and Oldham
model, by stating that the dimensions of autonomy and skill variety actually represent the
control dimension an employee has in his job (Pousette and Hanse, 2002; Hellerstedt and
Jeffery, 1997; Pelfrene et al., 2002). The dimension of job demands is, however not present in
the Hackman and Oldham model and is a vital dimension to explain the development of
strain.
The job demand & control model has been further developed in different directions. One
important step was to include social support as a dimension of the psychosocial work
environment (also known as the job demand control & support model). Various aspects of the
degree to which the individual worker can get support from workmates and/or supervisors
affect both how demands are handled and the ability of the individual worker to have control
in his or her job (Shannon et al., 2001; Jansen et al., 1996; Höckertin and Härenstam, 2006.
The social support addition acknowledges the need of any theory of job stress and behavior
development to assess social relations at the workplace (Karasek et al., 1988; Pelfrene et al.,
2002). These researchers do, however, not explain the fact that the correlation between social
support and the other two job characteristic dimensions found is low. Opposed to their view,
where the correlation between social support and the other two job characteristics dimensions
is high (Landsbergis, 1988). This thesis subscribes to the low correlations found between the
different job characteristics and will therefore treat social support as a distinct job
characteristic that influences health. Two other job characteristics have been added to the
model, physical job demands and job insecurity, but in the majority of theoretical reviews
they are excluded (de Lange et al., 2003).
The theory described above has two important implications for this research. First of all, it is
important to acknowledge job demands and control as distinct job characteristics to explain
health outcomes. Therefore the JDCS model is superior to the Hackman and Oldham model.
Second of all, the thesis tries to include as many job characteristics as possible in order to test
all relevant job characteristics. In the introduction it was identified that one of the critics on
job characteristics theory is that not all relevant dimensions of job characteristics are included.
Since the correlation between the different job characteristics is low it assumed that
investigating the relationship between all relevant job characteristics and health is feasible and
that each of the different job characteristics by itself has an influence on health.

16 Jasper Schuurman, 195367
Erasmus University, Rotterdam Health Economics, 2011
Figure 3 describes all the job characteristics identified by the JDCS model and the
relationship with health outcomes.
Figure 3: Full job demand control & support model
When the full job demand control & support model (figure 3) is compared with the full
Hackman and Oldham model (figure 1), we can see that the JDCS model is more
straightforward than the Hackman and Oldham model. Together with the reasons mentioned
above, this makes the JDCS model more suited to evaluate health outcomes. Or to put it in the
words of Kristensen: it is no exaggeration to say that the JDCS model has been the most
influential model in the research on psychosocial work environment, stress and disease for the
last 10 years. The job strain model (with or without the support dimension) has been
elucidated in more than 100 studies (Kristensen, 1995). In practice, health outcomes have
been assessed in two ways, directly and indirectly. In the direct manner, the job characteristics
are directly related to health outcomes. In the indirect manner, job characteristics are related
to stress outcomes, which subsequently influence health. The advantage of the indirect
manner is that the underlying psychological mechanism by which eventually health is effected
is explained.
The goal of this research is to add general knowledge to the debate of job characteristics and
health with satisfaction with social life moderating the relationship. Given the goal of the
research, this thesis will use the direct manner to assess the effect of job characteristics on
health.
17 Jasper Schuurman, 195367
Erasmus University, Rotterdam Health Economics, 2011
The final part of this chapter describes the hypothesis formulated and the support found for
the model. Researchers have formulated several hypotheses on how the model predicts work
and health outcomes. The model starts with the two basic hypotheses: the strain hypothesis
and the learning hypothesis. The strain hypothesis states that the most adverse work/health
outcomes are to be expected in workers having jobs characterized by the combination of high
demands and low control. These workers occupy high strain jobs, in contrast to low strain
jobs which combine low demands with high control (Kristensen, 1995; Pelfrene et al., 2002).
The higher the demands relative to control, the higher the strain (Shannon et al., 2001). The
learning hypothesis states that high job demands in combination with high job control will
favor learning, motivation and development of skills, all leading to so-called active jobs.
Employees in active jobs will develop better coping mechanisms to deal with stress. In
contrast, jobs characterized by low demands and low control will most often discourage
employees and put them or even lock them up in a passive situation. Some researchers have
included the dimension of social support in the strain hypothesis as well, i.e. high demands,
low control and low social support lead to high strain (Karasek et al., 1998; Pelfrene et al.,
2002).
Others have formulated a separate hypothesis for the social support dimension, the buffer
hypothesis. The buffer hypothesis states that support received from supervisors and
colleagues often buffer the impact of job demands and control on outcome variables. The
opposite of the buffer hypothesis is the hypothesis that there exists a synergic effect between
the different job characteristics. It is the combination of job characteristics, which together
exert a stronger effect, than each of the variables independent (de Lange et al., 2003; Sanne et
al., 2005).
A large body of research has tested the strain hypothesis as opposed to the learning
hypothesis. For the latter, no scientific research was found testing the hypothesis. In general
support for the model has been found based on the strain hypothesis. The model’s predictions
of psychological strain have been supported in the longitudinal 1968-1974 Swedish study, a
survey of 7000 Finnish men and women, a survey of 8700 Swedish white-collar workers, and
4503 men and women in the 1969, 1972 and 1977 U.S. Quality of Employment Surveys
(QES). View researchers have, however, found mixed results (Landsbergis, 1988). For
example, van der Doef and Maes’s review showed that only 28 of 41 studies examining the

18 Jasper Schuurman, 195367
Erasmus University, Rotterdam Health Economics, 2011
relationship between job characteristics and psychological well-being supported the strain
hypothesis. It showed be noted that earlier reviews of the JDCS model suffered from several
shortcomings that restrict the conclusions that can be drawn (de Lange et al., 2003). An
interesting feature about research on the JDCS model is that decision latitude appears to be
more consistently related to outcomes than are demands (Shannon et al., 2001). The other two
hypotheses, the buffer hypothesis and the synergy hypothesis, are rejected in the majority of
scientific research (Sanne et al., 2005; de Croon et al., 2000).
The JDCS model has been criticized on a number of other grounds, which show high
resemblance with the general criticism mentioned in the introduction:
1) The construct of decision latitude is too broad, as it embodies skill discretion as well as
decision authority (Pousette and Hanse, 2002; Kristensen, 1995; de Croon et al., 2000). Based
on the fact that decision latitude is more consistently related to outcomes, questions can be
raised as to whether this actually is a concern.
2) The model is too simple. More than two (or three) dimensions are needed to describe the
psychosocial work environment (Johnson and Hall, 1988; Kristensen, 1995).
3) In reality, high job strain is another way to measure low social status. This would mean that
social status is the mean variable explaining strain. Based on the general support for the
model this view seems to simplistic.
4) The effects of job demand, control and/or social support may be curvilinear with optimal
levels at the middle of the range. Like the Hackman and Oldham model, the JDCS model
states that the effects of job characteristics are linear opposed to curvilinear. The general view
is that the effects of the job characteristics are linear, as only a small amount of scientific
reviews found curvilinear relationships (Kristensen, 1995). These reviews based their findings
on the vitamin model that challenges this popular believe of linearity.

19 Jasper Schuurman, 195367
Erasmus University, Rotterdam Health Economics, 2011
Vitamin model
Warr raised a new criticism on the Karasek model. He points out that Karasek’s results
suggest that the relationships between the job characteristics and strain outcomes are in fact
curvilinear and not linear as assumed. Warr has challenged this popular believe with his
vitamin model. Warr uses the way vitamins affect human health as a metaphor for the effect
of environmental influences on mental health and well-being (Kelloway and Barling, 1991;
Fletcher and Jones, 1993; Jeurissen and Nyklíček, 2001). Vitamins exert a particular influence
on the human body. That is, vitamin deficiency produces bodily impairment and,
consequently, may lead to physical illness. Generally, vitamin intake initially improves health
and physical functioning, but beyond a particular level of intake no further improvement is
observed. Warr distinguishes between two types of vitamins, vitamin C (CE) and vitamin D
(AD). Job characteristics that are labeled vitamin C have a positive curvilinear effect on the
individual up to a certain point, but then any added increase does not have any further effects
(neither beneficial nor detrimental effects), i.e. there effect is constant. According to Warr,
vitamins C and E have a suchlike effect on the human body. Therefore, the label CE
(Constant Effect) is used to denote this particular relationship. Job characteristics that are
labeled vitamin D have a curvilinear positive effect on well-being, but beyond a certain point
there effect becomes negative. Vitamins A and D are known to be toxic, when taken in large
quantities. For that reason Warr has used the label AD (Additional Decrement) to denote the
inverted U-shaped curvilinear relationship (de Jonge et al., 1998; Sonnentag and Frese).
Figure 4 shows Warr’s vitamin model.
Figure 4: Warr’s vitamin model
20 Jasper Schuurman, 195367
Erasmus University, Rotterdam Health Economics, 2011
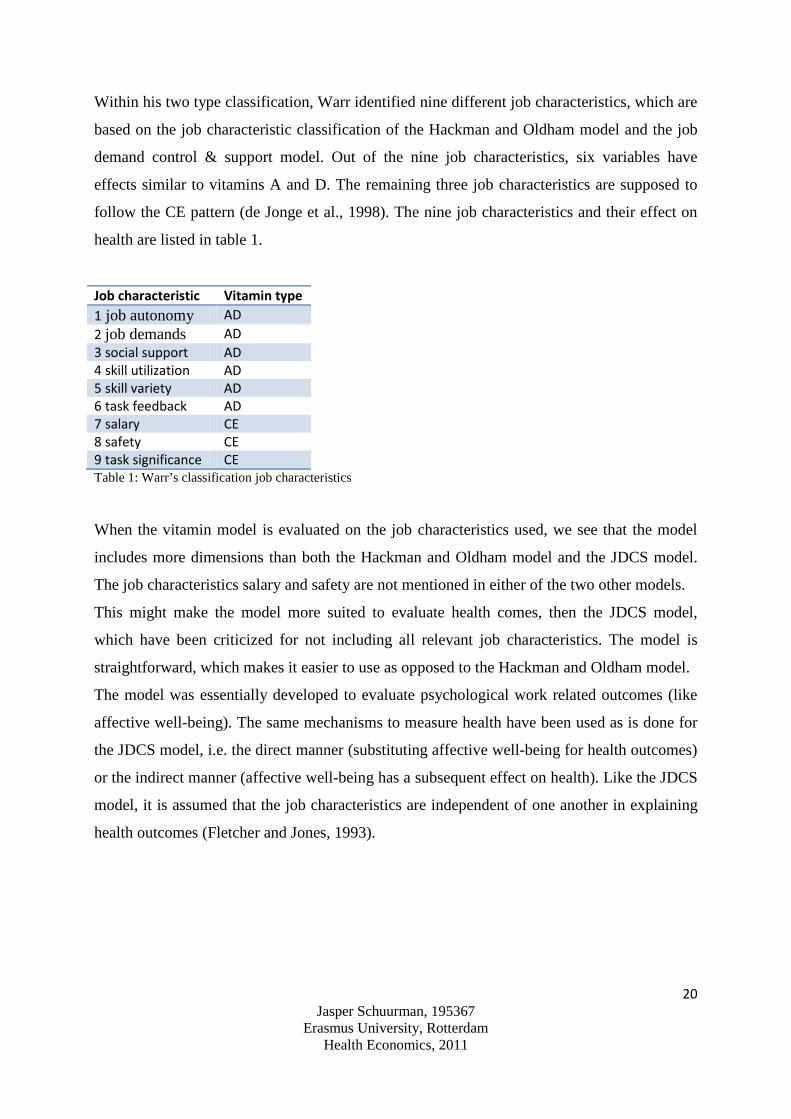
Within his two type classification, Warr identified nine different job characteristics, which are
based on the job characteristic classification of the Hackman and Oldham model and the job
demand control & support model. Out of the nine job characteristics, six variables have
effects similar to vitamins A and D. The remaining three job characteristics are supposed to
follow the CE pattern (de Jonge et al., 1998). The nine job characteristics and their effect on
health are listed in table 1.
Job characteristic Vitamin type 1 job autonomy AD 2 job demands AD 3 social support AD 4 skill utilization AD 5 skill variety AD 6 task feedback AD 7 salary CE 8 safety CE 9 task significance CE Table 1: Warr’s classification job characteristics
When the vitamin model is evaluated on the job characteristics used, we see that the model
includes more dimensions than both the Hackman and Oldham model and the JDCS model.
The job characteristics salary and safety are not mentioned in either of the two other models.
This might make the model more suited to evaluate health comes, then the JDCS model,
which have been criticized for not including all relevant job characteristics. The model is
straightforward, which makes it easier to use as opposed to the Hackman and Oldham model.
The model was essentially developed to evaluate psychological work related outcomes (like
affective well-being). The same mechanisms to measure health have been used as is done for
the JDCS model, i.e. the direct manner (substituting affective well-being for health outcomes)
or the indirect manner (affective well-being has a subsequent effect on health). Like the JDCS
model, it is assumed that the job characteristics are independent of one another in explaining
health outcomes (Fletcher and Jones, 1993).

21 Jasper Schuurman, 195367
Erasmus University, Rotterdam Health Economics, 2011
The major difference between the vitamin model in comparison with the Hackman and
Oldham model and the JDCS model, as described earlier, is the assumption of curvilinear
instead of linear effects. This means for example that people need the vitamin of task
significance to a certain point. Therefore, people’s wellbeing increases with having more task
significance. But at a certain level, any additional increase in task significance will not have
any further increase of people’s well-being (Sonnentag and Frese).
This is not in line with the Hackman and Oldham model, i.e. more task significance is always
better. An even bigger contradiction of the behavior of the vitamin model can be found for the
job characteristic social support. The vitamin model predicts that social support beyond a
certain point has a negative effect, while the JDCS models claims that social support always
has a positive effect and the more the better (since the relationship is positive and linear). In
other words, for most job characteristics there is an optimal level, while at both ends of the
distribution the effects on well-being and health are hypothesized to be unfavorable (Fletcher
and Jones, 1993; Jeurissen and Nyklíček, 2001).
The amount of scientific reviews on the vitamin model is limited, as opposed to the other two
models. Most research has mainly focused on the job characteristics which are also present in
the JDCS model. Warr originally studied among nearly 1900 employees and tested the job
characteristics for job satisfaction, job-related anxiety, and job- related depression (de Jonge
et al., 1998; http://www.coursework4you.co.uk/essays-and-dissertations/sample44.php).
Significant curvilinear relationships were found between job demands on the one hand, and
job satisfaction, job-related anxiety, and job- related depression on the other hand. Job
autonomy showed curvilinear association with job satisfaction. The latter relationship was the
only one found to be significant in the study of Fletcher and Jones in a large heterogeneous
sample of about 1300 men. Parkes, however, did not find any curvilinear relationship in her
sample of almost 600 civil servants. Contrarily, De Jonge et al. found four out of 12
curvilinear relationships in their study among about 250 health care professionals (de Jonge et
al., 1998). These discrepancies are at least partly due to methodological differences between
the studies, such as the participant samples and outcome variables used (Jeurissen and
Nyklíček, 2001).

22 Jasper Schuurman, 195367
Erasmus University, Rotterdam Health Economics, 2011
The hypothesis of isolated effects of job characteristics on health has been supported to a
certain extent. Although it should be mentioned that the studies testing the correlations did not
take into account all nine variables simultaneously (http://www.coursework4you.co.uk/
essays-and-dissertations/sample44.php). Despite the fact that not all job characteristics were
tested simultaneously it seems safe to assume that correlations are modest, since the job
characteristics are derived from the Hackman and Oldham model and the JDCS model, which
have modest correlations between the different job characteristics.
Both models have found some correlations between the job characteristics, where the job
characteristics of the JDCS model were less correlated with one another than in the Hackman
and Oldham model. To summarize the theory on the vitamin model, there is only limited
support for the curvilinear relationship described by the, however, more research is needed in
order to definitely reject the model. The model on the other hand has one big advantage
compared to the JDCS model as it includes more job characteristics.
The theoretical models above have described the job characteristics that are used and their
relationship with health. The JDCS model finds most support in the scientific literature,
although it includes a limited number of job characteristics. The vitamin model, although not
supported on the curvilinear behavior, includes a large number of job characteristics. By
combining the JDCS model and the vitamin model the following distinct job characteristics
are identified. Table 2 provides a list of all the relevant job characteristics identified so far and
the model it relates to.
Job characteristic model 1 job autonomy VM 2 job demands VM, JDCS 3 social support VM, JDCS 4 skill utilization VM 5 skill variety VM 6 task feedback VM 7 salary VM 8 safety VM 9 task significance VM 10 job control JDCS 11 physical demands JDCS 12 job insecurity JDCS Table 2: total number of identified job characteristics in literature

23 Jasper Schuurman, 195367
Erasmus University, Rotterdam Health Economics, 2011
The dimension of job control in the JDCS model, corresponds to the dimensions of job
autonomy and skill utilization in the vitamin model, consequently there are eleven different
job characteristics. Chapter three will discuss the database and methods used to test the
relationships between job characteristics and health. This chapter will show why it is not
possible to test all eleven job characteristics in this thesis. The job dimensions of skill variety,
task feedback, safety and task significance cannot be tested in this research the remaining job
characteristics however can be tested. By testing the remaining job characteristics this thesis
includes more job characteristics dimensions than most scientific reviews. For this reason, the
remaining part of the research will focus on the job characteristics that are tested in chapter
four.
24 Jasper Schuurman, 195367
Erasmus University, Rotterdam Health Economics, 2011
Job characteristics and health
Up to now, the research has focused on the different models used to connect job characteristic
to health and has briefly discussed how the models predict health outcomes. The research
found that the JDCS model is a better tool to explain health outcomes than the Hackman and
Oldham model. This is reflected in the scientific literature as well, as the majority of scientific
reviews are based on the JDCS model (Landsbergis, 1988). The vitamin model, although not
widely supported on the curvilinear relationships of job characteristics, identifies more job
characteristics than the JDCS model and is therefore important for this thesis. Except from the
curvilinear hypothesis, the vitamin model uses the same direct mechanism to connect job
characteristics to health and is therefore a good model as well. This research has identified
eleven different job characteristics based on the two models, from which seven will be tested.
Before specifying the hypothesized relationships between these seven job characteristics and
health, two final issues will be discussed that are important when testing the relationship
between job characteristics and health. This means a short description of the underlying
causal mechanism, even though not tested. As Kristensen notes, it is one thing to demonstrate
an association between strain and unfavorable health outcomes, another to explain such an
association (Kristensen, 1995). A second issue is the magnitude of effect the different job
characteristics have on health outcomes. In other words, do all the different job characteristics
have an equal effect on health or do some job characteristics have stronger effects than others.
The main underlying causal mechanism that connects job characteristics to health is stress
(Ramirez et al., 1996; Kelloway and Barling, 1991; Spector and Jex, 1998). The stress caused
by unfavorable job characteristics leads to two kind of changes in the individual,
physiological changes and behavioral changes. Examples of physiological changes are
changes in: blood pressure, blood sugar, pulse, stress hormones and obesity. Examples of
behavioral changes are: tobacco usage, diet habits, calorie intake, exercise, alcohol, coffee and
sleeping patterns (Kristensen, 1995). There is much research on physiological changes caused
by the negative effect of job characteristics (job demands, decision-latitude and social
support).

25 Jasper Schuurman, 195367
Erasmus University, Rotterdam Health Economics, 2011
The majority of scientific research has tested the relationship in an indirect manner by
examining the effect of job characteristics on the probability of getting CVD (increased blood
pressure is one of the main factors causing CVD). The results showed consistent relationships
between job characteristics and CVD (Vahtera et al., 2000).
The amount of research that shows behavioral changes is less exhaustive, but the research
available has shown such changes exist. Higher job demands were found to be associated with
increased smoking intensity and higher BMI due to increased fat intake. High decision
latitude (control) was associated with exercising on a regular basis (Hellerstedt and Jeffery,
1997) and less alcohol consumption. And increased social support has been found to be
associated with less smoking and lower BMI (Pelfrene et al., 2002). The results of the
research studying physiological changes and behavioral changes should however be
interpreted with caution. It is extremely complicated to study the causal networks empirically,
because many of the mechanisms may be working simultaneously and are also influenced by
factors outside the work environment such as heredity (Kristensen, 1995).
The second issue, which of the job characteristics has the biggest effect on health is still a
matter of debate. In prior research on work characteristics, job control has been shown to be
the strongest psychosocial predictors of sickness absence, morbidity and mortality (Vahtera et
al., 2000). These researchers state that employees that have more control over their work feel
that they have the situation under control and can control the duration and frequency of the
workload (Pousette and Hanse, 2002).
Others, however, found that job demands have a stronger influence on health (Hellerstedt and
Jeffery, 1997; Inoue et al., 2010). It should be mentioned that part of the different results can
be explained by different outcome measures used. Landsbergis (1988) for example found that
workload demands were more strongly related to exhaustion, and decision latitude was more
strongly related to depression and job dissatisfaction. The research on which of the job
characteristics has the most impact on health is therefore inclusive. This thesis will for this
reason make no assumptions on which of the job characteristics has a bigger effect on health.

26 Jasper Schuurman, 195367
Erasmus University, Rotterdam Health Economics, 2011
At this point the relevant theories have been discussed in order to connect job characteristics
to health. Eleven different job characteristics have been identified based on the JDCS model
and the vitamin model, as these models serve the research goals in this thesis. Out of the
eleven job characteristics, seven can be tested in chapter four: job autonomy, job demands,
social support, skill utilization, salary, physical demands and job insecurity. Based on the low
correlations found in previous research between job characteristics and health, it is assumed
that each of the seven job characteristics in itself has an influence on health. Especially since
the buffer hypothesis and the synergy hypothesis, which claim that the job characteristics
need to be tested simultaneously in order to assess the effect on health, is rejected in the
majority of scientific reviews.
A final issue is the strain hypothesis, which states that it is especially the combination of high
job demands, low control and low social support which leads to the biggest adverse health
effects. This hypothesis, however, does not imply that each of the job characteristics
individually have adverse health effects. Therefore the assumption that each of the different
job characteristics has an effect on health still holds. Out of the seven job characteristics, three
have been extensively discussed in the literature by means of the JDCS model and the vitamin
model: job demands, job control and social support. It has been found that high job demands
have negative effects on health. Increasing amounts of job control are related with better
health and high social support has also been associated with being in better health. The other
four job characteristics have received less attention in the scientific literature.
The JDCS model, see table 2, identifies physical demands and job insecurity as two other job
characteristics that influence health. Even though this thesis found no research linking these
job characteristics to health, it is hypothesized that increased amounts of physical demands
have adverse health effects and that increasing amounts of job insecurity lead to adverse
health effects. The vitamin model identifies the final two job characteristics: salary and skill
utilization, see table 2 as well. Again, this thesis did not find any articles relating these two
job characteristics to health. It seems, however, save to assume that increasing amounts of
skill utilization has positive effects on health and that increasing amounts of salaries has a
positive influence on health.

27 Jasper Schuurman, 195367
Erasmus University, Rotterdam Health Economics, 2011
The following hypotheses are formulated based on the scientific review:
H1a: increasing amounts of job autonomy has a positive effect on health.
H2a: increasing amounts of job demands has a negative effect on health.
H3a: increasing amounts of social support has a positive effect on health.
H4a: increasing amounts of skill utilization has a positive effect on health.
H5a: increasing amounts of salary has a positive effect on health.
H6a: increasing amounts of physical demands has a negative effect on health.
H7a: increasing amounts of job insecurity has a negative effect on health.
Out of the seven hypotheses formulated, three relate to both the JDCS model and the vitamin
model, two relate only to the JDCS model and two only to the vitamin model. The question
can be raised as to whether the job characteristics will follow the linear pattern as described
by the JDCS model or the curvilinear pattern (see figure 4) as described by the vitamin model.
The JDCS model has received more support than the vitamin model in the scientific literature,
therefore the five job characteristics related to the JDCS model are hypothesized to behave
linear. The job characteristics salary and skill utilization, even though only related to the
vitamin model, are also hypothesized to have linear effects. The amount of literature
supporting curvilinear behavior of job characteristics is small and it would therefore seem odd
if the two job characteristics related to the vitamin model would behave curvilinear. The
following hypotheses are formulated based on the linear expectation of the job characteristics:
H1b: job autonomy has a linear effect on health.
H2b: job demands has a linear effect on health.
H3b: social support has a linear effect on health.
H4b: skill utilization has a linear effect on health.
H5b: salary has a linear effect on health.
H6b: physical demands has a linear effect on health.
H7b: job insecurity has a linear effect on health.

28 Jasper Schuurman, 195367
Erasmus University, Rotterdam Health Economics, 2011
Satisfaction with social life
To the knowledge of this thesis, no research has been performed on the relationship between
job characteristics and health with satisfaction with social life as a moderating effect. The first
step is to define the construct of satisfaction with social life used for this research. Felce and
Perry (1995) in their study on quality of life identified five dimensions: physical wellbeing,
material wellbeing, social wellbeing, emotional wellbeing, and development and activity.
Other researchers have used similar constructs that cover the full range of an individual´s life
(i.e. including factors relating to work satisfaction) (Neugarten et al., 1996). Buetell defines
life satisfaction as an overall assessment of feelings and attitudes about one’s life at a
particular point in time ranging from negative to positive (Buetell, 2006). This definition
includes attitudes related to work as well, but provides a solid basis for the definition used in
this research. Satisfaction with social life in this research is defined as: an overall assessment
of feelings and attitudes about one’s life other than feeling and attitudes related to work at a
particular point in time ranging from negative to positive.
The construct of satisfaction with social life shows great resemblance to the job characteristic
construct of social support. That is, social support measures the support received from co-
workers, while satisfaction with social life measures the support received from friends and
family. There is reason to assume that satisfaction with social life has an influence on health
and could therefore moderate relationship between job characteristics and health. A number of
prospective studies have found an association between general social network interaction and
total mortality incidence (Johnson et al., 1998). The underlying causal mechanisms by which
social network interaction influences total mortality incidence was not specified in this
research, and for this it is beyond the scope as well to demonstrate how satisfaction with
social life can moderate the relationship between satisfaction and health. It, however, seems
fair to assume that satisfaction with social life will have an effect on the stress experienced by
an employee, the coping mechanism by which stress is dealt with and the behavior changes
associated with stress. Therefore, this thesis assumes that satisfaction with social life has an
influence on the relationship between job characteristics and health. The assumption made is
that the effect of the job characteristic will extend itself. This means for example that the
negative influence of high job demands has a bigger effect on individuals not satisfied with

29 Jasper Schuurman, 195367
Erasmus University, Rotterdam Health Economics, 2011
their social life in comparison with individuals that are satisfied with their social life and vice
versa. The following hypotheses are formulated for the effects of satisfaction with social life:
H1c: employees who are more satisfied with their social life experience bigger health benefits
from having more job autonomy, than individuals that are not satisfied with their social life.
H2c: employees who are more satisfied with their social life experience less adverse health
effects from having more job demands, than individuals that are not satisfied with their social
life.
H3c: employees who are more satisfied with their social life experience bigger health benefits
from having more social support, than individuals that are not satisfied with their social life.
H4c: employees who are more satisfied with their social life experience bigger health benefits
from having more skill utilization, than individuals that are not satisfied with their social life.
H5c: employees who are more satisfied with their social life experience bigger health benefits
from having more salary, than individuals that are not satisfied with their social life.
H6c: employees who are more satisfied with their social life experience less adverse health
effects from having more physical demands, than individuals that are not satisfied with their
social life.
H7c: employees who are more satisfied with their social life experience less adverse health
effects from having more job insecurity, than individuals that are not satisfied with their social
life.
30 Jasper Schuurman, 195367
Erasmus University, Rotterdam Health Economics, 2011
Data and methods
The primary hypothesis is that satisfaction with social life can moderate the relationship
between job characteristics and health. In addition to testing the hypothesized relationship,
this research will try to control for confounding variables that have been found to influence
the hypothesized relationship. Hence, a database is needed that cover a wide range of job
characteristics, confounding variables and variables that relate to satisfaction with social life.
The European Community Household Panel (ECHP) perfectly matched these requirements.
The ECHP is a survey based on a standardized questionnaire that involves annual
interviewing of a representative panel of households and individuals in each country, covering
a wide range of topics: income, health, education, housing, demographics and employment
characteristic, etc. The total duration of the ECHP was 8 years, running from 1994 to 2001.
(http://circa.europa.eu/irc/dsis/echpanel/info/data/information.html).
The total database contained 1121044 observations. In order to obtain the information needed
for this thesis a first shift was made by selecting all respondents from the Netherlands, which
left 72141 observations. The next step taken was the selection of the working population
based on the main activity status (normally working, unemployed or inactive. People
normally working were selected from these three categories), leaving a final database of
37928 (15387 women and 22541 men) observations. The database is longitudinal in nature
and all years are used for the analysis. Possible correlations between the different years are
taken into account and the analyses will therefore control for the fact that the database is
longitudinal in nature by correcting for the autocorrelation of the error term. In the next stage
questions were identified that cover the job characteristics. Since the European household
Panel is not primarily designed to measure job characteristics, proxies were used to cover the
job characteristics. The following job characteristics were identified from the database: job
autonomy, job demands, social support, skill utilization, salary, physical demands, job
insecurity, see table 2 for all the job characteristics identified in this thesis. So the database
provides the possibility to measure seven out of the eleven job characteristics identified in this
thesis.

31 Jasper Schuurman, 195367
Erasmus University, Rotterdam Health Economics, 2011
All the job characteristics of the JDCS model are covered, the vitamin model identifies more
job characteristics and it is therefore harder to obtain all of the variables from a standardized
database. The following step was to identify questions that relate to satisfaction with social
life based on the definition provided in chapter two, five questions were identified.
Finally, confounding variables were identified that are generally described as having an
influence on the relationship between job characteristics and health. This research will control
for the following variables: age, sex, marital status, full time versus part time work,
occupational status, type of industry the employee works in, private versus public sector,
education, health expense and social economic status. It was not possible to control for health
behaviors, since the variables smoking, alcohol consumption and BMI, although a standard
question in the European Household Panel, were not present for the Dutch respondents.

32 Jasper Schuurman, 195367
Erasmus University, Rotterdam Health Economics, 2011
Measures
The total number of variables included for analyses is twenty-two: one dependent variable,
ten independent variables, ten confounding variables and one moderating variable. Due to the
fact that the European Household Panel was not primarily designed to measure job
characteristics, the measures were compared with the questions of the JCQ, which is a
questionnaire especially designed to measure job characteristics (Karasek et al., 1998; de
Jonge et al., 1998).
Dependent variable
Self assessed health
Self assessed health is measured by a single item (i.e. How is your health in general?) that was
scored on a 5-point rating scale, ranging from 1 very good to 5 very bad. It has been shown
that a global rating of self assessed health is an inclusive measure of the general health of an
individual (de Jonge et al., 1998).
Independent variables
Job autonomy
Job autonomy (in the analyses referred to as job level) is assessed by a single item scale (i.e.
what is your current position in your job?). Respondents were able to select either
supervisory, intermediate or non-supervisory. The job position an employee has determines
the amount of job autonomy he has, where a supervisor has most authority and a non-
supervisor least authority.
Job demands
Job demands was measured by means of three variables. The first variable was labeled job
difficulty. Job difficulty was measured on a 2 item scale (do you feel that you have skills or
qualifications to do a more demanding job than the one you have now?). Respondents were
able to answer yes or no to the question. If people feel that they can do a more demanding job
it indicates that they perceive their job as not demanding.

33 Jasper Schuurman, 195367
Erasmus University, Rotterdam Health Economics, 2011
The second variable was labeled satisfaction with the amount of working hours (how satisfied
are you with your present job in term of number of working hours?). The variable was scored
on a 6-point rating scale, ranging from 1 not satisfied to 6 fully satisfied. The amount of
working hours is an indication of how demanding the employee feels his job is, if people are
fully satisfied they will perceive their job as not being that demanding.
The final variable that was used to measure job demands was the actual amount of working
hours an employee makes on a weekly basis (how many hours do you work on a weekly
basis) and was measured on a continuous scale. This variable will be referred to as hours work
in the analyses.
Social support
Social support is measured by a single question (how satisfied are you with your present job
in term of working conditions/environment?). Social support was measured on a six point
scale, ranging from not satisfied to fully satisfied. It is assumed that people that are not
satisfied with their working environment receive little social support from their coworkers.
This variable will be referred to as satisfaction working conditions in the analyses.
Skill utilization
Skill utilization was assessed by the amount of training an employee can put into practice
(referred to as value training in the analyses). If an employee receives training, but is not able
to put this into practice he will perceive that he or she is not using all the skills he or she has.
The following question was asked to measure the value of the training: how much has the
training or education contributed to your present work? This was measured on a 4 point scale;
A lot, a fair amount, not very much and not at all.
Wage
The variable wage measured the net monthly salary in euro’s (i.e. what is your net monthly
salary?). The variable was measured on a continuous scale.

34 Jasper Schuurman, 195367
Erasmus University, Rotterdam Health Economics, 2011
Physical demands
Physical demands was measured by the satisfaction level employees have with their working
shifts (referred to as satisfaction shifts in the analyses). If people have demanding working
shift or they at least experience their shifts to be demanding, it is assumed that these people
experience their job to be physically more demanding. Satisfaction with shift was measured
on 6 item scale (i.e. how satisfied are you with your present job in terms of working times?
(day time, night time, shifts)). The range of the scale was from 1 not satisfied to 6 fully
satisfied).
Job insecurity
Job insecurity was measured by means of two variables. The variable satisfaction with job
security was measured by the question: how satisfied are you with your present job in term of
job security? Again the scale ranged from 1 not satisfied to 6 fully satisfied (referred to as
satisfaction job security in the analyses). The second variable measured the type of contract an
employee has (i.e. what type of employment contract do you have in your main job?). This
variable is referred to as contract type in the analyses. Respondents were able to choose
between one of the following contract types: permanent employment, fixed-term contract or
short-term contract, casual work with no contract, some other working arrangement. It was
assumed that the other working arrangement provided less security then the casual work with
no contract.
Moderating variable
Satisfaction with social life
The questions related to the construct of social life were chosen in a way that they covered
different aspect of social life related to the definition in chapter two. Five questions were
identified from the European Household Panel to fit this construct: 1) Are you a member of
any club, such as a sport or entertainment club, a local or neighborhood group, a party, etc.?
Respondents were able to answer yes or no to this question. 2) How often do you talk to any
of your neighbors? The scale consisted of four response categories: On most days, once or
twice a week, once or twice a month, less than once a month and never. 3) How often do you
meet friends or relatives not living with you, whether here at home or elsewhere? Again this
scale consisted of four response categories: On most days, once or twice a week, once or

35 Jasper Schuurman, 195367
Erasmus University, Rotterdam Health Economics, 2011
twice a month, less than once a month and never. 4) How satisfied are you with your current
housing situation? This question was scored on a 6-point rating scale, ranging from 1 not
satisfied to 6 fully satisfied. 5) How satisfied are you with your current amount of leisure
time? This scale consisted of 6 points as well, 1 not satisfied to 6 fully satisfied.
The direction of the scales is different, that is, questions 1 to 3 were in a positive direction,
while question 4 and 5 were in a negative direction. Therefore the first three scales were
converted, so that they have the same direction as the last to scale. The second step was to
adjust the range of the scales, so that each scale has the same starting point and the same end.
For example, if a respondent is a club member the score was adjusted to 6 and if they were
not a club member the score was adjusted to 1. The same was done for question two and
three. The next step was to add the scores, so the scale ranged from 5 (scoring lowest on all
items) to 30 (scoring highest on all items). Finally, for the purpose of this study, respondents
were divided into three groups. The first group, the people least satisfied with their social life,
consisted of the first 25 percent of respondents that had the lowest score, which came down to
a score below 18.75. The second group (50 percent) was the group intermediately satisfied
with their social life, with a score between 18.75 and 24.5. The final 25 percent was the group
of people most satisfied with their social life; these respondents had a score above 24.5.
Control variables
This research controlled for the following variables, where a + indicates that dummy
categories were merged: age (continuous scale), sex (male, female), marital status (Being
married, separated, divorced + widowed and never married), fulltime versus part-time work,
job type (see appendix A), industry type (agriculture, industry, services), sector (private,
public), education (recognized third level education, second stage of secondary level
education and less than second stage of secondary education), expenditure health insurance
(continuous scale) and equivalent household income (household income divided by the square
root of household size). The variable equivalent household income will be used as a proxy for
social economic status.
36 Jasper Schuurman, 195367
Erasmus University, Rotterdam Health Economics, 2011
Method of analysis
In the first stage of analyses, the model is tested in the light of the research objectives. This
means a report on the missing values and a test of the model including all ten confounding
variables. Due to the large amount of variables included in the model and possible missing
values, there is a risk of losing many observations and subsequently a loss of significance
levels of the independent variables. In the analysis the test of this model will be referred to as
testing the full model. The test will be performed by means of an ordered logit regression as
the outcome variable health is a fixed response variable. The equation that will be tested is
yi*= xiβ+εi, where yi
* represents the latent variable, xi the independent variable and εi, the error
term. All the ordered logit regressions will control for the autocorrelation of the error term, as
the data is longitudinal in nature. Because data is obtained from the same individuals over a
period of 8 years, there is a possibility that the error term correlates from one year to another
and therefore has to be taken into account. An examination of the full model will result in the
specification of the final model used for analyses. Based on this final model, analyses will be
performed for four different samples. Sample 1 is the sample including all the observations,
sample 2 is the sample of respondents least satisfied with their social life, sample 3 is the
sample of respondents intermediately satisfied with their social life and sample 4 is the
sample of respondents most satisfied with their social life. In the second stage of analyses,
ordered logit regressions will be run for the four different samples and descriptive statistics
will be discussed which entails:
1) description of the means of the variables, in order to get a first idea of what to expect in
further analyses. The tables are reported in appendix D
2) correlations between the different independent variables by means of Pearson’s correlation
coefficient in order to control for possible collinearity between the different job
characteristics. Correlations found in previous research were between the range of 0.05 and
0.26 (Landsbergis, 1988). The tables are reported in appendix E
3) description of significance levels and joint significance levels (by means of the Wald test
for joint significance) for all the variables.
4) an interpretation of the sign of the variables in the ordered logit regressions. This means
that the variables will be discussed in terms of having a positive or negative effect on the
probability of being in very good health.

37 Jasper Schuurman, 195367
Erasmus University, Rotterdam Health Economics, 2011
In the third stage of analyses, hypotheses 1a till 7a (how job characteristics influence health)
and 1c till 7c (if satisfaction with social life moderates the relationship specified in hypotheses
1a till 7a) will be tested. In order to test whether a job characteristic has a positive or negative
effect on health and whether this is dependent on the satisfaction level with social life,
marginal effects will be determined for the job characteristics. All of the marginal effects will
be performed for the probability of being in very good health. This means testing the
probability that the latent variable yi* equals 1, i.e. P(yi = 1| xi) = P(yi
*< τ1| xi) = F (τ1- xiβ). τ1
is the threshold where, if exceeded, we can no longer believe that the latent variable equals 1.
Two kinds of analyses will be performed in order to assess the marginal effect. For the
variables that are measured on a continuous scale (wage and hours work), we use the formula:
to measure the marginal effect for the four different samples.
The increase of x1 (the independent variable) is associated with an increase or decrease in the
probability of being in very good health, yi*=1, where a positive β is associated with a
increased probability of being in very good health and a negative β with a decreased
probability of being in very good health.
For the job characteristics that are measured on a fixed response scale it is not possible to
measure the marginal effect. In order to test whether a job characteristic has a positive or
negative influence on health, the effect will be computed of of a change from not having
the characteristic to having the characteristic, i.e. P(yi=j| x1i=2, x2, etc) – P(yi=j| x1i=1, x2, etc).
By means of an example for the variable satisfaction with working conditions the method can
be explained best. The changed probability of being in very good health will be determined
for respondents that are fully dissatisfied with their working conditions (response item 1), but
would “actually” be dissatisfied with their working conditions (response item 2). The same
will be done for the other scales: respondents scored 2 but “actually” scored 3 (i.e. P(yi=j|
x1i=3, x2, etc) – P(yi=j| x1i=2, x2, etc), respondents scored 3 but “actually” scored 4 (i.e. P(yi=j|
x1i=4, x2, etc) – P(yi=j| x1i=3, x2, etc), respondents scored 4 but “actually” scored 5 (i.e. P(yi=j|
x1i=5, x2, etc) – P(yi=j| x1i=4, x2, etc), respondents scored 5 but “actually” scored 6 (i.e. P(yi=j|
x1i=6, x2, etc) – P(yi=j| x1i=5, x2, etc) measuring the effect if respondents would actually be
happier with their working conditions.

38 Jasper Schuurman, 195367
Erasmus University, Rotterdam Health Economics, 2011
In addition the effect will be measured if respondents that are fully dissatisfied with their
working conditions (response item 1) would actually be fully satisfied (response item 6), i.e.
P(yi=j| x1i=6, x2, etc) – P(yi=j| x1i=1, x2, etc) . For simplicity, the thesis will also refer to this
test as testing marginal effects. The marginal effects will be calculated for the probability of
being in very good health (scale item one of the variable health, yi*=1). The marginal effect of
the ten independent variables will be determined for all of the four different samples in order
to test hypotheses 1a till 7a and 1c till 7c.
In the final stage of analyses, hypotheses 1b till 7b will be tested, which is the test for
linearity. Two different measurement techniques will be used, depending on whether the job
characteristic is measured on a continuous scale or on a fixed item scale. The variables
measured on a continuous scale will be tested by means of the Wald test. This means that the
variable squared will be added to the equation and tested whether the effect is significant. The
linear or non linear effect of the fixed response variables will be demonstrated by plotting the
point estimates of the marginal effects in a graph, except for the variable job level as there is
only one point estimate. The lack of standard errors prevents to test whether the linearity or
non linearity is statistically significant for this measuring technique. If all the point estimates
in the graph are on the same line, for example all point estimates are 4 percent, it means that
the effect of the job characteristic is linear. Since the shape of the curve (a four percent
increase), if plotted, is the same throughout the entire range of the job characteristic. If the
graph would show a linear increase of for example 2 percent going from one point estimate to
another, it means the effect is not linear, as the point estimates are not the same in this case
throughout the entire range of the job characteristic. After the tests after performed, the results
will be compared with the hypotheses and formally accepted or rejected. Chapter 4 ends with
a discussion of the results.

39 Jasper Schuurman, 195367
Erasmus University, Rotterdam Health Economics, 2011
Results
In appendix B the missing values are reported. The variable health expense had by far the
most missing values, 27398 values were missing. Due to the large amount of missing values,
the full model (i.e. the model including the 10 control variables) was run to see what the effect
will be for further analyses. The results of the ordered logit regression based on the full model
are reported in appendix C. The number of observations used for the full model was 5077,
which means a loss of 37928-5077 = 32851 observations (that is 86% of all observations).
The fact that the full model is estimated on only 14% of the sample is caused by these missing
values. Out of the 31 independent variables (the 31 variables are the dummy variables
included in the model and the continuous variables), 22 variables were insignificant at the 5%
significance level. The AIC statistic for the full model was 9478.421. In terms of testing the
subsamples this means that the subsamples of respondents most satisfied with their social life
and the respondents least satisfied with their social life would contain 1269 observations. The
significance levels of the independent variables in the subsamples had worse scores in
comparison to the full sample. Hence, it was considered that the full model including all the
control variables was not an appropriate model in the light of the research objectives. Due to
the large loss of observations and the high amount of insignificant independent variables in
the full model, several models were run including different sets of control variables in order to
get to the final model used for analyses.

40 Jasper Schuurman, 195367
Erasmus University, Rotterdam Health Economics, 2011
The final model on which subsequent analyses will be based included four out of the ten
control variables (age, sex, ses and sector) and is specified as follow:
Health = βdjob_level1 + βdjob_level2 +βdjob_difficulty1 +βdsatisfaction_workinghours1 +
βdsatisfaction_workinghours2 + βdsatisfaction_workinghours3 +
βdsatisfaction_workinghours4 + βdsatisfaction_workinghours5 + βhours_work +
βdsatisfaction_workcondition1 + βdsatisfaction_workcondition2 +
βdsatisfaction_workcondition3 + βdsatisfaction_workcondition4 +
βdsatisfaction_workcondition5 + βdvalue_training1 + βdvalue_training2 + βdvalue_training3
+ βwage3 + βdsatisfaction_shifts1 + βdsatisfaction_shifts2 + βdsatisfaction_shifts3 +
βdsatisfaction_shifts4 + βdsatisfaction_shifts5 + βdsatisfaction_jobsecurity1 +
βdsatisfaction_jobsecurity2 + βdsatisfaction_jobsecurity3 + βdsatisfaction_jobsecurity4 +
βdsatisfaction_jobsecurity5 + βdcontract_type1 + βdcontract_type2 + βdcontract_type3 +
βage + βdsex1 + βses +βdsector1
The next section will discuss the empirical results of the final model (sample 1) and the three
different subsamples: respondents least satisfied with their social life (sample 2), respondents
intermediately satisfied with their social life (sample 3) and respondents most satisfied with
their social life (sample 4).
41 Jasper Schuurman, 195367
Erasmus University, Rotterdam Health Economics, 2011
Empirical results
Descriptive statistics
The means and correlations are tested for the four different samples. The results of the
different means are mentioned in appendix D, and the correlations in appendix E. Sample 1 is
the full sample based on the final model for analyses. This is the model which has been
derived from the previous section. Samples 2, 3 and 4 are subsamples based on sample 1.
Sample 2 is the subsample of respondents least satisfied with their social life. Sample 3 is the
subsample of respondents intermediately satisfied with their social life and sample 4 is the
subsample of respondents most satisfied with their social life. Sample 1 consists of 29552
observations (77% of all observations), with an AIC statistic of 55493.99. Compared to the
original full model with all ten confounding variables (5077 observations) this is an
improvement of 63% of observations. Sample 2, 3 and 4 respectively contain 7237, 15930 and
6385 observations. Despite the fact that the AIC statistic lowered in the final model, the
model provides a better fit in terms of the research objectives of this thesis, as the significance
levels of the independent variables have better scores. The significance levels of the
independent variables will be discussed at the end of this section.
The distribution of the mean of the variables is the same in all the 4 different samples for the
variables job difficulty, age, sex, sector and contract type. The proportion men to women is
59-41% in all samples. Respondents are on average 39 years old. 72 % of the people in the 4
samples are employed in the private sector. 40% of the people felt that they have the skills to
do a more demanding job, in terms of this thesis that means that 60% of the respondents view
their job as being demanding. 90% of the respondents in all four samples were in permanent
employment, 3% has a fixed term contract, 1% has casual work with no contract and the
remaining respondents have some other working arrangement.

42 Jasper Schuurman, 195367
Erasmus University, Rotterdam Health Economics, 2011
For the variables job level, satisfaction with working hours, hours work, satisfaction with
working conditions, value of training, wage, satisfaction with shifts, satisfaction job security
and social economic status the distribution of the mean of the variables differed from one
sample to another. Respondents in sample 1 and 3 on average work 36 hours a week, while
respondents least satisfied with their social life (sample 2) work 38 hours a week and people
most satisfied with their social life (sample 4) work 35 hours a week. The respondents
working most hours in sample 2 are also least satisfied with the amount of working hours (8
% scored fully unsatisfied or unsatisfied as opposed to 2% for the respondents working 35
hours a week). Respondents least satisfied with their social life have more supervisory jobs
(14% is in supervisory jobs, as opposed to 11% for the people most satisfied with their social
life and 13% for the full sample). Similar results are found for the variables satisfaction
working conditions (10 % is fully unsatisfied or unsatisfied with the working conditions in
sample 2 as opposed to 5% in sample 4), satisfaction shifts (6 % is fully unsatisfied or
unsatisfied with their working shifts in sample 2 as opposed to 2% in sample 4) and
satisfaction job security (10 % is fully unsatisfied or unsatisfied with their job security in
sample 2 as opposed to 5% in sample 4). Respondents in sample 1 and 3 felt that they were
able to put the skills of training into practice (65% answered that the training received
contributed a lot to their work). In sample 2 this amount was slightly lower 62% and in
sample and in sample 4 slightly higher 67%. The social economic status of respondents in
sample 1 is 2848, 24. The social economic status of people least satisfied with their social life
is lower 2770,396 and for the people most satisfied with their social life higher 2870, 845.
Correlations between the different job characteristics were low in general and comparable
across the different samples. The highest correlation found was 0.5114, which was between
people highly unsatisfied with their working hours and people that were highly unsatisfied
with their shifts in sample 4. The correlations are comparable to those found in previous
research (Landsbergis, 1988).

43 Jasper Schuurman, 195367
Erasmus University, Rotterdam Health Economics, 2011
Now that the different samples are described and the correlations are tested, we can run the
ordered logit regressions for the four different samples. The results of the different ordered
logit regressions are mentioned in appendix F. Out of the 31 independent variables in sample
1, 11 variables were insignificant at the 5% significance level, from which 8 were related to
the variables satisfaction with shifts (5 dummy categories included in the sample) and contract
type (three dummy categories included in the sample). The other three variables that were
insignificant are job level2 (respondents with intermediate jobs), satisfaction working hours1
(respondents fully dissatisfied with the amount of working hours) and value training3
(respondents that feel the training did not contributed a lot to their work). These variables
remained insignificant in sample 2, 3 and 4, except for the variable contract type2
(respondents with fixed term contracts), which became significant at the 5% significance level
for the respondents most satisfied with their social life.
In sample 2, the respondents least satisfied with their social life, the variables job difficulty,
satisfaction working hours5 (respondents highly satisfied with their working hours),
satisfaction job security2 (respondents highly dissatisfied with their job security) and
satisfaction job security5 (respondents highly satisfied with their job security) became
insignificant. In sample 3, the respondents intermediately satisfied with their social life, the
variables satisfaction working hours2 (respondents highly dissatisfied with their working
conditions), satisfaction working conditions5 (respondents highly satisfied with their working
conditions) and value training2 (respondents that feel the training contributed a fair amount to
their work) became insignificant. Finally, in sample 4, the respondents most satisfied with
their social life, the variables satisfaction working hours 2, 3, 4 and 5, satisfaction working
conditions 5, wage and satisfaction job security 4 became insignificant.
From the ordered logit regression, the magnitude of the effect cannot be derived, however the
sign can be interpreted, which provides a first idea of how the variables impact on health. In
sample 1 the probability of being in very good health increases when respondents are male,
when respondents are in supervisory positions, people feel their job is demanding, when
respondents are working more hours, when the training received contributed a lot or a fair
amount, when their wage goes up, when they are in fixed term contracts or casual contracts,
when their social economic status goes up and when they work in the private sector. In all the
other occasions the probability of being in very good health decreased.

44 Jasper Schuurman, 195367
Erasmus University, Rotterdam Health Economics, 2011
For the other samples, results will be discussed when the effect is different in comparison to
sample 1. For the respondents least satisfied with their social life (sample 2), the probability
of being in very good health increased when the value of training did not contributed very
much, when they were really dissatisfied with the shifts they are working and when they are
satisfied with the shifts they are working. The probability of being in very good health,
however, decreased when working in the private sector. For the respondents intermediately
satisfied with their social life (sample 3), the probability of being in very good health only
changed for having a fixed term contract (it decreases the probability of being in very good
health instead of increases in comparison to sample 1). For the respondents most satisfied
with their social life, the probability of being in very good health increases when people are in
intermediate jobs and when respondents are in fixed term contracts.
Before we can proceed towards testing the marginal effects for the different sample, we need
to run one more final test. For the continuous variables and the fixed response variables
measured on a 2 point scale the significance levels can be derived from the ordered logit
regression. For the fixed response variables measured on more than a 2 point scale, joint
significance tests are needed in order to determine whether the variable is jointly significant
or not. Hence, before testing the marginal effects of the variables, the fixed response variables
measured on a 3 point scale or more are tested for joint significance. The following variables
are tested for joint significance: job-level, satisfaction with working hours, satisfaction with
working conditions, value training, satisfaction job security, satisfaction-shifts and contract-
type. The variable satisfaction with shifts was jointly insignificant in all four samples. The
variable contract type was insignificant in three out of the four samples. The variables value
training, job level and satisfaction working hours was insignificant in 1 out of the 4 different
samples.

45 Jasper Schuurman, 195367
Erasmus University, Rotterdam Health Economics, 2011
satisfaction with working conditions prob>chi2 value training prob>chi2
sample 1 0.0000 sample 1 0.0000 sample 2 0.0000 sample 2 0.0717 sample 3 0.0000 sample 3 0.0003 sample 4 0.0001 sample 4 0.0223 satisfaction job security prob>chi2 contract type prob>chi2 sample 1 0.0000 sample 1 0.1427 sample 2 0.0351 sample 2 0.9304 sample 3 0.0000 sample 3 0.4148 sample 4 0.0002 sample 4 0.0331 job level prob>chi2 satisfaction with shifts prob>chi2 sample 1 0.0025 sample 1 0.2567 sample 2 0.0257 sample 2 0.4308 sample 3 0.0755 sample 3 0.5210 sample 4 0.1416 sample 4 0.6384 satisfaction with working hours prob>chi2 sample 1 0.0000 sample 2 0.0050 sample 3 0.0301 sample 4 0.5962 Table 3: test for joint significance
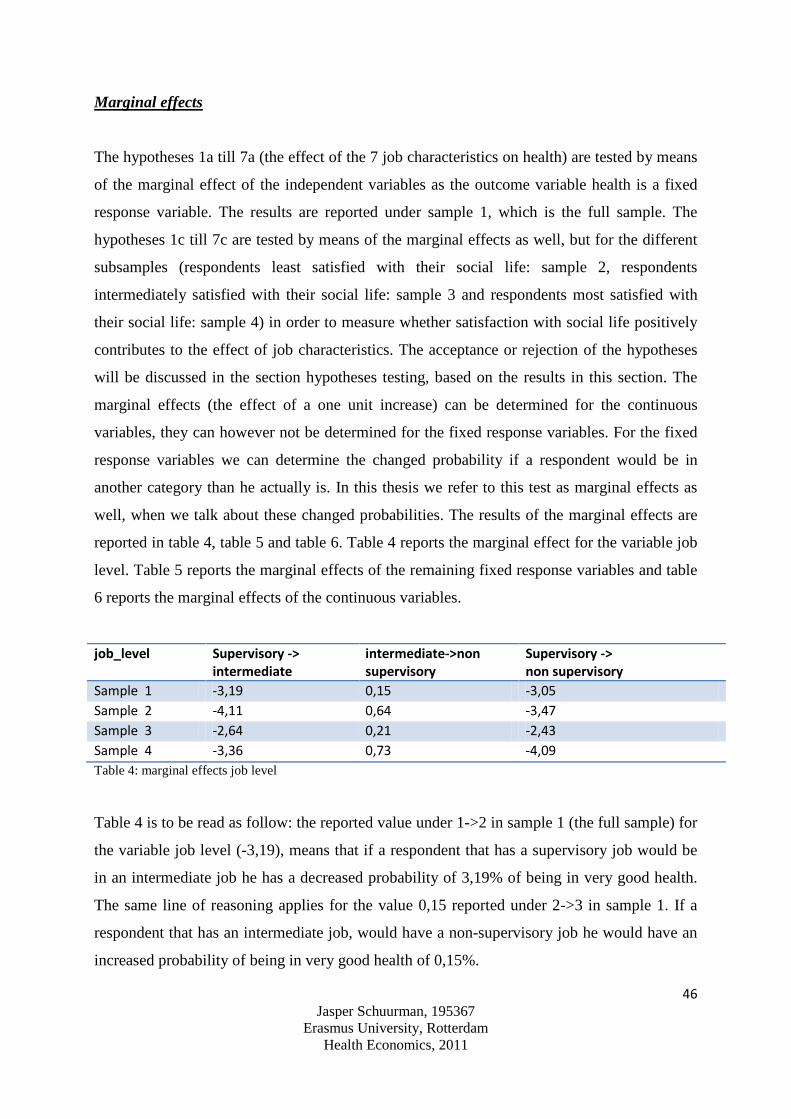
46 Jasper Schuurman, 195367
Erasmus University, Rotterdam Health Economics, 2011
Marginal effects
The hypotheses 1a till 7a (the effect of the 7 job characteristics on health) are tested by means
of the marginal effect of the independent variables as the outcome variable health is a fixed
response variable. The results are reported under sample 1, which is the full sample. The
hypotheses 1c till 7c are tested by means of the marginal effects as well, but for the different
subsamples (respondents least satisfied with their social life: sample 2, respondents
intermediately satisfied with their social life: sample 3 and respondents most satisfied with
their social life: sample 4) in order to measure whether satisfaction with social life positively
contributes to the effect of job characteristics. The acceptance or rejection of the hypotheses
will be discussed in the section hypotheses testing, based on the results in this section. The
marginal effects (the effect of a one unit increase) can be determined for the continuous
variables, they can however not be determined for the fixed response variables. For the fixed
response variables we can determine the changed probability if a respondent would be in
another category than he actually is. In this thesis we refer to this test as marginal effects as
well, when we talk about these changed probabilities. The results of the marginal effects are
reported in table 4, table 5 and table 6. Table 4 reports the marginal effect for the variable job
level. Table 5 reports the marginal effects of the remaining fixed response variables and table
6 reports the marginal effects of the continuous variables.
job_level Supervisory -> intermediate
intermediate->non supervisory
Supervisory -> non supervisory
Sample 1 -3,19 0,15 -3,05 Sample 2 -4,11 0,64 -3,47 Sample 3 -2,64 0,21 -2,43 Sample 4 -3,36 0,73 -4,09 Table 4: marginal effects job level
Table 4 is to be read as follow: the reported value under 1->2 in sample 1 (the full sample) for
the variable job level (-3,19), means that if a respondent that has a supervisory job would be
in an intermediate job he has a decreased probability of 3,19% of being in very good health.
The same line of reasoning applies for the value 0,15 reported under 2->3 in sample 1. If a
respondent that has an intermediate job, would have a non-supervisory job he would have an
increased probability of being in very good health of 0,15%.

47 Jasper Schuurman, 195367
Erasmus University, Rotterdam Health Economics, 2011
If a respondent that has a supervisory job would actually have a non-supervisory job he has a
decreased probability of 3,05% to be in very good health. Sample 2 estimates the same
probabilities as sample 1, but sample 2 estimates the marginal effects for the subsample of
respondents least satisfied with their social life. Sample 3 estimates the probabilities for the
people intermediately satisfied with their social life and sample 4 estimates the probabilities
for the respondents most satisfied with their social life. In all the different samples if
respondents that have supervisory jobs would have intermediate jobs or non-supervisory jobs,
respondents have a decreased probability of being in very good health. The probability of
being in very good health increases if respondents that have intermediate jobs would actually
have non-supervisory jobs, except for the respondents most satisfied with their social life,
who experience a decreased probability of being in very good health. The effect is strongest
for respondents most satisfied with their social life and lowest for the respondents
intermediately satisfied with their social life.
Job difficulty
Qualifications to do more demanding job -> no qualifications to do more demanding job
Sample 1 -2,27 Sample 2 -1,11 Sample 3 -2,37 Sample 4 -3,26 Value training
a lot -> fair amount
fair amount-> not very much
not very much-> not at all
a lot-> not at all
Sample 1 -1,67 -2,07 0,29 -3,45 Sample 2 -0,45 -1,44 -1,08 -2,96 Sample 3 -2,38 -1,48 0,50 -3,36 Sample 4 -1,64 -4,19 1,93 -3,90 Contract type
permanent employment -> fixed term
fixed term-> casual work
casual work-> other type
permanent employment-> other type
Sample 1 1,72 3,83 -4,61 0,93 Sample 2 0,95 1,32 -1,73 0,54 Sample 3 0,44 3,65 -2,34 1,75 Sample 4 7,04 6,41 13,50 -0,05

48 Jasper Schuurman, 195367
Erasmus University, Rotterdam Health Economics, 2011
satisfaction jobsecurity
fully unsatisfied - >unsatisfied
unsatisfied -> slightly satisfied
slightly satisfied -> satisfied
satisfied -> highly satisfied
highly satisfied - > fully satisfied
not satisfied ->fully satisfied
Sample 1 2,78 0,59 0,55 1,41 2,84 8,18 Sample 2 3,69 -0,99 1,27 0,51 2,05 6,52 Sample 3 1,47 1,51 -1,20 2,21 2,78 6,77 Sample 4 3,87 0,56 4,81 -0,37 3,24 12,11 satisfaction working hours
fully unsatisfied - >unsatisfied
unsatisfied -> slightly satisfied
slightly satisfied -> satisfied
satisfied -> highly satisfied
highly satisfied - > fully satisfied
not satisfied ->fully satisfied
sample 1 -0,70 0,93 1,26 1,49 1,91 4,88 sample 2 -3,02 2,09 0,82 2,69 0,59 3,17 sample 3 1,52 -0,71 1,02 0,42 2,60 4,84 sample 4 3,42 2,82 0,80 1,01 0,79 8,82 satisfaction working shifts
fully unsatisfied - >unsatisfied
unsatisfied -> slightly satisfied
slightly satisfied -> satisfied
satisfied -> highly satisfied
highly satisfied - > fully satisfied
not satisfied ->fully satisfied
Sample 1 0,97 1,15 0,75 0,02 1,07 3,98 Sample 2 -2,88 0,44 2,40 -1,32 0,52 -0,84 Sample 3 3,75 0,84 -0,86 0,82 0,85 5,40 Sample 4 5,35 1,99 1,37 -0,29 1,50 9,92 satisfaction working conditions
fully unsatisfied - >unsatisfied
unsatisfied -> slightly satisfied
slightly satisfied -> satisfied
satisfied -> highly satisfied
highly satisfied - > fully satisfied
not satisfied ->fully satisfied
Sample 1 2,10 2,39 2,02 3,02 2,58 12,12 Sample 2 2,10 0,95 2,75 1,09 4,19 11,09 Sample 3 2,18 2,98 1,40 3,75 1,86 12,16 Sample 4 2,20 2,85 1,88 3,24 2,29 12,46 Table 5: marginal effects fixed response variables
For the variable job difficulty all respondents experience a decreased probability of being in
very good health if people that do not have demanding jobs would actually have demanding
jobs, this is not dependent on whether people are more or less satisfied with their social life.
The percentage increased probability however does change, depending on the satisfaction
level with social life. People most satisfied with their social life experience the highest
decreased probability of being in very good health, while respondents least satisfied with their
social life the lowest decrease.

49 Jasper Schuurman, 195367
Erasmus University, Rotterdam Health Economics, 2011
As can be observed from table 5, many times the direction of the probabilities are in the same
direction in all the different samples, the magnitude of the effect is however different among
the samples. If respondents that feel that their training has positively contributed to their work
would actually feel that the training had less contribution to their work, they have decreased
probabilities of being in very good health in general. In the situation where respondents feel
that the training did not contributed very much to their work, would actually feel that the
training did not contributed at all; respondents would have an increased probability of being
in very good health. Except for the people least satisfied with their social life, they would
experience a decreased probability of being in very good health. The effect is again strongest
for the people most satisfied with their social life.
People in a permanent employment would experience an increased probability of being in
very good health if they would be in fixed term contracts and respondents with fixed term
contracts would experience a increasing probability of being in very good health if they would
have causal contracts. This sign of the effect is not contingent on the satisfaction level with
social life of the respondents. The magnitude of the effect is strongest among the people that
are most satisfied with their social life and smallest for the respondents least satisfied with
their social life. People that are in casual contracts experience a decreased probability of being
in very good health if they would be in another type of contract, the effect is again strongest
for the people most satisfied with their social life.
Respondents that are dissatisfied with their job security would experience an increased
probability of being in very good health if they would actually be more satisfied with the
amount of job security they experience. This effect is strongest for the people most satisfied
with their social life. The sample of respondents that are most satisfied with their social life
and who are fully dissatisfied with the amount of job security would even experience a
increased probability of 12% of being in very good health if they would be fully satisfied with
the amount of job security offered. Only in two occasions could respondents experience a
decreased probability of being in very good health, depending on the satisfaction level with
social life.

50 Jasper Schuurman, 195367
Erasmus University, Rotterdam Health Economics, 2011
For the satisfaction with the amount of working hours, satisfaction with shifts and satisfaction
with work conditions, a similar pattern can be observed. If respondents would be happier with
their working hours, shifts or working conditions, they would have an increased probability of
being in very good health. Depending on the satisfaction level with social life of the
respondent the effect can be stronger (the effect is strongest for people most satisfied with
their social life). The respondents least satisfied with their social life, however, would
experience a decreased probability of being in very good health when they are fully
dissatisfied with the amount of working hours or shifts and actually would be dissatisfied with
the amount of working hours.
hours work effect p value
sample 1 0,1500 0,000 sample 2 0,1391 0,000 sample 3 0,1800 0,000 sample 4 0,2000 0,000 wage sample 1 0,000392 0,000 sample 2 0,000305 0,000 sample 3 0,000450 0,000 sample 4 0,000410 0,000 Table 6: marginal effects continuous variables
For the variable hours work, an increasing probability of being in very good health is
observed as respondents work more hours and this is not dependent on whether people are
more or less satisfied with their social life. The effect is, however, stronger for respondents
most satisfied with their social life. People, most satisfied with their social life, have an
increased probability of 0,2% of being in very good health when they work an additional hour
as opposed to 0,14% for the respondents least satisfied with their social life. The effect is
smallest for the respondents least satisfied with their social life.
Respondents experience increasing probabilities of being in very good as they their wage goes
up. The effect is strongest for the respondents intermediately satisfied with their social life,
these people have an increased probability of being in very good health of 0,000450% when
they earn an additional euro. Again the effect is smallest for the respondents least satisfied
with their social life.

51 Jasper Schuurman, 195367
Erasmus University, Rotterdam Health Economics, 2011
Test for linearity
The main difference between the JDCS model and the vitamin model is the linear behavior of
the job characteristics. The JDCS model assumes linear effects of the job characteristics,
while the vitamin model does not. This section tests hypotheses 1b till 7b, whether the effect
of the job characteristics is linear or curvilinear. The acceptance or rejection of the hypotheses
will be discussed in the next section, based on the results in this section. The linearity of the
fixed response variables is demonstrated by means of a graph and the linearity of the
continuous variables will be tested by means of the Wald test. A job characteristic with fixed
response items is supposed to have a linear effect on health when all the point estimates of the
marginal effects (tested in the previous section) are on the same line, which means that the
effect is constant throughout the entire scale, for example all point estimates are 4 percent.
The graphs for the variables job-level and satisfaction with working hours are reported in this
section, while the remaining graphs for the other fixed response variables can be found in
appendix G.
Job-level
Figure 5: test for linearity job level
For the variable job level, three marginal effects were estimated, from which two are relevant
for testing the effect of linearity. The first marginal effect (under point 1 on the x-axis) is the
changed probability of being in very good health of an individual that has a supervisory job
and would actually have an intermediate job. The second marginal effect (under point 2 on the
x-axis) is the changed probability of being in very good health of an individual that has an
intermediate job and would actually have a non supervisory job. The third marginal effect, the
changed probability of being in very good health of respondents that have supervisory jobs
and would actually have non-supervisory jobs, is not taken as a point estimate in this graph.
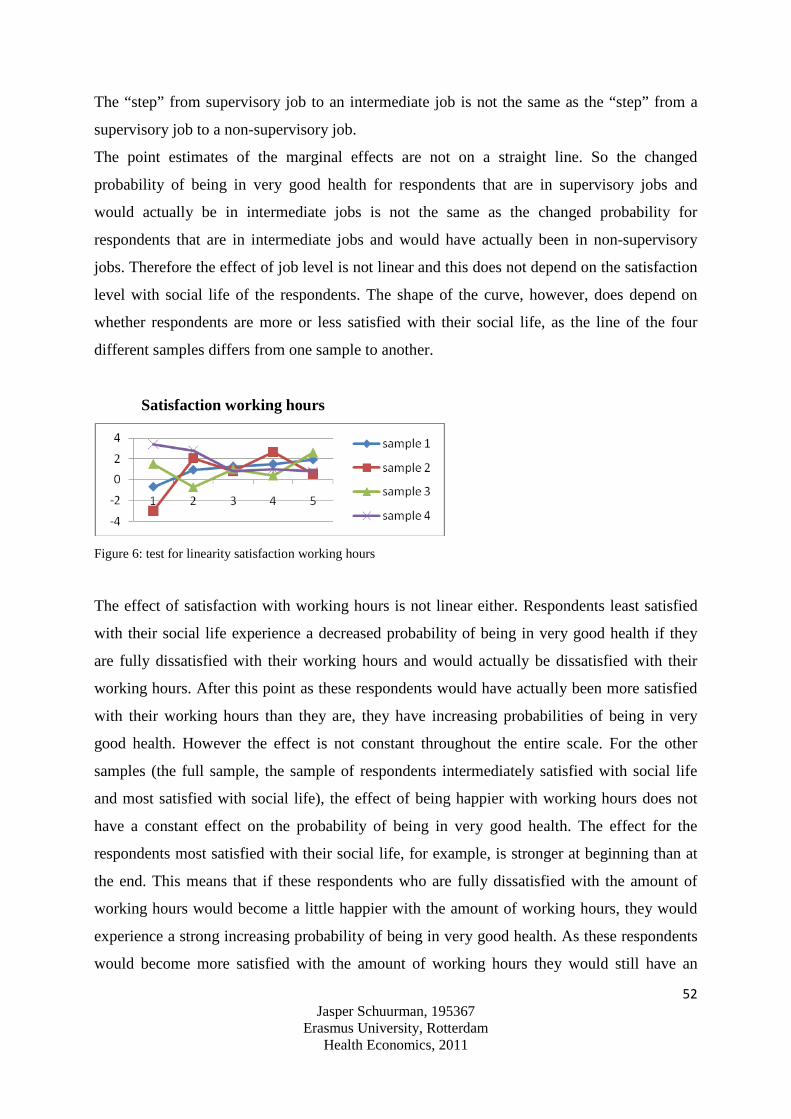
52 Jasper Schuurman, 195367
Erasmus University, Rotterdam Health Economics, 2011
The “step” from supervisory job to an intermediate job is not the same as the “step” from a
supervisory job to a non-supervisory job.
The point estimates of the marginal effects are not on a straight line. So the changed
probability of being in very good health for respondents that are in supervisory jobs and
would actually be in intermediate jobs is not the same as the changed probability for
respondents that are in intermediate jobs and would have actually been in non-supervisory
jobs. Therefore the effect of job level is not linear and this does not depend on the satisfaction
level with social life of the respondents. The shape of the curve, however, does depend on
whether respondents are more or less satisfied with their social life, as the line of the four
different samples differs from one sample to another.
Satisfaction working hours
Figure 6: test for linearity satisfaction working hours
The effect of satisfaction with working hours is not linear either. Respondents least satisfied
with their social life experience a decreased probability of being in very good health if they
are fully dissatisfied with their working hours and would actually be dissatisfied with their
working hours. After this point as these respondents would have actually been more satisfied
with their working hours than they are, they have increasing probabilities of being in very
good health. However the effect is not constant throughout the entire scale. For the other
samples (the full sample, the sample of respondents intermediately satisfied with social life
and most satisfied with social life), the effect of being happier with working hours does not
have a constant effect on the probability of being in very good health. The effect for the
respondents most satisfied with their social life, for example, is stronger at beginning than at
the end. This means that if these respondents who are fully dissatisfied with the amount of
working hours would become a little happier with the amount of working hours, they would
experience a strong increasing probability of being in very good health. As these respondents
would become more satisfied with the amount of working hours they would still have an
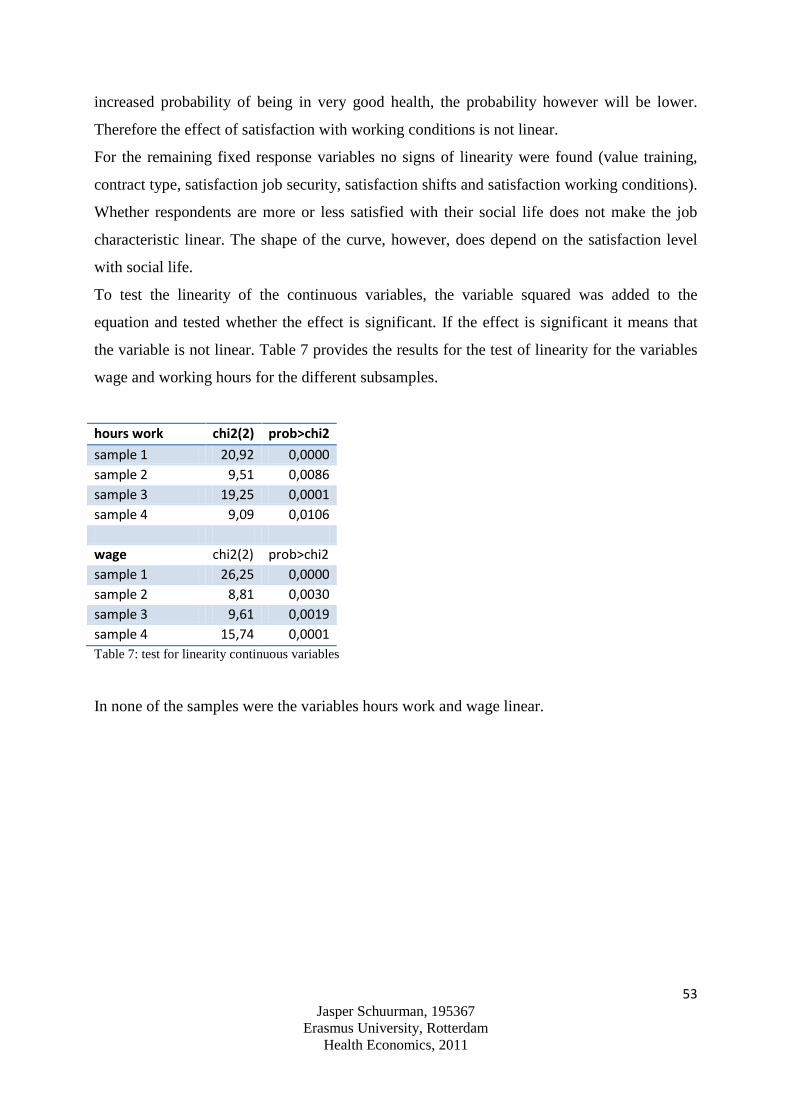
53 Jasper Schuurman, 195367
Erasmus University, Rotterdam Health Economics, 2011
increased probability of being in very good health, the probability however will be lower.
Therefore the effect of satisfaction with working conditions is not linear.
For the remaining fixed response variables no signs of linearity were found (value training,
contract type, satisfaction job security, satisfaction shifts and satisfaction working conditions).
Whether respondents are more or less satisfied with their social life does not make the job
characteristic linear. The shape of the curve, however, does depend on the satisfaction level
with social life.
To test the linearity of the continuous variables, the variable squared was added to the
equation and tested whether the effect is significant. If the effect is significant it means that
the variable is not linear. Table 7 provides the results for the test of linearity for the variables
wage and working hours for the different subsamples.
hours work chi2(2) prob>chi2
sample 1 20,92 0,0000 sample 2 9,51 0,0086 sample 3 19,25 0,0001 sample 4 9,09 0,0106 wage chi2(2) prob>chi2 sample 1 26,25 0,0000 sample 2 8,81 0,0030 sample 3 9,61 0,0019 sample 4 15,74 0,0001 Table 7: test for linearity continuous variables
In none of the samples were the variables hours work and wage linear.

54 Jasper Schuurman, 195367
Erasmus University, Rotterdam Health Economics, 2011
Hypotheses testing
This section formally tests the hypotheses formulated in chapter 2, based on the outcomes in
the previous two sections. The first set of hypotheses, 1a till 7a, covered the effects of the job
characteristics on health and the results were reported under sample 1 in tables 4 till 7.
It was hypothesized that increasing amounts of job autonomy has a positive influence on
health. Job autonomy, measured by the variable job level, had a positive effect on health at
first. If respondents with supervisory jobs, would actually have intermediate jobs (a decrease
in job autonomy), they have a decreased probability of being in very good health. The effect
of job autonomy later on became negative. That is, if respondents with intermediate jobs,
would actually have non supervisory jobs (a decrease in job autonomy), they have an
increased probability of being in very good health. The effect of job autonomy is however not
solely positive, therefore hypothesis 1a is partially rejected. The next section will go into
more depth on this result.
The job characteristic job demands was measured by means of three different variables: job
difficulty, satisfaction with working hours and hours work. It was hypothesized that
increasing amounts of job demands had a negative effect on health. Respondents had a
decreased probability of being in very good health, when they did not feel they could do a
more demanding job (i.e. job demands are high), when they work more hours (i.e. job
demands are high) and when they were more satisfied with their job demands (i.e. job
demands are high). Therefore, hypothesis 2a is accepted. The fact that hours work was not in
the hypothesized direction will be discussed in the next section and does not change the
acceptance of the hypothesis.
Social support, measured by the variable satisfaction working conditions, had a positive effect
on health. As respondents would become more satisfied with their working conditions than
they actually are they had an increased probability of being in very good health. We accept
hypothesis 3a, that increasing amounts of social support has a positive influence on health.
The job characteristic skill utilization, measured by the variable value training, had a positive
effect on health. As respondents felt that their training contributed less to their work, they had
decreased probabilities of being in very good health. Therefore hypothesis 4a is accepted.
55 Jasper Schuurman, 195367
Erasmus University, Rotterdam Health Economics, 2011
Salary, measured by the variable wage, was in the hypothesized direction. As the wage of the
respondents increases, they have increasing probabilities of being in very good health.
Hypothesis 5a is therefore accepted.
The job characteristic physical demands, measured by the variable satisfaction shifts, had a
positive effect on health. As respondents would become more satisfied with their shifts, they
experience increasing probabilities of being in very good health. Hypothesis 6a is therefore
accepted, that increasing amounts of physical demands have detrimental effects on health.
Job insecurity was measured by means of two variables: contract type and satisfaction
working conditions. It was hypothesized that increasing amounts of job insecurity have
detrimental effects on health. The results found were mixed. The variable contract type
showed an increasing probability of being in very good health as the job security increases.
Except for the response category other contract type. It cannot, however, be ruled out that the
other contract type provides more job security than casual work with no contract and that the
assumption made before has been incorrect. The variable satisfaction job security was in the
hypothesized direction. As respondents would become more satisfied with the amount of job
security offered they would have increasing probabilities of being in very good health.
Hypothesis 7a is therefore accepted. In the next section the variable contract type will be
discussed and it will be shown why the hypothesis is accepted.
The second set of hypotheses, 1b till 7b, was related to the linear or curvilinear effect of the
job characteristic on health. It was hypothesized that all of the 7 job characteristics have a
linear effect on health. Out of the ten variables tested, the variable satisfaction with working
conditions (social support) was the only variable that showed signs of linearity. Therefore
hypotheses 3b is accepted, the remaining hypotheses 1b, 2b and 4b till 7b are rejected. The
job characteristics that were not linearly related to health, however, did not follow the pattern
described by the vitamin model either (see figures 5, 6 and appendix G). The biggest effects
of the job characteristics were not always observed at the beginning of the scale, as predicted
by the vitamin model.

56 Jasper Schuurman, 195367
Erasmus University, Rotterdam Health Economics, 2011
The final set of hypotheses was related to the moderating effect of satisfaction with social life
between the relationship of job characteristics and health. It was hypothesized that employees
who are more satisfied with their social life experience bigger health benefits from having
more job autonomy, social support, skill utilization and salary, than individuals that are not
satisfied with their social life. And it was hypothesized that employees who are more satisfied
with their social life experience less adverse health effects from having more job demands,
more physical demands and more job insecurity, than individuals that are not satisfied with
their social life. Hypotheses 1c, 3c and 4c are accepted, increasing amounts of job autonomy,
social support and skill utilization have the most beneficial effects on people that are more
satisfied with their social life. Hypothesis 5c is rejected, increasing amounts of salary have the
most beneficial effects on people intermediately satisfied with their social life. Hypotheses 2c,
6c and 7c were rejected. Increasing amounts of job demands, physical demands and job
insecurity had the most detrimental effects on respondents most satisfied with their social life,
as can be observed from the fact that these respondents had the highest probability of being in
very good health as the amount of job demands, physical demands and job insecurity
decreases. It seems that the effect of the job characteristic is strongest for the respondents
most satisfied with their social life and weakest for the respondents least satisfied with their
social life. This means that if a job characteristic has a negative influence on health, the effect
was most negative for the respondents most satisfied with their social life and vice versa.

57 Jasper Schuurman, 195367
Erasmus University, Rotterdam Health Economics, 2011
Discussion of the results
This section will discuss the analyses performed in this thesis and identify several
methodological issues related to the analyses performed. The second part of this section will
discuss several unexplored theoretical issues, which have been found to be important in
studying the relationship between job characteristics and health.
Before testing the effect of the job characteristics on health, correlations between the different
job characteristics were tested. The results showed that none of the different job
characteristics showed high correlations with one another. The results of the regression
analyses provided results that in general were highly significant. However, not all the job
characteristics were significant in all samples. In sample 1 only two out of the ten variables
were not significant: satisfaction with shifts and contract type. In sample two, the subsample
of individuals least satisfied with their social life, three out the ten job characteristics were
insignificantly related to health: job difficulty, satisfaction with shifts and contract type.
Sample 3, the subsample of people intermediately satisfied with their social life, found the
same variables to be insignificant as sample 1. Sample 4, the subsample of people most
satisfied with their social life, obtained most insignificant effects of the different job
characteristics on health. Four out of the ten job characteristics were insignificantly related to
health: wage, job-level, satisfaction working hours and satisfaction with shifts.
In the next stage the effects of the job characteristics on health were tested. For the fixed
response variables, this meant testing the increased or decreased probability of being in very
good health as a person that is in one response category would have actually been in another.
For the continuous variables this meant testing the marginal effect on health. The results
obtained for the different variables were mainly in the hypothesized direction for the first set
of hypotheses, 1a till 7a. Only hypothesis 1 a was partially rejected. Decreasing amounts of
job autonomy, at first, led to decreasing probabilities of being in very good health. Later on,
decreasing amounts of job autonomy led to increasing probabilities of being in very good
health. This result could be the consequence of the way the variable was measured. It can very
well be that respondents in intermediate jobs have less autonomy in comparison to the
decisions they have to make than people in non supervisory jobs. The remaining hypotheses
2a till 7a were all accepted, even though not all variables in hypotheses 2a and 7a obtained
results that were not in line with the hypothesized relationship.

58 Jasper Schuurman, 195367
Erasmus University, Rotterdam Health Economics, 2011
Hypothesis 2a measured the effect of job demands on health. The variables job difficulty and
satisfaction working hours were in the hypothesized relationship, while hours work was not.
Increasing amounts of working hours led to increased probabilities of being in very good
health, as opposed to what was hypothesized. It could be that not the actual amount of
working hours is a source of strain, but the satisfaction level with the amount of working
hours is a source of strain. Some people might enjoy working long hours, while others do not
and this is not measured by a construct like hours work as opposed to satisfaction working
hours which captures this dimension. In hypothesis 7a, the variable contract type was not in
the hypothesized direction, while the variable satisfaction job security was. The variable
contract type was insignificant in 3 out of the 4 samples, besides it could be that the variable
contract type does not measure the real job security provided to the employee. Again it is the
perceived job security that causes strain and subsequent bad health effects, something
captured by the variable satisfaction job security. More research is needed to distinguish
between the effect of “objective” job characteristics measures and the effect on health and
“subjective” measures and the effect on health.
The second set of hypotheses measured the linear or non linear behavior of job characteristics
on health. All hypotheses were rejected, accept for hypothesis 3b, the effect of social support
which has a linear effect on health. The remaining variables did not follow the pattern
described by the vitamin model either. It could be the case that underlying causal mechanisms
have caused these results. Factors like time span (the time it takes before adverse health
effects caused by job characteristics become visible) and individual differences (differences in
health behaviors and physical changes caused by strain) could affect the relationship and
when controlling for such factors the relationship could be become linear as described by the
JDCS model or non linear as described by the vitamin model. More research is needed in
order to conclude whether the effect of job characteristics on health is linear or curvilinear.
59 Jasper Schuurman, 195367
Erasmus University, Rotterdam Health Economics, 2011
The final set of hypotheses described the effect of satisfaction with social life on relationship
between job characteristics and health, which is the central research question of this thesis. It
was found that satisfaction with social had an influence on the relationship between job
characteristics and health, but not as was hypothesized in hypotheses 1c till 7c. It was
hypothesized that employees most satisfied with their social life will have bigger health
benefits from having more job autonomy, social support, skill utilization and wage, and
experience less adverse health effects from having more job demands, physical demands and
job insecurity. It was found that employees most satisfied with their social life react stronger
on all job characteristic dimension, than employees least satisfied with their social life, except
for the job characteristic wage. At this stage, we can only speculate as to why employees most
satisfied with their social life show stronger responses on changes in the working
environment. It could be the case that these employees experience bigger changes in their
lives, when job characteristics change in favorable or unfavorable ways as opposed to
employees least satisfied with their social lives. Another explanation could be that employees
least satisfied with their social lives in general are more apathetic and for this reason show
less reaction to changes in their working environment. More research is needed in order to
explain, why respondents most satisfied with their social lives react stronger to changes in the
working environment.
There are several theoretical issues, which have not been discussed up to this point, but are
important when studying the relationship between job characteristics and health. The first
issue is the strain hypothesis put forward by the JDCS model. The JDCS model predicts that it
is especially the combination of high job demands, low control and low support that leads to
bad health outcomes. Therefore it was tested what the changed probability is if individuals
that have high job demands, low control and low support would have actually had low job
demands, high control and high social support for all different samples. Respondents in the
sample 1 in this case would have a increased probability of 18% to be in very good health,
16% for sample 2, 17 % for sample 3 and 20 % for sample 4. These scores are considerably
higher than the scores found in this research. Future should therefore continue to focus on the
strain hypothesis, when examining the relationship between job characteristics and health.
60 Jasper Schuurman, 195367
Erasmus University, Rotterdam Health Economics, 2011
A second issue of studying the effect of job characteristics on health is the time span it takes
before the adverse health effects become visible. Scientific literature seems to support cross
lagged effects of job characteristics on health. Theorell et al. focused on changes in the
psychosocial work environment by comparing the levels of job characteristics ten years
before and one year before the first myocardial infarction in a case referent study. A decrease
in job control during the 10 years preceding the infarction was associated with increased risk.
Corresponding results were not obtained in relation to job demands (Vahtera et al., 2000).
LaCroix (1984) in his research, however, did found effects for job demands. De Jonge et al.
(2001) found that time one job characteristics (job demands, control and social support)
influence time two psychological well-being. It could be possible that the respondents in this
study have experienced different time spans in which they are exposed to the positive or
negative effect of the job characteristics. This could explain why the relationship between job
characteristics and health did not follow the pattern described by either the JDCS model or the
vitamin model.
The final issue is whether there are individual differences for the relationship between job
characteristics and health. Several researchers have demonstrated differences among
individuals with regard to health behaviors resulting from increased stress experienced by
negative job characteristics. Men are more likely to increase their smoking patterns, even
though this result is not found by al studies, while women seem to `relief` stress by increased
fat intake (Hellerstedt and Jeffery, 1997). In addition to differences in sex, personality traits
have been found to be related to increased risks of burnout. The study of Boyle et al. among
critical care nurses showed that personality hardiness and ways of coping were related to
burnout. Hardy persons have a higher sense of commitment to work and self and feel a greater
sense of control over their lives, viewing stressors as potential opportunities for change
(Jansen et al., 1996). Future research could try to find out to what extend these individual
differences affect the relationships found in this research.

61 Jasper Schuurman, 195367
Erasmus University, Rotterdam Health Economics, 2011
To summarize, this research has shown that the satisfaction level with social life moderates
the relationship between job characteristics and health. This section has, however also shown
that there are many factors which should be taken into account when studying the complex
relationship between job characteristics and health. It seems that the results of this thesis will
make the debate of the effect of job characteristics on health more complex than it already
was.

62 Jasper Schuurman, 195367
Erasmus University, Rotterdam Health Economics, 2011
Conclusion & limitations
The aim of this research was to test the moderating effect of satisfaction with social life on the
relationship between job characteristics and health. In recent years there has been a change in
the relationship between organizations and their employees. Traditional job redesign
programs have yet not been able to counteract the effect of increased stress levels employees’
experience. Besides, research has not universally demonstrated that such policies are indeed
successful. Due to the increased demands of working life and stress, employees are
experiencing difficulty in balancing their social life with their working life. Even though new
initiatives are developed by companies (partially inspired by legislation), to get to more
family friendly policies, balancing social life and working life in general is still seen as the
major responsibility of the employee and not of the organization. If research would indicate
that employees that are more satisfied with their social life are healthier, than organizations
can no longer ignore employee needs to balance their working and social life.
Review of the theory on the relationship between job characteristics and health identified two
models capable of explaining such relationships, the job demand control & support model and
the vitamin model. Both models have their origin in the Hackman and Oldham model. The
models postulate that certain job characteristics can have detrimental effects on health, where
the JDCS model assumes this relationship is linear and the vitamin model assumes a
curvilinear relationship. Both models also differ on the amount of job characteristics included
in the model and the mechanism by which strain is caused. The models were combined for the
identification of the job characteristics and out of the eleven job characteristics, seven were
tested in chapter four. Increasing amounts of job autonomy, social support, skill utilization
and salary were hypothesized to have positive effects on health. While increasing amounts of
job demands, physical demands and job insecurity were hypothesized to have a detrimental
effect on health. The amount of satisfaction with social life was hypothesized to influence the
relationship between job characteristics and health.

63 Jasper Schuurman, 195367
Erasmus University, Rotterdam Health Economics, 2011
The results of the analyses supported the hypothesized relationships of job characteristics on
health, they are however not linear. More important for this research is that the satisfaction
level with social life moderates this relationship. Therefore the answer to the central research
question of this thesis: can satisfaction with social life moderate the relationship between job
characteristics and health in the Netherlands?, is yes. Employees most satisfied with their
social life react stronger to changes in the job characteristics than respondents least satisfied
with their social life. This would mean that companies implementing programs that are
beneficial for employee health, should make room for the need of employees to balance their
social life with their working life in order to obtain the best results of such programs.
There are several limitations in this research, which should be taken into account in drawing
solid conclusions from this thesis. One of the major limitations of this research was that
proxies were used to measure job characteristics. Future research should therefore use the
questions formulated by the JCQ, which is especially designed to measure job characteristics
and has proven to be both valid and reliable. Moreover, research should try to identify the
difference between the effect of objective measures of job characteristics on health and
subjective measures.
A second limitation was that the underlying construct by which job characteristics cause
adverse health effects was not tested. Previous research has demonstrated that the resulting
strain from negative scores on the job characteristics causes behavioral changes and
physiological changes. More research is needed on this topic, in order to identify possible
confounding variables, when the effect of the relationship between job characteristics and
health with a moderating variable is tested. The same line of reasoning applies for personality
traits. It can be speculated that employees with a high need for autonomy, for example, are
likely to be less affected by high levels of job autonomy than those lacking this need.
Controlling for these confounding variables could affect the shape of the curve of the effect of
job characteristics on health, which in this research did not follow the pattern described by the
JDCS model or the vitamin model.

64 Jasper Schuurman, 195367
Erasmus University, Rotterdam Health Economics, 2011
A third limitation is that the research did not test cross lagged effects or individual fixed
effects. Research has demonstrated that cross-lagged effects exist with regard to the effect of
job characteristics and health. In terms of behavioral changes and physiological changes it
seems possible that it takes some time before adverse health effects become visible. Future
research should try to use longitudinal design when testing the relationship between job
characteristics and health and test for cross-lagged effects and individual fixed effects.
The final recommendation for future that comes forward from this research is that research
should try to use the same outcome measures for health to make the results of the different
studies comparable. Previous research has shown that different outcome measures are related
to different aspects of job characteristics.
65 Jasper Schuurman, 195367
Erasmus University, Rotterdam Health Economics, 2011
Reference
1) Buetell, N. Life satisfaction, a Sloan Work and Family Encyclopedia entry. 2006.
2) de Croon, E.M. van der Beek, A.J., Blonk, R.W.B. and Monique H.W.Frings-Dresen. Job Stress and Psychosomatic Health Complaints Among Dutch Truck Drivers: A Re-evaluation of Karasek’s Interactive Job Demand-Control Model. 2000. Stress Medicine. Vol 16, 101-107
3) Emberland, J.S. and T. Rundmo. Implications of Job Insecurity Perceptions and Job Insecurity Responses for Psychological Well-being, Turnover Intentions and Reported Risk Behavior. 2010. Safety Science. Vol 48, 452-459
4) Faragher, E.B., Cass, M. and C.L. Cooper. The Relationship Between Job Satisfaction and Health. A Meta-Analysis. 2005. occupational Environmental Medicine. Vol 62, 105-112
5) Felce, D. and Jonathan Perry. Quality of Life: Its Definition and Measurement. 1995. Research in Development Disabilities. Vol 16, No 1, 51-74.
6) Fletcher B.C., and Fiona Jones. A Refutation of Karasek’s Demand-Discretion Model of Occupational Stress With a Range of Dependent Measures. 1993. Journal of Organizational Behavior. Vol 14, 319-330
7) Fried, Y. and Gerald R. Ferris. The Validity of the Job Characteristics Model: A Review and Meta-Analysis. 1987. Personnel Psychology. Vol 40, 287-322
8) Hackman, J.R. and Oldham, G.R. Motivation Through the Design of Work: Test of a Theory. 1976. Organizational Behavior and Human Performance. Vol 16, 250-279
9) Hellerstedt, W.L. and Robert W. Jeffery. The Association of Job Strain and Health Behaviors in Men and Women. 1997. International Journal of Epidemiology. Vol 26, No 3, 575-583
10) Höckertin, C. and Annika Härenstam. The Impact of Ownership on Psychosocial Working Conditions: A Multilevel Analysis of 60 Workplaces. 2006. Economic and Industrial Democracy. Vol 27, 245-284.
11) Hogan, E.A. and Daniel A. Martell. A Confirmatory Structural Equations Analysis of the Job Characteristics Model. 1987. Organizational Behavior and Human Decision Processes. Vol 39, 242-263
12) Hugh, H.J. and Robert J. House. Methodological and Substantive Extensions to the Job Characteristics Model of Motivation. 1980. Organizational Behavior and Human Performance. Vol 25, 161-183

66 Jasper Schuurman, 195367
Erasmus University, Rotterdam Health Economics, 2011
13) Inoue, A., Kawakami, N., Haratani, T., Kobayashi, F., Ishizaki, M., Hayashi, T., Fujita, O., Aizawa, Y., Miyazaki, S., Hisanori, H., Masumoto, T., Hashimoto, S. and Shunichi Araki. Job Stressors and Long-term Sick Leave Due to Depressive Disorders Among Japanese Male Employees: Findings From the Japan Work Stress and Health Cohort Study. 2010. Journal of epidemiological Community Health. Vol 64, 229-235.
14) Jansen, P.G.M., Kerkstra, A., Abu-Saad, H.H. and Jouke van der Zee. The Effects of Job Characteristics and Individual Characteristics on Job Satisfaction and Burnout in Community Nursing. 1996. International Journal Nurse Study. Vol 33, No 4, 407- 421
15) Jeurissen, T. and Ivan Nyklíček. Testing the Vitamin Model of Job Stress in Dutch Health Care Workers. 2001. Work & Stress. Vol 15, No 3, 254-264.
16) johnson, J.V. and Ellen M. Hall. Job Strain, Work Place Social Support, and Cardiovascular Disease: A Cross- Sectional Study of a Random Sample of the Swedish Working Population. 1988. American Journal of Public Health. Vol 78, No 10, 1336-1342
17) de Jonge, J., Dormann, C., Janssen, P.P.M., Dollard, M.F., Landeweerd, J.A. and Frans J. N. Nijhuis. Testing Reciprocal Relationships Between Job Characteristics and Psychological Well-being: A Cross-lagged Structural Equation Model. 2001. Journal of Occupational and Organizational Psychology. Vol 74, 29-46
18) de Jonge, J. and Wilmar B. Schaufeli. Job Characteristics and Employee Well-being: A Test of Warr’s Vitamin Model in Health Care Workers Using Structural Equation Modelling.1998. Journal of Organizational Behavior. Vol 19, 387-407.
19) Karasek, R., Brisson, C., kawakami, N., Houtman, I., Bongers, P and Benjamin Amick. The Job Content Questionnaire (JCQ): An Instrument for Internationally Comparative Assessment of Psychosocial Job Characteristics. 1998. Journal of Occupational Health Psychology. Vol 3, No 4, 322-355
20) Karasek, R.A., Theorell, T., Schwartz, J.E., Schnall, P.L., Pieper, C.F. and John L Michela. Job Characteristics in Relation to the Prevalence of Myocardial Infarction in the US Health Examination Survey (HES) and the Health and Nutrition Examination Survey (HANES).1988. American Journal of Public Health. Vol 78, No8, 910-918
21) Kelloway, K.E. and Julian Barling. Job Characteristics, Role Stress and Mental Health. 1991. Journal of Occupational Psychology. Vol 64, 291-304
22) Kristensen, Tage S. The Demand-Control-Support Model: Methodological Challenges for Future Research. 1995. Stress Medicine. Vol 11, 17-26.
23) LaCroix A: Occupational Exposure to High Demand/Low Control Work and CHD in the Framingham Cohort. 1984.
67 Jasper Schuurman, 195367
Erasmus University, Rotterdam Health Economics, 2011
24) Landsbergis, Paul A. Occupational Stress Among Health Care Workers: A Test of the Job Demands-Control Model. 1988. Journal of Organizational Behavior. Vol 9, 217-239.
25) de Lange, A.H. Taris, T.W., Kompier, M.A.J., Houtman, I.L.D. and Paulien M. Bongers. “The Very Best of the Millennium” : Longitudinal Research and the Demand-Control-(Support) Model. 2003. Journal of Occupational Health Psychology. Vol 8, No4, 282-305
26) László, K.D., Pikhart, H., Kopp, M.S., bobak, M., Pajak, A., Malyutina, S., Salavecz, G. and Michael Marmot. Job Insecurity and Health: A Study of 16 European Countries. 2010. Social Science & Medicine. Vol 70, 867-874.
27) Lennon, M.C. and Sarah Rosenfield. Women and Mental Health: The Interaction of Job and Family Conditions. 1992. Journal of Health and Social Behavior. Vol 33, No 4, 316-327
28) Neugarten, B.L., Havighurst, R.J. and Sheldon S. Tobin. The measurement of Life Satisfaction. 1996.
29) Pelfrene, E., Vlerick, P., Kittel, F., Mak, R.P., Kornitzer, M. and Guy de Backer. Psychosocial Work Environment and Well-being: Assessment of the Buffering Effects in the Job Demand-Control(-Support) Model in BELSTRESS. 2002. Stress and Health. Vol 18, 43-56
30) Pounder, D.G. Teacher Teams: Exploring Job Characteristics and Work-Related Outcomes of Work Group Enhancement. 1999. Educational Administration Quaterly. Vol 35, No 3, 317-348
31) Pousette, A. and Jan J. Hanse. Job Characteristics as Predictors of Ill-Health and Sickness Absenteeism in Different Occupational Types: A Multigroup Structural Equation Modelling Approach. 2002. Vol 16, No 3, 229-250
32) Ramirez, A.J., Graham, J., Richards, M.A., Cull, A. and W.M. Gregory. Mental Health of Hospital Consultants: the Effects of Stress and Satisfaction at Work.1996. Lancet. Vol 347, 724-728.
33) Sanne, B., Mykletun, A., Dahl, A.A., Moen, B.E., and Grethe S. Tell. Testing the Job Demand-Control-Support Model With Anxiety and Depression as Outcomes: The Hordaland Health Study. 2005. Occupational Medicine. Vol 55, 463-473.
34) Shannon, H.S., Robson, L.S. and Joanna E.M. Sale. Creating Safer and Healthier Workplaces: Role of Organizational Factors and Job Characteristics. 2001. American Journal of Industrial Medicine. Vol 40, 319-334.
35) Sims, H.P., Szilagyi, A.D. abd Robert T. Keller. The measurement of Job Characteristics. 1976. The Academy of Management Journal. Vol 19, No 2, 195-212.
36) Sonnentag, Sabine and Micheal Frese. Stress in Organizations.
68 Jasper Schuurman, 195367
Erasmus University, Rotterdam Health Economics, 2011
37) Spector, P.E., Dwyer, D.J. and Steve M. Jex. Relation of Job Stressors to Affective, Health, and Performance Outcomes: A Comparison of Multiple Data Sources. 1988. Vol 73, No1, 11-19
38) Spector, P.E. and Steve M. Jex. Relations of Job Characteristics From Multiple Data Sources With Employee Affect, Absence, Turnover Intentions, and Health. 1991. Journal of Applied Psychology. Vol 76, No 1, 46-53
39) Vahtera, J., Kivimäki, M., Pentti, J. and Töres Theorell. Effect of Change in the Psychosocial Work Environment on Sickness Absence: A Seven Year Follow up of Initially Healthy Employees. 2000. Journal of epidemiological Community Health. Vol 54, 484-493.
40) Warren, J.R., Carayon, P., Hoonakker, P. and Naomi Swanson. Job Characteristics as Mediators in SES-Health Relationships. 2002
41) http://www.coursework4you.co.uk/essays-and-dissertations/sample44.php
42) http://www.businessdictionary.com/ definition/job-factors.html
43) http://circa.europa.eu/irc/dsis/echpanel/info/data/information.html

69 Jasper Schuurman, 195367
Erasmus University, Rotterdam Health Economics, 2011
Appendix A: variable job type
1 legislators, senior officials + corporate managers 2 managers of small enterprises 3 physical, mathematical and engineering science professionals + life science and health professionals 4 teaching professionals 5 other professionals 6 physical and engineering science professionals + life science and health associate professionals 7 teaching associate professionals+ other associate professionals 8 office clerks +customer service clerks 9 personal and protective service workers 10 models, salespersons and demonstrators 11 skilled agricultural and fishery workers 12 extraction and building trades workers + other craft and related trades workers 13 metal, machinery and related trades workers + precision, handicraft, printing and related trades workers 14 stationary-plant and related operators +drivers and mobile-plant operators 15 machine operators and assemblers 16 miscellaneous 17 sales and service elementary occupations 18 agriculture, fishery and related labourers 19 laboureres in mining, construction, manufacturing and transport 20 miscellaneous
The following professions were merged:
Categories 11+18+19
Categories 10+17
Categories 14+ 15

70 Jasper Schuurman, 195367
Erasmus University, Rotterdam Health Economics, 2011
Appendix B: missing values
variable missing values 1 health 2 2 job level 3805 3 job difficulty 836 4 satisfaction working hours 126 5 hours work 21 6 satisfaction working conditions 161 7 value training 1069 8 wage 0 9 satisfaction shifts 125 10 contract type 7586 11 satisfaction job security 215 12 satisfaction social life 34 13 age 0 14 sex 0 15 married 0 16 full time parttime work 671 17 job type 2000 18 industry 3969 19 sector 714 20 education 354 21 health expense 27398 22 social economic status 0
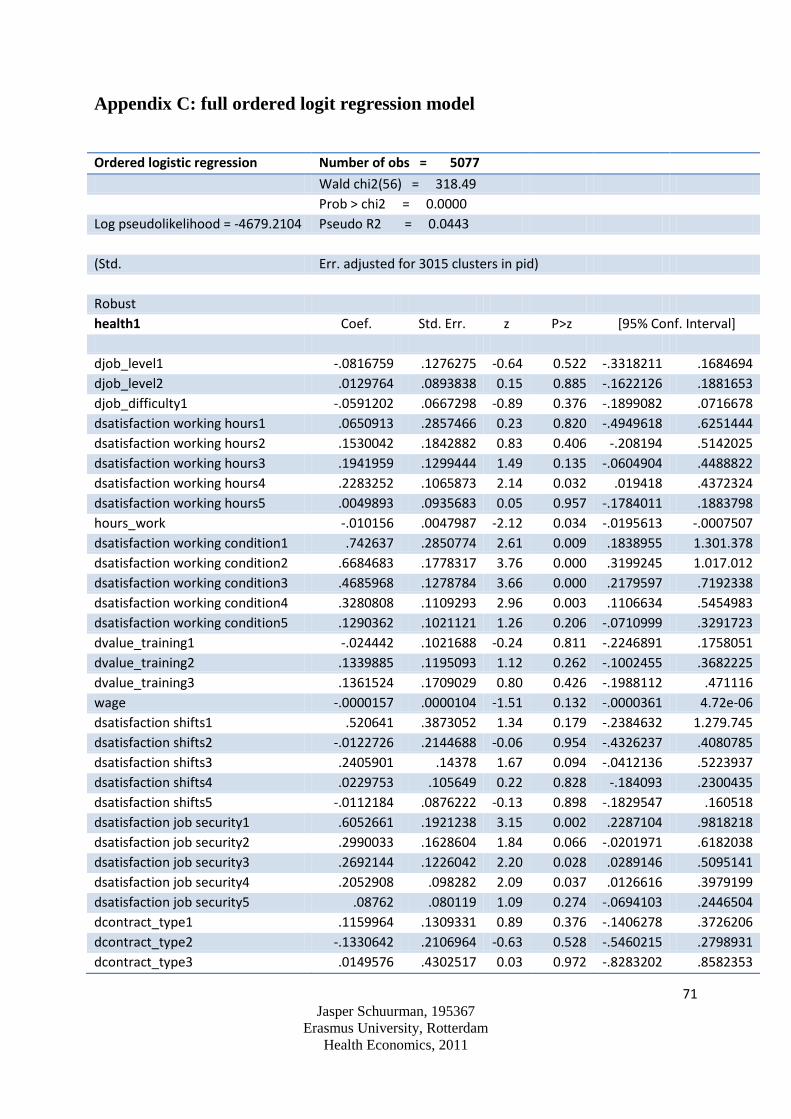
71 Jasper Schuurman, 195367
Erasmus University, Rotterdam Health Economics, 2011
Appendix C: full ordered logit regression model
Ordered logistic regression Number of obs = 5077
Wald chi2(56) = 318.49 Prob > chi2 = 0.0000 Log pseudolikelihood = -4679.2104 Pseudo R2 = 0.0443 (Std. Err. adjusted for 3015 clusters in pid) Robust health1 Coef. Std. Err. z P>z [95% Conf. Interval] djob_level1 -.0816759 .1276275 -0.64 0.522 -.3318211 .1684694 djob_level2 .0129764 .0893838 0.15 0.885 -.1622126 .1881653 djob_difficulty1 -.0591202 .0667298 -0.89 0.376 -.1899082 .0716678 dsatisfaction working hours1 .0650913 .2857466 0.23 0.820 -.4949618 .6251444 dsatisfaction working hours2 .1530042 .1842882 0.83 0.406 -.208194 .5142025 dsatisfaction working hours3 .1941959 .1299444 1.49 0.135 -.0604904 .4488822 dsatisfaction working hours4 .2283252 .1065873 2.14 0.032 .019418 .4372324 dsatisfaction working hours5 .0049893 .0935683 0.05 0.957 -.1784011 .1883798 hours_work -.010156 .0047987 -2.12 0.034 -.0195613 -.0007507 dsatisfaction working condition1 .742637 .2850774 2.61 0.009 .1838955 1.301.378 dsatisfaction working condition2 .6684683 .1778317 3.76 0.000 .3199245 1.017.012 dsatisfaction working condition3 .4685968 .1278784 3.66 0.000 .2179597 .7192338 dsatisfaction working condition4 .3280808 .1109293 2.96 0.003 .1106634 .5454983 dsatisfaction working condition5 .1290362 .1021121 1.26 0.206 -.0710999 .3291723 dvalue_training1 -.024442 .1021688 -0.24 0.811 -.2246891 .1758051 dvalue_training2 .1339885 .1195093 1.12 0.262 -.1002455 .3682225 dvalue_training3 .1361524 .1709029 0.80 0.426 -.1988112 .471116 wage -.0000157 .0000104 -1.51 0.132 -.0000361 4.72e-06 dsatisfaction shifts1 .520641 .3873052 1.34 0.179 -.2384632 1.279.745 dsatisfaction shifts2 -.0122726 .2144688 -0.06 0.954 -.4326237 .4080785 dsatisfaction shifts3 .2405901 .14378 1.67 0.094 -.0412136 .5223937 dsatisfaction shifts4 .0229753 .105649 0.22 0.828 -.184093 .2300435 dsatisfaction shifts5 -.0112184 .0876222 -0.13 0.898 -.1829547 .160518 dsatisfaction job security1 .6052661 .1921238 3.15 0.002 .2287104 .9818218 dsatisfaction job security2 .2990033 .1628604 1.84 0.066 -.0201971 .6182038 dsatisfaction job security3 .2692144 .1226042 2.20 0.028 .0289146 .5095141 dsatisfaction job security4 .2052908 .098282 2.09 0.037 .0126616 .3979199 dsatisfaction job security5 .08762 .080119 1.09 0.274 -.0694103 .2446504 dcontract_type1 .1159964 .1309331 0.89 0.376 -.1406278 .3726206 dcontract_type2 -.1330642 .2106964 -0.63 0.528 -.5460215 .2798931 dcontract_type3 .0149576 .4302517 0.03 0.972 -.8283202 .8582353

72 Jasper Schuurman, 195367
Erasmus University, Rotterdam Health Economics, 2011
age .036071 .0047492 7.60 0.000 .0267628 .0453793 dsex (men) -.4823603 .0963266 -5.01 0.000 -.6711569 -.2935637 ses -.000067 .0000341 -1.97 0.049 -.0001338 -1.84e-07 dsector (private) -.3146458 .0899022 -3.50 0.000 -.4908509 -.1384408 dmaried1 -.1526682 .1535513 -0.99 0.320 -.4536232 .1482869 dmaried4 -.0818308 .1668522 -0.49 0.624 -.4088551 .2451935 dfulltime -.044119 .1265182 -0.35 0.727 -.2920902 .2038521 djob_type1 -.2576718 .2029233 -1.27 0.204 -.6553942 .1400506 djob_type2 .1284881 .2354886 0.55 0.585 -.333061 .5900372 djob_type3 -.2996943 .2108866 -1.42 0.155 -.7130245 .1136358 djob_type4 -.0468663 .2345255 -0.20 0.842 -.5065279 .4127953 djob_type5 -.0059185 .2032216 -0.03 0.977 -.4042254 .3923885 djob_type6 -.2227513 .1836532 -1.21 0.225 -.582705 .1372024 djob_type7 -.0807995 .1805507 -0.45 0.655 -.4346724 .2730735 djob_type8 -.2943891 .1737276 -1.69 0.090 -.634889 .0461107 djob_type9 -.1813613 .2078142 -0.87 0.383 -.5886697 .2259471 djob_type12 .4785119 .207373 2.31 0.021 .0720682 .8849555 djob_type13 .3177138 .1961542 1.62 0.105 -.0667414 .702169 djob type11+17+18 .2366586 .2028353 1.17 0.243 -.1608913 .6342085 djob_type10+16 .1462271 .2061457 0.71 0.478 -.257811 .5502652 dindustry1 (agriculture) .0957099 .2612052 0.37 0.714 -.4162429 .6076628 dindustry2 (industry) .2411824 .0900497 2.68 0.007 .0646881 .4176766 deducation1 (third level) -.2565195 .1321194 -1.94 0.052 -.5154688 .0024298 deducation2 (second level) -.0670854 .0945708 -0.71 0.478 -.2524407 .1182699 health_expense .0005977 .0003459 1.73 0.084 -.0000803 .0012756 Table 8: full ordered logit regression model
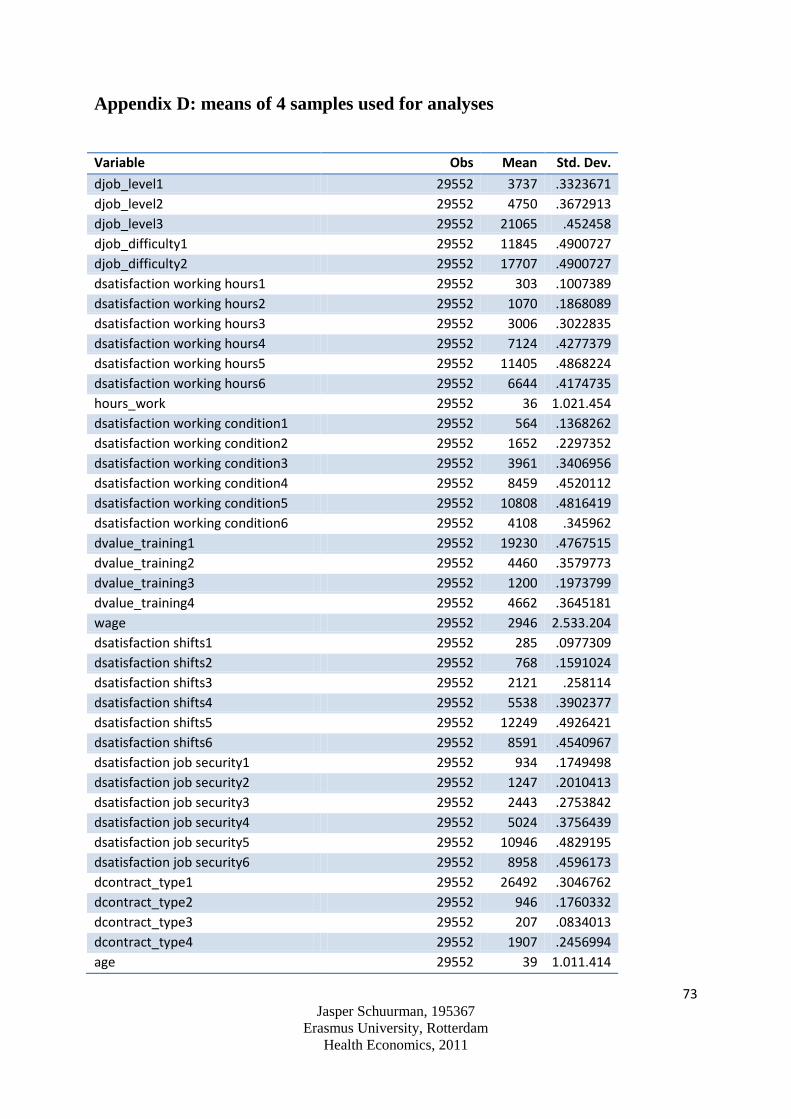
73 Jasper Schuurman, 195367
Erasmus University, Rotterdam Health Economics, 2011
Appendix D: means of 4 samples used for analyses
Variable Obs Mean Std. Dev.
djob_level1 29552 3737 .3323671 djob_level2 29552 4750 .3672913 djob_level3 29552 21065 .452458 djob_difficulty1 29552 11845 .4900727 djob_difficulty2 29552 17707 .4900727 dsatisfaction working hours1 29552 303 .1007389 dsatisfaction working hours2 29552 1070 .1868089 dsatisfaction working hours3 29552 3006 .3022835 dsatisfaction working hours4 29552 7124 .4277379 dsatisfaction working hours5 29552 11405 .4868224 dsatisfaction working hours6 29552 6644 .4174735 hours_work 29552 36 1.021.454 dsatisfaction working condition1 29552 564 .1368262 dsatisfaction working condition2 29552 1652 .2297352 dsatisfaction working condition3 29552 3961 .3406956 dsatisfaction working condition4 29552 8459 .4520112 dsatisfaction working condition5 29552 10808 .4816419 dsatisfaction working condition6 29552 4108 .345962 dvalue_training1 29552 19230 .4767515 dvalue_training2 29552 4460 .3579773 dvalue_training3 29552 1200 .1973799 dvalue_training4 29552 4662 .3645181 wage 29552 2946 2.533.204 dsatisfaction shifts1 29552 285 .0977309 dsatisfaction shifts2 29552 768 .1591024 dsatisfaction shifts3 29552 2121 .258114 dsatisfaction shifts4 29552 5538 .3902377 dsatisfaction shifts5 29552 12249 .4926421 dsatisfaction shifts6 29552 8591 .4540967 dsatisfaction job security1 29552 934 .1749498 dsatisfaction job security2 29552 1247 .2010413 dsatisfaction job security3 29552 2443 .2753842 dsatisfaction job security4 29552 5024 .3756439 dsatisfaction job security5 29552 10946 .4829195 dsatisfaction job security6 29552 8958 .4596173 dcontract_type1 29552 26492 .3046762 dcontract_type2 29552 946 .1760332 dcontract_type3 29552 207 .0834013 dcontract_type4 29552 1907 .2456994 age 29552 39 1.011.414

74 Jasper Schuurman, 195367
Erasmus University, Rotterdam Health Economics, 2011
dsex (men) 29552 17419 .4919446 dsex (women) 29552 12133 .4919446 ses 29552 2848 1.039.449 dsector (private) 29552 21268 .4491629 dsector (public) 29552 8284 .4491629 Table 9: Descriptive statistics sample 1
Variable Obs Mean Std. Dev.
djob_level1 7237 1016 .3474149 djob_level2 7237 1199 .3718156 djob_level3 7237 5022 .4608893 djob_difficulty1 7237 2951 .4914531 djob_difficulty2 7237 4286 .4914531 dsatisfaction working hours1 7237 146 .1406053 dsatisfaction working hours2 7237 439 .238723 dsatisfaction working hours3 7237 1118 .361437 dsatisfaction working hours4 7237 2045 .4502829 dsatisfaction working hours5 7237 2346 .4680953 dsatisfaction working hours6 7237 1143 .3647084 hours_work 7237 38 1.079.875 dsatisfaction working condition1 7237 195,9997 .1623367 dsatisfaction working condition2 7237 534,0001 .2614428 dsatisfaction working condition3 7237 1151 .3657422 dsatisfaction working condition4 7237 2085 .4529105 dsatisfaction working condition5 7237 2448 .4731508 dsatisfaction working condition6 7237 823,0003 .3174942 dvalue_training1 7237 4554 .4830346 dvalue_training2 7237 1100 .3590425 dvalue_training3 7237 333,9999 .2098281 dvalue_training4 7237 1249 .3779145 wage 7237 3008,16 2766.64 dsatisfaction shifts1 7237 125,0004 .1302934 dsatisfaction shifts2 7237 318,0003 .2049777 dsatisfaction shifts3 7237 757,0003 .3060602 dsatisfaction shifts4 7237 1569 .4120955 dsatisfaction shifts5 7237 2840 .4883249 dsatisfaction shifts6 7237 1628 .4175816 dsatisfaction job security1 7237 317,0001 .20467 dsatisfaction job security2 7237 363 .2182878 dsatisfaction job security3 7237 741 .3031821 dsatisfaction job security4 7237 1395 .394493 dsatisfaction job security5 7237 2575 .4787912 dsatisfaction job security6 7237 1846 .4359352

75 Jasper Schuurman, 195367
Erasmus University, Rotterdam Health Economics, 2011
dcontract_type1 7237 6372 .3244273 dcontract_type2 7237 285,0003 .1945131 dcontract_type3 7237 44,99967 .0786145 dcontract_type4 7237 535,0003 .261668 age 7237 39 9.862.515 dsex (men) 7237 4279 .4916337 dsex (women) 7237 2958 .4916337 ses 7237 2.770 1.054.349 dsector (private) 7237 5346 .4393713 dsector (public) 7237 1891 .4393713 Table 10: Descriptive statistics sample 2
Variable Obs Mean Std. Dev.
djob_level1 15930 2032 0,3336075
djob_level2 15930 2523 0,3651088
djob_level3 15930 11375 0,4518744
djob_difficulty1 15930 6305 0,4890359
djob_difficulty2 15930 9625 0,4890359
dsatisfaction working hours1 15930 125 0,0882369
dsatisfaction working hours2 15930 517 0,1772094
dsatisfaction working hours3 15930 1546 0,2960346
dsatisfaction working hours4 15930 3903 0,4301063
dsatisfaction working hours5 15930 6390 0,4901426
dsatisfaction working hours6 15930 3449 0,4118785
hours_work 15930 36 100,00587
dsatisfaction working condition1 15930 275 0,1302539
dsatisfaction working condition2 15930 860 0,2259975
dsatisfaction working condition3 15930 2129 0,3402836
dsatisfaction working condition4 15930 4675 0,4553669
dsatisfaction working condition5 15930 5894 0,4828178
dsatisfaction working condition6 15930 2097 0,3381079
dvalue_training1 15930 10420 0,4756719
dvalue_training2 15930 2451 0,3608264
dvalue_training3 15930 628 0,194604
dvalue_training4 15930 2431 0,3596178
wage 15930 2964 24930,586
dsatisfaction shifts1 15930 125 0,0882369
dsatisfaction shifts2 15930 366 0,1498301
dsatisfaction shifts3 15930 1063 0,2495607
dsatisfaction shifts4 15930 3040 0,3929715
dsatisfaction shifts5 15930 6863 0,4952069
dsatisfaction shifts6 15930 4473 0,4493997
dsatisfaction job security1 15930 463 0,1679931
dsatisfaction job security2 15930 651 0,1979866

76 Jasper Schuurman, 195367
Erasmus University, Rotterdam Health Economics, 2011
dsatisfaction job security3 15930 1273 0,2711656
dsatisfaction job security4 15930 2706 0,3755287
dsatisfaction job security5 15930 6081 0,4858268
dsatisfaction job security6 15930 4756 0,4576391
dcontract_type1 15930 14354 0,2985812
dcontract_type2 15930 466 0,1685201
dcontract_type3 15930 120 0,0864678
dcontract_type4 15930 990 0,2414297
age 15930 39 100,09127
dsex (men) 15930 9378 0,4920848
dsex (women) 15930 6552 0,4920848
ses 15930 2875 10500,798
dsector (private) 15930 11345 0,4527618
dsector (public) 15930 4585 0,4527618 Table 11: Descriptive statistics sample 3
Variable Obs Mean Std. Dev.
djob_level1 6385 689 .31029 djob_level2 6385 1028 .3675619 djob_level3 6385 4668 .4434286 djob_difficulty1 6385 2589 .4910235 djob_difficulty2 6385 3796 .4910235 dsatisfaction working hours1 6385 32 .0706216 dsatisfaction working hours2 6385 114 .1324323 dsatisfaction working hours3 6385 342 .225171 dsatisfaction working hours4 6385 1176 .3876626 dsatisfaction working hours5 6385 2669 .4932706 dsatisfaction working hours6 6385 2052 .4670422 hours_work 6385 35 977.655 dsatisfaction working condition1 6385 93 .1198144 dsatisfaction working condition2 6385 258 .1969277 dsatisfaction working condition3 6385 681 .3086999 dsatisfaction working condition4 6385 1699 .4419478 dsatisfaction working condition5 6385 2466 .4869196 dsatisfaction working condition6 6385 1188 .3891864 dvalue_training1 6385 4256 .4714783 dvalue_training2 6385 909 .3494514 dvalue_training3 6385 238 .1894494 dvalue_training4 6385 982 .3607832 wage 6385 2833 2.344.314 dsatisfaction shifts1 6385 35 .0738404 dsatisfaction shifts2 6385 84 .1139508 dsatisfaction shifts3 6385 301 .2119586 dsatisfaction shifts4 6385 929 .3526291

77 Jasper Schuurman, 195367
Erasmus University, Rotterdam Health Economics, 2011
dsatisfaction shifts5 6385 2546 .4896789 dsatisfaction shifts6 6385 2490 .4877828 dsatisfaction job security1 6385 154 .1534307 dsatisfaction job security2 6385 233 .187525 dsatisfaction job security3 6385 429 .2503682 dsatisfaction job security4 6385 923 .3516817 dsatisfaction job security5 6385 2290 .4796427 dsatisfaction job security6 6385 2356 .482569 dcontract_type1 6385 5766 .2959074 dcontract_type2 6385 195 .1720821 dcontract_type3 6385 42 .0808435 dcontract_type4 6385 382 .237186 age 6385 39 1.043.847 dsex (men) 6385 3762 .4920187 dsex (women) 6385 2623 .4920187 ses 6385 2871 9.885.006 dsector (private) 6385 4577 .4505705 dsector (public) 6385 1808 .4505705 Table 12: Descriptive statistics model 3

78 Jasper Schuurman, 195367
Erasmus University, Rotterdam Health Economics, 2011
Appendix E: correlations coefficients of 4 samples used for analyses

79 Jasper Schuurman, 195367
Erasmus University, Rotterdam Health Economics, 2011

80 Jasper Schuurman, 195367
Erasmus University, Rotterdam Health Economics, 2011

81 Jasper Schuurman, 195367
Erasmus University, Rotterdam Health Economics, 2011

82 Jasper Schuurman, 195367
Erasmus University, Rotterdam Health Economics, 2011
Appendix F: ordered logit regression of 4 samples used for analyses
Ordered logistic regression Number of obs = 29552
Wald chi2(35) = 866.39 Prob > chi2 = 0.0000 Log pseudolikelihood = -27707.996
Pseudo R2 = 0.0321
(Std. Err. adjusted for 7670 clusters in pid) Robust health1 Coef. Std. Err. z P>z [95% Conf. Interval] djob_level1 -.1791232 .0545683 -3.28 0.001 -.2860751 -.0721712 djob_level2 .0089886 .044293 0.20 0.839 -.0778241 .0958013 djob_difficulty1 -.1370112 .0324398 -4.22 0.000 -.2005921 -.0734303 dsatisfaction working hours1 .2985189 .162965 1.83 0.067 -.0208867 .6179245 dsatisfaction working hours2 .3456088 .0858862 4.02 0.000 .1772751 .5139426 dsatisfaction working hours3 .283506 .0592554 4.78 0.000 .1673675 .3996445 dsatisfaction working hours4 .2026933 .0476159 4.26 0.000 .1093678 .2960187 dsatisfaction working hours5 .1113133 .0400384 2.78 0.005 .0328394 .1897872 hours_work -.0091633 .0020866 -4.39 0.000 -.013253 -.0050736 dsatisfaction working condition1 .7954621 .1201653 6.62 0.000 .5599425 1.030.982 dsatisfaction working condition2 .6278232 .0792986 7.92 0.000 .4724008 .7832456 dsatisfaction working condition3 .4570004 .0588023 7.77 0.000 .34175 .5722508 dsatisfaction working condition4 .3246216 .0510379 6.36 0.000 .2245892 .424654 dsatisfaction working condition5 .1431016 .0458656 3.12 0.002 .0532067 .2329965 dvalue_training1 -.2151203 .0467577 -4.60 0.000 -.3067637 -.1234769 dvalue_training2 -.1141556 .0532953 -2.14 0.032 -.2186124 -.0096988 dvalue_training3 .0194521 .0771456 0.25 0.801 -.1317504 .1706546 wage -.0000238 5.62e-06 -4.24 0.000 -.0000349 -.0000128 dsatisfaction shifts1 .251177 .1780089 1.41 0.158 -.0977141 .600068 dsatisfaction shifts2 .1863711 .0988224 1.89 0.059 -.0073173 .3800596 dsatisfaction shifts3 .1125287 .0620331 1.81 0.070 -.009054 .2341113 dsatisfaction shifts4 .0658916 .0475047 1.39 0.165 -.0272159 .1589991 dsatisfaction shifts5 .0645307 .0377836 1.71 0.088 -.0095237 .1385852 dsatisfaction job security1 .5254113 .0909507 5.78 0.000 .3471513 .7036713 dsatisfaction job security2 .3288919 .0789486 4.17 0.000 .1741556 .4836283 dsatisfaction job security3 .2898938 .0575435 5.04 0.000 .1771107 .4026769 dsatisfaction job security4 .2542566 .0453622 5.61 0.000 .1653484 .3431648 dsatisfaction job security5 .1660532 .0352072 4.72 0.000 .0970483 .2350581 dcontract_type1 .0560762 .0596398 0.94 0.347 -.0608156 .172968 dcontract_type2 -.0461695 .0927619 -0.50 0.619 -.2279795 .1356405

83 Jasper Schuurman, 195367
Erasmus University, Rotterdam Health Economics, 2011
dcontract_type3 -.2576757 .1611552 -1.60 0.110 -.5735341 .0581827 age .0348948 .002037 17.13 0.000 .0309024 .0388871 dsex (men) -.2236392 .0463378 -4.83 0.000 -.3144597 -.1328188 ses -.0000734 .0000159 -4.61 0.000 -.0001046 -.0000422 dsector (private) -.034732 .0421497 -0.82 0.410 -.1173439 .0478799 Table 13: Results of the ordered logit regression of sample 1
Ordered logistic regression Number of obs = 7237
Wald chi2(35) = 340.25 Prob > chi2 = 0.0000 Log pseudolikelihood = -6859.688 Pseudo R2 = 0.0376 (Std. Err. adjusted for 3417 clusters in
pid)
Robust health1 Coef. Std. Err. z P>z [95% Conf. Interval] djob_level1 -.2290568 .0957524 -2.39 0.017 -.4167281 -.0413854 djob_level2 .0459571 .0788905 0.58 0.560 -.1086654 .2005796 djob_difficulty1 -.0765327 .05871 -1.30 0.192 -.1916022 .0385368 dsatisfaction working hours1 .2143668 .2407984 0.89 0.373 -.2575894 .686323 dsatisfaction working hours2 .4478508 .1442238 3.11 0.002 .1651773 .7305242 dsatisfaction working hours3 .2826778 .1110961 2.54 0.011 .0649336 .5004221 dsatisfaction working hours4 .2221439 .0985753 2.25 0.024 .0289399 .415348 dsatisfaction working hours5 .0379244 .0898743 0.42 0.673 -.1382261 .2140749 hours_work -.009654 .0033242 -2.90 0.004 -.0161693 -.0031388 dsatisfaction working condition1 .7984649 .2026544 3.94 0.000 .4012696 119.566 dsatisfaction working condition2 .61312 .1471535 4.17 0.000 .3247044 .9015356 dsatisfaction working condition3 .5365994 .1159703 4.63 0.000 .3093019 .7638969 dsatisfaction working condition4 .3338122 .1036333 3.22 0.001 .1306946 .5369298 dsatisfaction working condition5 .2594852 .0973215 2.67 0.008 .0687386 .4502318 dvalue_training1 -.2129197 .0818643 -2.60 0.009 -.3733708 -.0524686 dvalue_training2 -.1823039 .0978272 -1.86 0.062 -.3740417 .009434 dvalue_training3 -.0806499 .1532126 -0.53 0.599 -.3809411 .2196412 wage -.0000211 8.71e-06 -2.43 0.015 -.0000382 -4.06e-06 dsatisfaction shifts1 -.0569144 .2510493 -0.23 0.821 -.5489619 .435133 dsatisfaction shifts2 .1457552 .150821 0.97 0.334 -.1498487 .441359 dsatisfaction shifts3 .113264 .1164619 0.97 0.331 -.1149971 .3415251 dsatisfaction shifts4 -.0544733 .091779 -0.59 0.553 -.2343568 .1254101 dsatisfaction shifts5 .0359898 .0812843 0.44 0.658 -.1233246 .1953041 dsatisfaction job security1 .4806015 .1544289 3.11 0.002 .1779263 .7832766 dsatisfaction job security2 .1919484 .1394774 1.38 0.169 -.0814223 .4653192 dsatisfaction job security3 .2643362 .109907 2.41 0.016 .0489226 .4797499

84 Jasper Schuurman, 195367
Erasmus University, Rotterdam Health Economics, 2011
dsatisfaction job security4 .1720504 .0871046 1.98 0.048 .0013286 .3427722 dsatisfaction job security5 .136539 .0706651 1.93 0.053 -.001962 .2750401 dcontract_type1 .0374996 .1149836 0.33 0.744 -.1878641 .2628632 dcontract_type2 -.027429 .1843081 -0.15 0.882 -.3886663 .3338083 dcontract_type3 -.1140335 .3091779 -0.37 0.712 -.720011 .4919439 age .0392419 .0034969 11.22 0.000 .0323882 .0460957 dsex (men) -.3497736 .0785674 -4.45 0.000 -.5037629 -.1957843 ses -.0000981 .0000294 -3.33 0.001 -.0001557 -.0000404 dsector (private) .0076917 .0737025 0.10 0.917 -.1367624 .1521459 Table 14: Results of the ordered logit regression of sample 2
Ordered logistic regression Number of obs = 15930
Wald chi2(35) = 571.28 Prob > chi2 = 0.0000 Log pseudolikelihood = -14883.547 Pseudo R2 = 0.0313 (Std. Err. adjusted for 6086 clusters in pid) Robust health1 Coef. Std. Err. z P>z [95% Conf. Interval] djob_level1 -.1435379 .0670939 -2.14 0.032 -.2750396 -.0120362 djob_level2 .0128005 .0566646 0.23 0.821 -.0982601 .123861 djob_difficulty1 -.1423271 .0409335 -3.48 0.001 -.2225552 -.062099 dsatisfaction working hours1 .2953034 .2515371 1.17 0.240 -.1977002 .7883071 dsatisfaction working hours2 .1976086 .1203671 1.64 0.101 -.0383066 .4335238 dsatisfaction working hours3 .2428623 .0791578 3.07 0.002 .0877159 .3980086 dsatisfaction working hours4 .1784586 .0625037 2.86 0.004 .0559535 .3009636 dsatisfaction working hours5 .1527941 .0524922 2.91 0.004 .0499113 .2556769 hours_work -.0109965 .0026275 -4.19 0.000 -.0161463 -.0058467 dsatisfaction working condition1 .8069345 .1698955 4.75 0.000 .4739454 1.139.924 dsatisfaction working condition2 .6309575 .104924 6.01 0.000 .4253102 .8366047 dsatisfaction working condition3 .4182266 .0756925 5.53 0.000 .2698721 .5665811 dsatisfaction working condition4 .3268076 .0652012 5.01 0.000 .1990155 .4545996 dsatisfaction working condition5 .1024613 .0595589 1.72 0.085 -.0142721 .2191947 dvalue_training1 -.2084477 .0599494 -3.48 0.001 -.3259465 -.0909489 dvalue_training2 -.0632553 .0694408 -0.91 0.362 -.1993568 .0728462 dvalue_training3 .0330415 .1014383 0.33 0.745 -.165774 .231857 wage -.0000273 7.33e-06 -3.72 0.000 -.0000416 -.0000129 dsatisfaction shifts1 .3499521 .2510327 1.39 0.163 -.142063 .8419673 dsatisfaction shifts2 .100117 .1504542 0.67 0.506 -.1947677 .3950018 dsatisfaction shifts3 .0487037 .0814253 0.60 0.550 -.1108869 .2082943 dsatisfaction shifts4 .101797 .0623133 1.63 0.102 -.0203349 .2239288

85 Jasper Schuurman, 195367
Erasmus University, Rotterdam Health Economics, 2011
dsatisfaction shifts5 .0511698 .0493693 1.04 0.300 -.0455924 .1479319 dsatisfaction job security1 .4222299 .1253504 3.37 0.001 .1765476 .6679122 dsatisfaction job security2 .3221424 .1097972 2.93 0.003 .1069439 .5373409 dsatisfaction job security3 .2245016 .0746112 3.01 0.003 .0782663 .3707369 dsatisfaction job security4 .3017726 .0568898 5.30 0.000 .1902707 .4132746 dsatisfaction job security5 .1623883 .044858 3.62 0.000 .0744681 .2503084 dcontract_type1 .1035655 .0772148 1.34 0.180 -.0477727 .2549037 dcontract_type2 .0771101 .1233598 0.63 0.532 -.1646706 .3188909 dcontract_type3 -.1314165 .2166556 -0.61 0.544 -.5560537 .2932207 age .0344044 .0024548 14.02 0.000 .0295931 .0392158 dsex (men) -.2012567 .0555974 -3.62 0.000 -.3102255 -.0922879 ses -.0000592 .0000192 -3.09 0.002 -.0000968 -.0000217 dsector (private) -.0628049 .0503051 -1.25 0.212 -.1614011 .0357912 Table 15: Results of the ordered logit regression of sample 3
Ordered logistic regression Number of obs = 6385
Wald chi2(35) = 203.67 Prob > chi2 = 0.0000 Log pseudolikelihood = -5881.6389 Pseudo R2 = 0.0277 (Std. Err. adjusted for 3065 clusters in pid) Robust health1 Coef. Std. Err. z P>z [95% Conf. Interval] djob_level1 -.2143136 .108395 -1.98 0.048 -.426764 -.0018632 djob_level2 -.0398561 .0819063 -0.49 0.627 -.2003895 .1206773 djob_difficulty1 -.1756323 .0597266 -2.94 0.003 -.2926942 -.0585703 dsatisfaction working hours1 .5313566 .3702418 1.44 0.151 -.194304 1.257.017 dsatisfaction working hours2 .3076596 .226546 1.36 0.174 -.1363625 .7516816 dsatisfaction working hours3 .141784 .150444 0.94 0.346 -.1530807 .4366488 dsatisfaction working hours4 .0972547 .0933303 1.04 0.297 -.0856693 .2801786 dsatisfaction working hours5 .0421969 .0744773 0.57 0.571 -.1037759 .1881698 hours_work -.010873 .004571 -2.38 0.017 -.0198321 -.001914 dsatisfaction working condition1 .7321474 .2463609 2.97 0.003 .2492888 1.215.006 dsatisfaction working condition2 .5801431 .1733097 3.35 0.001 .2404624 .9198238 dsatisfaction working condition3 .4013176 .1183343 3.39 0.001 .1693867 .6332485 dsatisfaction working condition4 .2922719 .0969376 3.02 0.003 .1022777 .4822661 dsatisfaction working condition5 .1166479 .0871348 1.34 0.181 -.0541332 .2874289 dvalue_training1 -.2163262 .0871206 -2.48 0.013 -.3870794 -.045573 dvalue_training2 -.1280203 .1036425 -1.24 0.217 -.3311559 .0751154 dvalue_training3 .1164876 .1547311 0.75 0.452 -.1867799 .4197551 wage -.0000223 .0000163 -1.37 0.171 -.0000542 9.64e-06

86 Jasper Schuurman, 195367
Erasmus University, Rotterdam Health Economics, 2011
dsatisfaction shifts1 .608761 .4808968 1.27 0.206 -.3337794 1.551.301 dsatisfaction shifts2 .2566994 .2370945 1.08 0.279 -.2079972 .721396 dsatisfaction shifts3 .1411187 .1480537 0.95 0.341 -.1490613 .4312986 dsatisfaction shifts4 .0653432 .0991772 0.66 0.510 -.1290405 .2597269 dsatisfaction shifts5 .0809746 .0725012 1.12 0.264 -.0611251 .2230744 dsatisfaction job security1 .7314164 .2122262 3.45 0.001 .3154607 1.147.372 dsatisfaction job security2 .4652966 .1580443 2.94 0.003 .1555354 .7750578 dsatisfaction job security3 .4299607 .1157234 3.72 0.000 .203147 .6567744 dsatisfaction job security4 .1508675 .0937459 1.61 0.108 -.0328711 .3346061 dsatisfaction job security5 .1710468 .067356 2.54 0.011 .0390314 .3030622 dcontract_type1 -.002615 .125435 -0.02 0.983 -.2484632 .2432331 dcontract_type2 -.3594588 .174427 -2.06 0.039 -.7013294 -.0175882 dcontract_type3 -.6520461 .337824 -1.93 0.054 -1.314.169 .0100768 age .0302342 .0037917 7.97 0.000 .0228026 .0376658 Table 16: Results of the ordered logit regression of sample 4

87 Jasper Schuurman, 195367
Erasmus University, Rotterdam Health Economics, 2011
Appendix G: test for linearity
Value-training
Figure 7: test for linearity value-training
Contract-type
Figure 8: test for linearity contract-type
Satisfaction job-security
Figure 9: test for linearity satisfaction job-security
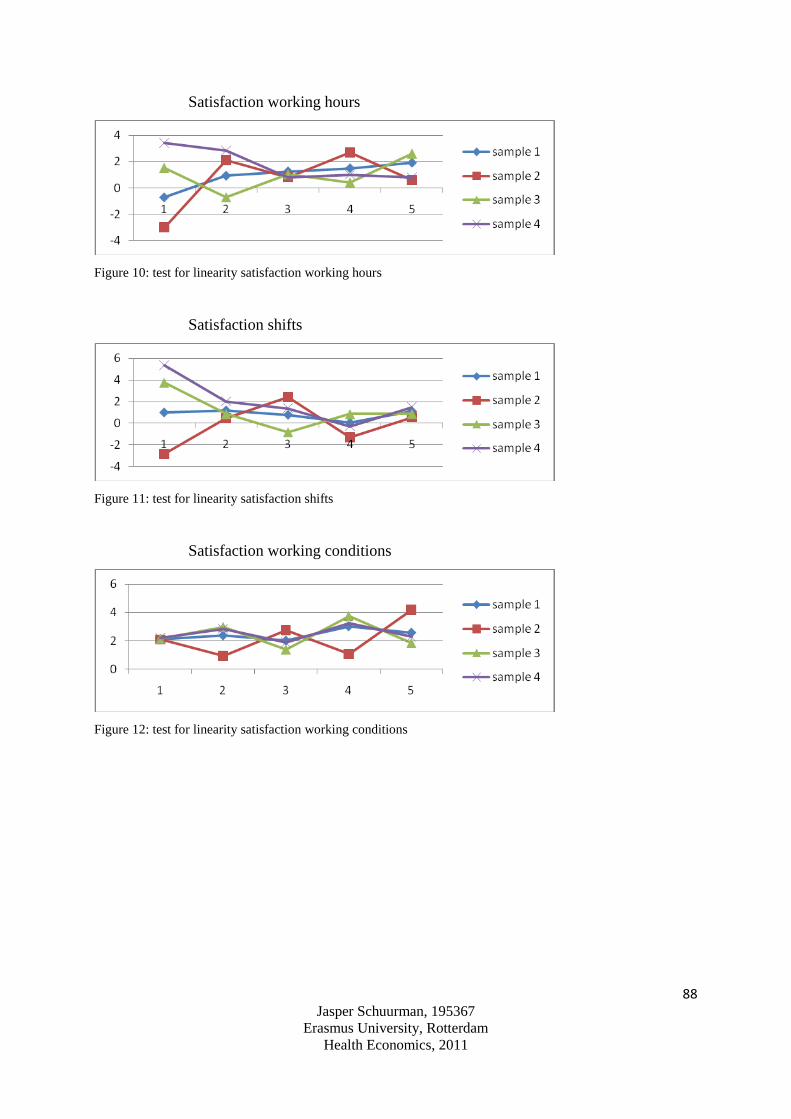
88 Jasper Schuurman, 195367
Erasmus University, Rotterdam Health Economics, 2011
Satisfaction working hours
Figure 10: test for linearity satisfaction working hours
Satisfaction shifts
Figure 11: test for linearity satisfaction shifts
Satisfaction working conditions
Figure 12: test for linearity satisfaction working conditions