jardine matheson · 2020-04-06 · jardine matheson holdings limited is incorporated in bermuda and...
TRANSCRIPT

JARDINEMATHESON
ANNUAL REPORT2019

Jardine Matheson is a diversified Asian-based group with unsurpassed experience in the region, having been founded in China in 1832. We comprise a broad portfolio of market-leading
businesses, which represent a combination of
cash generating activities and long-term property
assets and are closely aligned to the increasingly
prosperous consumers of the region.

Jardine Matheson Annual Report 2019
1
Contents
Introduction 1Highlights 2Chairman’s Statement 4Jardine Matheson Group Businesses at a Glance 8Managing Director’s Review 9People and the Community 20Financial Review 22Directors’ Profiles 27
Jardine Matheson Holdings Limited is incorporated in Bermuda and has a standard listing on the London Stock Exchange, with secondary listings in Bermuda and Singapore. Jardine Matheson Limited operates from Hong Kong and provides management services to Group companies.
www.jardines.comfor more information
Jardine Matheson Holdings LimitedJardine HouseHamiltonBermuda
Where we operate
We operate principally in Greater China and Southeast Asia, where our subsidiaries and affiliates can leverage and tap our vast experience, expertise, networks, and long-standing relationships in the region. Our goal is to help Group companies achieve sustainable growth over the long term by providing financial and other resources.
Our philosophy
Principled leadership, a long-term perspective, innovative thinking and a commitment to mutual growth inspire us. They also underpin our businesses which provide products, services, and experiences that impact the lives of many millions every day. These values also apply in our workspaces, where we strive to provide positive, safe working environments. We are also committed to improving communities through programmes that make a difference in environmental stewardship, education, mental health and more.
Our operations
Across the Group, our 464,000 employees work in a wide range of businesses in major sectors including motor vehicles and related operations, property investment and development, food retailing, health and beauty, home furnishings, engineering and construction, transport services, restaurants, luxury hotels, financial services, heavy equipment, mining, energy and agribusiness.
Financial Statements 28Independent Auditors’ Report 130Five Year Summary 138Responsibility Statement 139Corporate Governance 140Principal Risks and Uncertainties 146Shareholder Information 147Group Offices 148
Jardine Matheson Annual Report 2019
2 Highlights
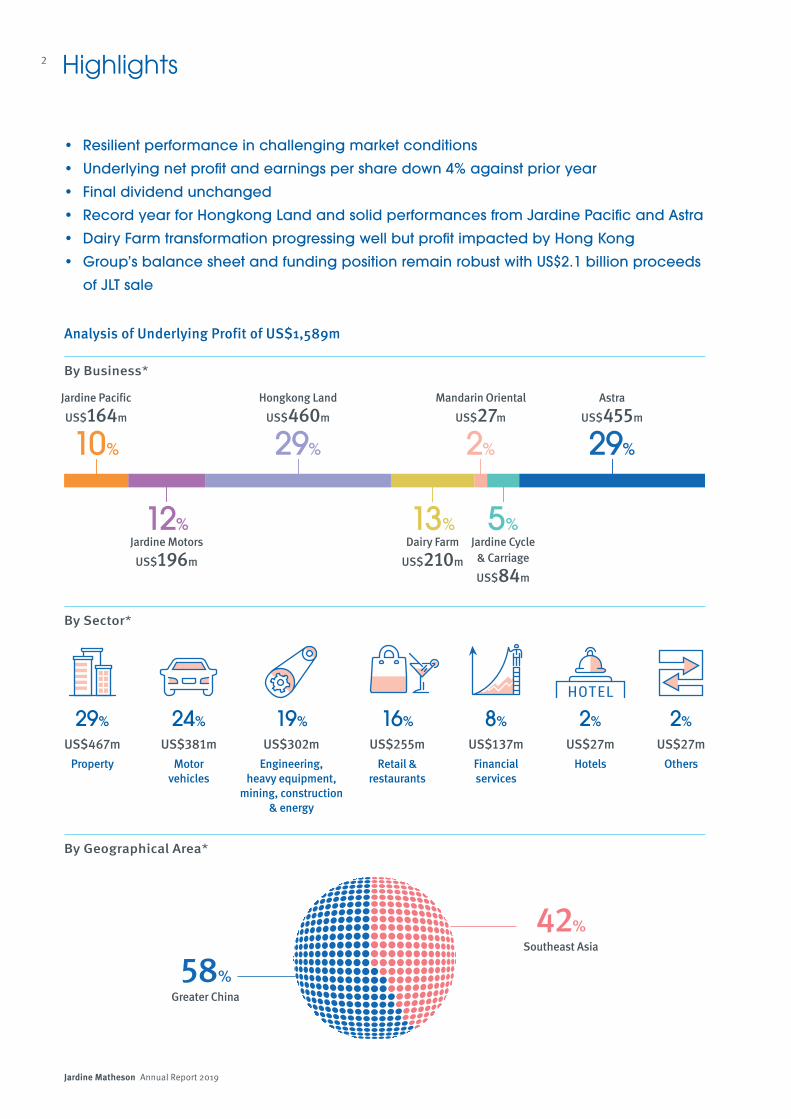
Analysis of Underlying Profit of US$1,589m
• Resilient performance in challenging market conditions
• Underlying net profit and earnings per share down 4% against prior year
• Final dividend unchanged
• Record year for Hongkong Land and solid performances from Jardine Pacific and Astra
• Dairy Farm transformation progressing well but profit impacted by Hong Kong
• Group’s balance sheet and funding position remain robust with US$2.1 billion proceeds
of JLT sale
58%Greater China
42%Southeast Asia
By Geographical Area*
By Sector*
By Business*
Jardine Pacific
US$164m
10%
Hongkong Land
US$460m
29%
Mandarin Oriental
US$27m
2%
Astra
US$455m
29%
12%Jardine Motors
US$196m
13%Dairy Farm
US$210m
5%Jardine Cycle
& Carriage
US$84m
29%
US$467mProperty
24%
US$381mMotor
vehicles
19%
US$302mEngineering,
heavy equipment, mining, construction
& energy
8%
US$137mFinancial services
2%
US$27mHotels
2%
US$27mOthers
16%
US$255mRetail &
restaurants

Jardine Matheson Annual Report 2019
3
* Based on underlying profit attributable to shareholders before corporate and other interests.# Excluding net borrowings of financial services companies.† Including expenditure on properties for sale and associates and joint ventures.Δ The 2018 financials have been restated due to changes in accounting policies upon adoption of IFRS 16 ‘Leases’, as set out in note 1 to the financial statements.Ω The Group uses ‘underlying profit’ in its internal financial reporting to distinguish between ongoing business performance and non-trading items, as more fully described in note 40 to the
financial statements. Management considers this to be a key measure which provides additional information to enhance understanding of the Group’s underlying business performance.§ Net asset value per share is based on the book value of shareholders’ funds.
US$4,678mUnderlying profit before tax
US$97,028mTotal assets
464,000People employed
US$103,308mGross revenue
US$1,589mUnderlying profit attributable to shareholders
US$4,786mNet borrowings#
US$10,570mTotal capital investment†
US$30,351mShareholders’ funds
Underlying Earnings per Share (US$)Highlights
3.64
3.71
4.10
4.40
2016
2017
2018
2015
2019 4.23
Net Asset Value per Share (US$)Highlights
53.30
58.19
68.19
69.19
2016
2017
2018
2015
2019 81.90
Underlying Earnings per ShareΔ (US$) Net Asset Value per ShareΔ (US$)
2019 Financial Highlights
Results2019US$m
2018US$m
restatedΔ
Change%
Gross revenue including 100% of associates and joint ventures 103,308 92,348 12
Revenue 40,922 42,527 (4)
Underlying profit before taxΩ 4,678 4,850 (4)
Underlying profit attributable to shareholdersΩ 1,589 1,655 (4)
Profit attributable to shareholders 2,838 1,722 65
Shareholders’ funds 30,351 26,069 16
US$ US$ %
Underlying earnings per shareΩ 4.23 4.40 (4)
Earnings per share 7.56 4.58 65
Dividends per share 1.72 1.70 1
Net asset value per share§ 81.90 69.19 18
Highlights

Jardine Matheson Annual Report 2019
4
2019 was a challenging year, but the Group has a long track record of resilience and delivered an encouraging performance in difficult conditions.
The 2020 performance of the Group’s businesses in Greater China is being materially impacted by the ongoing COVID-19 outbreak and results for the remainder of the year will depend on the duration, geographic extent and impact of the outbreak and the measures taken to control it. Longer term, however, we remain confident in the market fundamentals that drive Asia’s growth. The Board also remains confident that the Group’s strong balance sheet, liquidity and clear strategic priorities will position Jardine Matheson well for strong long-term growth.
OverviewJardine Matheson delivered a resilient performance in 2019. The Group navigated a range of challenges during the year, including the China-US trade war, negative consumer sentiment in a number of markets, lower commodity prices and the social unrest in Hong Kong. Social unrest in Hong Kong has had a significant impact on the local economy and caused extensive disruption, which has been exacerbated by COVID-19 which is creating significant challenges across Greater China. We are very grateful for the continuing dedication, hard work and resilience of our people in the context of these substantial challenges and remain confident in the positive long-term outlook for the region and in Hong Kong’s future as a financial and commercial centre.
The financial and operational resilience of the Group’s businesses continues to be supported by its investment strategy and approach to capital allocation, which are focused on fast-growing consumer markets in Greater China and Southeast Asia. The Group continues to monitor the COVID-19 outbreak closely. Our priority is always the wellbeing of our people and customers and we will do all we can to ensure their safety and support them through this
Ben KeswickExecutive Chairman & Managing Director
Chairman’s Statement
difficult time. While the outlook is likely to continue to be challenging and performance in the year ahead will depend on the duration, geographic extent and impact of the COVID-19 outbreak and the measures taken to control it, the Group remains confident in the resilience of its businesses and is therefore confident in their longer-term prospects.
Underlying net profit for the year was down by 4% compared with the prior year, with a record year for Hongkong Land and solid performances from Jardine Pacific and Astra.
Dairy Farm’s ongoing multi-year transformation programme is beginning to deliver encouraging operational results, but difficult market conditions in Hong Kong impacted the reported financial performance of the business in the year.
Net non-trading items included the US$1.5 billion net gain from the disposal of the Group’s interest in Jardine Lloyd Thompson (‘JLT’) and the US$49 million net revaluation gain on other investments. These were partially offset by the US$337 million net revaluation loss arising from the annual revaluation of the Group’s investment properties.
Jardine Matheson Annual Report 2019
5Chairman’s Statement
PerformanceThe Group’s consolidated revenue for 2019 was US$40.9 billion, a decrease of 4% from the prior year. The Group’s gross revenue benefited from the inclusion of sales from the newly-acquired interest in Robinsons Retail, as well as a full twelve months’ revenue for Zhongsheng and Yonghui due to the timing of the reporting of their results.
Underlying profit before tax for the year was down 4% at US$4,678 million.
The underlying profit attributable to shareholders decreased by 4% to US$1,589 million, with underlying earnings per share also down by 4% to US$4.23.
Net profit including non-trading items was US$2,838 million.
The Group’s financial position remains strong, with shareholders’ funds up 16% at US$30.4 billion at the year end. Consolidated net borrowings excluding financial services companies was US$4.8 billion at 31st December 2019, representing gearing of 7%, down from 10% at the end of 2018, primarily due to the receipt of the proceeds from the sale of the Group’s interest in JLT.
The Board is recommending an unchanged final dividend of US$1.28 per share, which produces a full-year dividend of US$1.72 per share, up 1% from the prior year.
There was a solid performance from Hongkong Land, which achieved a further year of record underlying profit, reflecting steady earnings in investment properties, despite the social unrest in Hong Kong, and a stable performance from development properties, with a higher contribution from the Chinese mainland, offset by lower profits in other markets.
Jardine Pacific also delivered a satisfactory performance, with overall profit growth of 2% to US$164 million and strong performances by JEC and Gammon, offset by weaker performances by Jardine Restaurants and HACTL.
Chairman’s Statement
Astra delivered a resilient performance in 2019 in the face of relatively weak domestic consumption and low commodity prices, with strong contributions from its financial services and newly-acquired gold mining business, offset by weaker performances from heavy equipment, coal mining and agribusiness.
At Dairy Farm, the multi-year transformation programme to reshape and reorganise the business showed encouraging signs of progress in evolving its operations. Underlying profit was, however, lower than the prior year due to the impact of the social unrest in Hong Kong – with Mannings and Maxim’s most affected – as well as increased cost of goods and ongoing investments in its Home Furnishings business.
Strategic DevelopmentsThe Group has a strong presence in two of the fastest growing consumer markets in the world: Greater China and Southeast Asia. Greater China provides the larger contribution to the Group, underpinned by the Group’s significant presence in Hong Kong. The Chinese mainland is also a key market for the Group, contributing 21% of profits in the year, and the Group is focused on growing its businesses there further.
Hongkong Land diversified its investment properties portfolio with the strategic acquisition in February 2020 of a large predominantly commercial mixed-use site in a prime waterside location in Shanghai.
It also continues to consolidate its presence in the Chinese mainland in cities where it already has a presence, with a total of five new residential development sites secured in 2019.
The Group’s affiliates in the Chinese mainland, Zhongsheng and Yonghui, both had a good year in their underlying businesses.

Jardine Matheson Annual Report 2019
6
Southeast Asia is the other area of key focus for the Group. During the year Astra increased its stake in Gojek, Indonesia’s leading multi-platform technology group and it also formed a fleet management joint venture with Gojek to support their GoCar ride-hailing service. Astra also increased its toll road interests, with the acquisition of a 44.5% stake in the operator of the Surabaya-Mojokerto toll road and a further 10% stake in the operator of the Cikopo-Palimanan toll road.
Jardine Cycle & Carriage increased its stake in Truong Hai Auto Corporation (‘Thaco’) in the year. Thaco continues to diversify its business into property and agriculture, and these are expected to grow in importance going forward.
Significant long-term consumption growth is forecast in the Group’s core markets of the Chinese mainland and Southeast Asia, particularly from the growing and increasingly affluent middle class. The Group’s businesses are associated with some of the world’s top brands and are well placed to take advantage of compelling long-term market dynamics.
An important part of the Group’s strategy is to invest for growth and to build significant stakes in strong companies which are benefiting from the opportunities offered by the economic development of the region. The Group’s aim is to be the partner of choice for associates or joint ventures and to grow those businesses over time by developing strong relationships which add value through the Group’s role as a supportive shareholder to entrepreneurs and leading management teams.
The sale of the Group’s interest in JLT to Marsh & McLennan completed in April 2019. The US$2.1 billion net proceeds from the sale increase the financial strength of the Group, enhancing the Group’s ability to take advantage of opportunities in its core markets across Asia. No profit was recognised in respect of the interest in JLT from the beginning of January 2019 to the date of completion.
At Dairy Farm, the multi-year transformation programme to reshape and reorganise the business showed encouraging signs of progress in the year, with its space optimisation plan, new store formats and improvement programmes generating greater efficiencies and starting to deliver tangible results. The business is well-placed to grow and meet the changing demands of customers and to address the increasing disruption faced by the retail sector.
Mandarin Oriental opened four new hotels in the year and it is positive to see a further increase in the group’s pipeline of future hotels, with seven new management contracts signed and announced in the year, bringing the total number of announced projects under development which are expected to open in the next five years to 20. The Excelsior in Hong Kong closed in March 2019 for redevelopment as a mixed-use office and retail project, and the demolition phase started in September 2019. The project is expected to complete in 2025.
Looking forward, the Group anticipates that a number of its businesses will face increasing changes, both in technology and consumer behaviours, set against an increasingly complex operating environment. In order to ensure that all its businesses are well placed to benefit from these changes and deliver future growth, the Group has made it a priority to invest in and promote innovation, the development of talent and the adoption of sustainable business practices.
Chairman’s Statement
Forecast middle class consumption in Asia# (US$ trillion)
# Calculated at purchasing power parity in 2011 pricing in US dollars, published in 2017 by Kharas, Brookings Institution.
ChinaRest of Asia ex Japan, India
2020F
2030F
2015
0 5.0 10.0 15.0 20.0 25.0 30.0

Jardine Matheson Annual Report 2019
7
The financial and operational strength of the Group’s businesses continues to be supported by its investment strategy and approach to capital allocation. The Board keeps its portfolio of businesses under review and regularly assesses whether action is necessary to ensure that the Group’s activities remain aligned with its strategic priorities. In the past year such action has included the disposal of the Group’s interests in JLT and JOS, the conditional agreement by Astra to dispose of its interest in Permata Bank and the closure of The Excelsior for redevelopment as a commercial property.
PeopleSimon Keswick retired as a Director on 1st January 2020. On 20th January 2020, it was announced that Lord Sassoon will retire from the Board on 9th April 2020. The Board would like to record its gratitude to both of them for their significant contribution to the Group over many years. Stuart Gulliver joined the Board with effect from 1st January 2019.
As announced on 5th March 2020, with effect from 15th June 2020 the roles of Executive Chairman and Managing Director, which have been held on a combined basis by Ben Keswick since 31st December 2018, will revert to being separate. Ben Keswick will remain as Executive Chairman and John Witt, currently Group Finance Director, will take on the role of Managing Director. Graham Baker will join the Group and replace John Witt as Group Finance Director with effect from 15th June 2020. He will also join the Board of the Company.
OutlookWhile the short-term outlook is likely to continue to be challenging and performance in the year ahead will depend on the duration, geographic extent and impact of the COVID-19 outbreak and the measures taken to control it, the Group takes a long-term view and is confident in the underlying economic resilience of China and the wider region. The Group is optimistic about the prospects for a speedy recovery once the situation has stabilised and remains confident in the mid- to long-term prospects for its businesses and the markets in which they operate.
464,000 Employees by Business Units
Jardine Pacific 48,000
Jardine Motors 8,100
Hongkong Land 4,700
226,000 Astra
40,700 JardineCycle & Carriage
12,500 Mandarin Oriental
Dairy Farm 124,000
Chairman’s Statement

Jardine Matheson Annual Report 2019
8
Mandarin Oriental is an international hotel investment and management group with deluxe and first class hotels, resorts and residences in sought-after destinations. The group operates 33 hotels and seven residences in 23 countries and territories, and has a strong pipeline of properties under development. As an innovative industry leader, the group is committed to exceeding its guests’ expectations through exceptional levels of hospitality. (78%)†
Dairy Farm is a leading listed Pan-Asian multi-brand retailer that is active across five divisions, being Food (including Grocery Retail and Convenience Stores), Health and Beauty, Home Furnishings, Restaurants and Other Retailing. The group aims to provide quality and value to Asian consumers by offering leading brands, a compelling retail experience and great service, all provided through a strong store network supported by efficient supply chains. (78%)†
Astra is an Indonesia-based company engaged in seven business sections: Automotive; Financial Services; Heavy Equipment, Mining, Construction & Energy; Agribusiness; Infrastructure and Logistics; Information Technology; and Property. With more than 235 subsidiaries, associated companies and other entities, and over 226,000 employees, it is one of Indonesia’s largest companies. Astra is also renowned for its ‘Catur Dharma’ corporate philosophy that underpins its extensive community programmes supporting education, the environment, sustainability, SMEs and healthcare. Jardine Cycle & Carriage has a shareholding of just over 50% in Astra.
Jardine Cycle & Carriage is a leading Singapore-listed investment holding company with long-term, strategic interests in diversified market-leading businesses in Southeast Asia. These include Astra in Indonesia; Truong Hai Auto Corporation, Refrigeration Electrical Engineering Corporation and Vinamilk in Vietnam; and Thailand-headquartered Siam City Cement (which also operates in South Vietnam and other regional markets). Other investments include automotive businesses under the Cycle & Carriage banner (in Singapore, Malaysia and Myanmar) and Tunas Ridean in Indonesia, all of which are managed by Jardine International Motors. (75%)†
Jardine Matheson Group Businesses at a Glance
* Figures in brackets show effective ownership by Jardine Matheson as at 5th March 2020.† Figures in brackets show effective ownership by Jardine Strategic as at 5th March 2020.
The listed holding company of the Group which oversees a portfolio of market-leading businesses and supports their long-term development. It holds an 85% interest in Jardine Strategic, a listed company holding most of the Group’s major listed interests, including 58% of Jardine Matheson.
Jardine Matheson
Jardine Matheson has a long-term ambition to expand and strengthen its automotive businesses across the globe, building upon its extensive footprint in Greater China and Southeast Asia, and strong presence in the United Kingdom. Jardine International Motors (‘JIM’) was formed in 2019 to provide central management and oversight in order to effectively harness expertise and talent, increase customer focus and create economies of scale across the Group’s automotive interests in a coordinated way in an increasingly complex environment. JIM currently comprises leading Asian automotive businesses including Zung Fu Motors Group in the Chinese mainland, Hong Kong and Macau; Cycle & Carriage in Singapore, Malaysia and Myanmar; and Tunas Ridean in Indonesia.
Hongkong Land is a major listed property investment, management and development group that operates under the principles of excellence, integrity and partnership. Its more than 850,000 sq. m. of prime office and retail space in Hong Kong, Singapore, Beijing, Jakarta and other major Asian cities attracts the world’s foremost companies and luxury brands. The group also has a number of high quality residential, commercial and mixed-use projects under development in cities across Greater China and Southeast Asia. (50%)†
Jardine Pacific’s diverse portfolio comprises industry leaders in the areas of engineering and construction, aviation and transport services, restaurants and IT. Its companies seek to deliver excellent performance and best in class service to their customers and to create value for their business partners and shareholders. (100%)*

Jardine Matheson Annual Report 2019
9
Jardine Matheson is a diversified group of market-leading businesses focused principally on two of the regions that are driving global growth: Greater China and Southeast Asia. In 2019, 58% of the Group’s underlying profit came from Greater China compared to 56% in 2018 – with stronger performance from the Chinese mainland but a lower contribution from Hong Kong – and 42% from Southeast Asia, compared with 40% in 2018.
The main contributors to underlying profit by activity were property at 29%, automotive interests at 24%, engineering, heavy equipment, mining, construction and energy at 19% and retail and restaurants at 16%.
The Group’s profit generation and related cash flows and retained earnings have supported continued investment, enabling high levels of capital expenditure to be combined with low levels of debt. The Group’s capital investment, including expenditure on properties for sale, was US$5.8 billion in 2019, and capital investment at its associates and joint ventures exceeded US$4.8 billion.
Managing Director’s Review
Total Capital Investment of US$10.6 billion (US$ million)
2,327 Astra
1,285 JardineCycle & Carriage
228 Mandarin Oriental
Corporate 357
Jardine Pacific 157
Jardine Motors 63
Hongkong Land 4,428 1,725 Dairy Farm
The Group remains focused on the opportunities and challenges presented by changing technologies and digitalisation. Its innovation agenda has continued to progress in the last year and has included the appointment of a new Group Director of Digital, who is leading the further development of the Group’s digital and innovation strategy. There is a particular focus on modernising the Group’s core business operations – looking at opportunities to leverage digital and new ways of working to drive a modern, efficient operating environment – and on using digital to help drive the Group’s revenue generating capabilities in both its consumer-facing and business-to-business operations.
The Group is also focused on broadening and deepening capability across its businesses. Over the past year the Group has increased its investment in meeting the needs of its people, by promoting lifelong learning and training, including the rollout of a range of new and improved senior leadership programmes and the implementation of digital learning platforms; offering greater career opportunities; enhancing the Group’s employer brand (including strengthening the Group’s graduate training programme); and recruiting a range of new skills and resources into the business.
The Group takes its responsibility as a corporate citizen seriously and believes that it is essential for a proactive approach to sustainability to be taken both at a Group level and among its businesses. A sustainability leadership council, comprising senior management from across the Group’s businesses, was established in 2019 and it has recently formulated and adopted a Group sustainability strategy, with input from colleagues across the business, which will be progressively implemented in the coming year.
Ben KeswickExecutive Chairman & Managing Director
The Board is confident that the Group’s strong balance sheet, liquidity and clear strategic priorities will position Jardine Matheson well for strong long-term growth.
The Group provides its businesses with access to the financial resources, expertise, people and relationships necessary to support their development and enable them to compete effectively in rapidly evolving operating environments. The Group’s strategy, strong financial position and investment in the development of both existing businesses and new areas of activity provide the foundation for consistent profit growth over the long term.

Jardine Matheson Annual Report 2019
10 Managing Director’s Review
Jardine Pacific• Underlying profit 2% higher than prior year
• JEC and Gammon delivered strong profit growth
• Jardine Restaurants profits impacted by difficult trading conditions in Hong Kong
Underlying Profit by Business (excluding Corporate & Other Interests) (US$ million)
Gross Revenue (US$ billion)
Underlying Profit Attributable to Shareholders* (US$ million)
2019 2018restated
Change (%)
Gross revenue (including 100% of associates and joint ventures) (US$ billion) 6.8 6.8 –
Underlying profit attributable to shareholders (US$ million) 164 160 2
Jardine Pacific produced an underlying net profit of US$164 million, 2% higher than 2018. The net profit after non-trading gains was US$285 million.
JEC delivered strong profit growth, primarily from its Hong Kong operations and in part as a result of its earlier investment in modernising its core business and increasing revenues via business efficiency initiatives. Gammon saw good profit growth, mainly due to the timing of project completions. Its order book remains strong. Jardine Schindler provided a slightly lower contribution as a result of challenging market conditions in Southeast Asia. Jardine Restaurants saw profits impacted by difficult trading conditions in Hong Kong and the upfront costs of its investment in process re-engineering projects in Hong Kong and Taiwan. KFC Taiwan produced good profit growth. HACTL’s performance was down against last year, due to a reduction in cargo throughput tonnage.
JTH performed well as both JOS and Innovix delivered better results. The sale of the JOS business was completed in December 2019.
Hong Kong-listed Greatview, in which a 28% stake has been held by Jardine Strategic since June 2017, continued to see volume growth despite intense competition in the China segment and lower sales from its international division.
* 2018 figure is restated.
Gross Revenue (US$ million)Jardine Pacific’s
6.2
6.3
6.6
6.8
2016
2017
2018
2015
2019 6.8
Underlying Profit Attributable to Shareholders (US$ million)Jardine Pacific’s
142
135
162
160
2016
2017
2018
2015
2019 164
18 Transport Services
13 Jardine Restaurants
7 JTH
Gammon 36
JEC 41
Jardine Schindler 48
Jardine Matheson Annual Report 2019
11Managing Director’s Review
Revenue* (US$ billion)
Underlying Profit Attributable to Shareholders*# (US$ million)
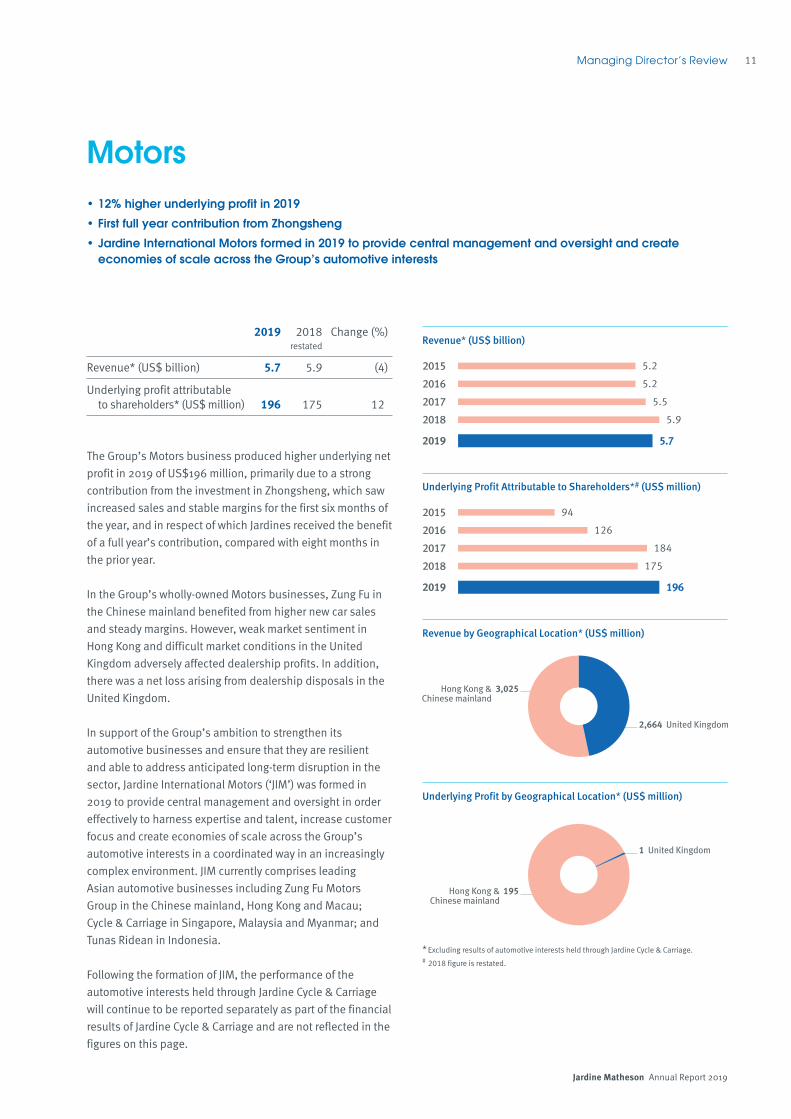
• 12% higher underlying profit in 2019
• First full year contribution from Zhongsheng
• Jardine International Motors formed in 2019 to provide central management and oversight and create economies of scale across the Group’s automotive interests
Revenue by Geographical Location* (US$ million)
Underlying Profit by Geographical Location* (US$ million)
2019 2018restated
Change (%)
Revenue* (US$ billion) 5.7 5.9 (4)
Underlying profit attributable to shareholders* (US$ million) 196 175 12
The Group’s Motors business produced higher underlying net profit in 2019 of US$196 million, primarily due to a strong contribution from the investment in Zhongsheng, which saw increased sales and stable margins for the first six months of the year, and in respect of which Jardines received the benefit of a full year’s contribution, compared with eight months in the prior year.
In the Group’s wholly-owned Motors businesses, Zung Fu in the Chinese mainland benefited from higher new car sales and steady margins. However, weak market sentiment in Hong Kong and difficult market conditions in the United Kingdom adversely affected dealership profits. In addition, there was a net loss arising from dealership disposals in the United Kingdom.
In support of the Group’s ambition to strengthen its automotive businesses and ensure that they are resilient and able to address anticipated long-term disruption in the sector, Jardine International Motors (‘JIM’) was formed in 2019 to provide central management and oversight in order effectively to harness expertise and talent, increase customer focus and create economies of scale across the Group’s automotive interests in a coordinated way in an increasingly complex environment. JIM currently comprises leading Asian automotive businesses including Zung Fu Motors Group in the Chinese mainland, Hong Kong and Macau; Cycle & Carriage in Singapore, Malaysia and Myanmar; and Tunas Ridean in Indonesia.
Following the formation of JIM, the performance of the automotive interests held through Jardine Cycle & Carriage will continue to be reported separately as part of the financial results of Jardine Cycle & Carriage and are not reflected in the figures on this page.
Motors
Revenue (US$ million)Jardine Motors
5.2
5.2
5.5
5.9
2016
2017
2018
2015
2019 5.7
Underlying Profit Attributable toShareholders (US$ million)Jardine Motors
94
126
184
175
2016
2017
2018
2015
2019 196
3,025Hong Kong &Chinese mainland
2,664 United Kingdom
1 United Kingdom
195Hong Kong &Chinese mainland
* Excluding results of automotive interests held through Jardine Cycle & Carriage.# 2018 figure is restated.

Jardine Matheson Annual Report 2019
12 Managing Director’s Review
2019 2018 Change (%)
Underlying profit attributable to shareholders (US$ million) 1,076 1,036 4
Gross assets (US$ billion) 41.9 41.9 –
Net asset value per share (US$) 16.39 16.43 –
Hongkong Land achieved a further year of record underlying profit growth, with a 4% increase to US$1,076 million. The group’s Investment Properties business maintained stable profits and Development Properties achieved a solid performance, building on a strong previous year, with a higher contribution from the Chinese mainland partially offset by lower contributions from other markets.
Including net losses of US$878 million resulting from lower valuations of the group’s investment properties, profit attributable to shareholders was US$198 million. This compares to US$2,457 million in 2018, which included net revaluation gains of US$1,421 million. The group remains well-financed, with net debt of US$3.6 billion at the year end, broadly unchanged from the end of 2018 and with net gearing unchanged at 9%. Net debt will increase in 2020 as payments are made for land purchases to which the group has already committed.
Investment PropertiesIn Hong Kong, office leasing activities in Central were slower in 2019 compared to the prior year as a result of uncertainties caused by the China-US trade negotiations and the social unrest in Hong Kong. The performance of the group’s Central office portfolio, however, continues to be resilient and rental reversions remain positive, with average office rents increasing during the year. The Central retail portfolio remains fully occupied and retains its reputation as Hong Kong’s premier shopping destination. It delivered a respectable performance over the Christmas period following several challenging months for the retail market in Hong Kong. Average retail rents decreased in the year, however, due to temporary rent relief as a result of the social unrest.
The value of the group’s Hong Kong Investment Properties portfolio decreased by 2% in the year due to lower open market rents. There was slightly higher vacancy in the group’s Singapore office portfolio, but rental reversions were positive and average rents increased in the year.
In February 2020, Hongkong Land acquired a large site in a prime location along the Huangpu River in the Xuhui District of Shanghai, the predominant commercial hub in the Chinese mainland. The acquisition illustrates our long-term confidence in the Chinese mainland and provides an attractive opportunity to develop and operate a commercial complex of scale in line with the group’s long-term strategy of acquiring prime sites in key gateway cities across Asia. The project mainly comprises office and retail space, with a developable area of 1.1 million sq. m., and will be developed in multiple phases to 2027.
Development Properties2019 was a solid year for the group’s Development Properties, building on a strong year in 2018, with a higher contribution from the Chinese mainland partially offset by lower contributions from other markets. In the Chinese mainland, sentiment in the group’s core markets remained broadly stable. Higher sales completions led to an increase in profit contribution, whilst the group’s attributable interest in contracted sales was higher than 2018 due to a change in sales location mix.
During the year, the group acquired five new residential sites in the Chinese mainland – all in cities where it already has a presence – with a wholly-owned project in each of Chongqing and Hangzhou, and joint ventures in each of Chongqing, Shanghai and Wuhan.
In Singapore, profits recognised in 2019 were lower than the prior year, while pre-sales at projects under construction were within expectations. The group’s joint venture projects in the rest of Southeast Asia performed within expectations.
Hongkong Land• Underlying profit up 4% to a record US$1,076 million
• Net asset value per share stable
• Large strategic mixed-use site secured in Shanghai
• Six other new projects acquired including five in the Chinese mainland

Jardine Matheson Annual Report 2019
13Managing Director’s Review
Underlying Profit Attributable to Shareholders (US$ million)
Net Asset Value per Share (US$)
China
Hong Kong
Thailand
Malaysia
Singapore
Indonesia
PhilippinesVietnam
Macau
Cambodia
Underlying Operating Profit by Activity (before corporate costs) (US$ million)
Gross Assets by Activity
Investment Properties – Office
Investment Properties – Retail
Development Properties
Underlying Earnings per Share (US¢)Hongkong Land
930
822
947
1,036
2016
2017
2018
2015
2019 1,076
Net Asset Value per Share (US$)Hongkong Land
12.24
13.34
15.66
16.43
2016
2017
2018
2015
2019 16.39
675 Development Properties
1,064Investment Properties
87%Investment Properties
13% Development Properties
Gross Assets by Location
Hong Kong 74%
13% Chinese mainland & Macau
13% Southeast Asia
1.2 million sq. m.Area of commercial investment portfolio under management (including 100% of joint ventures)

Jardine Matheson Annual Report 2019
14 Managing Director’s Review
2019 2018restated
Change (%)
Sales including 100% of associates & joint ventures (US$ billion) 27.7 22.0 26
Sales (US$ billion) 11.2 11.7 (5)
Underlying profit attributable to shareholders (US$ million) 321 358 (10)
Dairy Farm’s multi-year transformation programme to reshape and reorganise the business, adapting to the changing needs of customers, continued to gain momentum during 2019. Opportunities are being unlocked across the group as the business seeks to leverage its scale effectively and develop a more coherent approach to improving its customer proposition, both by banner and at a country level. The group’s space optimisation plan, new store formats and improvement programmes generated greater efficiencies and started to deliver tangible results in the year.
Consistent with Dairy Farm’s strategy of proactively managing its business portfolio as well as the ongoing execution of its space optimisation plan, sales of US$11.2 billion for the year by Dairy Farm’s subsidiaries were 5% behind those of 2018. Underlying operating profit was US$437 million, 14% lower than 2018, primarily due to the impact of the social unrest in Hong Kong, whose impact was felt to the greatest extent by Mannings, as well as increased cost of goods and ongoing investments in the Home Furnishings business. Underlying profit attributable to shareholders was US$321 million, down 10% from US$358 million last year.
Grocery Retail2019 saw a significant improvement in results in Dairy Farm’s Southeast Asia Grocery Retail businesses, as its space optimisation plan took effect. The foundations for future growth by the business were also strengthened by the ongoing transformation and improvement programmes. North Asia Grocery Retail sales were stronger, but overall profits there were weaker, impacted by cost pressures and investments in people and capabilities, although the Wellcome Hong Kong business delivered an improving trend in underlying profit performance.
ConvenienceSales in the Convenience business increased in the year, driven by new store growth and strong like-for-like sales in the Chinese mainland in particular. Enhancements to range and services are popular with customers and there is a focus on brand differentiation to support sales growth. Profits for the year declined, however, due primarily to investments in the expansion of the 7-Eleven store network in Guangdong. Profits in 2018 were also positively impacted by one-off items which were not repeated in 2019.
Health and BeautyTotal sales for Dairy Farm’s Health and Beauty business increased slightly, with strong growth in Southeast Asia, but operating profit declined, as the business was impacted by the challenging market conditions in Hong Kong. The group has been addressing these challenging conditions by adapting its offer to changing customer needs as well as prudent management of costs.
Weakness in North Asia Health and Beauty was partially offset by strong revenue and like-for-like sales growth in Southeast Asia, particularly in Indonesia and Malaysia. Guardian in Southeast Asia delivered a strong performance during the year, with improvements in operating standards, service and product availability, and it benefited from a growing middle-class customer base in Indonesia, Malaysia, and Vietnam.
• Multi-year transformation making progress
• Underlying profit impacted by social unrest in Hong Kong
• Improvement in Southeast Asia Grocery Retail and Health and Beauty
Dairy Farm
Jardine Matheson Annual Report 2019
15Managing Director’s Review
* 2018 figure is restated.# Including share of associates and joint ventures.† Based on operating profit before effect of adopting IFRS 16 and share of results of
associates and joint ventures, and excluding selling, general and administrative expenses and non-trading items.
Δ Including 100% of associates and joint ventures.
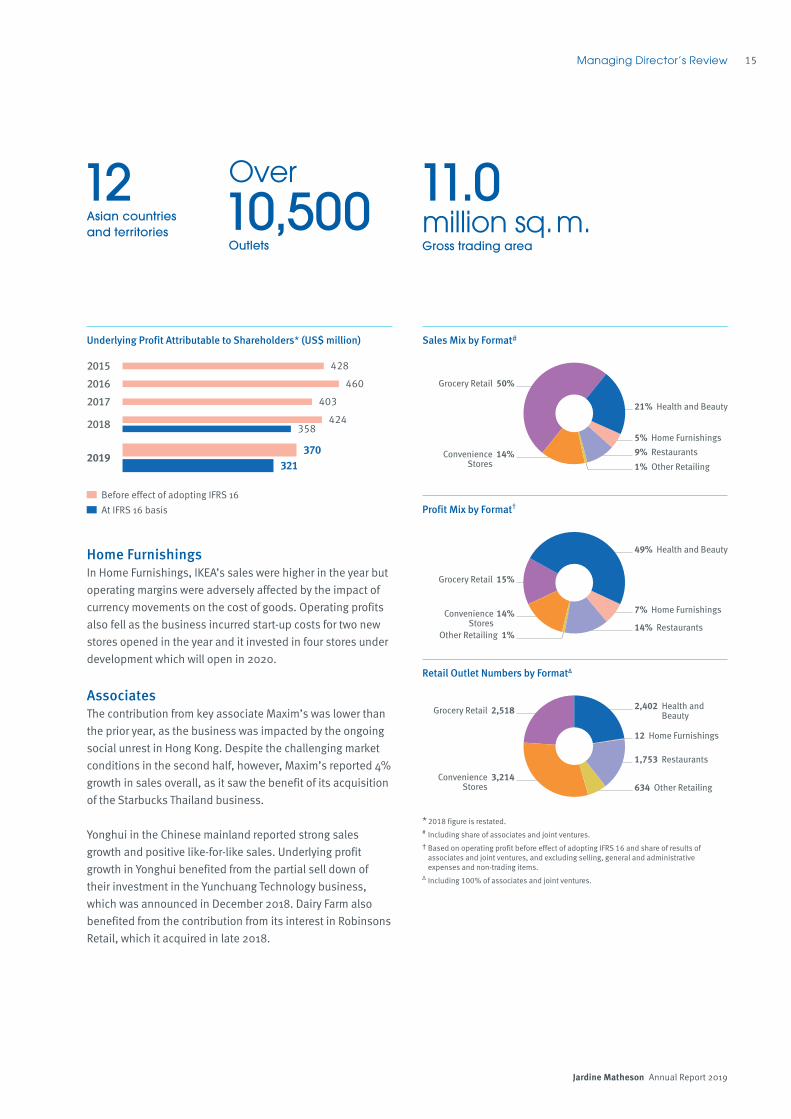
Sales Mix by Format#
Profit Mix by Format†
Retail Outlet Numbers by FormatΔ
12Asian countries and territories
Over
10,500Outlets
11.0million sq. m.Gross trading area
Underlying Profit Attributable to Shareholders* (US$ million)
Underlying Profit Attributableto Shareholders (US$ million)Dairy Farm
Before effect of adopting IFRS 16At IFRS 16 basis
358
428
460
403
424
370321
2015
2016
2017
2018
2019
Grocery Retail 50%
21% Health and Beauty
5% Home Furnishings9% Restaurants
1% Other Retailing14%Convenience
Stores
Grocery Retail 15%
14%Convenience Stores
49% Health and Beauty
7% Home Furnishings
14% RestaurantsOther Retailing 1%
Grocery Retail 2,518 2,402 Health and Beauty
12 Home Furnishings
1,753 Restaurants
634 Other Retailing 3,214Convenience
Stores
Home FurnishingsIn Home Furnishings, IKEA’s sales were higher in the year but operating margins were adversely affected by the impact of currency movements on the cost of goods. Operating profits also fell as the business incurred start-up costs for two new stores opened in the year and it invested in four stores under development which will open in 2020.
AssociatesThe contribution from key associate Maxim’s was lower than the prior year, as the business was impacted by the ongoing social unrest in Hong Kong. Despite the challenging market conditions in the second half, however, Maxim’s reported 4% growth in sales overall, as it saw the benefit of its acquisition of the Starbucks Thailand business.
Yonghui in the Chinese mainland reported strong sales growth and positive like-for-like sales. Underlying profit growth in Yonghui benefited from the partial sell down of their investment in the Yunchuang Technology business, which was announced in December 2018. Dairy Farm also benefited from the contribution from its interest in Robinsons Retail, which it acquired in late 2018.

Jardine Matheson Annual Report 2019
16 Managing Director’s Review
• Lower earnings in Hong Kong
• London hotel fully re-opened
• Commenced redevelopment of The Excelsior site
• Four new hotels opened and seven new management contracts signed
Combined Total Revenue of US$1,325 million of Hotels under Management by Geographical Area (US$ million)
Underlying Profit Attributable to Shareholders (US$ million)
Net Asset Value per Share* (US$)
* With freehold and leasehold properties at valuation.
2019US$m
2018US$m
Change (%)
Combined total revenue of hotels under management 1,325 1,398 (5)
Underlying profit attributable to shareholders 41 65 (37)
Mandarin Oriental’s underlying profit significantly decreased from US$65 million in 2018 to US$41 million in 2019, as a result of the closure of The Excelsior, the social unrest in Hong Kong and the major renovation in Bangkok. Earnings benefited, however, from the reopening of the London hotel following the fire in 2018 and the receipt of insurance proceeds following the final settlement of the insurance claim in respect thereof.
The majority of the group’s owned or partially-owned properties reported better earnings. The remainder of portfolio performed broadly in line with last year.
Several non-trading items were recognised during the year, including closure costs relating to The Excelsior and a decrease in its valuation, resulting in a loss attributable to shareholders of US$56 million in the year, compared to a profit attributable to shareholders of US$43 million in 2018.
The Excelsior in Hong Kong closed in March 2019 for redevelopment as a commercial property, and the demolition phase started in September 2019. The project is expected to take around six years to complete.
The group opened four new hotels in 2019 in Dubai, Doha, Beijing and Lake Como. The group continues to build its development pipeline, with seven new management contracts signed and announced in 2019, including six new hotels and one standalone Residences project. New Mandarin Oriental hotels were announced in Istanbul, Nanjing, Lake Lucerne, Dallas and Tel Aviv and the group took over management of The Emirates Palace in Abu Dhabi at the beginning of 2020.
Mandarin Oriental
Underlying Profit Attributable to Shareholders (US$ million)MO
90
57
55
65
2016
2017
2018
2015
2019 41
Net Asset Value per Share* (US$)MO
2.84
3.10
4.57
4.62
2016
2017
2018
2015
2019 4.70
The Americas 349
448 Other Asia
188 Hong Kong
340Europe & Middle East
Hotel and Residences Portfolio
# Number of hotels in operation is representative of up to the end of February 2020.MO
Number of hotels in operationNumber of hotels and residences expected to open in the next five years
29
29
31
30
19
13
18
18
33#
20
2015
2016
2017
2018
2019

Jardine Matheson Annual Report 2019
17Managing Director’s Review
Jardine Cycle & Carriage• Underlying profit at US$863 million
• Stable performance from Astra
• Direct Motor Interests down due to Singapore and Malaysia
• Other Strategic Interests impacted by Thaco’s lower automotive profits
Underlying Profit (excluding Astra, DMI central overheads and Corporate) of US$192 million by Business (US$ million)
Revenue (US$ billion)
Underlying Profit Attributable to Shareholders* (US$ million)
2019 2018restated
Change (%)
Revenue (US$ billion) 18.6 19.0 (2)
Underlying profit attributable to shareholders (US$ million) 863 856 1
Underlying profit attributable to shareholders at Jardine Cycle & Carriage (‘JC&C’) was 1% higher at US$863 million and profit attributable to shareholders increased to US$881 million from US$418 million in 2018, which included net non-trading losses of US$438 million, principally fair value losses related to non-current investments. Astra’s contribution to underlying profit of US$716 million was relatively stable compared to the previous year, while the contributions from the group’s Direct Motor Interests and Other Strategic Interests were both lower.
Direct Motor Interests Direct Motor Interests contributed US$63 million to the group’s underlying profit, 11% lower than the prior year. The contribution from Cycle & Carriage Singapore (‘CCS’) fell, with car sales growing despite a decrease in the overall Singapore passenger car market, but lower margins due to stronger competitive pressure. CCS’ market share increased as a result of the launch of new models and competitive pricing.
In Indonesia, Tunas Ridean saw a stronger contribution from its automotive and consumer finance operations but lower profits from its rental business. Cycle & Carriage Bintang in Malaysia made a loss in 2019, compared to a profit in 2018.
Other Strategic Interests The contribution from Other Strategic Interests was 13% lower at US$126 million. Other Strategic Interests now include Thaco consistent with its expanding investments in property and agriculture. Thaco’s contribution of US$49 million was 34% lower than last year, due to a lower contribution from its automotive business following a decline in vehicle sales and lower margins in a competitive market. The contribution from Thaco’s real estate business was significantly lower due to the slowdown in the property market. The group increased its interest in Thaco from 25.3% to 26.6% during the year, for a consideration of US$168 million.
Siam City Cement’s contribution of US$24 million was 16% higher than the previous year. Its improved domestic performance in Thailand was offset by a lower contribution from its regional operations, in particular in South Vietnam.
* 2018 figure is restated.
The contribution from Refrigeration Electrical Engineering Corporation (‘REE’) was 4% lower than the previous year, due to weaker performances from its hydropower investments and its M&E business, which were partially offset by a stronger contribution from real estate. JC&C increased its stake in REE during the year from 24.9% to 29.0% for US$25 million, by way of a public tender offer and market purchases.
The group’s investment in Vinamilk delivered dividend income of US$36 million, compared to US$32 million in the previous year. Vinamilk’s 2019 profit was 3% higher in local currency terms.
Revenue (US$ billion)Jardine C&C
15.7
15.8
17.3
19.0
2016
2017
2018
2015
2019 18.6
Underlying Profit Attributable to Shareholders (US$ million)Jardine C&C
632
679
770
856
2016
2017
2018
2015
2019 863
(6) Cycle & CarriageBintang
Siam City Cement 23
18RefrigerationElectrical
Engineering
Vinamilk 36
Other Strategic Interests:
Direct Motor Interests:
57 Cycle & CarriageSingapore
19 Tunas Ridean
(4) Cycle & CarriageMyanmar
49Thaco

Jardine Matheson Annual Report 2019
18 Managing Director’s Review
• Net earnings per share stable at Rp536
• Motorcycle sales up 3% but car sales down 8%, both with increased market shares
• Higher earnings contribution from financial services and gold mining operation
• Heavy equipment, coal mining and agribusiness activities impacted by lower commodity prices
2019 2018 Change* (%)
Net revenue# (US$ billion) 16.8 16.8 (1)
Profit attributable to shareholders* (US$ million) 1,536 1,519 –
*Based on the change in Indonesian rupiah, being the reporting currency of Astra.# Reported under Indonesian GAAP.
Astra’s net profit for 2019 under Indonesian accounting standards was Rp21.7 trillion, equivalent to US$1.5 billion. The group’s net debt, excluding financial services subsidiaries, was Rp22.2 trillion, equivalent to US$1.6 billion, at 31st December 2019, compared with Rp13.0 trillion, equivalent to US$0.9 billion, at the end of 2018, due mainly to the group’s further investments in its toll road businesses and Gojek, as well as capital expenditure in its mining contracting business.
AutomotiveNet income from Astra’s automotive division was down 1% at US$594 million. This was mainly due to lower car sales volumes and increased manufacturing costs, partially offset by higher motorcycle sales volumes. Car sales were 8% lower. The Indonesian wholesale market declined by 11% in 2019 but Astra increased its market share from 51% to 52%.
Motorcycle sales increased by 3% in the year. The Indonesian wholesale market increased by 2%, with Astra’s market share slightly higher at 76%. Astra Otoparts reported a 21% increase in net income, largely due to higher revenue from the replacement market and lower production costs.
Financial ServicesNet income from Astra’s financial services division increased by 22% to US$415 million, mainly due to a larger loan portfolio and an improvement in non-performing loans. Consumer finance businesses saw an 8% increase in the amount financed to US$6.2 billion. The net income contribution from Astra’s car-focused finance companies increased by 29% to US$106 million, with lower non-performing loan losses. The net income contribution from the group’s motorcycle-focused finance business increased by 11% to US$187 million, mainly due to a larger loan portfolio.
The group’s heavy equipment-focused finance operations saw an 18% decrease in the amounts financed to US$302 million. The net income contribution from this business grew, however, by 14% to US$7 million, as a result of lower loan provisions.
Permata Bank reported a 66% increase in net income to US$106 million, due to improved revenue and lower loan impairment levels, attributable to improved loan quality and better levels of recovery from non-performing loans. The bank’s gross and net non-performing loan ratios both improved. General insurance company Asuransi Astra Buana reported 4% growth in net income at US$77 million, with increased investment income.
Heavy Equipment, Mining, Construction and EnergyNet income from Astra’s heavy equipment, mining, construction and energy division increased by 1% to US$475 million, mainly due to the contribution from the new gold mining operation, offset by the impact of lower
Astra

Jardine Matheson Annual Report 2019
19Managing Director’s Review
heavy equipment sales and a loss incurred in the general contracting business. United Tractors reported a 2% increase in net income to US$801 million. Agincourt Resources achieved gold sales of 410,000 oz. Komatsu heavy equipment sales fell by 40%, with parts and service revenues also lower.
Mining contracting operations saw a 1% higher overburden removal volume at 989 million bank cubic metres, and 5% higher coal production at 131 million tonnes. Coal mining subsidiaries were adversely impacted by lower coal prices.
General contractor Acset Indonusa reported a net loss of US$77 million, compared to a net income of US$1 million the year before. This was mainly due to increased project and funding costs for several ongoing contracts.
Infrastructure and LogisticsNet income from Astra’s infrastructure and logistics division increased by 49% to US$21 million, mainly due to improved toll road revenue, reflecting 22% higher traffic volume in Astra’s 350km of operational toll roads along the Trans-Java network and the Kunciran Serpong toll road. Serasi Autoraya’s net income decreased by 17% to US$18 million, due to lower used car sales and a decline in its car leasing business.
AgribusinessNet income from Astra’s agribusiness was down by 85% at US$12 million. This was primarily due to an 8% fall in average crude palm oil prices, despite a 3% increase in crude palm oil and derivatives sales to 2.3 million tonnes. There have, however, recently been encouraging signs of improvement in prices.
Profit Attributable to Shareholders of US$1,536 million by Business (US$ million)
Motorcycle Sales including Associates and Joint Ventures (thousand units)
Motor Vehicle Sales including Associates and Joint Ventures (thousand units)
Motor Vehicle Sales including Associatesand Joint Ventures (thousand unitsAstra
510
591
579
582
2016
2017
2018
2015
2019 536
Motorcycle Sales including Associates and Joint Ventures (thousand units)Astra
4,454
4,381
4,386
4,759
2016
2017
2018
2015
2019 4,911
Heavy Equipment,Mining,
Construction& Energy
475
Financial Services 415
Automotive 594
12 Agribusiness
6 Property
14 InformationTechnology
20 Infrastructure & Logistics
US$302m2019 New heavy equipment financing
US$6.2bn2019 New consumer financing
76%2019 New motorcycles market share
52%2019 New motor car market share

Jardine Matheson Annual Report 2019
20
MINDSET Mental Health ProgrammeJardine Ambassadors (young executives from Group businesses in Hong Kong and Singapore) lead the MINDSET programme, which has helped to de-stigmatise issues related to mental health, and support people in recovery, since it was launched in Hong Kong in 2002 and Singapore in 2011.
Hong KongThe Hong Kong ambassadors organised the 34th annual Walk Up Jardine House in April 2019, raising US$420,000, and also supported the Health in Mind education programme, involving more than 450 students from 30 secondary schools in 2018-19.
Another initiative – MINDSET College – helped more than 1,800 people, including people in recovery and the public, learn new skills and improve their mental wellbeing. The MINDSET Buddy Sailing programme enabled more than 40 people in recovery learn to sail and enjoy the outdoors.
The Group’s approach to MINDSET will be refreshed going forward, with the launch of new activities aimed at making a bigger impact in Hong Kong and involving more employees in volunteering opportunities.
SingaporeDigitalMINDSET, a programme addressing excessive gaming and device use issues impacting teens was launched in 2019. Run in partnership with TOUCH Community Services, DigitalMINDSET provides counselling, therapy and mentoring services for at-risk teens and their families.
The Together Against Stigma 2019 Global Conference was held in October – attended by over 500 delegates from 24 countries – and focused on current mental health issues and help programmes.
To raise awareness of mental health in the workplace, MINDSET was also invited to the Singapore Exchange (‘SGX’) to open the securities market on 16th December.
The MINDSET Challenge & Carnival also was held in October to support the MINDSET Learning Hub. The carnival has raised over US$1 million for the hub since 2011. A MINDSET Success Video Series – profiling the work experiences of people in recovery – was also launched.
People and the Community
Just as Jardine Matheson Group companies have helped shape Asia’s business landscape for more than 180 years, its enterprises, and employees also contribute to community projects that have improved the lives of many.
FundraisingIn Hong Kong, the CENTRAL Rat Race team organised a series of STEAM educational workshops that enabled families and NGOs to enjoy music, and arts and crafts activities.
The Teddy Love Project run by Zung Fu – selling charity teddy bears – with support from Mercedes-Benz Hong Kong raised funds to purchase a new Mercedes-Benz Vito van for the New Life Psychiatric Rehabilitation Association. The van will transport mental health patients to activities and social enterprise programmes.
Supporting Asia’s Scholars and Future LeadersThe Jardine Foundation awarded scholarships for the academic year 2019/20 to 30 Jardine Scholars (14 undergraduate and 16 postgraduate students) from nine countries and regions to study at Oxford and Cambridge Universities. The programme has supported more than 320 scholars since its foundation in 1982.
To celebrate its 120th anniversary in 2019, Jardine Cycle & Carriage (‘JC&C’) launched the JC&C Scholarship scheme to support undergraduate students pursuing a broad range of disciplines in Indonesia, Malaysia, Myanmar, Singapore, Thailand and Vietnam. Their tuition fees will be sponsored through long-term endowments and donations, and about 70 Southeast Asian students will receive awards under the scheme over the next 10 years.
Community Focus in Indonesia Some of Astra’s key citizenship efforts in 2019 included the Kampung Berseri Astra (‘KBA’) village development programme which has so far supported 86 KBA and 645 Desa Sejahtera Astra (Prosperous Village) villages in 34 provinces.
Inspiring Indonesia’s Generation-Z leaders in health, education, environment, and technology was the focus of the SATU Indonesia awards that attracted 8,654 applicants, and rewarded 305 youth leaders with funding and coaching to develop their ideas.
Let’s Play for Change by IKEA Indonesia and Save the Children Indonesia raised awareness about the importance of play. Activities included the set-up of a play area in the IKEA store in Jakarta, and a soft toy fundraising promotion to support Save the Children’s programme for disabled children.

Jardine Matheson Annual Report 2019
21
Making a Difference in SingaporeJC&C donated US$7,200 to the National University of Singapore’s (‘NUS’) Institute of Policy Studies (‘IPS’) – JC&C has supported the NUS IPS since 2005. This donation helps support IPS research efforts into a range of social issues including ageing populations, social mobility, diversity, and more.
JC&C also sponsored the SGX Bull Charge Charity Run 2019, which targeted Singapore’s financial sector and SGX-listed company professionals. Money raised was donated to the Community Chest to support their adopted beneficiaries.
Growing our Green FootprintSustainability was a key area of focus across our Group companies in 2019, with a wide range of initiatives undertaken, including:
Hongkong Land continues to carry out a range of initiatives to reduce carbon, and its carbon emissions are 30% lower today than 2008 levels, and it is planned to reduce this further by 2030. Their projects also continue to receive green building accolades and awards across the region, with many recognised for their industry-leading standards against a range of benchmarks.
Dairy Farm partnered with waste industry experts to find new ways to reduce and better manage single use beverage packaging waste in Hong Kong.
Hunan and Guangzhou Zung Fu ran two workshops for customers in 2019, to showcase energy saving driving tips, such as turning off idling engines and reducing the use of air conditioning.
HACTL’s Solar Farm installation started operations in 2019. Comprising 516 panels, the 1,600 sq. m. system generated 20,000 kWh of energy in its first month and a 10,000 kg reduction in CO2.
Mandarin Oriental hotels diverted over 57,000 kg of used soap and bottled guestroom amenities from landfill, and donated these to support those in need through a partnership with Clean the World. A major photovoltaic (‘PV’) renewable energy system was installed at the Gammon Technology Park in Hong Kong’s Tseung Kwan O Industrial Estate in 2019. The 200 kWp capacity system generates around 276 megawatt-hours of electricity per year and is the third, and largest, PV system installed by Gammon.
People and the Community
Community CareJardine Motors Group UK participates in the Speakers for Schools programme, which supports young people seeking career advice and opportunities in a wide range of sectors including motoring.
Since 2000, Mandarin Oriental’s award-winning advertising campaign He’s a Fan/She’s a Fan, continues to win support around the world, and has helped to donate over US$500,000 to local and international charities supported by our philanthropic fans.
JEC Thailand held its 7th major CSR initiative – Jardine Jit Arsa 2019 with the aim of creating a sustainable environment for future generations. To support this, volunteers installed clean water facilities and helped renovate a village school last year.
VolunteeringVolunteers from Hero Group ran the Belanja Bareng (shopping together) programme teaching children – including local orphans – the benefits of using recycled bags for shopping. And through the Greenspiring Education initiative, Hero volunteers and children helped create an urban forest.
In June, Pizza Hut Myanmar colleagues served meals to more than 300 patients and their families at the Yangon Children’s Hospital and donated dental hygiene products to the children.
Jardine Schindler employees partnered with the Taiwan Fund for Children and Family to build bicycles for families that have no means of transportation.
Transformative InnovationDeveloping innovative business opportunities, talent and industry solutions is another priority for the Group and there was extensive activity in this area in 2019, including:
A joint venture between Bank of China Hong Kong, JD Digits, and Jardines to launch a virtual bank in Hong Kong was announced in April. Offering banking services via mobile and online platforms only, the virtual bank – named livi – will target a broad range of customers when it is launched in 2020.
Inspiring Asia’s new generation of entrepreneurs was the focus of a joint project between Jardines and Daimler. They hosted the first Hack.Asia hackathon that attracted over 800 Asian students (in 320 teams) who pitched data-driven solutions to address future of commerce, sustainability and mobility challenges.
In 2019, Gammon developed and launched Inspecto™, a digital solution which significantly enhances construction site inspection processes among contractors, consultants and clients.

Jardine Matheson Annual Report 2019
22 Financial Review
John WittGroup Finance Director
Accounting PoliciesThe Directors continue to review the appropriateness of the accounting policies adopted by the Group, having regard to developments in International Financial Reporting Standards (‘IFRS’).
The Group has applied IFRS 16 ‘Leases’ for the first time for the annual reporting period commencing 1st January 2019. IFRS 16 affects the accounting for lessees in the Group. The standard introduces a model in which lease liabilities, measured at the present value of lease payments, and their corresponding right-of-use assets are recognised on the balance sheet at the commencement of the leases. In the profit and loss account, depreciation of the right-of-use assets and interest on lease liabilities are recognised as expenses instead of the straight-line lease payments approach under the previous accounting standard.
The Group has adopted IFRS 16 using a full retrospective approach and the comparative financial statements have been restated. The impact of adopting IFRS 16 on the Group’s consolidated profit and loss account and cash flow statement for the year ended 31st December 2018, and balance sheet as at 31st December 2018, are summarised in note 1 to the financial statements. The adoption of IFRS 16 resulted in the recognition of right-of-use assets and lease liabilities of US$5.5 billion and US$4.4 billion, respectively, as at 31st December 2018. The right-of-use assets recognised are primarily related to property leases, which are entered into for use as retail stores and offices. As a result of the restatement, the Group’s underlying profit attributable to shareholders for the year ended 31st December 2018 was reduced by 3%. The impact on shareholders’ funds and gearing as at 31st December 2018 was insignificant.
Results
Underlying Business Performance
2019US$m
2018US$m
Revenue 40,922 42,527
Operating profit 3,991 4,071Net financing charges (534) (475)Share of results of associates
and joint ventures 1,221 1,254
Profit before tax 4,678 4,850Tax (941) (967)
Profit after tax 3,737 3,883Non-controlling interests (2,148) (2,228)
Underlying profit attributable to shareholders 1,589 1,655
Non-trading items 1,249 67
Net profit 2,838 1,722
US$ US$
Underlying earnings per share 4.23 4.40
RevenueThe Group’s revenue of US$40.9 billion in 2019 was 4% below the prior year, mainly due to lower sales in Dairy Farm as a result of the divestment of Rustan Supercenters business in 2018, and lower sales in its Health and Beauty business in Hong Kong, which was impacted by the social unrest in the second half of the year, and its Grocery Retail business in Southeast Asia due to the implementation of its space optimisation programme; Hongkong Land’s development property projects in Singapore which in the prior year had benefited from the completion of a pre-sold large Executive Condominium project; Jardine Cycle & Carriage’s motor vehicle operations in Singapore and Malaysia as a result of weaker consumer sentiment; and Astra’s Automotive business and Agribusiness, also as a result of weaker consumer sentiment combined with low commodity prices for much of the year. Gross revenue, including 100% of revenue from associates and joint ventures, which is a measure of the full extent of the Group’s operations, increased by 12% to US$103.3 billion. This increase was largely from the Group’s associates, Zhongsheng, Yonghui and Robinsons Retail. Zhongsheng and Yonghui contributed higher revenue as a result of the inclusion of a full twelve months’ revenue in 2019 due to the timing of the reporting of their results. In 2018, only eight months and nine months of Zhongsheng’s and Yonghui’s results, respectively, were included. Robinsons Retail, a 20%-owned associate, was acquired by Dairy Farm in November 2018.
Operating profitOperating profit from the Group’s subsidiaries, excluding non-trading items, was US$3,991 million, a decrease of US$80 million or 2%. Lower operating profits were recorded in many of the Group’s businesses, partially offset by solid performances from Hongkong Land and Jardine Pacific.
Dairy Farm’s underlying operating profit was US$72 million or 14% below 2018, principally due to lower contributions from its Health and Beauty business in Hong Kong and its Home Furnishings business, mitigated by improved performance in the Southeast Asia Grocery Retail business, particularly in Malaysia and Indonesia, as the transformation and improvement programmes took effect.
Astra’s underlying operating profit reduced by US$46 million or 2% from 2018. Astra’s Agribusiness recorded lower results due to lower crude palm oil prices, despite increased sales volumes. Astra’s Heavy Equipment, Mining, Construction and Energy businesses recorded higher earnings mainly due to the first year contribution from the gold mining business acquired in December 2018. There was also an improved performance in Astra’s Consumer Finance business mainly due to a larger loan portfolio and improvement in non-performing loans.
Mandarin Oriental’s contribution decreased by US$24 million in 2019 due to the absence of a contribution from The Excelsior in Hong Kong, following its closure for redevelopment in March 2019 and a weaker performance in Hong Kong due to social unrest in the second half of the year. This was mitigated by a higher contribution from the London hotel, which reopened in April 2019 following the fire in 2018, and by the receipt of insurance proceeds upon final settlement of the related insurance claim.

Jardine Matheson Annual Report 2019
23Financial Review
For Jardine Motors’ subsidiaries, the overall underlying operating profit decreased by US$15 million principally due to weaker results in the Group’s United Kingdom dealerships as a result of lower volumes and a net loss arising from the sale of two dealerships. In Hong Kong, Zung Fu’s results were behind the prior year due to weak market sentiment while results from its business in the Chinese mainland were relatively stable.
Jardine Cycle & Carriage’s contribution decreased by US$9 million or 8% in 2019 with lower earnings in the Singapore motor operations, while Cycle & Carriage Bintang recorded a loss in 2019 compared to a profit in 2018, mitigated by higher dividends from Jardine Cycle & Carriage’s 10.6% interest in Vinamilk.
Hongkong Land’s underlying operating profit increased by US$81 million in 2019, primarily due to higher contributions from its subsidiaries engaged in residential development activities in the Chinese mainland. Earnings from its commercial portfolio were in line with 2018 with a steady performance from its Hong Kong portfolio despite a decrease in average retail rents due to the temporary rent relief provided to tenants as a result of the social unrest.
Jardine Pacific recorded higher operating profit in 2019 with better results from the Hong Kong engineering operations in JEC, partly offset by lower profits from the Restaurant businesses due to difficult trading conditions in Hong Kong and the upfront costs for process re-engineering projects.
Net financing chargesNet financing charges at US$534 million were US$59 million higher compared to 2018 principally due to the higher average levels of net debt in Astra’s Heavy Equipment, Mining, Construction and Energy businesses reflecting the acquisition of the gold mining business in 2018. This was mitigated by higher interest income at the Group level, primarily due to increased cash arising from the US$2.1 billion net proceeds from the sale of the Group’s 41% interest in Jardine Lloyd Thompson and higher average deposit rates in 2019. Interest cover exclusive of financial services companies reduced from 15 times to 12 times in 2019. Cover was calculated as the sum of underlying operating profit – before the deduction of the amortisation of right-of-use assets, net of actual lease payments – and the share of results of associates and joint ventures, divided by net financing charges excluding interest on lease liabilities.
Share of results of associates and joint venturesThe Group’s US$1,221 million share of underlying results of associates and joint ventures was US$33 million, or 3%, lower than the prior year. This was primarily due to the absence of a contribution from Jardine Lloyd Thompson following its sale in 2019 (its 2018 contribution was US$77 million). This was mitigated by a US$30 million higher contribution from Zhongsheng in 2019 due to a full twelve months’ results in 2019 versus eight months in 2018, together with increased sales and stable margins for Zhongsheng in the first half of 2019.
The overall contribution from Astra’s associates and joint ventures increased by US$15 million in 2019 due to better performances from its Financial Services businesses, primarily Permata Bank, and its Infrastructure business, partly offset by a lower contribution from its Automotive businesses.
Contributions from Hongkong Land’s associates and joint ventures increased by US$8 million, primarily from its joint venture development property projects in the Chinese mainland.
In Dairy Farm, the overall contribution from associates increased by US$2 million. A higher contribution from 19.99%-owned Yonghui – with a full twelve months results in 2019 versus nine months in 2018 – and a first year contribution from 20%-owned Robinsons Retail, were partly offset by a lower contribution from 50%-owned Maxim’s, which was impacted by the social unrest in Hong Kong.
The overall contribution from Jardine Cycle & Carriage’s associates and joint ventures reduced by US$19 million. Weaker performances in the motor vehicle and property operations of 26.6% owned Truong Hai Auto Corporation (‘Thaco’) in Vietnam, were mitigated by improved performances in 25.5%-owned Siam City Cement and 46.2%-owned Tunas Ridean.
In Mandarin Oriental, contributions from associates reduced by US$8 million mainly due to the 47.6%-owned Bangkok Hotel, which was largely closed from March 2019 for a major renovation.
TaxThe underlying effective tax rate for the year was 27%, which was in line with that of 2018.
Non-trading ItemsIn 2019, the Group had net non-trading gains of US$1,249 million, which included a gain of US$1,507 million on sale of the Group’s interest in Jardine Lloyd Thompson and a net increase of US$49 million in the fair value of other investments; partly offset by a net decrease of US$337 million in the fair value of investment properties, primarily in Hongkong Land.
In 2018, the Group had net non-trading gains of US$67 million, which included a net increase of US$613 million in the fair value of investment properties primarily in Hongkong Land; a gain of US$111 million on disposal of a Philippine Food business subsidiary in Dairy Farm in exchange for a 12.15% interest in Robinsons Retail, a listed retailer in the Philippines; and gains on property disposals of US$23 million; partly offset by a net decrease of US$316 million in the fair value of other investments; a charge of US$275 million relating to Dairy Farm’s restructuring of its Grocery Retail business in Southeast Asia; and a loss of US$40 million related to reclassification of Dairy Farm’s investment in Rose Pharmacy from a joint venture to a wholly-owned subsidiary upon the acquisition of the remaining 51% interest by Dairy Farm.

Jardine Matheson Annual Report 2019
24 Financial Review
DividendsThe Board is recommending a final dividend of US$1.28 per share for 2019, providing a total annual dividend of US$1.72 per share, an increase of 1% over 2018. The final dividend will be payable on 13th May 2020, subject to approval at the Annual General Meeting to be held on 7th May 2020, to shareholders on the register of members at the close of business on 20th March 2020. The dividends will be available in cash with a scrip alternative.
Cash Flow
Summarised Cash Flow
2019US$m
2018US$m
Cash generated from operations 5,269 5,596
Net interest and other financing charges paid (573) (479)
Tax paid (964) (902)Dividends from associates
and joint ventures 1,133 942
Operating activities 4,865 5,157 Capital expenditure and
investments (4,283) (5,933)Disposals 3,583 1,275
Cash flow before financing 4,165 499 Principal elements of lease
payments (1,016) (1,018)Other financing activities (1,024) (348)
Net increase/(decrease) in cash and cash equivalents 2,125 (867)
Cash inflow from operating activities for the year was US$4,865 million, compared with US$5,157 million in 2018. The decrease of US$292 million from 2018 was principally due to higher financing charges and tax paid, and a decrease in working capital principally in Astra; partly offset by higher dividends received from associates and joint ventures.
Capital expenditure and investments for the year before disposals amounted to US$4,283 million (2018: US$5,933 million). This included the following:
• US$2,113 million for investments in various associates and joint ventures, primarily Hongkong Land’s investments of US$1,562 million in Development Property projects, most of which were joint venture projects in the Chinese mainland in Nanjing, Chongqing, Shanghai and Chengdu; Astra’s investments in and capital injections into associates and joint ventures of US$285 million, including US$208 million related to investments in toll road concessions; Jardine Cycle & Carriage’s acquisition of an additional 1.3% interest in Thaco of US$168 million, which increased its shareholding to 26.6%; and Jardine Strategic’s US$64 million investment in a virtual bank joint venture in Hong Kong;
• US$409 million for the purchase of other investments, which included US$299 million of securities by Astra’s general insurance business and US$100 million for Astra’s additional investments in Gojek;
• US$224 million for the purchase of intangible assets, which included US$86 million for mining exploration costs and US$40 million for the acquisition of contracts by Astra’s general insurance business;
• US$1,234 million for the purchase of tangible assets, which included US$800 million in Astra (of which US$626 million was for the acquisition of heavy equipment and machinery, predominantly by Pamapersada, US$87 million was for outlet development and additional operational machinery and equipment in Astra’s automotive business, and US$44 million was to improve plantation infrastructure in Astra’s agribusiness); US$233 million in Dairy Farm for new store expansion and the refurbishment of existing stores; US$55 million in Jardine Motors for dealership developments; and US$43 million in Mandarin Oriental for the renovation of hotel properties; and
• US$171 million for additions to investment properties in Hongkong Land and Astra, and US$44 million for additions to bearer plants in Astra.
In 2018, the Group’s principal capital expenditure and investments included:
• US$1,287 million for the purchase of businesses, principally Astra’s acquisition of a 95% interest in a gold mining business for US$1,150 million, and Dairy Farm’s acquisition for US$55 million of the remaining 51% interest in Rose Pharmacy, which was previously a 49% joint venture;

Jardine Matheson Annual Report 2019
25Financial Review
• US$2,181 million for investments in various associates and joint ventures, the main ones being Hongkong Land’s investments in Development Property projects of US$1,367 million in the Chinese mainland, US$273 million in Thailand and US$63 million in Vietnam. In addition, it included Dairy Farm’s investment in a 20% interest in Robinsons Retail in the Philippines with a 12.15% interest acquired by exchanging Dairy Farm’s previous interest in a wholly-owned Philippines Grocery Retail business subsidiary and the remaining interest acquired by way of US$220 million in share purchases from the controlling shareholders and in the market; and Astra’s US$99 million investments in toll road concessions;
• US$708 million for the purchase of other investments, which included a US$200 million investment in Toyota Motor Corporation shares and US$62 million of additional shares in Vinamilk acquired by Jardine Cycle & Carriage, together with US$280 million for the purchase of securities by Astra’s general insurance business and US$150 million for Astra’s purchase of a minority stake in Gojek;
• US$115 million for the purchase of intangible assets, which included US$43 million for the acquisition of contracts by Astra’s general insurance business;
• US$1,399 million for the purchase of tangible assets by Group companies; and
• US$166 million for additions to investment properties in Hongkong Land and Astra, and US$45 million for additions to bearer plants in Astra.
The contribution to the Group’s cash flow from disposals for the year amounted to US$3,583 million (2018: US$1,275 million), which principally included US$2,084 million from the sale of the Group’s interest in Jardine Lloyd Thompson, US$916 million relating to advances and repayments from associates and joint ventures in Hongkong Land, and US$276 million from the sale of other investments by Astra’s general insurance business.
During the year, shares in the Company were repurchased at a total cost of US$328 million (2018: US$99 million). Additional shares in Group companies, primarily shares in Jardine Strategic, were also purchased at a total cost of US$277 million (2018: US$567 million). According to accounting standards, these purchases are presented under financing activities in the Consolidated Cash Flow Statement.
The Group’s management also monitors total capital investment across the Group. The Group’s capital investment, including expenditure on properties for sale, was US$5.8 billion in 2019 (2018: US$7.6 billion), in addition to which capital investment at its associates and joint ventures exceeded US$4.8 billion (2018: US$4.6 billion).
Treasury PolicyThe Group manages its exposure to financial risk using a variety of techniques and instruments. The main objectives are to limit foreign exchange and interest rate risks to provide a degree of certainty about costs. The investment of the Group’s cash resources is managed so as to minimise risk, while seeking to enhance yield. Appropriate credit guidelines are in place to manage counterparty risk.
When economically sensible to do so, borrowings are taken in local currency to hedge foreign exchange exposures on investments. A portion of borrowings is denominated in fixed rates. Adequate headroom in committed facilities is maintained to facilitate the Group’s capacity to pursue new investment opportunities and to provide some protection against market uncertainties. Overall, the Group’s funding arrangements are designed to keep an appropriate balance between equity and debt from banks and capital markets, both short and long term in tenor, to give flexibility to develop the business.
The Group’s Treasury operations are managed as cost centres and are not permitted to undertake speculative transactions unrelated to underlying financial exposures.
Note 42 of the financial statements summarises the Group’s financial risk factors.
FundingThe Group is well financed with strong liquidity. Net gearing, excluding net borrowings relating to Astra’s financial services companies, was 7% at 31st December 2019, down from 10% at the end of 2018, due to proceeds from the sale of the Group’s interest in Jardine Lloyd Thompson, partly offset by investments in the year by the Group’s businesses, including projects in Hongkong Land. Net borrowings, on the same basis, were US$4.8 billion at 31st December 2019, compared with US$5.9 billion at the end of 2018. Astra’s financial services companies had net borrowings of US$3.3 billion at the end of the year, unchanged from 2018.
Net Borrowings* and Total Equity (US$ billion)
* Excluding net borrowings of Astra’s financial services companies.JM Financial Review
Net Borrowings
Total Equity
3.0
2.1
3.4
5.9
45.5
49.8
57.8
58.8
4.865.1
2015
2016
2017
2018
2019

Jardine Matheson Annual Report 2019
26 Financial Review
Interest rate*
By Geographical Area
By Business
Currency
Maturity
* Excluding Astra’s financial services companies.
At the year end, undrawn committed facilities totalled US$6.7 billion. In addition, the Group had liquid funds of US$7.2 billion. During the year, the Group’s total equity increased by US$6.3 billion to US$65.1 billion.
The average tenor of the Group’s borrowings at 31st December 2019 was 4.0 years, down from 4.1 years at the end of 2018. 83% of borrowings were non-US dollar denominated and directly related to the Group’s businesses in the countries of the currencies concerned. At 31st December 2019, approximately 60% of the Group’s borrowings, exclusive of Astra’s financial services companies, were at floating rates and the remaining 40% were at fixed rates including those hedged with derivative financial instruments with major creditworthy financial institutions. 93% of the borrowings for Astra’s financial services companies were at fixed rates.
Borrowings profile at 31st December 2019
Shareholders’ FundsShareholders’ funds at 31st December 2019 are analysed below, by business and by geographical area. There were no significant changes from the prior year.
Floating 60%
40% Fixed
IDR 37%
17% USD
30% HKD
16% Others
< 1 year 43%
1-2 years 13%
15% > 5 years
29% 2-5 years
3%JardineCycle & Carriage
Astra 13%Jardine Pacific 4%
Dairy Farm 4%
Mandarin Oriental 10%
6% Jardine Motors
60% Hongkong Land
28% Southeast Asia
Greater China 68%2% Rest of the World
2% United Kingdom
Principal Risks and UncertaintiesA review of the principal risks and uncertainties facing the Group is set out on page 146.

Jardine Matheson Annual Report 2019
27Directors’ Profiles
Ben Keswick* Executive Chairman and Managing DirectorMr Keswick joined the Board in 2007. He was appointed as Managing Director in 2012 and also became Executive Chairman in January 2019. He has held a number of executive positions since joining the Group in 1998, including finance director and then chief executive officer of Jardine Pacific between 2003 and 2007 and, thereafter, group managing director of Jardine Cycle & Carriage until 2012. He has an MBA from INSEAD. Mr Keswick is chairman of Jardine Matheson Limited, Jardine Cycle & Carriage and Yonghui Superstores and a commissioner of Astra. He is also executive chairman and managing director of Jardine Strategic, chairman and managing director of Dairy Farm, Hongkong Land and Mandarin Oriental, and a director of Jardine Pacific and Jardine Motors.
Y.K. Pang* Deputy Managing Director and Chairman of Hong KongMr Pang joined the Board in 2011 and was appointed Deputy Managing Director in 2016 and Chairman of Hong Kong in October 2019. He has held a number of senior executive positions in the Group, which he joined in 1984, including chief executive of Hongkong Land between 2007 and 2016. He is chairman of Jardine Pacific and Gammon. Mr Pang is also deputy chairman of Jardine Matheson Limited, and a director of Dairy Farm, Hongkong Land, Jardine Matheson (China), Jardine Strategic and Mandarin Oriental. He is chairman of the Hong Kong Tourism Board, Deputy Chairman of the Hong Kong Management Association, a member of the Council and General Committee of the Hong Kong General Chamber of Commerce and the Employers’ Federation of Hong Kong.
Mark Greenberg*Mr Greenberg joined the Board in 2008, having first joined the Group as Group Strategy Director in 2006. He had previously spent 16 years in investment banking with Dresdner Kleinwort Wasserstein in London. He is a director of Jardine Matheson Limited, Dairy Farm, Hongkong Land, Jardine Cycle & Carriage and Mandarin Oriental, and a commissioner of Astra and Permata Bank.
Stuart Gulliver Mr Gulliver joined the Board in January 2019. He was previously executive director and group chief executive of HSBC Holdings plc from January 2011 until February 2018 and chairman of The Hong Kong and Shanghai Banking Corporation Limited from 2011 to 2018. Mr Gulliver has more than 37 years’ international banking experience, having joined HSBC in 1980 and worked for the group throughout his career. He is a director and chairman of the audit and finance committees of Airport Authority Hong Kong, and is also a member of the International Advisory Council of Hong Kong Exchanges and Clearing Limited. He is a director and chairman of the risk committee of The Saudi British Bank.
David Hsu*Mr Hsu joined the Board in 2016, having first joined the Group in 2011. He is chairman of Jardine Matheson (China), with responsibility for supporting the Group’s business developments in Chinese mainland, Taiwan and Macau. He was previously chief executive of J.P. Morgan Asset Management in the Asia Pacific Region. Mr Hsu is also a director of Jardine Matheson Limited, Jardine Strategic and Greatview.
Julian HuiMr Hui joined the Board in 2018, having first joined the Group in 1994. He is an executive director of Owens Company, and a director of Central Development and Mandarin Oriental.
Adam Keswick* Mr Keswick first joined the Group in 2001 and was appointed to the Board in 2007. He was Deputy Managing Director from 2012 to 2016, and became chairman of Matheson & Co. in 2016. Mr Keswick is a director of Dairy Farm, Hongkong Land, Jardine Strategic and Mandarin Oriental. He is also a director of Ferrari NV, vice-chairman of the supervisory board of Rothschild & Co, and is a director of Yabuli China Entrepreneurs Forum.
Alex Newbigging*Mr Newbigging joined the Board in 2017. Since first joining the Group in 1995, he has held a number of executive positions, and was group managing director of Jardine Cycle & Carriage from 2012 to 2019 before taking up his current role of chief executive officer of Jardine International Motors in October 2019. He is also chairman and chief executive of Jardine Motors, a commissioner of Astra, vice chairman of Refrigeration Electrical Engineering and a director of Zhongsheng.
Anthony Nightingale Mr Nightingale joined the Group in 1969 and was appointed as a Director in 1994. He was Managing Director from 2006 until he retired from executive office in 2012. He is also a director of Dairy Farm, Hongkong Land, Jardine Cycle & Carriage, Jardine Strategic, Mandarin Oriental and a commissioner of Astra. He is a director of Prudential, Schindler, Shui On Land and Vitasoy. He is chairperson of The Sailors Home and Missions to Seafarers in Hong Kong.
Jeremy Parr*Mr Parr was appointed to the Board in 2016, having first joined the Group as Group General Counsel in 2015. He was previously a senior corporate partner with Linklaters, where he was the global head of the firm’s corporate division, based in London. Mr Parr is also a director of Jardine Matheson Limited, Dairy Farm and Mandarin Oriental.
Lord Sassoon, Kt*Lord Sassoon joined the Board in 2013. He began his career at KPMG, before joining SG Warburg (later UBS Warburg) in 1985. From 2002 to 2006 he served as a civil servant in the United Kingdom Treasury, where he had responsibility for financial services and enterprise policy. He subsequently chaired the Financial Action Task Force and conducted a review of the UK’s system of financial regulation. From 2010 to 2013 Lord Sassoon was the first Commercial Secretary to the Treasury and acted as the Government’s Front Bench Treasury spokesman in the House of Lords. He is a director of Matheson & Co., Dairy Farm, Hongkong Land and Mandarin Oriental. He is also President of the China-Britain Business Council. As announced on 20th January 2020, Lord Sassoon will be retiring as a Director on 9th April 2020.
Percy WeatherallMr Weatherall first joined the Company in 1976 and was appointed to the Board in 1999 before being made Managing Director in 2000. He retired from executive office in 2006. He is also a director of Matheson & Co., Dairy Farm, Hongkong Land, Jardine Strategic and Mandarin Oriental. He is chairman of Corney & Barrow and the Nith District Salmon Fishery Board.
John Witt*Mr Witt joined the Board as Group Finance Director in 2016. He is a Chartered Accountant and has an MBA from INSEAD. He has been with the Jardine Matheson Group since 1993 and has held a number of senior finance positions. Most recently, he was the chief financial officer of Hongkong Land. He is also a director of Jardine Matheson Limited and Dairy Farm, and a commissioner and chairman of the Executive Committee of Astra.
Michael Wei Kuo Wu Mr Wu joined the Board in 2015. He is chairman and managing director of Maxim’s Caterers in Hong Kong. He is also a non-executive director of Hang Seng Bank and Hongkong Land.
* Executive Director
Company Secretary Jonathan Lloyd
Registered OfficeJardine House, 33-35 Reid StreetHamiltonBermuda
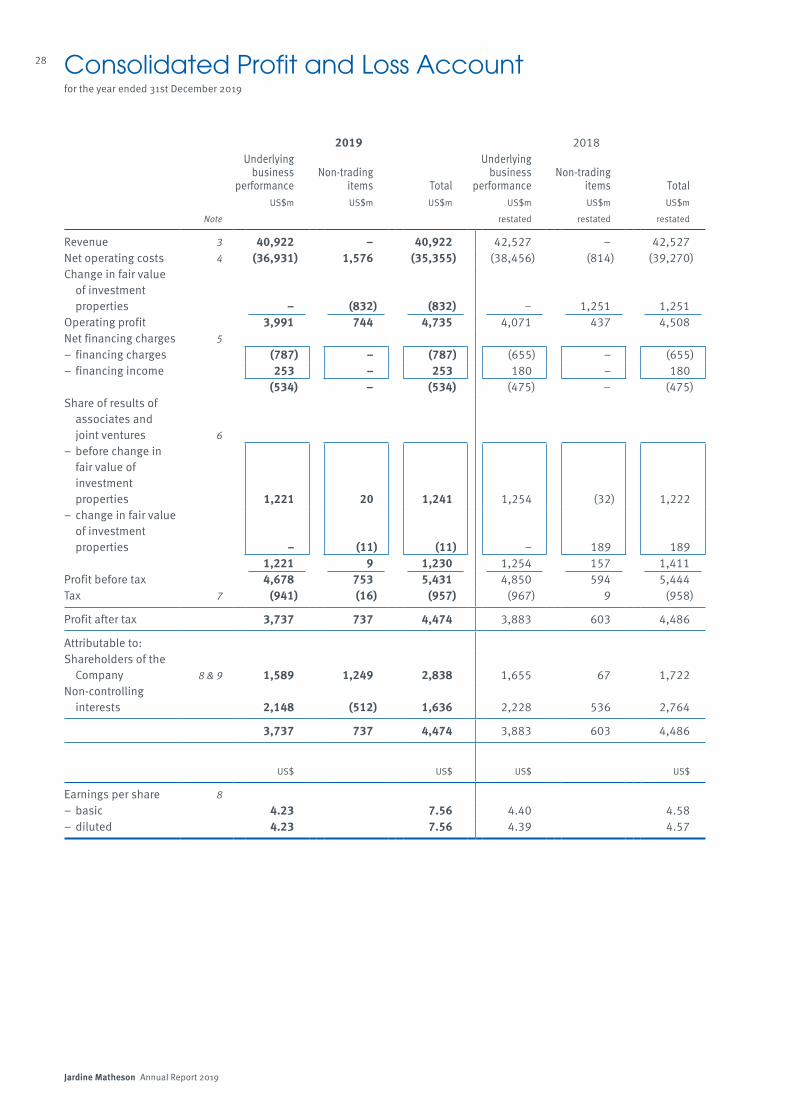
Jardine Matheson Annual Report 2019
28 Consolidated Profit and Loss Accountfor the year ended 31st December 2019
2019 2018Underlying
businessperformance
Non-tradingitems Total
Underlyingbusiness
performanceNon-trading
items TotalUS$m US$m US$m US$m US$m US$m
Note restated restated restated
Revenue 3 40,922 – 40,922 42,527 – 42,527Net operating costs 4 (36,931) 1,576 (35,355) (38,456) (814) (39,270)Change in fair value
of investment properties – (832) (832) – 1,251 1,251
Operating profit 3,991 744 4,735 4,071 437 4,508Net financing charges 5– financing charges (787) – (787) (655) – (655)– financing income 253 – 253 180 – 180
(534) – (534) (475) – (475)Share of results of
associates and joint ventures 6
– before change in fair value of investment properties 1,221 20 1,241 1,254 (32) 1,222
– change in fair value of investment properties – (11) (11) – 189 189
1,221 9 1,230 1,254 157 1,411Profit before tax 4,678 753 5,431 4,850 594 5,444Tax 7 (941) (16) (957) (967) 9 (958)
Profit after tax 3,737 737 4,474 3,883 603 4,486
Attributable to:Shareholders of the
Company 8 & 9 1,589 1,249 2,838 1,655 67 1,722Non-controlling
interests 2,148 (512) 1,636 2,228 536 2,764
3,737 737 4,474 3,883 603 4,486
US$ US$ US$ US$
Earnings per share 8– basic 4.23 7.56 4.40 4.58– diluted 4.23 7.56 4.39 4.57
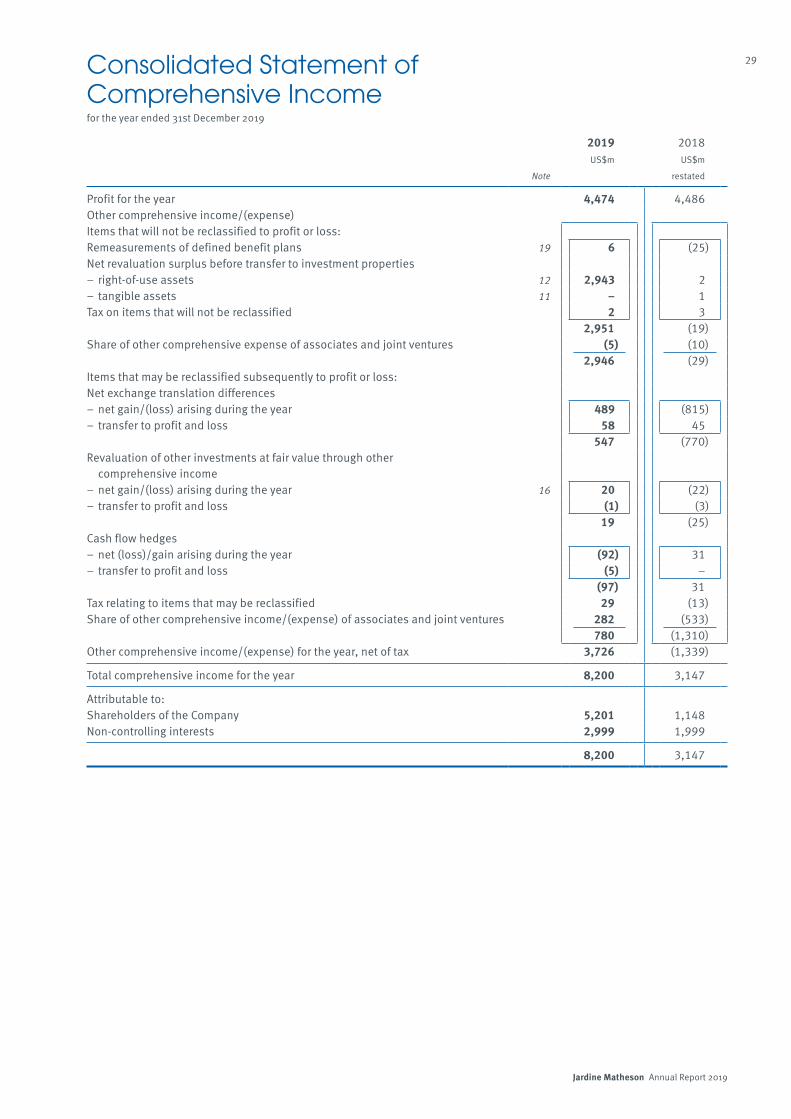
Jardine Matheson Annual Report 2019
29Consolidated Statement of Comprehensive Incomefor the year ended 31st December 2019
2019 2018US$m US$m
Note restated
Profit for the year 4,474 4,486Other comprehensive income/(expense)Items that will not be reclassified to profit or loss:Remeasurements of defined benefit plans 19 6 (25)Net revaluation surplus before transfer to investment properties– right-of-use assets 12 2,943 2– tangible assets 11 – 1Tax on items that will not be reclassified 2 3
2,951 (19)Share of other comprehensive expense of associates and joint ventures (5) (10)
2,946 (29)Items that may be reclassified subsequently to profit or loss:Net exchange translation differences– net gain/(loss) arising during the year 489 (815)– transfer to profit and loss 58 45
547 (770)Revaluation of other investments at fair value through other
comprehensive income– net gain/(loss) arising during the year 16 20 (22)– transfer to profit and loss (1) (3)
19 (25)Cash flow hedges– net (loss)/gain arising during the year (92) 31– transfer to profit and loss (5) –
(97) 31Tax relating to items that may be reclassified 29 (13)Share of other comprehensive income/(expense) of associates and joint ventures 282 (533)
780 (1,310)Other comprehensive income/(expense) for the year, net of tax 3,726 (1,339)
Total comprehensive income for the year 8,200 3,147
Attributable to:Shareholders of the Company 5,201 1,148Non-controlling interests 2,999 1,999
8,200 3,147

Jardine Matheson Annual Report 2019
30 Consolidated Balance Sheetat 31st December 2019
At 31st December At 1st January2019 2018 2018US$m US$m US$m
Note restated restated
AssetsIntangible assets 10 2,849 2,665 2,257Tangible assets 11 7,379 7,071 6,330Right-of-use assets 12 5,129 5,451 5,563Investment properties 13 37,377 34,753 33,538Bearer plants 14 503 487 498Associates and joint ventures 15 15,640 14,572 13,047Other investments 16 2,720 2,592 2,731Non-current debtors 17 3,045 3,069 2,990Deferred tax assets 18 457 390 417Pension assets 19 3 6 14Non-current assets 75,102 71,056 67,385
Properties for sale 20 2,441 2,339 2,594Stocks and work in progress 21 3,824 3,770 3,536Current debtors 17 8,196 7,758 7,018Current investments 16 29 50 22Current tax assets 253 189 164Bank balances and other liquid funds 22– non-financial services companies 6,927 4,801 5,764– financial services companies 256 187 241
7,183 4,988 6,00521,926 19,094 19,339
Assets classified as held for sale – – 11Current assets 21,926 19,094 19,350
Total assets 97,028 90,150 86,735
Approved by the Board of Directors
Ben KeswickJohn WittDirectors
5th March 2020
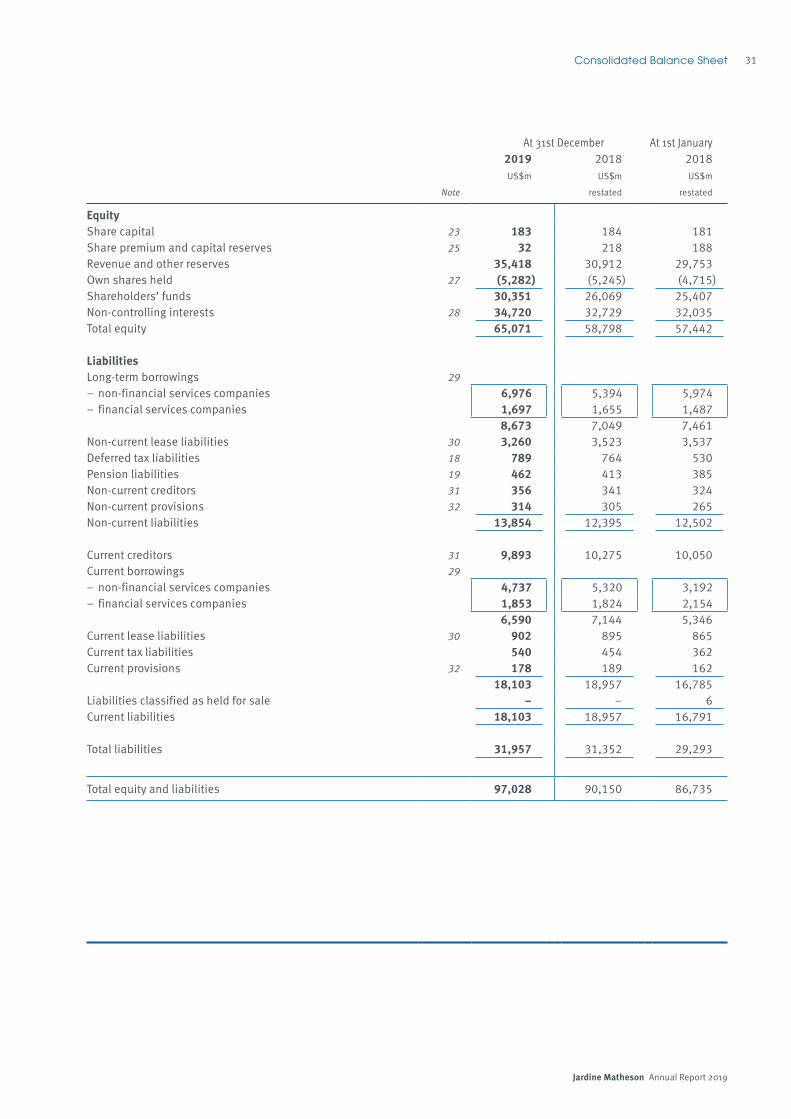
Jardine Matheson Annual Report 2019
31
At 31st December At 1st January2019 2018 2018US$m US$m US$m
Note restated restated
EquityShare capital 23 183 184 181Share premium and capital reserves 25 32 218 188Revenue and other reserves 35,418 30,912 29,753Own shares held 27 (5,282) (5,245) (4,715)Shareholders’ funds 30,351 26,069 25,407Non-controlling interests 28 34,720 32,729 32,035Total equity 65,071 58,798 57,442
LiabilitiesLong-term borrowings 29– non-financial services companies 6,976 5,394 5,974– financial services companies 1,697 1,655 1,487
8,673 7,049 7,461Non-current lease liabilities 30 3,260 3,523 3,537Deferred tax liabilities 18 789 764 530Pension liabilities 19 462 413 385Non-current creditors 31 356 341 324Non-current provisions 32 314 305 265Non-current liabilities 13,854 12,395 12,502
Current creditors 31 9,893 10,275 10,050Current borrowings 29– non-financial services companies 4,737 5,320 3,192– financial services companies 1,853 1,824 2,154
6,590 7,144 5,346Current lease liabilities 30 902 895 865Current tax liabilities 540 454 362Current provisions 32 178 189 162
18,103 18,957 16,785Liabilities classified as held for sale – – 6Current liabilities 18,103 18,957 16,791
Total liabilities 31,957 31,352 29,293
Total equity and liabilities 97,028 90,150 86,735
Consolidated Balance Sheet

Jardine Matheson Annual Report 2019 Jardine Matheson Annual Report 2019
32 33Consolidated Statement of Changes in Equityfor the year ended 31st December 2019
Sharecapital
Sharepremium
Capitalreserves
Revenuereserves
Assetrevaluation
reservesHedgingreserves
Exchangereserves
Ownshares
held
Attributable toshareholders of
the Company
Attributable tonon-controlling
interestsTotal
equityUS$m US$m US$m US$m US$m US$m US$m US$m US$m US$m US$m
2019At 1st January– as previously reported 184 36 182 33,020 213 (20) (2,028) (5,245) 26,342 32,855 59,197– change in accounting policies (refer note 1) – – – (281) – – 8 – (273) (126) (399)– as restated 184 36 182 32,739 213 (20) (2,020) (5,245) 26,069 32,729 58,798Total comprehensive income – – – 2,859 1,954 (2) 390 – 5,201 2,999 8,200Dividends paid by the Company – – – (646) – – – – (646) 113 (533)Dividends paid to non-controlling interests – – – – – – – – – (964) (964)Unclaimed dividends forfeited – – – 1 – – – – 1 – 1Issue of shares – 3 – – – – – – 3 – 3Employee share option schemes – – 4 – – – – – 4 – 4Scrip issued in lieu of dividends 1 (1) – 133 – – – – 133 – 133Repurchase of shares (2) (40) – (286) – – – – (328) – (328)Increase in own shares held – – – – – – – (37) (37) 37 –Subsidiaries acquired – – – – – – – – – 14 14Capital contribution from non-controlling interests – – – – – – – – – 18 18Change in interests in subsidiaries – – – (50) – – – – (50) (227) (277)Change in interests in associates and joint ventures – – – 1 – – – – 1 1 2Transfer – 2 (154) 152 – – – – – – –
At 31st December 183 – 32 34,903 2,167 (22) (1,630) (5,282) 30,351 34,720 65,071
2018At 1st January– as previously reported 181 32 156 31,323 212 (6) (1,508) (4,715) 25,675 32,158 57,833– change in accounting policies (refer note 1) – – – (269) – – 1 – (268) (123) (391)– as restated 181 32 156 31,054 212 (6) (1,507) (4,715) 25,407 32,035 57,442Total comprehensive income – – – 1,674 1 (14) (513) – 1,148 1,999 3,147Dividends paid by the Company – – – (607) – – – – (607) 109 (498)Dividends paid to non-controlling interests – – – – – – – – – (902) (902)Unclaimed dividends forfeited – – – 2 – – – – 2 – 2Issue of shares – 4 – – – – – – 4 – 4Employee share option schemes – – 32 – – – – – 32 1 33Scrip issued in lieu of dividends 3 (3) – 635 – – – – 635 – 635Increase in own shares held – – – – – – – (530) (530) (72) (602)Subsidiaries acquired – – – – – – – – – 57 57Capital contribution from non-controlling interests – – – – – – – – – 21 21Change in interests in subsidiaries – – – (25) – – – – (25) (537) (562)Change in interests in associates and joint ventures – – – 3 – – – – 3 18 21Transfer – 3 (6) 3 – – – – – – –
At 31st December 184 36 182 32,739 213 (20) (2,020) (5,245) 26,069 32,729 58,798
Consolidated Statement of Changes in Equity

Jardine Matheson Annual Report 2019
34 Consolidated Cash Flow Statementfor the year ended 31st December 2019
2019 2018US$m US$m
Note restated
Operating activitiesCash generated from operations 33 (a) 5,269 5,596Interest received 186 164Interest and other financing charges paid (759) (643)Tax paid (964) (902)
3,732 4,215Dividends from associates and joint ventures 1,133 942Cash flows from operating activities 4,865 5,157
Investing activitiesPurchase of subsidiaries 33 (c) (28) (1,287)Purchase of associates and joint ventures 33 (d) (1,088) (1,191)Purchase of other investments 33 (e) (409) (708)Purchase of intangible assets (224) (115)Purchase of tangible assets (1,234) (1,399)Additions to right-of-use assets (60) (32)Additions to investment properties (171) (166)Additions to bearer plants (44) (45)Advance to associates and joint ventures 33 (f) (1,025) (990)Advance from and repayment from associates and joint ventures 33 (g) 920 952Sale of subsidiaries 60 –Sale of Jardine Lloyd Thompson 9 2,084 –Sale of other associates and joint ventures 3 –Sale of other investments 33 (h) 450 236Sale of tangible assets 63 75Sale of right-of-use assets 3 12Cash flows from investing activities (700) (4,658)
Financing activitiesIssue of shares 3 4Capital contribution from non-controlling interests 18 21Change in interests in subsidiaries 33 (i) (277) (563)Purchase of own shares 23 (328) (99)Drawdown of borrowings 29 8,593 7,923Repayment of borrowings 29 (7,669) (6,366)Principal elements of lease payments (1,016) (1,018)Dividends paid by the Company (400) (366)Dividends paid to non-controlling interests (964) (902)Cash flows from financing activities (2,040) (1,366)Net increase/(decrease) in cash and cash equivalents 2,125 (867)Cash and cash equivalents at 1st January 4,953 6,001Effect of exchange rate changes 79 (181)
Cash and cash equivalents at 31st December 33 (k) 7,157 4,953

Jardine Matheson Annual Report 2019
35Notes to the Financial Statements
1 Basis of PreparationThe financial statements have been prepared in accordance with International Financial Reporting Standards (‘IFRS’), including International Accounting Standards (‘IAS’) and Interpretations adopted by the International Accounting Standards Board. The financial statements have been prepared on a going concern basis and under the historical cost convention except as disclosed in the accounting policies.
Details of the Group’s principal accounting policies are included in note 40.
The Group has applied IFRS 16 ‘Leases’ for the first time for the Group’s annual reporting period commencing 1st January 2019. Changes to principal accounting policies are described below. There are no other amendments or interpretations, which are effective in 2019 and relevant to the Group’s operations, that have a significant effect on the Group’s results, financial position and accounting policies.
The Group has elected to early adopt the ‘Interest Rate Benchmark Reform: Amendments to IFRS 9, IAS 39 and IFRS 7’ (effective 1st January 2020) in relation to hedge accounting for the Group’s annual reporting period commencing 1st January 2019. In accordance with the transition provisions, the amendments have been adopted retrospectively with respect to hedging relationships that existed at the start of the reporting period or were designated thereafter. The amendments provide temporary relief from applying specific hedge accounting requirements to hedging relationships which are directly affected by the uncertainty arising from the reforms and replacement of existing benchmark interest rates such as LIBOR and other inter-bank offered rates (‘IBOR reform’). The forthcoming IBOR reform may take effect at different times and may have a different impact on the hedged items (the fixed and floating rate borrowings) and the hedging instruments (the interest rate swaps and cross currency swaps used to hedge the borrowings). The reliefs have the effect that the IBOR reform should not generally cause hedge accounting to terminate. The reliefs under the amendments will end when the uncertainty arising from the IBOR reform are no longer present; or the hedging relationship is discontinued. Note 34 provides the nominal amounts and maturities of the hedging derivative financial instruments which are impacted by the IBOR reform. Early adoption of these amendments has no impact on the Group’s consolidated financial statements for 2019.
Apart from the above, the Group has not early adopted any standard, interpretation or amendments that have been issued but not yet effective (refer note 41).
The principal operating subsidiaries, associates and joint ventures have different functional currencies in line with the economic environments of the locations in which they operate. The functional currency of the Company is United States dollars. The consolidated financial statements are presented in United States dollars.
The Group’s reportable segments are set out in note 2 and are described on page 8 and pages 9 to 19.
Changes in principal accounting policiesIFRS 16 ‘Leases’The standard replaces IAS 17 ‘Leases’ and related interpretations, and introduces a comprehensive model for the identification of lease arrangements and accounting treatments for both lessors and lessees. The distinction between operating and finance leases is removed for lessee accounting, and is replaced by a model where a lease liability and a corresponding right-of-use asset have to be recognised on the balance sheet for almost all leases by the lessees. The Group’s recognised right-of-use assets primarily relate to property leases, which are entered into for use as retail stores and offices. There are also right-of-use assets relate to plant & machinery and motor vehicles. Prior to 2019, payments made under operating leases were charged to profit and loss on a straight-line basis over the period of the lease. Upon the adoption of IFRS 16, each lease payment is allocated between settlement of the lease liability and finance cost. The finance cost is charged to profit and loss over the lease period. The right-of-use asset is depreciated over the shorter of the asset’s useful life and the lease term on a straight-line basis.
In addition, leasehold land which represents payments to third parties to acquire interests in property, previously included in intangible assets and tangible assets, is now presented under right-of-use assets. Leasehold land is amortised over the useful life of the lease, which includes the renewal period if the lease is likely to be renewed by the Group without significant cost.
The accounting for lessors does not change significantly.
Changes to accounting policies on adoption of IFRS 16 have been applied retrospectively, and the comparative financial statements have been restated.

Jardine Matheson Annual Report 2019
36 Notes to the Financial Statements
The effects of adopting IFRS 16 were as follows:
(i) On the consolidated profit and loss account for the year ended 31st December 2018:
Increase/(decrease)
in profitUS$m
Net operating costs 160Net financing charges (163)Share of results of associates and joint ventures (20)Profit before tax (23)Tax 6
Profit after tax (17)
Attributable to:Shareholders of the Company* (10)Non-controlling interests (7)
(17)
* Further analysed as:Underlying profit attributable to shareholders (48)Non-trading items– sale and closure of businesses 17– restructuring of businesses 21
38
Profit attributable to shareholders (10)
Basic underlying earnings per share (US$) (0.13)
Diluted underlying earnings per share (US$) (0.13)
Basic earnings per share (US$) (0.02)
Diluted earnings per share (US$) (0.02)
(ii) On the consolidated statement of comprehensive income for the year ended 31st December 2018:
Increase/ (decrease)
in totalcomprehensive
incomeUS$m
Profit for the year (17)Other comprehensive incomeItems that may be reclassified subsequently to profit or loss:Net exchange translation differences– net gain arising during the year 10– transfer to profit and loss (2)Other comprehensive income for the year, net of tax 8
Total comprehensive income for the year (9)
Attributable to:Shareholders of the Company (4)Non-controlling interests (5)
(9)

Jardine Matheson Annual Report 2019
37Notes to the Financial Statements
(iii) On the consolidated balance sheet at 1st JanuaryIncrease/(decrease)
2019 2018US$m US$m
AssetsIntangible assets (713) (752)Tangible assets (715) (678)Right-of-use assets 5,451 5,563Associates and joint ventures (39) (21)Non-current debtors (13) (52)Deferred tax assets 1 11Current debtors (80) (34)
Total assets 3,892 4,037
EquityRevenue and other reserves (273) (268)Non-controlling interests (126) (123)
Total equity (399) (391)
LiabilitiesLong-term borrowings (24) (1)Non-current lease liabilities 3,523 3,537Deferred tax liabilities (36) (22)Non-current creditors (2) (2)Non-current provisions 6 90
Non-current liabilities 3,467 3,602
Current creditors (37) (44)Current borrowings (14) (3)Current lease liabilities 895 865Current provisions (20) 8
Current liabilities 824 826
Total liabilities 4,291 4,428
Total equity and liabilities 3,892 4,037
(iv) On the consolidated cash flow statement for the year ended 31st December 2018: Inflows/(outflows)
US$m
Operating activitiesCash generated from operations 1,174Interest and other financing charges paid (163)
1,011
Investing activitiesPurchase of intangible assets 8Purchase of tangible assets 24Additions to right-of-use assets (32)Sale of intangible assets (12)Sale of right-of-use assets 12
–
Financing activitiesRepayment of borrowings 7Principal elements of lease payments (1,018)
(1,011)
Net change in cash and cash equivalents –

Jardine Matheson Annual Report 2019 Jardine Matheson Annual Report 2019
38 39Notes to the Financial Statements Notes to the Financial Statements
JardinePacific
JardineMotors
HongkongLand
DairyFarm
MandarinOriental
JardineCycle &
Carriage Astra
JardineLloyd
Thompson#
Corporateand otherinterests
Intersegmenttransactions
Underlyingbusiness
performance
Non-trading
items GroupUS$m US$m US$m US$m US$m US$m US$m US$m US$m US$m US$m US$m US$m
2019Revenue (refer note 3) 2,635 5,690 2,320 11,192 567 1,788 16,803 – – (73) 40,922 – 40,922Net operating costs (2,562) (5,553) (1,150) (10,757) (496) (1,701) (14,711) – (74) 73 (36,931) 1,576 (35,355)Change in fair value of investment properties – – – – – – – – – – – (832) (832)Operating profit 73 137 1,170 435 71 87 2,092 – (74) – 3,991 744 4,735Net financing charges– financing charges (17) (19) (205) (165) (18) (45) (318) – – – (787) – (787)– financing income 1 4 84 7 3 1 92 – 61 – 253 – 253
(16) (15) (121) (158) (15) (44) (226) – 61 – (534) – (534)Share of results of associates and joint ventures– before change in fair value of investment
properties 124 116 273 115 (2) 108 493 – (6) – 1,221 20 1,241– change in fair value of investment properties – – – – – – – – – – – (11) (11)
124 116 273 115 (2) 108 493 – (6) – 1,221 9 1,230Profit before tax 181 238 1,322 392 54 151 2,359 – (19) – 4,678 753 5,431Tax (14) (23) (247) (70) (13) (16) (555) – (3) – (941) (16) (957)Profit after tax 167 215 1,075 322 41 135 1,804 – (22) – 3,737 737 4,474Non-controlling interests (3) (19) (615) (112) (14) (51) (1,349) – 15 – (2,148) 512 (1,636)
Profit attributable to shareholders 164 196 460 210 27 84 455 – (7) – 1,589 1,249 2,838
Net (borrowings)/cash (excluding net borrowings of financial services companies)* (63) 23 (3,591) (821) (300) (1,494) (1,554) – 3,014 – (4,786)
Total equity 1,133 1,599 38,290 1,430 4,222 1,393 13,701 – 3,479 (176) 65,071
2018Revenue (refer note 3) 2,585 5,905 2,665 11,749 614 1,938 17,133 – – (62) 42,527 – 42,527Net operating costs (2,519) (5,753) (1,576) (11,242) (519) (1,842) (14,995) – (72) 62 (38,456) (814) (39,270)Change in fair value of investment properties – – – – – – – – – – – 1,251 1,251Operating profit 66 152 1,089 507 95 96 2,138 – (72) – 4,071 437 4,508Net financing charges– financing charges (14) (19) (171) (172) (16) (37) (224) – (2) – (655) – (655)– financing income – 5 57 5 2 1 95 – 15 – 180 – 180
(14) (14) (114) (167) (14) (36) (129) – 13 – (475) – (475)Share of results of associates and joint ventures– before change in fair value of investment
properties 127 86 265 113 6 127 478 77 (25) – 1,254 (32) 1,222– change in fair value of investment properties – – – – – – – – – – – 189 189
127 86 265 113 6 127 478 77 (25) – 1,254 157 1,411Profit before tax 179 224 1,240 453 87 187 2,487 77 (84) – 4,850 594 5,444Tax (14) (34) (206) (93) (19) (20) (579) – (2) – (967) 9 (958)Profit after tax 165 190 1,034 360 68 167 1,908 77 (86) – 3,883 603 4,486Non-controlling interests (5) (15) (596) (125) (23) (66) (1,443) – 45 – (2,228) (536) (2,764)
Profit attributable to shareholders 160 175 438 235 45 101 465 77 (41) – 1,655 67 1,722
Net (borrowings)/cash (excluding net borrowings of financial services companies)* (88) 57 (3,564) (744) (285) (1,282) (870) – 863 – (5,913)
Total equity 1,044 1,511 38,370 1,351 1,342 1,260 12,331 485 1,272 (168) 58,798
# No profit was recognised in respect of interest in Jardine Lloyd Thompson from 1st January 2019 to the date of completion in April 2019 (refer note 9).
* Net (borrowings)/cash is total borrowings less bank balances and other liquid funds. Net borrowings of financial services companies amounted to US$3,294 million at 31st December 2019 (2018: US$3,292 million) and relates to Astra.
2 Segmental InformationOperating segments are identified on the basis of internal reports about components of the Group that are regularly reviewed by the executive directors of the Company for the purpose of resource allocation and performance assessment. The Group has seven operating
segments (2018: eight) as more fully described on page 8. No operating segments have been aggregated to form the reportable segments. Set out below is an analysis of the Group’s underlying profit, net borrowings and total equity by reportable segment.

Jardine Matheson Annual Report 2019
40 Notes to the Financial Statements
2 Segmental Information (continued)
Set out below are analyses of the Group’s underlying profit attributable to shareholders and non-current assets, by geographical areas:
2019 2018US$m US$m
Underlying profit attributable to shareholders:Greater China 920 945Southeast Asia 670 676United Kingdom 19 60Rest of the world (13) 15
1,596 1,696Corporate and other interests (7) (41)
1,589 1,655
Non-current assets*:Greater China 44,619 42,123Southeast Asia 19,807 18,659United Kingdom 671 945Rest of the world 944 1,099
66,041 62,826
* Excluding financial instruments, deferred tax assets and pension assets.

Jardine Matheson Annual Report 2019
41Notes to the Financial Statements
3 Revenue
JardinePacific
JardineMotors
HongkongLand
DairyFarm
MandarinOriental
JardineCycle &
Carriage Intersegment Astra transactions Group
US$m US$m US$m US$m US$m US$m US$m US$m US$m
2019Gross Revenue 6,767 22,967 4,437 27,665 908 6,958 33,887 (281) 103,308
RevenueBy product and
service:Property 5 – 2,320 – – – 30 (10) 2,345Motor vehicles – 5,685 – – – 1,788 7,315 (1) 14,787Retail and
restaurants 733 – – 11,192 – – – – 11,925Financial services – – – – – – 1,453 – 1.453Engineering,
heavy equipment, mining, construction and energy 612 – – – – – 5,941 (42) 6,511
Hotels – – – – 567 – – (1) 566Other 1,285 5 – – – – 2,064 (19) 3,335
2,635 5,690 2,320 11,192 567 1,788 16,803 (73) 40,922
By geographical location of customers:
Greater China 1,926 3,025 1,753 7,340 162 – – (69) 14,137Southeast Asia 709 1 567 3,852 27 1,788 16,803 (4) 23,743United Kingdom – 2,664 – – 65 – – – 2,729Rest of the world – – – – 313 – – – 313
2,635 5,690 2,320 11,192 567 1,788 16,803 (73) 40,922
From contracts with customers:
Recognised at a point in time 1,951 5,685 653 11,192 207 1,721 14,703 (14) 36,098
Recognised over time 678 5 516 – 340 67 428 (49) 1,985
2,629 5,690 1,169 11,192 547 1,788 15,131 (63) 38,083From other sources:Rental income
from investment properties 6 – 999 – – – 7 (10) 1,002
Revenue from financial services companies – – – – – – 1,453 – 1,453
Other – – 152 – 20 – 212 – 3846 – 1,151 – 20 – 1,672 (10) 2,839
2,635 5,690 2,320 11,192 567 1,788 16,803 (73) 40,922

Jardine Matheson Annual Report 2019
42 Notes to the Financial Statements
3 Revenue (continued)
JardinePacific
JardineMotors
HongkongLand
DairyFarm
MandarinOriental
JardineCycle &
Carriage
Intersegment transactions Astra and other* Group
US$m US$m US$m US$m US$m US$m US$m US$m US$m
2018Gross Revenue 6,827 15,954 4,642 21,957 985 7,277 33,072 1,634 92,348
RevenueBy product and
service:Property 5 – 2,665 – – – 279 (10) 2,939Motor vehicles – 5,905 – – – 1,938 7,424 – 15,267Retail and
restaurants 682 – – 11,749 – – – – 12,431Financial services – – – – – – 1,376 – 1,376Engineering, heavy
equipment, mining, construction and energy 565 – – – – – 5,970 (34) 6,501
Hotels – – – – 614 – – (2) 612Other 1,333 – – – – – 2,084 (16) 3,401
2,585 5,905 2,665 11,749 614 1,938 17,133 (62) 42,527
By geographical location of customers:
Greater China 1,842 3,087 1,663 7,422 252 – – (57) 14,209Southeast Asia 743 – 1,002 4,327 25 1,938 17,133 (5) 25,163United Kingdom – 2,818 – – 19 – – – 2,837Rest of the world – – – – 318 – – – 318
2,585 5,905 2,665 11,749 614 1,938 17,133 (62) 42,527
From contracts with customers:
Recognised at a point in time 1,948 5,902 1,319 11,749 223 1,882 15,109 (8) 38,124
Recognised over time 632 3 214 – 370 56 431 (44) 1,662
2,580 5,905 1,533 11,749 593 1,938 15,540 (52) 39,786From other sources:Rental income from
investment properties 5 – 983 – – – 2 (10) 980
Revenue from financial services companies – – – – – – 1,376 – 1,376
Other – – 149 – 21 – 215 – 3855 – 1,132 – 21 – 1,593 (10) 2,741
2,585 5,905 2,665 11,749 614 1,938 17,133 (62) 42,527
Gross revenue comprises revenue together with 100% of revenue from associates and joint ventures.
No interest income calculated using effective interest method had been included in revenue from contracts with customers in 2019 and 2018.
Rental income from investment properties included variable rents of US$16 million (2018: US$16 million).
* Included revenue from Jardine Lloyd Thompson, which was disposed of during 2019, of US$1,931 million (refer note 9).

Jardine Matheson Annual Report 2019
43Notes to the Financial Statements
3 Revenue (continued)
Contract balancesContract assets primarily relate to the Group’s rights to consideration for work completed but not billed, and are transferred to receivables when the rights become unconditional which usually occurs when the customers are billed.
Costs to fulfil contracts includes costs recognised to fulfil future performance obligations on existing contracts that have not yet been satisfied. Costs to obtain contracts include costs such as sales commission and stamp duty paid, as a result of obtaining contracts. The Group has capitalised these costs and recognised in profit and loss when the related revenue is recognised.
Contract liabilities primarily relate to the advance consideration received from customers for which revenue is recognised over time.
Contract assets and contract liabilities are further analysed as follows:
2019 2018US$m US$m
Contract assets (refer note 17)– properties for sale 103 79– engineering, heavy equipment, mining, construction and energy 547 419– other 16 11
666 509– provision for impairment (1) –
665 509
Contract liabilities (refer note 31)– properties for sale 324 353– motor vehicles 360 375– retail and restaurants 141 140– engineering, heavy equipment, mining, construction and energy 132 110– other 53 96
1,010 1,074
At 31st December 2019, costs to fulfil contracts and costs to obtain contracts amounted to US$387 million (2018: US$285 million) and US$14 million (2018: US$7 million), and US$605 million (2018: US$403 million) and US$13 million (2018: US$23 million) have been recognised in profit and loss during the year, respectively.

Jardine Matheson Annual Report 2019
44 Notes to the Financial Statements
3 Revenue (continued)
Revenue recognised in relation to contract liabilitiesRevenue recognised in the current year relating to carried-forward contract liabilities:
2019 2018US$m US$m
Properties for sale 297 806Motor vehicles 235 185Retail and restaurants 101 135Engineering, heavy equipment, mining, construction and energy 37 50Other 89 56
759 1,232
Revenue expected to be recognised on unsatisfied contracts with customersTiming of revenue to be recognised on unsatisfied performance obligations:
Propertiesfor sale
Motorvehicles
Engineering,heavy
equipment,mining,
constructionand energy Other Total
US$m US$m US$m US$m US$m
2019Within one year 605 106 641 77 1,429Between one and two years 469 65 303 18 855Between two and three years – 35 148 5 188Between three and four years 13 18 53 1 85Between four and five years – 7 70 – 77
1,087 231 1,215 101 2,634
2018Within one year 716 96 790 75 1,677Between one and two years 142 63 133 13 351Between two and three years 100 36 138 2 276Between three and four years – 18 19 1 38Between four and five years 10 10 3 – 23Beyond five years – – 2 – 2
968 223 1,085 91 2,367
As permitted under IFRS 15 ‘Revenue from Contracts with Customers’, the revenue expected to be recognised in the next reporting periods arising from unsatisfied performance obligations for contracts that have original expected durations of one year or less is not disclosed.

Jardine Matheson Annual Report 2019
45Notes to the Financial Statements
4 Net Operating Costs
2019 2018US$m US$m
Cost of sales (30,727) (32,136)Other operating income 2,272 814Selling and distribution costs (4,457) (4,586)Administration expenses (2,341) (2,221)Other operating expenses (102) (1,141)
(35,355) (39,270)
The following credits/(charges) are included in net operating costs:Cost of stocks recognised as expense (26,635) (28,641)Cost of properties for sale recognised as expense (797) (1,396)Amortisation of intangible assets (172) (98)Depreciation of tangible assets (1,118) (935)Amortisation/depreciation of right-of-use assets (1,089) (1,126)Depreciation of bearer plants (27) (25)Impairment of intangible assets (22) (127)Reversal of impairment/(impairment) of tangible assets 3 (203)Impairment of right-of-use assets (11) (93)Impairment of bearer plants (8) –Write down of stocks and work in progress (75) (80)Reversal of write down of stocks and work in progress 44 33Impairment of financing debtors (100) (147)Impairment of trade debtors, contract assets and other debtors (21) (68)Operating expenses arising from investment properties (173) (179)Net foreign exchange gains/(losses) 1 (12)Employee benefit expense– salaries and benefits in kind (3,811) (3,768)– share options granted (4) (6)– defined benefit pension plans (refer note 19) (117) (87)– defined contribution pension plans (100) (102)
(4,032) (3,963)Expenses relating to low-value leases (16) (15)Expenses relating to short-term leases (94) (56)Expenses relating to variable lease payment not included in lease liabilities (54) (57)Sublease income 44 44Auditors’ remuneration– audit (22) (19)– non-audit services (6) (3)
(28) (22)Dividend income from equity investments 70 66Interest income from debt investments 46 41Rental income from properties 27 31
Net operating costs included the following gains/(losses) from non-trading items:Change in fair value of other investments 71 (476)Sale of Jardine Lloyd Thompson 1,507 (21)Sale and closure of other businesses 32 179Sale of property interests 16 34Restructuring of businesses (15) (435)Reclassification of joint ventures as subsidiaries (14) (61)Closure of a hotel (32) (27)Other 11 (7)
1,576 (814)

Jardine Matheson Annual Report 2019
46 Notes to the Financial Statements
5 Net Financing Charges
2019 2018US$m US$m
Interest expense– bank loans and advances (356) (290)– interest on lease liabilities (154) (164)– other (147) (130)
(657) (584)Fair value gains/(losses) on fair value hedges 12 (9)Fair value adjustment on hedged items attributable to the hedged risk (12) 9
– –(657) (584)
Interest capitalised 9 17Commitment and other fees (139) (88)Financing charges (787) (655)Financing income 253 180
(534) (475)
6 Share of Results of Associates and Joint Ventures
2019 2018US$m US$m
By business:Jardine Pacific 133 127Jardine Motors 116 86Hongkong Land 240 429Dairy Farm 126 114Mandarin Oriental (2) 6Jardine Cycle & Carriage 128 127Astra 494 479Jardine Lloyd Thompson – 43Corporate and other interests (5) –
1,230 1,411
Share of results of associates and joint ventures included the following gains/(losses) from non-trading items:
Change in fair value of investment properties (11) 189Change in fair value of other investments (1) 1Sale and closure of businesses 20 1Costs associated with a regulatory review – (17)Merger-related costs – (15)Other 1 (2)
9 157
Results are shown after tax and non-controlling interests in the associates and joint ventures.

Jardine Matheson Annual Report 2019
47Notes to the Financial Statements
7 Tax
2019 2018US$m US$m
Tax charged to profit and loss is analysed as follows:Current tax (984) (928)Deferred tax 27 (30)
(957) (958)
Greater China (329) (321)Southeast Asia (611) (647)United Kingdom (5) (2)Rest of the world (12) 12
(957) (958)
Reconciliation between tax expense and tax at the applicable tax rate*:Tax at applicable tax rate (632) (848)Income not subject to tax– change in fair value of investment properties 15 205– other items 195 126Expenses not deductible for tax purposes– change in fair value of investment properties (168) (4)– other items (226) (282)Tax losses and temporary differences not recognised (43) (86)Utilisation of previously unrecognised tax losses and temporary differences 5 3Recognition of previously unrecognised tax losses and temporary differences 1 1Deferred tax assets written off – (7)Deferred tax liabilities written back 1 3Underprovision in prior years (3) (11)Withholding tax (56) (65)Land appreciation tax in Chinese mainland (49) (15)Tax refund on disposal of other investments in prior year – 19Change in tax rate (2) 1Other 5 2
(957) (958)
Tax relating to components of other comprehensive income is analysed as follows:Remeasurements of defined benefit plans 2 3Cash flow hedges 29 (13)
31 (10)
Share of tax charge of associates and joint ventures of US$431 million (2018: US$522 million) is included in share of results of associates and joint ventures. Share of tax credit of US$17 million (2018: nil) is included in other comprehensive income of associates and joint ventures.
* The applicable tax rate for the year was 15.1% (2018: 21.0%) and represents the weighted average of the rates of taxation prevailing in the territories in which the Group operates. The decrease in applicable tax rate is primarily due to the profit on sale of the Group’s interest in Jardine Lloyd Thompson of US$1.5 billion is not subject to tax (refer note 9). The applicable tax rate would be 23.5% if excluding such profit.

Jardine Matheson Annual Report 2019
48 Notes to the Financial Statements
8 Earnings per ShareBasic earnings per share are calculated on profit attributable to shareholders of US$2,838 million (2018: US$1,722 million) and on the weighted average number of 375 million (2018: 376 million) shares in issue during the year.
Diluted earnings per share are calculated on profit attributable to shareholders of US$2,838 million (2018: US$1,721 million), which is after adjusting for the effects of the conversion of dilutive potential ordinary shares of subsidiaries, associates or joint ventures, and on the weighted average number of 375 million (2018: 376 million) shares in issue during the year.
The weighted average number of shares is arrived at as follows:
Ordinary sharesin millions
2019 2018
Weighted average number of shares in issue 737 732Company’s share of shares held by subsidiaries (362) (356)Weighted average number of shares for basic earnings per share calculation 375 376Adjustment for shares deemed to be issued for no consideration under the
Senior Executive Share Incentive Schemes – –
Weighted average number of shares for diluted earnings per share calculation 375 376
Additional basic and diluted earnings per share are also calculated based on underlying profit attributable to shareholders. A reconciliation of earnings is set out below:
2019 2018Basic
earningsper share
Dilutedearnings
per share
Basicearnings
per share
Dilutedearnings
per shareUS$m US$ US$ US$m US$ US$
Profit attributable to shareholders 2,838 7.56 7.56 1,722 4.58 4.57Non-trading items (refer note 9) (1,249) (67)
Underlying profit attributable to shareholders 1,589 4.23 4.23 1,655 4.40 4.39

Jardine Matheson Annual Report 2019
49Notes to the Financial Statements
9 Non-trading Items
2019 2018US$m US$m
By business:Jardine Pacific 121 23Jardine Motors 4 2Hongkong Land (376) 603Dairy Farm 2 (179)Mandarin Oriental (64) (14)Jardine Cycle & Carriage 9 (280)Astra 2 3Jardine Lloyd Thompson – (34)Corporate and other interests 1,551 (57)
1,249 67
An analysis of non-trading items after interest, tax and non-controlling interests is set out below:
Change in fair value of investment properties– Hongkong Land (391) 594– other 54 19
(337) 613Change in fair value of other investments 49 (316)Sale of Jardine Lloyd Thompson 1,507 (21)Sale and closure of other businesses 48 118Sale of property interests 10 23Restructuring of businesses (9) (275)Reclassification of joint ventures as subsidiaries (9) (40)Closure of a hotel (19) (18)Tax refund on disposal of other investments in prior year – 16Costs associated with a regulatory review – (17)Merger-related costs – (15)Other 9 (1)
1,249 67
The sale of the Group’s 41% interest in Jardine Lloyd Thompson was completed in April 2019 with net proceeds of US$2.1 billion generating a profit on sale of US$1.5 billion.
Restructuring of businesses in 2018 related to Dairy Farm’s restructuring of its Southeast Asia Grocery Retail business following the completion of a strategic review. The charges comprised impairment charges of the carrying values of certain goodwill, tangible assets and right-of-use assets, as well as provisions for payments to tenants and employees.
Sale and closure of other businesses in 2018 included a gain of US$111 million related to the disposal of a subsidiary in the Philippines by Dairy Farm under a partnership arrangement with Robinsons Retail Holdings, Inc. (‘Robinsons Retail’), a multi-format retailer listed on the Philippine Stock Exchange (refer note 15).

Jardine Matheson Annual Report 2019
50 Notes to the Financial Statements
10 Intangible Assets
GoodwillFranchise
rights
Deferred Leasehold Concession exploration land rights costs Other Total
US$m US$m US$m US$m US$m US$m US$m
2019Cost– as previously reported 1,443 148 983 552 989 508 4,623– change in accounting policies
(refer note 1) 1 – (983) – – – (982)– as restated 1,444 148 – 552 989 508 3,641Amortisation and impairment– as previously reported (219) – (269) (34) (479) (244) (1,245)– change in accounting policies
(refer note 1) – – 269 – – – 269– as restated (219) – – (34) (479) (244) (976)Net book value at 1st January 1,225 148 – 518 510 264 2,665Exchange differences 27 6 – 23 1 5 62Additions 4 – – 80 117 139 340Disposals (19) – – – – (5) (24)Amortisation – – – (6) (72) (94) (172)Impairment charge (6) – – – – (16) (22)
Net book value at 31st December 1,231 154 – 615 556 293 2,849
Cost 1,456 154 – 656 1,107 588 3,961Amortisation and impairment (225) – – (41) (551) (295) (1,112)
1,231 154 – 615 556 293 2,849

Jardine Matheson Annual Report 2019
51Notes to the Financial Statements
10 Intangible Assets (continued)
GoodwillFranchise
rights
Deferred Leasehold Concession exploration land rights costs Other Total
US$m US$m US$m US$m US$m US$m US$m
2018Cost– as previously reported 1,303 158 999 563 120 497 3,640– change in accounting policies
(refer note 1) – – (999) – – – (999)– as restated 1,303 158 – 563 120 497 2,641Amortisation and impairment– as previously reported (88) – (247) (31) (29) (236) (631)– change in accounting policies
(refer note 1) – – 247 – – – 247– as restated (88) – – (31) (29) (236) (384)Net book value at 1st January 1,215 158 – 532 91 261 2,257Exchange differences (43) (10) – (35) (1) (9) (98)New subsidiaries 272 – – – 428 6 706Additions – – – 25 14 109 148Disposals (102) – – – – (21) (123)Amortisation – – – (4) (22) (72) (98)Impairment charge (117) – – – – (10) (127)
Net book value at 31st December 1,225 148 – 518 510 264 2,665
Cost 1,444 148 – 552 989 508 3,641Amortisation and impairment (219) – – (34) (479) (244) (976)
1,225 148 – 518 510 264 2,665
2019 2018US$m US$m
Goodwill allocation by business:Jardine Pacific 62 71Jardine Motors 54 64Dairy Farm 596 586Mandarin Oriental 40 39Astra 479 465
1,231 1,225

Jardine Matheson Annual Report 2019
52 Notes to the Financial Statements
10 Intangible Assets (continued)
Goodwill relating to Dairy Farm is allocated to groups of cash-generating units (‘CGU’) identified by banners or group of stores acquired in each geographical segment. Dairy Farm management has assessed the recoverable amount of each CGU based on value-in-use calculations using cash flow projections based on approved budgets which have forecasts covering a period of three years and projections for a further two years.
Key assumptions used for value-in-use calculations for the significant balances of Dairy Farm goodwill include budgeted gross margins between 18% and 31% and average sales growth rates are between 1.0% and 2.7% to project cash flows, which vary across the Group’s business segments and geographical locations, over a five-year period and thereafter, and are based on management expectations for the market development; and pre-tax discount rates between 5% and 14% applied to the cash flow projections. The discount rates used reflect business specific risks relating to the relevant industry, business life-cycle and geographical location. On the basis of this review, management concluded that no further impairment charge was required.
Total impairment charge of goodwill of US$117 million recognised in the profit and loss in 2018 included an impairment charge of US$102 million related to Dairy Farm’s Giant businesses in Malaysia and Singapore following the completion of a strategic review of its Southeast Asia Grocery Retail business. Goodwill related to the Malaysian Giant business was fully impaired and goodwill related to the Singapore Giant business had been reduced to its estimated recoverable amount in 2018.
Goodwill relating to Astra included goodwill arising from acquisition of shares in Astra and Astra’s acquisition of 95% interest in PT Agincourt Resources in 2018. For the purpose of impairment review in respect of goodwill relating to Astra, the carrying value of Astra is compared with the recoverable amount measured by reference to the quoted market price of the shares held. On the basis of this review and the continued expected level of profitability, management concluded that no impairment has occurred.
Franchise rights are rights under franchise agreements with automobile and heavy equipment manufacturers. These franchise agreements are deemed to have indefinite lives because either they do not have any term of expiry or their renewal would be probable and would not involve significant costs, taking into account the history of renewal and the relationships between the franchisee and the contracting parties. The carrying amounts of franchise rights comprise mainly Astra’s automotive of US$55 million and heavy equipment of US$97 million, are not amortised as such rights will contribute cash flows for an indefinite period. Management has performed an impairment review of the carrying amounts of franchise rights at 31st December 2019 and has concluded that no impairment has occurred. The impairment review was made by comparing the carrying amounts of the cash-generating units in which the franchise rights reside with the recoverable amounts of the cash-generating units. The recoverable amounts of the cash-generating units are determined based on value-in-use calculations. These calculations use pre-tax cash flow projections based on budgets covering a three-year period. Cash flows beyond the three-year period are extrapolated using growth rates between 3% and 4%. Pre-tax discount rate between 14% and 15% reflecting business specific risks, is applied to the cash flow projections.
Other intangible assets comprise trademarks, computer software, deferred acquisition costs for insurance contracts and customer contracts.
The amortisation charges are all recognised in arriving at operating profit and are included in cost of sales, selling and distribution costs and administration expenses.
The remaining amortisation periods for intangible assets are as follows:
Concession rights by traffic volume over 36 to 40 yearsComputer software up to 8 yearsDeferred exploration costs by unit of productionOther various
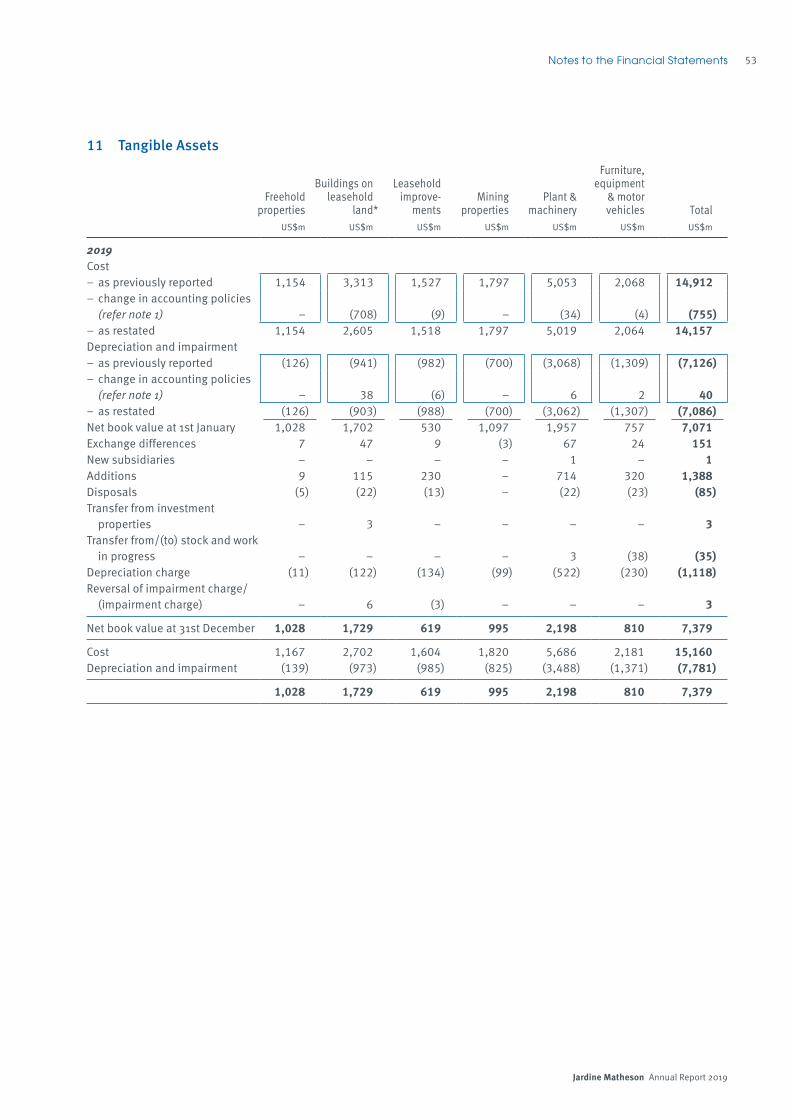
Jardine Matheson Annual Report 2019
53Notes to the Financial Statements
11 Tangible Assets
Buildings onFreehold leasehold
properties land*
Leaseholdimprove-
mentsMining
propertiesPlant &
machinery
Furniture,equipment
& motorvehicles Total
US$m US$m US$m US$m US$m US$m US$m
2019Cost– as previously reported 1,154 3,313 1,527 1,797 5,053 2,068 14,912– change in accounting policies
(refer note 1) – (708) (9) – (34) (4) (755)– as restated 1,154 2,605 1,518 1,797 5,019 2,064 14,157Depreciation and impairment– as previously reported (126) (941) (982) (700) (3,068) (1,309) (7,126)– change in accounting policies
(refer note 1) – 38 (6) – 6 2 40– as restated (126) (903) (988) (700) (3,062) (1,307) (7,086)Net book value at 1st January 1,028 1,702 530 1,097 1,957 757 7,071Exchange differences 7 47 9 (3) 67 24 151New subsidiaries – – – – 1 – 1Additions 9 115 230 – 714 320 1,388Disposals (5) (22) (13) – (22) (23) (85)Transfer from investment
properties – 3 – – – – 3Transfer from/(to) stock and work
in progress – – – – 3 (38) (35)Depreciation charge (11) (122) (134) (99) (522) (230) (1,118)Reversal of impairment charge/
(impairment charge) – 6 (3) – – – 3
Net book value at 31st December 1,028 1,729 619 995 2,198 810 7,379
Cost 1,167 2,702 1,604 1,820 5,686 2,181 15,160Depreciation and impairment (139) (973) (985) (825) (3,488) (1,371) (7,781)
1,028 1,729 619 995 2,198 810 7,379

Jardine Matheson Annual Report 2019
54 Notes to the Financial Statements
11 Tangible Assets (continued)
Buildings on Freehold leasehold properties land*
Leaseholdimprove-
mentsMining
propertiesPlant &
machinery
Furniture,equipment
& motorvehicles Total
US$m US$m US$m US$m US$m US$m US$m
2018Cost– as previously reported 1,166 3,264 1,516 1,156 4,418 2,077 13,597– change in accounting policies
(refer note 1) – (697) 1 – (3) (4) (703)– as restated 1,166 2,567 1,517 1,156 4,415 2,073 12,894Depreciation and impairment– as previously reported (112) (744) (944) (722) (2,791) (1,276) (6,589)– change in accounting policies
(refer note 1) – 36 (12) – – 1 25– as restated (112) (708) (956) (722) (2,791) (1,275) (6,564)Net book value at 1st January 1,054 1,859 561 434 1,624 798 6,330Exchange differences (38) (84) (14) 1 (95) (42) (272)New subsidiaries – – 10 682 142 4 838Additions 55 201 161 – 762 287 1,466Disposals (8) (25) (39) – (33) (15) (120)Revaluation surplus before
transfer to investment properties – 1 – – – – 1
Transfer to investment properties – (5) – – – – (5)Transfer to stock and work in
progress – – – – (2) (27) (29)Depreciation charge (11) (123) (134) (20) (420) (227) (935)Impairment charge (24) (122) (15) – (21) (21) (203)
Net book value at 31st December 1,028 1,702 530 1,097 1,957 757 7,071
Cost 1,154 2,605 1,518 1,797 5,019 2,064 14,157Depreciation and impairment (126) (903) (988) (700) (3,062) (1,307) (7,086)
1,028 1,702 530 1,097 1,957 757 7,071
* In previous years, the total net book value of leasehold land and buildings was reported, and in 2019, the net book value of leasehold land was reclassified to right-of-use assets upon the adoption of IFRS 16.
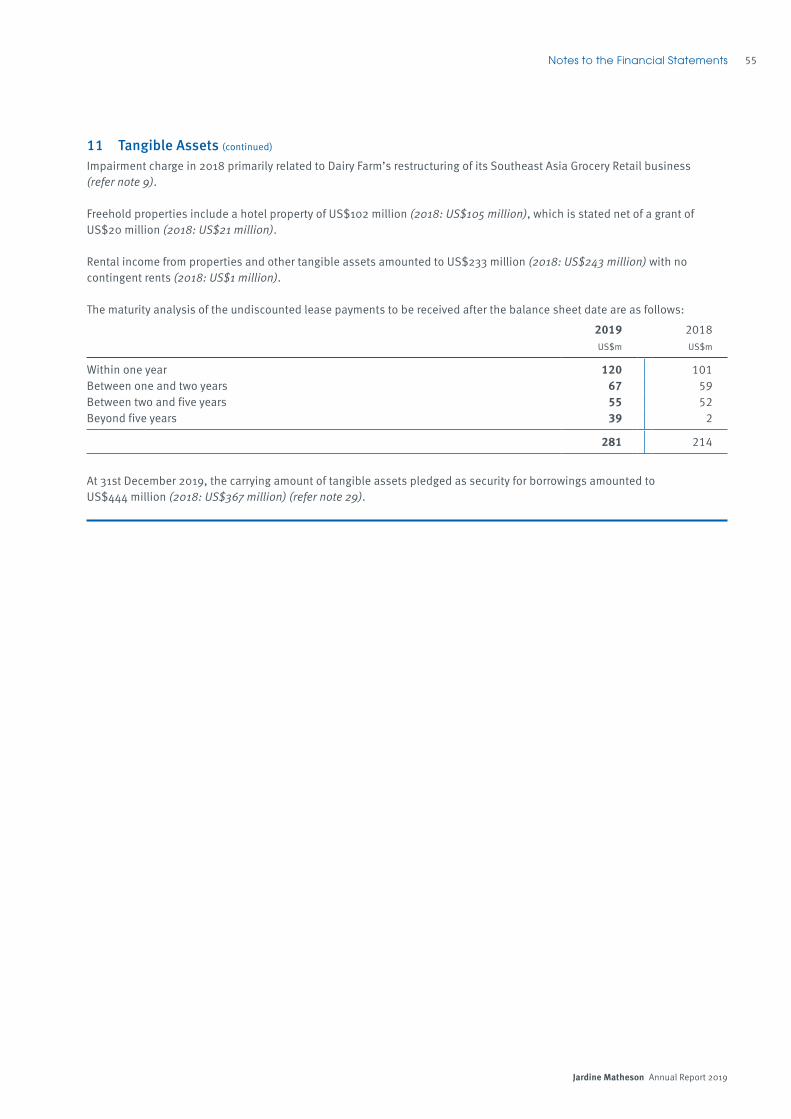
Jardine Matheson Annual Report 2019
55Notes to the Financial Statements
11 Tangible Assets (continued)
Impairment charge in 2018 primarily related to Dairy Farm’s restructuring of its Southeast Asia Grocery Retail business (refer note 9).
Freehold properties include a hotel property of US$102 million (2018: US$105 million), which is stated net of a grant of US$20 million (2018: US$21 million).
Rental income from properties and other tangible assets amounted to US$233 million (2018: US$243 million) with no contingent rents (2018: US$1 million).
The maturity analysis of the undiscounted lease payments to be received after the balance sheet date are as follows:
2019 2018US$m US$m
Within one year 120 101Between one and two years 67 59Between two and five years 55 52Beyond five years 39 2
281 214
At 31st December 2019, the carrying amount of tangible assets pledged as security for borrowings amounted to US$444 million (2018: US$367 million) (refer note 29).

Jardine Matheson Annual Report 2019
56 Notes to the Financial Statements
12 Right-of-use Assets
Leaseholdland Properties
Plant &machinery
Motorvehicles Other Total
US$m US$m US$m US$m US$m US$m
2019Cost– change in accounting policies
(refer note 1) 1,702 6,902 68 96 43 8,811Amortisation/depreciation
and impairment– change in accounting policies
(refer note 1) (316) (2,933) (27) (56) (28) (3,360)Net book value at 1st January 1,386 3,969 41 40 15 5,451Exchange differences 32 37 3 1 (1) 72New subsidiaries – 2 – – – 2Additions 61 329 71 12 5 478Disposals (6) (29) – – (10) (45)Revaluation surplus before transfer
to investment properties 2,943 – – – – 2,943Transfer to investment properties, net (3,041) – – – – (3,041)Transfer to stock and work in
progress – – – (1) – (1)Modifications to lease terms – 370 – – – 370Amortisation/depreciation charge (49) (973) (35) (23) (9) (1,089)Impairment charge (9) (2) – – – (11)
Net book value at 31st December 1,317 3,703 80 29 – 5,129
Cost 1,695 7,230 141 110 1 9,177Amortisation/depreciation
and impairment (378) (3,527) (61) (81) (1) (4,048)
1,317 3,703 80 29 – 5,129
The typical lease term associated with the right-of-use assets are as follows:
Leasehold land 2 to 999 yearsProperties 1 to 20 yearsPlant & machinery 1 to 5 yearsMotor vehicles 1 to 10 years
The leasehold land transferred related to a hotel property, The Excelsior, owned by Mandarin Oriental in Hong Kong, which was closed during 2019 for redevelopment into a commercial property. Prior to the change of use, the leasehold land was revalued by an independent valuer, Jones Lang LaSalle, resulting in a surplus of US$2,943 million, which was recognised in the asset revaluation reserves through other comprehensive income. The revalued carrying amount of US$3,125 million was transferred to investment properties (refer note 13).

Jardine Matheson Annual Report 2019
57Notes to the Financial Statements
12 Right-of-use Assets (continued)
Leaseholdland Properties
Plant &machinery
Motorvehicles Other Total
US$m US$m US$m US$m US$m US$m
2018Cost– change in accounting policies
(refer note 1) 1,702 5,980 31 66 33 7,812Amortisation/depreciation and
impairment– change in accounting policies
(refer note 1) (288) (1,907) (10) (26) (18) (2,249)Net book value at 1st January 1,414 4,073 21 40 15 5,563Exchange differences (51) (62) (2) (2) – (117)New subsidiaries – 12 – – – 12Additions 41 478 39 32 10 600Disposals (3) (103) – – – (106)Revaluation surplus before transfer
to investment properties 2 – – – – 2Transfer from investment properties 32 – – – – 32Modifications to lease terms – 684 – – – 684Amortisation/depreciation charge (43) (1,026) (17) (30) (10) (1,126)Impairment charge (6) (87) – – – (93)
Net book value at 31st December 1,386 3,969 41 40 15 5,451
Cost 1,702 6,902 68 96 43 8,811Amortisation/depreciation and
impairment (316) (2,933) (27) (56) (28) (3,360)
1,386 3,969 41 40 15 5,451
At 31st December 2019, the carrying amount of leasehold land pledged as security for borrowings amounted to US$126 million (2018: US$126 million) (refer note 29). None of the other right-of-use assets have been pledged at 31st December 2019 and 2018.

Jardine Matheson Annual Report 2019
58 Notes to the Financial Statements
13 Investment Properties
Completed commercial
properties
Under development
commercial properties
Completed residential properties Total
US$m US$m US$m US$m
2019At 1st January 33,970 50 733 34,753Exchange differences 212 26 5 243Additions 141 31 3 175Transfer (to)/from right-of-use assets (84) 3,125 – 3,041Transfer to tangible assets (3) – – (3)Change in fair value (842) (66) 76 (832)
At 31st December 33,394 3,166 817 37,377
Freehold properties 175Leasehold properties 37,202
37,377
2018At 1st January 32,432 408 698 33,538Exchange differences (130) (18) (1) (149)Additions 118 21 1 140Transfer 332 (332) – –Transfer to right-of-use assets – (32) – (32)Transfer from tangible assets – 5 – 5Change in fair value 1,218 (2) 35 1,251
At 31st December 33,970 50 733 34,753
Freehold properties 168Leasehold properties 34,585
34,753
The Group measures its investment properties at fair value. The fair values of the Group’s investment properties at 31st December 2019 and 2018 have been determined on the basis of valuations carried out by independent valuers who hold a recognised relevant professional qualification and have recent experience in the locations and segments of the investment properties valued. The completed commercial properties were principally held by Hongkong Land. During 2019, the revalued carrying amount of leasehold land site owned by Mandarin Oriental of US$3,125 million was transferred from right-of-use assets upon change of use (refer note 12).
Hongkong Land and Mandarin Oriental employed Jones Lang LaSalle to value their commercial investment properties in Hong Kong, the Chinese mainland, Singapore, Vietnam and Cambodia which are either freehold or held under leases with unexpired lease terms of more than 20 years. The valuations, which conform to the International Valuation Standards issued by the International Valuation Standards Council and the HKIS Valuation Standards issued by the Hong Kong Institute of Surveyors, were arrived at by reference to the net income, allowing for reversionary potential, of each property. The valuations are comprehensively reviewed by Hongkong Land and Mandarin Oriental.
Fair value measurements of residential properties using no significant unobservable inputsFair values of completed residential properties are generally derived using the direct comparison method. This valuation method is based on comparing the property to be valued directly with other comparable properties, which have recently transacted. However, given the heterogeneous nature of real estate properties, appropriate adjustments are usually required to allow for any qualitative differences that may affect the price likely to be achieved by the property under consideration.

Jardine Matheson Annual Report 2019
59Notes to the Financial Statements
13 Investment Properties (continued)
Fair value measurements of commercial properties using significant unobservable inputsFair values of completed commercial properties in Hong Kong, the Chinese mainland and Singapore are generally derived using the income capitalisation method. This valuation method is based on the capitalisation of the net income and reversionary income potential by adopting appropriate capitalisation rates, which are derived from analysis of sale transactions and valuers’ interpretation of prevailing investor requirements or expectations. The prevailing market rents adopted in the valuation have reference to valuers’ views of recent lettings, within the subject properties and other comparable properties.
Fair values of completed commercial properties in Vietnam and Cambodia are generally derived using the discounted cash flow method. The net present value of the income stream is estimated by applying an appropriate discount rate which reflects the risk profile.
Fair values of under development commercial properties in Hongkong Land are generally derived using the residual method. This valuation is essentially a means of valuing the land by reference to its development potential by deducting development costs together with developer’s profit and risk from the estimated capital value of the proposed development assuming completion as at the date of valuation.
Fair value of Mandarin Oriental’s investment property under development is derived using the direct comparison method. This valuation is based on comparing the property to be valued directly with other comparable properties, which have recently transacted. However, given the heterogeneous nature of real estate properties, appropriate adjustments are usually required to allow for any qualitative differences that may affect the price likely to be achieved by the property under consideration. The Group’s policy is to recognise transfers between fair value measurements as of the date of the event or change in circumstances that caused the transfer.
Information about fair value measurements of Hongkong Land’s commercial investment properties using significant unobservable inputs at 31st December 2019:
Range of significant unobservable inputs
Fair value Valuation methodPrevailing market
rent per monthCapitalisation/discount rates
Completed properties US$m US$ %
Hong Kong 31,215 Income capitalisation 5.7 to 36.0 per square foot
2.75 to 5.00
Chinese mainland 918 Income capitalisation 98.2 per square metre
3.75
Singapore 594 Income capitalisation 7.6 to 8.8 per square foot
3.50 to 4.80
Vietnam and Cambodia 140 Discounted cash flow 21.5 to 44.5 per square metre
12.50 to 15.00
Total 32,867
Prevailing market rents are estimated based on independent valuers’ view of recent lettings, within the subject properties and other comparable properties. The higher the rents, the higher the fair value.
Capitalisation and discount rates are estimated by independent valuers based on the risk profile of the properties being valued. The lower the rates, the higher the fair value.

Jardine Matheson Annual Report 2019
60 Notes to the Financial Statements
13 Investment Properties (continued)
Information about fair value measurement of Mandarin Oriental’s investment property under development using significant unobservable inputs at 31st December 2019:
Under development property Fair value
US$m Valuation method Unobservable inputs
Relationship of unobservable inputs
of fair value
Hong Kong 2,968 Direct comparison Average unit price: US$4,338.7 per
square foot
The higher the unit price, the higher
the fair value
The maturity analysis of lease payments, showing the undiscounted lease payments to be received after the balance sheet date are as follows:
2019 2018US$m US$m
Within one year 886 894Between one and two years 660 652Between two and five years 979 831Beyond five years 364 316
2,889 2,693
Generally the Group’s operating leases in respect of investment properties are for terms of three or more years.
At 31st December 2019, the carrying amount of investment properties pledged as security for borrowings amounted to US$917 million (2018: US$881 million) (refer note 29).
14 Bearer Plants2019 2018US$m US$m
Cost 644 648Depreciation (157) (150)Net book value at 1st January 487 498Exchange differences 20 (32)Additions 46 48Disposals (15) (2)Depreciation charge (27) (25)Impairment charge (8) –
Net book value at 31st December 503 487
Immature bearer plants 113 95Mature bearer plants 390 392
503 487
Cost 687 644Accumulated depreciation (184) (157)
503 487
The Group’s bearer plants are primarily for the production of palm oil.
At 31st December 2019 and 2018, the Group’s bearer plants had not been pledged as security for borrowings.

Jardine Matheson Annual Report 2019
61Notes to the Financial Statements
15 Associates and Joint Ventures
2019 2018US$m US$m
AssociatesListed associates– Yonghui 631 633– Zhongsheng 556 472– Siam City Cement 350 332– Robinsons Retail 297 214– Greatview 110 112– Jardine Lloyd Thompson – 274– other 145 121
2,089 2,158Unlisted associates 1,562 1,595Share of attributable net assets 3,651 3,753Goodwill on acquisition 1,451 1,550
5,102 5,303Amounts due from associates 257 140
5,359 5,443Joint venturesListed joint ventures– Permata Bank 723 640– PT Tunas Ridean 131 112
854 752Unlisted joint ventures 6,785 6,289Share of attributable net assets 7,639 7,041Goodwill on acquisition 63 55
7,702 7,096Amounts due from joint ventures 2,579 2,033
10,281 9,129
15,640 14,572
Amounts due from associates are interest free, unsecured and have no fixed terms of repayment.
Amounts due from joint ventures bear interest at fixed rates ranging from approximately 0% to 8% per annum and are repayable within one to six years.

Jardine Matheson Annual Report 2019
62 Notes to the Financial Statements
15 Associates and Joint Ventures (continued)
Associates Joint ventures2019 2018 2019 2018US$m US$m US$m US$m
Movements of associates and joint ventures during the year:At 1st January– as previously reported 5,477 5,002 9,134 8,066– change in accounting policies (refer note 1) (34) (17) (5) (4) – as restated 5,443 4,985 9,129 8,062Share of results after tax and non-controlling interests 482 540 748 871Share of other comprehensive income/(expense) after
tax and non-controlling interests 100 (212) 177 (331)Dividends received (236) (396) (897) (546)Acquisitions, increases in attributable interests
and advances 606 702 1,804 1,810Disposal of Jardine Lloyd Thompson (refer note 9) (543) – – –Other disposals, decreases in attributable interests and
repayment of advances (137) (203) (1,036) (737)Employee share options schemes – 27 – –Reclassification (356) – 356 –
At 31st December 5,359 5,443 10,281 9,129
Fair value of listed associates and joint ventures 5,436 6,665 1,304 751
Acquisition of associates in 2018 included Dairy Farm’s acquisition of a 20% interest in Robinsons Retail. In November 2018, Dairy Farm completed the exchange of its 100% interest in a Philippine subsidiary, which operates supermarkets and hypermarkets, for a consideration of US$336 million in the form of a 12.15% interest in the enlarged share capital of Robinsons Retail under a partnership arrangement. This, together with further shares acquired from the existing controlling shareholders and in the market totalling US$220 million, gave Dairy Farm a total shareholding of 20% in Robinsons Retail. Goodwill amounting to US$346 million was recognised for the Group’s investment in Robinsons Retail at the date of acquisition. A gain on disposal of the Philippine subsidiary attributable to the Group of US$111 million was recognised and credited to the profit and loss in 2018.
(a) Investment in associatesThe material associates of the Group are listed below. These associates have share capital consisting solely of ordinary shares, which are held directly by the Group.
Nature of investments in material associates in 2019 and 2018:
Name of entity Nature of business
Country of incorporation/principal place of business/place of listing
% of ownership interest
2019 2018
Maxim’s Caterers Limited (‘Maxim’s’)
Restaurants Hong Kong/Hong Kong Unlisted
50 50
Yonghui Superstores Co., Limited (‘Yonghui’)
Grocery retail China/ Chinese mainland/Shanghai
20 20
Siam City Cement Public Company Limited (‘Siam City Cement’)
Cement manufacturing Thailand/Thailand/Thailand/
26 26
PT Astra Daihatsu Motor Automotive Indonesia/Indonesia/Unlisted
32 32

Jardine Matheson Annual Report 2019
63Notes to the Financial Statements
15 Associates and Joint Ventures (continued)
Summarised financial information for material associatesSummarised balance sheets at 31st December (unless otherwise indicated):
Maxim’s Yonghui†Siam City
Cement
PT AstraDaihatsu
Motor TotalUS$m US$m US$m US$m US$m
2019Non-current assets 2,848 7,075 2,423 432 12,778Current assetsCash and cash equivalents 236 870 162 507 1,775Other current assets 235 2,555 355 543 3,688Total current assets 471 3,425 517 1,050 5,463Non-current liabilitiesFinancial liabilities* (799) (3,754) (785) – (5,338)Other non-current liabilities* (253) (49) (224) (59) (585)Total non-current liabilities (1,052) (3,803) (1,009) (59) (5,923)Current liabilitiesFinancial liabilities* (1,023) (1,082) (209) – (2,314)Other current liabilities* (169) (2,495) (307) (561) (3,532)Total current liabilities (1,192) (3,577) (516) (561) (5,846)Non-controlling interests (141) (30) (43) – (214)
Net assets 934 3,090 1,372 862 6,258
2018Non-current assets 1,935 6,857 2,313 455 11,560Current assetsCash and cash equivalents 269 836 81 481 1,667Other current assets 210 2,426 338 439 3,413Total current assets 479 3,262 419 920 5,080Non-current liabilitiesFinancial liabilities* (740) (4,067) (810) – (5,617)Other non-current liabilities* (52) (27) (157) (49) (285)Total non-current liabilities (792) (4,094) (967) (49) (5,902)Current liabilitiesFinancial liabilities* (601) (592) (141) – (1,334)Other current liabilities* (144) (2,252) (277) (576) (3,249)Total current liabilities (745) (2,844) (418) (576) (4,583)Non-controlling interests (15) (119) (47) – (181)
Net assets 862 3,062 1,300 750 5,974
* Financial liabilities exclude trade and other payables and provisions, which are presented under other current and non-current liabilities.
† Based on the unaudited summarised balance sheets at 30th September 2019 and 2018.

Jardine Matheson Annual Report 2019
64 Notes to the Financial Statements
15 Associates and Joint Ventures (continued)
Summarised statements of comprehensive income for the year ended 31st December (unless otherwise indicated):
Maxim’s Yonghui†Siam City
Cement
PT AstraDaihatsu
Motor TotalUS$m US$m US$m US$m US$m
2019Revenue 2,701 11,823 1,522 4,494 20,540Depreciation and amortisation (431) (388) (112) (102) (1,033)Interest income 3 6 2 29 40Interest expense (40) (223) (46) (1) (310)
Profit from underlying business performance 209 111 133 297 750Tax (38) (28) (25) (74) (165)Profit after tax from underlying business
performance 171 83 108 223 585Profit after tax from non-trading items – 56 – – 56Profit after tax 171 139 108 223 641Other comprehensive expense – – (8) (3) (11)
Total comprehensive income 171 139 100 220 630
Dividends received from associates 54 31 20 45 150
2018Revenue 2,586 8,052 1,370 4,334 16,342Depreciation and amortisation (378) (378) (101) (116) (973)Interest income 3 8 1 29 41Interest expense (30) (135) (43) – (208)
Profit from underlying business performance 261 43 120 450 874Tax (49) (21) (19) (112) (201)Profit after tax from underlying business
performance 212 22 101 338 673Profit after tax from non-trading items – 10 – – 10Profit after tax 212 32 101 338 683Other comprehensive income/(expense) (6) – – 2 (4)
Total comprehensive income 206 32 101 340 679
Dividends received from associates 51 43 19 140 253
† Based on the unaudited summarised statements of comprehensive income for the 12 months ended 30th September 2019 and nine months ended 30th September 2018.
The information contained in the summarised balance sheets and statements of comprehensive income reflect the amounts presented in the financial statements of the associates adjusted for differences in accounting policies between the Group and the associates, and fair value of the associates at the time of acquisition. 2018 information was restated, where appropriate, for changes in accounting policies upon adoption of IFRS 16 ‘Leases’.

Jardine Matheson Annual Report 2019
65Notes to the Financial Statements
15 Associates and Joint Ventures (continued)
Reconciliation of the summarised financial informationReconciliation of the summarised financial information presented to the carrying amount of the Group’s interests in its material associates for the year ended 31st December:
Maxim’s YonghuiSiam City
Cement
PT AstraDaihatsu
Motor TotalUS$m US$m US$m US$m US$m
2019Net assets 934 3,090 1,372 862 6,258Interest in associates (%) 50 20 26 32Group’s share of net assets in associates 467 618 351 275 1,711Goodwill – 387 422 – 809Other – 13 – – 13
Carrying value 467 1,018 773 275 2,533
Fair value N/A 2,068 484 N/A 2,552
2018Net assets 862 3,062 1,300 750 5,974Interest in associates (%) 50 20 26 32Group’s share of net assets in associates 431 612 332 239 1,614Goodwill – 392 388 – 780Other – 22 – – 22
Carrying value 431 1,026 720 239 2,416
Fair value N/A 2,189 480 N/A 2,669

Jardine Matheson Annual Report 2019
66 Notes to the Financial Statements
15 Associates and Joint Ventures (continued)
The Group has interests in a number of individually immaterial associates. The following table analyses, in aggregate, the share of profit and other comprehensive expense and carrying amount of these associates.
2019 2018US$m US$m
Share of profit 270 291Share of other comprehensive income/(expense) 9 (81)
Share of total comprehensive income 279 210
Carrying amount of interests in these associates 2,826 3,027
Contingent liabilities relating to the Group’s interest in associates
2019 2018US$m US$m
Financial guarantee in respect of facilities made available to an associate 20 20
(b) Investment in joint venturesThe material joint ventures of the Group are listed below. These joint ventures have share capital consisting solely of ordinary shares, which are held directly by the Group.
Nature of investments in material joint ventures in 2019 and 2018:
Nature of businessCountry of incorporation and principal place of business
% of ownership interest2019 2018
Hongkong Land– Properties Sub F, Ltd Property investment Macau 49 49– BFC Development LLP Property investment Singapore 33 33– Central Boulevard Development Pte Ltd Property investment Singapore 33 33– One Raffles Quay Pte Ltd Property investment Singapore 33 33Astra– PT Astra Honda Motor Automotive Indonesia 50 50– PT Bank Permata Tbk
(‘Permata Bank’)Commercial and
retail bankIndonesia 45 45
At 31st December 2019, the fair value of the Group’s interest in Permata Bank, which is listed on the Indonesian Stock Exchange, was US$1,137 million (2018: US$539 million) and the carrying amount of the Group’s interest was US$758 million (2018: US$674 million).

Jardine Matheson Annual Report 2019
67Notes to the Financial Statements
15 Associates and Joint Ventures (continued)
Summarised financial information for material joint venturesSummarised balance sheets at 31st December:
Central BFC Boulevard Properties Development Development Sub F, Ltd LLP Pte Ltd
OneRaffles
QuayPte Ltd
PT AstraHondaMotor
PermataBank Total
US$m US$m US$m US$m US$m US$m US$m
2019Non-current assets 1,357 3,756 2,910 2,858 1,545 3,910 16,336Current assetsCash and cash equivalents 58 11 23 12 651 1,669 2,424Other current assets 35 1 2 5 432 5,944 6,419Total current assets 93 12 25 17 1,083 7,613 8,843Non-current liabilitiesFinancial liabilities* – (1,269) (1,207) (775) – (52) (3,303)Other non-current liabilities* (145) – (21) (210) (268) (127) (771)Total non-current liabilities (145) (1,269) (1,228) (985) (268) (179) (4,074)Current liabilitiesFinancial liabilities* – (1) (13) (5) – (453) (472)Other current liabilities* (48) (56) (36) (43) (991) (9,269) (10,443)Total current liabilities (48) (57) (49) (48) (991) (9,722) (10,915)
Net assets 1,257 2,442 1,658 1,842 1,369 1,622 10,190
2018Non-current assets 1,380 3,683 2,848 2,804 1,394 3,599 15,708Current assetsCash and cash equivalents 65 14 19 7 535 1,685 2,325Other current assets 35 1 1 3 415 5,174 5,629Total current assets 100 15 20 10 950 6,859 7,954Non-current liabilitiesFinancial liabilities* – (1,248) (1,181) (764) – (158) (3,351)Other non-current liabilities* (153) – (20) (205) (235) (115) (728)Total non-current liabilities (153) (1,248) (1,201) (969) (235) (273) (4,079)Current liabilitiesFinancial liabilities* – – (4) (1) – (173) (178)Other current liabilities* (47) (61) (35) (41) (790) (8,575) (9,549)Total current liabilities (47) (61) (39) (42) (790) (8,748) (9,727)
Net assets 1,280 2,389 1,628 1,803 1,319 1,437 9,856
* Financial liabilities exclude trade and other payables and provisions, which are presented under other current and non-current liabilities.

Jardine Matheson Annual Report 2019
68 Notes to the Financial Statements
15 Associates and Joint Ventures (continued)
Summarised statements of comprehensive income for the year ended 31st December:
Central BFC Boulevard Properties Development Development Sub F, Ltd LLP Pte Ltd
OneRaffles
QuayPte Ltd
PT AstraHondaMotor
PermataBank Total
US$m US$m US$m US$m US$m US$m US$m
2019Revenue 86 161 121 111 5,716 975 7,170Depreciation and
amortisation (9) – – – (122) (28) (159)Interest income – – – – 41 – 41Interest expense – (51) (34) (25) – – (110)
Profit from underlying business performance 40 75 58 58 647 158 1,036
Tax (5) (12) (10) (10) (158) (40) (235)Profit after tax from
underlying business performance 35 63 48 48 489 118 801
Profit/(loss) after tax from non-trading items (24) 21 22 12 – – 31
Profit after tax 11 84 70 60 489 118 832Other comprehensive
income/(expense) 8 45 9 27 (12) 6 83
Total comprehensive income 19 129 79 87 477 124 915
Dividends received from joint ventures 20 25 16 16 241 – 318
2018Revenue 87 158 110 112 5,129 886 6,482Depreciation and
amortisation (8) – – – (114) (31) (153)Interest income – – – – 35 – 35Interest expense (1) (47) (32) (25) – – (105)
Profit from underlying business performance 44 72 49 61 600 54 880
Tax (5) (12) (8) (11) (150) (5) (191)Profit after tax from
underlying business performance 39 60 41 50 450 49 689
Profit after tax from non-trading items 13 132 110 85 – – 340
Profit after tax 52 192 151 135 450 49 1,029Other comprehensive
income/(expense) (2) (36) (26) (34) 1 (5) (102)
Total comprehensive income 50 156 125 101 451 44 927
Dividends received from joint ventures 18 24 14 17 223 – 296
The information contained in the summarised balance sheets and statements of comprehensive income reflect the amounts presented in the financial statements of the joint ventures adjusted for differences in accounting policies between the Group and the joint ventures, and fair value of the joint ventures at the time of acquisition. 2018 information was restated, where appropriate, for changes in accounting policies upon adoption of IFRS 16 ‘Leases’.

Jardine Matheson Annual Report 2019
69Notes to the Financial Statements
15 Associates and Joint Ventures (continued)
Reconciliation of the summarised financial informationReconciliation of the summarised financial information presented to the carrying amount of the Group’s interests in its material joint ventures for the year ended 31st December:
Central BFC Boulevard Properties Development Development Sub F, Ltd LLP Pte Ltd
OneRaffles
QuayPte Ltd
PT AstraHondaMotor
Permata Bank Total
US$m US$m US$m US$m US$m US$m US$m
2019Net assets 1,257 2,442 1,658 1,842 1,369 1,622 10,190Interest in joint ventures (%) 49 33 33 33 50 45Group’s share of net assets
in joint ventures 616 814 553 614 685 723 4,005Goodwill – – – – – 35 35Amount due from joint
ventures – 423 – 36 – – 459
Carrying value 616 1,237 553 650 685 758 4,499
2018Net assets 1,280 3,637 1,628 1,803 1,319 1,437 11,104Shareholders’ loans – – – 104 – – 104Adjusted net assets 1,280 3,637 1,628 1,907 1,319 1,437 11,208Interest in joint ventures (%) 49 33 33 33 50 45Group’s share of net assets
in joint ventures 627 796 543 601 660 640 3,867Goodwill – – – – – 34 34Amounts due from joint
ventures 3 416 – 35 – – 454
Carrying value 630 1,212 543 636 660 674 4,355
The Group has interests in a number of individually immaterial joint ventures. The following table analyses, in aggregate, the share of profit and other comprehensive income and carrying amount of these joint ventures.
2019 2018US$m US$m
Share of profit 376 441Share of other comprehensive expense (2) (102)
Share of total comprehensive income 374 339
Carrying amount of interests in these joint ventures 5,782 4,774
Commitments and contingent liabilities in respect of joint venturesThe Group has the following commitments relating to its joint ventures as at 31st December:
2019 2018US$m US$m
Commitment to provide funding if called 1,054 1,359
There were no contingent liabilities relating to the Group’s interest in the joint ventures at 31st December 2019 and 2018.
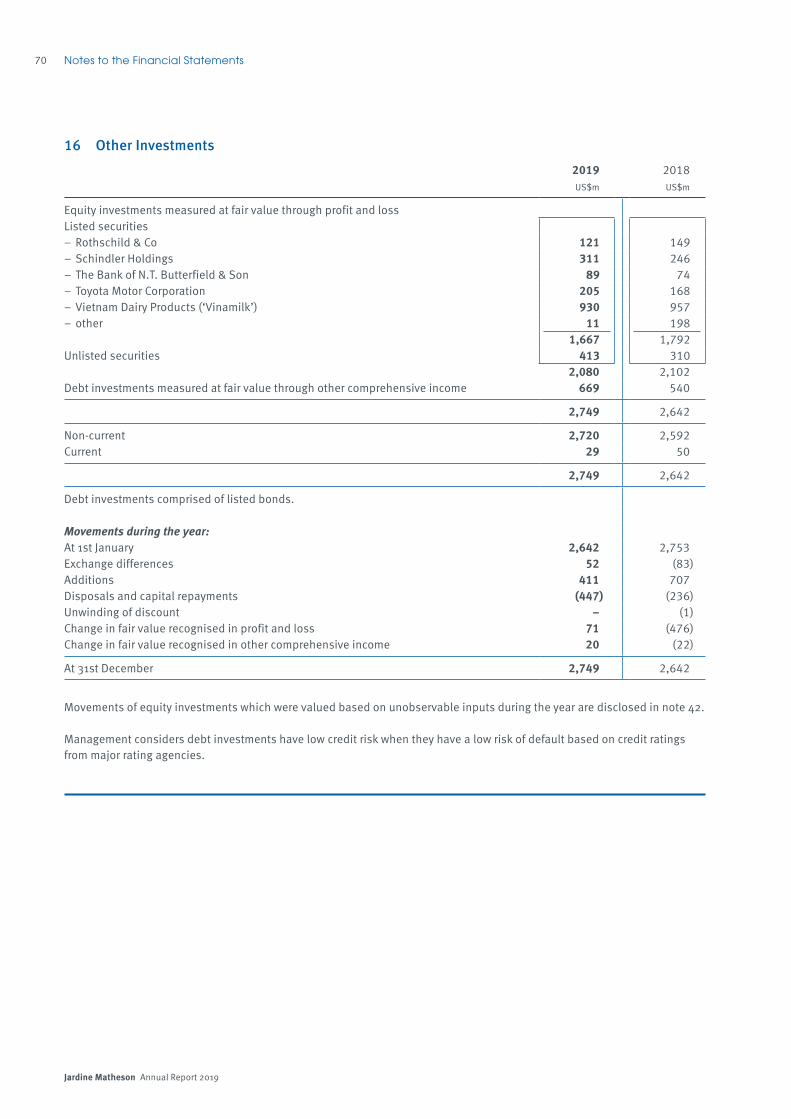
Jardine Matheson Annual Report 2019
70 Notes to the Financial Statements
16 Other Investments
2019 2018US$m US$m
Equity investments measured at fair value through profit and lossListed securities– Rothschild & Co 121 149– Schindler Holdings 311 246– The Bank of N.T. Butterfield & Son 89 74– Toyota Motor Corporation 205 168– Vietnam Dairy Products (‘Vinamilk’) 930 957– other 11 198
1,667 1,792Unlisted securities 413 310
2,080 2,102Debt investments measured at fair value through other comprehensive income 669 540
2,749 2,642
Non-current 2,720 2,592Current 29 50
2,749 2,642
Debt investments comprised of listed bonds.
Movements during the year:At 1st January 2,642 2,753Exchange differences 52 (83)Additions 411 707Disposals and capital repayments (447) (236)Unwinding of discount – (1)Change in fair value recognised in profit and loss 71 (476)Change in fair value recognised in other comprehensive income 20 (22)
At 31st December 2,749 2,642
Movements of equity investments which were valued based on unobservable inputs during the year are disclosed in note 42.
Management considers debt investments have low credit risk when they have a low risk of default based on credit ratings from major rating agencies.
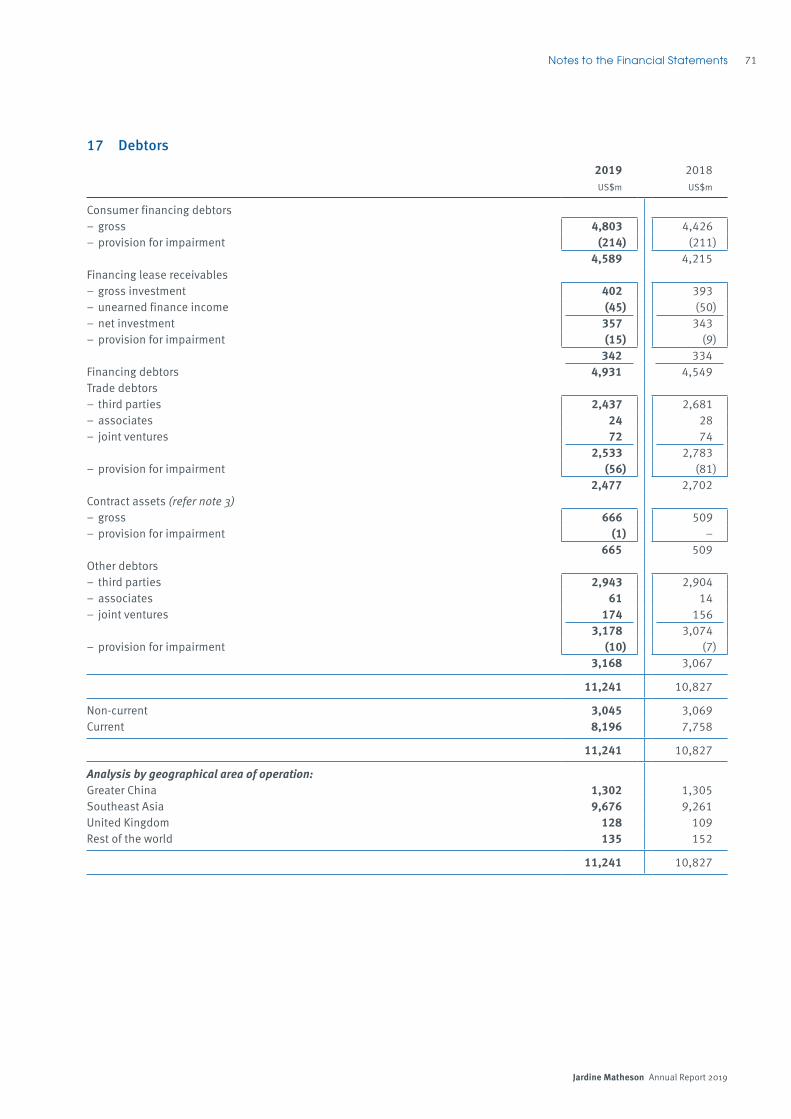
Jardine Matheson Annual Report 2019
71Notes to the Financial Statements
17 Debtors
2019 2018US$m US$m
Consumer financing debtors– gross 4,803 4,426– provision for impairment (214) (211)
4,589 4,215Financing lease receivables– gross investment 402 393– unearned finance income (45) (50)– net investment 357 343– provision for impairment (15) (9)
342 334Financing debtors 4,931 4,549Trade debtors– third parties 2,437 2,681– associates 24 28– joint ventures 72 74
2,533 2,783– provision for impairment (56) (81)
2,477 2,702Contract assets (refer note 3)– gross 666 509– provision for impairment (1) –
665 509Other debtors– third parties 2,943 2,904– associates 61 14– joint ventures 174 156
3,178 3,074– provision for impairment (10) (7)
3,168 3,067
11,241 10,827
Non-current 3,045 3,069Current 8,196 7,758
11,241 10,827
Analysis by geographical area of operation:Greater China 1,302 1,305Southeast Asia 9,676 9,261United Kingdom 128 109Rest of the world 135 152
11,241 10,827

Jardine Matheson Annual Report 2019
72 Notes to the Financial Statements
17 Debtors (continued)
2019 2018US$m US$m
Fair value:Consumer financing debtors 4,680 4,286Financing lease receivables 347 337Financing debtors 5,027 4,623Trade debtors 2,477 2,702Contract assets 665 509Other debtors* 997 1,042
9,166 8,876
* Excluding prepayments, rental and other deposits, and other non-financial debtors.
The fair values of financing debtors is determined based on a discounted cash flow method using unobservable inputs, which are mainly rates of 10% to 36% per annum (2018: 9% to 35% per annum). The higher the rates, the lower the fair value.
The fair values of trade debtors and other debtors, other than short-term debtors, is estimated using the expected future receipts discounted at market rates ranging from 5% to 14% (2018: 5% to 14%) per annum. The fair value of short-term debtors approximates their carrying amounts. Derivative financial instruments are stated at fair value.
Financing debtorsFinancing debtors comprise consumer financing debtors and financing lease receivables. They relate primarily to Astra’s motor vehicle and motorcycle financing.
Financing debtors are due within five years (2018: five years) from the balance sheet date and the interest rates range from 10% to 36% per annum (2018: 9% to 35% per annum).
An analysis of financing lease receivables is set out below:
2019 2018US$m US$m
Lease receivables 402 393Guaranteed residual value 166 203Security deposits (166) (203)Gross investment 402 393Unearned lease income (45) (50)
Net investment 357 343

Jardine Matheson Annual Report 2019
73Notes to the Financial Statements
17 Debtors (continued)
The maturity analyses of financing lease receivables at 31st December are as follows:
2019 2018Gross
investmentNet
investmentGross
investmentNet
investmentUS$m US$m US$m US$m
Within one year 232 201 221 188Between one and two years 123 113 123 110Between two and five years 47 43 49 45
402 357 393 343
Impairment of financing debtorsBefore accepting any new customer, the Group assesses the potential customer’s credit quality and sets credit limits by customer using internal scoring systems. These limits and scoring are reviewed periodically. The Group obtains collateral in the form of motor vehicles and motorcycles from consumer financing debtors.
The loan period ranges from 6 to 60 months for motor vehicles and motorcycles. Significant financial difficulties of the debtor, probability that the debtor will enter bankruptcy or financial reorganisation and default or delinquency in payment are factors in determining the credit risk of financing debtors. To measure the expected credit losses, the financing debtors have been grouped based on shared credit risk characteristics and the days past due. The calculation reflects the probability weighted outcome, the time value of money and reasonable and supportable information that is available at the reporting date about past events, current conditions and forecasts of future economic conditions. Changes in certain macroeconomic information, such as GDP and inflation rate, are relevant for determining expected credit loss rates. Financing debtors are performing when timely repayments are being made. Financing debtors are underperforming and subject to a significant increase in credit risk when motor vehicles and motorcycle financing debtors are overdue for 30 days. Lifetime expected credit losses are provided at this stage. Financing debtors are non-performing if they are overdue for 90 days. Financing debtors are written off when they are overdue for 150 days and there is no reasonable expectation of recovery. In case of default, the Group facilitates the customer to sell the collateral vehicles under fiduciary arrangements for the purpose of recovering the outstanding receivables.

Jardine Matheson Annual Report 2019
74 Notes to the Financial Statements
17 Debtors (continued)
The Group provides for credit losses against the financing debtors as follows:
2019 2018
Expectedcredit
loss rate
Estimated gross
carrying amount at
default
Expectedcredit
loss rate
Estimated gross
carrying amount at
default% US$m % US$m
Performing 0.79 – 6.38 3,849 0.03 – 9.24 3,743Underperforming 0.71 – 10.67 1,252 0.40 – 6.86 951Non-performing 17.21 – 100.00 59 0.58 – 100.00 75
5,160 4,769
Movements in the provisions for impairment are as follows:
2019 2018US$m US$m
At 1st January (220) (211)Exchange differences (12) 14Allowance made during the year (103) (147)Write off/utilisation 106 124
At 31st December (229) (220)
The allowance for impairment of financing debtors are further analysed as follows:
2019 2018US$m US$m
Performing (110) (114)Underperforming (76) (47)Non-performing (43) (59)
(229) (220)
At 31st December 2019 and 2018, there were no financing debtors that are written off but still subject to enforcement activities.

Jardine Matheson Annual Report 2019
75Notes to the Financial Statements
17 Debtors (continued)
Trade and other debtorsThe average credit period on sale of goods and services varies among Group businesses and is generally not more than 60 days.
Other debtors are further analysed as follows:
2019 2018US$m US$m
Derivative financial instruments (refer note 34) 49 189Restricted bank balances and deposits 112 157Loans to employees 38 35Other amounts due from associates 61 14Other amounts due from joint ventures 174 156Repossessed collateral of finance companies 19 16Other receivables 554 483Financial assets 1,007 1,050Cost to fulfil contracts (refer note 3) 387 285Costs to obtain contracts (refer note 3) 14 7Prepayments 1,186 1,122Reinsurers’ share of estimated losses on insurance contracts 94 77Rental and other deposits 237 255Other 243 271
3,168 3,067
Impairment of trade debtors and contract assetsBefore accepting any new customer, the individual Group business assesses the potential customer’s credit quality and sets credit limits by customer using internal credit scoring systems. These limits and scoring are reviewed periodically.
Significant financial difficulties of the debtor, probability that the debtor will enter bankruptcy or financial reorganisation and default or delinquency in payment are considered indicators that the debtor is impaired and an allowance for impairment is made based on the estimated irrecoverable amount determined by reference to past default experience.
The Group applied the simplified approach to measure expected credit loss, that is a lifetime expected loss allowance for trade debtors and contract assets. To measure the expected credit losses, trade receivables and contract assets have been grouped based on shared credit risk characteristics and the days past due. Changes in certain macroeconomic information, such as GDP and inflation rate, are relevant for determining expected credit loss rates. The contract assets relate to unbilled work in progress and have substantially the same risk characteristics as the trade debtors for the same types of contracts. The Group has therefore concluded that the expected loss rates for trade debtors are a reasonable approximation of the loss rates for the contract assets.
The expected loss rates are based on the historical payment profiles of sales and the corresponding historical credit losses. The historical loss rates are adjusted to reflect current and forward-looking information on macroeconomic factors and industry trends affecting the ability of the customers to settle the receivables.

Jardine Matheson Annual Report 2019
76 Notes to the Financial Statements
17 Debtors (continued)
The loss allowance for both trade debtors and contract assets at 31st December 2019 and 2018 were determined as follows:
Below30 days
Between31 and 60 days
Between61 and 120 days
More than120 days Total
2019Expected loss rate 0.3% 0.3% 1.4% 20.4%Gross carrying amount –
trade debtors (US$m) 1,962 192 150 229 2,533Gross carrying amount –
contract assets (US$m) 666 – – – 666Loss allowance (US$m) (8) – (2) (47) (57)
2018Expected loss rate 0.4% 1.2% 4.3% 23.3%Gross carrying amount –
trade debtors (US$m) 2,076 268 186 253 2,783Gross carrying amount –
contract assets (US$m) 509 – – – 509Loss allowance (US$m) (11) (3) (8) (59) (81)
Movements in the provisions for impairment are as follows:
Trade debtors Contract assets Other debtors2019 2018 2019 2018 2019 2018US$m US$m US$m US$m US$m US$m
At 1st January (81) (84) – – (7) (7)Exchange differences (2) 4 – – – –Disposals 3 – – – – 1Additional provisions (28) (74) (1) – (4) (3)Unused amounts
reversed 12 8 – – – 1Amounts written off 40 65 – – 1 1
At 31st December (56) (81) (1) – (10) (7)
Trade debtors, contract assets and other debtors are written off when there is no reasonable expectation of recovery. Indicators that there is no reasonable expectation of recovery include, amongst others, the failure of a debtor to engage in a repayment plan with the Group.
At 31st December 2019, the carrying amount of consumer financing debtors, financing lease receivables and other debtors pledged as security for borrowings amounted to US$829 million, US$32 million and US$13 million (2018: US$1,303 million, US$22 million and US$12 million), respectively (refer note 29). Trade debtors and contract assets had not been pledged as security for borrowings at 31st December 2019 and 2018.

Jardine Matheson Annual Report 2019
77Notes to the Financial Statements
18 Deferred Tax Assets/(Liabilities)
Acceleratedtax
depreciation
Fair valuegains/losses Losses
Employeebenefits
Provisionsand other
temporarydifferences Total
US$m US$m US$m US$m US$m US$m
2019At 1st January– as previously reported (108) (450) 32 103 12 (411)– change in accounting policies
(refer note 1) 30 – – – 7 37– as restated (78) (450) 32 103 19 (374)Exchange differences 2 (4) – 4 5 7New subsidiaries – – – – (6) (6)Disposals 1 – (4) 1 – (2)Credited/(charged) to profit and loss (49) 6 2 9 59 27Credited to other comprehensive
income – 29 – 2 – 31Other – – – – (15) (15)
At 31st December (124) (419) 30 119 62 (332)
Deferred tax assets 158 (40) 29 104 206 457Deferred tax liabilities (282) (379) 1 15 (144) (789)
(124) (419) 30 119 62 (332)
2018At 1st January– as previously reported (88) (264) 33 96 77 (146)– change in accounting policies
(refer note 1) 25 – – – 8 33– as restated (63) (264) 33 96 85 (113)Exchange differences (7) 8 (1) (6) (6) (12)New subsidiaries – (170) – 1 (39) (208)Disposals – – – (1) (1) (2)Credited/(charged) to profit and loss (8) (11) – 10 (21) (30)Credited/(charged) to other
comprehensive income – (13) – 3 – (10)Other – – – – 1 1
At 31st December (78) (450) 32 103 19 (374)
Deferred tax assets 155 (51) 32 89 165 390Deferred tax liabilities (233) (399) – 14 (146) (764)
(78) (450) 32 103 19 (374)
Deferred tax balances predominantly comprise non-current items. Deferred tax assets and liabilities are netted when the taxes relate to the same taxation authority and where offsetting is allowed.
Deferred tax assets of US$221 million (2018: US$190 million) arising from unused tax losses of US$942 million (2018: US$816 million) have not been recognised in the financial statements. Included in the unused tax losses, US$312 million have no expiry date and the balance will expire at various dates up to and including 2037.
Deferred tax liabilities of US$587 million (2018: US$551 million) arising on temporary differences associated with investments in subsidiaries of US$5,875 million (2018: US$5,476 million) have not been recognised as there is no current intention of remitting the retained earnings of these subsidiaries to the holding companies in the foreseeable future.

Jardine Matheson Annual Report 2019
78 Notes to the Financial Statements
19 Pension PlansThe Group operates defined benefit pension plans in the main territories in which it operates, with the major plans in Hong Kong and the United Kingdom. Most of the pension plans are final salary defined benefits, calculated based on members’ length of service and their salaries in the final years leading up to retirement. In Hong Kong, the pension benefits are usually paid in one lump sum. With the exception of certain plans in Hong Kong, all the defined benefit plans are closed to new members. In addition, although all plans are impacted by the discount rate, liabilities in Hong Kong are driven by salary growth, whilst the United Kingdom plans are driven by inflationary rates and life expectancy.
The Group’s defined benefit plans are either funded or unfunded, with the assets of the funded plans held independently of the Group’s assets in separate trustee administered funds. Plan assets held in trusts are governed by local regulations and practices in each country. Responsibility for governance of the plans, including investment decisions and contribution schedules, lies jointly with the company and the boards of trustees. The Group’s major plans are valued by independent actuaries annually using the projected unit credit method.
The amounts recognised in the consolidated balance sheet are as follows:
2019 2018US$m US$m
Fair value of plan assets 912 867Present value of funded obligations (1,034) (1,013)
(122) (146)Present value of unfunded obligations (337) (261)
Net pension liabilities (459) (407)
Analysis of net pension liabilities:Pension assets 3 6Pension liabilities (462) (413)
(459) (407)

Jardine Matheson Annual Report 2019
79Notes to the Financial Statements
19 Pension Plans (continued)
The movement in the net pension liabilities is as follows:
Fair valueof planassets
Presentvalue of
obligations TotalUS$m US$m US$m
2019At 1st January 867 (1,274) (407)Current service cost _ (76) (76)Interest income/(expense) 29 (55) (26)Past services cost and losses on settlements – (12) (12)Administration expenses (3) – (3)
26 (143) (117)893 (1,417) (524)
Exchange differences 16 (30) (14)Remeasurements– return on plan assets, excluding amounts included in interest income 83 – 83– change in financial assumptions – (78) (78)– experience losses – 1 1
83 (77) 6Contributions from employers 42 – 42Contributions from plan participants 4 (4) –Benefit payments (75) 97 22Settlements (51) 59 8Plan amendment – 1 1
At 31st December 912 (1,371) (459)
2018At 1st January 991 (1,362) (371)Current service cost – (64) (64)Interest income/(expense) 28 (49) (21)Administration expenses (2) – (2)
26 (113) (87)1,017 (1,475) (458)
Exchange differences (26) 47 21New subsidiaries 1 (5) (4)Disposals – 5 5Remeasurements– return on plan assets, excluding amounts included in interest income (70) – (70)– change in financial assumptions – 61 61– experience losses – (16) (16)
(70) 45 (25)Contributions from employers 33 – 33Contributions from plan participants 4 (4) –Benefit payments (91) 109 18Settlements (1) 7 6Plan amendment – (3) (3)
At 31st December 867 (1,274) (407)

Jardine Matheson Annual Report 2019
80 Notes to the Financial Statements
19 Pension Plans (continued)
The weighted average duration of the defined benefit obligations at 31st December 2019 was 12 years (2018: 12 years).
Expected maturity analysis of undiscounted pension benefits at 31st December is as follows:
2019 2018US$m US$m
Within one year 100 101Between one and two years 99 88Between two and five years 350 345Between five and ten years 642 633Between ten and fifteen years 719 684Between fifteen and twenty years 892 829Beyond twenty years 4,036 3,780
6,838 6,460
The principal actuarial assumptions used for accounting purposes at 31st December are as follows:
Hong Kong United Kingdom Others2019 2018 2019 2018 2019 2018
% % % % % %
Discount rate 3.0 3.3 2.0 2.7 7.5 7.9Salary growth rate 4.8 4.8 – – 6.6 6.4Inflation rate N/A N/A 3.1 3.3 N/A N/A
Life expectancy for pensioners in the United Kingdom plans at the age of 65 for male and female are 22 years and 24 years (2018: 22 years and 24 years), respectively. As participants of the plans relating to Hong Kong usually take lump sum amounts upon retirement, mortality rate is not a principal assumption for these plans.
The sensitivity of the defined benefit obligations to changes in the weighted principal assumptions is:
(Increase)/decrease on defined benefit obligationsChange in
assumptionIncrease in
assumptionDecrease in assumption
% US$m US$m
Discount rate 1 143 (175)Salary growth rate 1 (108) 87Inflation rate 1 (21) 17
The above sensitivity analyses are based on a change in an assumption while holding all other assumptions constant. In practice, this is unlikely to occur, and changes in some of the assumptions may be correlated. When calculating the sensitivity of the defined benefit obligations to significant actuarial assumptions the same method (present value of the defined benefit obligations calculated with the projected unit credit method at the end of the reporting period) has been applied as when calculating the pension liability recognised within the balance sheet.
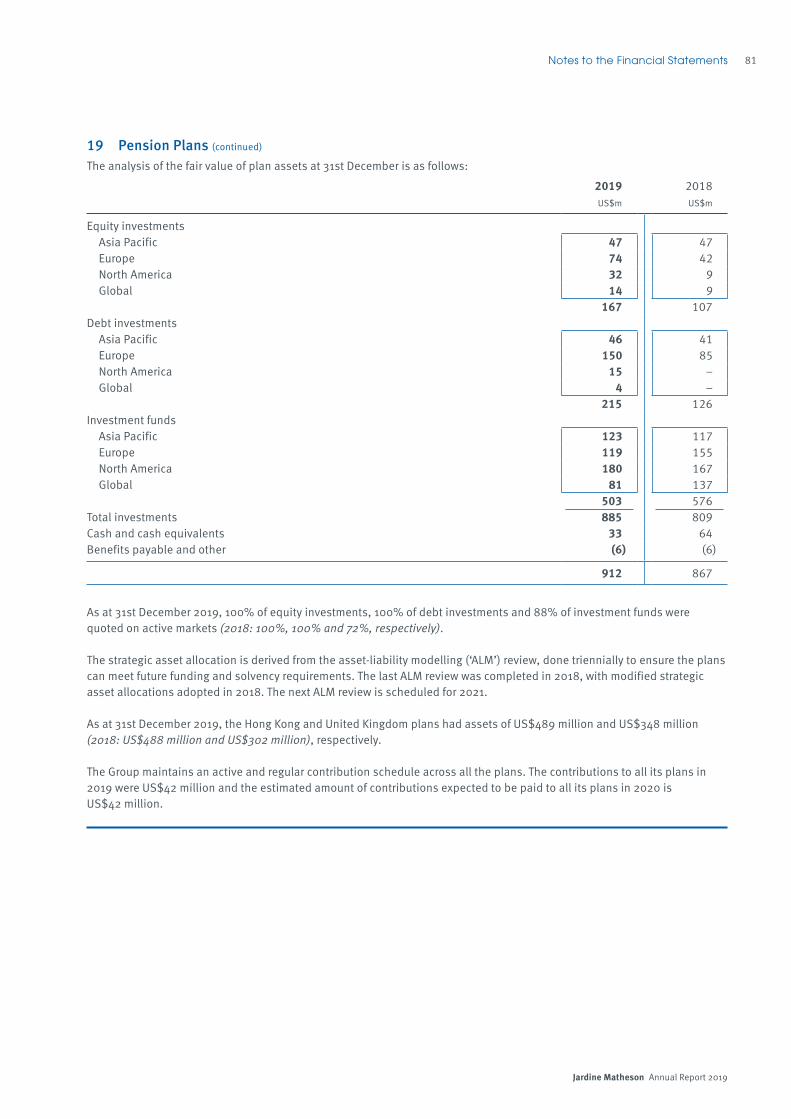
Jardine Matheson Annual Report 2019
81Notes to the Financial Statements
19 Pension Plans (continued)
The analysis of the fair value of plan assets at 31st December is as follows:
2019 2018US$m US$m
Equity investments Asia Pacific 47 47 Europe 74 42 North America 32 9 Global 14 9
167 107Debt investments Asia Pacific 46 41 Europe 150 85 North America 15 – Global 4 –
215 126Investment funds Asia Pacific 123 117 Europe 119 155 North America 180 167 Global 81 137
503 576Total investments 885 809Cash and cash equivalents 33 64Benefits payable and other (6) (6)
912 867
As at 31st December 2019, 100% of equity investments, 100% of debt investments and 88% of investment funds were quoted on active markets (2018: 100%, 100% and 72%, respectively).
The strategic asset allocation is derived from the asset-liability modelling (‘ALM’) review, done triennially to ensure the plans can meet future funding and solvency requirements. The last ALM review was completed in 2018, with modified strategic asset allocations adopted in 2018. The next ALM review is scheduled for 2021.
As at 31st December 2019, the Hong Kong and United Kingdom plans had assets of US$489 million and US$348 million (2018: US$488 million and US$302 million), respectively.
The Group maintains an active and regular contribution schedule across all the plans. The contributions to all its plans in 2019 were US$42 million and the estimated amount of contributions expected to be paid to all its plans in 2020 is US$42 million.

Jardine Matheson Annual Report 2019
82 Notes to the Financial Statements
20 Properties for Sale
2019 2018US$m US$m
Properties in the course of development 2,194 2,174Completed properties 247 165
2,441 2,339
At 31st December 2019, properties in the course of development amounting to US$1,398 million (2018: US$1,693 million) were not scheduled for completion within the next twelve months.
At 31st December 2019 and 2018, the Group’s properties for sale had not been pledged as security for borrowings.
21 Stocks and Work in Progress
2019 2018US$m US$m
Finished goods 3,456 3,393Work in progress 40 51Raw materials 101 86Spare parts 91 86Other 136 154
3,824 3,770
At 31st December 2019 and 2018, the Group’s stocks and work in progress had not been pledged as security for borrowings.

Jardine Matheson Annual Report 2019
83Notes to the Financial Statements
22 Bank Balances and Other Liquid Funds
2019 2018US$m US$m
Deposits with banks and financial institutions 5,143 3,021Bank balances 1,911 1,824Cash balances 129 143
7,183 4,988
Analysis by currency:Chinese renminbi 772 765Euro 51 44Hong Kong dollar 410 222Indonesian rupiah 1,232 1,209Japanese yen 31 25Macau patacas 34 29Malaysian ringgit 62 63New Taiwan dollar 48 75Singapore dollar 245 388United Kingdom sterling 51 41United States dollar 4,206 2,078Other 41 49
7,183 4,988
The weighted average interest rate on deposits with banks and financial institutions at 31st December 2019 was 2.6% (2018: 2.7%) per annum.
23 Share Capital
2019 2018US$m US$m
Authorised:1,000,000,000 shares of US¢25 each 250 250
Ordinary shares in millions 2019 2018
2019 2018 US$m US$m
Issued and fully paid:At 1st January 737 726 184 181Scrip issued in lieu of dividends 2 11 1 3Repurchased and cancelled (6) – (2) –
At 31st December 733 737 183 184
During the year, the Company repurchased 6 million ordinary shares from the stock market at a cost of US$328 million, which was dealt with by charging US$2 million to share capital, US$40 million to share premium and US$286 million to revenue reserves.

Jardine Matheson Annual Report 2019
84 Notes to the Financial Statements
24 Share-based Long-term Incentive PlansShare-based long-term incentive plans (‘LTIP’) have been put in place to provide incentives for selected executives. Awards take the form of share options to purchase ordinary shares in the Company with exercise prices based on the then prevailing market prices; however, share awards which will vest free of payment may also be made. Awards normally vest on or after the third anniversary of the date of grant and may be subject to the achievement of performance conditions.
The Jardine Matheson Holdings Share-based Long-term Incentive Plan (the ‘2015 LTIP’) was adopted by the Company on 5th March 2015. Since the adoption of the 2015 LTIP, awards were granted in the form of options with exercise prices based on the then prevailing market prices and no free shares were granted. In 2019, no awards were granted under the 2015 LTIP.
Prior to the adoption of the 2015 LTIP, The Jardine Matheson International Share Option Plan 2005 and The Jardine Matheson Holdings Limited Tax-Qualified Share Option Plan 2005 (formerly The Jardine Matheson Holdings Limited Approved Share Option Plan 2005) provided selected executives with options to purchase ordinary shares in the Company.
The exercise prices of the options granted in prior years were based on the average market prices for the five trading days immediately preceding the dates of grant of the options. Options normally vest in tranches over a period of three to five years, and are exercisable for up to ten years following the date of grant.
Movements during the year:
2019 2018Weighted
average exercise
price Optionsin millions
Weighted average exercise
price Optionsin millionsUS$ US$
At 1st January 57.2 2.6 55.7 2.6Granted – – 63.4 0.4Exercised 43.5 (0.2) 49.9 (0.3)Cancelled 63.0 (0.1) 63.3 (0.1)
At 31st December 57.9 2.3 57.2 2.6
The average share price during the year was US$60.7 (2018: US$63.6) per share.
Outstanding at 31st December:
Exercise price
Optionsin millions
Expiry date US$ 2019 2018
2020 32.2 – 0.12021 46.8 0.1 0.12022 51.2 0.3 0.32023 64.9 0.3 0.32024 59.6 0.1 0.12025 52.8 – 63.4 0.2 0.22026 53.9 – 56.6 0.7 0.72027 65.6 0.3 0.42028 63.4 0.3 0.4
Total outstanding 2.3 2.6
of which exercisable 1.1 1.0

Jardine Matheson Annual Report 2019
85Notes to the Financial Statements
24 Share-based Long-term Incentive Plan (continued)
The fair value of options granted in 2018, determined using the Trinomial valuation model, was US$4 million. The significant inputs into the model, based on the weighted average number of options issued, were share price of US$62.2 at the grant dates, exercise price shown above, expected volatility based on the last seven years of 20.7%, dividend yield of 2.6%, option life disclosed above, and annual risk-free interest rate of 2.7%. Options are assumed to be exercised at the end of the seventh year following the date of grant.
25 Share Premium and Capital Reserves
Share premium
Capital reserves Total
US$m US$m US$m
2019At 1st January 36 182 218Capitalisation arising on scrip issued in lieu of dividends (1) – (1)Repurchase of shares (refer note 23) (40) – (40)Employee share option schemes– exercise of share options 3 – 3– value of employee services – 4 4Transfer 2 (154) (152)
At 31st December – 32 32
2018At 1st January 32 156 188Capitalisation arising on scrip issued in lieu of dividends (3) – (3)Employee share option schemes– exercise of share options 4 – 4– value of employee services – 32 32Transfer 3 (6) (3)
At 31st December 36 182 218
Capital reserves represent the value of employee services under the Group’s employee share option schemes. At 31st December 2019, US$27 million (2018: US$26 million) related to the Company’s Senior Executive Share Incentive Schemes. The transfer of capital reserves in 2019 primarily related to Jardine Lloyd Thompson which was disposed of during the year (refer note 9).
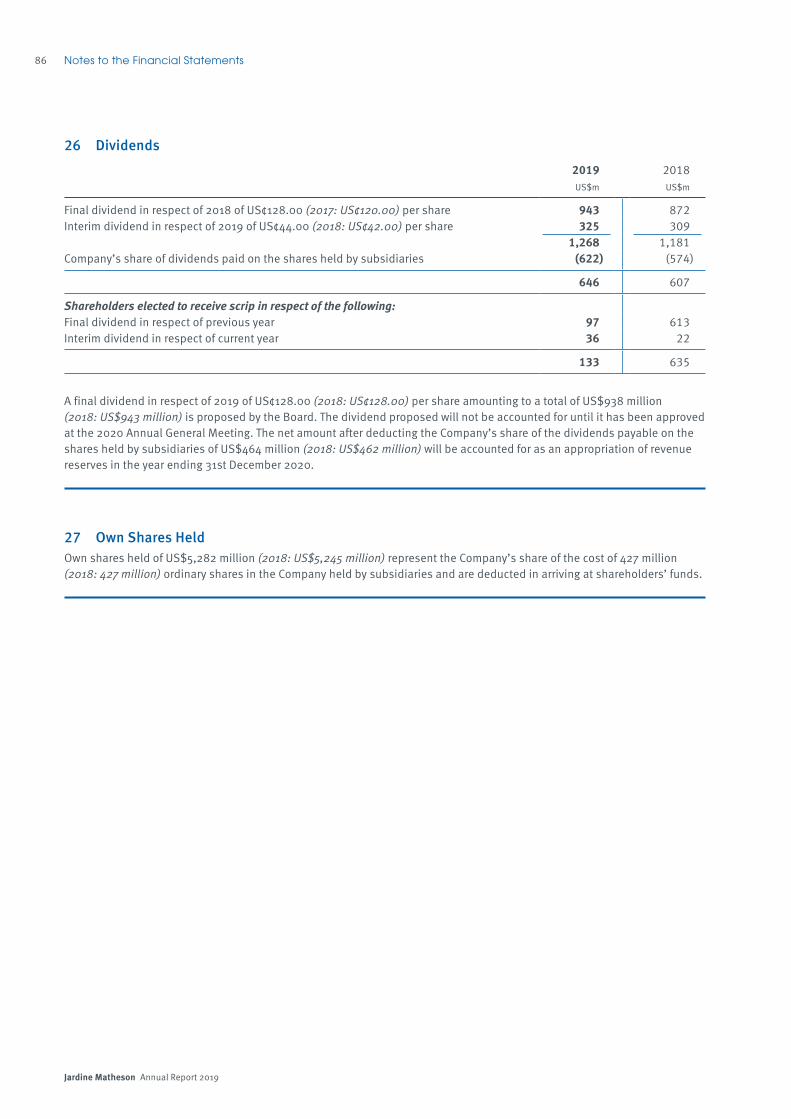
Jardine Matheson Annual Report 2019
86 Notes to the Financial Statements
26 Dividends
2019 2018US$m US$m
Final dividend in respect of 2018 of US¢128.00 (2017: US¢120.00) per share 943 872Interim dividend in respect of 2019 of US¢44.00 (2018: US¢42.00) per share 325 309
1,268 1,181Company’s share of dividends paid on the shares held by subsidiaries (622) (574)
646 607
Shareholders elected to receive scrip in respect of the following:Final dividend in respect of previous year 97 613Interim dividend in respect of current year 36 22
133 635
A final dividend in respect of 2019 of US¢128.00 (2018: US¢128.00) per share amounting to a total of US$938 million (2018: US$943 million) is proposed by the Board. The dividend proposed will not be accounted for until it has been approved at the 2020 Annual General Meeting. The net amount after deducting the Company’s share of the dividends payable on the shares held by subsidiaries of US$464 million (2018: US$462 million) will be accounted for as an appropriation of revenue reserves in the year ending 31st December 2020.
27 Own Shares HeldOwn shares held of US$5,282 million (2018: US$5,245 million) represent the Company’s share of the cost of 427 million (2018: 427 million) ordinary shares in the Company held by subsidiaries and are deducted in arriving at shareholders’ funds.
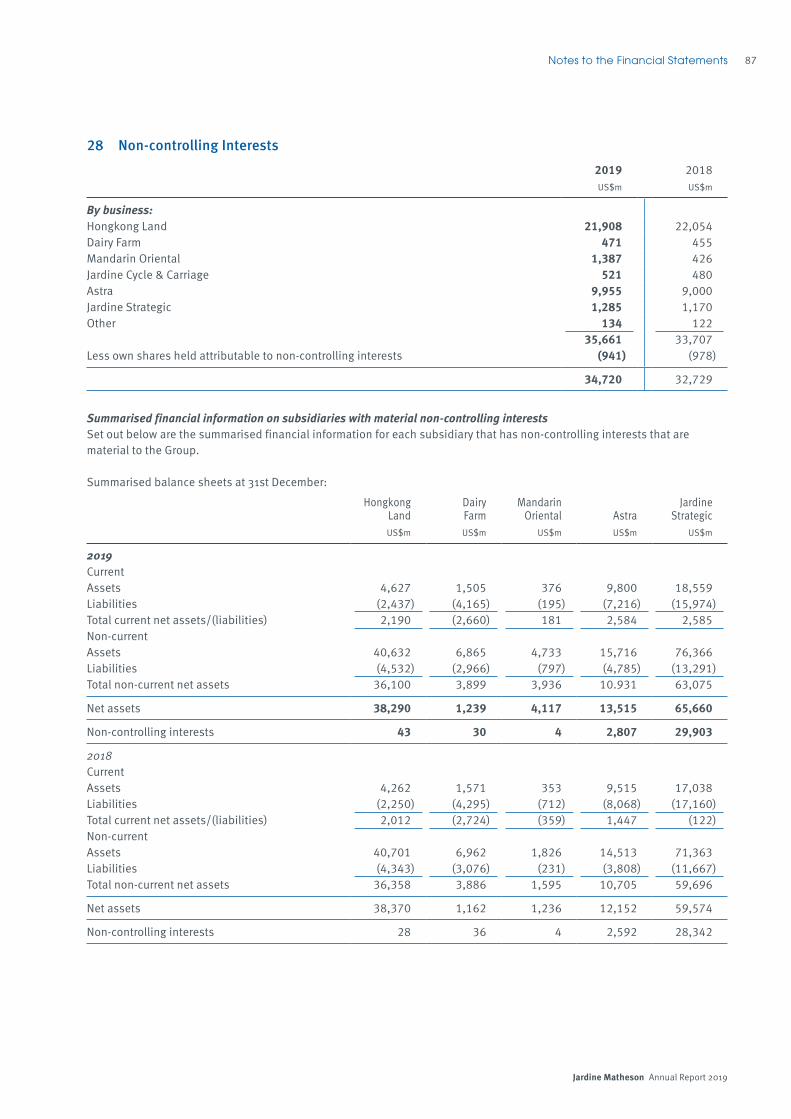
Jardine Matheson Annual Report 2019
87Notes to the Financial Statements
28 Non-controlling Interests
2019 2018US$m US$m
By business:Hongkong Land 21,908 22,054Dairy Farm 471 455Mandarin Oriental 1,387 426Jardine Cycle & Carriage 521 480Astra 9,955 9,000Jardine Strategic 1,285 1,170Other 134 122
35,661 33,707Less own shares held attributable to non-controlling interests (941) (978)
34,720 32,729
Summarised financial information on subsidiaries with material non-controlling interestsSet out below are the summarised financial information for each subsidiary that has non-controlling interests that are material to the Group.
Summarised balance sheets at 31st December:
HongkongLand
DairyFarm
MandarinOriental Astra
JardineStrategic
US$m US$m US$m US$m US$m
2019CurrentAssets 4,627 1,505 376 9,800 18,559Liabilities (2,437) (4,165) (195) (7,216) (15,974)Total current net assets/(liabilities) 2,190 (2,660) 181 2,584 2,585Non-currentAssets 40,632 6,865 4,733 15,716 76,366Liabilities (4,532) (2,966) (797) (4,785) (13,291)Total non-current net assets 36,100 3,899 3,936 10.931 63,075
Net assets 38,290 1,239 4,117 13,515 65,660
Non-controlling interests 43 30 4 2,807 29,903
2018CurrentAssets 4,262 1,571 353 9,515 17,038Liabilities (2,250) (4,295) (712) (8,068) (17,160)Total current net assets/(liabilities) 2,012 (2,724) (359) 1,447 (122)Non-currentAssets 40,701 6,962 1,826 14,513 71,363Liabilities (4,343) (3,076) (231) (3,808) (11,667)Total non-current net assets 36,358 3,886 1,595 10,705 59,696
Net assets 38,370 1,162 1,236 12,152 59,574
Non-controlling interests 28 36 4 2,592 28,342

Jardine Matheson Annual Report 2019
88 Notes to the Financial Statements
28 Non-controlling Interests (continued)
Summarised profit and loss for the year ended 31st December:
HongkongLand
DairyFarm
MandarinOriental Astra
Jardine Strategic
US$m US$m US$m US$m US$m
2019Revenue 2,320 11,192 567 16,803 32,665
Profit after tax from underlying business performance 1,075 324 41 1,835 3,598
Profit/(loss) after tax from non-trading items (873) 1 (97) 8 53Profit/(loss) after tax 202 325 (56) 1,843 3,651Other comprehensive income/(expense) 219 39 2,974 (157) 3,663
Total comprehensive income 421 364 2,918 1,686 7,314
Total comprehensive income allocated to non-controlling interests 3 2 – 302 2,442
Dividends paid to non-controlling interests (1) – – (190) (905)
2018Revenue 2,665 11,749 614 17,054 34,094
Profit after tax from underlying business performance 1,034 358 65 1,898 3,716
Profit/(loss) after tax from non-trading items 1,423 (290) (22) 8 615Profit after tax 2,457 68 43 1,906 4,331Other comprehensive income/(expense) (361) (51) (43) 47 (1,290)
Total comprehensive income 2,096 17 – 1,953 3,041
Total comprehensive income/(expense) allocated to non-controlling interests (4) (20) – 412 1,826
Dividends paid to non-controlling interests (3) – – (176) (844)

Jardine Matheson Annual Report 2019
89Notes to the Financial Statements
28 Non-controlling Interests (continued)
Summarised cash flows at 31st December:
HongkongLand
DairyFarm
MandarinOriental Astra
JardineStrategic
US$m US$m US$m US$m US$m
2019Cash flows from operating activitiesCash generated from operations 1,023 1,384 129 2,265 4,728Interest received 50 7 3 86 180Interest and other financing charges paid (195) (167) (19) (316) (744)Tax paid (116) (25) (6) (726) (927)Dividends from associates and joint ventures 420 89 6 398 1,726Cash flows from operating activities 1,182 1,288 113 1,707 4,963Cash flows from investing activities (658) (283) (80) (1,485) (2,730)Cash flows from financing activities (491) (1,008) (11) (250) (1,289)Net increase/(decrease) in cash and
cash equivalents 33 (3) 22 (28) 944Cash and cash equivalents at 1st January 1,369 285 247 1,722 4,555Effect of exchange rate changes 16 6 2 56 84
Cash and cash equivalents at 31st December 1,418 288 271 1,750 5,583
2018Cash flows from operating activitiesCash generated from operations 764 1,624 178 3,082 5,218Interest received 45 4 2 91 156Interest and other financing charges paid (172) (168) (16) (208) (609)Tax paid (172) (96) (19) (523) (843)Dividends from associates and joint ventures 139 94 8 5 963Cash flows from operating activities 604 1,458 153 2,447 4,885Cash flows from investing activities (1,056) (501) (69) (2,534) (4,579)Cash flows from financing activities 237 (1,001) (17) (399) (879)Net increase/(decrease) in cash and
cash equivalents (215) (44) 67 (486) (573)Cash and cash equivalents at 1st January 1,617 335 184 2,331 5,298Effect of exchange rate changes (33) (6) (4) (123) (170)
Cash and cash equivalents at 31st December 1,369 285 247 1,722 4,555
Hongkong Land, Dairy Farm, Mandarin Oriental and Astra are subsidiaries of Jardine Strategic.
The information above is before any inter-company eliminations.

Jardine Matheson Annual Report 2019
90 Notes to the Financial Statements
29 Borrowings
2019 2018Carryingamount
Fairvalue
Carryingamount
Fairvalue
US$m US$m US$m US$m
Current– bank overdrafts 26 26 35 35– other bank advances 4,144 4,144 3,796 3,796– other advances 19 19 22 22
4,189 4,189 3,853 3,853Current portion of long-term borrowings– bank loans 1,489 1,489 2,470 2,470– bonds and notes 901 901 809 809– other loans 11 11 12 12
2,401 2,401 3,291 3,2916,590 6,590 7,144 7,144
Long-term borrowings– bank loans 4,682 4,697 3,052 3,053– bonds and notes 3,980 4,153 3,990 4,172– other loans 11 11 7 7
8,673 8,861 7,049 7,232
15,263 15,451 14,193 14,376
The fair values are based on market prices or are estimated using the expected future payments discounted at market interest rates ranging from 0.1% to 10.0% (2018: 0.1% to 12.3%) per annum. This is in line with the definition of ‘observable current market transactions’ under the fair value measurement hierarchy. The fair value of current borrowings approximates their carrying amount, as the impact of discounting is not significant.
2019 2018US$m US$m
Secured 3,106 3,973Unsecured 12,157 10,220
15,263 14,193
Secured borrowings at 31st December 2019 included Hongkong Land’s bank borrowings of US$653 million (2018: US$822 million) which were secured against its investment properties, Mandarin Oriental’s bank borrowings of US$549 million (2018: US$523 million) which were secured against its tangible assets and right-of-use assets, and Astra’s bonds and notes of US$467 million (2018: US$974 million) and bank borrowings of US$1,437 million (2018: US$1,654 million) which were secured against its various assets.

Jardine Matheson Annual Report 2019
91Notes to the Financial Statements
29 Borrowings (continued)
Fixed rate borrowingsWeighted
average interest rates
Weighted average period
outstanding
Floating rate
borrowings TotalBy currency: % Years US$m US$m US$m
2019Chinese renminbi 5.0 – – 635 635Hong Kong dollar 3.9 6.3 2,521 1,960 4,481Indonesian rupiah 7.9 2.0 4,598 1,100 5,698Malaysian ringgit 4.1 – – 266 266Singapore dollar 2.9 11.4 397 514 911Thai baht 1.8 – – 376 376United Kingdom sterling 1.7 4.4 53 161 214United States dollar 2.5 2.8 400 2,223 2,623Other 2.5 10.3 2 57 59
7,971 7,292 15,263
2018Chinese renminbi 4.9 – – 488 488Hong Kong dollar 3.9 6.8 2,295 1,835 4,130Indonesian rupiah 7.9 2.1 4,359 1,339 5,698Malaysian ringgit 4.4 – – 234 234Singapore dollar 2.8 7.3 360 745 1,105Thai baht 2.3 – – 262 262United Kingdom sterling 1.6 – – 211 211United States dollar 2.7 0.2 203 1,805 2,008Other 4.6 13.0 2 55 57
7,219 6,974 14,193
The weighted average interest rates and period of fixed rate borrowings are stated after taking into account hedging transactions.
The exposure of the Group’s borrowings to interest rate changes and the contractual repricing dates at 31st December after taking into account hedging transactions are as follows:
2019 2018US$m US$m
Floating rate borrowings 7,292 6,974Fixed rate borrowings– within one year 2,053 2,220– between one and two years 1,320 389– between two and three years 1,389 230– between three and four years 651 636– between four and five years 669 1,090– beyond five years 1,889 2,654
7,971 7,219
15,263 14,193

Jardine Matheson Annual Report 2019
92 Notes to the Financial Statements
29 Borrowings (continued)
Details of the bonds and notes outstanding at 31st December are as follows:
2019 2018
MaturityInterest rates % Nominal values
CurrentNon-
current CurrentNon-
currentUS$m US$m US$m US$m
Hongkong Land4.135% 10-year notes 2019 4.135 HK$200 million – – 26 –4.1875% 10-year notes 2019 4.1875 HK$300 million – – 38 –4.25% 10-year notes 2019 4.25 HK$300 million – – 38 –4.22% 10-year notes 2020 4.22 HK$500 million 64 – – 654.24% 10-year notes 2020 4.24 HK$500 million 64 – – 643.43% 10-year notes 2020 3.43 S$150 million 112 – – 1103.95% 10-year notes 2020 3.95 HK$500 million 64 – – 644.28% 12-year notes 2021 4.28 HK$500 million – 65 – 653.86% 10-year notes 2022 3.86 HK$410 million – 52 – 524.50% 10-year notes 2022 4.50 US$500 million – 498 – 4883.00% 10-year notes 2022 3.00 HK$305 million – 39 – 392.90% 10-year notes 2022 2.90 HK$200 million – 26 – 263.95% 10-year notes 2023 3.95 HK$1,100 million – 141 – 1403.95% 10-year notes 2023 3.95 HK$300 million – 38 – 384.625% 10-year notes 2024 4.625 US$400 million – 407 – 4004.10% 15-year notes 2025 4.10 HK$300 million – 38 – 384.50% 15-year notes 2025 4.50 US$600 million – 609 – 6103.75% 15-year notes 2026 3.75 HK$302 million – 39 – 384.00% 15-year notes 2027 4.00 HK$785 million – 100 – 994.04% 15-year notes 2027 4.04 HK$473 million – 61 – 603.95% 15-year notes 2027 3.95 HK$200 million – 26 – 263.15% 15-year notes 2028 3.15 HK$300 million – 38 – 384.22% 15-year notes 2028 4.22 HK$325 million – 41 – 413.83% 10-year notes 2028 3.83 HK$450 million – 58 – 573.75% 10-year notes 2028 3.75 HK$355 million – 45 – 454.40% 15-year notes 2029 4.40 HK$400 million – 51 – 512.93% 10-year notes 2029 2.93 HK$550 million – 71 – –4.11% 20-year notes 2030 4.11 HK$800 million – 103 – 1024.125% 20-year notes 2031 4.125 HK$200 million – 25 – 254.00% 20-year notes 2032 4.00 HK$240 million – 30 – 304.12% 15-year notes 2033 4.12 HK$700 million – 89 – 883.67% 15-year notes 2034 3.67 HK$604 million – 77 – –3.95% 20-year notes 2038 3.95 S$150 million – 109 – 1083.45% 20-year notes 2039 3.45 S$150 million – 110 – –5.25% 30-year notes 2040 5.25 HK$250 million – 32 – 32
Astra Sedaya Finance (‘ASF’)Berkelanjutan III Tahap I bonds 2019 8.5 Rp1,230 billion – – 85 –Berkelanjutan III Tahap II bonds 2019 7.95 Rp850 billion – – 53 –Berkelanjutan III Tahap III bonds 2020 – 2022 8.5 – 8.75 Rp1,500 billion 81 27 – 103Berkelanjutan III Tahap IV bonds 2020 – 2022 7.5 – 7.65 Rp825 billion 45 14 – 57Berkelanjutan IV Tahap I bonds 2021 7.5 Rp550 billion – 38 39 38Berkelanjutan IV Tahap II bonds 2020 – 2024 8.0 – 9.2 Rp2,225 billion 67 86 – –Berkelanjutan IV Tahap III bonds 2020 – 2024 8.65 – 7.95 Rp1,557 billion 37 67 – –Sukuk Mudharabah
Berkelanjutan I Tahap I bonds 2021 7.5 Rp175 billion – 13 22 12Euro Medium Term Notes 2021 7.2 Rp678 billion – 49 – 48

Jardine Matheson Annual Report 2019
93Notes to the Financial Statements
29 Borrowings (continued)
Details of the bonds and notes outstanding at 31st December are as follows (continued):
2019 2018
MaturityInterest rates % Nominal values
CurrentNon-
current CurrentNon-
currentUS$m US$m US$m US$m
Federal International Finance (‘FIF’)
Berkelanjutan II Tahap III bonds 2019 9.15 Rp2,507 billion – – 173 –Berkelanjutan II Tahap IV bonds 2019 7.95 Rp1,257 billion – – 80 –Berkelanjutan III Tahap I bonds 2020 8.45 Rp2,076 billion 147 – – 142Berkelanjutan III Tahap II bonds 2020 7.5 Rp971 billion 68 – – 65Berkelanjutan III Tahap III bonds 2021 7.45 Rp1,408 billion – 91 110 82Berkelanjutan III Tahap IV bonds 2021 8.75 Rp661 billion – 42 44 45Berkelanjutan III Tahap V bonds 2020 – 2022 8.0 – 8.8 Rp2,360 billion 71 94 – –Berkelanjutan IV Tahap I bonds 2020 – 2022 7.55 – 8.55 Rp1,500 billion 33 67 – –Medium Term Notes 2021 – 2022 7.99 – 8.2 Rp4,554 billion – 326 – 297
SAN FinanceBerkelanjutan II Tahap I bonds 2019 9.0 Rp1,090 billion – – 72 –Berkelanjutan II Tahap II bonds 2020 – 2022 9.0 – 9.25 Rp471 billion 32 2 – 33Berkelanjutan III Tahap I bonds 2020 – 2022 7.70 – 8.75 Rp500 billion 16 16 – –
Astra Otoparts (‘AOP’) Medium Term Note
AOP Medium Term Note Seri B 2019 9.0 Rp350 billion – – 24 –
Serasi Autoraya (‘SERA’)Berkelanjutan I Tahap I bonds 2021 – 2023 7.75 – 8.35 Rp420 billion – 30 5 29
901 3,980 809 3,990
The ASF bonds were issued by a partly-owned subsidiary of Astra. Apart from the ASF Berkelanjutan IV Tahap II and III bonds and Euro Medium Term Notes which were unsecured, the other ASF bonds are collateralised by fiduciary guarantee over financing debtors of the subsidiary which amounting to 50% of the total outstanding principal of the bonds.
The FIF bonds were issued by a wholly-owned subsidiary of Astra. Apart from the FIF Berkelanjutan III Tahap III, IV and V bonds, Berkelanjutan IV Tahap I bonds and Medium Term Notes which were unsecured, the other FIF bonds are collateralised by fiduciary guarantee over financing debtors of the subsidiary which amounting to 60% of the total outstanding principal of the bonds.
The SAN Finance bonds were issued by a partly-owned subsidiary of Astra. Apart from the SAN Finance Berkelanjutan III Tahap I bonds which was unsecured, the other SAN Finance bonds are collateralised by fiduciary guarantee over financing debtors of the subsidiary which amounting to 60% of the total outstanding principal of the bonds.
The AOP Medium Term Note was unsecured and issued by a wholly-owned subsidiary of Astra.
The SERA bonds was unsecured and issued by a wholly-owned subsidiary of Astra.

Jardine Matheson Annual Report 2019
94 Notes to the Financial Statements
29 Borrowings (continued)
The movements in borrowings are as follows:
Bank overdrafts
Long-term borrowings
Short-term borrowings
Finance lease
liabilities TotalUS$m US$m US$m US$m US$m
2019At 1st January– as previously reported 35 7,049 7,109 38 14,231– change in accounting policies (refer note 1) – – – (38) (38)– as restated 35 7,049 7,109 – 14,193Exchange differences 1 42 113 – 156Disposals – – (26) – (26)Amortisation of borrowing costs – 4 10 – 14Transfer – (2,553) 2,553 – –Change in fair value – 12 – – 12Change in bank overdrafts (10) – – – (10)Drawdown of borrowings – 5,412 3,181 – 8,593Repayment of borrowings – (1,293) (6,376) – (7,669)
At 31st December 26 8,673 6,564 – 15,263
2018At 1st January– as previously reported 7 7,461 5,339 4 12,811– change in accounting policies (refer note 1) – – – (4) (4)– as restated 7 7,461 5,339 – 12,807Exchange differences (2) (117) (233) – (352)New subsidiaries – 104 68 – 172Disposals – – (26) – (26)Amortisation of borrowing costs – 4 10 – 14Transfer – (3,328) 3,328 – –Change in fair value – (9) – – (9)Change in bank overdrafts 30 – – – 30Drawdown of borrowings – 5,166 2,757 – 7,923Repayment of borrowings – (2,232) (4,134) – (6,366)
At 31st December 35 7,049 7,109 – 14,193

Jardine Matheson Annual Report 2019
95Notes to the Financial Statements
30 Lease Liabilities
2019 2018US$m US$m
At 1st January– as previously reported – –– change in accounting policies (refer note 1) 4,418 4,402– as restated 4,418 4,402Exchange differences 43 (76)New subsidiaries 2 14Additions 408 553Disposals (58) (130)Modifications to lease terms 365 673Lease payments (1,170) (1,182)Interest expense 154 164
At 31st December 4,162 4,418
Non-current 3,260 3,523Current 902 895
4,162 4,418
Lease terms are negotiated on an individual basis and contain a wide range of different terms and conditions. The lease agreements do not impose any covenants other than the security interests in the leased assets that are held by the lessor.
The Group is not exposed to any residual guarantees in respect of the leases entered into at 31st December 2019 and 2018.
The Group has entered into lease contracts which have not commenced at 31st December 2019 amounting to US$108 million (2018: US$15 million).

Jardine Matheson Annual Report 2019
96 Notes to the Financial Statements
31 Creditors
2019 2018US$m US$m
Trade creditors– third parties 4,865 5,412– associates 63 85– joint ventures 210 209
5,138 5,706Accruals 2,025 1,929Other amounts due to joint ventures 143 142Rental and other refundable deposits 426 411Deferred consideration payable 77 56Contingent consideration payable 19 10Derivative financial instruments 144 52Other creditors 613 613Financial liabilities 8,585 8,919Contract liabilities (refer note 3) 1,010 1,074Gross estimated losses on insurance contracts 193 178Rental income received in advance 41 36Unearned premiums on insurance contracts 341 326Other 79 83
10,249 10,616
Non-current 356 341Current 9,893 10,275
10,249 10,616
Analysis by geographical area of operation:Greater China 3,972 3,925Southeast Asia 5,607 6,185United Kingdom 433 272Rest of the world 237 234
10,249 10,616
Derivative financial instruments are stated at fair value. Other creditors are stated at amortised cost. The fair values of these creditors approximate their carrying amounts.

Jardine Matheson Annual Report 2019
97Notes to the Financial Statements
32 Provisions
Motor vehicle
warranties
Closure cost
provisions
Obligations under
onerous leases
Reinstate-ment and
restoration costs
Statutory employee
entitlements Others TotalUS$m US$m US$m US$m US$m US$m US$m
2019At 1st January– as previously reported 63 93 101 101 124 26 508– change in accounting
policies (refer note 1) – (25) (101) 112 – – (14)– as restated 63 68 – 213 124 26 494Exchange differences 1 1 – 2 5 1 10Additional provisions 9 12 – 12 20 4 57Disposals – – – (2) – – (2)Unused amounts reversed – (9) – (2) (1) – (12)Utilised (3) (40) – (7) (1) (4) (55)
At 31st December 70 32 – 216 147 27 492
Non-current – 1 – 184 113 16 314Current 70 31 – 32 34 11 178
70 32 – 216 147 27 492
2018At 1st January– as previously reported 58 50 14 64 121 22 329– change in accounting
policies (refer note 1) – (6) (14) 118 – – 98– as restated 58 44 – 182 121 22 427Exchange differences (1) (2) – (2) (8) (1) (14)New subsidiaries – – – 25 – – 25Additional provisions 10 53 – 15 13 7 98Unused amounts reversed – (7) – (4) – (1) (12)Utilised (4) (20) – (3) (2) (1) (30)
At 31st December 63 68 – 213 124 26 494
Non-current – 7 – 184 100 14 305Current 63 61 – 29 24 12 189
63 68 – 213 124 26 494
Motor vehicle warranties are estimated liabilities that fall due under the warranty terms offered on sale of new and used vehicles beyond that which are reimbursed by the manufacturers.
Closure cost provisions are established when legal or constructive obligations arise on closure or disposal of businesses.
Provisions for reinstatement and restoration costs comprised the estimated costs, to be incurred by the Group as lessees, in dismantling and removing the underlying assets, restoring the sites on which they are located or restoring the underlying assets to the condition required by the terms and conditions of the leases.
Other provisions principally comprise provisions in respect of indemnities on disposal of businesses and legal claims.

Jardine Matheson Annual Report 2019
98 Notes to the Financial Statements
33 Notes to Consolidated Cash Flow Statement(a) Cash generated from operations
2019 2018US$m US$m
By nature:Operating profit 4,735 4,508Adjustments for: Depreciation and amortisation (refer note 33(b)) 2,406 2,184 Change in fair value of investment properties 832 (1,251) Profit on sale of subsidiaries (29) (178) Profit on sale of Jardine Lloyd Thompson (1,507) – Loss on sale of other associates and joint ventures 9 46 Profit on sale of other investments (4) (3) Profit on sale of right-of-use assets (3) (9) Profit on sale of tangible assets (2) (29) Loss on sale of repossessed collateral of finance companies 60 54 Fair value (gain)/loss on other investments (71) 476 Fair value (gain)/loss on agricultural produce (5) 10 Impairment of intangible assets 22 127 (Reversal of impairment)/impairment of tangible assets (3) 203 Impairment of right-of-use assets 11 93 Impairment of bearer plant 8 – Impairment of debtors 121 227 Write down of stocks and work in progress 75 80 Reversal of write down of stocks and work in progress (44) (33) Gain on modifications to lease terms (4) (6) Change in provisions 37 75 Net foreign exchange losses 3 18 Amortisation of borrowing costs for financial services companies 10 10 Options granted under employee share option schemes 4 5 Recognition of previous deferred fair value gain on land – (34)
1,926 2,065Change in working capital: Increase in concession rights (77) (20) (Increase)/decrease in properties for sale (29) 169 Increase in stocks and work in progress (115) (466) Increase in debtors (472) (1,539) (Decrease)/increase in creditors (743) 845 Increase in pension obligations 44 34
(1,392) (977)
5,269 5,596

Jardine Matheson Annual Report 2019
99Notes to the Financial Statements
33 Notes to Consolidated Cash Flow Statement (continued)
(b) Depreciation and amortisation
2019 2018US$m US$m
By business:Jardine Pacific 141 137Jardine Motors 70 68Hongkong Land 13 4Dairy Farm 1,003 1,103Mandarin Oriental 92 93Jardine Cycle & Carriage 18 17Astra 1,069 762
2,406 2,184
(c) Purchase of subsidiaries
2019 2018Fair value Fair value
US$m US$m
Non-current assets 3 1,310Current assets 72 145Non-current liabilities (8) (352)Current liabilities (3) (174)Fair value of identifiable net assets acquired 64 929Goodwill 4 272Adjustment for non-controlling interests (14) (57)Total consideration 54 1,144Adjustment for contingent consideration (10) –Net borrowings repaid at date of acquisition – 148Payment for deferred consideration – 82Adjustment for deferred consideration – (25)Carrying value of associates and joint ventures (15) (44)Cash and cash equivalents of subsidiaries acquired (1) (18)
Net cash outflow 28 1,287
For the subsidiaries acquired during 2019, the fair values of the identifiable assets and liabilities at the acquisition dates are provisional and will be finalised within one year after the acquisition dates.
The fair values of the identifiable assets and liabilities at the acquisition dates of certain subsidiaries acquired during 2018 were finalised in 2019 and the comparative figures have been adjusted.

Jardine Matheson Annual Report 2019
100 Notes to the Financial Statements
33 Notes to Consolidated Cash Flow Statement (continued)
(c) Purchase of subsidiaries (continued)Net cash outflow for purchase of subsidiaries in 2018 included US$55 million for Dairy Farm’s acquisition of an additional 51% interest in Rose Pharmacy, a health and beauty stores chain in the Philippines, increasing its controlling interest to 100%; and US$1,150 million (including repayment of net borrowings of US$148 million) for Astra’s acquisition of a 95% interest in PT Agincourt Resources, a gold mining company. In addition, there were cash outflows of US$69 million and US$13 million for Astra’s payment of deferred consideration for investments in toll road concessions and acquisition of an 80% interest in PT Suprabari Mapanindo Mineral, a coal mining company, respectively, in 2017.
Goodwill in 2018 mainly arose from the acquisitions of Rose Pharmacy of US$99 million, attributable to the leading market position and retail network in the Philippines; and PT Agincourt Resources of US$171 million, attributable to the requirement to recognise deferred tax on the difference between the fair value and the tax value of the assets at the date of acquisition.None of the goodwill is expected to be deductible for tax purposes.
(d) Purchase of associates and joint ventures in 2019 mainly included US$553 million for Hongkong Land’s investments primarily in the Chinese mainland; US$168 million for Jardine Cycle & Carriage’s additional interest in Truong Hai Auto Corporation; US$208 million and US$42 million for Astra’s investments in toll road concessions and capital injections into its associates and joint ventures, respectively; and US$64 million for Jardine Strategic’s 20% interest in Livi VB Limited, a virtual bank in Hong Kong.
Purchases in 2018 mainly included US$834 million for Hongkong Land’s investments in the Chinese mainland, Thailand and Vietnam; US$220 million related to Dairy Farm’s acquisition of a 20% interest in Robinsons Retail (refer note 15); and US$99 million for Astra’s investments in toll road concessions.
(e) Purchase of other investments in 2019 mainly included Astra’s additional investment in Gojek and investments in other securities of US$100 million and US$299 million, respectively.
Purchases in 2018 included US$200 million and US$62 million for Jardine Cycle & Carriage’s investments in shares in Toyota Motor Corporation and additional shares in Vietnam Dairy Products increasing its interest to 10.6%, respectively; and US$150 million and US$280 million for Astra’s investments in Gojek and other securities, respectively.
(f ) Advance to associates and joint ventures in 2019 and 2018 mainly included Hongkong Land’s advance to its property joint ventures.

Jardine Matheson Annual Report 2019
101Notes to the Financial Statements
33 Notes to Consolidated Cash Flow Statement (continued)
(g) Advance from and repayment from associates and joint ventures in 2019 and 2018 mainly included advance from and repayment from Hongkong Land’s property joint ventures.
(h) Sale of other investments in 2019 comprised US$158 million in Hongkong Land and US$276 million in Astra.
Sale in 2018 mainly included Astra’s sale of securities.
(i) Change in interests in subsidiaries
2019 2018US$m US$m
Increase in attributable interests– Jardine Strategic (253) (203)– Hongkong Land – (131)– Mandarin Oriental (5) (33)– other (19) (200)Decrease in attributable interests – 4
(277) (563)
Increase in attributable interests in other subsidiaries in 2018 included US$196 million for Astra’s acquisition of the remaining 25% interest in Astra Sedaya Finance, a consumer financing company, from Permata Bank, increasing its controlling interest to 100%.
(j) Cash outflows for leases
2019 2018US$m US$m
Lease rentals paid (1,346) (1,316)Additions to right-of-use assets (60) (32)
(1,406) (1,348)
The above cash outflows are included in– operating activities (330) (298)– investing activities (60) (32)– financing activities (1,016) (1,018)
(1,406) (1,348)
(k) Analysis of balances of cash and cash equivalents
2019 2018US$m US$m
Bank balances and other liquid funds (refer note 22) 7,183 4,988Bank overdrafts (refer note 29) (26) (35)
7,157 4,953

Jardine Matheson Annual Report 2019
102 Notes to the Financial Statements
34 Derivative Financial InstrumentsThe fair values of derivative financial instruments at 31st December are as follows:
2019 2018Positive
fair value
Negative fair
value
Positive fair
value
Negative fair
valueUS$m US$m US$m US$m
Designated as cash flow hedges– forward foreign exchange contracts 2 4 6 –– interest rate swaps and caps 1 10 3 2– cross currency swaps 35 82 174 40– forward commodity contracts – 38 – –– commodity zero collars – 6 – –
38 140 183 42
Designated as fair value hedges– forward foreign exchange contracts – 1 – –– interest rate swaps and caps 1 – 2 –– cross currency swaps 10 3 4 10
11 4 6 10
Forward foreign exchange contractsThe contract amounts of the outstanding forward foreign exchange contracts at 31st December 2019 were US$813 million (2018: US$2,844 million). Included in 2018 outstanding amount were contracts totalling US$2.1 billion relating to the sale of Jardine Lloyd Thompson (refer note 9).
Interest rate swaps and capsThe notional principal amounts of the outstanding interest rate swap and cap contracts at 31st December 2019 were US$799 million (2018: US$600 million).
At 31st December 2019, the fixed interest rates relating to interest rate swaps and caps varied from 1.2% to 2.7% (2018: 0.9% to 3.1%) per annum.
The fair values of interest rate swaps at 31st December 2019 were based on the estimated cash flows discounted at market rates ranging from 0.7% to 2.9% (2018: 1.9% to 3.1%) per annum.
Cross currency swapsThe contract amounts of the outstanding cross currency swap contracts at 31st December 2019 were US$4,175 million (2018: US$3,960 million).
Forward commodity contracts, commodity zero collars and commodity optionsThe contract amounts of the outstanding forward commodity contracts and commodity zero collars at 31st December 2019 were US$429 million (2018: nil) and US$84 million (2018: nil), respectively.
The Group also entered into commodity options with outstanding contract amounts at 31st December 2019 totalled US$8 million (2018: nil).
The outstanding interest rate swaps and cross currency swaps of an aggregate notional principal and contract amount of US$4.9 billion are impacted by the IBOR reform. 75% of these will mature after 2021.

Jardine Matheson Annual Report 2019
103Notes to the Financial Statements
35 Commitments
2019 2018US$m US$m
Capital commitments:Authorised not contracted– joint ventures – –– other 1,522 1,415
1,522 1,415Contracted not provided– joint ventures 1,054 1,359– other 355 396
1,409 1,755
2,931 3,170
In February 2020, Hongkong Land secured a prime, predominantly commercial site in the Xuhui District of Shanghai for a consideration of RMB31 billion (equivalent to approximately US$4.4 billion). The project mainly comprises office and retail space with a developable area of 1.1 million square metres, and will be developed in multiple phases to 2027.
2019 2018US$m US$m
Operating lease commitments for short-term and low-value leases:Total commitments– due within one year 33 21– due between one and two years 16 8– due between two and three years 8 4– due between three and four years 4 1– due between four and five years 3 1– due beyond five years 4 2
68 37
Total future sublease payments receivable amounted to US$16 million (2018: US$25 million).
36 Contingent LiabilitiesVarious Group companies are involved in litigation arising in the ordinary course of their respective businesses. Having reviewed outstanding claims and taking into account legal advice received, the Directors are of the opinion that adequate provisions have been made in the financial statements.

Jardine Matheson Annual Report 2019
104 Notes to the Financial Statements
37 Related Party TransactionsIn the normal course of business the Group undertakes a variety of transactions with certain of its associates and joint ventures.
The most significant of such transactions relate to the purchases of motor vehicles and spare parts from its associates and joint ventures in Indonesia including PT Toyota-Astra Motor, PT Astra Honda Motor and PT Astra Daihatsu Motor. Total cost of motor vehicles and spare parts purchased in 2019 amounted to US$5,446 million (2018: US$5,449 million). The Group also sells motor vehicles and spare parts to its associates and joint ventures in Indonesia including PT Astra Honda Motor, PT Astra Daihatsu Motor and PT Tunas Ridean. Total revenue from sale of motor vehicles and spare parts in 2019 amounted to US$664 million (2018: US$637 million).
The Group manages six (2018: six) associate and joint venture hotels. Management fees received by the Group in 2019 from these managed hotels amounted to US$15 million (2018: US$15 million).
Permata Bank provides banking services to the Group. The Group’s deposits with Permata Bank at 31st December 2019 amounted to US$437 million (2018: US$345 million).
Amounts of outstanding balances with associates and joint ventures are included in debtors and creditors, as appropriate (refer notes 17 and 31).
Details of Directors’ remuneration (being the key management personnel compensation) are shown on page 141 under the heading of Directors’ Appointment, Retirement, Remuneration and Service Contracts.
38 Summarised Balance Sheet of the CompanyIncluded below is certain summarised balance sheet information of the Company disclosed in accordance with Bermuda law.
2019 2018US$m US$m
Subsidiaries 1,659 1,659Current assets 811 577
Total assets 2,470 2,236
Share capital (refer note 23) 183 184Share premium and capital reserves (refer note 25) 27 62Revenue and other reserves 2,237 1,969Shareholders’ funds 2,447 2,215Current liabilities 23 21
Total equity and liabilities 2,470 2,236
Subsidiaries are shown at cost less amounts provided.

Jardine Matheson Annual Report 2019
105Notes to the Financial Statements
39 Principal SubsidiariesThe Group’s principal subsidiaries at 31st December 2019 are set out below:
Country of incorporation/ principal place of business Nature of business
Attributable interests
Proportion of ordinaryshares and voting powers at31st December 2019 held by
2019 2018 the Groupnon-controlling
interests% % % %
Dairy Farm International Holdings Ltd
Bermuda/Greater China and Southeast Asia
Grocery retail, convenience stores, health and beauty, home furnishings, restaurants and other retailing
66 65 78 22
Hongkong Land Holdings Ltd Bermuda/Greater China and Southeast Asia
Property development & investment, leasing & management
43 43 50 50
Jardine Cycle & Carriage Ltd Singapore/ Southeast Asia
A 50.1% interest in PT Astra International Tbk, motor trading and holding
64 63 75 25
Jardine Matheson Ltd Bermuda/ Hong Kong
Group management 100 100 100 –
Jardine Motors Group Holdings Ltd
Bermuda/ Greater China and United Kingdom
Motor trading 100 100 100* –
Jardine Pacific Holdings Ltd Bermuda/ Greater China and Southeast Asia
Engineering & construction, transport services, restaurants and IT services
100 100 100 –
Jardine Strategic Holdings Ltd† Bermuda/ Greater China and Southeast Asia
Holding 85 84 85 15
Mandarin Oriental International Ltd
Bermuda/ Worldwide
Hotel management & ownership
66 66 78 22
Matheson & Co., Ltd England/ United Kingdom
Holding and management
100 100 100 –
PT Astra International Tbk Indonesia/ Indonesia
Automotive, financial services, heavy equipment, mining, construction and energy, agribusiness, infrastructure and logistics, information technology and property
32 32 50 50
All subsidiaries are included in the consolidation.
Attributable interests represent the proportional holdings of the Company, held directly or through its subsidiaries, in the issued share capitals of the respective companies, after the deduction of any shares held by the trustees of the employee share option schemes of any such company and any shares in any such company owned by its wholly-owned subsidiaries.
* Jardine Motors is directly held by the Company. All other subsidiaries are held through subsidiaries.
† Jardine Strategic held 58% (2018: 58%) of the share capital of the Company.

Jardine Matheson Annual Report 2019
106 Notes to the Financial Statements
40 Principal Accounting PoliciesBasis of consolidation(i) The consolidated financial statements include the financial statements of the Company, its subsidiaries, and the Group’s interests in associates and joint ventures.
(ii) A subsidiary is an entity over which the Group has control. The Group controls an entity when the Group is exposed to, or has rights to, variable returns from its involvement with the entity and has the ability to affect those returns through its power over the entity.
The purchase method of accounting is used to account for the acquisition of subsidiaries by the Group. The cost of an acquisition includes the fair value at the acquisition date of any contingent consideration. The Group recognises the non-controlling interest’s proportionate share of the recognised identifiable net assets of the acquired subsidiary. In a business combination achieved in stages, the Group remeasures its previously held interest in the acquiree at its acquisition-date fair value and recognises the resulting gain or loss in profit and loss. Changes in a parent’s ownership interest in a subsidiary that do not result in the loss of control are accounted for as equity transactions. When control over a previous subsidiary is lost, any remaining interest in the entity is remeasured at fair value and the resulting gain or loss is recognised in profit and loss.
All material intercompany transactions, balances and unrealised surpluses and deficits on transactions between Group companies have been eliminated. The cost of and related income arising from shares held in the Company by subsidiaries are eliminated from shareholders’ funds and non-controlling interests, and profit, respectively.
(iii) An associate is an entity, not being a subsidiary or joint venture, over which the Group exercises significant influence. A joint venture is a type of joint arrangement whereby the parties that have joint control of the arrangement have rights to the net assets of the joint venture. Joint control is the contractually agreed sharing of control of an arrangement, which exists only when decisions about the relevant activities require unanimous consent of the parties sharing control.
Associates and joint ventures are included on the equity basis of accounting.
Profits and losses resulting from upstream and downstream transactions between the Group and its associates and joint ventures are recognised in the consolidated financial statements only to the extent of unrelated investor’s interests in the associates and joint ventures.
(iv) Non-controlling interests represent the proportion of the results and net assets of subsidiaries and their associates and joint ventures not attributable to the Group.
(v) The results of subsidiaries, associates and joint ventures are included or excluded from their effective dates of acquisition or disposal, respectively. The results of entities other than subsidiaries, associates and joint ventures are included to the extent of dividends received when the right to receive such dividend is established.
Foreign currenciesTransactions in foreign currencies are accounted for at the exchange rates ruling at the transaction dates.
Assets and liabilities of subsidiaries, associates and joint ventures, together with all other monetary assets and liabilities expressed in foreign currencies, are translated into United States dollars at the rates of exchange ruling at the year end. Results expressed in foreign currencies are translated into United States dollars at the average rates of exchange ruling during the year, which approximate the exchange rates at the dates of the transactions.
Exchange differences arising from the retranslation of the net investment in foreign subsidiaries, associates and joint ventures, and of financial instruments which are designated as hedges of such investments, are recognised in other comprehensive income and accumulated in equity under exchange reserves. On the disposal of these investments, such exchange differences are recognised in profit and loss. Exchange differences on other investments measured at fair value through other comprehensive income are recognised in other comprehensive income as part of the gains and losses arising from changes in their fair value. All other exchange differences are recognised in profit and loss.
Goodwill and fair value adjustments arising on acquisition of a foreign entity after 1st January 2003 are treated as assets and liabilities of the foreign entity and translated into United States dollars at the rate of exchange ruling at the year end.

Jardine Matheson Annual Report 2019
107Notes to the Financial Statements
Impairment of non-financial assetsAssets that have indefinite useful lives are not subject to amortisation and are tested for impairment annually and whenever there is an indication that the assets may be impaired. Assets that are subject to amortisation are reviewed for impairment whenever events or changes in circumstances indicate that the carrying amount may not be recoverable. For the purpose of assessing impairment, assets are grouped at the lowest level for which there is separately identifiable cash flows. Cash-generating units or groups of cash-generating units to which goodwill has been allocated are tested for impairment annually and whenever there is an indication that the units may be impaired. An impairment loss is recognised for the amount by which the carrying amount of the asset exceeds its recoverable amount, which is the higher of an asset’s fair value less costs to sell and value in use. Non-financial assets other than goodwill that suffered an impairment are reviewed for possible reversal of the impairment annually.
Intangible assets(i) Goodwill represents the excess of the sum of the consideration transferred, the amount of any non-controlling interests in the acquiree, and the acquisition-date fair value of any previously held equity interest in the acquiree over the acquisition-date fair value of the Group’s share of the net identifiable assets acquired. Non-controlling interests are measured at their proportionate share of the net identifiable assets at the acquisition date. If the cost of acquisition is less than the fair value of the net assets acquired, the difference is recognised directly in profit and loss. Goodwill on acquisitions of subsidiaries is included in intangible assets. Goodwill on acquisitions of associates and joint ventures is included in investment in associates and joint ventures. Goodwill is allocated to cash-generating units or groups of cash-generating units for the purpose of impairment testing and is carried at cost less accumulated impairment loss.
The profit or loss on disposal of subsidiaries, associates and joint ventures is stated after deducting the carrying amount of goodwill relating to the entity sold.
(ii) Franchise rights, which are rights under franchise agreements, are separately identified intangible assets acquired as part of a business combination. These franchise agreements are deemed to have indefinite lives because either they do not have any term of expiry or their renewal by the Group would be probable and would not involve significant costs, taking into account the history of renewal and the relationships between the franchisee and the contracting parties. The useful lives are reviewed at each balance sheet date. Franchise rights are carried at cost less accumulated impairment loss.
(iii) Concession rights are operating rights for toll roads under service concession arrangements. The cost of the construction services is amortised based on traffic volume projections.
(iv) Deferred exploration costs relating to mining resources are capitalised when the rights of tenure of a mining area are current and is considered probable that the costs will be recouped through successful development and exploitation of the area. Deferred exploration costs are amortised using the unit of production method, and are assessed for impairment if facts and circumstances indicate that impairment may exist.
(v) Other intangible assets are stated at cost less accumulated amortisation. Amortisation is calculated on the straight line basis to allocate the cost of intangible assets over their estimated useful lives.
Tangible fixed assets and depreciationFreehold properties comprised land and buildings. Freehold land is stated at cost less any impairment. No depreciation is provided on freehold land as it is deemed to have an indefinite life. Buildings on freehold and leasehold land are stated at cost less any accumulated depreciation and impairment. Grants related to tangible assets are deducted in arriving at the carrying amount of the assets. Mining properties, which are contractual rights to mine and own coal and gold reserves in specified concession areas, and other tangible fixed assets are stated at cost less amounts provided for depreciation. Cost of mining properties includes expenditure to restore and rehabilitate coal and gold mining areas following the completion of production.

Jardine Matheson Annual Report 2019
108 Notes to the Financial Statements
Depreciation of tangible fixed assets other than mining properties is calculated on the straight-line basis to allocate the cost or valuation of each asset to its residual value over its estimated useful life. The residual values and useful lives are reviewed at each balance sheet date. The estimated useful lives are as follows:
Buildings– hotels 21 to 150 years– others 14 to 116 yearsSurface, finishes and services of hotel properties 20 to 30 yearsLeasehold improvements shorter of unexpired lease term or useful lifePlant and machinery 2 to 25 yearsFurniture, equipment and motor vehicles 2 to 25 years
Mining properties are depreciated using the unit of production method.
Where the carrying amount of a tangible fixed asset is greater than its estimated recoverable amount, it is written down immediately to its recoverable amount.
The profit or loss on disposal of tangible fixed assets is recognised by reference to their carrying amount.
LeasesAt inception of a contract, the Group assesses whether a contract is, or contains, a lease. A contract is, or contains, a lease if the contract conveys the right to control the use of an identified asset for a period of time in exchange for consideration.
Lease contracts may contain lease and non-lease components. The Group allocates the consideration in the contract to lease and non-lease component based on their relative stand-alone prices. For property leases where the Group is a lessee, it has elected not to separate lease and immaterial non-lease components and accounts for these items as a single lease component.
(i) As a lesseeThe Group enters into property leases for use as retail stores and offices, as well as leases for plant & machinery and motor vehicles for use in its operations.
The Group recognises right-of-use assets and lease liabilities at the lease commencement dates, that is the dates the underlying assets are available for use. Right-of-use assets are measured at cost, less any accumulated depreciation and impairment, and adjusted for any remeasurement of lease liabilities. The cost of the right-of-use assets includes amounts of the initial measurement of lease liabilities recognised, lease payments made at or before the commencement dates less any lease incentives received, initial direct costs incurred and restoration costs. Right-of-use assets are depreciated using the straight-line method over the shorter of their estimated useful lives and the lease terms.
When right-of-use assets meet the definition of investment properties, they are presented in investment properties, and are initially measured at cost and subsequently measured at fair value, in accordance with the Group’s accounting policy.
The Group also has interests in leasehold land for use in its operations. Lump sum payments were made upfront to acquire these land interests from their previous registered owners or governments in the jurisdictions where the land is located. There are no ongoing payments to be made under the term of the land leases, other than insignificant lease renewal costs or payments based on rateable value set by the relevant government authorities. These payments are stated at cost and are amortised over the term of the lease which includes the renewal period if the lease can be renewed by the Group without significant cost.
Lease liabilities are measured at the present value of lease payments to be made over the lease terms. Lease payments include fixed payments (including in-substance fixed payments) less any lease incentives receivable, variable lease payments that depend on an index or a rate, and amounts expected to be paid under residual value guarantees. The lease payments also include the exercise price of a purchase option reasonably certain to be exercised and payments of penalties for terminating a lease, if the lease term reflects the Group exercising that option. The variable lease payments that do not depend on an index or a rate are recognised as expense in the period on which the event or condition that triggers the payment occurs.

Jardine Matheson Annual Report 2019
109Notes to the Financial Statements
In calculating the present value of lease payments, the Group uses the incremental borrowing rate at the lease commencement date if the interest rate implicit in the lease is not readily determinable. Lease liabilities are measured at amortised cost using the effective interest method. After the commencement date, the amount of lease liabilities is increased by the interest costs on the lease liabilities and decreased by lease payments made.
The carrying amount of lease liabilities is remeasured when there is a change in the lease term, or there is a change in future lease payments arising from a change in an index or rate, or there is a change in the Group’s estimate of the amount expected to be payable under a residual guarantee, or there is a change arising from the reassessment of whether the Group will be reasonably certain to exercise an extension or a termination option. When the lease liability is remeasured, a corresponding adjustment is made to the carrying amount of the right-of-use asset, or is recorded in profit or loss if the carrying amount of right-of-use asset has been reduced to zero.
The Group has elected not to recognise right-of-use assets and lease liabilities for leases of low value assets (i.e. US$5,000 or less) and short-term leases. Low value assets comprised IT equipment and small items of office furniture. Short-term leases are leases with a lease term of 12 months or less. Lease payments associated with these leases are recognised on a straight-line basis as an expense in profit and loss over the lease term.
Lease liabilities are classified as non-current liabilities unless payments are within 12 months from the balance sheet date.
(ii) As a lessorThe Group enters into contracts with lease components as a lessor primarily on its investment properties. These leases are operating leases as they do not transfer the risk and rewards incidental to the underlying investment properties. The Group recognises the lease payments received under these operating leases on a straight line basis over the lease term as part of revenue in the profit and loss.
Investment propertiesProperties including those under operating leases which are held for long-term rental yields or capital gains are classified and accounted for as investment properties, but the business model does not necessarily envisage that the properties will be held for their entire useful life. Investment properties are carried at fair value, representing estimated open market value determined annually by independent qualified valuers who have recent experience in the location and category of the investment property being valued. The market value of commercial properties are calculated on the discounted net rental income allowing for reversionary potential. The market value of residential properties are arrived at by reference to market evidence of transaction prices for similar properties. Changes in fair value are recognised in profit and loss.
Bearer plantsBearer plants are stated at cost less any accumulated depreciation and impairment loss. The cost of bearer plants includes costs incurred for field preparation, planting, fertilising and maintenance, capitalisation of borrowing costs incurred on loans used to finance the development of immature bearer plants and an allocation of other indirect costs based on planted hectares. Bearer plants are considered mature three to four years after planting and once they are generating fresh fruit bunches which average four to six tonnes per hectare per year. Depreciation of mature bearer plants commences in the year when the bearer plants are mature using the straight-line method over the estimated useful life of 20 years. Agricultural produce growing on bearer plants comprise oil palm fruits which are measured at fair value. Changes in fair value are recorded in the profit and loss.
InvestmentsThe Group classifies its investments into the following measurement categories:
(i) Those to be measured subsequently at fair value, either through other comprehensive income or through profit and loss; and
(ii) Those to be measured at amortised cost.
The classification is based on the management’s business model and their contractual cash flows characteristics.
Equity investments are measured at fair value with fair value gains and losses recognised in profit and loss, unless management has elected to recognise the fair value gains and losses through other comprehensive income. For equity investments measured at fair value through other comprehensive income, gains or losses realised upon disposal are not reclassified to profit and loss.

Jardine Matheson Annual Report 2019
110 Notes to the Financial Statements
Debt investments that are held for collection of contractual cash flows and for sale, where the cash flows represent solely payments of principal and interest, are measured at fair value through other comprehensive income. On disposal, the cumulative gain or loss previously recognised in other comprehensive income is reclassified from equity to profit and loss.
Debt investments that are held for collection of contractual cash flows till maturity, where the cash flows represent solely payments of principal and interest, are measured at amortised cost. Any gain or loss arising on disposal is recognised in profit and loss.
At initial recognition, the Group measures an investment at its fair value plus, in the case of the investment not at fair value through profit or loss, transaction costs that are directly attributable to the acquisition of the investment. Transaction costs of investments carried at fair value through profit and loss are expensed in profit and loss.
Investments with embedded derivatives are considered in their entirety when determining whether their cash flows are solely payment of principal and interest.
The Group assesses on a forward-looking basis the expected credit losses associated with both types of debt investments. They are considered ‘credit impaired’ when one or more events that have a detrimental impact on the estimated future cash flows have occurred. Any impairment is recognised in profit and loss.
All purchases and sales of investments are recognised on the trade date, which is the date that the Group commits to purchase or sell the investments.
Investments are classified as non-current assets, unless in the case of debt investments with maturities less than 12 months after the balance sheet date, are classified as current assets.
Properties for saleProperties for sale, which comprise land and buildings held for resale, are stated at the lower of cost and net realisable value. The cost of properties for sale comprises land costs, construction and other development costs, and borrowing costs.
Stocks and work in progressStocks, which principally comprise goods held for resale, are stated at the lower of cost and net realisable value. Cost is determined by the first-in, first-out method, specific identification method and weighted average method. The cost of finished goods and work in progress comprises raw materials, labour and an appropriate proportion of overheads.
DebtorsFinancing and trade debtors are recognised initially at the amount of consideration that is unconditional and measured subsequently at amortised cost using the effective interest method. Finance lease receivables are shown as the finance lease receivables plus the guaranteed residual values at the end of the lease period, net of unearned finance lease income, security deposits and provision for doubtful receivables. A contract asset arises if the Group has a right to consideration in exchange for goods or services the Group has transferred to a customer, that is conditional on something other than the passage of time. Repossessed collateral of finance companies are measured at the lower of the carrying amount of the debtors in default and fair value less costs to sell. All other debtors, excluding derivative financial instruments, are measured at amortised cost except where the effect of discounting would be immaterial. The Group assesses on a forward-looking basis using the three stages expected credit losses model on potential losses associated with its consumer financing debtors and financing lease receivables. The impairment measurement is subject to whether there has been a significant increase in credit risk. For trade debtors and contract assets, the Group applied the simplified approach as permitted by IFRS 9, which requires expected lifetime losses to be recognised from initial recognition of the debtors. Provision for impairment is established by considering potential financial difficulties of the debtor, probability that the debtor will enter bankruptcy or financial reorganisation, and default or delinquency in payments. The carrying amount of the asset is reduced through the use of an allowance account and the amount of the loss is recognised in arriving at operating profit. When a debtor is uncollectible, it is written off against the allowance account. Subsequent recoveries of amount previously written off are credited to profit and loss.
Debtors with maturities greater than 12 months after the balance sheet date are classified under non-current assets.

Jardine Matheson Annual Report 2019
111Notes to the Financial Statements
Cash and cash equivalentsFor the purposes of the cash flow statement, cash and cash equivalents comprise deposits with banks and financial institutions, bank and cash balances, and liquid investments, net of bank overdrafts. In the balance sheet, bank overdrafts are included in current borrowings.
Liquid investments, which are readily convertible to known amounts of cash and which are subject to an insignificant risk of change in value, are included in bank balances and other liquid funds and are stated at market value. Increases or decreases in market value are recognised in profit and loss.
ProvisionsProvisions are recognised when the Group has present legal or constructive obligations as a result of past events, it is probable that an outflow of resources embodying economic benefits will be required to settle the obligations, and a reliable estimate of the amount of the obligations can be made.
Borrowings and borrowing costsBorrowings are initially recognised at fair value, net of transaction costs incurred. In subsequent periods, borrowings are stated at amortised cost using the effective interest method.
On the issue of bonds which are convertible into a fixed number of ordinary shares of the issuing entity, the fair value of the liability portion is determined using a market interest rate for an equivalent non-convertible bond; this amount is included in long-term borrowings on the amortised cost basis until extinguished on conversion or maturity of the bond. The remainder of the proceeds is allocated to the conversion option which is recognised and included in shareholders’ funds. On the issue of convertible bonds which are not convertible into the issuing entity’s own shares or which are not convertible into a fixed number of ordinary shares of the issuing entity, the fair value of the conversion option component is determined and included in current liabilities, and the residual amount is allocated to the carrying amount of the bond. Any conversion option component included in current liabilities is shown at fair value with changes in fair value recognised in profit and loss.
Borrowing costs relating to major development projects are capitalised until the asset is substantially completed. Capitalised borrowing costs are included as part of the cost of the asset. All other borrowing costs are expensed as incurred.
Borrowings are classified as current liabilities unless the Group has an unconditional right to defer settlement of the liability for at least 12 months after the balance sheet date.
Current and deferred taxThe tax expense for the year comprises current and deferred tax. Tax is recognised in profit and loss, except to the extent that it relates to items recognised in other comprehensive income or direct in equity. In this case, the tax is also recognised in other comprehensive income or directly in equity, respectively.
The current income tax charge is calculated on the basis of the tax laws enacted or substantively enacted at the balance sheet date in the countries where the Group operates and generates taxable income.
Management periodically evaluates positions taken in tax returns with respect to situations in which applicable tax regulation is subject to interpretation. It establishes provisions where appropriate on the basis of amounts expected to be paid to the tax authorities.
Deferred tax is provided, using the liability method, for all temporary differences arising between the tax bases of assets and liabilities and their carrying values. Deferred tax is determined using tax rates and laws that have been enacted or substantially enacted by the balance sheet date and are expected to apply when the related deferred tax asset is realised or the deferred tax liability is settled.
Provision for deferred tax is made on the revaluation of certain non-current assets and, in relation to acquisitions, on the difference between the fair value of the net assets acquired and their tax base. Deferred tax is provided on temporary differences associated with investments in subsidiaries, associates and joint ventures, except where the Group is able to control the reversal of the temporary difference and it is probable that the temporary difference will not reverse in the foreseeable future. Deferred tax assets relating to the carry forward of unused tax losses are recognised to the extent that it is probable that future taxable profit will be available against which the unused tax losses can be utilised.

Jardine Matheson Annual Report 2019
112 Notes to the Financial Statements
Employee benefits(i) Pension obligationsThe Group operates a number of defined benefit and defined contribution plans, the assets of which are held in trustee administered funds.
Pension accounting costs for defined benefit plans are assessed using the projected unit credit method. Under this method, the costs of providing pensions are charged to profit and loss spreading the regular cost over the service lives of employees in accordance with the advice of qualified actuaries, who carry out a full valuation of major plans every year. The pension obligations are measured as the present value of the estimated future cash outflows by reference to market yields on high quality corporate bonds which have terms to maturity approximating the terms of the related liability. Plan assets are measured at fair value.
Actuarial gains and losses arising from experience adjustments and changes in actuarial assumptions are recognised in other comprehensive income in the year in which they occur.
Past service costs are recognised immediately in profit and loss.
The Group’s total contributions relating to the defined contribution plans are charged to profit and loss in the year to which they relate.
(ii) Share-based compensationThe Company and its subsidiaries and associates operate a number of equity settled employee share option schemes. The fair value of the employee services received in exchange for the grant of the options in respect of options granted after 7th November 2002 is recognised as an expense. The total amount to be expensed over the vesting period is determined by reference to the fair value of the options granted as determined on the grant date. At each balance sheet date, the entity revises its estimates of the number of options that are expected to become exercisable. The impact of the revision of original estimates, if any, is recognised in profit and loss.
Derivative financial instrumentsThe Group only enters into derivative financial instruments in order to hedge underlying exposures and not as speculative investments. Derivative financial instruments are initially recognised at fair value on the date a derivative contract is entered into and are subsequently remeasured at their fair value. The method of recognising the resulting gain or loss is dependent on the nature of the item being hedged. The Group designates certain derivatives as a hedge of the fair value of a recognised asset or liability (‘fair value hedge’), or a hedge of a forecasted transaction or of the foreign currency risk on a firm commitment (‘cash flow hedge’), or a hedge of a net investment in a foreign entity.
At inception of the hedge relationship, the Group documents the economic relationship between hedging instruments and hedged items including whether changes in the cash flows of the hedging instruments are expected to offset changes in the cash flows of hedged items. The Group documents its risk management objective and strategy for undertaking its hedge transactions.
Changes in the fair value of derivatives that are designated and qualify as fair value hedges and that are highly effective, are recognised in profit and loss, along with any changes in the fair value of the hedged asset or liability that is attributable to the hedged risk. The gain or loss relating to the effective portion of interest rate swaps hedging fixed rate borrowings is recognised in profit and loss within finance costs, together with changes in the fair value of the hedged fixed rate borrowings attributable to interest rate risk. The gain or loss relating to the ineffective portion is recognised in profit and loss. When a hedging instrument expires or is sold, or when a hedge no longer meets the criteria for hedge accounting, the cumulative adjustment to the carrying amount of a hedged item for which the effective interest method is used is amortised to profit and loss over the residual period to maturity.
Changes in the fair value of derivatives that are designated and qualify as cash flow hedges and that are highly effective, are recognised in other comprehensive income and accumulated in equity under hedging reserves. Changes in the fair value relating to the ineffective portion is recognised immediately in profit and loss. Where the hedged item results in the recognition of a non-financial asset or of a non-financial liability, the deferred gains and losses are included in the initial

Jardine Matheson Annual Report 2019
113Notes to the Financial Statements
measurement of the cost of the asset or liability. The deferred amounts are ultimately recognised in profit and loss as the hedged item affects profit and loss. Otherwise, amounts deferred in hedging reserves are transferred to profit and loss in the same periods during which the hedged firm commitment or forecasted transaction affects profit and loss. The gain or loss relating to the effective portion of the interest rate swaps hedging variable rate borrowings is recognised in profit and loss within finance cost at the same time as the interest expense on the hedged borrowings. When a hedging instrument expires or is sold, or when a hedge no longer meets the criteria for hedge accounting, any cumulative gain or loss existing in hedging reserves at that time remains in the hedging reserves and is recognised when the committed or forecasted transaction ultimately is recognised in profit and loss. When a committed or forecasted transaction is no longer expected to occur, the cumulative gain or loss that was reported in hedging reserves is immediately transferred to profit and loss.
Certain derivative transactions, while providing effective economic hedges under the Group’s risk management policies, do not qualify for hedge accounting under the specific rules in IFRS 9. Changes in the fair value of any derivative instruments that do not qualify for hedge accounting under IFRS 9 are recognised immediately in profit and loss.
Hedges of net investments in foreign entities are accounted for on a similar basis to that used for cash flow hedges. Any gain or loss on the hedging instrument relating to the effective portion of the hedge is recognised in other comprehensive income and accumulated in exchange reserves; the gain or loss relating to the ineffective portion is recognised immediately in profit and loss.
The fair value of derivatives which are designated and qualify as effective hedges are classified as non-current assets or liabilities if the remaining maturities of the hedged assets or liabilities are greater than 12 months after the balance sheet date.
Insurance contractsInsurance contracts are those contracts that transfer significant insurance risk.
Premiums on insurance contracts are recognised as revenue proportionately over the period of coverage. The portion of premium received on in-force contracts that relates to unexpired risks at the balance sheet date is reported as the unearned premium liability. Claims and loss adjustment expenses are charged to profit and loss as incurred based on the estimated liabilities for compensation owed to contract holders or third parties damaged by the contract holders. They include direct and indirect claims settlement costs and arise from events that have occurred up to the balance sheet date even if they have not yet been reported to the Group. The Group does not discount its liabilities for unpaid claims. Liabilities for unpaid claims are estimated using the input of assessments for individual cases reported to the Group and statistical analyses for the claims incurred but not reported.
Financial guarantee contracts under which the Group accepts significant risk from a third party by agreeing to compensate that party on the occurrence of a specified uncertain future event are accounted for in a manner similar to insurance contracts. Provisions are recognised when it is probable that the Group has obligations under such guarantees and an outflow of resources embodying economic benefits will be required to settle the obligations.
Offsetting financial instrumentsFinancial assets and liabilities are offset and the net amount reported in the balance sheet when there is a legally enforceable right to offset the recognised amounts and there is an intention to settle on a net basis or realise the asset and settle the liability simultaneously. The legally enforceable right must not be contingent on future events and must be enforceable in the normal course of business and in the event of default, insolvency or bankruptcy of the company or the counterparty.
Non-trading itemsNon-trading items are separately identified to provide greater understanding of the Group’s underlying business performance. Items classified as non-trading items include fair value gains or losses on revaluation of investment properties and equity investments which are measured at fair value through profit and loss; gains and losses arising from the sale of businesses, investments and properties; impairment of non-depreciable intangible assets and other investments; provisions for the closure of businesses; acquisition-related costs in business combinations; and other credits and charges of a non-recurring nature that require inclusion in order to provide additional insight into underlying business performance.

Jardine Matheson Annual Report 2019
114 Notes to the Financial Statements
Earnings per shareBasic earnings per share are calculated on profit attributable to shareholders and on the weighted average number of shares in issue during the year. The weighted average number excludes the Company’s share of the shares held by subsidiaries. For the purpose of calculating diluted earnings per share, profit attributable to shareholders is adjusted for the effects of the conversion of dilutive potential ordinary shares of subsidiaries, associates or joint ventures, and the weighted average number of shares is adjusted for the number of shares which are deemed to be issued for no consideration under the Senior Executive Share Incentive Schemes based on the average share price during the year.
DividendsDividends proposed or declared after the balance sheet date are not recognised as a liability at the balance sheet date.
The nominal amount of the ordinary shares issued as a result of election for scrip is capitalised out of the share premium account or other reserves, as appropriate.
Revenue recognition(i) PropertyProperties for saleRevenue from properties for sale is recognised when or as the control of the property is transferred to the customer. Revenue consists of the fair value of the consideration received and receivable, net of value added tax, rebates and discounts. Proceeds received in advance for pre-sale are recorded as contract liabilities. Depending on the terms of the contract and the laws that apply to the contract, control of the property may transfer over time or at a point in time.
If control of the property transfers over time, revenue is recognised over the period of the contract by reference to the progress towards complete satisfaction of that performance obligation. Otherwise, revenue is recognised at a point in time when the customer obtains control of the property.
The progress towards complete satisfaction of the performance obligation is measured based on the Group’s efforts or inputs to the satisfaction of the performance obligation, by reference to the contract costs incurred up to the end of reporting period as a percentage of total estimated costs for each contract.
For properties for sale under development and sales contract for which the control of the property is transferred at a point in time, revenue is recognised when the customer obtains the physical possession or the legal title of the completed property and the Group has present right to payment and the collection of the consideration is probable.
Investment propertiesRental income from investment properties are accounted for on an accrual basis over the lease terms.
(ii) Motor vehiclesRevenue from the sale of motor vehicles, including motorcycles, and rendering of aftersales services, is recognised through dealership structures. In instances where the contracts with customers include multiple deliverables, the separate performance obligations are identified. The transaction price, which is represented by the consideration fixed in the contract and net of discounts if any, is then allocated to each performance obligation based on their relative stand-alone selling prices. When a stand-alone selling price is not directly observable, it is estimated. Revenue from the sale of motor vehicles is recognised when control of the motor vehicles is transferred to the customer, which generally coincides with the point of delivery. Revenue from the aftersales services is recognised when the services are rendered. In instances where payments are received in advance from customers but there are unfulfilled aftersales services obligations by the Group, a contract liability is recognised for which revenue is subsequently recognised over time as the services are rendered.
(iii) Retail and restaurantsRevenue from retail includes sales from the supermarket and hypermarkets, health and beauty stores, and home furnishing stores. Revenue consists of the fair value of goods sold to customers, net of returns, discounts and sales related taxes. Sale of goods is recognised at the point of sale, when the control of the asset is transferred to the customers, and is recorded at the net amount received from customers.
Revenue from restaurants comprises the sale of food and beverages and is recognised at the point when the Group sells the food and beverages to the customer and payment is due immediately when the customer purchases the food and beverages.

Jardine Matheson Annual Report 2019
115Notes to the Financial Statements
(iv) Financial servicesRevenue from consumer financing and finance leases is recognised over the term of the respective contracts based on a constant rate of return on the net investment, using the effective interest method. Revenue from insurance premiums is recognised proportionately over the period of coverage. The portion of premium received on in-force contracts that relates to unexpired risks at the balance sheet date is reported as the unearned premium liability.
(v) Engineering, heavy equipment, mining, construction and energyEngineeringRevenue from engineering, including supplying, installing and servicing engineering equipment is recognised over time based on the enforceable right to payment for the performance completed to date and using the output method on the basis of direct measurements of the value to customer of the Group’s performance to date, as evidenced by the certification by qualified architects and/or surveyors. When there is more than one single performance obligation under a contract or any contract modification creates a separate performance obligation, the revenue will be allocated to each performance obligation based on their relative stand-alone selling prices. Payments received in advance from customers but there are unfulfilled obligations, are recognised as contract liabilities.
Claims, variations and liquidated damages are accounted for as variable consideration and are included in contract revenue provided that it is highly probable that a significant reversal will not occur in the future.
Heavy equipmentRevenue from heavy equipment includes sale of heavy equipment and rendering of maintenance services. In instances where the contracts with customers include multiple deliverables, the separate performance obligations are identified and generally referred as sale of heavy equipment and rendering of maintenance services. The transaction price, which is represented by the consideration fixed in the contract and net of discounts if any, is then allocated to each performance obligation based on their relative stand-alone selling prices. Revenue from the sale of heavy equipment is recognised when control of the heavy equipment is transferred to the customer, which generally coincides with the point of delivery. Payments from customers for maintenance services are received in advance and recognised as a contract liability. Revenue from the maintenance services is recognised based on the actual service provided to the end of the reporting period as a proportion of the total services to be reported, as soon as it can be estimated reliably. The stage of completion is measured by reference to cost incurred to date compared to estimated total costs for each contract.
MiningRevenue from mining includes contract mining services and through the Group’s own production. The performance obligations identified under contract mining services relate to the extraction of mining products and removal of overburden on behalf of the customers. Revenue is recognised when the services are rendered by reference to the volume of mining products extracted and overburden removed at contracted rates, and payment is due upon delivery. Revenue from its own mining production is recognised when control of the output is transferred to the customer, which generally coincides with the point of delivery.
ConstructionRevenue from construction includes contracts to provide construction and foundation services for building, civil and maritime works. Under the contracts, the Group’s construction activities creates or enhances an asset or work in progress that the customer controls as the asset is created or enhanced, and hence revenue is recognised over time by reference to the progress towards completing the construction works. Under this method, the revenue recognised is based on the latest estimate of the total value of the contract and actual completion rate determined by reference to the physical state of progress of the works.
Claims, variations and liquidated damages are accounted for as variable consideration and are included in contract revenue provided that it is highly probable that a significant reversal will not occur in the future.

Jardine Matheson Annual Report 2019
116 Notes to the Financial Statements
(vi) HotelsRevenue from hotel ownership comprises amounts earned in respect of rental of rooms, food and beverage sales, and other ancillary services and goods supplied by the subsidiary hotels. Revenue is recognised over the period when rooms are occupied or services are performed. Revenue from the sale of food and beverages and goods is recognised at the point of sale when the food and beverages and goods are delivered to customers. Payment is due immediately when the hotel guest occupies the room and receives the services and goods.
Revenue from hotel and residences branding and management comprises gross fees earned from the branding and management of all the hotels and residences operated by the Group. Branding and management fees are recognised over time as determined by the relevant contract, taking into account the performance of the hotels, and the sales and operating expenses of the residences. Fees charged to the subsidiary hotels are eliminated upon consolidation. Hotels and residences are invoiced in accordance with the terms of contract and fees are payable when invoiced.
Pre-operating costsPre-operating costs are expensed as they are incurred.
41 Standards and Amendments Issued But Not Yet Effective‘Interest Rate Benchmark Reform: Amendments to IFRS 9, IAS 39 and IFRS 7’ (effective 1st January 2020) was issued in September 2019. The Group has elected to early adopt the amendments in 2019 (refer note 1). IFRS 17 ‘Insurance Contracts’ (effective from 1st January 2021) and a number of other new amendments, which are effective for accounting periods beginning after 2019, have also been published and will be adopted by the Group from their effective dates. IFRS 17 will only have an effect on the Group’s insurance companies in Indonesia. The Group is currently assessing the potential impact of IFRS 17 and the amendments but expects their adoption will not have a significant effect on the Group’s consolidated financial statements.

Jardine Matheson Annual Report 2019
117Notes to the Financial Statements
42 Financial Risk ManagementFinancial risk factorsThe Group’s activities expose it to a variety of financial risks: market risk (including foreign exchange risk, interest rate risk and price risk), credit risk and liquidity risk.
The Group’s treasury function co-ordinates, under the directions of the board of Jardine Matheson Limited, financial risk management policies and their implementation on a group-wide basis. The Group’s treasury policies are designed to manage the financial impact of fluctuations in interest rates and foreign exchange rates and to minimise the Group’s financial risks. The Group uses derivative financial instruments, principally interest rate swaps, caps and collars, cross-currency swaps, forward foreign exchange contracts, foreign currency options, and commodity forward contracts and options as appropriate for hedging transactions and managing the Group’s assets and liabilities in accordance with the Group’s financial risk management policies. Financial derivative contracts are executed between third party banks and the Group entity that is directly exposed to the risk being hedged. Hedge accounting is applied to remove the accounting mismatch between the hedging instrument and the hedged item. The effective portion of the change in the fair value of the hedging instrument is deferred into the cash flow hedge reserve through other comprehensive income and will be recognised in profit and loss when the hedged item affects profit and loss. In general, the volatility in profit or loss can be reduced by applying hedge accounting.
Hedge effectiveness is determined at the inception of the hedge relationship, and through periodic prospective effectiveness assessments to ensure that an economic relationship exists between the hedged item and hedging instrument.
For hedges of foreign currency purchases, the Group enters into hedge relationships where the critical terms of the hedging instrument match exactly with the terms of the hedged item. The Group assesses whether the derivative designated in each hedging relationship has been and expected to be effective in offsetting changes in cash flow of the hedged item using the hypothetical derivative method.
In hedges of foreign currency purchases, ineffectiveness may arise if the timing of the forecast transaction changes from what was originally estimated, or if there are changes in the credit risk of the Group or the derivative counterparty.
The Group enters into interest rate swaps and caps that have similar critical terms as the hedged item, such as reference rate, reset dates, payment dates, maturities and notional amount. The Group does not hedge 100% of its loans, therefore the hedged item is identified as a proportion of the outstanding loans up to the notional amount of the swaps. As all critical terms matched during the year, effective economic relationship existed between the swaps and the loans.
Hedge ineffectiveness for interest rate swaps is assessed using the same principles as for hedges of foreign currency purchases. It may occur due to: (i) the credit value/debit value adjustment on the interest rate swaps which is not matched by the loan; and (ii) differences in critical terms between the interest rate swaps and loans. The ineffectiveness during 2019 or 2018 in relation to interest rate swaps was not material.
(i) Market riskForeign exchange riskEntities within the Group are exposed to foreign exchange risk from future commercial transactions, net investments in foreign operations and net monetary assets and liabilities that are denominated in a currency that is not the entity’s functional currency.

Jardine Matheson Annual Report 2019
118 Notes to the Financial Statements
Entities in the Group use cross-currency swaps, forward foreign exchange contracts and foreign currency options in a consistent manner to hedge firm and anticipated foreign exchange commitments and manage their foreign exchange risk arising from future commercial transactions. The Group does not usually hedge its net investments in foreign operations except in circumstances where there is a material exposure arising from a currency that is anticipated to be volatile and the hedging is cost effective. Group entities are required to manage their foreign exchange risk against their functional currency. Foreign currency borrowings are swapped into the entity’s functional currency using cross-currency swaps except where the foreign currency borrowings are repaid with cash flows generated in the same foreign currency. The purpose of these hedges is to mitigate the impact of movements in foreign exchange rates on assets and liabilities and the profit and loss account of the Group.
Currency risks as defined by IFRS 7 arise on account of monetary assets and liabilities being denominated in a currency that is not the functional currency. At 31st December 2019 the Group’s Indonesian rupiah functional entities had United States dollar denominated net monetary liabilities of US$320 million (2018: net monetary assets of US$106 million). At 31st December 2019, if the United States dollar had strengthened/weakened by 10% against the Indonesian rupiah with all other variables unchanged, the Group’s profit after tax would have been US$24 million lower/higher (2018: US$8 million higher/lower), arising from foreign exchange gains/losses taken on translation. The impact on amounts attributable to the shareholders of the Company would be US$4 million lower/higher (2018: US$2 million higher/lower). This sensitivity analysis ignores any offsetting foreign exchange factors and has been determined assuming that the change in foreign exchange rates had occurred at the balance sheet date. The stated change represents management’s assessment of reasonably possible changes in foreign exchange rates over the period until the next annual balance sheet date. There are no other significant monetary balances held by Group companies at 31st December 2019 that are denominated in a non-functional currency. Differences resulting from the translation of financial statements into the Group’s presentation currency are not taken into consideration.
Since the Group manages the interdependencies between foreign exchange risk and interest rate risk of foreign currency borrowings using cross-currency swaps, the sensitivity analysis on financial impacts arising from cross-currency swaps is included in the sensitivity assessment on interest rates under the interest rate risk section.
Interest rate riskThe Group is exposed to interest rate risk through the impact of rate changes on interest bearing liabilities and assets. These exposures are managed partly by using natural hedges that arise from offsetting interest rate sensitive assets and liabilities, and partly through fixed rate borrowings and the use of derivative financial instruments such as interest rate swaps, caps and collars. The Group monitors interest rate exposure on a monthly basis by currency and business unit, taking into consideration proposed financing and hedging arrangements. The Group’s guideline is to maintain 40% to 60% of its gross borrowings, exclusive of the financial services companies, in fixed rate instruments. At 31st December 2019 the Group’s interest rate hedge exclusive of the financial services companies was 40% (2018: 39%), with an average tenor of six years (2018: six years). The financial services companies borrow predominately at a fixed rate. The interest rate profile of the Group’s borrowings after taking into account hedging transactions are set out in note 29.
Cash flow interest rate risk is the risk that changes in market interest rates will impact cash flows arising from variable rate financial instruments. Borrowings at floating rates therefore expose the Group to cash flow interest rate risk. The Group manages this risk by using forward rate agreements to a maturity of one year, and by entering into interest rate swaps, caps and collars for a maturity of up to five years. Forward rate agreements and interest rate swaps have the economic effect of converting borrowings from floating rate to fixed rate, caps provide protection against a rise in floating rates above a pre-determined rate, whilst collars combine the purchase of a cap and the sale of a floor to specify a range in which an interest rate will fluctuate.

Jardine Matheson Annual Report 2019
119Notes to the Financial Statements
Fair value interest rate risk is the risk that the value of a financial asset or liability and derivative financial instruments will fluctuate because of changes in market interest rates. The Group manages its fair value interest rate risk by entering into interest rate swaps which have the economic effect of converting borrowings from fixed rate to floating rate, to maintain the Group’s fixed rate instruments within the Group’s guideline.
At 31st December 2019, if interest rates had been 100 basis points higher/lower with all other variables held constant, the Group’s profit after tax would have been US$9 million (2018: US$5 million) lower/higher, and hedging reserves would have been US$99 million (2018: US$92 million) higher/lower as a result of fair value changes to cash flow hedges. The sensitivity analysis has been determined assuming that the change in interest rates had occurred at the balance sheet date and had been applied to the exposure to interest rate risk for both derivative and non-derivative financial instruments in existence at that date. There is no significant sensitivity resulting from interest rate caps and collars. The 100 basis point increase or decrease represents management’s assessment of a reasonably possible change in those interest rates which have the most impact on the Group, specifically the United States, Hong Kong and Indonesian rates, over the period until the next annual balance sheet date. In the case of effective fair value hedges, changes in the fair value of the hedged items caused by interest rate movements balance out in the profit and loss account against changes in the fair value of the hedging instruments. Changes in market interest rates affect the interest income or expense of non-derivative variable-interest financial instruments, the interest payments of which are not designated as hedged items of cash flow hedges against interest rate risks. As a consequence, they are included in the calculation of profit after tax sensitivities. Changes in the market interest rate of financial instruments that were designated as hedging instruments in a cash flow hedge to hedge payment fluctuations resulting from interest rate movements affect the hedging reserves and are therefore taken into consideration in the equity-related sensitivity calculations.
Price riskThe Group is exposed to securities price risk because of its equity investments which are measured at fair value through profit and loss and debt investments which are measured at fair value through other comprehensive income. Gains and losses arising from changes in the fair value of these investments are recognised in profit and loss or other comprehensive income according to their classification. The performance of these investments are monitored regularly, together with an assessment of their relevance to the Group’s long-term strategic plans. Details of these investments are contained in note 16.
The Group’s interest in these investments are unhedged. At 31st December 2019, if the price of these investments had been 25% higher/lower with all other variables held constant, total equity would have been US$687 million (2018: US$661 million) higher/lower, of which US$520 million (2018: US$526 million) relating to equity investments would be reflected in operating profit as non-trading items. The sensitivity analysis has been determined based on a reasonable expectation of possible valuation volatility over the next 12 months.
The Group is exposed to financial risks arising from changes in commodity prices, primarily coal, gold, steel rebar and copper. The Group considers the outlook for coal, gold, steel rebar and copper prices regularly in considering the need for active financial risk management. The Group’s policy is generally not to hedge commodity price risk, although limited hedging may be undertaken for strategic reasons. In such cases the Group uses forward contracts and foreign currency options to hedge the price risk. To mitigate or hedge the price risk, Group entities may enter into a forward contract and foreign currency options to buy the commodity at a fixed price at a future date, or a forward contract to sell the commodity at a fixed price or pre-determined range of prices at a future date.

Jardine Matheson Annual Report 2019
120 Notes to the Financial Statements
(ii) Credit riskThe Group’s credit risk is primarily attributable to deposits with banks, contractual cash flows of debt investments carried at amortised cost and those measured at fair value through other comprehensive income, credit exposures to customers and derivative financial instruments with a positive fair value. The Group has credit policies in place and the exposures to these credit risks are monitored on an ongoing basis.
The Group manages its deposits with banks and financial institutions and transactions involving derivative financial instruments by monitoring credit ratings and capital adequacy ratios of counterparties, and limiting the aggregate risk to any individual counterparty. The utilisation of credit limits is regularly monitored. Similarly transactions involving derivative financial instruments are with banks with sound credit ratings and capital adequacy ratios. In developing countries it may be necessary to deposit money with banks that have a lower credit rating, however the Group only enters into derivative transactions with counterparties which have credit ratings of at least investment grade. Management does not expect any counterparty to fail to meet its obligations.
The Group’s debt investments are considered to be low risk investments. The investments are monitored for credit deterioration based on credit ratings from major rating agencies.
In respect of credit exposures to customers, the Group has policies in place to ensure that sales on credit without collateral are made principally to corporate companies with an appropriate credit history and credit insurance is purchased for businesses where it is economically effective. The Group normally obtains collateral over vehicles from consumer financing debtors towards settlement of vehicle receivables. Customers give the right to the Group to sell the repossessed collateral or take any other action to settle the outstanding receivable. Sales to other customers are made in cash or by major credit cards.
The maximum exposure to credit risk is represented by the carrying amount of each financial asset in the balance sheet after deducting any impairment allowance.
(iii) Liquidity riskPrudent liquidity risk management includes managing the profile of debt maturities and funding sources, maintaining sufficient cash and marketable securities, and ensuring the availability of funding from an adequate amount of committed credit facilities and the ability to close out market positions. The Group’s ability to fund its existing and prospective debt requirements is managed by maintaining diversified funding sources with adequate committed funding lines from high quality lenders, and by monitoring rolling short-term forecasts of the Group’s cash and gross debt on the basis of expected cash flows. In addition long-term cash flows are projected to assist with the Group’s long-term debt financing plans.
At 31st December 2019, total available borrowing facilities amounted to US$25.3 billion (2018: US$26.4 billion) of which US$15.3 billion (2018: US$14.2 billion) was drawn down. Undrawn committed facilities, in the form of revolving credit and term loan facilities, and undrawn uncommitted facilities totalled US$6.7 billion (2018: US$8.0 billion) and US$3.3 billion (2018: US$4.2 billion), respectively.

Jardine Matheson Annual Report 2019
121Notes to the Financial Statements
The following table analyses the Group’s non-derivative financial liabilities, net-settled derivative financial liabilities and gross-settled derivative financial instruments into relevant maturity groupings based on the remaining period at the balance sheet date to the contractual maturity date. Derivative financial liabilities are included in the analysis if their contractual maturities are essential for an understanding of the timing of the cash flows. The amounts disclosed in the table are the contractual undiscounted cash flows.
Withinoneyear
Betweenone and
two years
Betweentwo and
three years
Betweenthree andfour years
Betweenfour and
five years
Beyond Total five undiscounted years cash flows
US$m US$m US$m US$m US$m US$m US$m
At 31st December 2019Borrowings 7,189 2,354 2,720 925 1,393 2,712 17,293Lease liabilities 1,069 868 644 483 356 1,617 5,037Creditors 8,197 88 65 22 31 38 8,441Net settled derivative
financial instruments 39 6 1 – – – 46Gross settled derivative
financial instruments– inflow 1,667 898 1,076 341 582 623 5,187– outflow 1,769 965 1,105 350 601 618 5,408Estimated losses on
insurance contracts 193 – – – – – 193
At 31st December 2018Borrowings 7,595 1,827 1,420 2,179 582 2,376 15,979Lease liabilities 1,035 870 679 512 383 1,730 5,209Creditors 8,617 107 59 22 22 40 8,867Gross settled derivative
financial instruments– inflow 3,814 699 680 899 252 1,052 7,396– outflow 3,819 721 687 886 239 1,053 7,405Estimated losses on
insurance contracts 178 – – – – – 178
Capital managementThe Group’s objectives when managing capital are to safeguard the Group’s ability to continue as a going concern whilst seeking to maximise benefits to shareholders and other stakeholders. Capital is equity as shown in the consolidated balance sheet plus net borrowings.
The Group actively and regularly reviews and manages its capital structure to ensure optimal capital structure and shareholder returns, taking into consideration the future capital requirements of the Group and capital efficiency, prevailing and projected profitability, projected operating cash flows, projected capital expenditures and projected strategic investment opportunities. In order to maintain or adjust the capital structure, the Group may adjust the amount of dividends paid to shareholders, purchase Group shares, return capital to shareholders, issue new shares or sell assets to reduce debt.
The Group monitors capital on the basis of the Group’s consolidated gearing ratio and consolidated interest cover before taking into account the impact of IFRS 16 ‘Leases’. The gearing ratio is calculated as net borrowings divided by total equity. Net borrowings is calculated as total borrowings less bank balances and other liquid funds. Interest cover is calculated as the sum of underlying operating profit, before the deduction of amortisation/depreciation of right-of-use assets, net of actual lease payments; and share of results of associates and joint ventures, divided by net financing charges excluding interest on lease liabilities. The ratios are monitored both inclusive and exclusive of the Group’s financial services companies, which by their nature are generally more highly leveraged than the Group’s other businesses. The Group does not have a defined gearing or interest cover benchmark or range.

Jardine Matheson Annual Report 2019
122 Notes to the Financial Statements
The ratios at 31st December 2019 and 2018 are as follows:
2019 2018
Gearing ratio exclusive of financial services companies (%) 7 10Gearing ratio inclusive of financial services companies (%) 12 16Interest cover exclusive of financial services companies (times) 12 15Interest cover inclusive of financial services companies (times) 14 17
Fair value estimation(i) Financial instruments that are measured at fair valueFor financial instruments that are measured at fair value in the balance sheet, the corresponding fair value measurements are disclosed by level of the following fair value measurement hierarchy:
(a) Quoted prices (unadjusted) in active markets for identical assets or liabilities (‘quoted prices in active markets’)The fair values of listed securities and bonds are based on quoted prices in active markets at the balance sheet date. The quoted market price used for listed investments held by the Group is the current bid price.
(b) Inputs other than quoted prices in active markets that are observable for the asset or liability, either directly or indirectly (‘observable current market transactions’)The fair values of derivative financial instruments are determined using rates quoted by the Group’s bankers at the balance sheet date. The rates for interest rate swaps and caps, cross-currency swaps and forward foreign exchange contracts are calculated by reference to market interest rates and foreign exchange rates.
The fair values of unlisted investments mainly include club and school debentures, are determined using prices quoted by brokers at the balance sheet date.
(c) Inputs for assets or liabilities that are not based on observable market data (‘unobservable inputs’)The fair values of other unlisted equity investments are determined using valuation techniques by reference to observable current market transactions (including price-to earnings and price-to book ratios of listed securities of entities engaged in similar industries) or the market prices of the underlying investments with certain degree of entity specific estimates or discounted cash flow by projecting the cash inflows from these investments.
There were no changes in valuation techniques during the year.

Jardine Matheson Annual Report 2019
123Notes to the Financial Statements
The table below analyses financial instruments carried at fair value, by the levels in the fair value measurement hierarchy:
Quoted prices in active
markets
Observable current market
transactionsUnobservable
inputs TotalUS$m US$m US$m US$m
2019AssetsOther investments– equity investments 1,667 52 361 2,080– debt investments 669 – – 669
2,336 52 361 2,749Derivative financial instruments at fair value– through other comprehensive income – 38 – 38– through profit and loss – 11 – 11
2,336 101 361 2,798
LiabilitiesContingent consideration payable – – (19) (19)Derivative financial instruments at fair value– through other comprehensive income – (140) – (140)– through profit and loss – (4) – (4)
– (144) (19) (163)
2018AssetsOther investments– equity investments 1,792 57 253 2,102– debt investments 540 – – 540
2,332 57 253 2,642Derivative financial instruments at fair value– through other comprehensive income – 183 – 183– through profit and loss – 6 – 6
2,332 246 253 2,831
LiabilitiesContingent consideration payable – – (10) (10)Derivative financial instruments at fair value– through other comprehensive income – (42) – (42)– through profit and loss – (10) – (10)
– (52) (10) (62)
There were no transfers among the three categories during the year ended 31st December 2019 and 2018.

Jardine Matheson Annual Report 2019
124 Notes to the Financial Statements
Movements of financial instruments which are valued based on unobservable inputs during the year ended 31st December are as follows:
Unlisted equity investments2019 2018US$m US$m
At 1st January 253 107Exchange differences 10 (13)Additions 112 163Disposals (16) –Net change in fair value during the year included in profit and loss 2 (4)
At 31st December 361 253
(ii) Financial instruments that are not measured at fair valueThe fair values of current debtors, bank balances and other liquid funds, current creditors and current borrowings are assumed to approximate their carrying amounts due to the short-term maturities of these assets and liabilities.
The fair values of long-term borrowings are based on market prices or are estimated using the expected future payments discounted at market interest rates.

Jardine Matheson Annual Report 2019
125Notes to the Financial Statements
Financial instruments by categoryThe fair values of financial assets and financial liabilities, together with carrying amounts at 31st December 2019 and 2018 are as follows:
Fair value of hedging
instruments
Fair value Fair value through through other profit and comprehensive loss income
Financial assets at
amortised costs
Other financial
liabilities
Total carrying amount
Fair value
US$m US$m US$m US$m US$m US$m US$m
2019Financial assets
measured at fair value
Other investments– equity investments – 2,080 – – – 2,080 2,080– debt investments – – 669 – – 669 669Derivative financial
instruments 49 – – – – 49 49
49 2,080 669 – – 2,798 2,798
Financial assets not measured at fair value
Debtors – – – 9,031 – 9,031 9,117Bank balances – – – 7,183 – 7,183 7,183
– – – 16,214 – 16,214 16,300
Financial liabilities measured at fair value
Derivative financial instruments (144) – – – – (144) (144)
Contingent consideration payable – (19) – – – (19) (19)
(144) (19) – – – (163) (163)
Financial liabilities not measured at fair value
Borrowings – – – – (15,263) (15,263) (15,451)Lease liabilities – – – – (4,162) (4,162) (4,162)Trade and other
payable excluding non-financial liabilities – – – – (8,422) (8,422) (8,422)
– – – – (27,847) (27,847) (28,035)

Jardine Matheson Annual Report 2019
126 Notes to the Financial Statements
Fair value of hedging
instruments
Fair value Fair value through through other profit and comprehensive loss income
Financial assets at
amortised costs
Other financial
liabilities
Total carrying amount
Fair value
US$m US$m US$m US$m US$m US$m US$m
2018Financial assets
measured at fair value
Other investments– equity investments – 2,102 – – – 2,102 2,102– debt investments – – 540 – – 540 540Derivative financial
instruments 189 – – – – 189 189
189 2,102 540 – – 2,831 2,831
Financial assets not measured at fair value
Debtors – – – 8,621 – 8,621 8,687Bank balances – – – 4,988 – 4,988 4,988
– – – 13,609 – 13,609 13,675
Financial liabilities measured at fair value
Derivative financial instruments (52) – – – – (52) (52)
Contingent consideration payable – (10) – – – (10) (10)
(52) (10) – – – (62) (62)
Financial liabilities not measured at fair value
Borrowings – – – – (14,193) (14,193) (14,376)Lease liabilities – – – – (4,418) (4,418) (4,418)Trade and other
payable excluding non-financial liabilities – – – – (8,857) (8,857) (8,857)
– – – – (27,468) (27,468) (27,651)

Jardine Matheson Annual Report 2019
127Notes to the Financial Statements
43 Critical Accounting Estimates and JudgementsEstimates and judgements used in preparing the financial statements are continually evaluated and are based on historical experience and other factors, including expectations of future events that are believed to be reasonable. Actual results may differ from these accounting estimates. The estimates and assumptions that have a significant effect on the reported amounts of assets and liabilities, and income and expenses are discussed below.
Acquisition of subsidiaries, associates and joint venturesThe initial accounting on the acquisition of subsidiaries, associates and joint ventures involves identifying and determining the fair values to be assigned to the identifiable assets, liabilities and contingent liabilities of the acquired entities. The fair values of franchise rights, concession rights, tangible assets, right-of-use assets, investment properties and bearer plants are determined by independent valuers by reference to market prices or present value of expected net cash flows from the assets. Any changes in the assumptions used and estimates made in determining the fair values, and management’s ability to measure reliably the contingent liabilities of the acquired entity will impact the carrying amount of these assets and liabilities.
On initial acquisition or acquisition of further interests in an entity, an assessment of the level of control or influence exercised by the Group is required. For entities where the Group has a shareholding of less than 50%, an assessment of the Group’s level of voting rights, board representation and other indicators of influence is performed to consider whether the Group has de facto control, requiring consolidation of that entity, or significant influence, requiring classification as an associate, or joint control, requiring classification as a joint venture.
Investment propertiesThe fair values of investment properties, which are principally held by Hongkong Land, are determined by independent valuers on an open market for existing-use basis calculated on the discounted net income allowing for reversionary potential. For investment properties in Hong Kong, the Chinese mainland and Singapore, capitalisation rates in the range of 2.75% to 3.50% for office (2018: 2.75% to 3.50%) and 3.75% to 5.00% for retail (2018: 3.75% to 5.00%) are used by Hongkong Land in the fair value determination.
Consideration has been given to assumptions that are mainly based on market conditions existing at the balance sheet date and appropriate capitalisation rates. These estimates are regularly compared to actual market data and actual transactions entered into by the Group.
Impairment of assetsThe Group tests annually whether goodwill and other assets that have indefinite useful lives suffered any impairment. Other assets are reviewed for impairment whenever events or changes in circumstances indicate that the carrying amount of the asset exceeds its recoverable amount. The recoverable amount of an asset or a cash-generating unit is determined based on the higher of its fair value less costs to sell and its value-in-use, calculated on the basis of management’s assumptions and estimates. Changing the key assumptions, including the amount of estimated coal and gold reserves, the discount rates or the growth rate assumptions in the cash flow projections, could materially affect the value-in-use calculations.
The results of the impairment reviews undertaken at 31st December 2019 on the Group’s indefinite life franchise rights indicated that no impairment charge was necessary. If there is a significant increase in the discount rate and/or a significant adverse change in the projected performance of the business to which these rights attach, it may be necessary to take an impairment charge to profit and loss in the future.
The loss allowances for financial assets are based on assumptions about risk of default and expected loss rates. The Group uses judgement in making these assumptions and selecting the inputs to the impairment calculation, based on the Group’s past history, existing market conditions as well as forward looking estimates at the balance sheet date (refer note 17).

Jardine Matheson Annual Report 2019
128 Notes to the Financial Statements
Income taxesThe Group is subject to income taxes in numerous jurisdictions. Significant judgement is required in determining the worldwide provision for income taxes. There are many transactions and calculations for which the ultimate tax determination is uncertain during the ordinary course of business. Where the final tax outcome of these matters is different from the amounts that were initially recorded, such differences will impact the income tax and deferred tax provisions in the period in which such determination is made.
Provision for deferred tax follows the way management expects to recover or settle the carrying amount of the related assets or liabilities, which the management may expect to recover through use, sale or combination of both. Accordingly, deferred tax will be calculated at income tax rate, capital gains tax rate or combination of both. There is a rebuttable presumption in International Financial Reporting Standards that investment properties measured at fair value are recovered through sale. Thus, deferred tax on revaluation of investment properties held by the Group are calculated at the capital gains tax rate.
Recognition of deferred tax assets, which principally relate to tax losses, depends on the management’s expectation of future taxable profit that will be available against which the tax losses can be utilised. The outcome of their actual utilisation may be different.
Pension obligationsThe present value of the pension obligations depends on a number of factors that are determined on an actuarial basis using a number of assumptions. The assumptions used in determining the net cost/income for pensions include the discount rate. Any changes in these assumptions will impact the carrying amount of pension obligations.
The Group determines the appropriate discount rate at the end of each year. This is the interest rate that should be used to determine the present value of estimated future cash outflows expected to be required to settle the pension obligations. In determining the appropriate discount rate, the Group considers the interest rates of high-quality corporate bonds that are denominated in the currency in which the benefits will be paid and that have terms to maturity approximating the terms of the related pension obligation.
Other key assumptions for pension obligations are based in part on current market conditions.
LeasesLiabilities and the corresponding right-of-use assets arising from leases are initially measured at the present value of the lease payments at the commencement date, discounted using the interest rates implicit in the leases, or if that rate cannot be readily determinable, the Group uses the incremental borrowing rate. The Group generally uses the incremental borrowing rate as the discount rate.
The Group applies the incremental borrowing rate with reference to the rate of interest that the Group would have to pay to borrow, over a similar term as that of the lease, the funds necessary to obtain an asset of a similar value to the right-of-use asset in the country where it is located.
Lease payments to be made during the lease term will be included in the measurement of a lease liability. The Group determines the lease term as the non-cancellable term of the lease, together with any periods covered by an option to extend the lease if it is reasonably certain to be exercised, or any period covered by an option to terminate the lease, if it is reasonably certain not to be exercised.
The Group has the option, under some of its leases to lease the assets for additional terms. The Group applies judgement in evaluating whether it is reasonably certain to exercise the option to renew. That is, the Group considers all relevant factors that create an economic incentive for it to exercise the renewal. After the commencement date, the Group reassesses the lease term if there is a significant event or change in circumstances that is within its control and affects its ability to exercise or not to exercise the option to renew. The assessment of whether the Group is reasonably certain to exercise the options impacts the lease terms, which significantly affects the amount of lease liabilities and right-of-use assets recognised.

Jardine Matheson Annual Report 2019
129Notes to the Financial Statements
Revenue recognitionThe Group uses the percentage of completion method to account for its contract revenue of certain development properties sales. The stage of completion is measured by reference to the contract costs incurred to date compared to the estimated total costs for the contract. Significant assumptions are required to estimate the total contract costs and the recoverable variation works that affect the stage of completion and the contract revenue respectively. In making these estimates, management has relied on past experience and the work of specialists.
For revenue from the heavy equipment maintenance contracts, the Group exercises judgement in determining the level of actual service provided to the end of the reporting period as a proportion of the total services to be reported, and estimated total costs of the maintenance contracts. When it is probable that total contract costs will exceed total contract revenue, the expected loss is immediately recognised as a current year expense.
For other contracts with customers which include multiple deliverables, the separate performance obligations are identified. The transaction price is then allocated to each performance obligation based on their stand-alone selling prices. From time to time, when a stand-alone selling price may not be directly observable, the Group estimated the selling price using expected costs of rendering such services and adding an appropriate margin.
Non-trading itemsThe Group uses underlying business performance in its internal financial reporting to distinguish between the underlying profits and non-trading items. The identification of non-trading items requires judgement by management, but follows the consistent methodology as set out in the Group’s accounting policies.
Jardine Matheson Annual Report 2019
130 Independent Auditors’ Report
To the members of Jardine Matheson Holdings Limited
Report on the audit of the Financial StatementsOpinionIn our opinion, Jardine Matheson Holdings Limited’s Group (“the Group”) financial statements (the “financial statements”):
• give a true and fair view of the state of the Group’s affairs as at 31st December 2019 and of its profit and cash flows for the year then ended;
• have been properly prepared in accordance with International Financial Reporting Standards (IFRSs) as issued by the International Accounting Standards Board (IASB); and
• have been prepared in accordance with the requirements of the Companies Act 1981 (Bermuda).
We have audited the financial statements, included within the Annual Report, which comprise: the Consolidated Balance Sheet as at 31st December 2019; the Consolidated Profit and Loss Account, the Consolidated Statement of Comprehensive Income, the Consolidated Cash Flow Statement, and the Consolidated Statement of Changes in Equity for the year then ended; and the Notes to the Financial Statements, which include the Principal Accounting Policies.
Certain required disclosures have been presented in the Corporate Governance section on page 141, rather than in the Notes to the Financial Statements. These disclosures are cross-referenced from the financial statements and are identified as audited.
Basis for opinionWe conducted our audit in accordance with International Standards on Auditing (UK) (“ISAs (UK)”) and applicable law. Our responsibilities under ISAs (UK) are further described in the Auditors’ responsibilities for the audit of the financial statements section of our report. We believe that the audit evidence we have obtained is sufficient and appropriate to provide a basis for our opinion.
IndependenceWe remained independent of the Group in accordance with the ethical requirements that are relevant to our audit of the financial statements in the UK, which includes the Financial Reporting Council’s (“FRC’s”) Ethical Standard as applicable to listed entities, and we have fulfilled our other ethical responsibilities in accordance with these requirements.
Our audit approachOverview
Materiality• Overall Group materiality: US$228.5 million (2018: US$262.5 million), based on 5% of consolidated profit before tax of
the Group’s largest subsidiary, Jardine Strategic Holdings Limited.• Specific Group materiality: US$225.0 million (2018: US$235.5 million), based on 5% of consolidated underlying profit
before tax of the Group’s largest subsidiary, Jardine Strategic Holdings Limited.
Audit scope• A full scope audit was performed on six entities – Jardine Cycle & Carriage Limited (which includes PT Astra International
Tbk), Hongkong Land Holdings Limited, Dairy Farm International Holdings Limited, Mandarin Oriental International Limited, Jardine Motors Group UK and Zung Fu Hong Kong.
• These entities, together with procedures performed on central functions and at the Group level, accounted for 87% of the Group’s revenue, 92% of the Group’s profit before tax, and 92% of the Group’s underlying profit before tax.
• A full scope audit of a joint venture, which accounted for a further 0.7% of the Group’s profit before tax and 0.9% of the Group’s underlying profit before tax, was also performed.
Key audit matters• Valuation of investment properties• Carrying value of investments in associates and joint ventures• Provisioning for consumer financing debtors• Right-of-use assets and lease liabilities

Jardine Matheson Annual Report 2019
131
The scope of our auditAs part of designing our audit, we determined materiality and assessed the risks of material misstatement in the financial statements. In particular, we looked at where the directors made subjective judgements, for example in respect of significant accounting estimates that involved making assumptions and considering future events that are inherently uncertain. As in all of our audits we also addressed the risk of management override of internal controls, including evaluating whether there was evidence of bias by the directors that represented a risk of material misstatement due to fraud.
Key audit mattersKey audit matters are those matters that, in the auditors’ professional judgement, were of most significance in the audit of the financial statements of the current period and include the most significant assessed risks of material misstatement (whether or not due to fraud) identified by the auditors, including those which had the greatest effect on: the overall audit strategy, the allocation of resources in the audit and directing the efforts of the engagement team. These matters, and any comments we make on the results of our procedures thereon, were addressed in the context of our audit of the financial statements as a whole, and in forming our opinion thereon, and we do not provide a separate opinion on these matters. This is not a complete list of all risks identified by our audit.
Key audit matter How our audit addressed the key audit matter
Valuation of investment propertiesRefer to note 43 (Critical Accounting Estimates and Judgements) and note 13 (Investment Properties) to the financial statements.
The fair value of the Group’s investment properties amounted to US$37,377 million at 31st December 2019, with a revaluation loss of US$832 million recognised as a non-trading item in the Consolidated Profit and Loss account for the year. The Group’s property portfolio principally consists of commercial properties.
The valuation of the Group’s investment property portfolio is inherently subjective due to, among other factors, the individual nature of each property, its location, prevailing market returns and the expected future rentals for that particular property.
The valuations were carried out by third party valuers (the ‘valuers’). In determining a property’s valuation, the valuers make assumptions, judgements and estimates in key areas. Valuations are principally derived using the income capitalisation method. Judgements are made in respect of capitalisation rates and market rents.
We focused on the valuation of investment properties due to the significant judgements and estimates involved in determining the valuations.
We assessed the valuers’ qualifications and their expertise, considering whether there were any matters that might have affected their objectivity or may have imposed scope limitations upon their work. We found no evidence to suggest that the objectivity of the valuers in their performance of the valuations was compromised.
Our work focused on the highest value properties in the portfolio, namely the buildings in the central business district of Hong Kong.
We read the valuation reports for the Hong Kong properties covering the majority of the total investment property portfolio to consider whether the valuation approach used was appropriate for each property and suitable for use in determining the carrying value. We performed testing, on a sample basis, of the input data used in the valuation process to satisfy ourselves of the accuracy of the property information supplied to the valuers by management, for example agreeing of lease terms to tenancy agreements and other supporting documents.
We understood and assessed the Group’s controls over data used in the valuation of the investment property portfolio and management’s review of the valuations.
The audit team, including our valuation specialists, attended meetings with the valuers at which the valuations and the key assumptions therein were discussed. We compared the capitalisation rates used by the valuers with an estimated range of expected yields, determined via reference to published benchmarks and market information. We evaluated year-on-year movements in capital values and rentals with reference to publicly available information and prevailing market rents. We evaluated whether assumptions were appropriate in light of the evidence provided by significant transactions that had taken place in relevant markets during the year.
We concluded that the assumptions used in the valuations were supportable in light of available evidence.
Independent Auditors’ Report

Jardine Matheson Annual Report 2019
132 Independent Auditors’ Report
Key audit matter How our audit addressed the key audit matter
Carrying value of investments in associates and joint venturesRefer to note 43 (Critical Accounting Estimates and Judgements) and note 15 (Associates and Joint Ventures) to the financial statements.
As at 31st December 2019, investments in associates and joint ventures totalled US$15,640 million.
Management undertook impairment assessments, as required by accounting standards, noting certain cash generating units (‘CGUs’) that were underperforming or loss making.
The determination of the recoverable amount of CGUs requires significant judgements by management in preparing their value in use models, particularly management’s view on key internal inputs and external market conditions which impact future cash flows, the discount rates and long term growth rates.
We have reviewed and understood management’s impairment assessment process, including the identification of indicators of impairment and appropriateness of the valuation models used. We assessed management’s determination of CGUs. Where we identified a risk of impairment we performed the following procedures.
With the support of our valuation specialists, we benchmarked and challenged key assumptions in management’s valuation models used to determine recoverable amounts, including assumptions of projected profits of businesses, long term growth rates and discount rates appropriate for the CGUs under review, using our knowledge and experience.
We tested the discounted cash flow models used by management in their assessments, checked the accuracy of the calculations, compared historical budgeted performance to actual results and agreed the financial information used to the detailed management approved budgets to assess the reasonableness of the cash flows used in the models.
Our challenge focused particularly on the discount rates and long term growth rates used. We compared the discount rates used to the range of typical discount rates used in similar businesses and considered whether management had incorporated all relevant macro-economic and country-specific factors, as well as those specific to those CGUs, in determining their discount rates.
For growth rates we compared each rate used to the range of growth rates used by similar businesses, considering whether management had considered macro-economic and country-specific factors specific to the relevant businesses. We also tested management’s historical estimation accuracy by comparing previous projected growth rates to the actual growth achieved. Where differences were noted we understood management’s rationale and the evidence, such as actual recent performance, to support management’s estimates.
We evaluated the sensitivity analysis performed by management and performed our own independent sensitivity analysis on the key assumptions above and considered a range of alternative outcomes to determine the sensitivity of the valuation models to changes in assumptions.
Where the recoverable amount was lower than the carrying amount of the CGU, we checked the calculation of the impairment charge recognised.
Based on the work performed, we found that the judgements made by management to determine the discount rates, long term growth rates and valuation models were reasonable.
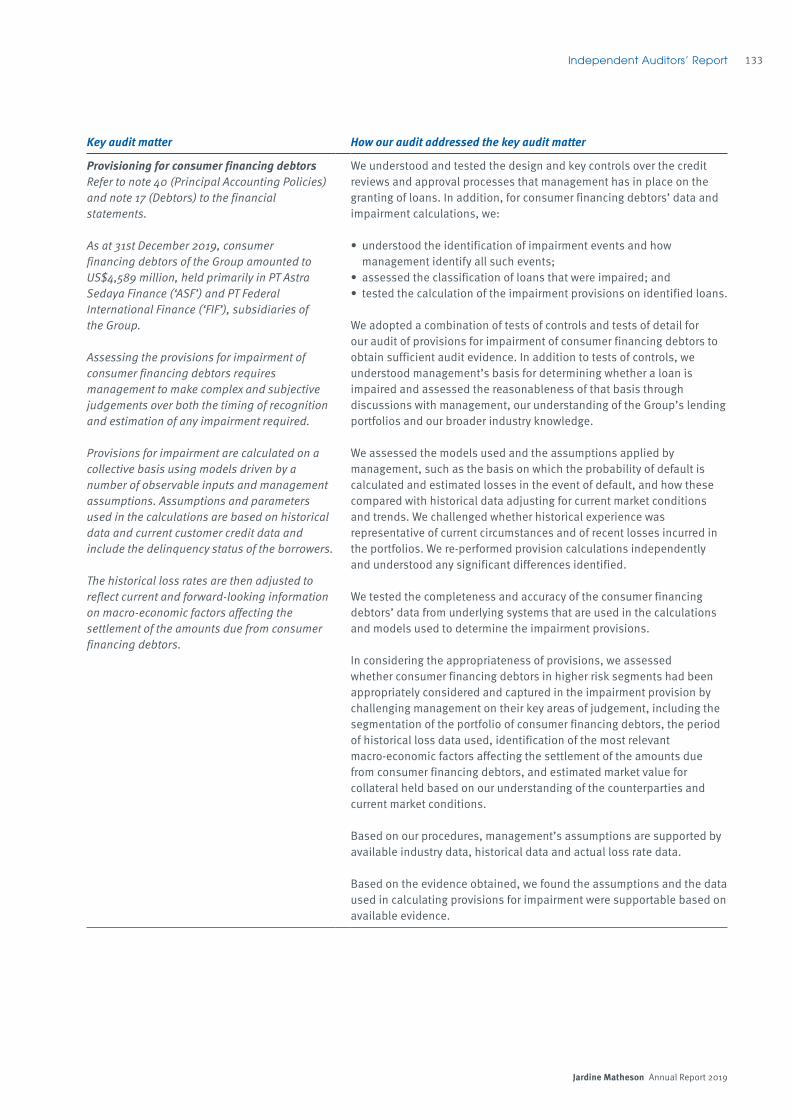
Jardine Matheson Annual Report 2019
133Independent Auditors’ Report
Key audit matter How our audit addressed the key audit matter
Provisioning for consumer financing debtorsRefer to note 40 (Principal Accounting Policies) and note 17 (Debtors) to the financial statements.
As at 31st December 2019, consumer financing debtors of the Group amounted to US$4,589 million, held primarily in PT Astra Sedaya Finance (‘ASF’) and PT Federal International Finance (‘FIF’), subsidiaries of the Group.
Assessing the provisions for impairment of consumer financing debtors requires management to make complex and subjective judgements over both the timing of recognition and estimation of any impairment required.
Provisions for impairment are calculated on a collective basis using models driven by a number of observable inputs and management assumptions. Assumptions and parameters used in the calculations are based on historical data and current customer credit data and include the delinquency status of the borrowers.
The historical loss rates are then adjusted to reflect current and forward-looking information on macro-economic factors affecting the settlement of the amounts due from consumer financing debtors.
We understood and tested the design and key controls over the credit reviews and approval processes that management has in place on the granting of loans. In addition, for consumer financing debtors’ data and impairment calculations, we:
• understood the identification of impairment events and how management identify all such events;
• assessed the classification of loans that were impaired; and• tested the calculation of the impairment provisions on identified loans.
We adopted a combination of tests of controls and tests of detail for our audit of provisions for impairment of consumer financing debtors to obtain sufficient audit evidence. In addition to tests of controls, we understood management’s basis for determining whether a loan is impaired and assessed the reasonableness of that basis through discussions with management, our understanding of the Group’s lending portfolios and our broader industry knowledge.
We assessed the models used and the assumptions applied by management, such as the basis on which the probability of default is calculated and estimated losses in the event of default, and how these compared with historical data adjusting for current market conditions and trends. We challenged whether historical experience was representative of current circumstances and of recent losses incurred in the portfolios. We re-performed provision calculations independently and understood any significant differences identified.
We tested the completeness and accuracy of the consumer financing debtors’ data from underlying systems that are used in the calculations and models used to determine the impairment provisions.
In considering the appropriateness of provisions, we assessed whether consumer financing debtors in higher risk segments had been appropriately considered and captured in the impairment provision by challenging management on their key areas of judgement, including the segmentation of the portfolio of consumer financing debtors, the period of historical loss data used, identification of the most relevant macro-economic factors affecting the settlement of the amounts due from consumer financing debtors, and estimated market value for collateral held based on our understanding of the counterparties and current market conditions.
Based on our procedures, management’s assumptions are supported by available industry data, historical data and actual loss rate data.
Based on the evidence obtained, we found the assumptions and the data used in calculating provisions for impairment were supportable based on available evidence.

Jardine Matheson Annual Report 2019
134 Independent Auditors’ Report
Key audit matter How our audit addressed the key audit matter
Right-of-use assets and lease liabilitiesRefer to note 40 (Principal Accounting Policies), note 12 (Right-of-use Assets) and note 30 (Lease Liabilities) to the financial statements.
The Group adopted IFRS 16 ‘Leases’ on 1st January 2019 using the retrospective approach and restated the 2018 comparative financial information. The Group has right-of-use assets of US$5,129 million and lease liabilities of US$4,162 million as at 31st December 2019.
Determining the value of right-of-use assets and lease liabilities requires management to make judgements over key estimates and assumptions, including the certainty of lease term renewals and determination of appropriate discount rates to be applied.
The Group has a significant number of leases with varying lease terms. IFRS 16 requires management to assess the underlying terms of each lease and to make assumptions to determine the appropriate lease term and discount rates which are applied in the lease calculation.
We assessed the completeness of the population of leases by determining the number and types of leases in each of the Group’s significant businesses and comparing these against those leases recorded in the Group’s lease management system.
On a sample basis, we agreed the completeness and accuracy of lease data that would impact right-of-use assets and lease liabilities valuations, to underlying lease contracts and from lease payments.
For a sample of leases, we independently recalculated the right-of-use assets and lease liabilities and compared our results with management’s calculations.
With the support of our valuations specialists, we assessed the discount rates used to calculate the lease liabilities and considered whether management had incorporated relevant duration and country-specific factors in determining their discount rates.
We challenged the key judgements and assumptions used by management. In particular, we evaluated whether management was reasonably certain to undertake renewal options and had appropriately accounted for the measurement of lease liabilities for renewal terms. We evaluated whether the assumptions on the lease terms were appropriate based on the evidence available.
Based on the work performed, we consider the key assumptions used, and calculations undertaken by management to determine right-of-use assets and lease liabilities as defined by IFRS 16 to be appropriate based on available evidence.

Jardine Matheson Annual Report 2019
135Independent Auditors’ Report
How we tailored the audit scopeJardine Matheson Holdings Limited is a holding company of a diversified group of businesses, some of which are separately listed.
We tailored the scope of our audit to ensure that we performed enough work to be able to give an opinion on the financial statements as a whole, taking into account the structure of the Group, the accounting processes and controls, and the industries in which it operates.
The Group’s accounting processes are structured around a finance function in each main business, which are responsible for their own accounting records and controls and which in turn report to a group finance function for that business. Each of the Group’s listed subsidiaries have in addition to their own group finance functions, corporate governance structures and public reporting requirements. These businesses report financial information to the Group’s finance function in Hong Kong to enable them to prepare consolidated financial statements.
In establishing the overall approach to the Group audit, we determined the type of work that needed to be performed by members of the Group engagement team or by component auditors from within the PwC Network operating under our instruction. Where the work was performed by component auditors, we determined the level of involvement we needed to have in the audit work at those components to be able to conclude whether sufficient, appropriate audit evidence had been obtained as a basis for our opinion on the financial statements as a whole. The Group engagement team was involved in the significant reporting entities in scope for Group reporting during the audit cycle through a combination of meetings, visits and conference calls. The lead Group audit partner and other senior team members undertook multiple visits to Hong Kong during the audit and were involved throughout the year in regular conference calls and other forms of communication to direct and oversee the audit. The lead Group audit partner and other senior team members visited a number of countries, including Indonesia, Singapore and Malaysia during the audit to review the work of component teams along with regular communication throughout the year.
For six entities – Jardine Cycle & Carriage Limited (which includes PT Astra International Tbk), Hongkong Land Holdings Limited, Dairy Farm International Holdings Limited, Mandarin Oriental International Limited and Jardine Motors Group UK and Zung Fu Hong Kong – a full scope audit of the complete financial information was performed. These entities, together with procedures performed on central functions and at the Group level (on the consolidation and other areas of significant judgement), accounted for 87% of the Group’s revenue, 92% of the Group’s profit before tax, and 92% of the Group’s underlying profit before tax. A full scope audit of the complete financial information of a joint venture, which accounted for a further 0.7% of the Group’s profit before tax and 0.9% of the Group’s underlying profit before tax, was also performed. This gave us the evidence we needed for our opinion on the financial statements as a whole.
MaterialityThe scope of our audit was influenced by our application of materiality. We set certain quantitative thresholds for materiality. These, together with qualitative considerations, helped us to determine the scope of our audit and the nature, timing and extent of our audit procedures on the individual financial statement line items and disclosures and in evaluating the effect of misstatements, both individually and in aggregate on the financial statements as a whole.
Based on our professional judgement, we determined materiality for the financial statements as a whole as follows:
Overall Group materiality US$228.5 million (2018: US$262.5 million)
How we determined it 5% of consolidated profit before tax of the Group’s largest subsidiary, Jardine Strategic Holdings Limited.
Rationale for benchmark applied Profit is the primary measure used by the shareholders in assessing the performance of the Group.
Jardine Matheson Annual Report 2019
136 Independent Auditors’ Report
We set a specific materiality level of US$225.0 million (2018: US$235.5 million) for those items affecting underlying profit before tax, which included all transactions and balances recorded in the consolidated financial statements that were not related to investment properties. This was based upon 5% of the Group’s largest subsidiary, Jardine Strategic Holdings Limited’s consolidated underlying profit before tax. In arriving at this judgement we had regard to the fact that underlying profit is an important financial indicator of the Group.
Overall Group materiality and specific Group materiality equates to 5% of the Group’s largest subsidiary, Jardine Strategic Holdings Limited’s consolidated profit before tax and consolidated underlying profit before tax respectively.
For each component in the scope of our Group audit, we allocated a materiality that is less than our overall Group materiality. The range of overall materiality allocated across components was US$3 million to US$200 million. The range of specific materiality allocated across components was US$3 million to US$127 million.
We agreed with the Audit Committee that we would report to them misstatements identified during our audit above US$10 million (2018: US$10 million), other than classifications within the Consolidated Profit and Loss Account or Consolidated Balance Sheet, which were only reported above US$228.5 million. We also reported misstatements below this amount that in our view, warranted reporting for qualitative reasons.
Conclusions relating to going concernISAs (UK) require us to report to you when the directors’ use of the going concern basis of accounting in the preparation of the financial statements is not appropriate; or the directors have not disclosed in the financial statements any identified material uncertainties that may cast significant doubt about the Group’s ability to continue to adopt the going concern basis of accounting for a period of at least twelve months from the date when the financial statements are authorised for issue. We have nothing to report in respect of the above matters.
However, because not all future events or conditions can be predicted, this statement is not a guarantee as to the Group’s ability to continue as a going concern. For example, the terms of the United Kingdom’s withdrawal from the European Union or the outcome of ongoing US and China trade relationships, are not clear, and it is therefore difficult to evaluate all of the potential implications.
Reporting on other informationThe other information comprises all of the information in the Annual Report other than the financial statements and our auditors’ report thereon. The directors are responsible for the other information. Our opinion on the financial statements does not cover the other information and, accordingly, we do not express an audit opinion or any form of assurance thereon.
In connection with our audit of the financial statements, our responsibility is to read the other information and, in doing so, consider whether the other information is materially inconsistent with the financial statements or our knowledge obtained in the audit, or otherwise appears to be materially misstated. If we identify an apparent material inconsistency or material misstatement, we are required to perform procedures to conclude whether there is a material misstatement of the financial statements or a material misstatement of the other information. If, based on the work we have performed, we conclude that there is a material misstatement of this other information, we are required to report that fact. We have nothing to report based on these responsibilities.
Responsibilities for the financial statements and the auditResponsibilities of the directors for the financial statementsAs explained more fully in the Responsibility Statement set out on page 139 and the Corporate Governance section set out on page 143, the directors are responsible for the preparation of the financial statements in accordance with the applicable framework and for being satisfied that they give a true and fair view. The directors are also responsible for such internal control as they determine is necessary to enable the preparation of financial statements that are free from material misstatement, whether due to fraud or error.
In preparing the financial statements, the directors are responsible for assessing the Group’s ability to continue as a going concern, disclosing as applicable, matters related to going concern and using the going concern basis of accounting unless the directors either intend to liquidate the Group or to cease operations, or have no realistic alternative but to do so.

Jardine Matheson Annual Report 2019
137Independent Auditors’ Report
Auditors’ responsibilities for the audit of the financial statementsOur objectives are to obtain reasonable assurance about whether the financial statements as a whole are free from material misstatement, whether due to fraud or error, and to issue an auditors’ report that includes our opinion. Reasonable assurance is a high level of assurance, but is not a guarantee that an audit conducted in accordance with ISAs (UK) will always detect a material misstatement when it exists. Misstatements can arise from fraud or error and are considered material if, individually or in the aggregate, they could reasonably be expected to influence the economic decisions of users taken on the basis of these financial statements.
A further description of our responsibilities for the audit of the financial statements is located on the FRC’s website at: www.frc.org.uk/auditorsresponsibilities. This description forms part of our auditors’ report.
Use of this reportThis report, including the opinions, has been prepared for and only for the Company’s members as a body in accordance with Section 90 of the Companies Act 1981 (Bermuda) and for no other purpose. We do not, in giving these opinions, accept or assume responsibility for any other purpose or to any other person to whom this report is shown or into whose hands it may come save where expressly agreed by our prior consent in writing.
The engagement partner responsible for this independent auditors’ report is John Baker.
PricewaterhouseCoopers LLPChartered AccountantsLondon5th March 2020
• The maintenance and integrity of the Jardine Matheson Holdings Limited website is the responsibility of the directors; the work carried out by the auditors does not involve consideration of these matters and, accordingly, the auditors accept no responsibility for any changes that may have occurred to the financial statements since they were initially presented on the website.
• Legislation in Bermuda governing the preparation and dissemination of financial statements may differ from legislation in other jurisdictions.

Jardine Matheson Annual Report 2019
138 Five Year Summary
Profit and Loss*
2019 2018 2017 2016 2015US$m US$m US$m US$m US$m
Revenue 40,922 42,527 38,748 37,051 37,007
Profit attributable to shareholders 2,838 1,722 3,943 2,503 1,799 Underlying profit attributable to
shareholders 1,589 1,655 1,543 1,386 1,360
Earnings per share (US$) 7.56 4.58 10.48 6.69 4.82 Underlying earnings per share (US$) 4.23 4.40 4.10 3.71 3.64 Dividends per share (US$) 1.72 1.70 1.60 1.50 1.45
Balance Sheet*
2019 2018 2017 2016 2015US$m US$m US$m US$m US$m
Total assets excluding right-of-use assets 91,899 84,699 82,633 71,176 66,581
Right-of-use assets 5,129 5,451 – – –Total assets 97,028 90,150 82,633 71,176 66,581
Total liabilities excluding total lease liabilities (27,795) (26,934) (24,865) (21,374) (21,081)
Total lease liabilities (4,162) (4,418) – – –Total liabilities (31,957) (31,352) (24,865) (21,374) (21,081)
Total equity 65,071 58,798 57,768 49,802 45,500
Shareholders’ funds 30,351 26,069 25,659 21,815 19,886
Net borrowings (excluding net borrowings of financial services companies) 4,786 5,913 3,403 2,087 2,972
Net asset value per share (US$) 81.90 69.19 68.19 58.19 53.30
Cash Flow*
2019 2018 2017 2016 2015US$m US$m US$m US$m US$m
Cash flows from operating activities 4,865 5,157 4,298 3,967 4,089 Cash flows from investing activities (700) (4,658) (3,975) (2,063) (3,200)
Net cash flow before financing 4,165 499 323 1,904 889
Net cash flow after principal elements of lease payments 3,149 (519) 323 1,904 889
Cash flow per share from operating activities (US$) 12.96 13.71 11.42 10.60 10.96
* Figures in 2018 have been restated due to changes in accounting policies upon adoption of IFRS 16 ‘Leases’. Figures in 2017 have been restated due to changes in accounting policies upon adoption of IFRS9 ‘Financial Instruments’ and IFRS15 ‘Revenue from Contracts with Customers’. Figures prior to 2016 have been restated due to a change in accounting policy upon adoption of the amendments to IAS 16 and IAS 41 ‘Agriculture: Bearer Plants’.

Jardine Matheson Annual Report 2019
139Responsibility Statement
The Directors of the Company confirm to the best of their knowledge that:
(a) the consolidated financial statements have been prepared in accordance with International Financial Reporting Standards, including International Accounting Standards and Interpretations adopted by the International Accounting Standards Board; and
(b) the sections of this Report, including the Chairman’s Statement and Managing Director’s Review and the Principal Risks and Uncertainties, which constitute the management report, include a fair review of all information required to be disclosed by the Disclosure Guidance and Transparency Rules 4.1.8 to 4.1.11 issued by the Financial Conduct Authority of the United Kingdom.
For and on behalf of the Board
Ben KeswickJohn WittDirectors
5th March 2020

Jardine Matheson Annual Report 2019
140
Jardine Matheson Holdings Limited (the ‘Company’) is incorporated in Bermuda. The majority of the Jardine Matheson Group’s (the ‘Group’) business interests are located in Greater China and Southeast Asia. The Company’s equity shares have a standard listing on the Main Market of the London Stock Exchange, and secondary listings in Singapore and Bermuda. The Company’s share capital is 58%-owned by Jardine Strategic Holdings Limited (‘Jardine Strategic’), a Bermuda incorporated 85%-owned subsidiary of the Company similarly listed in London, Singapore and Bermuda. The Disclosure Guidance and Transparency Rules (the ‘DTRs’) issued by the Financial Conduct Authority of the United Kingdom (the ‘FCA’) require that this Report address all relevant information about the corporate governance practices applied beyond the requirements under Bermuda law.
The Company attaches importance to the corporate stability that is fundamental to the Group’s ability to pursue a long-term strategy in its Asian markets. It is committed to high standards of governance based on its approach developed over many years.
The Management of the GroupThe Company is the parent company of the Jardine Matheson Group. Its management is therefore concerned both with the direct management of the Company’s own activities, and with the oversight of the operations of other listed companies within the wider Group.
The structural relationship between the Group companies is considered to be a key element to the Group’s success. By coordinating objectives, establishing common values and standards and sharing experience, contacts and business relationships, the Group aims to optimise opportunities across the Asian countries in which it operates. The Company’s system of governance is based on a well-tried approach to oversight and management, in which the individual subsidiaries and affiliates benefit from the Group’s strategic guidance and professional expertise, while at the same time ensuring that the independence of their boards is respected and clear operational accountability rests with their executive management teams.
The Directors have the full power to manage the business affairs of the Company, with the exception of matters reserved to be exercised by the Company in general meeting under Bermuda legislation or the Company’s Bye-laws. Among the matters on which the Board decides are the Group’s business strategy, its annual budget, dividends and major corporate activities.
Operational management is delegated to the appropriate level, and coordination with the Group’s listed subsidiaries is undertaken by the board of the Group management company, Jardine Matheson Limited (‘JML’). The JML board meets regularly in Hong Kong and is chaired by the Chairman and has six other members, whose names appear on page 148 of this Report, including JML’s Deputy Managing Director, Group Finance Director, Group Strategy Director, Group General Counsel and Group Digital Director.
The BoardAs at 5th March 2020, the Company currently has a Board of 14 Directors. Their names and brief biographies appear on page 27 of this Report. The Board composition and operation provide stability, allowing the Company to take a long-term view as it seeks to grow its business and pursue investment opportunities.
The Chairman’s role is to lead the Board as it oversees the Group’s strategic and financial direction. The role of Managing Director, with the support of the Deputy Managing Director, is to implement the strategy set by the Board and to manage the Group’s operations. Ben Keswick currently holds the positions of both Executive Chairman and Managing Director. As announced on 5th March 2020, with effect from 15th June 2020 Ben Keswick will step down as Managing Director and John Witt will take on the role of Managing Director. The Board considers that there is a clear division of responsibilities at board level to ensure an appropriate balance of power and authority.
The Board is scheduled to hold four meetings in 2020 and ad hoc procedures are adopted to deal with urgent matters which arise between scheduled meetings. In 2019 one meeting was held in Bermuda and three were held in Asia. The Board receives high quality, up to date information for each of its meetings. In addition, certain Directors who are not members of the board of JML and who are based outside Asia regularly visit Asia and Bermuda to discuss the Group’s business, as well as to participate in four annual Group strategic reviews which precede each of the regular Board meetings. These Directors are not directly involved in the operational management of the Group’s business activities, but their knowledge and close oversight of the Group’s affairs, as well as their knowledge and experience of the wider Group, reinforces the process by which business is reviewed before consideration at Board meetings.
Corporate Governance

Jardine Matheson Annual Report 2019
141
Directors’ Appointment, Retirement, Remuneration and Service ContractsCandidates for appointment as executive Directors of the Company or as executive directors of JML may be sourced internally or externally, including by using the services of specialist executive search firms. The aim is to appoint individuals who combine international best practice with familiarity with, or adaptability to, Asian markets. When appointing non-executive Directors, the Board pays particular attention to the Asian business experience and relationships that they can bring.
Each new Director is appointed by the Board and, in accordance with the Company’s Bye-laws, each new Director so appointed is subject to retirement and reappointment at the first annual general meeting after appointment. Thereafter, Directors are subject to retirement by rotation under the Bye-laws whereby one-third of the Directors retire at the annual general meeting each year. These provisions apply to both executive and non-executive Directors, but the requirement to retire by rotation does not extend to the Chairman or Managing Director.
Stuart Gulliver was appointed as a Director of the Company with effect from 1st January 2019. Simon Keswick retired from the Board on 1st January 2020. On 20th January 2020, it was announced that Lord Sassoon will retire from the Board on 9th April 2020. On 5th March 2020, it was announced that Graham Baker will join the Board with effect from 15th June 2020.
In accordance with Bye-law 84, David Hsu, Adam Keswick, Anthony Nightingale and John Witt will retire by rotation at the forthcoming Annual General Meeting and, being eligible, offer themselves for re-election. David Hsu, Adam Keswick and John Witt each have a service contract with a subsidiary of the Company that has a notice period of six months. Anthony Nightingale does not have a service contract with the Company or its subsidiaries.
The Company’s policy is to offer competitive remuneration packages to its senior executives. It is recognised that, due to the nature of the Group and its diverse geographic base, a number of its senior executives are required to be offered international terms and the nature of the remuneration packages is designed to reflect this. Executive Directors joining from outside the Group may be offered an initial fixed-term service contract to reflect any requirement for them to relocate.
Recommendations and decisions on remuneration and other benefits payable or made available to executive Directors result from consultations involving the Chairman and Managing Director and such other Directors as may be considered appropriate. Directors’ fees which are payable to the Chairman and all non-executive Directors are decided upon by shareholders in general meeting as provided for by the Company’s Bye-laws.
Certain Directors are discretionary objects under a trust created in 1947 (the ‘1947 Trust’) which holds 35,915,991 ordinary shares in the Company representing 4.90% of the Company’s issued share capital. Under the terms of the 1947 Trust, its income is to be distributed to senior executive officers and employees of the Company and its wholly-owned subsidiaries.
For the year ended 31st December 2019, the Directors received US$59.9 million (2018: US$70.0 million) in aggregate being distributions from the 1947 Trust of US$48.1 million (2018: US$57.5 million) and Directors’ fees and employee benefits from the Group of US$11.8 million (2018: US$12.5 million). Directors’ fees and employee benefits included US$0.4 million (2018: US$0.4 million) in Directors’ fees, US$9.4 million (2018: US$9.7 million) in short-term employee benefits including salary, bonuses, accommodation and deemed benefits in kind, US$1.0 million (2018: US$1.2 million) in post-employment benefits and US$1.0 million (2018: US$1.2 million) in share-based payments. The information set out in this paragraph forms part of the audited financial statements.
Share-based long-term incentive plans have also been established to provide incentives for executive Directors and senior managers. Share options are granted from time to time at the then prevailing market prices and they normally vest on or after the third anniversary of the date of grant. Grants may be made in a number of instalments. Share options are not granted to non-executive Directors.
The Company purchases insurance to cover its Directors against their costs in defending themselves in civil proceedings taken against them in that capacity and in respect of damages resulting from the unsuccessful defence of any proceedings. To the extent permitted by law, the Company also indemnifies its Directors. Neither the insurance nor the indemnity provides cover where the Director has acted fraudulently or dishonestly.
Corporate Governance
Jardine Matheson Annual Report 2019
142 Corporate Governance
Audit CommitteeThe Board has established an Audit Committee, the current members of which are Anthony Nightingale, Stuart Gulliver, Adam Keswick and Lord Sassoon; they have extensive knowledge of the Group but are not directly involved in operational management. Lord Sassoon is to retire as a member of the Audit Committee on 9th April 2020. The Company’s Chairman and Managing Director, Deputy Managing Director, Group Finance Director, Group Strategy Director and Group General Counsel, together with representatives of the internal and external auditors, also attend the Audit Committee meetings by invitation. The Audit Committee meets and reports to the Board semi-annually.
Prior to completion and announcement of the half-year and year-end results, a review of the Company’s financial information and any issues raised in connection with the preparation of the results, including the adoption of any new accounting policies, is undertaken by the Audit Committee with the executive management and a report is received from the external auditors. The external auditors also have access when necessary to the full Board and other senior executives, and to the boards of the Group’s operating companies.
The Audit Committee also keeps under review the nature, scope and results of the audits conducted by the internal audit function and the findings of the various Group audit committees. The Audit Committee’s responsibilities extend to reviewing the effectiveness of both the internal and the external audit functions; considering the independence and objectivity of the external auditors; and reviewing and approving the level and nature of non-audit work performed by the external auditors.
The terms of reference of the Audit Committee can be found on the Company’s website at www.jardines.com.
Risk Management and Internal ControlThe Board has overall responsibility for the Group’s systems of risk management and internal control. The Board has delegated to the Audit Committee responsibility for providing oversight in respect of risk management activities. The Audit Committee considers the Group’s principal risks and uncertainties and potential changes to the risk profile and reviews the operation and effectiveness of the Group’s systems of internal control and the procedures by which these risks are monitored and mitigated. The Audit Committee considers the systems and procedures on a regular basis, and reports to the Board semi-annually. The systems of internal control are designed to manage, rather than eliminate, business risk; to help safeguard the Group’s assets against fraud and other irregularities; and to give reasonable, but not absolute, assurance against material financial misstatement or loss.
Executive management oversees the implementation of the systems of internal control within the Group’s operating companies, the responsibility for which rests with each company’s board and its own executive management. The effectiveness of these systems is monitored by the internal audit function, which is independent of the operating companies, and by a series of audit committees or risk management and compliance committees that operate in each major business unit across the Group. The internal audit function also monitors the approach taken by the business units to risk. The findings of the internal audit function and recommendations for any corrective action required are reported to the relevant audit committee and, if appropriate, to the Audit Committee of the Company.
The Group has in place an organisational structure with defined lines of responsibility and delegation of authority. Across the Group there are established policies and procedures for financial planning and budgeting; for information and reporting systems; for assessment of risk; and for monitoring the Group’s operations and performance. The information systems in place are designed to ensure that the financial information reported is reliable and up to date.
The Company’s policy on commercial conduct underpins the Group’s internal control process, particularly in the area of compliance. The policy is set out in the Group’s Code of Conduct, which is a set of guidelines to which every employee must adhere and is reinforced and monitored by an annual compliance certification process.
The Audit Committee has also been given the responsibility to oversee the effectiveness of the formal procedures for employees to raise any matters of serious concern and is required to review any reports made under those procedures that are referred to it by the internal audit function.
The principal risks and uncertainties facing the Company are set out on page 146.

Jardine Matheson Annual Report 2019
143Corporate Governance
Directors’ Responsibilities in respect of the Financial StatementsThe Directors are required under the Bermuda Companies Act to prepare financial statements for each financial year and to present them annually to the Company’s shareholders at the annual general meeting. The financial statements are required to present fairly in accordance with International Financial Reporting Standards (‘IFRS’) the financial position of the Group at the end of the year and the results of its operations and its cash flows for the year then ended. The Directors consider that applicable accounting policies under IFRS, applied on a consistent basis and supported by prudent and reasonable judgments and estimates, have been followed in preparing the financial statements. The financial statements have been prepared on a going concern basis.
Code of ConductThe Group conducts business in a professional, ethical and even-handed manner. Its ethical standards are clearly set out in its Code of Conduct. The code requires that all Group companies comply with all laws of general application, all rules and regulations that are industry specific and proper standards of business conduct. The code prohibits the giving or receiving of illicit payments and requires that all managers must be fully aware of their obligations under the code and establish procedures to ensure compliance at all levels within their organisations.
The code also encourages inclusion and diversity, and requires all employees to be treated fairly, impartially and with dignity and respect. As a multinational Group with a broad range of businesses operating primarily across East Asia and Southeast Asia, although with further interests elsewhere in the world, the Group believes in promoting equal opportunities in recruiting, developing and rewarding its people regardless of race, gender, nationality, religion, sexual orientation, disability, age or background. The scale and breadth of the Group’s businesses necessitate that they seek the best people from the communities in which they operate most suited to their needs.
The Group has in place procedures by which employees can raise, in confidence, matters of serious concern in areas such as financial reporting or compliance.
Directors’ Share InterestsThe Directors of the Company in office on 5th March 2020 had interests (within the meaning of the EU Market Abuse Regulation (‘MAR’), which applies to the Company as it is listed on the London Stock Exchange) as set out below in the ordinary share capital of the Company. These interests included those notified to the Company in respect of the Directors’ closely associated persons (as that term is used under MAR).
Ben Keswick 44,617,600(a) (b)
Y.K. Pang 388,000Mark Greenberg 87,078David Hsu 108,012Adam Keswick 38,054,060(a) (b)
Anthony Nightingale 1,186,780Alex Newbigging 22,000Percy Weatherall 38,088,817(a) (b)
John Witt 100,806Notes:(a) Includes 1,750,004 ordinary shares held by a family trust, the trustees of which are closely associated persons of Ben Keswick, Adam Keswick and
Percy Weatherall.
(b) Includes 33,168,142 ordinary shares held by family trusts, the trustee of which is a closely associated person of Ben Keswick, Adam Keswick and Percy Weatherall.
In addition, Ben Keswick, Y.K. Pang, Mark Greenberg, David Hsu, Adam Keswick, Alex Newbigging, Jeremy Parr, Lord Sassoon and John Witt held options in respect of 190,000, 107,000, 90,000, 30,000, 50,000, 90,000, 50,000, 125,000 and 90,000 ordinary shares, respectively, issued pursuant to the Company’s share-based long-term incentive plans.

Jardine Matheson Annual Report 2019
144 Corporate Governance
Substantial ShareholdersAs a non-UK issuer, the Company is subject to the DTRs pursuant to which a person must in certain circumstances notify the Company of the percentage of voting rights attaching to the share capital of the Company that person holds. The obligation to notify arises if that person acquires or disposes of shares in the Company which results in the percentage of voting rights which the person holds reaching, exceeding, or falling below, 5%, 10%, 15%, 20%, 25%, 30%, 50% and 75%.
The Company has been informed of the holding of voting rights of 5% or more attaching to the Company’s issued ordinary share capital by Jardine Strategic and its subsidiary undertakings which are directly and indirectly interested in 426,938,290 ordinary shares carrying 58.27% of the voting rights. Apart from this interest and the interests disclosed under ‘Directors’ Share Interests’ above, the Company is not aware of any holders of voting rights of 5% or more attaching to the issued ordinary share capital of the Company as at 5th March 2020.
There were no contracts of significance with corporate substantial shareholders during the year under review.
Governance PrinciplesThe Company’s primary listing on the London Stock Exchange is a standard listing on the Main Market. Under a standard listing, the Company is subject to the UK Listing Rules (other than those which apply only to companies with a premium listing), the DTRs, the UK Prospectus Rules and MAR. The Company, therefore, is bound by the rules in relation to continuous disclosure, periodic financial reporting, disclosure of interests in shares and market abuse, including the rules governing insider dealing, market manipulation and the disclosure of inside information. The Company is also subject to regulatory oversight from the FCA, as the Company’s principal securities regulator, and is required to comply with the Admission and Disclosure Standards of the Main Market of the London Stock Exchange.
When shareholders approved the Company’s move to a standard listing from a premium listing in 2014, the Company stated that it intended to maintain certain governance principles on the same basis as was then applicable to the Company’s premium listing, as follows:
1. When assessing a significant transaction, being a larger transaction which would be classified as a class 1 transaction under the provisions of the UK Listing Rules, the Company will engage an independent financial adviser to provide a fairness opinion on the terms of the transaction.
2. In the event of a related party transaction, being a transaction with a related party which would require a sponsor to provide a fair and reasonable opinion under the provisions of the UK Listing Rules, the Company will engage an independent financial adviser to confirm that the terms of the transaction are fair and reasonable as far as the shareholders of the Company are concerned.
3. Further, as soon as the terms of a significant transaction or a related party transaction are agreed, an announcement will be issued by the Company providing such details of the transaction as are necessary for investors to evaluate the effect of the transaction on the Company.
4. At each annual general meeting, the Company will seek shareholder approval to issue new shares on a non-pre-emptive basis for up to 33% of the Company’s issued share capital, of which up to 5% can be issued for cash consideration.
5. The Company will continue to adhere to its Securities Dealing Rules. These rules, which were based on the UK Model Code, have since been revised to follow the provisions of MAR with respect to market abuse and disclosure of interests in shares.
6. The Company will continue its policies and practices in respect of risk management and internal controls.

Jardine Matheson Annual Report 2019
145Corporate Governance
Related Party TransactionsDetails of transactions with related parties entered into by the Company during the course of the year are included in note 37 to the financial statements on page 104.
Securities Purchase ArrangementsThe Directors have the power under the Bermuda Companies Act and the Company’s Memorandum of Association to purchase the Company’s shares. Any shares so purchased shall be treated as cancelled and, therefore, reduce the issued share capital of the Company. The Board considers on a regular basis the possibility for share repurchases or the acquisition of further shares in Group companies, including shares in Jardine Strategic. When doing so, it considers the potential for the enhancement of earnings or asset values per share. When purchasing such shares, the Company is subject to the provisions of MAR.
During the year the Company repurchased and cancelled 5,879,077 ordinary shares for an aggregate total cost of US$327.6 million. The ordinary shares, which were repurchased in the market, represented some 0.80% of the Company’s issued ordinary share capital.
Takeover CodeThe Company is subject to a Takeover Code, based on London’s City Code on Takeovers and Mergers. The Takeover Code provides an orderly framework within which takeovers can be conducted and the interests of shareholders protected. The Takeover Code has statutory backing, being established under the Acts of incorporation of the Company in Bermuda.
Annual General MeetingThe 2020 Annual General Meeting will be held on 7th May 2020. The full text of the resolutions and explanatory notes in respect of the meeting are contained in the Notice of Meeting which accompanies this Report. A corporate website is maintained containing a wide range of information of interest to investors at www.jardines.com.
Power to amend Bye-lawsThe Bye-laws of the Company can be amended by the shareholders by way of a special resolution at a general meeting of the Company.

Jardine Matheson Annual Report 2019
146 Principal Risks and Uncertainties
The Board has overall responsibility for risk management and internal control. The process by which the Group identifies and manages risk is set out in more detail on page 142 of the Corporate Governance section of this Report. The following are the principal risks and uncertainties facing the Company as required to be disclosed pursuant to the Disclosure Guidance and Transparency Rules issued by the Financial Conduct Authority of the United Kingdom and are in addition to the matters referred to in the Chairman’s Statement, Managing Director’s Review and other parts of the Annual Report.
Economic RiskMost of the Group’s businesses are exposed to the risk of negative developments in global and regional economies and financial markets, either directly or through the impact such developments might have on the Group’s joint venture partners, associates, franchisors, bankers, suppliers or customers. These developments could include recession, inflation, deflation, currency fluctuations, restrictions in the availability of credit, business failures, or increases in financing costs, oil prices or the cost of raw materials. Such developments might increase operating costs, reduce revenues, lower asset values or result in some or all of the Group’s businesses being unable to meet their strategic objectives.
Commercial Risk and Financial RiskRisks are an integral part of normal commercial activities, and where practicable steps are taken to mitigate them. Risks can be more pronounced when businesses are operating in volatile markets.
A number of the Group’s businesses make significant investment decisions in respect of developments or projects and these are subject to market risks. This is especially the case where projects are longer-term in nature and take more time to deliver returns.
The Group’s businesses operate in sectors and regions which are highly competitive and evolving rapidly, and failure to compete effectively, whether in terms of price, tender terms, product specification, application of new technologies or levels of service, can have an adverse effect on earnings or market share. Significant competitive pressure may also lead to reduced margins.
It is essential for the products and services provided by the Group’s businesses to meet appropriate quality and safety standards and there is an associated risk if they do not, including the risk of damage to brand equity or reputation, which might adversely impact the ability to achieve acceptable revenues and profit margins.
The potential impact on many of our businesses of disruption to IT systems or infrastructure, whether as a result of cyber-crime or other factors, could be significant. There is also an increasing risk to our businesses from adverse social media commentary, which could influence customer and other stakeholder behaviours and impact operations or profitability, or lead to reputational damage.
The steps taken by the Group to manage its exposure to financial risk are set out in the Financial Review on pages 25 to 26 and note 42 to the financial statements on pages 117 to 126.
Concessions, Franchises and Key ContractsA number of the Group’s businesses and projects are reliant on concessions, franchises, management, outsourcing or other key contracts. Cancellation, expiry or termination, or the renegotiation of any such concession, franchise, management, outsourcing or other key contracts, could have an adverse effect on the financial condition and results of operations of certain subsidiaries, associates and joint ventures of the Group.
Regulatory and Political RiskThe Group’s businesses are subject to a number of regulatory regimes in the territories in which they operate. Changes in such regimes, in relation to matters such as foreign ownership of assets and businesses, exchange controls, planning controls, emission regulations, tax rules and employment legislation, could have the potential to impact the operations and profitability of the Group’s businesses.
Changes in the political environment, including political or social unrest, in the territories where the Group operates could adversely affect the Group’s businesses.
Terrorism, Pandemic and Natural DisastersThe Group’s operations are vulnerable to the effects of terrorism, either directly through the impact of an act of terrorism or indirectly through the effect on the Group’s businesses of generally reduced economic activity in response to the threat, or an actual act, of terrorism.
The Group businesses could be impacted by a global or regional pandemic which seriously affects economic activity or the ability of businesses to operate smoothly. In addition, many of the territories in which the Group operates can experience from time to time natural disasters such as earthquakes and typhoons.

Jardine Matheson Annual Report 2019
147
Financial Calendar
2019 full-year results announced 5th March 2020Shares quoted ex-dividend 19th March 2020Share registers closed 23rd to 27th March 20202019 final dividend scrip election period closes 24th April 2020Annual General Meeting to be held 7th May 20202019 final dividend payable 13th May 20202020 half-year results to be announced 31st July 2020*Shares quoted ex-dividend 20th August 2020*Share registers to be closed 24th to 28th August 2020*2020 interim dividend scrip election period closes 25th September 2020*2020 interim dividend payable 14th October 2020*
*Subject to change
DividendsThe dividends will be available in cash with a scrip alternative. Shareholders will receive their cash dividends in United States Dollars, unless they are registered on the Jersey branch register, in which case they will have the option to elect for their dividends to be paid in Sterling. These shareholders may make new currency elections for the 2019 final dividend by notifying the United Kingdom transfer agent in writing by 24th April 2020. The Sterling equivalent of dividends declared in United States Dollars will be calculated by reference to a rate prevailing on 29th April 2020. Shareholders holding their shares through CREST in the United Kingdom will receive their cash dividends in Sterling only. Shareholders holding their shares through The Central Depository (Pte) Limited (‘CDP’) in Singapore will receive their cash dividends in United States Dollars unless they elect, through CDP, to receive Singapore Dollars.
Registrars and Transfer AgentShareholders should address all correspondence with regard to their shareholdings or dividends to the appropriate registrar or transfer agent.
Principal RegistrarJardine Matheson International Services LimitedP.O. Box HM 1068Hamilton HM EXBermuda
Jersey Branch RegistrarLink Market Services (Jersey) Limited 12 Castle StreetSt Helier, Jersey JE2 3RTChannel Islands
United Kingdom Transfer AgentLink Asset ServicesThe Registry34 Beckenham RoadBeckenhamKent BR3 4TU, United Kingdom
Singapore Branch RegistrarM & C Services Private Limited112 Robinson Road #05-01Singapore 068902
Press releases and other financial information can be accessed through the internet at www.jardines.com.
Shareholder Information

Jardine Matheson Annual Report 2019
148 Group Offices
Jardine Matheson Ltd 48th Floor, Jardine HouseG.P.O. Box 70Hong Kong
TelephoneEmailWebsite
(852) 2843 [email protected]
DirectorsBen Keswick, Chairman Y.K. Pang, Deputy Chairman Mark GreenbergDavid HsuAnne O’RiordanJeremy ParrJohn Witt
Group Corporate SecretaryJonathan Lloyd
Matheson & Co., Ltd 3 Lombard StreetLondon EC3V 9AQUnited Kingdom
TelephoneEmailWebsite
(44 20) 7816 [email protected] Keswick
Jardine Pacific Ltd 48th Floor, Jardine HouseG.P.O. Box 70Hong Kong
TelephoneEmail
(852) 2843 [email protected] Cheung
Jardine Motors Group Ltd 25th Floor, Devon HouseTaikoo Place979 King’s RoadQuarry BayHong Kong
TelephoneEmail
(852) 2579 [email protected] Newbigging
Hongkong Land Ltd 8th FloorOne Exchange SquareCentralHong Kong
TelephoneEmailWebsite
(852) 2842 [email protected] Wong
Dairy Farm Management Services Ltd 11th Floor, Devon HouseTaikoo Place979 King’s RoadQuarry BayHong Kong
TelephoneEmailWebsite
(852) 2299 [email protected] McLeod
Mandarin Oriental Hotel GroupInternational Ltd
8th Floor, One Island East Taikoo Place18 Westlands RoadQuarry BayHong Kong
TelephoneEmailWebsite
(852) 2895 [email protected] Riley
Jardine Cycle & Carriage Ltd 239 Alexandra RoadSingapore 159930
TelephoneEmailWebsite
(65) 6473 [email protected] Birks
PT Astra International Tbk Menara Astra 59th FloorJln. Jend. Sudirman Kav. 5-6 Jakarta 10220Indonesia
TelephoneEmailWebsite
(62 21) 508 43 [email protected] Sugiarto

BermudaJardine Matheson International Services Ltd
4th Floor, Jardine House33-35 Reid StreetHamilton HM 12
P.O. Box HM 1068Hamilton HM EX
Telephone (1 441) 292 0515Philip Barnes
Cambodia Jardine Matheson Ltd(Representative Office)
7th Floor, Exchange SquareNo. 19 & 20 Street 106Sangkat Wat PhnomKhan Daun Penh Phnom Penh 12202
Telephone (855 23) 986 804Peter Beynon
Hong Kong SAR, ChinaJardine Matheson Ltd
48th Floor, Jardine HouseG.P.O. Box 70Hong Kong
Telephone (852) 2843 8288Ben Keswick
Chinese mainlandJardine Matheson (China) Ltd(Representative Office)
Rm 3702China World Office 1China World Trade CentreNo. 1 Jianguomenwai AvenueChaoyang DistrictBeijing 100004
Telephone (86 10) 6505 2801David Hsu
MalaysiaJardine Matheson (Malaysia) Sdn Bhd
Suite 7.01, Level 7 Wisma E&CNo. 2 Lorong Dungun KiriBukit Damansara50490 Kuala Lumpur
Telephone (60 3) 2094 2168Rossana Annizah Binti Ahmad Rashid
Myanmar Jardine Matheson Management (SEA) Pte. Ltd
No. 1/4 Parami Road, Level 2Hlaing Township Yangon
Telephone (95 1) 654 854 Peter Beynon
NetherlandsJardine Matheson Europe B.V.
Atrium BuildingStrawinskylaan 30071077 ZX Amsterdam
Telephone (31 20) 470 0258Pim Bertels
PhilippinesJardine Matheson Ltd(Representative Office)
c/o Hongkong LandRoom 1803 The Taipan PlaceF. Ortigas Jr. RoadOrtigas CenterPasig City 1605
Telephone (63 2) 737 36348A.B. Colayco
SingaporeJardine Matheson (Singapore) Ltd
239 Alexandra RoadSingapore 159930
Telephone (65) 6220 5111Benjamin Birks
Taiwan, ChinaJardine Matheson Ltd(Representative Office)
3rd Floor, No.1, Zhong Zheng RoadXinZhuang DistrictNew Taipei City 24243
Telephone (886 2) 8069 9005David Hsu
ThailandJardine Matheson (Thailand) Ltd
16th-17th Floor, SPE Tower252 Phaholyothin Road, SamsennaiPhayathai Bangkok 10400
Telephone (66) 2 079 5965Subhak Siwaraksa
United KingdomMatheson & Co., Ltd
3 Lombard StreetLondon EC3V 9AQ
Telephone (44 20) 7816 8100Adam Keswick
VietnamJardine Matheson Ltd
5th Floor, CJ Building6 Le Thanh Ton StreetDistrict 1, Ho Chi Minh City
Telephone (84 28) 3822 2340Alain Cany
