japan and the world 2018/19 - kkc
TRANSCRIPT


Japan and the World 2018/19A Pocket Guide in Figures
Japan and the World 2018/19A Pocket Guide in Figures
Published by Keizai Koho Center(Japan Institute for Social and Economic Affairs)
Keidanren Kaikan 19F, 1-3-2 Otemachi,Chiyoda-ku, Tokyo 100-0004 Japan
Data researched and compiled byHiroto Arita, Hidekazu Mori,
Chikako Yoshioka and Rie Sakagoshi.
Copyright © Keizai Koho CenterAll rights reserved. No part of this publication may be reproduced
without the prior permission of the publisher.
The majority of the statistics contained in this data book are taken directly from published sources and reformatted by Keizai Koho Center.
Consequently, neither Keizai Koho Center nor the compilers endorse the validity of the original data.
Although the greatest care has been taken in compiling this book, any errors will be corrected and posted on Keizai Koho Center’s website.
http://en.kkc.or.jp/
Printed in Japan by Hikari Photo Printing Co., Ltd.

CONTENTS
Economic and Financial IndicatorsChapter 11-1 GDP (Gross Domestic Product) 2-3 国内総生産1-2 GDP Growth Rates 4-5 GDP成長率1-3 GDP Per Capita 6-7 一人当たり GDP
1-4 GDP Composition by Industries 8-9 産業別 GDP構成比1-5 GDP Composition by Expenditures 10-11 支出要素別 GDP構成比1-6 Gross National Income 12 国民総所得
1-7 Exchange Rates 13 為替レート1-8 Stock Prices and Indices 14-15 株価・株価指数1-9 Long-term Interest Rates 16-17 長期金利1-10 Industrial Production Index 18-19 鉱工業生産指数1-11 Consumer Price Indices (All Items) 20-21 消費者物価指数(総合)1-12 Household and NPISHs Final Consumption Expenditure 22-23 家計最終消費支出1-13 Crude Oil Price 24 原油価格(Editor's choice)Electric Cars: New Sales Ranking 25 電気自動車販売台数ランキング

Populations and Labor MarketsChapter 22-1 Population 26-27 人口2-2 Population (Ages 15-64) 28-29 人口(15-64歳)2-3 Population (Ages 65 and Older) 30-31 人口(65歳以上)2-4 Total Fertility Rate 32-33 合計特殊出生率2-5 Unemployment Rate 34-35 失業率
2-6 Employment Rate by Age and Gender 36 年齢・性別雇用率2-7 Part-time Employment Rate by Age and Gender 37 年齢・性別短時間雇用率2-8 Labor Productivity 38-39 労働生産性2-9 Foreign Workers in Japan 40-41 外国人労働者数

Trade and InvestmentChapter 33-1 Current Account Balance 42-43 経常収支3-2 Trade Balance (Japan) 44-45 貿易収支(日本)3-3 Japan's Major Trading Partners 46-47 日本の主な貿易相手国3-4 Trade Balance (U.S.) 48 貿易収支(米国)3-5 Trade Balance (China) 49 貿易収支(中国)3-6 Trade Balance (Germany) 50 貿易収支(ドイツ)3-7 Trade Balance (U.K.) 51 貿易収支(イギリス)3-8 Trade Balance (South Korea) 52 貿易収支(韓国)3-9 Trade and Investment (U.S.-Japan-China) 53 日米中の貿易・投資3-10 Outward Foreign Direct Investment (FDI) (Stock) 54-55 対外直接投資残高3-11 Outward FDI (Flow) 56-57 対外直接投資フロー
3-12 Inward FDI (Stock) 58-59 対内直接投資残高3-13 Inward FDI (Flow) 60-61 対内直接投資フロー3-14 FDI (Japan) (Flow) 62-63 直接投資フロー(日本)3-15 FDI (Japan) (Stock) 64-65 直接投資残高(日本)3-16 FDI (U.S.) 66-67 直接投資(米国)3-17 FDI (China) 68-69 直接投資(中国)3-18 FDI (ASEAN) 70-71 直接投資(ASEAN)3-19 FDI (EU) 72-73 直接投資(EU)3-20 Outbound M&A 74 対外M&A
3-21 Inbound M&A 75 対内M&A
3-22 Employment and Exports by Foreign Affiliated Companies in the U.S. 76 在米外資系企業の雇用と輸出額(Editor's choice)Global Competitiveness Index 4.0 77 世界競争力ランキング
Education and People ExchangeChapter 44-1 Inbound Tourism 78-79 外国人訪問者数4-2 Foreign Visitors to Japan 80-81 訪日外客数4-3 Travel Spending by Foreign Travelers in Japan 82-83 訪日外国人旅行消費額4-4 Outbound Tourism 84-85 外国旅行者数4-5 Japanese Outbound Travelers 86-87 日本人出国者数
4-6 Foreign Students by Destination 88 各国の留学生受入れ数4-7 Students Studying Abroad 89 各国の海外留学生数4-8 Foreign Students in Japan 90-91 日本への留学生4-9 Overseas Japanese in Higher Education Institutions 92-93 海外高等教育機関への日本人留学生4-10 University Rankings 94 大学ランキング4-11 TOEFL Scores 95 国別TOEFLスコア

Government Budget, Tax and Other DataChapter 55-1 General Government Spending to GDP 96-97 一般政府支出(対 GDP比)5-2 Government Budget Balance to GDP 98-99 財政収支(対 GDP比)5-3 Tax Revenue Structure 100 税収構成比5-4 Effective Corporate Tax Rates 101 法人実効税率5-5 Top Marginal Personal Income Tax Rates 102 所得税最高税率5-6 Value-Added Tax Rates 103 付加価値税率
5-7 National Burden Ratio 104 国民負担率5-8 Gross Domestic Expenditure on R&D by Source 105 各国の研究開発投資(拠出元別)5-9 Foreign Exchange Reserves 106-107 外貨準備高5-10 Military Expenditure 108-109 軍事支出5-11 ODA (Official Development Assistance) 110-111 ODA純支出額5-12 Land Area 112 国土面積
Japan and the World2018/19
Japan and the World2018/19
A Pocket Guide in Figures
Chapter 1 Economic and Financial IndicatorsChapter 2 Population and Labor MarketsChapter 3 Trade and InvestmentChapter 4 Education and People ExchangeChapter 5 Government Budget, Tax and Other Data

3Economic and Financial IndicatorsChapter 1
509
492
499
494 494
507518
534
539549
460470480490500510520530540550560
2009 2011 2013 2015 2017
(Billion USD)Nominal GDP (in USD)
*EstimateSource: IMF http://www.imf.org/external/datamapper/NGDPD@WEO/WEOWORLD
Source: Cabinet Officehttp://www.esri.cao.go.jp/jp/sna/data/data_list/sokuhou/files/2018/toukei_2018.html
Japan's Nominal GDP (in JPY)
(Trillion JPY)2008 2009 2010 2011 2012 2013 2014 2015 2016 2017
1 U.S. 14,719 14,419 14,964 15,518 16,155 16,692 17,428 18,121 18,624 19,391
2 China 4,604 5,122 6,066 7,522 8,570 9,635 10,535 11,226 11,222 12,015
3Japan(% of Global GDP)
5,038 (7.9%)
5,231 (8.7%)
5,700 (8.6%)
6,157 (8.4%)
6,203 (8.3%)
5,156 (6.7%)
4,850 (6.2%)
4,395 (5.9%)
4,949 (6.6%)
4,872 (6.1%)
4 Germany 3,770 3,427 3,423 3,761 3,546 3,754 3,897 3,377 3,479 3,685
5 U.K. 2,921 2,391 2,444 2,621 2,663 2,742 3,024 2,886 2,661 2,625
6 India 1,224 1,365 1,708 1,823 1,828 1,857 2,039 2,102 2,274 2,611
7 France 2,937 2,701 2,652 2,865 2,683 2,809 2,854 2,435 2,466 2,584
8 Brazil 1,695 1,668 2,208 2,614 2,464 2,471 2,456 1,800 1,793 2,055
9 Italy 2,402 2,191 2,129 2,278 2,074 2,131 2,155 1,834 1,860 *1,938
10 Canada 1,549 1,371 1,613 1,789 1,824 1,843 1,799 1,560 1,536 *1,652
11 S. Korea 1,002 902 1,094 1,202 1,223 1,306 1,411 1,383 1,411 1,538
World Total 63,722 60,337 65,960 73,165 74,535 76,596 78,663 74,429 75,485 79,865
2Economic and Financial IndicatorsChapter 1
GDP (Gross Domestic Product)1-1 国内総生産
0
2,000
4,000
6,000
8,000
10,000
12,000
14,000
16,000
18,000
20,000
2008 2009 2010 2011 2012 2013 2014 2015 2016 2017
U.S.
China
Japan
Germany
U.K.
South Korea
Source: IMF http://www.imf.org/external/datamapper/NGDPD@WEO/WEOWORLD
(Billion USD) Nominal GDP (in USD)

5Economic and Financial IndicatorsChapter 1
-2.1
-6.0
2.2
-1.8
0.7 1.7
2.1 3.5
1.2
1.5
-8.0
-6.0
-4.0
-2.0
0.0
2.0
4.0
2009 2011 2013 2015 2017
(% Change from previous year)
Real GDP Growth Rates
*EstimateSource: IMF http://www.imf.org/external/pubs/ft/weo/2018/01/weodata/index.aspx
Source: Cabinet Officehttp://www.esri.cao.go.jp/jp/sna/data/data_list/sokuhou/files/2018/toukei_2018.html
Japan's Nominal GDP Growth Rate
(% Change from previous year)2008 2009 2010 2011 2012 2013 2014 2015 2016 2017
U.S. -0.3 -2.8 2.5 1.6 2.2 1.7 2.6 2.9 1.5 2.3
China 9.6 9.2 10.6 9.5 7.9 7.8 7.3 6.9 6.7 6.9
Japan -1.1 -5.4 4.2 -0.1 1.5 2.0 0.4 1.4 0.9 1.7
Germany 0.8 -5.6 3.9 3.7 0.7 0.6 1.9 1.5 1.9 2.5
U.K. -0.5 -4.2 1.7 1.5 1.5 2.1 3.1 2.3 1.9 1.8
India 3.9 8.5 10.3 6.6 5.5 6.4 7.4 8.2 7.1 6.7
France 0.2 -2.9 2.0 2.1 0.2 0.6 0.9 1.1 1.2 1.8
Brazil 5.1 -0.1 7.5 4.0 1.9 3.0 0.5 -3.6 -3.5 1.0
Italy -1.1 -5.5 1.7 0.6 -2.8 -1.7 0.1 1.0 0.9 *1.5
Canada 1.0 -3.0 3.1 3.1 1.7 2.5 2.9 1.0 1.4 *3.0
S. Korea 2.8 0.7 6.5 3.7 2.3 2.9 3.3 2.8 2.8 3.1
4Economic and Financial IndicatorsChapter 1
GDP Growth Rates1-2 GDP成長率
-6
-4
-2
0
2
4
6
8
10
12
2008 2009 2010 2011 2012 2013 2014 2015 2016 2017
U.S.
China
Japan
Germany
U.K.
South Korea
Source: IMF http://www.imf.org/external/pubs/ft/weo/2018/01/weodata/index.aspx
(% Change from previous year) Real GDP Growth Rates

7Economic and Financial IndicatorsChapter 1
4.1
3.8
3.9
3.8
3.9
4.0 4.0
4.2 4.2 4.3
3.6
3.8
4.0
4.2
4.4
2009 2011 2013 2015 2017
(Thousand USD)
Nominal GDP Per Capita (in USD)
*EstimateSource: IMF http://www.imf.org/external/pubs/ft/weo/2018/01/weodata/index.aspx
Source: IMFhttp://www.imf.org/external/pubs/ft/weo/2018/01/weodata/index.aspx
Japan's Nominal GDP Per Capita (in JPY)
(Million JPY)2008 2009 2010 2011 2012 2013 2014 2015 2016 2017
U.S. 48.3 46.9 48.3 49.7 51.4 52.7 54.7 56.4 57.6 59.5
China 3.5 3.8 4.5 5.6 6.3 7.1 7.7 8.2 8.1 8.6
Japan 39.5 41.0 44.7 48.2 48.6 40.5 38.2 34.6 39.0 38.4
Germany 46.7 42.6 42.6 46.9 44.1 46.5 48.1 41.3 42.2 44.5
U.K. 47.2 38.4 38.9 41.4 41.8 42.8 46.8 44.3 40.5 *39.7
S. Korea 20.4 18.3 22.1 24.1 24.4 25.9 27.8 27.1 *27.5 *29.9
6Economic and Financial IndicatorsChapter 1
GDP Per Capita1-3 一人当たりGDP
0
10
20
30
40
50
60
70
2008 2009 2010 2011 2012 2013 2014 2015 2016 2017
U.S.
China
Japan
Germany
U.K.
South Korea
Source: IMF http://www.imf.org/external/pubs/ft/weo/2018/01/weodata/index.aspx
(Thousand USD)Nominal GDP Per Capita (in USD)

9Economic and Financial IndicatorsChapter 1
(Billion USD, % of GDP)GDP Composition by Industries (2016)
Agriculture, hunting,
forestry, fishing
Mining, Manufacturing,
UtilitiesConstruction
Wholesale, retail trade,
restaurants and hotels
Transport, storage and
communicationOther Activities Total
U.S.177.6 2,775.8 792.5 2,758.7 1,803.2 10,316.4 18,624.5
(1.0%) (14.9%) (4.3%) (14.8%) (9.7%) (55.4%) (100%)
China992.8 3,730.3 745.3 1,270.1 502.0 3,958.6 11,218.3
(8.9%) (33.3%) (6.7%) (11.3%) (4.5%) (35.3%) (100%)
Japan53.0 1,099.7 270.0 827.8 502.8 2,144.6 4,936.2
(1.1%) (22.5%) (5.5%) (16.9%) (10.3%) (43.8%) (100%)
Germany19.2 805.9 149.3 359.7 291.1 1,038.3 3,477.8
(0.7%) (30.3%) (5.6%) (13.5%) (10.9%) (39.0%) (100%)
U.K.14.2 330.0 146.0 327.8 250.5 1,291.1 2,647.9
(0.6%) (14.0%) (6.2%) (13.9%) (10.6%) (54.7%) (100%)
S. Korea28.2 420.8 73.0 146.5 93.9 518.2 1,411.2
(2.2%) (32.9%) (5.7%) (11.4%) (7.3%) (40.5%) (100%)
Source: UN http://unstats.un.org/unsd/snaama/dnlList.asp
8Economic and Financial IndicatorsChapter 1
GDP Composition by Industries1-4 産業別GDP構成比
0
2,000
4,000
6,000
8,000
10,000
12,000
14,000
16,000
18,000
20,000
U.S. China Japan
Agriculture, hunting, forestry, fishing
Mining, Manufacturing, Utilities
Construction
Wholesale, retail trade, restaurants and hotels
Transport, storage and communication
Other Activities
South KoreaU.K.Germany
Source: UN http://unstats.un.org/unsd/snaama/dnlList.asp
(Billion USD) GDP Composition by Industries (2016)

11Economic and Financial IndicatorsChapter 1
(Billion USD, % of GDP)GDP Composition by Expenditures (2016)
Household consumption expenditure
General government final
consumption expenditure
Gross fixed capital formation
Changes in inventories
Exports of goods and services
Imports of goods and services Total
U.S.12,820.7 2,658.1 3,631.9 35.1 2,214.6 -2,735.8 18,624.5
(68.8%) (14.3%) (19.5%) (0.2%) (11.9%) (-14.7%) (100%)
China4,412.4 1,610.3 4,760.3 185.4 2,197.9 -1,948.0 11,218.3
(39.3%) (14.4%) (42.4%) (1.7%) (19.6%) (-17.4%) (100%)
Japan2,759.6 976.7 1,142.6 9.5 797.5 -749.7 4,936.2
(55.9%) (19.8%) (23.1%) (0.2%) (16.2%) (-15.2%) (100%)
Germany1,852.1 680.8 700.1 -32.5 1,603.9 -1,326.7 3,477.8
(53.3%) (19.6%) (20.1%) (-0.9%) (46.1%) (-38.1%) (100%)
U.K.1,742.2 499.5 438.5 10.7 739.2 -797.3 2,647.9
(65.8%) (18.9%) (16.6%) (0.4%) (27.9%) (-30.1%) (100%)
S. Korea688.1 214.7 418.8 -6.6 596.1 -500.2 1,411.2
(48.8%) (15.2%) (29.7%) (-0.5%) (42.2%) (-35.4%) (100%)Source: UN http://unstats.un.org/unsd/snaama/dnlList.asp
10Economic and Financial IndicatorsChapter 1
GDP Composition by Expenditures1-5 支出要素別GDP構成比
-5,000
-2,500
0
2,500
5,000
7,500
10,000
12,500
15,000
17,500
20,000
22,500Household consumption expenditure
General government final consumption expenditure
Gross fixed capital formation
Changes in inventories
Exports of goods and services
Imports of goods and services
U.S. China Japan South KoreaU.K.Germany
Source: UN http://unstats.un.org/unsd/snaama/dnlList.asp
(Billion USD) GDP Composition by Expenditures (2016)
12Economic and Financial IndicatorsChapter 1
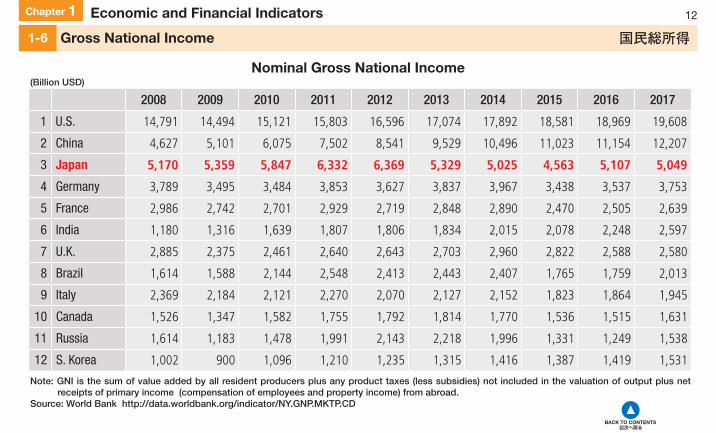
(Billion USD)Nominal Gross National Income
Note: GNI is the sum of value added by all resident producers plus any product taxes (less subsidies) not included in the valuation of output plus net receipts of primary income (compensation of employees and property income) from abroad.
Source: World Bank http://data.worldbank.org/indicator/NY.GNP.MKTP.CD
Gross National Income1-6 国民総所得
2008 2009 2010 2011 2012 2013 2014 2015 2016 2017
1 U.S. 14,791 14,494 15,121 15,803 16,596 17,074 17,892 18,581 18,969 19,608
2 China 4,627 5,101 6,075 7,502 8,541 9,529 10,496 11,023 11,154 12,207
3 Japan 5,170 5,359 5,847 6,332 6,369 5,329 5,025 4,563 5,107 5,049
4 Germany 3,789 3,495 3,484 3,853 3,627 3,837 3,967 3,438 3,537 3,753
5 France 2,986 2,742 2,701 2,929 2,719 2,848 2,890 2,470 2,505 2,639
6 India 1,180 1,316 1,639 1,807 1,806 1,834 2,015 2,078 2,248 2,597
7 U.K. 2,885 2,375 2,461 2,640 2,643 2,703 2,960 2,822 2,588 2,580
8 Brazil 1,614 1,588 2,144 2,548 2,413 2,443 2,407 1,765 1,759 2,013
9 Italy 2,369 2,184 2,121 2,270 2,070 2,127 2,152 1,823 1,864 1,945
10 Canada 1,526 1,347 1,582 1,755 1,792 1,814 1,770 1,536 1,515 1,631
11 Russia 1,614 1,183 1,478 1,991 2,143 2,218 1,996 1,331 1,249 1,538
12 S. Korea 1,002 900 1,096 1,210 1,235 1,315 1,416 1,387 1,419 1,531

13Economic and Financial IndicatorsChapter 1
Exchange Rates1-7 為替レート
(National currencies per USD)
2008 2009 2010 2011 2012 2013 2014 2015 2016 2017
Yuan (China)End of period 6.83 6.83 6.62 6.30 6.29 6.10 6.12 6.49 6.95 6.51
Annual average 6.95 6.83 6.77 6.46 6.31 6.20 6.14 6.23 6.64 6.76
JPYEnd of period 90.75 92.06 81.45 77.72 86.55 105.30 120.64 120.50 116.80 112.90
Annual average 103.36 93.57 87.78 79.81 79.79 97.60 105.94 121.04 108.79 112.17
EuroEnd of period 0.72 0.69 0.75 0.77 0.76 0.73 0.82 0.92 0.95 0.83
Annual average 0.68 0.72 0.76 0.72 0.78 0.75 0.75 0.90 0.90 0.89
Won (S. Korea)End of period 1,259.50 1,164.50 1,134.80 1,151.80 1,070.60 1,055.40 1,099.30 1,172.50 1,207.70 1,070.50
Annual average 1,102.05 1,276.93 1,156.06 1,108.29 1,126.47 1,094.85 1,052.96 1,131.16 1,160.43 1,130.42
Source: IMF http://data.imf.org/?sk=4C514D48-B6BA-49ED-8AB9-52B0C1A0179B
(JPY per national currencies)
2008 2009 2010 2011 2012 2013 2014 2015 2016 2017
JPY /Yuan (China) Annual average 14.87 13.70 12.97 12.35 12.64 15.75 17.25 19.44 16.37 16.60
JPY /Euro Annual average 152.41 130.19 116.44 111.07 102.60 129.64 140.51 134.29 120.33 126.91
JPY /Won (S. Korea) Annual average 0.094 0.073 0.076 0.072 0.071 0.089 0.101 0.107 0.094 0.099
Source: Cabinet Office

15Economic and Financial IndicatorsChapter 1
Stock Prices and Indices(Annual Average)
2008 2009 2010 2011 2012 2013 2014 2015 2016 2017
Dow Jones (USD) 11,249.33 8,885.67 10,665.06 11,960.80 12,960.35 15,001.04 16,782.40 17,588.04 17,922.85 21,741.74
SSE Composite (Index) 5,261.56 1,820.81 3,277.14 2,808.08 2,199.42 2,269.13 2,115.98 3,234.68 3,539.18 3,103.64
Nikkei (JPY) 12,151.55 9,347.61 10,022.45 9,427.03 9,109.61 13,555.09 15,482.01 19,172.06 16,926.97 20,202.62
FT 100 (Index) 5,366.32 4,569.09 5,472.16 5,685.38 5,740.16 6,472.02 6,681.60 6,591.37 6,474.97 7,380.24
Note: The SSE Composite Index is a stock market index of all stocks (A shares and B shares) that are traded at the Shanghai Stock Exchange.Source: Cabinet Office
14Economic and Financial IndicatorsChapter 1
Stock Prices and Indices1-8 株価・株価指数
79.0 94.8
106.3 115.2 133.4
149.2 156.3 159.3
193.3
34.6
62.3 53.4 41.8 43.1 40.2
61.5 67.3 59.0
85.1 102.0
105.9 107.0
120.6 124.5
122.8 120.7 137.5
76.9 82.5 77.6 75.0
127.4
157.8 139.3
166.3
0
20
40
60
80
100
120
140
160
180
200
2008 2009 2010 2011 2012 2013 2014 2015 2016 2017
Dow Jones SSE Composite FT 100 Nikkei
111.6
Note: The SSE Composite Index is a stock market index of all stocks (A shares and B shares) that are traded at the Shanghai Stock Exchange.Source: Compiled by Keizai Koho Center from Cabinet Office data.
(2008=100, Annual average)

17Economic and Financial IndicatorsChapter 1
Long-term Interest Rates(%, 10-year government bonds)
2008 2009 2010 2011 2012 2013 2014 2015 2016 2017
U.S. 3.67 3.26 3.21 2.79 1.80 2.35 2.54 2.14 1.84 2.33
China 2.75 3.64 3.88 3.42 3.57 4.55 3.62 2.82 3.01 3.88
Japan 1.47 1.33 1.15 1.10 0.84 0.69 0.52 0.35 -0.07 0.05
Germany 3.98 3.22 2.74 2.61 1.50 1.57 1.16 0.50 0.09 0.32
U.K. 4.59 3.65 3.62 3.14 1.92 2.39 2.57 1.90 1.31 1.24
S. Korea 5.57 5.17 4.77 4.20 3.45 3.28 3.19 2.31 1.75 2.28
Note: China's figures are end of period. Others are the annual average.Sources: OECD http://stats.oecd.org/, Ministry of Finance of People's Republic of China http://yield.chinabond.com.cn/cbweb-czb-web/czb/moreInfo
16Economic and Financial IndicatorsChapter 1
Long-term Interest Rates1-9 長期金利
-1.00
0.00
1.00
2.00
3.00
4.00
5.00
6.00
2008 2009 2010 2011 2012 2013 2014 2015 2016 2017
U.S.
China
Japan
Germany
U.K.
South Korea
Note: China's figures are end of period. Others are the annual average.Sources: OECD http://stats.oecd.org/, Ministry of Finance of People's Republic of China http://yield.chinabond.com.cn/cbweb-czb-web/czb/moreInfo
(%, 10-year government bonds)

19Economic and Financial IndicatorsChapter 1
Industrial Production Index(2010=100)
2008 2009 2010 2011 2012 2013 2014 2015 2016 2017
U.S. 107.1 94.8 100.0 103.1 106.2 108.4 111.7 110.6 108.5 110.2
China N/A 100.0 113.7 125.0 137.2 148.5 157.5 167.1 N/A
Japan 110.1 87.0 100.0 97.1 97.7 96.9 98.7 97.4 97.1 101.4
Germany 108.3 89.6 100.0 108.5 107.3 107.3 109.4 110.6 112.2 115.5
U.K. 106.3 96.9 100.0 99.4 96.6 96.0 97.4 98.6 99.4 101.1
S.Korea 86.1 86.0 100.0 106.0 107.4 108.2 108.4 108.1 109.2 111.1
Note: China's figures are as of 2017.Source: IMF http://data.imf.org/?sk=4C514D48-B6BA-49ED-8AB9-52B0C1A0179B
18Economic and Financial IndicatorsChapter 1
Industrial Production Index1-10 鉱工業生産指数
2008 2009 2010 2011 2012 2013 2014 2015 2016 201780.0
90.0
100.0
110.0
120.0
130.0
140.0
150.0
160.0
170.0U.S.
China
Japan
Germany
U.K.
South Korea
Source: IMF http://data.imf.org/?sk=4C514D48-B6BA-49ED-8AB9-52B0C1A0179B
(2010=100)

21Economic and Financial IndicatorsChapter 1
Consumer Price Indices (All Items)(2008=100)
2008 2009 2010 2011 2012 2013 2014 2015 2016 2017
U.S. 100.0 99.7 101.3 104.6 106.7 108.2 110.0 110.1 111.6 113.9
China 100.0 99.3 102.5 108.2 111.0 113.9 116.1 117.7 120.1 122.0
Japan 100.0 98.6 97.9 97.6 97.6 97.9 100.7 101.5 101.4 101.9
Germany 100.0 100.3 101.4 103.5 105.6 107.2 108.1 108.4 108.9 110.9
U.K. 100.0 102.0 104.5 108.6 111.3 113.9 115.5 116.0 117.1 120.2
S. Korea 100.0 102.8 105.8 110.1 112.5 114.0 115.4 116.2 117.4 119.7
Source: Compiled by Keizai Koho Center from OECD data. https://stats.oecd.org/
20Economic and Financial IndicatorsChapter 1
Consumer Price Indices (All Items)1-11 消費者物価指数(総合)
2008 2009 2010 2011 2012 2013 2014 2015 2016 2017
U.S.
China
Japan
Germany
U.K.
South Korea
90.0
100.0
110.0
120.0
130.0
Source: Compiled by Keizai Koho Center from OECD data. https://stats.oecd.org/
(2008=100)

23Economic and Financial IndicatorsChapter 1
Household and NPISHs Final Consumption Expenditure(Annual % growth)
2007 2008 2009 2010 2011 2012 2013 2014 2015 2016
U.S. 2.2 -0.3 -1.6 1.9 2.3 1.5 1.5 2.9 3.6 2.7
China 4.8 5.9 -0.7 3.3 5.4 2.7 2.7 2.0 1.4 2.0
Japan 0.9 -1.0 -0.7 2.4 -0.4 2.0 2.4 -0.9 0.0 0.1
Germany 0.0 0.6 0.2 0.4 1.4 1.3 0.6 1.0 1.7 2.1
U.K. 2.6 -0.5 -3.0 0.7 -0.7 1.6 1.7 2.1 2.6 2.9
S. Korea 5.1 1.4 0.2 4.4 2.9 1.9 1.9 1.8 2.2 2.5
Notes: Household and NPISHs final consumption expenditure (formerly private consumption) is the market value of all goods and services, including durable products (such as cars, washing machines, and home computers), purchased by households. It includes the expenditures of nonprofit institutions serving households.
Source: World Bank http://databank.worldbank.org/data/reports.aspx?source=2&series=NE.CON.PRVT.CD&country=#
22Economic and Financial IndicatorsChapter 1
Household and NPISHs Final Consumption Expenditure1-12 家計最終消費支出
-4
-3
-2
-1
0.0
1.0
2.0
3.0
4.0
5.0
6.0
2007 2008 2009 2010 2011 2012 2013 2014 2015 2016
U.S.
China
Japan
Germany
U.K.
South Korea
.0
.0
.0
.0
Notes: Household and NPISHs final consumption expenditure (formerly private consumption) is the market value of all goods and services, including durable products (such as cars, washing machines, and home computers), purchased by households. It includes the expenditures of nonprofit institutions serving households.
Source: World Bank http://databank.worldbank.org/data/reports.aspx?source=2&series=NE.CON.PRVT.CD&country=#
(Annual % growth)

24Economic and Financial IndicatorsChapter 1
Crude Oil Price1-13 原油価格
99.56
61.65
79.43
95.05 94.16 97.94
93.11
48.71
43.19 50.91
0.00
20.00
40.00
60.00
80.00
100.00
120.00
2008 2009 2010 2011 2012 2013 2014 2015 2016 2017
USD / barrel
Source: World Bank http://www.worldbank.org/en/research/commodity-markets
(USD per barrel, West Texas Intermediate, Annual Averages)

25Economic and Financial IndicatorsChapter 1
Electric Cars: New Sales RankingEditor's Choice 電気自動車販売台数ランキング
(Thousands)
Rank Country NewSales
MarketShare
BEV(Battery Electric
Vehicle)
PHEV(Plug-in Hybrid Electric Vehicle)
1 China 579 2.2% 81% 19%
2 U.S. 198 1.2% 53% 47%
3 Norway 62 39.2% 53% 47%
4 Germany 55 1.6% 46% 54%
5 Japan 54 1.0% 33% 67%
6 U.K. 47 1.7% 29% 71%
7 France 35 1.7% 75% 25%
8 Sweden 20 6.3% 21% 79%
9 Canada 17 1.1% 52% 48%
10 S. Korea 15 1.3% 90% 10%Note: Electric Cars (BEV + PHEV)Source: IEA, Global EV Outlook 2018 https://webstore.iea.org/global-ev-outlook-2018
(Year 2017)

27Population and Labor MarketsChapter 2
(Million people)Population
2000 2005 2010 2015 2020 2025 2030 2035 2040 2045
U.S. 282.0 295.1 308.6 319.9 331.4 343.3 354.7 365.0 374.1 382.1
China 1,283.2 1,321.6 1,359.8 1,397.0 1,424.5 1,438.8 1,441.2 1,433.5 1,417.5 1,394.4
Japan 127.5 128.3 128.6 128.0 126.5 124.3 121.6 118.5 115.2 111.9
Germany 81.5 81.7 80.9 81.7 82.5 82.5 82.2 81.7 81.1 80.3
U.K. 59.0 60.3 63.3 65.4 67.3 69.1 70.6 71.9 73.1 74.3
India 1,053.1 1,144.1 1,231.0 1,309.1 1,383.2 1,451.8 1,513.0 1,564.6 1,605.4 1,636.5
S. Korea 47.4 48.7 49.6 50.6 51.5 52.2 52.7 52.8 52.4 51.6
World Total 6,145.0 6,542.2 6,958.2 7,383.0 7,795.5 8,185.6 8,551.2 8,892.7 9,210.3 9,504.0
Note: Estimates from 2020 using medium fertility variant. Source: UN http://esa.un.org/unpd/wpp/Download/Standard/Population/
26Population and Labor MarketsChapter 2
Population2-1 人口
0.0
500.0
1,000.0
1,500.0
2,000.0
2000 2005 2010 2015 2020 2025 2030 2035 2040 2045
U.S.
China
Japan
Germany
U.K.
India
South Korea
Note: Estimates from 2020 using medium fertility variant. Source: UN http://esa.un.org/unpd/wpp/Download/Standard/Population/
(Million people)

29Population and Labor MarketsChapter 2
(Million people, % of total population)Population (Ages 15-64)
2000 2005 2010 2015 2020 2025 2030 2035 2040 2045
U.S.186.1 197.2 206.3 211.6 214.6 216.5 217.8 221.5 226.8 232.3
(66.0%) (66.8%) (66.9%) (66.1%) (64.8%) (63.1%) (61.4%) (60.7%) (60.6%) (60.8%)
China878.5 957.0 1002.8 1014.8 1002.2 995.6 973.6 928.1 882.1 852.3
(68.5%) (72.4%) (73.8%) (72.6%) (70.4%) (69.2%) (67.6%) (64.7%) (62.2%) (61.1%)
Japan87.0 85.4 82.5 78.1 74.7 72.5 69.9 66.5 61.7 58.2
(68.2%) (66.5%) (64.1%) (61.0%) (59.1%) (58.3%) (57.5%) (56.1%) (53.5%) (52.0%)
Germany55.3 54.5 53.3 53.7 53.4 51.5 49.0 46.8 46.1 45.7
(67.8%) (66.7%) (65.9%) (65.8%) (64.7%) (62.5%) (59.6%) (57.2%) (56.9%) (56.9%)
U.K.38.4 39.8 41.7 42.0 42.5 42.9 43.0 43.1 43.6 43.9
(65.1%) (66.0%) (65.9%) (64.3%) (63.1%) (62.2%) (61.0%) (60.0%) (59.6%) (59.1%)
India641.0 714.5 787.8 860.1 924.9 983.4 1028.8 1067.7 1097.8 1117.7
(60.9%) (62.4%) (64.0%) (65.7%) (66.9%) (67.7%) (68.0%) (68.2%) (68.4%) (68.3%)
S. Korea34.2 35.2 36.3 37.0 36.6 35.0 33.2 31.3 29.5 28.2
(72.2%) (72.3%) (73.2%) (73.1%) (71.1%) (67.1%) (63.0%) (59.3%) (56.3%) (54.7%)Note: Estimates from 2020 using medium fertility variant. Source: UN http://esa.un.org/unpd/wpp/Download/Standard/Population/
28Population and Labor MarketsChapter 2
Population (Ages 15-64)2-2 人口(15~64歳)
50.0
55.0
60.0
65.0
70.0
75.0
2000 2005 2010 2015 2020 2025 2030 2035 2040 2045
U.S.
China
Japan
Germany
U.K.
India
South Korea
Note: Estimates from 2020 using medium fertility variant. Source: UN http://esa.un.org/unpd/wpp/Download/Standard/Population/
(% of total population)

31Population and Labor MarketsChapter 2
(Million people, % of total population)Population (Ages 65 and Older)
2000 2005 2010 2015 2020 2025 2030 2035 2040 2045
U.S.34.7 36.3 40.0 46.8 55.1 64.2 72.2 77.6 80.8 83.2
(12.3%) (12.3%) (13.0%) (14.6%) (16.6%) (18.7%) (20.4%) (21.2%) (21.6%) (21.8%)
China 88.6 101.7 114.2 135.2 173.6 203.7 245.9 299.2 337.9 348.4
(6.9%) (7.7%) (8.4%) (9.7%) (12.2%) (14.2%) (17.1%) (20.9%) (23.8%) (25.0%)
Japan21.7 25.2 28.9 33.3 35.7 36.4 36.8 37.6 39.5 39.8
(17.0%) (19.7%) (22.5%) (26.0%) (28.2%) (29.3%) (30.3%) (31.8%) (34.2%) (35.6%)
Germany 13.4 15.4 16.6 17.3 18.3 19.8 22.0 24.0 24.4 24.3
(16.5%) (18.9%) (20.5%) (21.1%) (22.2%) (24.1%) (26.8%) (29.3%) (30.0%) (30.2%)
U.K.9.4 9.7 10.5 11.9 12.8 14.0 15.5 16.9 17.8 18.4
(15.9%) (16.0%) (16.6%) (18.1%) (19.0%) (20.2%) (22.0%) (23.5%) (24.3%) (24.8%)
India 46.3 54.6 62.9 73.8 90.6 108.8 128.0 148.1 169.8 194.0
(4.4%) (4.8%) (5.1%) (5.6%) (6.6%) (7.5%) (8.5%) (9.5%) (10.6%) (11.9%)
S. Korea 3.4 4.3 5.3 6.6 8.1 10.4 12.6 14.7 16.3 17.2
(7.2%) (8.9%) (10.7%) (13.0%) (15.7%) (19.9%) (23.9%) (27.7%) (31.1%) (33.4%)Note: Estimates from 2020 using medium fertility variant. Source: UN http://esa.un.org/unpd/wpp/Download/Standard/Population/
30Population and Labor MarketsChapter 2
Population (Ages 65 and Older)2-3 人口(65歳以上)
0.0
5.0
10.0
15.0
20.0
25.0
30.0
35.0
40.0
2000 2005 2010 2015 2020 2025 2030 2035 2040 2045
U.S.
China
Japan
Germany
U.K.
India
South Korea
Note: Estimates from 2020 using medium fertility variant. Source: UN http://esa.un.org/unpd/wpp/Download/Standard/Population/
(% of total population)

33Population and Labor MarketsChapter 2
Total Fertility Rate(Births per woman)
2007 2008 2009 2010 2011 2012 2013 2014 2015 2016
U.S. 2.12 2.07 2.00 1.93 1.89 1.88 1.86 1.86 1.84 1.80
China 1.58 1.58 1.59 1.59 1.59 1.60 1.60 1.61 1.62 1.62
Japan 1.34 1.37 1.37 1.39 1.39 1.41 1.43 1.42 1.45 1.44
Germany 1.37 1.38 1.36 1.39 1.39 1.41 1.42 1.47 1.50 1.50
U.K. 1.86 1.91 1.89 1.92 1.91 1.92 1.83 1.81 1.80 1.80
India 2.82 2.75 2.67 2.60 2.53 2.48 2.43 2.38 2.35 2.33
S. Korea 1.25 1.19 1.15 1.23 1.24 1.30 1.19 1.21 1.24 1.17
Source: World Bank http://data.worldbank.org/indicator/SP.DYN.TFRT.IN
32Population and Labor MarketsChapter 2
Total Fertility Rate2-4 合計特殊出生率
1.00
1.20
1.40
1.60
1.80
2.00
2.20
2.40
2.60
2.80
3.00
2007 2008 2009 2010 2011 2012 2013 2014 2015 2016
U.S.
China
Japan
Germany
U.K.
India
South Korea
Note: Total fertility rate represents the number of children that would be born to a woman if she were to live to the end of her childbearing years and bear children in accordance with age-specific fertility rates of the specified year.
Source: World Bank http://data.worldbank.org/indicator/SP.DYN.TFRT.IN
(Births per woman)
35Population and Labor MarketsChapter 2
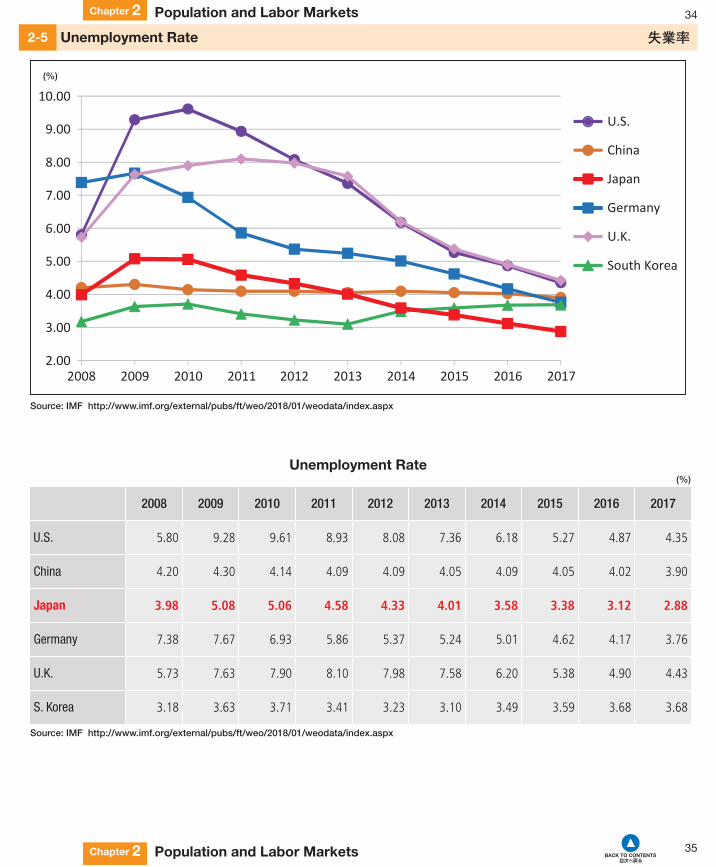
(%)Unemployment Rate
2008 2009 2010 2011 2012 2013 2014 2015 2016 2017
U.S. 5.80 9.28 9.61 8.93 8.08 7.36 6.18 5.27 4.87 4.35
China 4.20 4.30 4.14 4.09 4.09 4.05 4.09 4.05 4.02 3.90
Japan 3.98 5.08 5.06 4.58 4.33 4.01 3.58 3.38 3.12 2.88
Germany 7.38 7.67 6.93 5.86 5.37 5.24 5.01 4.62 4.17 3.76
U.K. 5.73 7.63 7.90 8.10 7.98 7.58 6.20 5.38 4.90 4.43
S. Korea 3.18 3.63 3.71 3.41 3.23 3.10 3.49 3.59 3.68 3.68
Source: IMF http://www.imf.org/external/pubs/ft/weo/2018/01/weodata/index.aspx
34Population and Labor MarketsChapter 2
Unemployment Rate2-5 失業率
2.00
3.00
4.00
5.00
6.00
7.00
8.00
9.00
10.00
2008 2009 2010 2011 2012 2013 2014 2015 2016 2017
U.S.
China
Japan
Germany
U.K.
South Korea
Source: IMF http://www.imf.org/external/pubs/ft/weo/2018/01/weodata/index.aspx
(%)

36Population and Labor MarketsChapter 2
(%)
B break in series.Note: 2011 results for Japan excludes 3 prefectures (Iwate, Miyagi and Fukushima) from March-August 2011. For time series comparison, the
corresponding figures 2010 are also compiled on the basis excluding the 3 prefectures.Source: OECD https://stats.oecd.org/Index.aspx?DataSetCode=STLABOUR#
Employment Rate by Age and Gender2-6 年齢・性別雇用率
Age Country Gender 2008 2009 2010 2011 2012 2013 2014 2015 2016 2017
15-24
U.S. Female 50.2 47.0 45.1 44.9 45.4 46.0 47.1 48.2 48.8 49.9 Male 52.3 46.7 44.9 46.0 46.6 46.9 48.2 49.0 50.1 50.8
Japan Female 41.6 40.9 40.1 40.3 38.9 40.6 40.9 40.7 42.6 43.0 Male 40.8 38.2 37.5 38.0 37.8 38.6 39.3 39.9 41.8 42.1
Germany Female 44.6 B 44.4 B 44.5 46.1 44.5 45.2 44.3 44.0 44.5 45.5 Male 48.7 B 47.5 B 47.9 49.7 48.6 48.4 47.7 46.5 46.9 47.4
25-54
U.S. Female 72.3 70.2 69.3 69.0 69.2 69.3 70.0 70.3 71.1 72.1 Male 86.0 81.5 81.0 81.4 82.5 82.8 83.6 84.4 85.0 85.4
Japan Female 67.7 67.8 68.3 69.1 69.2 70.9 72.0 72.8 74.0 75.3 Male 92.7 91.4 91.5 91.7 91.6 91.8 92.2 92.2 92.6 92.8
Germany Female 74.7 B 75.4 B 76.4 77.9 78.3 78.6 78.9 79.2 79.7 80.0 Male 87.0 B 86.1 B 86.8 88.0 88.4 88.2 88.1 88.2 88.1 88.3
55-64
U.S. Female 57.0 56.4 56.4 55.9 56.1 56.2 56.3 56.4 56.5 57.1 Male 67.7 65.2 64.4 64.4 65.5 66.0 66.8 67.1 67.5 68.4
Japan Female 51.9 51.8 52.2 52.7 52.5 54.3 56.1 58.0 59.7 62.0 Male 81.5 80.0 79.1 79.2 78.9 79.9 81.6 82.5 83.6 85.1
Germany Female 46.0 B 48.6 B 50.7 53.2 55.0 57.7 60.0 61.2 63.6 65.4 Male 61.7 B 63.8 B 65.2 67.1 68.6 69.9 71.4 71.3 73.7 75.0

37Population and Labor MarketsChapter 2
Part-time Employment Rate by Age and Gender2-7 年齢・性別短時間雇用率(%)
Notes: Germany and Japan data utilize total employment statistics. U.S. data utilizes dependent employment statistics. Dependent employment refers to wage and salary workers.
Source: OECD http://stats.oecd.org/Index.aspx?DataSetCode=STLABOUR#
Age Country Gender 2008 2009 2010 2011 2012 2013 2014 2015 2016 2017
15-24
U.S.Female 40.5 44.0 43.2 42.8 43.7 41.9 42.3 41.5 41.3 41.2 Male 30.0 32.6 33.0 33.2 31.9 31.7 30.7 31.7 31.2 30.2
Japan Female 27.2 29.4 30.5 32.3 31.4 33.6 35.2 35.2 35.6 36.2 Male 24.5 25.4 27.5 26.6 28.5 29.2 29.9 29.9 30.6 31.6
GermanyFemale 23.0 22.8 21.9 24.1 24.5 25.5 25.2 26.4 27.1 27.6 Male 14.9 14.5 13.7 15.0 15.5 17.1 16.7 17.4 18.3 19.2
25-54
U.S.Female 12.2 13.6 13.1 12.8 12.7 12.3 12.4 11.9 12.1 11.4 Male 2.9 4.1 3.9 4.0 3.8 4.0 3.8 3.6 3.6 3.4
Japan Female 30.4 30.5 30.2 30.6 30.6 32.1 33.1 32.5 32.4 31.6 Male 4.5 5.0 4.5 4.5 4.4 4.9 5.4 5.3 4.9 4.5
GermanyFemale 39.3 39.1 39.1 38.6 38.2 37.9 37.0 36.7 36.0 35.8 Male 5.4 5.6 5.6 5.7 5.6 5.8 5.9 5.9 5.8 6.0
55-64
U.S.Female 15.5 15.3 15.1 15.8 15.5 14.5 15.0 14.6 14.4 13.9 Male 5.9 6.7 6.4 5.8 6.0 5.8 5.4 5.3 5.7 5.5
Japan Female 38.9 40.0 40.5 41.8 41.5 43.2 43.7 42.5 42.4 42.1 Male 10.2 11.0 11.3 11.1 10.9 12.1 12.5 11.6 10.8 9.5
GermanyFemale 43.7 42.7 42.0 42.6 41.9 42.2 41.4 41.1 40.9 40.6 Male 8.2 8.3 8.1 8.9 9.2 9.2 9.3 9.2 9.1 9.0

39Population and Labor MarketsChapter 2
Labor Productivity(USD)
2008 2009 2010 2011 2012 2013 2014 2015 2016 2017
U.S. 112,998 114,090 117,663 118,601 119,376 120,386 121,672 123,473 123,502 124,442
China 15,021 16,451 18,193 19,903 21,493 23,197 24,922 26,712 28,587 30,686
Japan 75,511 72,527 75,981 76,131 77,768 79,000 78,922 79,726 79,778 80,302
Germany 90,945 85,815 88,924 90,994 90,564 90,548 91,529 92,051 92,534 93,464
U.K. 86,728 84,443 85,660 86,468 86,801 87,557 88,147 88,691 89,146 89,761
S. Korea 64,817 65,475 68,782 70,093 70,432 71,356 72,206 73,256 74,470 75,869
Notes: Labor productivity per person employed in 2017 USD (converted to 2017 price level with updated 2011 PPPs). Labor productivity is defined as real output in national currency per hour worked.
Source: Conference Board Total Economy DatabaseTM (Adjusted version), March 2018 https://www.conference-board.org/data/economydatabase/index.cfm?id=27762
38Population and Labor MarketsChapter 2
Labor Productivity2-8 労働生産性
10,000
30,000
50,000
70,000
90,000
110,000
130,000
2008 2009 2010 2011 2012 2013 2014 2015 2016 2017
U.S.
China
Japan
Germany
U.K.
South Korea
Notes: Labor productivity per person employed in 2017 USD (converted to 2017 price level with updated 2011 PPPs). Labor productivity is defined as real output in national currency per hour worked.
Source: Conference Board Total Economy DatabaseTM (Adjusted version), March 2018 https://www.conference-board.org/data/economydatabase/index.cfm?id=27762
(USD)

41Population and Labor MarketsChapter 2
(Thousand people)Foreign Workers in Japan
Nationality 2008 2009 2010 2011 2012 2013 2014 2015 2016 2017
China 211 249 287 297 296 304 312 323 345 372
Vietnam N/A N/A N/A N/A 27 38 61 110 172 240
Phillipines 41 49 62 70 73 80 92 107 128 147
Brazil 99 104 116 117 102 96 94 97 107 117
Nepal N/A N/A N/A N/A N/A N/A 24 39 53 69
S. Korea 21 25 29 31 32 34 37 41 48 56
U.S. N/A 18 20 22 22 23 25 26 29 32
U.K. N/A 7 8 8 9 9 9 10 11 12
Others 114 111 128 141 121 134 134 155 191 234
Total 486 563 650 686 682 718 788 908 1,084 1,279
Note: Includes workers of professional technical fields, designated activities, extra-status activities (students) and long-term/permanent residents.Source: Ministry of Health, Labor and Welfare https://www.mhlw.go.jp/stf/seisakunitsuite/bunya/koyou_roudou/koyou/gaikokujin/gaikokujin-koyou/06.html
40Population and Labor MarketsChapter 2
Foreign Workers in Japan2-9 外国人労働者数
0
500
1,000
1,500
2008 2009 2010 2011 2012 2013 2014 2015 2016 2017
Others
U.K.
U.S.
South Korea
Nepal
Brazil
Phillipines
Vietnam
China
563650 686 682 718
788908
1,084
1,279
From
486
Note: Includes workers of professional technical fields, designated activities, extra-status activities (students) and long-term/permanent residents.Source: Ministry of Health, Labor and Welfare https://www.mhlw.go.jp/stf/seisakunitsuite/bunya/koyou_roudou/koyou/gaikokujin/gaikokujin-koyou/06.html
(Thousand people)

43Trade and InvestmentChapter 3
(Billion USD)Current Account Balance
2008 2009 2010 2011 2012 2013 2014 2015 2016 2017
U.S. -681.4 -372.5 -430.7 -444.6 -426.2 -349.5 -373.8 -434.6 -451.7 *-466.2
China 420.6 243.3 237.8 136.1 215.4 148.2 236.0 304.2 202.2 164.9
Japan 142.6 145.3 221.0 129.8 59.7 45.9 36.8 134.1 188.1 195.4
Germany 210.9 196.7 192.3 229.7 248.9 252.5 291.0 301.1 297.5 296.6
U.K. -135.4 -93.4 -92.3 -62.3 -113.1 -151.8 -161.4 -150.0 -153.9 -106.7
S. Korea 3.2 33.6 28.9 18.7 50.8 81.1 84.4 105.9 99.2 78.5
* Estimate Source : IMF http://www.imf.org/external/pubs/ft/weo/2018/01/weodata/index.aspx
42Trade and InvestmentChapter 3
Current Account Balance3-1 経常収支
-750.0
-500.0
-250.0
0.0
250.0
500.0
750.0
2008 2009 2010 2011 2012 2013 2014 2015 2016 2017
U.S.
China
Japan
Germany
U.K.
South Korea
Source : IMF http://www.imf.org/external/pubs/ft/weo/2018/01/weodata/index.aspx
(Billion USD)

45Trade and InvestmentChapter 3
25,000
50,000
75,000
100,000
2008 2009 2010 2011 2012 2013 2014 2015 2016 2017
Export Import
(Billion JPY) Japan's Trade Balance (in JPY)
(Billion JPY)
2008 2009 2010 2011 2012 2013 2014 2015 2016 2017
Export 77,611 51,122 64,391 62,965 61,957 67,829 74,075 75,274 69,093 77,286
Import 71,808 45,734 54,875 63,296 66,229 76,602 84,540 76,160 63,575 72,330
Balance 5,803 5,388 9,516 -330 -4,272 -8,773 -10,465 -886 5,518 4,955Source: Ministry of Finance http://www.mof.go.jp/international_policy/reference/balance_of_payments/bpnet.htm
44Trade and InvestmentChapter 3
Trade Balance (Japan)3-2 貿易収支(日本)
250
500
750
1000
2008 2009 2010 2011 2012 2013 2014 2015 2016 2017
Export Import
(Billion USD) Japan's Trade Balance (in USD)
(Billion USD)
2008 2009 2010 2011 2012 2013 2014 2015 2016 2017
Export 749 548 735 790 777 695 699 622 636 689
Import 694 490 627 794 830 785 799 629 585 645
Balance 55 58 109 -4 -53 -90 -100 -7 51 44 Source: IMF http://data.imf.org/?sk=7A51304B-6426-40C0-83DD-CA473CA1FD52&sId=1390030341854

47Trade and InvestmentChapter 3
Source: Ministry of Finance http://www.customs.go.jp/toukei/suii/html/time_latest.htm
Imports(Billion JPY)
2008 2009 2010 2011 2012 2013 2014 2015 2016 2017World 78,954.7 51,499.4 60,765.0 68,111.2 70,688.6 81,242.5 85,909.1 78,405.5 66,042.0 75,379.2
1 China China China China China China China China China China14,830.4 11,436.0 13,413.0 14,641.9 15,038.8 17,660.0 19,176.5 19,428.8 17,019.0 18,459.3
2 U.S. U.S. U.S. U.S. U.S. U.S. U.S. U.S. U.S. U.S.8,039.6 5,512.3 5,911.4 5,931.4 6,082.1 6,814.8 7,542.7 8,059.8 7,322.1 8,090.3
3 Saudi Arabia Australia Australia Australia Australia Australia Australia Australia Australia Australia5,292.7 3,242.3 3,948.2 4,513.9 4,503.6 4,976.9 5,089.7 4,210.0 3,321.1 4,365.0
4 Australia Saudi Arabia Saudi Arabia Saudi Arabia Saudi Arabia Saudi Arabia Saudi Arabia S. Korea S. Korea S. Korea4,921.6 2,719.7 3,149.4 4,025.8 4,376.0 4,863.3 5,015.3 3,243.9 2,722.1 3,152.7
5 UAE UAE UAE UAE UAE UAE UAE Saudi Arabia Taiwan Saudi Arabia4,871.9 2,114.6 2,568.8 3,413.1 3,509.5 4,147.8 4,399.8 3,035.3 2,495.3 3,115.0
6 Indonesia S. Korea S. Korea S. Korea S. Korea Qatar Qatar UAE Germany Taiwan3,378.0 2,051.0 2,504.0 3,170.1 3,233.7 3,604.4 3,537.5 2,846.2 2,394.5 2,847.8
7 S. Korea Indonesia Indonesia Indonesia Qatar S. Korea S. Korea Taiwan Thailand Germany3,052.0 2,037.6 2,476.2 2,716.0 2,863.1 3,493.1 3,531.3 2,817.4 2,189.7 2,627.2
8 Qatar Taiwan Taiwan Malaysia Malaysia Malaysia Malaysia Malaysia Saudi Arabia Thailand2,752.2 1,710.7 2,024.6 2,425.7 2,621.3 2,901.2 3,086.7 2,601.6 2,124.9 2,550.2
9 Malaysia Germany Malaysia Qatar Indonesia Indonesia Indonesia Thailand Indonesia UAE2,397.6 1,563.4 1,987.4 2,395.4 2,576.4 2,813.0 2,715.6 2,471.8 1,988.9 2,328.8
10 Taiwan Malaysia Qatar Thailand Germany Germany Russia Germany UAE Indonesia2,258.2 1,558.4 1,904.0 1,953.2 1,971.7 2,324.6 2,618.5 2,454.2 1,880.2 2,230.7
46Trade and InvestmentChapter 3
Japan's Major Trading Partners3-3 日本の主な貿易相手国
Source: Ministry of Finance http://www.customs.go.jp/toukei/suii/html/time_latest.htm
Exports(Billion JPY)
2008 2009 2010 2011 2012 2013 2014 2015 2016 2017World 81,018.1 54,170.6 67,399.6 65,546.5 63,747.6 69,774.2 73,093.0 75,613.9 70,035.8 78,286.5
1 U.S. China China China China U.S. U.S. U.S. U.S. U.S.14,214.3 10,235.6 13,085.6 12,902.2 11,509.1 12,928.2 13,649.3 15,224.6 14,142.9 15,113.5
2 China U.S. U.S. U.S. U.S. China China China China China12,949.9 8,733.4 10,374.0 10,017.7 11,188.4 12,625.2 13,381.5 13,223.4 12,361.4 14,889.7
3 S. Korea S. Korea S. Korea S. Korea S. Korea S. Korea S. Korea S. Korea S. Korea S. Korea6,168.3 4,409.7 5,460.2 5,269.1 4,911.3 5,511.8 5,455.9 5,326.6 5,020.4 5,975.2
4 Taiwan Taiwan Taiwan Taiwan Taiwan Taiwan Taiwan Taiwan Taiwan Taiwan4,781.6 3,398.7 4,594.2 4,057.7 3,673.2 4,060.8 4,231.6 4,472.5 4,267.7 4,557.8
5 Hong Kong Hong Kong Hong Kong Hong Kong Thailand Hong Kong Hong Kong Hong Kong Hong Kong Hong Kong4,177.8 2,975.1 3,704.8 3,419.8 3,488.9 3,651.3 4,039.3 4,236.0 3,651.5 3,974.1
6 Thailand Thailand Thailand Thailand Hong Kong Thailand Thailand Thailand Thailand Thailand3,051.5 2,069.7 2,993.7 2,988.5 3,276.2 3,507.2 3,319.8 3,386.3 2,974.4 3,300.4
7 Singapore Singapore Singapore Singapore Singapore Singapore Singapore Singapore Singapore Singapore2,757.6 1,933.2 2,209.1 2,170.1 1,859.4 2,047.3 2,225.2 2,402.6 2,154.6 2,540.6
8 Germany Germany Germany Germany Germany Germany Germany Germany Germany Germany2,483.7 1,553.5 1,776.6 1,871.4 1,660.0 1,850.2 2,017.9 1,964.8 1,917.1 2,124.6
9 Netherlands Netherlands Malaysia Malaysia Indonesia Indonesia Indonesia Australia Australia Australia2,185.1 1,260.3 1,544.6 1,496.1 1,618.7 1,661.8 1,560.5 1,554.9 1,532.1 1,795.6
10 Australia Malaysia Netherlands Netherlands Australia Australia Australia Vietnam U.K. Vietnam1,793.3 1,200.1 1,430.5 1,428.9 1,470.8 1,655.6 1,501.2 1,516.4 1,483.4 1,688.1

48Trade and InvestmentChapter 3
Trade Balance (U.S.)3-4 貿易収支(米国)
0
500
1,000
1,500
2,000
2,500
2008 2009 2010 2011 2012 2013 2014 2015 2016 2017
Export Import
(Billion USD)
(Billion USD)
2008 2009 2010 2011 2012 2013 2014 2015 2016 2017
Export 1,309 1,070 1,290 1,499 1,563 1,594 1,636 1,511 1,457 1,553
Import 2,141 1,580 1,939 2,240 2,304 2,294 2,385 2,273 2,208 2,361
Balance -832 -510 -649 -741 -741 -701 -750 -762 -751 -807Source: IMF http://data.imf.org/?sk=7A51304B-6426-40C0-83DD-CA473CA1FD52

49Trade and InvestmentChapter 3
Trade Balance (China)3-5 貿易収支(中国)
0
500
1,000
1,500
2,000
2,500
2008 2009 2010 2011 2012 2013 2014 2015 2016 2017
Export Import
(Billion USD)
(Billion USD)
2008 2009 2010 2011 2012 2013 2014 2015 2016 2017
Export 1,350 1,127 1,486 1,808 1,974 2,149 2,244 2,143 1,990 2,216
Import 990 884 1,240 1,579 1,662 1,790 1,809 1,567 1,501 1,740
Balance 360 244 246 229 312 359 435 576 489 476 Source: IMF http://data.imf.org/?sk=7A51304B-6426-40C0-83DD-CA473CA1FD52

50Trade and InvestmentChapter 3
Trade Balance (Germany)3-6 貿易収支(ドイツ)
0
500
1,000
1,500
2,000
2,500
2008 2009 2010 2011 2012 2013 2014 2015 2016 2017
Export Import
(Billion USD)
(Billion USD)
2008 2009 2010 2011 2012 2013 2014 2015 2016 2017
Export 1,398 1,074 1,217 1,433 1,377 1,435 1,481 1,308 1,319 1,434
Import 1,125 876 1,003 1,206 1,120 1,152 1,178 1,018 1,022 1,135
Balance 274 198 214 227 257 282 303 290 297 300 Source: IMF http://data.imf.org/?sk=7A51304B-6426-40C0-83DD-CA473CA1FD52

51Trade and InvestmentChapter 3
Trade Balance (U.K.)3-7 貿易収支(イギリス)
0
500
1,000
1,500
2,000
2,500
2008 2009 2010 2011 2012 2013 2014 2015 2016 2017
Export Import
(Billion USD)
(Billion USD)
2008 2009 2010 2011 2012 2013 2014 2015 2016 2017
Export 469 356 413 494 476 473 489 441 408 441
Import 639 489 561 646 648 660 692 622 591 616
Balance -171 -133 -148 -152 -172 -188 -202 -181 -183 -175 Source: IMF http://data.imf.org/?sk=7A51304B-6426-40C0-83DD-CA473CA1FD52

52Trade and InvestmentChapter 3
Trade Balance (South Korea)3-8 貿易収支(韓国)
0
500
1,000
1,500
2,000
2,500
2008 2009 2010 2011 2012 2013 2014 2015 2016 2017
Export Import
(Billion USD)
(Billion USD)
2008 2009 2010 2011 2012 2013 2014 2015 2016 2017
Export 433 364 464 587 604 618 613 543 512 577
Import 421 316 416 558 554 535 524 421 393 457
Balance 12 48 48 29 49 83 89 122 119 120Source: IMF http://data.imf.org/?sk=7A51304B-6426-40C0-83DD-CA473CA1FD52

53Trade and InvestmentChapter 3
Trade and Investment (U.S.-Japan-China)3-9 日米中の貿易・投資
Source: IMF data compiled by JETRO. https://www.jetro.go.jp/world/gtir/2018.html
Trade (2017) FDI Inflows and Outflows (2017)
Source: U.S. Department of Commerce Ministry of Finance data compiled by JETRO. https://www.jetro.go.jp/world/gtir/2018.html
(Million USD) (Million USD)
Japan
China U.S.
51,9819,679
966
-504
9,850
5,831
Japan
China U.S.
135,076132,817
137,529
433,745
130,370
67,696

55Trade and InvestmentChapter 3
(Billion USD, % of GDP)Outward Foreign Direct Investment (FDI) (Stock)
2008 2009 2010 2011 2012 2013 2014 2015 2016 2017
U.S.3,102 4,322 4,810 4,514 5,223 6,254 6,277 6,008 6,361 7,799
(20.9%) (29.8%) (31.9%) (28.9%) (32.1%) (37.2%) (35.8%) (33.0%) (34.0%) (40.0%)
China184 246 317 425 532 660 883 1,098 1,357 1,482
(4.0%) (4.8%) (5.2%) (5.7%) (6.2%) (6.9%) (8.4%) (9.8%) (12.1%) (12.3%)
Japan680 741 831 956 1,038 1,118 1,152 1,229 1,315 1,520
(13.5%) (14.2%) (14.6%) (15.5%) (16.7%) (21.7%) (23.8%) (28.1%) (26.6%) (31.3%)
GermanyD 1,190 D 1,323 D 1,365 D 1,435 D 1,572 D 1,507 D 1,399 D 1,350 D 1,336 1,607
(31.7%) (38.7%) (39.9%) (38.2%) (44.3%) (40.2%) (36.0%) (40.0%) (38.4%) (43.7%)
U.K.1,632 1,643 1,686 1,729 1,694 1,796 1,681 1,557 1,492 1,532
(56.4%) (69.0%) (69.1%) (66.0%) (63.6%) (65.6%) (55.6%) (54.0%) (56.4%) (58.5%)
S. KoreaA 98 A 121 A 144 A 172 A 203 A 239 A 261 A 286 A 310 A 356
(9.8%) (13.4%) (13.2%) (14.3%) (16.6%) (18.3%) (18.5%) (20.7%) (22.0%) (23.1%)
A Asset/Liability basis. D Directional basis calculated from Asset/Liability basis.Source: UNCTAD http://unctadstat.unctad.org/wds/ReportFolders/reportFolders.aspx
54Trade and InvestmentChapter 3
Outward Foreign Direct Investment (FDI) (Stock)3-10 対外直接投資残高
0
20
40
60
80
2008 2009 2010 2011 2012 2013 2014 2015 2016 2017
U.S.
China
Japan
Germany
U.K.
South Korea
Source: UNCTAD http://unctadstat.unctad.org/wds/ReportFolders/reportFolders.aspx
(% of GDP)

57Trade and InvestmentChapter 3
(Million USD, % of GDP)Outward FDI (Flow)
2008 2009 2010 2011 2012 2013 2014 2015 2016 2017
U.S.308,296 287,901 277,779 396,569 318,196 303,432 294,754 262,569 280,682 342,269
(2.1%) (2.0%) (1.8%) (2.5%) (2.0%) (1.8%) (1.7%) (1.4%) (1.5%) (1.8%)
China55,907 56,529 68,811 74,654 87,804 107,844 123,120 145,667 196,149 124,630
(1.2%) (1.1%) (1.1%) (1.0%) (1.0%) (1.1%) (1.2%) (1.3%) (1.8%) (1.0%)
Japan128,020 74,699 56,263 107,599 122,549 135,749 130,843 134,233 145,243 160,449
(2.5%) (1.4%) (1.0%) (1.8%) (2.0%) (2.6%) (2.7%) (3.1%) (2.9%) (3.3%)
GermanyD 71,507 D 68,541 D 125,451 D 77,929 D 62,164 D 42,271 D 99,584 D 108,177 D 51,460 D 82,336
(1.9%) (2.0%) (3.7%) (2.1%) (1.8%) (1.1%) (2.6%) (3.2%) (1.5%) (2.2%)
U.K.198,185 28,965 48,092 95,587 20,700 40,486 -151,286 -83,492 -22,516 99,614
(6.9%) (1.2%) (2.0%) (3.7%) (0.8%) (1.5%) (-5.0%) (-2.9%) (-0.9%) (3.8%)
S. KoreaA 19,633 A 17,436 A 28,280 A 29,705 A 30,632 A 28,360 A 28,039 A 23,760 A 29,961 A 31,676
(2.0%) (1.9%) (2.6%) (2.5%) (2.5%) (2.2%) (2.0%) (1.7%) (2.1%) (2.1%)
A Asset/Liability basis. D Directional basis calculated from Asset/Liability basis.Source: UNCTAD http://unctadstat.unctad.org/wds/ReportFolders/reportFolders.aspx
56Trade and InvestmentChapter 3
Outward FDI (Flow)3-11 対外直接投資フロー
-7.5
-5.0
-2.5
0.0
2.5
5.0
7.5
2008 2009 2010 2011 2012 2013 2014 2015 2016 2017
U.S.
China
Japan
Germany
U.K.
South Korea
Source: UNCTAD http://unctadstat.unctad.org/wds/ReportFolders/reportFolders.aspx
(% of GDP)

59Trade and InvestmentChapter 3
(Billion USD, % of GDP)Inward FDI (Stock)
2008 2009 2010 2011 2012 2013 2014 2015 2016 2017
U.S.2,486 2,995 3,422 3,499 3,916 4,948 5,457 5,710 6,556 7,807
(16.8%) (20.6%) (22.7%) (22.4%) (24.1%) (29.5%) (31.1%) (31.3%) (35.0%) (40.0%)
China378 473 588 712 833 957 1,085 1,221 1,355 1,491
(8.2%) (9.2%) (9.7%) (9.5%) (9.7%) (9.9%) (10.3%) (10.9%) (12.1%) (12.4%)
Japan203 200 215 226 206 171 172 174 191 207
(4.0%) (3.8%) (3.8%) (3.7%) (3.3%) (3.3%) (3.5%) (4.0%) (3.9%) (4.3%)
GermanyD 789 D 964 D 956 D 998 D 1,077 D 968 D 860 D 776 D 786 931
(21.0%) (28.2%) (28.0%) (26.6%) (30.4%) (25.8%) (22.1%) (23.0%) (22.6%) (25.3%)
U.K.911 1,026 1,068 1,158 1,440 1,513 1,582 1,408 1,476 1,564
(31.5%) (43.1%) (43.8%) (44.2%) (54.1%) (55.2%) (52.3%) (48.8%) (55.7%) (59.7%)
S. KoreaA 95 A 122 A 136 A 135 A 158 A 181 A 179 A 180 A 189 A 231
(9.5%) (13.5%) (12.4%) (11.2%) (12.9%) (13.9%) (12.7%) (13.0%) (13.4%) (15.0%)
A Asset/Liability basis. D Directional basis calculated from Asset/Liability basis.Source: UNCTAD http://unctadstat.unctad.org/wds/ReportFolders/reportFolders.aspx
58Trade and InvestmentChapter 3
Inward FDI (Stock)3-12 対内直接投資残高
0.0
25.0
50.0
75.0
2008 2009 2010 2011 2012 2013 2014 2015 2016 2017
U.S.
China
Japan
Germany
U.K.
South Korea
Source: UNCTAD http://unctadstat.unctad.org/wds/ReportFolders/reportFolders.aspx
(% of GDP)

61Trade and InvestmentChapter 3
(Million USD, % of GDP)Inward FDI (Flow)
2008 2009 2010 2011 2012 2013 2014 2015 2016 2017
U.S.306,366 143,604 198,049 229,862 199,034 201,393 201,734 465,765 457,126 275,381
(2.1%) (1.0%) (1.3%) (1.5%) (1.2%) (1.2%) (1.2%) (2.6%) (2.4%) (1.4%)
China108,312 95,000 114,734 123,985 121,080 123,911 128,500 135,610 133,710 136,320
(2.4%) (1.9%) (1.9%) (1.7%) (1.4%) (1.3%) (1.2%) (1.2%) (1.2%) (1.1%)
Japan24,425 11,938 -1,252 -1,758 1,732 2,304 12,030 3,309 11,388 10,430
(0.5%) (0.2%) (0.0%) (0.0%) (0.0%) (0.0%) (0.3%) (0.1%) (0.2%) (0.2%)
GermanyD 8,127 D 23,806 D 65,643 D 67,514 D 28,181 D 15,573 D 4,863 D 33,276 D 16,982 D 34,726
(0.2%) (0.7%) (1.9%) (1.8%) (0.8%) (0.4%) (0.1%) (1.0%) (0.5%) (0.9%)
U.K.92,158 89,709 58,200 42,200 55,446 51,676 24,690 32,720 196,130 15,090
(3.2%) (3.8%) (2.4%) (1.6%) (2.1%) (1.9%) (0.8%) (1.1%) (7.4%) (0.6%)
S. KoreaA 11,188 A 9,022 A 9,497 A 9,773 A 9,496 A 12,767 A 9,274 A 4,104 A 12,104 A 17,053
(1.1%) (1.0%) (0.9%) (0.8%) (0.8%) (1.0%) (0.7%) (0.3%) (0.9%) (1.1%)
A Asset/Liability basis. D Directional basis calculated from Asset/Liability basis.Source: UNCTAD http://unctadstat.unctad.org/wds/ReportFolders/reportFolders.aspx
60Trade and InvestmentChapter 3
Inward FDI (Flow)3-13 対内直接投資フロー
-2.0
0.0
2.0
4.0
6.0
8.0
2008 2009 2010 2011 2012 2013 2014 2015 2016 2017
U.S.
China
Japan
Germany
U.K.
South Korea
Source: UNCTAD http://unctadstat.unctad.org/wds/ReportFolders/reportFolders.aspx
(% of GDP)

63Trade and InvestmentChapter 3
(Million USD)Inward FDI (Flow) by Source
2008 2009 2010 2011 2012 2013 2014 2015 2016 2017
1 U.S. 11,792 1,831 2,961 -3,197 -110 1,378 7,131 4,338 6,293 5,831
2 France 177 371 1,128 3,438 -463 -645 1,998 2,063 4,583 4,000
3 Netherlands 2,692 2,584 -7,733 3 -435 537 653 1,568 4,147 3,946
4 Singapore 2,716 756 1,575 782 978 325 1,362 1,893 3,143 3,447
5 Cayman Islands 3,592 965 616 -1,294 -1,953 -1,104 414 -2,313 1,387 2,688
S. Korea 279 255 274 197 559 48 669 932 593 974
China 37 -137 314 109 72 140 767 636 -93 966
Germany 1,185 389 2,206 18 449 10 1,259 -3,394 823 663
U.K. -1,289 5,629 4,817 1,792 1,212 618 432 -1,527 5,601 -3,845
EU 2,943 9,207 132 4,537 -3,005 1,401 3,672 -2,104 21,057 3,082
ASEAN 2,740 985 1,810 831 1,003 317 1,648 2,324 3,814 3,203
TOTAL 24,550 11,839 -1,359 -1,702 1,761 2,358 19,770 5,253 39,314 18,840Notes: Balance of payments basis, net. Because of the changes in the calculation method of the balance of payments, there is no continuity
between the data before 2013 and the data after 2014.Source: Ministry of Finance and Bank of Japan data compiled by JETRO. https://www.jetro.go.jp/world/japan/stats/fdi.html
62Trade and InvestmentChapter 3
FDI (Japan) (Flow)3-14 直接投資フロー(日本)
(Million USD)Outward FDI (Flow) by Destination
2008 2009 2010 2011 2012 2013 2014 2015 2016 2017
1 U.S. 44,674 10,660 9,193 14,730 31,974 43,703 49,437 50,218 52,584 51,981
2 U.K. 6,744 2,126 4,624 14,125 11,882 13,319 6,273 13,979 49,983 21,628
3 Netherlands 6,514 6,698 3,288 5,346 8,638 8,636 6,401 10,070 9,019 18,552
4 China 6,496 6,899 7,252 12,649 13,479 9,104 10,889 10,011 9,453 9,679
5 Singapore 1,089 2,881 3,845 4,492 1,566 3,545 8,144 7,010 -18,581 9,677
Germany 3,905 2,089 -321 2,165 1,797 2,653 3,423 3,925 1,714 4,670
S. Korea 2,369 1,077 1,085 2,439 3,996 3,296 3,196 1,593 1,626 1,700
EU 22,939 17,039 8,359 36,052 29,023 30,999 27,026 35,785 69,122 56,845
ASEAN 6,309 7,002 8,930 19,645 10,675 23,619 22,819 20,920 -5,340 22,011
TOTAL 130,801 74,650 57,223 108,808 122,355 135,049 138,018 138,428 173,855 168,587Notes: Balance of payments basis, net. Because of the changes in the calculation method of the balance of payments, there is no continuity
between the data before 2013 and the data after 2014.Source: Ministry of Finance and Bank of Japan data compiled by JETRO. https://www.jetro.go.jp/world/japan/stats/fdi.html

65Trade and InvestmentChapter 3
(Million USD)Inward FDI (Stock) by Source
2008 2009 2010 2011 2012 2013 2014 2015 2016 2017
1 U.S. 74,344 75,003 72,497 70,908 61,756 52,402 57,559 56,796 60,654 59,212
2 Netherlands 36,510 36,034 36,890 39,936 31,607 27,664 26,395 30,581 32,941 40,790
3 France 16,233 15,208 19,193 20,505 18,033 14,249 23,353 25,325 28,832 31,065
4 Singapore 10,047 10,632 13,901 16,031 15,383 13,360 14,437 15,018 20,216 22,566
5 U.K. 6,750 7,318 9,386 15,894 15,471 13,115 15,761 16,005 18,811 15,277
Germany 6,592 7,166 10,009 9,651 8,386 6,438 8,881 6,359 7,735 7,934
S. Korea 1,235 1,444 1,933 2,225 2,851 2,079 2,346 3,234 3,429 4,067
China 225 197 399 560 552 576 1,162 1,911 1,616 2,544
EU 75,600 74,832 82,236 94,293 81,271 68,462 82,980 87,132 105,564 113,060
ASEAN 10,193 11,004 14,596 16,835 16,150 14,062 16,316 17,425 23,124 25,765
TOTAL 204,433 199,991 214,722 226,224 206,301 170,597 198,231 205,699 241,071 253,480Notes: Balance of payments basis, net. Because of the changes in the calculation method of the balance of payments, there is no continuity
between the data before 2013 and the data after 2014.Source: Ministry of Finance and Bank of Japan data compiled by JETRO. https://www.jetro.go.jp/world/japan/stats/fdi.html
64Trade and InvestmentChapter 3
FDI (Japan) (Stock)3-15 直接投資残高(日本)
(Million USD)Outward FDI (Stock) by Destination
2008 2009 2010 2011 2012 2013 2014 2015 2016 2017
1 U.S. 226,611 230,948 251,805 275,504 286,529 331,439 381,845 418,928 452,512 491,368
2 U.K. 32,576 31,282 37,956 48,194 53,956 67,742 77,533 89,030 123,938 152,635
3 Netherlands 72,172 77,470 75,995 84,950 94,444 96,451 96,745 106,367 105,305 128,528
4 China 49,002 55,045 66,478 83,379 93,215 98,132 104,408 108,902 108,734 118,438
5 Australia 19,107 32,557 39,856 49,417 61,344 54,112 62,595 67,460 65,979 69,747
S. Korea 12,180 12,603 15,043 17,968 25,594 29,850 31,897 31,492 31,964 36,883
Germany 11,992 15,096 15,316 16,715 16,906 17,071 19,481 21,207 21,709 27,501
EU 161,783 174,881 182,194 215,484 237,800 259,153 267,283 290,918 324,072 397,711
ASEAN 67,654 75,746 90,749 110,954 122,269 136,258 159,933 166,997 167,216 204,543
TOTAL 683,872 740,364 830,464 957,703 1,040,463 1,117,267 1,185,447 1,261,020 1,356,717 1,550,808Notes: Balance of payments basis, net. Because of the changes in the calculation method of the balance of payments, there is no continuity
between the data before 2013 and the data after 2014.Source: Ministry of Finance and Bank of Japan data compiled by JETRO. https://www.jetro.go.jp/world/japan/stats/fdi.html

67Trade and InvestmentChapter 3
(Million USD)Inward FDI (Flow) by Source
2008 2009 2010 2011 2012 2013 2014 2015 2016 2017
1 Canada 16,794 30,366 7,357 18,790 17,326 14,933 23,479 58,887 67,053 71,904
2 Japan 22,321 6,544 15,805 17,077 22,114 46,413 44,891 32,997 31,610 43,868
3 U.K. 52,609 18,373 30,069 46,316 39,640 32,023 -94,851 50,294 57,267 43,694
4 Switzerland 45,660 10,710 41,406 19,894 16,110 18,420 31,139 -5,732 56,155 21,082
5 France 12,950 25,369 8,865 795 25,433 -7,021 10,197 33,472 28,104 20,757
Germany 17,122 12,320 18,760 16,396 6,772 12,427 37,121 25,353 14,931 11,899
China 500 500 1,037 1,105 3,419 1,920 2,201 5,127 25,445 -504
S. Korea 1,440 236 2,245 4,978 6,185 6,601 9,024 1,302 3,392 10,392
EU 234,331 99,073 151,055 128,687 156,994 114,304 93,768 338,691 318,177 150,267
ASEAN 10,272 1,535 1,220 3,400 488 1,713 6,890 4,038 -602 -2,022
TOTAL 306,366 143,604 198,049 229,862 199,034 201,393 201,733 467,625 471,792 277,258Note: Financial inflow transactions without current-cost adjustment.Sources: U.S. Department of Commerce ASEAN: Compiled by Keizai Koho Center from U.S. Department of Commerce data.
http://www.bea.gov/international/di1usdbal
66Trade and InvestmentChapter 3
FDI (U.S.)3-16 直接投資(米国)
(Million USD)Outward FDI (Flow) by Destination
2008 2009 2010 2011 2012 2013 2014 2015 2016 20171 Ireland 31,795 23,528 28,865 26,381 30,836 21,924 47,993 69,631 50,035 44,6692 Netherlands 38,639 51,588 44,979 86,000 48,052 57,740 24,320 41,337 44,203 34,5423 Luxembourg 27,079 22,194 48,156 48,113 15,622 39,161 37,125 -365 30,833 33,4444 Bermuda 7,824 29,149 12,976 21,072 11,991 17,804 15,429 25,106 31,015 30,0315 Switzerland 25,168 15,383 -353 7,439 12,091 8,641 19,291 17,059 20,732 30,026
U.K. 29,615 28,940 38,839 25,605 41,790 25,301 29,112 14,426 33,469 23,093China 15,971 -7,512 5,420 -1,720 -1,223 7,397 11,033 6,029 8,561 9,850Japan -1,656 11,138 917 2,787 943 6,227 -13,003 5,177 -1,398 9,653Germany 775 7,839 5,898 8,187 1,860 -2,409 -115 1,691 4,424 2,148S. Korea 2,157 3,200 2,745 3,277 1,838 2,493 4,795 2,225 1,902 1,693
EU 178,415 165,064 175,995 235,409 158,958 157,885 159,695 152,317 186,333 163,989ASEAN 11,086 7,784 21,960 16,451 20,408 22,628 35,313 23,984 11,609 15,339
TOTAL 308,296 287,901 277,779 396,569 318,196 303,432 333,014 264,359 289,261 300,378Note: Financial outflow transactions without current-cost adjustment.Sources: U.S. Department of Commerce ASEAN: Compiled by Keizai Koho Center from U.S. Department of Commerce data.
http://www.bea.gov/international/di1usdbal

69Trade and InvestmentChapter 3
(Billion USD)Inward FDI (Flow) by Source
2008 2009 2010 2011 2012 2013 2014 2015 2016
1 Hong Kong 41.04 46.08 60.57 70.50 65.56 73.40 81.27 86.39 81.47
2 British Virgin Islands 15.95 11.30 10.45 9.72 7.83 6.16 6.23 7.39 6.74
3 Singapore 4.44 3.60 5.43 6.10 6.31 7.23 5.83 6.90 6.05
4 Cayman Islands 3.14 2.58 2.50 2.24 1.98 1.67 1.26 1.44 5.15
5 S. Korea 3.14 2.70 2.69 2.55 3.04 3.05 3.97 4.03 4.75
Japan 3.65 4.10 4.08 6.33 7.35 7.06 4.33 3.19 3.10
Germany 0.90 1.22 0.89 1.13 1.45 2.08 2.07 1.56 2.71
U.S. 2.94 2.55 3.02 2.37 2.60 2.82 2.37 2.09 2.39
U.K. 0.91 0.68 0.71 0.58 0.41 0.39 0.74 0.50 1.35
TOTAL 92.40 90.03 105.73 116.01 111.72 117.59 119.56 126.27 126.00Note: Including foreign direct investments and other foreign investments and the basic condition of registration of foreign funded enterprises.Source: Data are from the Ministry of Commerce of the People’s Republic of China compiled by the National Bureau of Statistics of the People's
Republic of China.http://www.stats.gov.cn/english/Statisticaldata/AnnualData/
68Trade and InvestmentChapter 3
FDI (China)3-17 直接投資(中国)
(Million USD)Outward FDI (Flow) by Destination
2008 2009 2010 2011 2012 2013 2014 2015 20161 Hong Kong 38,640 35,601 38,505 35,655 51,238 62,824 70,867 89,790 114,2332 U.S. 462 909 1,308 1,811 4,048 3,873 7,596 8,029 16,9813 Cayman Islands 1,524 5,366 3,496 4,936 827 9,253 4,192 10,213 13,5234 Virgin Islands 2,104 1,612 6,120 6,208 2,239 3,222 4,570 1,849 12,2885 Australia 1,892 2,436 1,702 3,165 2,173 3,458 4,049 3,401 4,187
Germany 183 179 412 512 799 911 1,439 410 2,381U.K. 17 192 330 1,420 2,775 1,420 1,499 1,848 1,480S. Korea 97 265 -722 342 942 269 549 1,325 1,148Japan 59 84 338 149 211 434 394 240 344
TOTAL 55,907 56,529 68,811 74,654 87,804 107,844 123,120 145,667 196,149Notes: Overseas direct investment includes basic situation of domestic investors and overseas enterprises, investment, earnings and their
distribution between domestic and overseas invested enterprises, import and export of commodities through overseas enterprises and approval of overseas enterprises.Statistics cover all types of overseas corporate and non-corporate enterprises by direct investment of domestic investors.Data are from the Ministry of Commerce through comprehensive surveys.
Source: Data are from the Ministry of Commerce of the People’s Republic of China compiled by the National Bureau of Statistics of the People's Republic of China.http://www.stats.gov.cn/english/Statisticaldata/AnnualData/
71Trade and InvestmentChapter 3
(Million USD)Inward FDI (Flow) by Source
2008 2009 2010 2011 2012 2013 2014 2015 2016 2017
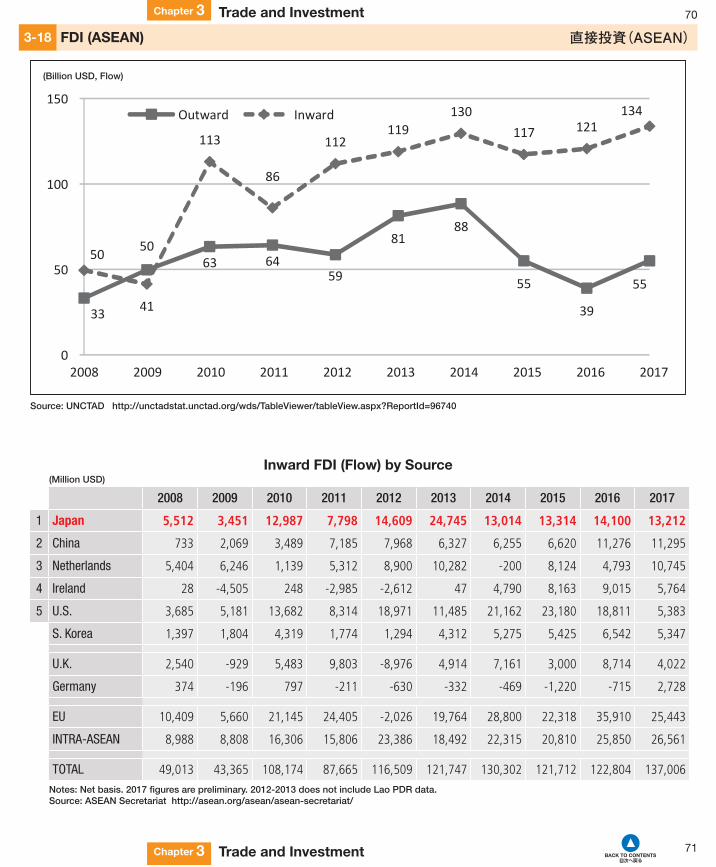
1 Japan 5,512 3,451 12,987 7,798 14,609 24,745 13,014 13,314 14,100 13,212
2 China 733 2,069 3,489 7,185 7,968 6,327 6,255 6,620 11,276 11,295
3 Netherlands 5,404 6,246 1,139 5,312 8,900 10,282 -200 8,124 4,793 10,745
4 Ireland 28 -4,505 248 -2,985 -2,612 47 4,790 8,163 9,015 5,764
5 U.S. 3,685 5,181 13,682 8,314 18,971 11,485 21,162 23,180 18,811 5,383
S. Korea 1,397 1,804 4,319 1,774 1,294 4,312 5,275 5,425 6,542 5,347
U.K. 2,540 -929 5,483 9,803 -8,976 4,914 7,161 3,000 8,714 4,022
Germany 374 -196 797 -211 -630 -332 -469 -1,220 -715 2,728
EU 10,409 5,660 21,145 24,405 -2,026 19,764 28,800 22,318 35,910 25,443
INTRA-ASEAN 8,988 8,808 16,306 15,806 23,386 18,492 22,315 20,810 25,850 26,561
TOTAL 49,013 43,365 108,174 87,665 116,509 121,747 130,302 121,712 122,804 137,006Notes: Net basis. 2017 figures are preliminary. 2012-2013 does not include Lao PDR data.Source: ASEAN Secretariat http://asean.org/asean/asean-secretariat/
70Trade and InvestmentChapter 3
FDI (ASEAN)3-18 直接投資(ASEAN)
33
5063 64
59
8188
55
39
55
50
41
113
86
112119
130117 121
134
0
50
100
150
2008 2009 2010 2011 2012 2013 2014 2015 2016 2017
Outward Inward
Source: UNCTAD http://unctadstat.unctad.org/wds/TableViewer/tableView.aspx?ReportId=96740
(Billion USD, Flow)

73Trade and InvestmentChapter 3
Outward FDI (Flow) by Destination (in EUR) Inward FDI (Flow) by Source (in EUR)
(Billion EUR) (Billion EUR)
2013 2014 2015 2016 2013 2014 2015 2016
1 Switzerland 20.1 -33.0 48.8 62.4 1 Switzerland 18.3 26.9 78.3 80.5
2 Brazil 45.0 32.8 28.9 37.6 2 U.S. 352.8 -24.8 252.4 55.7
3 UAE N/A 28.0 3 Japan 9.7 10.6 6.1 49.7
4 Australia 11.9 9.3 -8.5 21.8 4 Canada 16.2 12.4 24.2 32.1
5 China 20.9 8.8 6.0 12.5 5 Israel N/A 11.7
U.S. 274.4 -83.3 323.5 N/A China 6.6 7.9 6.3 10.2
Japan 8.2 -0.6 10.9 N/A Russia 7.3 10.4 4.5 7.4
S. Korea 0.8 5.5 -4.5 N/A S. Korea 1.3 4.5 2.2 N/A
Total (Extra EU-28) 546.8 58.3 537.2 248.4 Total (Extra EU-28) 506.8 98.7 466.5 379.4
Note: Extra EU-28 refers to transactions with all countries outside of the EU.Sources: European Commision, DG Trade Statistical Guide
Eurostat
72Trade and InvestmentChapter 3
FDI (EU)3-19 直接投資(EU)
753
353
462 494
407341
222
607
453
436
305
391
363435
492
345260
516
524
304
0
250
500
750
1,000
2008 2009 2010 2011 2012 2013 2014 2015 2016 2017
Outward
Inward
Source: UNCTAD http://unctadstat.unctad.org/wds/TableViewer/tableView.aspx?ReportId=96740
(Billion USD, Flow) FDI (in USD)

74Trade and InvestmentChapter 3
Outbound M&A3-20 対外M&A
2013 2014 2015 2016 2017
U.S.# of deals 2,066 2,374 2,462 2,374 2,433Value (Million USD) 119,428.5 244,721.3 200,301.8 253,056.2 265,654.2 Top 3 U.K., Germany, Netherlands Ireland, Canada, U.K. U.K., Germany, France Germany, U.K., Canada U.K., Switzerland, Japan
China# of deals 387 459 623 909 858Value (Million USD) 64,340.3 53,088.6 105,813.0 207,606.2 118,532.0 Top 3 U.S., H.K., Australia H.K., U.S., Singapore H.K., Italy, U.S. U.S., Switzerland, Israel H.K., Singapore, U.K.
Hong Kong(H.K.)
# of deals 489 531 577 702 680Value (Million USD) 26,920.1 44,374.9 48,664.3 50,048.9 50,726.5 Top 3 China, Netherlands, Singapore China, U.S., Australia China, U.K., Singapore China, Australia, U.S. China, Germany, Canada
Japan# of deals 630 666 759 779 784Value (Million USD) 47,474.0 56,365.9 87,289.4 96,363.9 65,371.5 Top 3 U.S., Thailand, Germany U.S., H.K., India U.S., H.K., U.K. U.K., U.S., Czech Republic U.S., China, Singapore
Germany# of deals 447 514 546 551 649Value (Million USD) 21,633.3 110,175.5 19,834.3 116,653.7 34,585.0 Top 3 Luxembourg, U.S., Norway U.S., Luxembourg, Sweden Italy, U.S., U.K. U.S., France, Spain Austria, France, U.S.
U.K.# of deals 928 1090 1,110 1,114 1,206Value (Million USD) 74,452.3 137,873.7 110,025.9 123,146.1 107,605.2 Top 3 Germany, U.S., India U.S., Spain, Netherlands U.S., Netherlands, Germany U.S., Netherlands, Poland U.S., India, Germany
Canada# of deals 641 714 703 723 845Value (Million USD) 57,928.2 68,138.5 133,761.8 142,941.2 94,572.9 Top 3 U.S., Australia, U.K. U.S., France, Isle of Man U.S., U.K., Australia U.S., Brazil, U.K. U.S., U.K., Chile
S. Korea# of deals 94 107 91 120 125Value (Million USD) 4,450.1 3,602.7 2,930.8 14,085.7 5,425.3 Top 3 Canada, U.S., Australia U.S., Bangladesh, Malaysia U.S., China, Vietnam U.S., Japan. H.K. U.S., H.K., Brazil
Note: Excluding property acquisitions. Source: Refinitiv (Former Thomson Reuters)

75Trade and InvestmentChapter 3
Inbound M&A3-21 対内M&A
2013 2014 2015 2016 2017
U.S.# of deals 1,272 1,586 1,715 1,790 2,114Value (Million USD) 142,639.6 287,557.8 431,122.1 502,642.8 247,644.9Top 3 Canada, U.K., Japan Germany, U.K., Japan Canada, Ireland, U.K. Canada, U.K., Germany Canada, U.K., Japan
China# of deals 631 691 712 731 698Value (Million USD) 34,378.1 44,853.8 54,366.5 39,514.2 45,631.9Top 3 H.K., U.S., Singapore H.K., Singapore, U.S. H.K., U.S., Qatar H.K., Singapore, Cayman Islands H.K., Japan, U.S.
Hong Kong(H.K.)
# of deals 193 243 273 354 348Value (Million USD) 18,652.1 34,085.1 56,540.5 18,401.0 43,350.1Top 3 China, U.K. Singapore China, Singapore, Japan China, Japan, Qatar China, S. Korea, U.S. China, Cayman Islands, U.S.
Japan# of deals 97 170 155 159 143Value (Million USD) 4,950.8 10,681.6 25,472.5 12,884.1 27,742.0Top 3 U.S., Taiwan, Cayman Islands U.S., Singapore, H.K. France, U.S., Denmark U.S., Taiwan, S. Korea U.S., China, H.K.
Germany# of deals 563 649 618 791 730Value (Million USD) 62,901.0 46,630.6 44,230.5 84,538.6 63,036.4Top 3 U.K., U.S., Spain U.K.,U.S., Luxembourg U.S., U.K., Canada U.S., China, France U.S., France, U.K.
U.K.# of deals 792 948 1,063 1,129 1,126Value (Million USD) 47,270.3 93,223.5 331,495.9 127,092.7 110,421.1Top 3 U.S., France, Japan U.S., Switzerland, Qatar Belgium, Netherlands, U.S. U.S., Japan, China U.S., China, Canada
Canada# of deals 479 494 526 513 568Value (Million USD) 20,650.8 55,899.5 19,226.9 41,153.2 35,711.9Top 3 U.S., U.K., Colombia U.S., Spain, Switzerland U.S., France, U.K. U.S., U.K., China U.S., H.K., Switzerland
S. Korea# of deals 118 148 162 141 132Value (Million USD) 5,540.7 16,430.9 7,662.0 5,146.2 8,622.0Top 3 U.S., Japan, H.K. Belgium, U.S., Saudi Arabia Japan, China, Saudi Arabia U.S., China, H.K. U.K., U.S., Canada
Note: Excluding property acquisitions. Source: Refinitiv (Former Thomson Reuters)
76Trade and InvestmentChapter 3
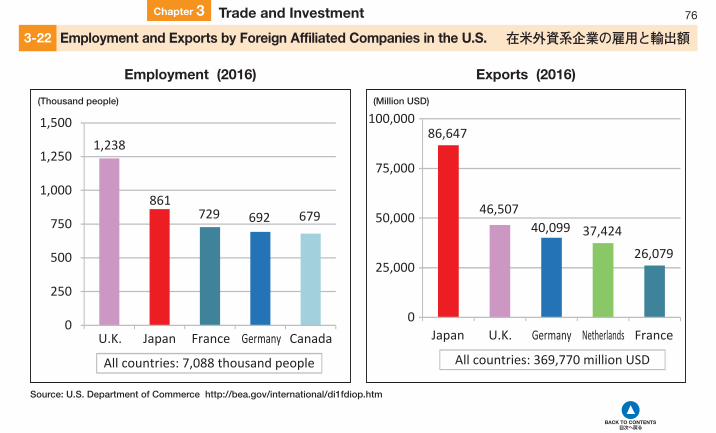
Employment and Exports by Foreign Affiliated Companies in the U.S.3-22 在米外資系企業の雇用と輸出額
86,647
46,50740,099 37,424
26,079
0
25,000
50,000
75,000
100,000
Japan U.K. Germany Netherlands France
All countries: 369,770 million USD
Source: U.S. Department of Commerce http://bea.gov/international/di1fdiop.htm
All countries: 7,088 thousand people
1,238
861729 692 679
0
250
500
750
1,000
1,250
1,500
U.K. Japan France Germany Canada
Employment (2016)
(Million USD)
Exports (2016)
(Thousand people)

77Trade and InvestmentChapter 3
Global Competitiveness Index 4.0Editor's Choice 世界競争力ランキング
2018Rank
Country / Economy Score
Diff. from 2017 2018Rank
Country / Economy Score
Diff. from 2017
Rank Score Rank Score
1 U.S. 85.6 — +0.8 11 Finland 80.3 +1 +0.5
2 Singapore 83.5 — +0.5 12 Canada 79.9 –2 –0.1
3 Germany 82.8 — +0.2 13 Taiwan 79.3 — +0.1
4 Switzerland 82.6 — +0.2 14 Australia 78.9 +1 +0.7
5 Japan 82.5 +3 +0.9 15 S. Korea 78.8 +2 +0.8
6 Netherlands 82.4 –1 +0.2 16 Norway 78.2 –2 –0.8
7 Hong Kong 82.3 — +0.3 17 France 78.0 +1 +0.6
8 U.K. 82.0 –2 –0.1 18 New Zealand 77.5 –2 –0.6
9 Sweden 81.7 — +0.1 19 Luxembourg 76.6 +3 +0.6
10 Denmark 80.6 +1 +0.7 20 Israel 76.6 — +0.4
Notes: The Global Competitiveness Index 4.0 captures the determinants of long-term growth. Recent developments are reflected only insofar as they have an impact on data measuring these determinants. Results should be interpreted in this context.Scale ranges from 0 to 100. Rank and score differences with 2017 index, calculated using the GCI 4.0 methodology.
Source: World Economic Forum, Global Competitiveness Report 2018 http://reports.weforum.org/global-competitiveness-report-2018/downloads/

79Education and People ExchangeChapter 4
Arrivals of International Travelers(Thousand people)
2008 2009 2010 2011 2012 2013 2014 2015 2016 2017France 79,218 76,764 76,647 80,499 81,980 83,634 83,701 84,452 82,570 86,918 Spain 57,192 52,178 52,677 56,177 57,464 60,675 64,939 68,175 75,315 81,786 U.S. 58,007 55,103 60,010 62,821 66,657 69,995 75,022 77,465 75,608 75,900 China 53,049 50,875 55,664 57,581 57,725 55,686 55,622 56,886 59,270 60,740 Italy 42,734 43,239 43,626 46,119 46,360 47,704 48,576 50,732 52,372 58,253 Mexico 22,931 22,346 23,290 23,403 23,403 24,151 29,346 32,093 35,079 39,298 U.K. 30,142 28,199 28,295 29,306 29,282 31,063 32,613 34,436 35,814 37,651 Turkey 29,792 30,187 31,364 34,654 35,698 37,795 39,811 39,478 30,289 37,601 Germany 24,884 24,220 26,875 28,374 30,411 31,545 32,999 34,970 35,555 * 37,452 Thailand 14,584 14,150 15,936 19,230 22,354 26,547 24,810 29,923 32,530 35,381 Austria 21,935 21,355 22,004 23,012 24,151 24,813 25,291 26,728 28,121 * 29,460 Japan 8,351 6,790 8,611 6,219 8,358 10,364 13,413 19,737 24,040 28,691 Hong Kong 17,319 16,926 20,085 22,316 23,770 25,661 27,770 26,686 26,553 27,885
S. Korea 6,891 7,818 8,798 9,795 11,140 12,176 14,202 13,232 17,242 13,336 Notes: 2017 figures are estimates. US refers to 2016. *International tourists arrivals at collective tourism establishments.
South Korea and Japan indicate arrivals of non-resident visitors, including same-day visitors. All other countries indicate arrivals of non-resident overnight visitors (tourists).
Source: The World Tourism Organization (UNWTO) http://www.e-unwto.org/toc/unwtotfb/current
78Education and People ExchangeChapter 4
Inbound Tourism4-1 外国人訪問者数
0
10,000
20,000
30,000
40,000
50,000
60,000
70,000
80,000
90,000
2008 2009 2010 2011 2012 2013 2014 2015 2016 2017
U.S.
China
Japan
Germany
U.K.
South Korea
Notes: 2017 figures are estimates. US refers to 2016.South Korea and Japan indicate arrivals of non-resident visitors, including same-day visitors. All other countries indicate arrivals of non-resident overnight visitors (tourists).
Source: The World Tourism Organization (UNWTO) http://www.e-unwto.org/toc/unwtotfb/current
(Thousand people) Arrivals of International Travelers

81Education and People ExchangeChapter 4
Foreign Visitors to Japan(Thousand people)
2008 2009 2010 2011 2012 2013 2014 2015 2016 2017
China 1,000 1,006 1,413 1,043 1,425 1,314 2,409 4,994 6,374 7,356
S. Korea 2,382 1,587 2,440 1,658 2,043 2,456 2,755 4,002 5,090 7,140
Taiwan 1,390 1,024 1,268 994 1,466 2,211 2,830 3,677 4,168 4,564
Hong Kong 550 450 509 365 482 746 926 1,524 1,839 2,232
U.S. 768 700 727 566 717 799 892 1,033 1,243 1,375
U.K. 207 181 184 140 174 192 220 258 292 310
Germany 126 111 124 81 109 122 140 163 183 196
Others 1,926 1,731 1,946 1,372 1,943 2,524 3,241 4,086 4,851 5,518
Total 8,351 6,790 8,611 6,219 8,358 10,364 13,413 19,737 24,040 28,691
Source: Japan National Tourism Organization https://www.jnto.go.jp/jpn/statistics/visitor_trends/index.html
80Education and People ExchangeChapter 4
Foreign Visitors to Japan4-2 訪日外客数
0
5,000
10,000
15,000
20,000
25,000
30,000
2008 2009 2010 2011 2012 2013 2014 2015 2016 2017
Others
Germany
U.K.
U.S.
Hong Kong
Taiwan
South Korea
China
6,790
8,611
6,2198,358
10,364
13,413
19,737
24,040
28,691
From
8,351
Source: Japan National Tourism Organization https://www.jnto.go.jp/jpn/statistics/visitor_trends/index.html
(Thousand people)

83Education and People ExchangeChapter 4
Travel Spending by Foreign Travelers in Japan(Million JPY)
2010 2011 2012 2013 2014 2015 2016 2017
China 2,498 1,964 2,688 2,759 5,583 14,174 14,754 16,947
Taiwan 1,318 1,059 1,648 2,475 3,544 5,207 5,245 5,744
S. Korea 1,973 1,254 1,466 1,978 2,090 3,008 3,577 5,126
Hong Kong 593 430 655 1,054 1,370 2,627 2,947 3,416
U.S. 1,159 813 979 1,362 1,475 1,814 2,130 2,503
U.K. 296 222 283 329 412 545 532 669
Germany 200 112 164 190 209 278 313 356
Others 3,453 2,281 2,978 4,020 5,595 7,118 7,978 9,401
Total 11,490 8,135 10,861 14,167 20,278 34,771 37,476 44,162
Notes: Figures exclude the payments to national carriers for international transport. 2010 result is based on the average value of it's April to December. Source: Japan Tourism Agency http://www.mlit.go.jp/kankocho/siryou/toukei/syouhityousa.html
82Education and People ExchangeChapter 4
Travel Spending by Foreign Travelers in Japan4-3 訪日外国人旅行消費額
Notes: Figures exclude the payments to national carriers for international transport. 2010 result is based on the average value of it's April to December.Source: Japan Tourism Agency http://www.mlit.go.jp/kankocho/siryou/toukei/syouhityousa.html
0
5,000
10,000
15,000
20,000
25,000
30,000
35,000
40,000
45,000
50,000
2010 2011 2012 2013 2014 2015 2016 2017
Others
Germany
U.K.
U.S.
Hong Kong
South Korea
Taiwan
China
8,135 10,86114,167
20,278
34,771 37,476
44,162 From
11,490
(Million JPY)

85Education and People ExchangeChapter 4
Departures of International Travelers(Thousand people)
2007 2008 2009 2010 2011 2012 2013 2014 2015 2016
China 40,954 45,844 47,656 57,386 70,250 83,182 98,185 116,593 127,860 135,130
Germany 82,099 86,201 85,547 85,872 84,692 82,729 87,459 83,008 83,737 90,966
U.S. 64,049 63,653 62,051 61,061 59,209 60,697 61,874 68,176 73,453 N/A
U.K. N/A N/A N/A 53,759 54,946 54,604 56,088 58,364 64,165 69,375
Russia 34,285 36,538 34,276 39,323 43,726 47,813 54,069 45,889 34,550 31,659
Canada 25,163 27,034 26,204 28,680 30,450 32,276 32,971 33,518 32,267 31,278
Italy 27,734 28,284 29,060 29,823 29,295 28,810 27,798 28,460 29,040 30,849
France 28,103 25,506 25,140 25,041 26,155 25,317 26,062 27,919 26,648 26,483
Ukraine 17,335 15,499 15,334 17,180 19,773 21,433 23,761 22,438 23,142 24,668
India 9,783 10,868 11,067 12,988 13,994 14,920 16,626 18,330 20,376 21,872
Saudi Arabia 4,126 4,087 6,032 17,827 15,281 18,671 19,154 19,824 20,819 21,118
Mexico 15,257 14,527 14,104 14,334 14,799 15,581 15,911 18,261 19,603 20,223
Japan 17,295 15,987 15,446 16,637 16,994 18,491 17,473 16,903 16,214 17,116
S. Korea 13,325 11,996 9,494 12,488 12,694 13,737 14,846 16,081 19,310 22,383Notes: South Korea and Japan include departures of same-day visitors (excursionists). All other countries indicate departures of overnight tourists.Source: The World Tourism Organization (UNWTO) http://www.e-unwto.org/toc/unwtotfb/current
84Education and People ExchangeChapter 4
Outbound Tourism4-4 外国旅行者数
0
20,000
40,000
60,000
80,000
100,000
120,000
140,000
160,000
2007 2008 2009 2010 2011 2012 2013 2014 2015 2016
U.S.
China
Japan
Germany
U.K.
South Korea
Notes: South Korea and Japan include departures of same-day visitors (excursionists). All other countries indicate departures of overnight tourists.Source: The World Tourism Organization (UNWTO) http://www.e-unwto.org/toc/unwtotfb/current
(Thousand people) Departures of International Travelers

87Education and People ExchangeChapter 4
Japanese Outbound Travelers(Thousand people)
2007 2008 2009 2010 2011 2012 2013 2014 2015 2016
U.S. 3,531 3,250 2,918 3,386 3,250 3,698 3,730 3,620 3,758 3,577
China 3,977 3,446 3,317 3,731 3,658 3,518 2,878 2,718 2,498 2,587
S. Korea 2,236 2,378 3,053 3,023 3,289 3,519 2,748 2,280 1,838 2,298
Taiwan 1,166 1,087 1,001 1,080 1,295 1,432 1,422 1,635 1,627 1,896
Thailand 1,278 1,154 1,004 994 1,128 1,374 1,536 1,268 1,382 1,440
Hong Kong 846 817 780 824 787 774 608 636 633 693
Germany 662 598 538 605 643 734 712 671 647 545
U.K. 308 239 235 223 237 243 225 222 194 246
Others 3,291 3,019 2,599 2,771 2,708 3,198 3,615 3,853 3,637 3,835
Total 17,295 15,987 15,446 16,637 16,994 18,491 17,473 16,903 16,214 17,116
Note: China, S.Korea, Taiwan and U.K. figures include same-day visitors. Source: Japan National Tourism Organization https://www.jnto.go.jp/jpn/statistics/visitor_trends/index.html
86Education and People ExchangeChapter 4
Japanese Outbound Travelers4-5 日本人出国者数
0
2,000
4,000
6,000
8,000
10,000
12,000
14,000
16,000
18,000
20,000
2007 2008 2009 2010 2011 2012 2013 2014 2015 2016
Others
U.K.
Germany
Hong Kong
ThailandTaiwan
South Korea
China
U.S.
To17,29515,987 15,446 16,637
16,994 18,491 17,47316,903 16,214
17,116
(Thousand people)
Note: China, S.Korea, Taiwan and U.K. figures include same-day visitors.Source: Japan National Tourism Organization https://www.jnto.go.jp/jpn/statistics/visitor_trends/index.html

88Education and People ExchangeChapter 4
Foreign Students by Destination4-6 各国の留学生受入れ数
(Number of foreign and international students in tertiary education, by country of origin and destination)
to Japan to U.S. to U.K. to Germany to China to South Korea
from students from students from students from students from students from students
1 China 76,537 1 China 309,837 1 China 89,318 1 China 25,464 1 China 38,568
2 Vietnam 19,152 2 India 135,733 2 Malaysia 17,360 2 India 11,739 2 Vietnam 3,432
3 S. Korea 12,951 3 S. Korea 60,454 3 Hong Kong 16,717 3 Austria 10,027 3 Mongolia 2,259
4 Nepal 8,425 4 Saudi Arabia 58,385 4 India 16,655 4 Russia 9,711 4 Japan 1,416
5 Indonesia 2,854 5 Canada 28,255 5 Nigeria 16,072 5 France 6,967 5 U.S. 1,266
6 Thailand 2,691 6 Vietnam 22,172 6 U.S. 15,654 6 Cameroon 6,743 6 Uzbekistan 1,074
7 Malaysia 2,245 7 Mexico 17,032 7 Germany 12,963 13 U.S. 5,057 7 Indonesia 948
8 U.S. 2,117 8 Japan 15,437 8 Italy 12,086 14 S. Korea 4,343 8 Pakistan 878
15 Germany 622 12 U.K. 10,279 22 S. Korea 5,024 31 U.K. 2,059 36 Germany 91
21 U.K. 391 21 Germany 7,215 37 Japan 2,944 34 Japan 1,797 41 U.K. 84
Total 143,457 Total 971,417 Total 432,001 Total 244,575 Total 137,527 Total 61,888
Source: OECD https://stats.oecd.org/
(Year 2016)
N/A

89Education and People ExchangeChapter 4
Students Studying Abroad4-7 各国の海外留学生数
(Number of outbound internationally mobile tertiary students studying abroad, by country of origin)
1 China 847,259 11 U.S. 68,580 31 U.K. 33,109
2 India 278,383 12 Malaysia 64,655 35 Japan 30,850
3 Germany 117,921 13 Italy 62,180
4 S. Korea 108,608 14 Bangladesh 60,390
5 Nigeria 95,619 15 Russia 56,915
6 France 90,708 16 Pakistan 51,894
7 Kazakhstan 89,660 17 Iran 51,082
8 Saudi Arabia 85,277 18 Canada 50,506
9 Ukraine 76,181 19 Turkmenistan 47,878
10 Vietnam 70,328 20 Indonesia 46,232
Source: UNESCO Institute of Statistics http://data.uis.unesco.org/Index.aspx?queryid=172
(Year 2017)

91Education and People ExchangeChapter 4
Foreign Students in Japan(Number of students in higher education institutions)
2008 2009 2010 2011 2012 2013 2014 2015 2016 2017
China 72,766 79,082 86,173 87,533 86,324 81,884 77,792 74,921 75,262 79,502
Vietnam 2,873 3,199 3,597 4,033 4,373 6,290 11,174 20,131 28,579 35,489
Nepal 1,476 1,628 1,829 2,016 2,451 3,188 5,291 8,691 13,456 14,850
S. Korea 18,862 19,605 20,202 17,640 16,651 15,304 13,940 13,397 13,571 13,538
Taiwan 5,082 5,332 5,297 4,571 4,617 4,719 4,971 5,610 6,401 6,994
U.S. 2,024 2,230 2,348 1,456 2,133 2,083 1,975 2,223 2,428 2,516
Germany 479 450 554 393 566 599 674 804 836 831
U.K. 400 427 452 364 429 452 454 426 477 563
Others 19,867 20,767 21,322 20,069 20,212 21,000 22,914 25,859 30,112 34,101
Total 123,829 132,720 141,774 138,075 137,756 135,519 139,185 152,062 171,122 188,384
Source: Japan Student Services Organization http://www.jasso.go.jp/statistics/intl_student/ichiran.html
90Education and People ExchangeChapter 4
Foreign Students in Japan4-8 日本への留学生
0
25,000
50,000
75,000
100,000
125,000
150,000
175,000
200,000
2008 2009 2010 2011 2012 2013 2014 2015 2016 2017
Others
U.K.
Germany
U.S.
Taiwan
South Korea
Nepal
Vietnam
China
132,720
141,774138,075 137,756 135,519 139,185
152,062
171,122188,384 From
123,829
Source: Japan Student Services Organization http://www.jasso.go.jp/statistics/intl_student/ichiran.html
(Number of students in higher education institutions)
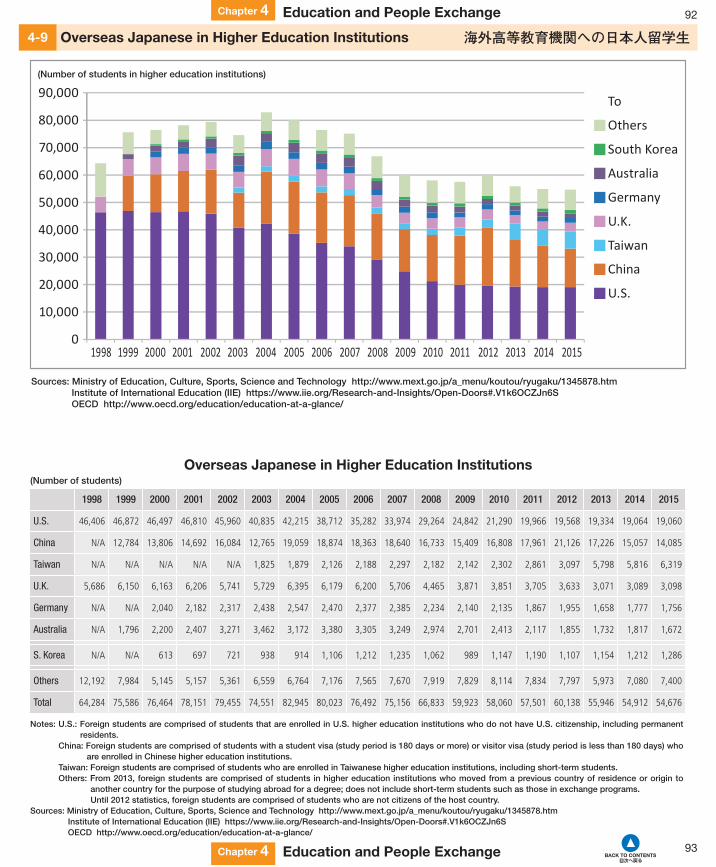
93Education and People ExchangeChapter 4
Notes: U.S.: Foreign students are comprised of students that are enrolled in U.S. higher education institutions who do not have U.S. citizenship, including permanent residents.
China: Foreign students are comprised of students with a student visa (study period is 180 days or more) or visitor visa (study period is less than 180 days) who are enrolled in Chinese higher education institutions.
Taiwan: Foreign students are comprised of students who are enrolled in Taiwanese higher education institutions, including short-term students.Others: From 2013, foreign students are comprised of students in higher education institutions who moved from a previous country of residence or origin to
another country for the purpose of studying abroad for a degree; does not include short-term students such as those in exchange programs. Until 2012 statistics, foreign students are comprised of students who are not citizens of the host country.
Sources: Ministry of Education, Culture, Sports, Science and Technology http://www.mext.go.jp/a_menu/koutou/ryugaku/1345878.htmInstitute of International Education (IIE) https://www.iie.org/Research-and-Insights/Open-Doors#.V1k6OCZJn6SOECD http://www.oecd.org/education/education-at-a-glance/
Overseas Japanese in Higher Education Institutions(Number of students)
1998 1999 2000 2001 2002 2003 2004 2005 2006 2007 2008 2009 2010 2011 2012 2013 2014 2015
U.S. 46,406 46,872 46,497 46,810 45,960 40,835 42,215 38,712 35,282 33,974 29,264 24,842 21,290 19,966 19,568 19,334 19,064 19,060
China N/A 12,784 13,806 14,692 16,084 12,765 19,059 18,874 18,363 18,640 16,733 15,409 16,808 17,961 21,126 17,226 15,057 14,085
Taiwan N/A N/A N/A N/A N/A 1,825 1,879 2,126 2,188 2,297 2,182 2,142 2,302 2,861 3,097 5,798 5,816 6,319
U.K. 5,686 6,150 6,163 6,206 5,741 5,729 6,395 6,179 6,200 5,706 4,465 3,871 3,851 3,705 3,633 3,071 3,089 3,098
Germany N/A N/A 2,040 2,182 2,317 2,438 2,547 2,470 2,377 2,385 2,234 2,140 2,135 1,867 1,955 1,658 1,777 1,756
Australia N/A 1,796 2,200 2,407 3,271 3,462 3,172 3,380 3,305 3,249 2,974 2,701 2,413 2,117 1,855 1,732 1,817 1,672
S. Korea N/A N/A 613 697 721 938 914 1,106 1,212 1,235 1,062 989 1,147 1,190 1,107 1,154 1,212 1,286
Others 12,192 7,984 5,145 5,157 5,361 6,559 6,764 7,176 7,565 7,670 7,919 7,829 8,114 7,834 7,797 5,973 7,080 7,400
Total 64,284 75,586 76,464 78,151 79,455 74,551 82,945 80,023 76,492 75,156 66,833 59,923 58,060 57,501 60,138 55,946 54,912 54,676
92Education and People ExchangeChapter 4
Overseas Japanese in Higher Education Institutions4-9 海外高等教育機関への日本人留学生
Sources: Ministry of Education, Culture, Sports, Science and Technology http://www.mext.go.jp/a_menu/koutou/ryugaku/1345878.htmInstitute of International Education (IIE) https://www.iie.org/Research-and-Insights/Open-Doors#.V1k6OCZJn6SOECD http://www.oecd.org/education/education-at-a-glance/
0
10,000
20,000
30,000
40,000
50,000
60,000
70,000
80,000
90,000
1998 1999 2000 2001 2002 2003 2004 2005 2006 2007 2008 2009 2010 2011 2012 2013 2014 2015
Others
South Korea
Australia
Germany
U.K.
Taiwan
China
U.S.
To
(Number of students in higher education institutions)

94Education and People ExchangeChapter 4
The Times Higher Education World University Rankings
Source: Times Higher Education World University Rankingshttp://www.thewur.com
University Rankings4-10 大学ランキング
Institution Country Institution Country
1 University of Oxford U.K. 11 ETH Zurich-Swiss Federal Institute of Technology Zurich Switzerland
2 University of Cambridge U.K. 12 Johns Hopkins University U.S.
3 Stanford University U.S. 12 University of Pennsylvania U.S.
4 Massachusetts Institute of Technology U.S. 14 University College London U.K.
5 California Institute of Technology U.S. 15 University of California, Berkeley U.S.
6 Harvard University U.S. 16 Columbia University U.S.
7 Princeton University U.S. 17 University of California, Los Angeles U.S.
8 Yale University U.S. 18 Duke University U.S.
9 Imperial College London U.K. 19 Cornell University U.S.
10 University of Chicago U.S. 20 University of Michigan U.S.
42 The University of Tokyo Japan
65 Kyoto University Japan
(2018/19)

95Education and People ExchangeChapter 4
TOEFL iBT Total Score Means
<AFRICA> <EUROPE>
Botswana 88 Austria 100
Mauritius 95 Germany 98
S. Africa 98 Ireland 101
Zimbabwe 88 Netherlands 100
<AMERICAS> U.K. 96
Bahamas 94 <ASIA/PACIFIC REGION>
Canada 95 China 79
Trinidad and Tobago 96 India 94
U.S. 89 Japan 71<MIDDLE EAST> S. Korea 83
Egypt 86 Singapore 97
Israel 91 New Zealand 95
Lebanon 89Notes: The score ranges from 0 to 120. Countries refer to the country of birth. Because of the unreliability of statistics based on small samples, means
are not reported for subgroups of less than 30.Source: Educational Testing Service https://www.ets.org/toefl/research/
TOEFL Scores4-11 国別TOEFLスコア(Year 2017)

97Government Budget, Tax and Other DataChapter 5
(% of GDP)General Government Spending to GDP
* EstimateNote: Total expenditure consists of total expense and the net acquisition of nonfinancial assets.Source: IMF https://www.imf.org/external/pubs/ft/weo/2018/01/weodata/index.aspx
2008 2009 2010 2011 2012 2013 2014 2015 2016 2017
U.S. 37.3 41.6 40.0 39.0 37.3 36.0 35.5 35.2 35.4 35.7
China 22.4 25.5 25.0 27.0 28.1 28.5 29.0 31.3 31.9 31.5
Japan 35.0 39.5 38.5 39.4 39.4 39.5 38.9 38.0 37.8 * 37.5
Germany 43.6 47.6 47.3 44.7 44.3 44.7 44.3 43.9 44.2 44.1
U.K. 40.7 44.3 44.7 43.5 43.5 41.7 40.8 39.8 39.0 38.7
S. Korea 20.8 21.3 19.5 19.9 20.6 20.9 20.8 20.9 20.7 21.1
96Government Budget, Tax and Other DataChapter 5
General Government Spending to GDP5-1 一般政府支出(対GDP比)
0
10
20
30
40
50
2008 2009 2010 2011 2012 2013 2014 2015 2016 2017
U.S.
China
Japan
Germany
U.K.
South Korea
Note: Total expenditure consists of total expense and the net acquisition of nonfinancial assets.Source: IMF https://www.imf.org/external/pubs/ft/weo/2018/01/weodata/index.aspx
(% of GDP)

99Government Budget, Tax and Other DataChapter 5
(% of GDP)Government Budget Balance to GDP
* Estimate Source: IMF http://www.imf.org/external/pubs/ft/weo/2018/01/weodata/index.aspx
2008 2009 2010 2011 2012 2013 2014 2015 2016 2017
U.S. -6.68 -13.15 -10.93 -9.59 -7.88 -4.42 -4.05 -3.53 -4.19 -4.58
China -0.03 -1.74 -0.36 -0.10 -0.30 -0.83 -0.91 -2.79 -3.70 -3.95
Japan -4.53 -10.19 -9.53 -9.44 -8.61 -7.91 -5.64 -3.80 -3.66 * -4.23
Germany -0.18 -3.24 -4.22 -0.96 -0.03 -0.14 0.33 0.64 0.82 1.12
U.K. -5.17 -10.12 -9.42 -7.47 -7.62 -5.40 -5.44 -4.26 -2.96 -2.33
S. Korea 1.52 0.02 1.53 1.69 1.56 0.65 0.42 0.55 1.75 1.94
98Government Budget, Tax and Other DataChapter 5
Government Budget Balance to GDP5-2 財政収支(対GDP比)
-15.00
-12.50
-10.00
-7.50
-5.00
-2.50
0.00
2.50
5.00
2008 2009 2010 2011 2012 2013 2014 2015 2016 2017
U.S.
China
Japan
Germany
U.K.
South Korea
Note: Government budget balance is net lending/borrowing. Source: IMF http://www.imf.org/external/pubs/ft/weo/2018/01/weodata/index.aspx
(% of GDP)

100Government Budget, Tax and Other DataChapter 5
Tax Revenue Structure5-3 税収構成比
53.1
31.2 42.6
34.1 23.4
11.2
20.3 7.5
9.3 17.8
22.2 34.6
45.3
41.1 38.2
13.5 13.94.7
15.5 20.6
0.0
10.0
20.0
30.0
40.0
50.0
60.0
70.0
80.0
90.0
100.0
South Korea
Tax onproperty
Tax ongoods andservice
corporateincome tax
Personalincome tax
U.K.GermanyJapanU.S.
Note: Personal income tax includes capital gains and income gains.Source: Ministry of Finance https://www.mof.go.jp/tax_policy/summary/condition/a03.htm
(% Share of major taxes in total tax revenue) (As of 2015)
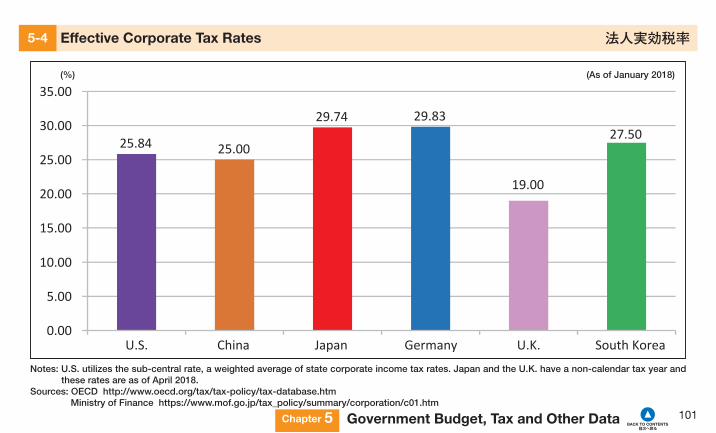
101Government Budget, Tax and Other DataChapter 5
Effective Corporate Tax Rates5-4 法人実効税率
25.84 25.00
29.74 29.83
19.00
27.50
0.00
5.00
10.00
15.00
20.00
25.00
30.00
35.00
South KoreaU.K.GermanyJapanChinaU.S.
Notes: U.S. utilizes the sub-central rate, a weighted average of state corporate income tax rates. Japan and the U.K. have a non-calendar tax year and these rates are as of April 2018.
Sources: OECD http://www.oecd.org/tax/tax-policy/tax-database.htmMinistry of Finance https://www.mof.go.jp/tax_policy/summary/corporation/c01.htm
(%) (As of January 2018)
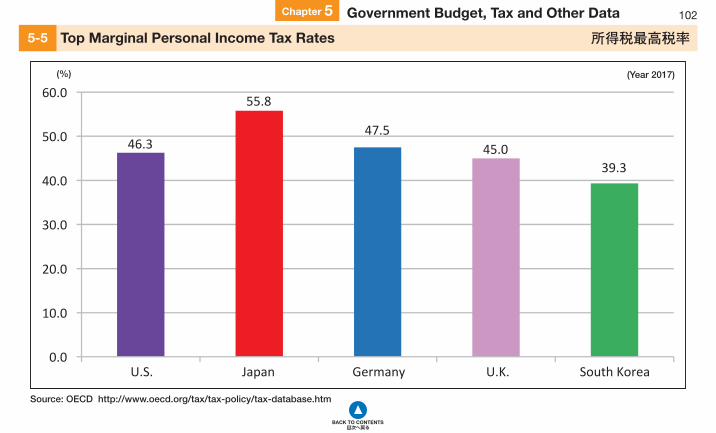
102Government Budget, Tax and Other DataChapter 5
Top Marginal Personal Income Tax Rates5-5 所得税最高税率
46.3
55.8
47.5 45.0
39.3
0.0
10.0
20.0
30.0
40.0
50.0
60.0
South KoreaU.K.GermanyJapanU.S.
Source: OECD http://www.oecd.org/tax/tax-policy/tax-database.htm
(%) (Year 2017)

103Government Budget, Tax and Other DataChapter 5
Value-Added Tax Rates5-6 付加価値税率
10.25
6.25
17.00
8.00
19.00 20.00
10.00
0.00
5.00
10.00
15.00
20.00
25.00
U.S. (Chicago) South KoreaU.K.GermanyJapanChinaU.S. (Boston)
Note: U.S. rates are as of July, 2017.Sources: Ministry of Finance https://www.mof.go.jp/tax_policy/summary/itn_comparison/j04.htm
Tax Foundation https://taxfoundation.org/sales-tax-rates-major-cities-midyear-2017/
(%) (As of January 2018)

104Government Budget, Tax and Other DataChapter 5
National Burden Ratio5-7 国民負担率
25.0 25.4 31.1
36.1 26.2
8.3 17.2
22.1 10.4
11.6
0.0
10.0
20.0
30.0
40.0
50.0
60.0
33.3
46.5
53.2 Social Security
Cost Burden Ratio
Tax Burden
Ratio
42.637.8
South KoreaU.K.GermanyJapanU.S.
Note: National burden ratio is the proportion of tax and social security burden to national income.Source: Ministry of Finance https://www.mof.go.jp/tax_policy/summary/condition/a04.htm
(%) (Year 2015)

105Government Budget, Tax and Other DataChapter 5
Gross Domestic Expenditure on R&D by Source5-8 各国の研究開発投資(拠出元別)
(Million USD, % by Sector)
Total Business enterprise Government Higher education Others
U.S. DP 511,089 D 318,527 (62.3%) DP 128,203 (25.1%) DP 18,686 (3.7%) 45,673 (8.9%)
China 451,201 343,178 (76.1%) 90,397 (20.0%) N/A 17,626 (3.9%)
Japan 168,645 131,691 (78.1%) * 25,325 (15.0%) * 9,149 (5.4%) 2,480 (1.5%)
Germany 118,159 77,064 (65.2%) 33,702 (28.5%) N/A 7,393 (6.3%)
U.K. 45,345 22,200 (49.0%) 12,546 (27.7%) 621 (1.4%) 9,978 (22.0%)
S. Korea 79,354 59,849 (75.4%) 18,000 (22.7%) 508 (0.6%) 997 (1.3%)
* Estimate. D Difference in methodology. P Provisional value.Notes: U.K. data based on 2015. Gross domestic spending on R&D is defined as the total expenditure (current and capital) on R&D carried out by all
resident companies, research institutes, university and government laboratories, etc., in a country.Source: OECD https://stats.oecd.org/Index.aspx?DataSetCode=GERD_SOF
(Year 2016)

107Government Budget, Tax and Other DataChapter 5
(Billion USD)Foreign Exchange Reserves
2008 2009 2010 2011 2012 2013 2014 2015 2016 2017
U.S. 294 404 489 537 574 449 434 384 406 451
China 1,966 2,453 2,910 3,255 3,388 3,880 3,900 3,405 3,098 3,236
Japan 1,031 1,052 1,096 1,296 1,268 1,267 1,261 1,233 1,217 1,264
Germany 139 179 216 234 249 199 193 174 184 200
U.K. 65 79 98 110 117 119 124 148 135 151
S. Korea 202 270 292 307 328 346 363 367 370 389
Note: Includes gold. Source: World Bank http://data.worldbank.org/indicator/FI.RES.TOTL.CD
106Government Budget, Tax and Other DataChapter 5
Foreign Exchange Reserves5-9 外貨準備高
1,000
2,000
3,000
4,000
0
500
250
2008 2009 2010 2011 2012 2013 2014 2015 2016 2017
U.S.
China
Japan
Germany
U.K.
South Korea
Note: Includes gold. Source: World Bank http://data.worldbank.org/indicator/FI.RES.TOTL.CD
(Billion USD)

109Government Budget, Tax and Other DataChapter 5
(Billion USD, % of GDP)Military Expenditure
2008 2009 2010 2011 2012 2013 2014 2015 2016 2017
U.S.692.4 747.9 768.5 759.0 715.8 659.1 618.3 603.6 600.1 597.2
(4.2%) (4.6%) (4.7%) (4.6%) (4.2%) (3.8%) (3.5%) (3.3%) (3.2%) (3.1%)
China108.5 131.4 138.0 149.0 161.8 176.9 191.9 204.5 216.0 228.2
(1.9%) (2.1%) (1.9%) (1.8%) (1.8%) (1.9%) (1.9%) (1.9%) (1.9%) (1.9%)
Japan44.6 45.4 45.6 46.2 45.7 45.5 45.9 46.8 46.5 46.6
(0.9%) (1.0%) (1.0%) (1.0%) (1.0%) (1.0%) (1.0%) (1.0%) (0.9%) (0.9%)
Germany39.5 41.0 41.5 40.3 41.3 38.9 38.7 39.9 41.6 43.0
(1.3%) (1.4%) (1.4%) (1.3%) (1.3%) (1.2%) (1.2%) (1.2%) (1.2%) (1.2%)
U.K.57.2 58.3 57.1 54.7 52.3 50.1 48.8 47.9 48.1 48.4
(2.3%) (2.4%) (2.4%) (2.3%) (2.2%) (2.1%) (2.0%) (1.9%) (1.8%) (1.8%)
S. Korea29.0 30.9 31.1 31.5 32.3 33.2 34.6 36.0 36.9 37.6
(2.6%) (2.7%) (2.6%) (2.6%) (2.6%) (2.6%) (2.7%) (2.6%) (2.6%) (2.6%)
World total 1,542.7 1,652.1 1,683.9 1,689.3 1,677.3 1,652.4 1,648.9 1,676.0 1,674.2 1,693.2Notes: Figures are in billion USD at constant 2016 prices and exchange rates. Figures of China are SIPRI estimates.Source: SIPRI Military Expenditure Database 2018 https://www.sipri.org/databases/milex
108Government Budget, Tax and Other DataChapter 5
Military Expenditure5-10 軍事支出
0.0
100.0
200.0
600.0
800.0
2008 2009 2010 2011 2012 2013 2014 2015 2016 2017
U.S.
China
Japan
Germany
U.K.
South Korea
Notes: Figures are in billion USD at constant 2016 prices and exchange rates. Figures of China are SIPRI estimates.Source: SIPRI Military Expenditure Database 2018 https://www.sipri.org/databases/milex
(Billion USD)

111Government Budget, Tax and Other DataChapter 5
(Million USD, Net disbursement)
ODA (Official Development Assistance)
Notes: Net means the total amount disbursed minus payments of interest.The Republic of Korea became a member of DAC(Development Assistance Committee) as of January 1, 2010.
Source: OECD https://data.oecd.org/oda/net-oda.htm#indicator-chart
2008 2009 2010 2011 2012 2013 2014 2015 2016 2017
U.S. 29,678 32,123 32,643 33,395 32,459 32,583 33,881 31,381 34,421 34,638
Japan 9,019 8,074 9,033 8,365 8,074 10,713 9,442 10,263 10,417 11,864
Germany 12,101 10,642 11,938 12,210 11,944 12,469 14,272 18,124 24,736 23,844
U.K. 9,733 10,895 12,551 12,561 12,566 16,078 16,180 16,715 18,053 18,425
S. Korea 890 1,003 1,269 1,351 1,639 1,736 1,756 1,901 2,246 2,100
DAC Total 112,516 114,318 120,598 119,595 115,139 121,529 123,458 130,990 144,921 144,165
110Government Budget, Tax and Other DataChapter 5
ODA (Official Development Assistance)5-11 ODA純支出額
0
5,000
10,000
15,000
20,000
25,000
30,000
35,000
40,000
2008 2009 2010 2011 2012 2013 2014 2015 2016 2017
U.S.
Japan
Germany
U.K.
South Korea
Notes: Net means the total amount disbursed minus payments of interest.The Republic of Korea became a member of DAC (Development Assistance Committee) as of January 1, 2010.
Source: OECD https://data.oecd.org/oda/net-oda.htm#indicator-chart
(Million USD, Net disbursement)

112Government Budget, Tax and Other DataChapter 5
Land Area5-12 国土面積
(km²)
1 Russia 17,098,246 11 Congo (DRC) 2,344,858 Japan 377,930
2 U.S. 9,833,517 12 Saudi Arabia 2,206,714 Germany 357,386
3 China 9,600,000 13 Greenland 2,166,086 U.K. 242,495
4 Canada 9,093,507 14 Mexico 1,964,375 S. Korea 100,339
5 Brazil 8,515,767 15 Indonesia 1,910,931
6 Australia 7,692,024 16 Libya 1,676,198
7 India 3,287,263 17 Iran 1,628,750
8 Argentina 2,780,400 18 Mongolia 1,564,116
9 Kazakhstan 2,724,902 19 Peru 1,285,216
10 Algeria 2,381,741 20 Chad 1,284,000
Note: Land area refers to total surface area.Source: UN https://unstats.un.org/unsd/demographic-social/products/dyb/dyb_2016.cshtml
(Year 2016)

Japan and the World 2018/19
Order copies by contacting Keizai Koho Center at [email protected] Koho Center(Japan Institute for Social and Economic Affairs)Keidanren Kaikan 19F, 1-3-2 Otemachi
Chiyoda-ku, Tokyo 100-0004 JAPAN
URL: http://en.kkc.or.jp/
About Keizai Koho Center
Since 1978, Keizai Koho Center (Japan Institute for Social and
Economic Affairs, KKC) has served as a bridge for the Japanese
business community to interact with its key stakeholders inside
and outside Japan. With a wide range of domestic and international
programs, KKC has developed a worldwide network encompassing
businesses leaders, lawmakers, government officials, journalists,
university scholars, and school teachers.
Japan and the World 2018/19 英文国際比較統計集2018年12月3日 初版第1刷印刷所:光写真印刷株式会社発行者:渡辺 良発行所:一般財団法人経済広報センター〒100-0004 東京都千代田区大手町1-3-2 経団連会館19階電話: 03-6741-0031 FAX: 03-6741-0032
乱丁・落丁本はお取替えいたします。ISBN:978-4-87605-050-5
Japan and the World 2018/19A Pocket Guide in Figures
