january february march creating a taxonomy … 04, 2018 · principles in dimensional metrology and...
TRANSCRIPT

2018JANUARY
FEBRUARYMARCH
Metrology 101: Calibrating a Micropipette
An Introduction to the Differences Between the Two Most Recognizable Force Standards
Creating a Taxonomy for Metrology

HELMHOLTZ COIL SYSTEMS FOR COMPASS CALIBRATION
www.bartington.com
MAG-13 THREE-AXIS FLUXGATE MAGNETOMETERS
• Noise levels down to <4pTrms/√Hz at 1Hz• Bandwidth to 3kHz• Measuring ranges from ±60 to ±1000µT
HELMHOLTZ COILS
• 350mm to 1m diameter coils• Field generated up to 1mT (at DC) and 100µT (at 5kHz)• Control system including active cancellation
FERRONATO COILS
• 300mm to 2m diameter coils• Field generated up to 2mT• Compatible with Bartington control system including active cancellation
US distributor:
www.gmw.com
Cal-Lab-GMW-March-2018.indd 1 15/03/2018 15:49:57

1Jan • Feb • Mar 2018 Cal Lab: The International Journal of Metrology
Volume 25, Number 1
www.callabmag.com
FEATURES
19 Metrology 101: Calibrating a MicropipetteMartin de Groot
26 An Introduction to the Differences Between the Two Most Recognized Force Standards
Henry Zumbrun
31 Creating a Taxonomy for MetrologyMichael L. Schwartz
DEPARTMENTS 2 Calendar 3 Editor’s Desk 14 Industry and Research News 18 Cal-Toons by Ted Green 38 New Products and Services 40 Automation Corner
ON THE COVER: Vacuum test set-up on one of CEESI’s low flow test stands in Nunn, Colorado, US.

2 Jan • Feb • Mar 2018Cal Lab: The International Journal of Metrology
CALENDAR
Apr 9-11, 2018 FORUMESURE. Marrakesh, Morocco. FORUMESURE is an annual event, for companies and also institutions wishing to present their know-how, new products and services to hundreds of international visitors. This event is organized by The African Committee of Metrology (CAFMET). As the same time as the exhibition, the 7th International Metrology Conference, CAFMET 2018, will take place. http://www.cafmet2018.com
Apr 9-12, 2018 CAFMET. Marrakesh, Morocco. The African Committee of Metrology (CAFMET) is organizing the 7th International Conference of Metrology in Africa – CAFMET 2018, which will be a Metrology forum to share information, ideas and experiences, during conferences, open discussions, technical workshops and exhibition booths. http://www.cafmet2018.com/en
Apr 16-18, 2018 IEEE International Workshop on Metrology for Industry 4.0 and IoT. Brescia, Italy. MetroInd4.0&IoT aims to discuss the contributions both of the metrology for the development of Industry 4.0 and IoT and the new opportunities offered by Industry 4.0 and IoT for the development of new measurement methods and apparatus. http://www.metroind40iot.org/
Apr 16-19, 2018 European Flow Measurement Workshop. Barcelona, Spain. CEESI has partnered with VSL, NMi Certin, and Enagás to present the 6th European Flow Measurement Workshop. Each year different specific topics related to custody transfer measurement and ultrasonic meter measurement are discussed. https://efmws.eu/
Apr 17-19, 2018 Expo Control. Moscow, Russia. The most unique and comprehensive trade show in Russia which yearly demonstrates to specialists all the variety of the latest technologies for industrial and scientific quality assurance, measurement and testing. http://expo-control.com/en/
Apr 24-26, 2018 ICEEM. Algiers, Algeria. The Laboratory of Instrumentation at USTHB organizes the International Conference on Electronics, Energy and Measurement (ICEEM). The conference provides opportunity to bring scientists and engineers from academia, research institutes and industrial establishments to present and discuss the latest results in the field of electronics, instrumentation and measurement, sensors and energy. http://easychair.org/cfp/ICEEM-2018
UPCOMING CONFERENCES & MEETINGS
©2017 Fluke Calibration. 6009028a-en
Fluke Calibration. Precision, performance, confidence.™
Electrical RF Temperature Humidity Pressure SoftwareFlow
Get four times more calibration throughput with twice the accuracy of Micro-Baths and dry-block calibrators
Get the details: us.flukecal.com/7109A
• Calibrate up to four tri-clamp sanitary sensors at the same time.
• Wide temperature range covers most clean process applications:
• 6109A: 35 °C to 250 °C • 7109A: –25 °C to 140 °C
• Excellent display accuracy of ±0.1 ° provides 4:1 test uncertainty ratio.
• Stainless steel casing withstands harsh sterilizing chemicals, is rust proof and perfect for clean room use.

3Jan • Feb • Mar 2018 Cal Lab: The International Journal of Metrology
EDITOR’S DESK
PUBLISHERMICHAEL L. SCHWARTZ
EDITORSITA P. SCHWARTZ
CAL LAB PO Box 111113
Aurora, CO 80042TEL 303-317-6670 • FAX 303-317-5295
EDITORIAL ADVISORS
CHRISTOPHER L. GRACHANENTRANSCAT
MIKE SURACISURACI CONSULTING SERVICES
LEAD ASSESSOR, ANAB
MARTIN DE GROOTMARTINDEGROOT CONSULTANCY
JESSE MORSEMORSE METROLOGY
JERRY ELDREDTESCOM
Subscription fees for 1 year (4 issues) $50 for USA, $55 Mexico/Canada,
$65 all other countries.Visit www.callabmag.com
to subscribe.
Printed in the USA. © Copyright 2018 CAL LAB.
ISSN No. 1095-4791
Team Spirit
A recent study found that wolves could figure out a solution to a problem by using teamwork, while domesticated dogs have lost this type of intelligence. Generations of pampered wolves have led to modern day dogs with inferior problem solving abilities. I see this in our family Schnauzer who can’t figure out how to come to the car through the open fence gate—she just stares confounded at me through the chain link fence.
Like wolves, people have created complex societies as a competitive advantage against death and suffering. Yet, the challenge of teamwork is a constant struggle, particularly when faced with barriers such as existing in different industries and cultures, or communicating in different languages. We aren’t bees speaking the same buzzes or mindless borgs all seamlessly connected to a mother-queen. Instead, we’re individuals who have to be constantly reminded of a common daily struggle that is not ours alone. So despite the different industries, different businesses, governments, and so on, we created standards for getting done what needs to be done.
But now our world is moving at a digital rate, requiring more precision at a technical and organizational level. We have to create better tools and invent even more complex processes to help keep us organized. Those of us in the measurement science world are faced with the task of creating a new taxonomy to help us communicate.
Since January 2013, Mark Kuster has been contributing a series of short articles to NCSLI’s Metrologist (http://www.ncsli.org/mo) on development of a Measurement Information Infrastructure (MII). Just last year, NCSLI officially refocused the 141 MII & Automation Committee to help address a pressing need to standardize scopes of accreditation in order to organize specific data in a machine-readable format. Mark found related endeavors happening elsewhere as well: The International Union of Pure and Applied Chemistry (IUPAC) has been working to standardize clinical laboratory data for many years and QUDT was created in an effort to provide working ontology models for a NASA project.
Our publisher, who has been actively involved with the MII group for a couple of years, prepared an article for this issue on the progress of getting standards of accreditation information into a XML format. A beta version has been developed, but more actors need to get involved—those with advanced knowledge of metrology and programming. Progress on this task has involved a lot of complicated steps; it’s been a slog and those involved deserve a nice pat on the back for all their team effort. So much more work needs to be done though! I encourage those who are interested to find out more on the MII initiative by going to: http://miiknowledge.wikidot.com/start.
We pickup on the Metrology 101 feature this issue with a much-needed pipette calibration article by our friend Martin de Groot of Kelvin-Training in the Netherlands. He provides some emphasis of the impact of the new ISO/IEC 17025:2017 on the gravimetric method of pipette calibration. This article is a great compliment to the one we published 5 years ago by providing hands-on, practical methods and instruction.
And then to round out this issue, Henry Zumbrun of Morehouse contributed his article on defining the differences between ASTM E74 and ISO 376 force standards.
We hope you enjoy this issue, including Ted’s fabulous Cal-Toon!
Happy Measuring,
Sita Schwartz

4 Jan • Feb • Mar 2018Cal Lab: The International Journal of Metrology
CALENDAR
ISO/IEC 17025:2005CALIBRATION CERT #2746.01
Your Source for High Voltage Calibration.
High Voltage Dividers & Probes
HV CALIBRATION LAB CAPABILITIES: • UP TO 450kV PEAK 60Hz • UP TO 400kV DC • UP TO 400kV 1.2x50μs LIGHTNING IMPULSE
DESIGN, MANUFACTURE, TEST &CALIBRATE: • HV VOLTAGE DIVIDERS • HV PROBES • HV RELAYS • HV AC & DC HIPOTS • HV DIGITAL VOLTMETERS • HV CONTACTORS • HV CIRCUIT BREAKERS • HV RESISTIVE LOADS • SPARK GAPS • FIBER OPTIC SYSTEMS HV LAB CALIBRATION STANDARDSISO/IEC 17025:2005 ACCREDITEDANSI/NCSLI Z540-1-1994 ACCREDITEDISO 9001:2015 QMS CERTIFIEDN.I.S.T. TRACEABILITYN.R.C. TRACEABILITY
HIGH VOLTAGECALIBRATION LAB
ENGINEERING CORPORATIONOSSR 540 Westchester Drive, Campbell, CA 95008 USA | Ph: 408-377-4621 [email protected] | www.rossengineeringcorp.com
ISO 9001:2015 QMS CERTIFIED
May 2-3, 2018 Metrology Solutions EXPO. Greenville, SC. Manufacturing and Industrial Quality Control managers, engineers, and technical professionals will gather to discover the latest trends in precision measurement gages, instruments and metrology systems technologies. https://www.msiexpo.com/
May 14-17, 2018 I2MTC. Houston, TX. International Instrumentation and Measurement Technology Conference – is the flagship conference of the IEEE Instrumentation and Measurement Society, and is dedicated to advances in measurement methodologies, measurement systems, instrumentation, and sensors in all areas of science and technology. These features make I2MTC a unique event and one of the most important conferences in the field of instrumentation and measurement. http://imtc.ieee-ims.org/
May 28-Jun 1, 2018 EURAMET General Assembly. Bucharest, Romania. The General Assembly (GA) is the highest authority and decision making body of EURAMET. Each member is represented by a Delegate. The General Assembly meets once per year to decide on EURAMET’s strategy and objectives. http://www.euramet.org
Jun 12, 2018 North American Custody Transfer Measurement Conference. Colorado Springs, CO. This conference brings together meter manufacturers and end users in order to share information about measurement challenges in the hydrocarbon
measurement industry. Updates in metering technologies, flow measurement research, industry standards, government regulations, and diagnostic tools are discussed to help mitigate metering challenges. http://www.ceesi.com/custodytransfer2018
Jun 20, 2018 MetroAeroSpace. Rome, Italy. The 5th IEEE International Workshop on Metrology for AeroSpace aims to gather people who work in developing instrumentation and measurement methods for aerospace. http://www.metroaerospace.org/
SEMINARS: Dimensional
Apr 9-12, 2018 Dimensional Measurement Training: Level 2 – Measurement Applier. Telford, UK (Hexagon Metrology). NPL. A four day training course for those who have a good basic understanding of measurement principles gained through the Level 1 training course. http://www.npl.co.uk/training
Apr 18-19, 2018 Hands-On Gage Calibration and Repair. Dallas, TX. IICT. This 2-day hands-on workshop offers specialized training in calibration and repair for the individual who has some knowledge of basic Metrology. Course includes hands on calibration and repairs and adjustments of micrometers, calipers, indicators height gages, etc. http://www.iictenterprisesllc.com

5Jan • Feb • Mar 2018 Cal Lab: The International Journal of Metrology
CALENDAR
Apr 18-19, 2018 Dimensional Measurement. Port Melbourne, VIC. Australian Government NMI. This two-day course (9 am to 5 pm) presents a comprehensive overview of the fundamental principles in dimensional metrology and geometric dimensioning and tolerancing. http://www.measurement.gov.au/Services/Training/Pages/default.aspx#
May 17-18, 2018 Hands-On Gage Calibration and Repair. Hartford, CT. IICT. This 2-day hands-on workshop offers specialized training in calibration and repair for the individual who has some knowledge of basic Metrology. Course includes hands on calibration and repairs and adjustments of micrometers, calipers, indicators height gages, etc. http://www.iictenterprisesllc.com
May 21-22, 2018 Hands-On Gage Calibration and Repair. Cleveland, OH. IICT. This 2-day hands-on workshop offers specialized training in calibration and repair for the individual who has some knowledge of basic Metrology. Course includes hands on calibration and repairs and adjustments of micrometers, calipers, indicators height gages, etc. http://www.iictenterprisesllc.com
Jun 11-12, 2018 Hands-On Gage Calibration and Repair. Atlanta, GA. IICT. This 2-day hands-on workshop offers specialized training in calibration and repair for the individual who has some knowledge of basic Metrology. http://www.iictenterprisesllc.com
SEMINARS: Electrical
Apr 23-26, 2018 MET-301 Advanced Hands-on Metrology. Everett, WA. Fluke Calibration. This course introduces the student to advanced measurement concepts and math used in standards laboratories. The student will learn how to make various types of measurements using different measurement methods. We will also teach techniques for making good high precision measurements using reference standards. http://us.flukecal.com/training
Apr 30-May 3, 2018 MET-101 Basic Hands-on Metrology. Everett, WA. Fluke Calibration. This course introduces the student to basic measurement concepts, basic electronics related to measurement instruments and math used in calibration. We will also teach various techniques used to make good measurements using calibration equipment. http://us.flukecal.com/training
Jun 18-21, 2018 MET-101 Basic Hands-on Metrology. Everett, WA. Fluke Calibration. This course introduces the student to basic measurement concepts, basic electronics related to measurement instruments and math used in calibration. We will also teach various techniques used to make good measurements using calibration equipment. http://us.flukecal.com/training

6 Jan • Feb • Mar 2018Cal Lab: The International Journal of Metrology
CALENDAR
SEMINARS: Flow / Pressure
Apr 11, 2018 Flow Calculations Training Course. East Kilbride, UK. NEL. Accurate measurement of produced hydrocarbons has always been a very high priority for oil and gas operating companies. This course explains the equations and standards which define these parameters. http://www.tuvnel.com/site2/subpage/nel_training_courses
May 8-10, 2018 Principles and Practice of Flow Measurement Training Course. East Kilbride, UK. NEL. This course will enable delegates to understand the issues surrounding flow measurement. It also provides the delegate with an unbiased view of the various technologies available and the basic knowledge required to make informed choices. http://www.tuvnel.com/site2/subpage/nel_training_courses
May 11, 2018 Multiphase & Wet-Gas Flow Measurement Training Course. East Kilbride, UK. NEL. The demand to measure multiphase and wet-gas flows is increasing in the oil and gas industry worldwide. This interactive course will provide an understanding of the complexities of multiphase and wet-gas flows, effective metering techniques, selection and testing of meters and flow assurance strategies. http://www.tuvnel.com/site2/subpage/nel_training_courses
Jun 27-28, 2018 Calibration of Liquid Hydrocarbon Flow Meters. Londonderry, NSW. Australian NMI. This two-day course (9 am to
5 pm) provides training on the calibration of liquid-hydrocarbon LPG and petroleum flow meters. It is aimed at manufacturers, technicians and laboratory managers involved in the calibration and use of flowmeters. It includes hands-on learning activities on-site at NMI’s world-class hydrocarbon flow calibration and training facility at Londonderry (Sydney). http://www.measurement.gov.au/Services/Training/Pages/default.aspx#
SEMINARS: Industry Standards
Apr 9-10, 2018 ISO/IEC 17025:2005 and Laboratory Accreditation. Frederick, MD. A2LA. This course includes a comprehensive review as well as exposure to the core philosophies and requirements of this International Standard. Through lecture and a variety of interactive individual and class activities, the participant will be equipped to apply the Standard in its laboratory. https://www.a2la.org/events/iso-iec-17025-2005-and-laboratory-accreditation
Apr 9-10, 2018 Introduction to ISO/IEC 17025. San Francisco, CA. ANAB. The 1.5-day Introduction to ISO/IEC 17025 training course will help attendees understand and apply the requirements of ISO/IEC 17025:2005. Attendees will examine the origins of the standard and learn practical concepts such as document control, internal auditing, proficiency testing, traceability, measurement uncertainty, and method witnessing. https://www.anab.org/training/17025/intro
611 E. CARSON ST. PITTSBURGH, PA 15203TEL 412-431-0640 FAX 412-431-0649
WWW.OHM-LABS.COM
MULTIPLE CURRENT SHUNT
• UNIQUE TEMPERATURE STABILIZED DESIGN
• HIGHEST COMMERCIALLY AVAILABLE ACCURACY
• WIDE RANGE: <100 MA TO 300 A• LOW INDUCTANCE FOR DC OR AC USE
• LOW TCR, STABLE OVER TIME
• LOWER COST THAN FIVE SEPARATE SHUNTS
• INCLUDES ACCREDITED CALIBRATION
AMPS OHMS ACCURACY0.1-3 1 Ω <0.005 %1-10 0.1 <0.005 %3-30 0.01 <0.005 %
10-100 0.001 <0.01 %30-300 0.000 1 <0.05 %
SEE WWW.OHM-LABS.COM FOR SPECS & SAMPLE CAL REPORT
OHMLABSmultishuntAD.3.11_Layout 1 3/28/11 4:20 PM Page 2

Automatic Handheld Pressure Calibrator Introduction
Phone: 714-998-6899
Fax: 714-998-6999
E-mail: [email protected]
Corporate Headquarters
2900 Saturn Street #B
Brea, CA 92821, USA
Salt Lake City Office
1364 West State Rd. Suite 101
Pleasant Grove, UT 84062, USA
www.additel.com
Fully automatic calibrator with built-in pump and controller
Switchable internal pressure modules for expandable ranges
Accuracy (1 year) of 0.02%FS
External pressure modules available (measure only)
Less than 4 lbs (1.8 kg) for handheld operation
Source pressure, measure pressure and electrical
Optional HART communications
Optional data logging and task documenting
USB, Wi-Fi, and Bluetooth communications
4 Channels
World’s First Handheld Automatic Pressure CalibratorTaking portable pressure calibration to a whole new level!

GMW Associates • www.gmw.com
DS2000
DS Series Current Transducers±300A to ±8000A, high accuracy for Power Analyzers andimproved performance for Power Amplifiers
• Very high absolute amplitude and phase accuracy from dc to over 1kHz• Low signal output noise• Low fluxgate switching noise on the pimary• Enhanced electrostatic shielding to increase rejection of primary dV/dt coupling• Increased operating temperature range• Reduced mechanical dimensions• Options: Voltage Output Signal; Calibration Winding• Amplitude and Phase measurement to 300kHz included with each head
DSSIU-4 for Multi Channel Systems4-channel Transducer Interface Unit and Power Supplyimproved performance for Power Amplifiers
• Power and Signal connections for up to four Current Transducer heads• Heads may be mixed (e.g.: One DS2000 Head and three DS200 Heads)
Gain / Phase
DS200
DS200 DS600 DS2000 DS5000
Primary Current, rms 200A 600A 2000A 5000A
Primary Current, Peak ±300A ±900A ±3000A ±7000A
Turns Ratio 500:1 1500:1 1500:1 2500:1
Output Signal (rms/Peak) 0.4A/±0.6A† 0.4A/±0.6A† 1.33A/±2A† 2A/±3.2A†
Overall Accuracy 0.01% 0.01% 0.01%
Offset <20ppm <10ppm <10ppm <5ppm
Linearity <1ppm <1ppm <1ppm <1ppm
Operating Temperature -40 to 85˚C -40 to 85˚C -40 to 85˚C 0 to 55˚C
Aperature Diameter 27.6mm 27.6mm 68mm 150mm
Bandwidth Bands for DS200 DS600 DS2000 DS5000Gain and Phase Error <5kHz <100kHz <1MHz <2kHz <10kHz <100kHz <500Hz <1kHz <10kHz <5kHz <20kHz
Gain (sensitivity) Error 0.01% 0.5% 20% 0.01% 0.5% 3% 0.01% 0.05% 3% 0.01% 1%
Phase Error 0.2˚ 4˚ 30˚ 0.1˚ 0.5˚ 3˚ 0.01˚ 0.1˚ 1˚ 0.01˚ 1˚† Voltage Output options available in ±1V and ±10V
MW Associates • www
DSSIU-4
Frequency (Hz)
-30
-25
-20
-15
-10
-5
0
10 100 1000 10000 100000 1000000
-16%
-14%
-12%
-10%
-8%
-6%
-4%
-2%
0%
2%
10 100 1000 10000 100000 1000000Frequency (Hz)
Gai
n
Ph
ase
(Deg
rees
)
Gain (DS200, typical) Phase (DS200, typical)
Electric Current Measurement
GMW_Ad_CalLab-ElectricCurrent-Danisense_8x10.75_May2014.ai 1 2/17/2015 12:05:16 PM

9Jan • Feb • Mar 2018 Cal Lab: The International Journal of Metrology
CALENDAR
Highest product quality in production and during storage requires an integrated monitoring system. The expandable RMS Rotronic Monitoring System is the perfect solution. It provides guaranteed installation flexibility and full data availability, anywhere, on a variety of devices. Rotronic can meet all your needs: whether supplying the hardware, integrating third party devices, installation, and service to the entire system. www.rotronic.com/rms
The Rotronic UniversalMonitoring System – RMS
Highest product quality in production and during storage requires an integrated monitoring system. The expandable RMS Rotronic Monitoring System is the perfect solution. It provides guaranteed installation flexibility and full data availability, anywhere, on a variety of devices. Rotronic can meet all your needs: whether supplying the hardware, integrating third party devices, installation, and service to the entire system. www.rotronic.com/rms
May 8-9, 2018 ISO/IEC 17025:2005 and Laboratory Accreditation. Detroit, MI. A2LA. This course includes a comprehensive review as well as exposure to the core philosophies and requirements of this International Standard. Through lecture and a variety of interactive individual and class activities, the participant will be equipped to apply the Standard in its laboratory. https://www.a2la.org/events/iso-iec-17025-2005-and-laboratory-accreditation
May 16-17, 2018 Internal Auditing. Denver, CO. A2LA. This course introduces participants to the internationally-recognized approaches of ISO 19011 Guidelines for Auditing Management Systems for conducting effective internal audits. The course includes easy-to-implement methods for involvement of personnel, continual improvement of the audit process, as well as group exercises to apply the interpersonal skills needed to be an effective auditor. https://www.a2la.org/events/internal-auditing
May 21-23, 2018 Internal Auditing to ISO/IEC 17025. Baltimore, MD. ANAB. The 2.5-day Internal Auditing to ISO/IEC 17025 training course prepares the internal auditor to clearly understand technical issues relating to an audit. Attendees of this course will learn how to coordinate a quality management system audit to ISO/IEC 17025:2005 and collect audit evidence and document observations, including techniques for effective questioning and listening. https://www.anab.org/training/17025/internal-auditing
Jun 5-6, 2018 ISO/IEC 17025:2005 and Laboratory Accreditation. Chicago, IL. A2LA. This course includes a comprehensive review as well as exposure to the core philosophies and requirements of this International Standard. Through lecture and a variety of interactive individual and class activities, the participant will be equipped to apply the Standard in its laboratory. https://www.a2la.org/events/iso-iec-17025-2005-and-laboratory-accreditation
Jun 6-7, 2018 Internal Auditing. Frederick, MD. A2LA. This course introduces participants to the internationally-recognized approaches of ISO 19011 Guidelines for Auditing Management Systems for conducting effective internal audits. The course includes easy-to-implement methods for involvement of personnel, continual improvement of the audit process, as well as group exercises to apply the interpersonal skills needed to be an effective auditor. https://www.a2la.org/events/internal-auditing
Jun 6-7, 2018 Internal Auditing. Yellowstone, WY. A2LA. This course introduces participants to the internationally-recognized approaches of ISO 19011 Guidelines for Auditing Management Systems for conducting effective internal audits. The course includes easy-to-implement methods for involvement of personnel, continual improvement of the audit process, as well as group exercises to apply the interpersonal skills needed to be an effective auditor. https://www.a2la.org/events/internal-auditing
GMW Associates • www.gmw.com
DS2000
DS Series Current Transducers±300A to ±8000A, high accuracy for Power Analyzers andimproved performance for Power Amplifiers
• Very high absolute amplitude and phase accuracy from dc to over 1kHz• Low signal output noise• Low fluxgate switching noise on the pimary• Enhanced electrostatic shielding to increase rejection of primary dV/dt coupling• Increased operating temperature range• Reduced mechanical dimensions• Options: Voltage Output Signal; Calibration Winding• Amplitude and Phase measurement to 300kHz included with each head
DSSIU-4 for Multi Channel Systems4-channel Transducer Interface Unit and Power Supplyimproved performance for Power Amplifiers
• Power and Signal connections for up to four Current Transducer heads• Heads may be mixed (e.g.: One DS2000 Head and three DS200 Heads)
Gain / Phase
DS200
DS200 DS600 DS2000 DS5000
Primary Current, rms 200A 600A 2000A 5000A
Primary Current, Peak ±300A ±900A ±3000A ±7000A
Turns Ratio 500:1 1500:1 1500:1 2500:1
Output Signal (rms/Peak) 0.4A/±0.6A† 0.4A/±0.6A† 1.33A/±2A† 2A/±3.2A†
Overall Accuracy 0.01% 0.01% 0.01%
Offset <20ppm <10ppm <10ppm <5ppm
Linearity <1ppm <1ppm <1ppm <1ppm
Operating Temperature -40 to 85˚C -40 to 85˚C -40 to 85˚C 0 to 55˚C
Aperature Diameter 27.6mm 27.6mm 68mm 150mm
Bandwidth Bands for DS200 DS600 DS2000 DS5000Gain and Phase Error <5kHz <100kHz <1MHz <2kHz <10kHz <100kHz <500Hz <1kHz <10kHz <5kHz <20kHz
Gain (sensitivity) Error 0.01% 0.5% 20% 0.01% 0.5% 3% 0.01% 0.05% 3% 0.01% 1%
Phase Error 0.2˚ 4˚ 30˚ 0.1˚ 0.5˚ 3˚ 0.01˚ 0.1˚ 1˚ 0.01˚ 1˚† Voltage Output options available in ±1V and ±10V
MW Associates • www
DSSIU-4
Frequency (Hz)
-30
-25
-20
-15
-10
-5
0
10 100 1000 10000 100000 1000000
-16%
-14%
-12%
-10%
-8%
-6%
-4%
-2%
0%
2%
10 100 1000 10000 100000 1000000Frequency (Hz)
Gai
n
Ph
ase
(Deg
rees
)
Gain (DS200, typical) Phase (DS200, typical)
Electric Current Measurement
GMW_Ad_CalLab-ElectricCurrent-Danisense_8x10.75_May2014.ai 1 2/17/2015 12:05:16 PM

Every XP2i maintains its accuracy across a wide pressure
and temperature range, so using one XP2i is like carrying
multiple conventional gauges. The XP2i’s case is made from rugged aluminum alloy,
and utilizes a gasket to seal the enclosure against dust and water intrusion. Even the
RS-232 connector is fully sealed. Configurable with customizable, calibration-due
reminders and alerts.
0.1% of Reading Accuracy, not affected from -10 to 50°C
Absolute, gauge, and differential pressure
IP66, IP67 Marine grade enclosure resists corrosion
Low pressure, absolute ranges available now
Shift everyday wear to replaceable CPF adapter
Record 32 000 data points with optional DataLoggerXP
ATEX Zone 0, CSA Class 1, Div 1
CrystalnVision
JOFRAASC-400
a m e t e kc a l i b ra t i o n .c o m
JOFRARTC Series
M & GPKII
CrystalGaugeCalHP
NEW!
JofraCloudNow with

11Jan • Feb • Mar 2018 Cal Lab: The International Journal of Metrology
CALENDAR
Jun 11-12, 2018 ISO/IEC 17025:2005 and Laboratory Accreditation. Nashville, TN. A2LA. This course includes a comprehensive review as well as exposure to the core philosophies and requirements of this International Standard. Through lecture and a variety of interactive individual and class activities, the participant will be equipped to apply the Standard in its laboratory. Ihttps://www.a2la.org/events/iso-iec-17025-2005-and-laboratory-accreditation
Jul 24-25, 2018 Internal Auditing. San Francisco, CA. A2LA. This course introduces participants to the internationally-recognized approaches of ISO 19011 Guidelines for Auditing Management Systems for conducting effective internal audits. The course includes easy-to-implement methods for involvement of personnel, continual improvement of the audit process, as well as group exercises to apply the interpersonal skills needed to be an effective auditor. https://www.a2la.org/events/internal-auditing
Aug 15-16, 2018 Internal Auditing. Frederick, MD. A2LA. This course introduces participants to the internationally-recognized approaches of ISO 19011 Guidelines for Auditing Management Systems for conducting effective internal audits. The course includes easy-to-implement methods for involvement of personnel, continual improvement of the audit process, as well
as group exercises to apply the interpersonal skills needed to be an effective auditor. https://www.a2la.org/events/internal auditing
SEMINARS: Management & Quality
Jun 28, 2018 Documenting Your Quality System. Portland, OR. A2LA. During this course, the participant will gain an understanding of the basic concepts of management system documentation structure, content, and development. The participant will also practice developing processes, Standard Operation Procedures, and applying mechanisms needed to control, review, and update documents on an ongoing basis. https://www.a2la.org/events/documenting-your-quality-system
SEMINARS: Mass & Weight
Apr 16-27, 2018 Mass Metrology Seminar. Gaithersburg, MD. NIST. The Mass Metrology Seminar is a 2 week, “hands-on” seminar. It incorporates approximately 30 percent lectures and 70 percent demonstrations and laboratory work in which the trainee performs measurements by applying procedures and equations discussed in the classroom. https://www.nist.gov/news-events/events/2018/04/5516-mass-metrology-seminar
NEW!
NEW!
NEW!
NEW!
Cloud and Subscription based pricing options
Unicode & Multi-lingual support
Brand your own customizable Customer Portal
Fully customizable interface, processes, and reports
Automated emails for due reports and customer communication
1D/2D barcoding automation and calibration sticker printing
Accounting System integration
Sync data over the Cloud to customers with IndySoft Client
Celebrating 20 years as the worldwide leader in
Commercial Lab Management Software
Commercial Lab Management Software

12 Jan • Feb • Mar 2018Cal Lab: The International Journal of Metrology
CALENDAR
Jul 26, 2018 Calibration of Weights and Balances. Port Melbourne, VIC. Australian NMI. This one-day course (9 am to 5 pm) covers the theory and practice of the calibration of weights and balances. It incorporates hands-on practical exercises to demonstrate adjustment features and the effects of static, magnetism, vibration and draughts on balance performance. http://www.measurement.gov.au/Services/Training/Pages/default.aspx#
SEMINARS: Measurement Uncertainty
May 24-25, 2018 Fundamentals of Measurement Uncertainty. Baltimore, MD. ANAB. Attendees of the 2-day Fundamentals Measurement Uncertainty training course will learn a practical approach to measurement uncertainty applications, based on fundamental practices. Measurement uncertainty for both testing and calibration laboratories will be discussed. Attendees will gain an understanding of the steps required, accepted practices, and types of uncertainties that need to be considered by accredited laboratories. https://www.anab.org/training/17025/fundamentals-of-measurement-uncertainty
Aug 17-18, 2018 Measurement Uncertainty per ILAC P14 Guidelines. Baltimore International Airport. WorkPlace
Training. This workshop introduces basic measurement uncertainty and traceability concepts. The concepts taught are then put in practice by developing sample measurement uncertainty budgets. Call 612-308-2202 or visit: http://wptraining.com/
SEMINARS: Pressure
Apr 23-27, 2018 Principles of Pressure Calibration. Phoenix, AZ. Fluke Calibration. A five day training course on the principles and practices of pressure calibration using digital pressure calibrators and piston gauges (pressure balances). The class is designed to focus on the practical considerations of pressure calibrations. http://us.flukecal.com/training
Jun 7-8, 2018 Pressure Measurement. Lindfield, NSW. Australian Government NMI. This two-day course (9 am to 5 pm each day) covers essential knowledge of the calibration and use of a wide range of pressure measuring instruments, their principles of operation and potential sources of error — it incorporates extensive hands-on practical exercises. http://www.measurement.gov.au/Services/Training/Pages/default.aspx#
Providing Reference Pulse Generators for Oscilloscope Calibrations
www.entegra-corp.com240-672-7645
Entegra’s Pulse Generators: Models available for calibrating the step response of 12 GHz, 20 GHz, and 50 GHz bandwidth oscilloscopes
Transition durations down to 9 ps (10 % - 90 %) and both the positive and negative transitions are fast
550 mV step amplitude typical
Differential output model available

13Jan • Feb • Mar 2018 Cal Lab: The International Journal of Metrology
CALENDAR
Visit ralstoninst.com/cm or scan the QR code to find out more+1-440-564-1430 | (US/CA) 800-347-6575
ISO 9001:2008 Certified Made in the U.S.A.
The FieldLab system is your solution for traceability
The FieldLab system meets the increasing traceability requirements for calibrating process instruments — taking away the unnecessary burden from measurement supervisors and technicians
Ralston Instruments developed a way to standardize pressure calibration using templates that are consistent across your company
• Technicians follow on-screen prompts on the FieldLab hardware and enter information about each device under test
• The returned data has traceability information on the device under test, reference, technician and anything else that is needed
• Greater standardization of the process of calibration fulfills the requirements of virtually any stringent quality system
SEMINARS: Software
May 14-18, 2018 MC-207 Advanced MET/CAL Procedure Writing. Everett, WA. This five-day in-depth workshop is for experienced MET/CAL programmers who wish to enhance their procedure writing skills. Students will focus on the use of instrument communication with the IEEE, PORT, VISA, MATH and LIB FSCs, the use of memory registers in procedures, and will create a complex procedure using live instrumentation. http://us.flukecal.com/training
Jul 16-20, 2018 MC-206 Basic MET/CAL® Procedure Writing. Everett, WA. Fluke Calibration. In this five-day basic MET/CAL procedure writing course, you will learn to configure MET/CAL software to create, edit, and maintain calibration solutions, projects and procedures. http://us.flukecal.com/training
SEMINARS: Temperature
Sep 17-19, 2018 Advanced Topics in Temperature Metrology. American Fork, UT. Fluke Calibration. A three-day course for those who need to get into the details of temperature metrology. This course is for experienced calibration technicians, metrologists, engineers, and technical experts working in primary and secondary-level temperature calibration laboratories who would
like to validate, refresh, or expand their understanding of advanced topics in temperature metrology. http://us.flukecal.com/training
Sep 20-21, 2018 Infrared Calibration Training. American Fork, UT. Fluke Calibration. A three-day course with plenty of hands on experience in infrared temperature metrology. This course is for calibration technicians, engineers, metrologists, and technical experts who are beginning or sustaining an infrared temperature calibration program. http://us.flukecal.com/training
SEMINARS: Volume
Jun 4-8, 2018 Volume Metrology Seminar. Gaithersburg, MD. NIST Office of Weights and Measures. This 5 day volume metrology seminar is designed to enable metrologists to apply fundamental measurement concepts to volume calibrations. https://www.nist.gov/news-events/events/2018/06/5523-volume-metrology-seminar
Visit www.callabmag.com for
upcoming metrology events & webinars!

14 Jan • Feb • Mar 2018Cal Lab: The International Journal of Metrology
CALENDARINDUSTRY AND RESEARCH NEWS
A Stopwatch for Nanofluids: NIST Files Provisional Patent for Measuring Nanoliter Flow Rates
January 17, 2018, NIST News — The National Institute of Standards and Technology (NIST) has filed a provisional patent application for a microflow measurement system, about the size of a nickel, that can track the movement of extremely tiny amounts of liquids—as small as nanoliters (nL, billionth of a liter) per minute. If water were flowing at that rate from a 1-liter bottle of water, it would take about 200 years to drain.
The invention is designed to fill an urgent need in the rapidly expanding field of microfluidics, in which precisely measuring tiny flow rates is critical. For example, some medical drug-delivery pumps dispense as little as tens of nL per minute into the bloodstream. For comparison, a single drop of water contains 50,000 nL. Clinical diagnostics, chemical research, cell sorting and counting, and continuous-flow micromanufacturing—essentially tiny factories that work nonstop to make small quantities of liquids—also increasingly require accurate measurements of similarly minuscule volumes.
But current state-of-the-art devices used to measure flow on that scale have one or more operational limitations. “Some require calibration, others use complex imaging systems and microscopes; some take data over many minutes, and therefore, can’t track dynamic changes, and some are not traceable to the International System of Units,” said inventor Greg Cooksey, a biomedical engineer in NIST’s Physical Measurement Laboratory.
His optical microflow measurement system, fabricated at NIST’s Center for Nanoscale Science and Technology, avoids those complications. It monitors the speed of fluorescent molecules in liquid as they travel down a channel about the width of a human hair, measuring the time interval between the molecules’ responses to two separate laser pulses.
To exactly mark a start-time reference point, an ultraviolet laser pulse (with a wavelength of 375 nm) is fired along an optical waveguide and into the channel. There, the pulse strikes a chemically protected (“caged”) fluorescent molecule
moving in the stream. “The molecule can’t fluoresce until we activate it with the UV pulse,” Cooksey said. “That, in effect, turns the molecule ‘on’ as its cage is destroyed by the laser. At that point, the molecule becomes responsive to excitation by light.”
After the activated molecule has traveled 250 micrometers—about the thickness of a playing card—downstream in the channel, it crosses the path of a blue laser (488 nm). The molecule absorbs the blue light and immediately emits green light (520 nm). That emission travels down a wave guide to an optical power meter that continuously measures changes in the emitted light’s intensity at a rate of 250,000 times per second.
The emission signals are compared to the timing of the initial activating pulses to determine the elapsed interval. The faster the flow, the less time between activation and emission.
The flow rate is deduced from careful measurements of the time between laser pulses and the channel dimensions, and those measurements are refined with calculations of flow pattern between activation and emission measurements. Therefore, the flow meter does not require calibration using an independent flow standard. In addition, it is more sensitive than most conventional technologies, and provides continuous real-time data with resolution on the order of 1 millisecond.
The invention is also capable of serving as a flow cytometer—a device that counts, or otherwise measures, properties of biological cells in a fluid stream. There are many ways of engineering cells so that they contain fluorescent “biomarkers” of various kinds, which can be measured as they flow past the detectors in the NIST device.
“That’s what we’re trying to build in addition to precision flow measurement—a platform for next-generation biological measurements,” Cooksey said. “For example, because of the precise timing built into the system, we can conduct ‘time-lapse’ studies of cell metabolism, where cells are loaded with fluorescent materials whose emission changes in proportion to their metabolism.”
Such information will be useful for studies of cancer, as cancer cells are known to have elevated rates of metabolism. “We could make as many measurements as we want downstream,” Cooksey said. “We could use 10 of these optical interrogation points, each separated by, say, 100 milliseconds, and track the decline in light output in each cell through time.”
Alternatively, Cooksey said, they could also investigate calcium influx. “Many kinds of cells use calcium for signaling, so if we load the cell with a calcium-sensitive dye, the dye will respond as the calcium concentration changes. That would allow us to watch changes in real time in functions such as neural communication or triggering of programmed cell death.”
A provisional patent application, marking the start of the patent process, has been filed.
Source: https://www.nist.gov/news-events/news/2018/01/stopwatch-nanofluids-nist-files-provisional-patent-measuring-nanoliter-flowGreg Cooksey with apparatus used to observe microflow meter.
Credit: NIST

Call 1-800-829-4444 to discuss your service needs or email [email protected] to schedule your service.Visit: www.keysight.com/find/standardslab
Standards Lab Calibration
• Wideband and amplifier (5725A) options available
• Keysight’s lowest measurement uncertainties
• Fully traceable accredited calibration
• OEM equivalent calibration tests all OEM test points
• Fast calibration turnaround time - typically 15
business days or less
Standards Lab Calibrations offer our lowest measurement uncertainties for more than only Keysight instruments. Our OEM equivalent calibrations can offer you low uncertainties and fast turnaround times for a variety of models from multiple OEMs. Our newest capability allows us to calibrate your Fluke 5700A, 5720A, or 5730A.
Keysight now calibrates Fluke 5700A series calibrators!
Additional Standards Lab Calibration Capabilities
Electro-optics Color temperature, fiber optic power, laser power, wavelength, luminous intensity
RF, microwave,millimeter wave
Antenna gain, attenuation, impedance, linear antenna probe, frequency, phasenoise, noise temperature, excess noise ratio (ENR),
Dimension/ optical
Angle, flatness, length, straightness/parallelism, thread lead
PhysicalDensity, dew/frost point, force, gas flow rate, pressure, temperature, torque,vacuum, air velocity, helium leak, humidity, mass
ElectricalAC-DC difference, AC current, AC voltage, capacitance, DC ratio, DC resistance,DC voltage, inductance, phase angle, sinusoidal/shock sensitivity

16 Jan • Feb • Mar 2018Cal Lab: The International Journal of Metrology
INDUSTRY AND RESEARCH NEWS
the ultrasound travels with the flow and slightly speeds up. In the other direction, it travels against it and slightly slows down. Calculating the speed of the gas requires measuring how long it takes the ultrasound to travel in each direction.
Pitot tubes are small portable devices that gauge how well this CEMS ultrasound system is doing its job. Each year, technicians use pitot tubes to conduct what’s called a Relative Accuracy Test Audit (RATA). To conduct the audit, they insert a pitot tube into the smokestack horizontally. The tube has small holes or ports. One port faces directly into the flow of gas and detects the pressure that builds up in the tube. The faster the flow, the higher the pressure; measuring the pressure allows them to calculate the flow’s speed.
If the pitot tube measures the same flow as the ultrasonic CEMS device, the power plant passes its emissions test. But there are no rules that require the pitot tubes themselves to be calibrated. As a result, it’s not certain exactly how accurate either the CEMS or the pitot tube methods are.
The most commonly used pitot tube is called an “s-probe.” It has two ports that point in opposite directions. One port points directly into the flow. The other points directly away from the flow. The pressure is higher in the upstream port than in the downstream port. Technicians measure this pressure difference and use it to calculate the speed of the gas flow.
NIST researchers have been testing this type of pitot tube as well as two others, the “prism probe” and the “spherical probe,” both of which have five ports instead of two.
NIST’s Iosif Shinder is testing the three probes in a wind tunnel, in which flow is measured with high precision.
After being calibrated in the wind tunnel, the pitot tubes are also being tested in NIST’s horizontal smokestack simulator, which produces eddies and swirls similar to those in industrial smokestacks.
To use the s-probe pitot tubes in a smokestack, a RATA technician makes sure that one of the holes faces the true direction of the flow. In practice, this means rotating the probe to determine the direction of the highest pressure difference. The process, called “yaw-nulling,” must be repeated dozens of times during a RATA test.
“It’s pretty labor-intensive,” Johnson said. It’s so intensive that an on-site annual calibration can take days to complete. “And the power plant is losing money all the time the RATA testers are there, so they want the technicians in and out as fast as possible.”
By adapting a process used in other industries, Shinder is developing a technique that eliminates the need for yaw-nulling. It requires a more complex calibration of the pitot tubes in a laboratory, but Johnson and Shinder say they are confident that the savings from shortening RATA tests will offset the extra calibration expense.
The researchers are arranging to test their findings in a working industry smokestack this summer. In addition to coal-fired power plants, Johnson said that cement and paper production industries might also be able to use the new information. -- Reported and written by Jennifer Lauren Lee
Source: https://www.nist.gov/news-events/news/2018/02/making-smokestack-emissions-tests-better-faster-cheaper
Making Smokestack Emissions Tests Better, Faster, Cheaper
February 27, 2018, NIST News — Smokestacks at coal-fired power plants have sensors that continuously monitor their emissions by measuring the flow of gases such as carbon dioxide, mercury, sulfur dioxide, and nitrogen oxides. By federal law, these sensors need to be calibrated every year. They are calibrated with small, portable flow-measurement devices called pitot tubes.
But scientists suspect there are fairly high uncertainties on the calibration measurements conducted with the pitot tubes. And uncertainties will be a problem for companies if power plants are charged for their emissions under cap-and-trade policies.
In anticipation of the eventual need to increase the accuracy of these measurements, and working in consultation with the Electric Power Research Institute (EPRI) (link is external), researchers at the National Institute of Standards and Technology (NIST) have now measured the uncertainties of the different kinds of pitot tubes now being used to calibrate smokestack-emission sensors.
“The purpose of this study is to give industry options,” said NIST’s Aaron Johnson. “Can we make the measurements better? How much better? And can we do it cheaply?”
Measuring smokestack emissions requires two things: knowing the concentration of pollutants within a flue gas and knowing how fast the gas is flowing.
Researchers have been able to accurately measure concentration of emitted pollutants for decades. But getting accurate flow measurements has been trickier. This is because before being emitted, flue gas usually travels around a sharp bend. The bend creates complicated eddies and swirls that don’t go away even in tall smokestacks.
“The swirl persists as you go up,” Johnson said. “Flowmeters don’t like that. They perform very poorly when you have these crossflow components.”
Right now, to measure flow, smokestacks are installed with an ultrasonic system called a Continuous Emission Monitoring System (CEMS), which consists of a pair of devices that take turns sending ultrasonic pulses to one another from up and down the chimney. In one direction,
Three types of pitot probes. From left to right: s-probe, spherical probe, prism probe. Credit: NIST

Transcat Calibrates All Your Reference StandardsHumidity ■ Dew Point ■ Dimensional ■ Mass ■ Electrical ■ Pressure
Temperature ■ Standards Rentals
Manufacturers Include:
Trust in every measure
RF Standards Calibration (to 50GHz) 17025 Accredited
Now Your Single Source for RF/Microwave Calibrations
Capabilities Include:
• Spectrum Analyzers• Frequency Counters• Function/Arbitrary
Waveform Generators• RF Synthesizers & Generators• Vector Network Analyzers• RF Sensors, Probes, Attenuators• High Frequency Switching• EMI Receivers• Line Impedance Stabilization
Networks (LISN)
Transcat.com/rfcalGet your calibration quote now, call 800-828-1470 or visit:

18 Jan • Feb • Mar 2018Cal Lab: The International Journal of Metrology
INDUSTRY AND RESEARCH NEWS
NOT SURE WHAT THE AUDITORS WILL THINK ABOUT A HEART-SHAPED CAL STICKER…
CAL-TOONS by Ted Green
A NEW HOPE. JEDI MASTER BOB,
FORCE CALIBRATION.
CAL-TOONS by Ted Green [email protected]
Primary Liquid Densitometer To Be Reinstated
February 1, 2018, NEL News - Work is underway to re-instate the Primary Liquid Densitometer at NEL. This will enable NEL to enhance its services and improve the accuracy of the measurements it offers for the calibration of industrial densitometers.
“The work began in December 2017 and a review of current NEL density calibrations systems has been undertaken,” says Principal Consultant, Dr Norman Glen. “We have also started the process of upgrading relevant system control and data-processing software. The project is scheduled to finish in May.”
According to Norman, this nationally important project will re-establish traceability to primary standards for liquid density measurement at elevated temperatures and pressures.
“Our approach uses Archimedes’ principle,” Norman explains. “It measures the apparent mass of a reference body (made from fused silica) in the fluid that we are trying to determine the density of.”
“This work has become a priority due to the demands for enhanced accuracy at elevated pressures that our new era
multi-phase test facility will bring,” says Norman. “We are also seeing requests from meter manufacturers for enhanced density calibration services for next-generation industrial density measurement devices.”
At present NEL uses reference fluids to establish density and there is no direct chain of traceability to primary standards. Whilst this is adequate for most purposes (e.g. calibration of industrial densitometers with an uncertainty of the order of 0.5 to 0.8 %), it is not acceptable for use in primary standard applications.
The use of reference fluids adds an additional source of uncertainty. The completion of the Primary Liquid Densitometer project will allow this uncertainty to be removed, resulting in lower overall uncertainties and improved measurements for industry.
“Highly accurate knowledge of the density of a fluid and its variation with temperature and pressure is particularly important in the oil and gas sector,” explains Norman. “This is because volumetric flow measurement devices are used but mass is the quantity required for reporting. Highly accurate density information is needed to convert one to the other.”
Source: http://www.tuvnel.com/news/primary_liquid_densitometer_to_be_re_instated

19Jan • Feb • Mar 2018 Cal Lab: The International Journal of Metrology
METROLOGY 101
Calibrating a MicropipetteMartin de Groot
Kelvin Training
This paper discusses the calibration of pipette, with particular attention to the type that is used and calibrated most frequently. This is the so-called air-displacement pipette, single channel, adjustable volume pipet. The new ISO/IEC 17025, published November 2017, demands more attention to the agreement of the calibration procedure with the customer. The paper describes points that need to be agreed with the customer and calibration by the gravimetric method (weighing). The alternative calorimetric method (ISO 8655-7) is not described in this paper.
Figure 1. This YouTube film is recommended as a good short introduction to air displacement pipettes and their use [1].
The Use of Micropipettes
A good explanation of the do’s and don’ts when using the pipette is shown in a 10 minute YouTube film of the University of Leicester [1] (see Figure 1).
There is a significant difference in use of these pipettes by either the forward or reverse method. Figure 2 shows the difference between the two approaches.
It is generally recommended that tips of the original supplier should be used with the pipette. Alternative tips can only be used after sufficient experience to ensure the tip fits the particular pipette type. The tip shape, surface roughness, and wettability (adhesion) are of influence on the amount of water taken in by the pipette. Take appropriate care in attaching the tip on the pipette. There must be a close seal between pipette and tip that can easily be misfit by rough treatment. Tips are for single use only.
Make sure that you are not contaminating the pipette body with the liquids that you take in. Immerse the pipette tip 2 mm to 3 mm in the liquid to be taken in. Operate the pipette with care and (for variable volume pipettes) always set the volume from higher to lower volume to avoid that the measurement reproducibility is influenced by the hysteresis of the pipette mechanism.
The calibration procedure must reproduce the method of use as much as possible. For the gravimetric approach, a volume of water is added to a vessel on a balance. This volume is weighed and the weight is converted to volume through the known density of the reference weight(s) used to calibrate the balance and the equations of the densities of water and air. This correction factor is called the Z-factor as defined in ISO 8655-6 [2].
Method and Points of Attention
The new ISO/IEC 17025:2017 is even more particular than the 2005 version about the prior arrangements to be fixed with the customer. Calibrations need to meet the customer requirements whenever possible. There are a few items to observe when calibrating pipettes.
Calibrate the pipette in the same way as it is used: if the customer uses forward (Figure 2) pipetting, the pipette must be calibrated that way too. It might be that your customer wants to have the calibration data expressed at a nominal temperature of 20 °C as described in [6].
Maintenance Pipettes are sensitive to wear. Pipette maintenance is a
regular part of the services provided by a calibration lab; for this, use original parts supplied by the manufacturer. If replacement of O-ring, seal, or other components is required, ISO/IEC 17025:2005 (clause 5.10.4.3) only requires pre-maintenance or pre-adjustment calibration results when the pipette is to be used for calibration. ISO/IEC 17025:2017 (7.8.4.1d) is more particular and requires pre-adjustment and repair data when available for all instruments (i.e., including those not to be used for calibration). When customers want to save money by eliminating the pre-adjustment calibration, the data need not be reported, but the new ISO/IEC 17025 does require the data to be “readily available.” Note that ISO/IEC 17025 does not specify that the calibration procedures before and after adjustment must be the same. Both procedures need to be agreed upon between customer and calibration laboratory (2017 clauses: 7.1.3, 7.2.1.4).

20 Jan • Feb • Mar 2018Cal Lab: The International Journal of Metrology
METROLOGY 101
Figure 2. Forward versus reverse pipetting. To the left (forward pipetting): fill the pipette to the first stop and empty it by pushing all the liquid out. To the right (reverse pipetting): fill the pipette to the maximum extent and then empty the pipette only by pushing to the first stop.
Figure 3. A balance set up for micropipette calibrations with an evaporation trap to minimize the effect of evaporation on the calibration. The balance is placed on a vibration free table. (Courtesy Gilson Netherlands)
Measurement Volumes and Number of Measurements
The measurement volumes must be agreed upon with the customer. ISO 8655-6:2002 describes a minimum of three volumes: the nominal volume, 50 % of the nominal volume, and the greatest of 10 % of the nominal volume and the lower limit of the useful volume range. For pipette calibrations, the repeatability of the calibration dominates the uncertainty budget for most of the pipette ranges. The number of repeat measurements at each volume is advised to be ten; the coverage factor must be calculated from the effective degrees of freedom that results from the uncertainty analysis as explained in UKAS M3003 [8] and other basic documents on uncertainty analysis. In order to minimize the effect from hysteresis in the volume adjusting mechanism of the micropipette, agree with the customer that the volume is always set in the same direction—preferably from higher volume down to the required volume.
TipAgree on the pipette tip (make and type) to be used
during the calibration with the customer. Use the same pipette tip that the customer uses. Besides possible leakage when the pipette tip does not properly fit on the pipette, the pipette tip material and surface roughness have significant influence on the volume of water taken in by the pipette.
Decision RuleThe decision rule is a new item in ISO/EC 17025:2017
and a major revision compared to the 2005 version of this standard. This rule refers to the way it is decided if a calibrated item conforms to a defined specification or not. The new ISO/IEC 17025 is much more specific in requiring
this than the preceding 2005 version. While the old standard only requires that you consider the uncertainty when stating conformity to specification on a certificate, the new standard wants you to understand the level of risk of a false statement when the measurement is within the uncertainty’s range from the specification limit. Current practice is explained by ILAC [7] such that you cannot make a statement on conformity if the measurement is within uncertainty’s reach of the specification limit. The new ISO/IEC 17025 allows you to follow your customer’s “decision rule” to reach a conformity to specification decision. Particularly for low volume micropipettes, this can solve the problem you might have experienced when a decisive conclusion on conformity is not possible because the uncertainty is about as large as or even larger than specified tolerances. This means that not only do you have to agree on the specification tolerances with your customer but also the decision rule. For more information on conformity, read clauses 7.1.3 and 7.8.6 of the ISO/IEC 17025:2017. Further information on decision rules can be found in UKAS M3003, annex M [8], and a document published by BIPM on this subject [9].
Equipment
For proper gravimetric calibration of pipettes, you need a balance placed on a stable weighing table, a thermometer to measure water temperature, a hygrometer for measurement of ambient temperature and relative humidity, a barometer, sufficient pipette tips, pure water and a container to contain this water, a weighing vessel with either a lid or as part of an evaporation trap system to reduce evaporation influence on the measurement, and a timer to measure the time for evaporation measurement.

21Jan • Feb • Mar 2018 Cal Lab: The International Journal of Metrology
METROLOGY 101
BalanceFor calibration of a pipette, you need an accurate
(analytical) balance that must be levelled prior to the measurement and placed on a vibration free bench or table. The balance must have resolution of 10 µg for pipettes between 10 µl and 100 µl and 1 µg for pipettes with smaller volumes. Larger volumes can be calibrated with 0.1 mg balances. For best uncertainties, the calibration of the balance requires particular attention to the linearity of the balance in its lowest ranges. After all, when using the balance, you use the balance to measure volumes between 1 µl (approximately 1 mg) up to, for example, 100 µl (100 mg on your balance). The balance you use for this calibration will have a maximum reading of some 5 grams. Make sure you know the linearity of the balance over the lowest milligrams as well, as that is where you are actually using the balance! Table 4.1 of ISO 8655-6 [2] gives the balance requirements.
Balance Calibration Calibration of the balance may be done by an external
service agent or by yourself. The balance uncertainty contributes quite (if not most) significantly to the calibration of a pipette at lower volumes (typically below 100 µl).
If you calibrate the balance yourself, use a set of mass
pieces ranging from 1 mg to 100 g. Not all weights in this set need to be calibrated. You could use two calibrated reference weights for consistency, but also if only one of the reference weights is calibrated, the linearity can be derived from differential measurements.
For this, add the weights on the weighing pan in the same order as you remove them. This order may be: 1 mg, 2 mg, 10 mg, 20 mg, 100 mg, 1 g, etc. The added mass for each weight should correspond with the reduced mass when you remove the same weight. Note that the weight is not added at the same load as when it is removed. Comparing the mass changes for each weight shows the nonlinearity of the balance (see Figure 4). For this measurement, not all weights need to be calibrated, as stability is the important feature that this method uses. Figure 4 shows that at higher loads, the calibration of the weights become an important contributor to the bias (difference between reading and calibrated value of the reference weight). This effect drops out if you compare the measured mass differences rather than using the bias. The reference weight(s) fix(es) the traceability of your balance, while the linearity measurements relate the other scale readings to the bias of the reference weight. The bias is larger than the non-linearity due to the uncertainties of the class E2-weights that drop out in the subtractions explained in Figure 4.
Figure 4. An analytical balance (total range 215 g, resolution 10 µg) was calibrated adding 1 mg, 20 mg and 200 mg weights (m) to a balance loaded with 20 g, 100 g and 150 g (L). The bias is equal to the balance reading minus the weight certificate values. For an ideal balance, the subtraction of the balance reading after and before adding a weight should be independent of the prior load. Differences δm between these subtractions for different loads are caused by balance nonlinearity. This nonlinearity is shown both in terms of the Load, L, and in terms of the applied weights, m.

22 Jan • Feb • Mar 2018Cal Lab: The International Journal of Metrology
METROLOGY 101
Ambient Conditions You shall need two thermometers: one to measure air
temperature and one for the water temperature of the water in the container containing the source water. The water temperature measurement is the most demanding on accuracy of measurement and contributes more significantly than the other ambient condition parameters. The thermometer may not be so heavy that it makes the water container fall over. The thermometer should be calibrated to within 0.1 °C uncertainty. The air thermometer is to measure the difference between air and water temperature and must also be calibrated to within 0.1 °C.
The relative humidity must be measured even though it has no direct influence on the analysis. The humidity does influence the evaporation in the weighing vessel on the balance. The evaporation causes the weight on the balance to drift. This can be minimized by using a lid on the weighing vessel after adding each volume of water or by using an evaporation trap. The ambient humidity must be higher than 50 %rh and must be measured to within an uncertainty of 5 %rh. For measurement of the evaporation, and allowing a correction and/or the evaluation of its uncertainty, a timer is needed. This timing device should have an uncertainty of 1 s or better.
The ambient pressure must be measured with a barometer with a resolution of 1 hPa and an uncertainty of better than 5 hPa.
Calibration Procedure
As part of the preparation, make sure both pipettes and tips, water, and all associated measurement equipment are sufficiently climatized prior to the measurement.
Calibrate the balance once per day using a calibrated weight and adjust the balance using its internal adjustment system regularly to make sure the balance is corrected for ambient temperature drift. Make sure the balance setting does not automatically do this, ruining your measurement in the middle of a measurement cycle. Also verify that the drift setting of the balance is off.
Verify that the difference between water temperature and ambient temperature is not bigger than 0.2 °C. During the calibration, the temperature should not drift by more than 0.5 °C.
At the beginning of the measurement cycle at each volume, a tip shall [2] be used only to pre-wet the air inside the pipette. For this, fill the pipette with water from the reservoir five times and empty the water to waste. This will more or less “saturate” the air inside the pipet so that evaporation during the calibration is minimized. Evaporation would cause a significant increase in volume of the air cushion of the pipette, displacing the water from the pipette tip. Before the calibration, remove the tip and replace it by a new one that you now carefully fill only once emptying this also to waste. Tare the balance. It is only now that you are ready
to measure.A measurement cycle consists of 10 measurements;
if the customer prefers (to cut cost of calibration) less measurements per volume, the uncertainty will be larger because of the required correction of the coverage factor. Tare the balance after the measurement and before adding a new filling in the weighing vessel.
Take notice of the way that water is to be taken in the pipette and to be delivered in the weighing vessel as described in [2 section 7.2]. In Germany, DAkkS requires a slightly deviating approach for this [10 sections 7.2 and 7.3]. While ISO 8655-6 [2] requires a new tip for every measurement, Guideline DKD-R 8-1 “Calibration of piston-operated pipettes with air cushion” [10] allows, under conditions, that the same pipette tip may be used for the full measurement cycle. It is advised to at least replace the tip for each different volume. Pre-wet a newly fitted tip once after replacement.
For evaporation measurements, the time is to be measured for a measurement cycle. Then over this time, measure the drift on the balance due to evaporation. Divide this by ten to get the evaporation for a single measurement. Repeat this measurement a number of times to allow for an uncertainty estimate of this effect.
Z-factor and Pipette Calibration Data
The analysis of a pipette calibration is not a straightforward calculation. The widely-used gravimetric calibration method (described in ISO8655-6 [2]) relies on an amount of pure water to be transferred into the vessel placed on the balance. The weight of this water relates to the volume of the transferred water by a formula that incorporates the density of the water, density of air and the buoyancy effect affecting the weight of the water on the balance. This formula is, in practice, replaced by the so-called Z-factor, that depends on water temperature, air temperature, and pressure and can be found in table A1 of ISO 8655-6. ISO 8655 takes the air temperature to be equal to the water temperature. For more detail, see Figure 5 and accompanying text.
Uncertainty Analysis
Z-factor UncertaintyFor proper uncertainty analysis the sensitivity of the
Z-factor to the influence parameters (temperatures, pressure, but also humidity) is to be calculated. This can be done analytically as in ISO/TR 20461 [6] but also by numerical variation of the influence parameters. The uncertainty basics are laid out in ISO/TR 20461.
As stated before, the uncertainty from relative humidity is negligible. The Z-factor dependence can be simply found by looking at the Z-dependence on pressure or temperature in table A.1 in ISO 8655 [2]. These so-called sensitivity factors are used to multiply the thermometer and barometer uncertainties in the budget for the calculation

23Jan • Feb • Mar 2018 Cal Lab: The International Journal of Metrology
METROLOGY 101
of the uncertainty contributions from these ambient measurements on the calibrated volume. For more accurate calculation of the uncertainty the ISO/TR 20461 approach is better calculating separate sensitivity coefficients for ambient temperature and water temperature.
ISO/TR 20461 explains the temperature dependence of the pipette and includes an uncertainty component in the budget for the heating of the pipette by the operator.
Balance UncertaintyThe calibration of the balance results in two components
for the uncertainty. One is the linearity component the other is the uncertainty following from the calibration using the reference weight.
Smaller contributions are given as the reproducibility of the balance and the readability of the balance. It can be argued, however, that these components are already part of the balance calibration. As these are smaller than the balance calibration contribution, these components have no significant influence in the combined uncertainty.
Temperature drift sensitivity of the balance results in another generally small contribution per degree ambient temperature instability. This can be calculated using the maximum allowed temperature deviation being 0.5 °C.
Water PurityThe water purity can be verified by boiling out a weighed
volume of water and weighing the residual. As very pure (distilled) water should be used, the uncertainty from this effect should be negligible.
RepeatabilityEvery measurement is repeated a number, n, of times
with n normally being 10 [2]. The repeatability is calculated from the standard deviation s. This standard deviation can be compared with the required value in the specification. The component for repeatability of the measurement in the uncertainty budget is the standard deviation of the mean
_ s = s/√n. Generally this component is the dominant
contributor to the uncertainty. The operator has a very large influence on the calibration result.
Further Uncertainty Components: Pressure vs. Altitude
Thorough German research has shown that this uncertainty calculation is not complete [11,12]. There are some other dominant factors contributing to the uncertainty that are not sufficiently identified in ISO/TR20461. These relate to pressure effects that become significant when working with the pipette on a different altitude than where the pipette was calibrated. DKD document [10] describes an elegant formula (3) allowing correction of a calibration result to a different pressure. An uncertainty component of 20 hPa is advised on the Z-factor to account for this effect.
Buoyancy Effect and the Z-factor
When using an ordinary (analytical) balance for pipette calibration, the balance was calibrated by a stainless steel reference weight with density ρr = 8000 kg m-3. This density is a fixed value within the required accuracy. During pipette calibration the balance weighs water with a density of approximately 1000 kg m-3 and compares this with the weight of the stainless steel reference weight previously used for the calibration. The density of water depends on the temperature of the water [3].
The upwards buoyancy effect is caused by the weight of displaced air by the volume of the stainless steel weight (on the left) versus the larger amount of displaced air by the volume of water on the right. The weight on both loads is partly compensated by the weight of the displaced air. The water having larger volume for the same weight experiences larger upward force because of the larger volume of displaced air. The air density is approximately 1.0 kg m-3 and depends on air temperature, pressure, and to a lesser extent, on relative humidity; the equation for this can be found in [4]. Part of the equation in reference [4] is the molar gas constant. This value has very recently undergone a very small change as a consequence of the redefinition of the SI units. As part of the revision of the SI, new values have been defined for the Boltzmann constant and the Avogadro constant. The product of these is equal to the gas constant. The effect of this change to the Z-factor is however very small and insignificant for the calculation of the Z-factor [5].
Knowing the density of water ρw (t90,w ) as a function of water temperature, the density of air ρa (t90,a ,p, xv ) as a function of temperature, humidity and pressure, and the correction factor from buoyancy can be calculated from [6]:
Z( t 90,w , t 90,a ,p, x v ) = 1 __ ρr × ρr − ρa ______ ρw − ρa
As the dependence of this Z-factor from humidity is insignificant in comparison with the other parameter dependencies, the humidity dependence is neglected.
Figure 5. The upwards buoyancy effect is caused by the weight of displaced air by the volume of the stainless steel weight (on the left) vs. the larger amount of displaced air by the volume of water on the right. The weight on both loads is partly compensated by the weight of the displaced air.

24 Jan • Feb • Mar 2018Cal Lab: The International Journal of Metrology
METROLOGY 101
Figure 6. CMC example uncertainty based on a combination of relevant terms from ISO/TR 20461 and DKD R8-1 (see Table 1 on the following page).
Figure 7. Uncertainty budget for a volume corresponding with the CMC budget in Figure 6.

25Jan • Feb • Mar 2018 Cal Lab: The International Journal of Metrology
METROLOGY 101
The DKD document [11] also explains that this pressure effect depends on humidity. It is argued that while transferring the water from the container to the weighing vessel, water evaporates from the aspirated water into the air cushion. This increases the volume of and humidity in the air cushion and drives some of the liquid out of the pipette. An uncertainty contribution has been taken from studies to amount to 0.007 % of the transferred volume per change of humidity by 1 %rh for 100 µl and 1000 µl nominal pipette volumes. At 1 µl nominal pipette volume, this effect is 0.01 % of volume per change of humidity by 1 %rh. Prewetting to increase humidity inside the pipette becomes even more important.
Handling Component DKD document [10] recognizes handling influences on
the calibration through: 1. mechanical effects (hysteresis reproducibility of the
piston stroke); 2. influences by the operator (waiting times, pace of
work, pipette angle, operating force, immersion depth); and
3. hand warmth, as the thermometer is heated in the hand of the operator.
To account for these effects, German accredited laboratories are required to include a contribution of 0.1% of the calibrated volume in the budget for handling.
For readers wanting to do some calculations themselves,
a GUM workbench example budget is available from our website (Kelvin.training).
References
[1] University of Leicester, 25 Jun 2009, "Using a Micropipette," https://youtu.be/uEy_NGDfo_8. [2] ISO 8655-6; 2002. Piston-oper-ated volumetric apparatus—Part 6: Gravimetric methods for the determi-nation of measurement error.[3] M. Tanaka, et al., "Recom-mended table for the density of water between 0 °C and 40 °C based on recent experimental re-ports," Metrologia, 2001, 38, 301-309 [4] A. Picard, et al., "Revised for-mula for the density of moist air" (CIPM-2007), Metrologia 2008, 45, 149155.[5] D.B. Newell et. al., "The CO-DATA 2017 values of h, e, k, and NA for the revision of the SI," Metrologia 2018, 55 L13-L16.
[6] ISO/TR 20461:2000 (&Cor 1: 2008, IDT) Determination of uncertainty for volume measurements made using the gravimetric method. (Note the correction document of 2008 specifying wrong signs of some coefficients in the original document!)
[7] ILAC G8:03/2009 Guidelines on the Reporting of Compli-ance with Specification.
[8] United Kingdom Accreditation Service, The Expression of Uncertainty and Confidence in Measurement, M3003 Ed. 3, November 2012.
[9] JCGM 106:2012 Evaluation of measurement data – The role of measurement uncertainty in conformity assessment, BIPM 2012.
[10] PTB/DKD Guideline DKD-R 8-1 Calibration of piston-operated pipettes with air cushion, 12/2011.
[11] K. H. Lochner, R. Feldmann, J. Pfohl, PTB/DKD Expert report DKD-E 8-2 Analysis of influencing parameters on calibration of piston-operated pipettes with air cushions, Is-sue 05/2013.
[12] C. Spälti, M. Polin, S. Finkbeiner, PTB/DKD DKD-E 8-3 Einfluss der Höhenlage auf das Volumenergebnis einer KolbenHubpipette mit Luftpolster, Ausgabe 09/2013.
Martin de Groot ([email protected]), Kelvin Training, Kampdijklaan 4, 5263 CJ Vught, Netherlands, https://kelvin.training/.
U Expanded uncertainty at 95 % percent coverage probability.
u(<m>meas) Repeatability of measurement specification ISO 8655-2.
u(δDKD,handling) DKD handling effect 0.07 % of volume.
u(RHDKD) DKD relative humidity effect as described in text for 5 %rh uncertainty.
u(δtwater_air) Difference between air and water temperature at 0.2 °C.
u(PDKD) DKD pressure effect at 0.01 % of volume per 1 %rh.
u(ρwater) Density of water uncertainty estimated as 0.005%.
u(Zt-water) Z-factor water temperature at uncertainty of 0.2 °C.
u(δmbalance) Balance calibration 0.01 mg for 5 g balance and 0.15 mg for other balance.
u(ZP) Z-factor pressure contribution at uncertainty of 10 hPa.
u(Zt-air) Z-factor air temperature at uncertainty of 0.5 °C.
u(ZRH) Z-factor relative humidity contribution at uncertainty of 10 %rh.
u(δevap) Evaporation: 4 nl uncertainty in measured effect.
u(δt,balance) Temperature sensitivity of balance for standard balance specification.
Table 1. UNCERTAINTY BUDGET components used to produce Figures 6 and 7.

26 Jan • Feb • Mar 2018Cal Lab: The International Journal of Metrology
Introduction
Morehouse has been performing both ASTM E74 and ISO 376 calibrations for more than fifteen years. We have been calibrating in accordance with the ASTM E74 standard since its introduction in 1974, and performing ISO 376 calibrations since sometime in early 2000. Until recently, we assumed that the rest of the world and force community knew that the standards were completely different and that either standard could not be substituted for another. However, we have learned that not only are some laboratories providing field calibrations by intermixing and using an ASTM E74 calibration to certify a tensile machine to ISO 7500, but that several organizations throughout the world are not aware that the standards are vastly different in the criteria requirements. Basically, if ISO 7500 is the requirement, then calibration needs to be performed in accordance with ISO 376 on the force-proving instruments used to certify the tensile machine. If ASTM E4 is the requirement, then the elastic force-measuring instrument needs to be calibrated in accordance with the ASTM E74 standard. The differences have already begun to emerge with the subtle use of terminology:
• ASTM E74-13a is titled Standard Practice of Calibration of Force-Measuring Instruments for Verifying the Force Indication of Testing Machines
• ISO 376:2011 Metallic materials — Calibration of force-proving instruments used for the verification of uniaxial testing machines
Selection of Forces
ASTM E74 requires at least 30 force points be selected and typically three runs of data, each with a force point taken at about a 10 % interval. If the Class A or Class AA loading range is anticipated to be less than the first non-zero force point, then a point equal to at least 400 times the resolution for Class A, or 2000 times the resolution for Class AA, needs to be added to the calibration forces selected. By comparison, ISO 376 requires at least 8 force
points throughout the range, and at least 4 runs of data and a creep test if the force-measuring instrument is to be used for incremental loading only. However, if the force-proving instrument is to be used for both incremental and decremental loading, then two extra runs of data are taken, making the total of runs 6. ISO 376 does not allow the first test point to be less than 2 % of the measuring range, and has classifications that specify that the first point cannot be less than 4000 times the resolution for Class 00, 2000 times the resolution for Class 0.5, 1000 times the resolution for Class 1, and 500 times the resolution for Class 2.
Creep Tests
ASTM E74 requires a creep test if the data is analyzed with Method A, which allows the trailing zero to be ignored, whereas ISO 376 requires a creep test if only incremental loads are applied. More information on the creep tests can be found in each of the standards.
Time Requirements for Application of Forces
ASTM E74 does not reference a specific set time that a force should be applied before the point is taken, while ISO 376 states in section 7.4.3, “The time interval between two successive loadings shall be as uniform as possible, and no reading shall be taken within 30 s of the start of the force change.”
Note: Morehouse had performed timing tests and shown the observed output can vary with the amount of dwell time and has adopted ISO 376 timing requirements when calibrating to the ASTM E74 standard.
Determination of Deflection
ASTM E74 allows for Method A, which involves ignoring the trailing zero, and Method B, which involves using an acceptable method such as average zero or interpolation of zero. ISO 376 defines deflection as the difference between a reading under force and a reading without force.
An Introduction to the Differences Between the Two Most Recognized
Force StandardsHenry Zumbrun
Morehouse Instrument Company

27Jan • Feb • Mar 2018 Cal Lab: The International Journal of Metrology
Curve Fitting
ASTM E74 uses the observed data and fits the data to a curve. Most of the time, a second-degree equation is used and ASTM E74 allows up to a 5th-degree equation, assuming that the resolution of the device is over 50,000 counts, and that an F test is passed per Annex A1. ISO 376 allows the use of curves up to a 3rd-degree only.
Calculation and Analysis of Data
This section may be the most dramatic regarding differences. ASTM E74 uses the observed data to calculate a standard deviation from the difference in the individual values observed in the calibration and the corresponding values taken from the calibration equation.
s m = √_________________
d 1 2 + d 2 2 + . . . + d n 2 _________________ n − m − 1
The equation uses the differences and divides by a more conservative number by subtracting the number of deflection values, minus the degree of polynomial fit minus one. This value is then converted to the proper force unit and multiplied by 2.4. The multiplied value is called the Lower Limit Factor or LLF. A loading range is defined based on certain criteria. If the device was calibrated using deadweight primary standards and is intended to be used to calibrate other force-measuring instruments, then a Class AA loading range can be assigned. The Class AA range is assigned by multiplying the LLF by 2000, assuming that the non-zero force point is taken below this value and that the resolution of the force-measuring instrument is less than the LLF. If the force-measuring device was calibrated using another force-measuring device with a Class AA loading range, then only a Class A loading range can be assigned by substituting 2000 for 400 as the multiplier. ASTM E74 works on a concept that the deadweight primary standards are at least ten times more accurate than the secondary standards with a Class AA loading range. The Class AA standards are five times more accurate than the Class A standards, and the Class A standards are four times more accurate than a one-percent testing machine shown in Figure 1 above.
Figure 1. ASTM E74 Test Accuracy Ratio Pyramid.
PRIMARY STANDARDS
0.005 %
SECONDARY STANDARDS
CLASS AA0.05 %
WORKING STANDARDSCLASS A
0.25 %
TESTING MACHINE1.0 %
Figure 2. ISO 376 Expanded Uncertainty of Applied Calibration Force.
±0.01 %CLASS 00
±0.02 %CLASS 0.5
±0.05 %CLASS 1
±0.10 %CLASS 2
An Introduction to the Differences Between the Two Most Recognized Force StandardsHenry Zumbrun

28 Jan • Feb • Mar 2018Cal Lab: The International Journal of Metrology
ISO 376 uses the observed values to ensure that certain characteristics of the force-proving instrument are met and rates the device’s performance based on its characteristics. ISO 376 uses either four runs of data and a creep test or six runs of data to characterize the force-proving instrument and the associated relative error. ISO 376 then takes the highest error percentage per point for each parameter and assigns a class based on the highest error shown in Figure 3. Force-proving instruments, where only increasing data is used (four runs of data), are tested for reproducibility, repeatability, resolution, interpolation, zero, and creep. However, force-proving instruments, where increasing and decreasing data is used (six runs of data), are tested for reproducibility, repeatability, resolution, interpolation, zero, and reversibility. The expanded uncertainty of the applied calibration force must also be less than the table allows. If a force-proving instrument has a relative error % for one of the parameters more than what is required for Class 00, but meets the criteria for all other parameters, then the best classification for the device is limited by class for the highest error. ISO 376 classifies everything per point and then breaks down the classification per loading range. If the relative error of reversibility is Class 1, but all other criteria meet Class 00, then the device is rated as a Class 1 device, assuming that the expanded uncertainty of the applied calibration force meets the criteria as well. What ISO 376 does very well is that it accounts for the uncertainty of the applied calibration force within the standard. A force-proving device cannot have an uncertainty of less than the reference used for calibration, as shown in Figure 3 above. ASTM E74 addresses this point in the appendix and not in the main body of the standard. ASTM E74 currently allows for a Lower Limit Factor that can be less than the uncertainty of the reference standard. In fact, Euramet cg-4 features a useful write-up on this topic.
Euramet cg-4 includes a note at the end of section 6.2: ASTM E 74 includes a mandatory method for calculating a value of uncertainty, which it defines as “a statistical estimate of error in forces computed from the calibration equation of a force-measuring instrument when the instrument is calibrated in accordance with this practice.” This calculation of uncertainty only includes contributions due to reproducibility and deviation from the interpolation equation, although the value is increased to equal the resolution if the original value is calculated to be lower, and the uncertainty of the calibration force applied is also specified to be within certain limits. The method results in an uncertainty value, in units of force, which is applicable across the range of calibration forces and is used to determine the lower force limits for the two standard loading ranges (2 000 times the uncertainty for Class AA and 400 times the uncertainty for Class A). The uncertainty calculated by this method ignores some of the components included in Section 6.1 and, as such, is likely to result in different, and probably lower, values. The use of only the calculated uncertainty value associated with the calibration when developing an uncertainty budget for the subsequent use of the force-measuring instrument should be avoided – the contributions due to the other uncertainty components present during the calibration should also be included. [3]
The author suggests reading Euramet cg-4, Version 2.0 for more information on Uncertainty of Force Measurements since the goal of this article is to show that significant differences exist between the two standards.
Recalibration Dates
ASTM E74-13a in section 11 deals with recalibration intervals. To simplify things, if the force-measuring device demonstrates 0.032 % or better over the Class AA range, or
Figure 3. Table 2 from ISO 376 Standard for Classification of Force-Proving Instruments.
Table 2 - Characteristics of Force-Proving Instruments
Class
Relative error of the force-proving instrument
%
Exanded uncertainty of applied
calibration force (95 % level of confidence)
%of reproducibility
bof repeatability
b’of interpolation
fc
of zero
f0
of reversibility
vof creep
c
00 0.05 0.025 ±0.025 ±0.012 0.07 0.025 ±0.01
0.5 0.10 0.05 ±0.05 ±0.025 0.15 0.05 ±0.02
1 0.20 0.10 ±0.10 ±0.050 0.30 1.10 ±0.05
2 0.40 0.20 ±0.20 ±0.10 0.50 0.20 ±0.10
An Introduction to the Differences Between the Two Most Recognized Force StandardsHenry Zumbrun

29Jan • Feb • Mar 2018 Cal Lab: The International Journal of Metrology
0.16 % over the Class A range, then a two-year calibration interval can be assigned. Section 11.2.2 states that if this criterion is not demonstrated, then the end devices not meeting the stability criteria of section 11.2.1 shall be recalibrated at intervals that shall ensure that the stability criteria are not exceeded during the recalibration interval. ISO 376 in section 8.3.2 allows for a maximum validity of the calibration certificate to not exceed 26 months.
Reporting Criteria
ISO 376 requires:• the identity of all elements of the force-proving
instrument and loading fittings and of the calibration machine;
• the mode of force application (tension/compression);• that the instrument is in accordance with the
requirements of preliminary tests;• the class and the range (or forces) of validity and the
loading direction (incremental-only or incremental/decremental);
• the date and results of the calibration and, when required, the interpolation equation;
• the temperature at which the calibration was performed;
• the uncertainty of the calibration results (one method of determining the uncertainty is given in Annex C) and details of the creep measurement, if performed. [2]
ASTM E74-13a per section 13 requires:The report issued by the standardizing laboratory on the
calibration of a force-measuring instrument shall be error free and contain no alteration of dates, data, etc. The report shall contain the following information:
• Statement that the calibration has been performed in accordance with Practice E 74. It is recommended that the calibration be performed in accordance with the latest published issue of Practice E 74.
• Manufacturer and identifying serial numbers of the instrument calibrated.
• Name of the laboratory performing the calibration.• Date of the calibration.
• Type of reference standard used in the calibration with a statement of the limiting errors or uncertainty.
• Temperature at which the calibration was referenced.
• Listing of the calibration forces applied and the corresponding deflections, including the initial and return zero forces and measured deflections.
• Treatment of zero in determining deflections 8.1(a) or (b), and if method (b) is elected if zero was determined by the average or interpolated method.
• List of the coefficients for any fitted calibration equation and the deviations of the experimental data from the fitted curve.
• Values for the instrument resolution, the uncertainty associated with the calibration results, and the limits of the Class A loading range.
• Statement that the Lower Force Limit expressed in this report applies only when the calibration equation is used to determine the force. [1]
Miscellaneous Items
Both ASTM E74 and ISO 376 have non-mandatory appendices. The ISO 376 appendix deals with bearing pad tests, which are highly recommended for verifying that there is no interaction between the force transducer of an instrument used in compression and its support on the calibration machine. Morehouse can perform bearing
Figure 5. Drawing of Morehouse Load Cell with ISO 376 Compression Adapter.
Figure 4. Morehouse Quick Change Tension Adapter Value Kit meets ISO 376 standard annex A.4 requirements.
An Introduction to the Differences Between the Two Most Recognized Force StandardsHenry Zumbrun

30 Jan • Feb • Mar 2018Cal Lab: The International Journal of Metrology
Figure 6. Sample from Morehouse Scope Showing ASTM and ISO 376 Capability.
pad tests, if requested. The ASTM E74 appendix does not address adapters, which can be a large source of error (see Morehouse blogs on force measurement errors for more information on these errors). ISO Annex A 4 discusses loading fittings:
Loading fittings should be designed in such a way that the line of force application is not distorted. As a rule, tensile force transducers [shown in Figure 4] should be fitted with two ball nuts, two ball cups, and, if necessary, with two intermediate rings, while compressive force transducers should be fitted with one or two compression pads [shown in Figure 5]. [2]
Summary
This article is intended to show that ASTM E74 is not the same as ISO 376; one cannot effectively use an ASTM E74 calibration to certify to ISO 7500, and one cannot effectively use an ISO 376 calibration to certify to ASTM E4. It is possible, however, to use some of the ISO 376 data for analysis with ASTM E74. This practice assumes that the minimum number of test points is met. This article is not comprehensive since several other differences exist between both standards in addition to those discussed here. For anyone wanting to perform force calibrations to ASTM E74 or ISO 376, we recommend purchasing the standards at https://www.astm.org/Standards/E74.htm and https://www.iso.org/standard/44661.html . Morehouse can provide calibration to ISO 376, ASTM E74, or both standards. If you need calibration in accordance with either standard, it is important to look at the scope of accreditation and verify that your calibration provider has the capability mentioned on their scope, as shown in Figure 6.
References
[1] ASTM E74-13a. Standard Practice of Calibration of Force-Measuring Instruments for Verifying the Force Indication of Testing Machines (https://www.astm.org/Standards/E74.htm).
[2] ISO 376:2011. Metallic materials — Calibration of force-proving instruments used for the verification of uniaxial testing machines (https://www.iso.org/standard/44661.html).
[3] EURAMET cg-4, version 2.0 – Uncertainty of Force Measurements (https://www.euramet.org/Media/docs/Publications/calguides/EURAMET_cg-4__v_2.0_Un-certainty_of_Force_Measurements.pdf).
Henry Zumbrun ([email protected]), Morehouse Instrument Company, 717-843-0081, www.mhforce.com.
Parameter/Equipment Range CMC2,3 (±) Comments
Force –
Dead Weight PrimaryStandards Tension and Compression
(0.1 to 10) lbf[(0.44 to 44) N]
(10 to 100) lbf[(44 to 444) N]
(100 to 12 0000) lbf[(444 to 53 378) N]
(12 000 to 120 000) lbf[(53 378 to 533 786) N]
0.00225 %
0.0016 %
0.0016 %
0.0016 %
Force Calibrationincluding ASTM E74Class A and AA, ISO 376Class 00, 0.5, 1 and 2
Forces can be applied incrementally and decrementally thus permitting the determination of hysteresis errors.
An Introduction to the Differences Between the Two Most Recognized Force StandardsHenry Zumbrun

31Jan • Feb • Mar 2018 Cal Lab: The International Journal of Metrology
Introduction
When a calibration laboratory undergoes an audit for ISO/IEC 17025 accreditation, their Calibration Measurement Capabilities (CMCs) are presented in a document known as the Scope of Accreditation (SoA). The laboratory’s accredited measurement capabilities are comprised in an official SoA document carrying a legal signature from the certifying body as an external verification. The purpose for an ISO/IEC 17025 scope of accreditation serves as the deliverable end product of a calibration laboratory’s external audit. Currently a free-text (largely unformulated) document has been sufficient; however, the information contained in these free formatted documents is not machine readable.
There is a legal obligation of an ISO/IEC 17025 scope accredited calibration laboratory to ensure that it does not misrepresent the auditing body’s certification on any calibration report that bears the certifying body logo. This is a requirement that the auditing body places on the certified calibration laboratory. To meet this requirement, the laboratory must have processes in place to check each and every stated uncertainty on every calibration report containing a certification logo. The laboratory must ensure that all stated uncertainties correspond to the capabilities section of its current ISO/IEC 17025 SoA. This is a tedious, complex, and time consuming process lending itself to human errors. Numerical calculations, comparisons, and document generation are tasks better suited for a computer and automated data processing.
Some of the major hindrances preventing software from auto-validating ISO/IEC 17025 calibration reports are the
lack of intelligently parseable scopes of accreditation and the associated Calibration Measurement Capability (CMC) data. And the lack of an industry standard defining the content and layout of a lab’s ISO/IEC 17025 SoA, prevents the development of a standards tool for parsing the data.
This paper highlights the progress made on developing a practical alternative, most notably of which has been the refocusing of the NCSLI 141 Measurement Information Infrastructure (MII) & Automation Committee taking on the gargantuan task of defining standards for metrology based data. Mark Kuster has been faithfully documenting these efforts as a special feature in the Metrologist for anyone interested in further reading [1]. Much of the information is available on http://miiknowledge.wikidot.com/start.
Additionally, members of the group have created several supporting databases and open-source software applications and tools available online. Most of the developed applications and source code is available under standard open source licensing and are free to use at no cost:
• https://github.com/CalLabSolutions/Metrology.NET_Public
• http://testsite2.callabsolutions.com/UnitsOfMeasure/UOM_Database.xml
• http://schema.metrology.net/Uom_Database.xsd• http://schema.metrology.net/Uncertainty.xsd• http://schema.metrology.net/
MetrologyTaxonomyCatalog.xsd• http://schema.metrology.net/SoA_Master_Datafile.xsd
Creating a Taxonomy for MetrologyMichael L. Schwartz
Cal Lab Solutions, Inc.
This paper covers the progress of the MII (Measurement Information Infrastructure) effort to create a standard for expressing a calibration laboratory capabilities, ISO/IEC 17025 Scope of Accreditation (SoA) in an XML formatted dataset. Once established, the metrology community can move from manually verifying uncertainties to a more automatable approach. This XML file can then be used to generate a traditional SoA document. As a result of these efforts, the members of the MII working group have released several tools and software to the community under open source licenses. These tools can be used for tasks such as verifying final uncertainties on a calibration test report to comply with a SoA.
Over the past three years, the MII working group has refined a SoA data schema and developed a number of supporting products including: a standard measurement-quantities-and-unit-of-measure database; an open-source, unit-of-measure management and conversion tools; an open-source high precision formula interpreter; and an open-source, SoA data access object library. We are currently working on user friendly data editors and online SoA search tools. Now, we need help from the community to create a self-enforcing standard for terms, taxonomies, and encapsulating knowledge to be used throughout MII.

32 Jan • Feb • Mar 2018Cal Lab: The International Journal of Metrology
Technical Overview
An Expanded Mission - Becoming a Component of MII
Creating a digital representation of SoA data is a logical first step in the initiative to implement a full set of MII standards (see Figure 1). SoAs only exist in the thousands. While this is a large dataset, it is a much smaller set than the millions of instrument specifications and billions of certificates. So, starting with creating a standard for SoA data was a logical place to start.
It is important to note, there are multiple uses for this data outside of the calibration lab. First, and most noteworthy, was a search tool. Searching through thousands of PDF formatted documents to find a qualified lab is a time consuming process. And to make matters worse, it required a laboratory insider who understands a SoA and his trusty calculator. Having a search tool that could filter out labs based on their measurement capabilities, as well as calculate the uncertainties, would be of great benefit to the industry. A search tool like this would make it easy for any user anywhere in the world to find a qualified calibration lab without having learn complex calculations found in a typical SoA.
Unfortunately, we also discovered the SoA database could never be populated by simply scanning the existing SoA documents in PDF format. No solution, using manpower or any known current technology, could adequately perform this task. We fervently believe no set of pattern recognition rules, translation rules, or even the most powerful artificial intelligence engine could be created to adequately capture this data. Even experts in the field of metrology are stumped as to some of the meanings found in these documents.
There is a contextual deficiency in most documents because important elements are just stuffed into the comments section of the CMC line. Scanning or typing the
data into a database wouldn’t solve the problem, since much of the data (processes, techniques, and equipment) would still be contextually usable. From an MII perspective, the existing state of SoA data is insufficient to fully realize the MII vision. The SoA data required had to be fundamentally re-engineered.
Required DataToday’s typically published SoA only contains a subset of
the requirements we need from an MII perspective. The data in a SoA can be broadly split into two categories: one being a set of formulas needed to calculate the certified uncertainty limits, the other being a set of metadata (data about data) needed to determine which of the uncertainty calculation formulas is applicable to a given test report value. Both of these broad categories of data can be further broken down.
Each uncertainty formula (which can be as simple as a constant) is expressible as a symbolic algebraic expression, having: a result, a set of coefficients, and a set of variables. The symbolic algebraic expression is a required data element. And each of the algebraic expression constituent elements must be fully defined. These elements include the result, constants, and input variables. The data required for each input and resulting output is a quantity type (i.e., length, mass, torque, etc.). This keeps the interface format simple and automatically provides unit conversions.
Note: Only quantity types for the formula constituent elements are required. Units of measurement are not required because they can be calculated from a quantity type and a mechanism for doing so has been developed that utilizes a supporting database which specifies a single standardized unit of measurement for any given quantity type.Since the appropriate formula for uncertainty calculation
can vary depending on the test requirements--what is being calibrated, how it is being calibrated, and what is the nominal value-- metadata in the formula selection
is utilized to answers to these questions. The metadata typically contains criteria for the Device Under Test (DUT) type, the test technique, the equipment being used as standards and/or accessories, and ranges for stimulus values. We keep the test criteria requirements open ended so it can handle boundless lists of specific criteria.
Over the past three years, the MII group has made simple yet significant refinements to the original XML Schema. Working with the NCSLI MII & Automation Committee has helped test our theories of creating a machine readable SoA. We have demonstrated the capability of our software by duplicating several existing SoAs into our XML format. For now, editing of this is being done with a commercially available, raw XML editor, but an effort is underway to develop a user friendly editor.Figure 1. MII communications vehicles. [2]
Creating a Taxonomy for MetrologyMichael L. Schwartz

33Jan • Feb • Mar 2018 Cal Lab: The International Journal of Metrology
Solving the Missing Context Problem
Defining Standard TechniquesThe biggest problem we have in creating a SoA
formatted database is the lack of an explicitly defined measurement taxonomy. Currently, it is a free form text block in the comments section of the SoA. In the machine readable schema, the technique element is foundational to comprehension and all CMC lines must be linked to a technique.
Looking at the sample SoA (Figure 2), it impossible for a computer software system to know the difference between measure capacitance and source capacitance, unless the exact standards were being used. But we have to remember, a SoA only lists a lab’s BEST measurement capabilities; this lab could have other fixed capacitors and even a Fluke 5500A.
To be technically usable, the data:• Must define the technique result(s) type by
measurement quantity, and all measurement quantities must exist in a standard reference (measurement-quantity-unit-of-measurement database).
• Must define the minimum and maximum expected values for each process result.
• Must define the name and type of every parameter utilized to either make a selection or calculate a value. If the underlying value is numeric, it defines the measurement quantity type for the parameter. If the underlying value type is a list of values represented by names, it defines that list.
• Must define every formula utilized within the technique with sufficient detail to allow automated assignment of values into each parameter and subsequent calculation.
This schema additionally encourages the documentation of techniques by having data elements reserved for HTML based documentation. This allows labs and other metrology based organizations to publically share information about a technique.
Creating a Formal Metrology TaxonomyIn the schema, the process type element is given a
formal role: It conveys a formal standard of the metrology taxonomy of the CMC. Every technique must be linked to a process type and every process type must exist in a standard metrology taxonomy. The process type serves as a content-rich, generic specification referencing at a high level what is being tested.
The data structures for process type are well defined and exist primarily to create a means of categorizing and creating templates. For example, if the technique measures the AC voltage of a sine wave signal, the process type might be named “Measure.Voltage.Sinusoidal.RootMeanSquare.”
There will be several specific techniques that will share the same process type, so you can think of the relationship as a “kind” of measurement process type. By requiring every uncertainty specification in a SoA to be tied to a technique, and in turn, requiring every technique to be tied to a process type from a standard metrology taxonomy, the data now becomes usable.
Figure 2. Sample SoA
Creating a Taxonomy for MetrologyMichael L. Schwartz

34 Jan • Feb • Mar 2018Cal Lab: The International Journal of Metrology
MII’s Relationship to the International Vocabulary of Metrology (VIM)
The MII definitions will be built upon a specific standard metrology vocabulary. So what is the relationship between MII and the VIM? The VIM’s reason for existence is similar yet different from that of the MII. Both exist to clarify communication so they can exist side by side. However, while the VIM is limited by its nature to being a recommended best-practice [3], a standard taxonomy within MII will not be optional; compliance with its standards will be required and enforced with reference databases.
This is why the MII working group is working so diligently to formally define a reference database and schemas. It will include naming conventions, complex data structures, and sub-components. And at the center of it all is the creation of a process type/taxonomy reference database. The contextual data in this database will be used to link all related elements using a “kind” of process type.
Structured For ReusabilityThe following data element definitions are designed
to convey a sense of exactness in data, yet allow lab customization and future expansion of the standard.
In the SoA schema, data elements that are reusable can be separated out and externally referenced. These reusable data elements now reside in the schema as “MetrologyTaxonomyCatalog.xsd.” The reusable data elements currently defined in the “MetrologyTaxonomyCatalog.xsd” are: DeviceType, DeviceTypes, Value_type, RangeLimit_type, Result, Function_type, Function, Parameter, ProcessType, and Technique.
• DeviceType: The value for a device type is the name of a specific device or family of devices. As a standard metrology taxonomy develops, these values should correlate with a standard online reference.
• DeviceTypes: A DeviceTypes element simply holds a collection of DeviceType elements.
• Value_type: A Value_type is a reusable definition for any data element holding a measurement value. Any data element derived from a Value_type will hold a combination of a numeric value, an optional unit-of-measure, and optional presentation formatting.
• RangeLimit_type: A RangeLimit_type is a reusable definition for any data element holding a value that can either be the start or end of a measurement value range. Any data element derived from a RangeLimit_Type holds the combination of a Value_Type and a test. A test is a boolean operator that is equivalent to “is equal to,” “is less than,” “is greater than,” “is greater than or equal to,” or “is less than or equal to.”
• Result: The Result element defines the type of any result produced by a Function, ProcessType, or Technique. The type of a result is defined by specifying its measurement quantity type.
• Function_type and Function: A Function_type is a reusable definition for any data element holding a mathematical symbolic expression in which all symbols are fully defined. A Function is a data element that is directly derived from a Function_type.
• Parameter: A Parameter holds a named variable type definition. The variable definition can be either for a variable that can hold a measurement value or named item. If the variable definition is for a measurement value, the Parameter element holds the variable’s name and measurement quantity type. On the other hand, if the variable definition is for a variable that can hold a named item, the Parameter element holds the variable’s name as an enumerated list of valid item names.
• ProcessType: A ProcessType data element holds a name, Result(s), Parameter(s), Function(s), and Documentation. To be useful in MII, Process types must exist in a standard, universally accessible reference—a metrology taxonomy organized as a public online dataset. Process types serve as grammatical adjectives which specify a specific, yet still high level domain for test and measurement techniques.
• Technique: A Technique element holds information about techniques. The information held includes: a name for the technique, the name of the process type, the technique implements, ranges for results, (if required) an extension to the list of parameters contained in its process type, ranges for all numeric parameters, a list of required equipment, (if required) additional functions to those defined in its process type, functions that are specifically annotated for utilization in an SoA, and documentation that should go beyond the generic documentation of its process type.
SoA Databases and Related XML Technologies
We chose XML based technologies are a well defined industry standard with tons of software, products, tools, and libraries that operate on XML documents. In the SoA effort, the following XML document types and standard software technologies have been employed:
Schemas (*.xsl files) - XML has more than one way to specify schemas for data documents. In the SoA effort, both rules defining valid data structure (grammar) and rules defining valid data content (business rules) are required.
Creating a Taxonomy for MetrologyMichael L. Schwartz

35Jan • Feb • Mar 2018 Cal Lab: The International Journal of Metrology
Different solutions were selected for these two tasks: XML Schema Definition Language (XSD) is used for the task of defining data structure, and C# code is used for validating data content.
Data documents (*.xml files) - The goal of this effort is to produce machine readable SoA database containing all the CMC listed on the PDF document. The XML version of the SoA will be a well formatted external reference whose content can be shared, uploaded and used by several software systems like Metrology.NET® and Qualer Search.
Retrieving DataThere are a variety of approaches to retrieving data from
XML data sources. Some of the most common methods are XPath and XQuery expressions. In this effort, a Microsoft specific technology called “XML LINQ” has been widely employed for querying.
The SoA Document Generation ProcessWe see the process for authoring a SoA starting much
as it does now, with a template provided to the laboratory by the accreditation body. The difference is that instead of using word processing technology, the template for this effort is a XSLT document and the task presented to the laboratory is to author the contents of XML data documents using a special purpose editor rather than filling out a document using a word processing program.
Once the XML files have been authored, the documentation layout and generation processes can be fully automated: The contents of the XML documents can be merged with XSLT templates in order to produce a PDF with tools such as a Formatting Object Processor.
The CMCs Data Section of the SoA DatabaseThe CMCs section of the XML version of the SoA
contains metadata about the CMC Section. This metadata serves three purposes: 1) It can be used as filter parameters to select the correct CMC section, 2) the values can be used as inputs for the CMC formula and calculations, and 3) it minimizes ambiguity.
The purpose of namespaces in XML is to distinguish element names that might otherwise be inadvertently named the same but have more than one schematic definition. This situation can arise when data sources are merged together from separate source documents. Since, in both this effort and follow-on projects, merging data from separate data sources will be common, all XML files used in the effort will use namespace prefixes.
All of the SoA XML files refer to data defined in a separate Unit Of Measurement data file. Future additions to the effort will also allow additional references such as: Equipment/Accessory types, Test Processes (Techniques), Measurement Categories, and Test Equipment Setup Models. Once in place, restrictions will be enforced that
only terms defined in these external dictionaries may be used.
Note: The rationale for limiting terms to only those appearing in these dictionaries is the same as the motivation behind the Vocabulary in Metrology (VIM). By limiting the use of terms to only those found in external, openly accessible dictionaries, the SoA reader will be enabled to delve into the definition of any term as needed.
All XML files (just like HTML files) must have a single root element. For the CMC files, the root element is the “CMCs” element. The CMCs element is merely a container for a collection of CMC elements. Each CMC element holds all the metadata that is selection criteria for an element known as a CMC “Template,” as well as all of the data for the template. A unique CMC template is required whenever the CMC formula, in combination with the formulas selection criteria, change.
The metadata that is used for selecting a CMC formula exist in a hierarchical structure. The CMC template contains four metadata elements that serve as the first layer of selection criteria. If any of these four metadata elements fails to match the measurement, then the CMC template element is not applicable. These terms are:
1. A broad technical category to which the measurement applies - An example of a broad measurement technology category would be Electrical with a subcategory of Direct Current. In the XML file this would appear as:<unc:Category name=”Electrical”> <unc:Category name=”Direct Current”/></unc:Category>
2. Device(s) Under Test (DUT) type(s) - The Device(s) or DUT types define what is being tested. The DUT type can be a generic description or explicit model/option numbers. If more than one entry is required, a “DUT_types” element is required. Therefore, in the XML file the DUT type(s) can appear either as a list contained in a DUT_Types element: <unc:DUT_Types> <unc:DUT_Type> Multi-Function Calibrator </uncDUT_Type> <unc:DUT_Type>Fluke 5700</uncDUT_Type> <unc:DUT_Type>Fluke 5720</uncDUT_Type> <unc:DUT_Type>Fluke 5730</uncDUT_Type><unc:DUT_types/>
or as a single entry without the DUT_Types element being required:<unc:DUT_Type> Fluke 57XX Meter Calibrators </unc:DUT_Type>
3. Test Process Identifier - The Test Process defines what, in fine detail, on the DUT is being tested or measured.
Creating a Taxonomy for MetrologyMichael L. Schwartz

36 Jan • Feb • Mar 2018Cal Lab: The International Journal of Metrology
As an example, if a plug gage is being tested, possible Process names might be “measure diameter external” or “measure surface roughness.” This would appear in the XML file as:<unc:Process> measure surface roughness </unc:Process>
4. Test Technique Identifier - The Test Technique (The Metrology Taxonomy) specifically defines what measurement/metrology process is being performed. As an example, if a gage block is being tested, possible Technique names might be “non-contacting using laser interferometer” or “contacting substitution comparison.” This would appear in the XML file as:<unc:Technique> contacting substitution comparison </unc:Technique>
Note: These four standard metadata criteria (Category, DUT Type, Test Process, and Test Technique) greatly diminish the need for the “Comments” column found in typical SoA documents. Because the contents of the typical SoA Comments column are nearly unrestricted, they become unusable from a library science point of view. A major goal of this effort is to organize and categorize the elements that are typically found in the comments of an SoA.
The CMC Template Element The CMC template contains the definition of the CMC
formula(s) as appropriate, the definitions of all symbols in the formula, additional selection criteria, and the values for all constants defined in the formula.
The selection of a CMC formula set will often depend on the values of variables. The variables can be numeric or boolean (true/false) conditions. The numeric variables may be explicit in the formula or external to the formula.
There are often symbols that come into play that are not explicit in the formula. These are symbols for variables that act as selection criteria for the template. These symbols are defined in a “Selector” element. The symbol definitions apply to the template level, however, the values will be stored in the range selection. As an example, the CMC uncertainty of a microphone calibration may depend on the frequency of the test point. In this case, a symbol for a variable that will hold the frequency value for different frequency ranges is required and its definition is held in a Selector element as follows:
<unc:Selector> <unc:Symbol>f</unc:Symbol> <unc:Quantity>frequency</unc:Quantity> <unc:Description>Audio Frequency</unc:Description> </unc:Selector>
In addition to numeric ranges, formula selection can also depend on non-numeric criteria. These criteria can
be held in a collection of Condition elements. Condition elements hold boolean name/value pair assertions. This provides an opened-ended method of extending beyond the four standard selection criteria that apply to the template level. If more than one condition exists, they can be organized in either lists or hierarchies. If numeric ranges also exist as selection criteria, they must be contained within the definition of condition criteria. If no condition criteria exist, then numeric ranges can exist on their own.
Most of the time, a template will only contain a single formula. There are circumstances however where multiple CMCs apply to a test. A typical case is in the measurement of microwave parameters where one CMC specification exists for the magnitude of the measurement result and a second CMC specification exists for its phase. In this type of case, the default heading name for the CMC column does not suffice because there are two values that must be distinguishable from each other. To handle this situation, the formula element has an optional heading attribute that should be used to override the default column name which is simply “CMC.”
The CMC formula will consist of definable symbols representing inputs and constants, as well as mathematical operators. The formula expression is contained in a “Function” element. As an example, the uncertainty of a pressure gage often depends on four values: the reading, a percent of reading specification, a percent of full scale value, and finally the full scale value. In this case, the expanded formula expression (using square root of the sum of squares) might appear in the XML files as:
<unc:Function> sqrt((m1 * x + b1 * fs1)^2 + (m2 * x + b2 * fs2)^2) </unc:Function>
This expression is not useful by itself because none of the symbols or the result has yet to be defined. The schema has provisions to fully define all of the symbols, as well as the result. These definitions are held in a “SymbolDefinitions” element that immediately follows the Function element.
This was just a brief overview of the XML and schema format. For more detailed information, read “Creating a Standardized Schema for Representing ISO/IEC 17025 Scope of Accreditations in XML Data” by Dave Zajac [4].
Software and Tools
In parallel with the development of the MII data structures, software is being developed that is able to work with these data structures. This parallel development drives an iterative refinement of both the formal definitions of the data elements and the ongoing discovery of new potential value as the MII is coming to fruition.
Creating a Taxonomy for MetrologyMichael L. Schwartz

37Jan • Feb • Mar 2018 Cal Lab: The International Journal of Metrology
The Data Access Object Library (.dll)An open source data access object library currently exists
with the following features:• Ability to load data from both local files or internet
based XML files• Data structure with access to all data values • Ability to add, remove, and/or modify individual
data values • Ability to save updated data back to file• Support for common data queries• Built in formula interpretation• Substantial data validation and automatic conflict
resolution• Ability to integrate with higher level software• Open source• Dual licensing
Data EditorsData editors are being developed to allow manipulation
of data without having to open the XML files in a text editor:• Unit-of-Measurement Database Editor• SoA Database Editor
Online SoA Search ToolsThis working online search tool (http://Search.qualer.
com) provides:• Geolocation of calibration services providers with
search filters for full SoA contents including: ◦ Quantity ◦ Range ◦ CMC ◦ Device Type
• Business identification• Point of contact identification
Next Steps - Collaboration and Formalization
This effort is now beyond the Proof-of-Concept stage. Enough development has been done to prove that the approach is technically feasible, but there is still plenty of work to be done before the accreditation body can fully embrace the technology. Efforts are underway to present this technology to The International Laboratory Accreditation Cooperation (ILAC), with hopes of this becoming an international standard.
The working group has made great progress over the past few years. We have progressed from grand idea, to proof of concept, all the way to working applications. We
put the architecture to the test, learned some things along the way and made improvements. At this point we feel the architecture is solid and ready for the next phase.
The biggest thing we learned along the way was the lack of standardization. There is an immediate need for a metrology based taxonomy to standardize the message in a CMC meaning. In our original implementation, we allowed the process type to be free form and manually entered. This created ambiguity where one lab called Volts, another lab called Volts Direct Current. Such ambiguity reflects an immediate need for an international reference database containing standardized names for metrology techniques.
References
[1] M. J. Kuster, “Toward a Measurement Information In-frastructure,” Metrologist, 6.1-pres., 2013-pres.
[2] M. J. Kuster, “Toward a Measurement Information In-frastructure,” Metrologist, 8.1, p21, 2015.
[3] JCGM, “International vocabulary of Metrology–Basic and general concepts and associated terms (VIM),” 3rd edition (2008 version with minor corrections), JCGM 200:2012.
[4] D. Zajac, “Creating a Standardized Schema for Rep-resenting ISO/IEC 17025 scope of accreditations in XML Data,” presented at NCSL Int. Workshop & Symposium (NCSLI), St. Paul, MN, July 24-28, 2016. http://www.metrology.net/dev/wp-content/up-loads/2016/07/NCSLI-2016-Digital-SoA-Brief-docx.pdf.
Michael L. Schwartz ([email protected]), Cal Lab Solutions, Inc., Aurora, Colorado, (303) 317-6670, www.callabsolutions.com.
Creating a Taxonomy for MetrologyMichael L. Schwartz
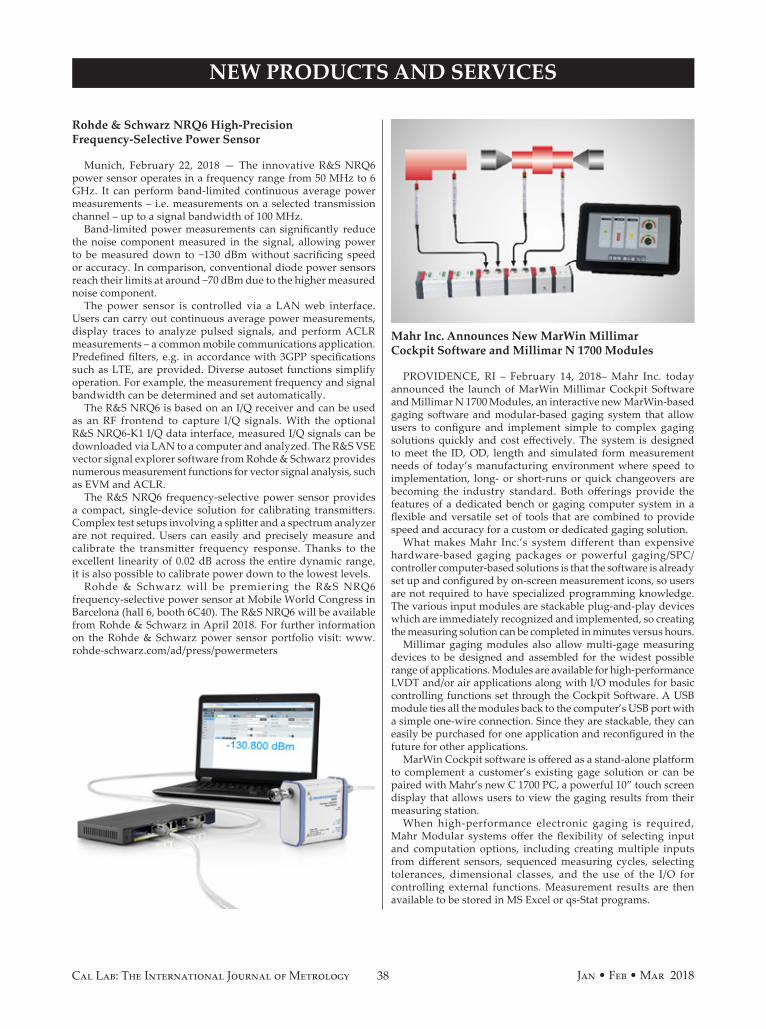
38 Jan • Feb • Mar 2018Cal Lab: The International Journal of Metrology
NEW PRODUCTS AND SERVICES
Rohde & Schwarz NRQ6 High-Precision Frequency-Selective Power Sensor
Munich, February 22, 2018 — The innovative R&S NRQ6 power sensor operates in a frequency range from 50 MHz to 6 GHz. It can perform band-limited continuous average power measurements – i.e. measurements on a selected transmission channel – up to a signal bandwidth of 100 MHz.
Band-limited power measurements can significantly reduce the noise component measured in the signal, allowing power to be measured down to −130 dBm without sacrificing speed or accuracy. In comparison, conventional diode power sensors reach their limits at around −70 dBm due to the higher measured noise component.
The power sensor is controlled via a LAN web interface. Users can carry out continuous average power measurements, display traces to analyze pulsed signals, and perform ACLR measurements – a common mobile communications application. Predefined filters, e.g. in accordance with 3GPP specifications such as LTE, are provided. Diverse autoset functions simplify operation. For example, the measurement frequency and signal bandwidth can be determined and set automatically.
The R&S NRQ6 is based on an I/Q receiver and can be used as an RF frontend to capture I/Q signals. With the optional R&S NRQ6-K1 I/Q data interface, measured I/Q signals can be downloaded via LAN to a computer and analyzed. The R&S VSE vector signal explorer software from Rohde & Schwarz provides numerous measurement functions for vector signal analysis, such as EVM and ACLR.
The R&S NRQ6 frequency-selective power sensor provides a compact, single-device solution for calibrating transmitters. Complex test setups involving a splitter and a spectrum analyzer are not required. Users can easily and precisely measure and calibrate the transmitter frequency response. Thanks to the excellent linearity of 0.02 dB across the entire dynamic range, it is also possible to calibrate power down to the lowest levels.
Rohde & Schwarz will be premiering the R&S NRQ6 frequency-selective power sensor at Mobile World Congress in Barcelona (hall 6, booth 6C40). The R&S NRQ6 will be available from Rohde & Schwarz in April 2018. For further information on the Rohde & Schwarz power sensor portfolio visit: www.rohde-schwarz.com/ad/press/powermeters
Mahr Inc. Announces New MarWin Millimar Cockpit Software and Millimar N 1700 Modules
PROVIDENCE, RI – February 14, 2018– Mahr Inc. today announced the launch of MarWin Millimar Cockpit Software and Millimar N 1700 Modules, an interactive new MarWin-based gaging software and modular-based gaging system that allow users to configure and implement simple to complex gaging solutions quickly and cost effectively. The system is designed to meet the ID, OD, length and simulated form measurement needs of today’s manufacturing environment where speed to implementation, long- or short-runs or quick changeovers are becoming the industry standard. Both offerings provide the features of a dedicated bench or gaging computer system in a flexible and versatile set of tools that are combined to provide speed and accuracy for a custom or dedicated gaging solution.
What makes Mahr Inc.’s system different than expensive hardware-based gaging packages or powerful gaging/SPC/controller computer-based solutions is that the software is already set up and configured by on-screen measurement icons, so users are not required to have specialized programming knowledge. The various input modules are stackable plug-and-play devices which are immediately recognized and implemented, so creating the measuring solution can be completed in minutes versus hours.
Millimar gaging modules also allow multi-gage measuring devices to be designed and assembled for the widest possible range of applications. Modules are available for high-performance LVDT and/or air applications along with I/O modules for basic controlling functions set through the Cockpit Software. A USB module ties all the modules back to the computer’s USB port with a simple one-wire connection. Since they are stackable, they can easily be purchased for one application and reconfigured in the future for other applications.
MarWin Cockpit software is offered as a stand-alone platform to complement a customer’s existing gage solution or can be paired with Mahr’s new C 1700 PC, a powerful 10” touch screen display that allows users to view the gaging results from their measuring station.
When high-performance electronic gaging is required, Mahr Modular systems offer the flexibility of selecting input and computation options, including creating multiple inputs from different sensors, sequenced measuring cycles, selecting tolerances, dimensional classes, and the use of the I/O for controlling external functions. Measurement results are then available to be stored in MS Excel or qs-Stat programs.

39Jan • Feb • Mar 2018 Cal Lab: The International Journal of Metrology
NEW PRODUCTS AND SERVICES
About Mahr Inc.Mahr Inc., a member of the Mahr Group, has been providing
dimensional measurement solutions to fit customer application needs for more than 150 years. The company manufactures and markets a wide variety of dimensional metrology equipment, from simple and easy-to-use handheld gages to technically advanced measurement systems for form, contour, surface finish and length. Mahr Inc. is also well known as a producer of custom-designed gages and a provider of calibration and contract measurement services. Mahr Inc.’s calibration laboratories are accredited to ISO/IEC 17025:2005 NVLAP Lab Code 200605-0. For more information, visit www.mahr.com.
Cal Lab Solutions, Inc. Introduces Metrology Blocks at MSC Training Symposium
Cal Lab Solutions, Inc. is introducing Metrology Blocks, a browser based, software development tool built specifically for the metrology industry. It allows technicians with varying skill levels to program in Metrology.NET® by combining both a visual development experience and the traditional text based editor.
Spark Kalibrasyon, partnered with Middle East Technical University (METU) in Ankara, Turkey, and Cal Lab Solutions, Inc. worked together to create Metrology Blocks and allow integration with the Metrology.NET system. As a result, Metrology Blocks can assist the user in writing automated calibration procedures in any HTML5 environment, including on iOS and Android controlled tablets.
About Cal Lab Solutions, Inc.Cal Lab Solutions, Inc. is a metrology based software
engineering company located in the Denver Metro Area. Because software is an integral part of metrology, we pride ourselves on creating innovative, high quality software for the metrology world. Two years ago, we released Metrology.NET, the first system-of-systems technology built to cover all disciplines of metrology. Our methodology is an industry disrupter as it allows all of your software to work together.
Come visit Cal Lab Solutions, Inc. at booth 103 at the MSC Training Symposium, March 20-23rd, 2018, and see how you can improve your lab’s data collection and measurement uncertainties with this pioneering new technology.
EXLab Express Acquires Data Without Programming
IRVINE, CA, February 15, 2018 – AMETEK VTI Instruments announced today the introduction of EXLab Express, a powerful, easy-to-use, plug-and-play data acquisition software package.
EXLab Express is a version of VTI’s EXLab data acquisition software that allows users of the EX1401 Thermocouple/Voltage Measurement Instrument to acquire data without programming. It simplifies instrument configuration, acquisition and data display without sacrificing functionality or performance. Using EXLab Express, users will be up and running in minutes, not days or weeks.
EXLab Express features include:• Intuitive, icon-based setup and control • Spreadsheet-style channel configuration • Snapshot display with data export • Independent sampling rates for each instrument • Real-time online graphical data analysis EX1401
makes high-speed, high-accuracy measurements
EXLab Express is offered at no charge with the purchase of an EX1401 and can be downloaded from the VTI Instruments’ website (http://www.vtiinstruments.com/EXLab-Express-Software-Download-Form.aspx).
The EX1401 was designed to be used in any test environment that requires accurate temperature measurement and repeatability. The EX1401 features a 24-bit ADC on each channel and 1000 V channel-channel isolation. These features yield a temperature accuracy of ±0.20°C at sample rates up to 20k samples/sec on each channel. Other features include an LXI Ethernet interface, built-in self-test capabilities, parallel data storage, and standalone autonomous operation. Applications include automotive and battery testing, jet engine testing, highly accelerated life test/highly accelerated stress screening (HALT/HASS), and health monitoring.
To access images, data, and specifications and to create a quote online, visit http://www.vtiinstruments.com/Products-Services/EXLab.aspx or contact VTI Instruments directly at 949.955.1894 or [email protected].
About AMETEK Programmable Power AMETEK Programmable Power designs, manufactures and
markets precision, AC and DC programmable power supplies, electronic loads, application-specific power subsystems, precision data acquisition instrumentation and signal switching, and compliance test solutions for customers requiring and valuing differentiated power products and services. It offers one of the industry’s broadest portfolios of core ATE components under the VTI Instruments, California Instruments, Sorensen, and Elgar brands. AMETEK Programmable Power is a business unit of the AMETEK Electronic Instruments Group, a leader in advanced instruments for the process, aerospace, power and industrial markets and a division of AMETEK, Inc., a leading global manufacturer of electronic instruments and electromechanical devices with annual sales of $4.3 billion.
METU students presenting their work on a Blocks based editor for use in metrology at the 2017 International Conference on Computer Science and Engineering (UBMK).

40 Jan • Feb • Mar 2018Cal Lab: The International Journal of Metrology
AUTOMATION CORNER
The next three technologies that will change the world as we know it will be artificial intelligence (AI) running in the cloud, working with the Internet of Things (IoT). Yes, that is quite the mouthful of technology and the basis for many science fiction films. But the reality of the situation is, these technologies are here to stay. So the question is: How can metrologists take advantage of them?
First, I would like to point out many of you have used these three technologies and didn’t even know it. For example, you use Google Maps when you need to get from point A to point B. Just type the address into Google Maps and press Start Navigation. On the back-end, the AI algorithms are looking at all the possible routes and choosing the fastest one. The fastest route is being continually updated based on the data from all the people traveling that day. Your phone is telling Google’s Cloud database about the traffic at that time. Then that cloud database builds both real-time traffic information, as well as creating some traffic patterns. Your phone is an IoT device, updating the cloud, so the AI can give you driving directions.
Another implementation is voice recognition software and Google Translate. I have personally witnessed this technology improve over the years. Six years ago, when I first went to Turkey on a business trip, I tried to use Google translate—epic fail. My colleagues told me about another app called Turing Dictionary that would get the word right more often than not, but it could only do one or two words at a time. When their accreditation body sent me some documents in Turkish, I needed whole sentences translated, so I tried Google Translate again. I was amazed how
much it had improved, so this last trip I used it and the voice recognition to order a sandwich at Subway. It worked both ways as we had a two way conversation about how to make me sandwich.
So how did the programmers make so much improvement in the technology in such a short amount of time? Truth be told, they gave the AI more data. Its accuracy is based on having millions of documents where it learns grammar, rules, and sentence structure. Then the AI uses statistical analysis, rather than rule based algorithms. It gets smarter the more data you give it. Then it figures out how to translate a sentence it has never seen.
The next phase of the IoT is autonomous control of systems. This will have a great effect on metrology. Writing automation software for the past 30 years has taught me one thing: Computers don’t know good measurements for bad ones—and autonomous systems will be plagued with this problem. AIs will have to play a part in evaluating measurements; they will eventually learn how to best make a measurement.
Let’s take three measurement approaches. The first is simple, take 5 measurements and average them. The second one is to take 5 measurements, throwing away the high and low measurement and then average the other three. And finally my favorite, keep taking measurements until the system stabilizes, then use that measurement.
Each method has its advantages and disadvantages. The first two produce great results as long as the measurement time is sufficient, whereas my favorite method has a tendency to increase the total measurement time and can result in several minutes to take a
measurement on something like a high resistance test.
Now, if we were to switch from a rule based measurement methodology (i.e., pick one of the three and code it) to a statistical analysis method of measurement, much like Google Translate, the AI could then be optimized for measurement speed or measurement accuracy.
A n A I w i t h d a t a a b o u t measurements could learn how to best make a measurement achieving the uncertainties required. The measurement methods could be thought of as needing x number of samples over x amount of time when using x device to measure a value. The AI would be able to learn from its data and past measurements, and update the measurement requirements and instrument settings.
Over time, the AIs could also help us discover dogs and gems—what instruments are making better, more reliable measurements and what instruments can’t be trusted much. It could also help us discover new things like contributors to our measurement inaccuracies. Large populations of measurement data could be correlated with other data to discover new contributors to our measurement uncertainties: a butterfly flaps its wings in New Mexico and my measurements are off by 5.6 ppm.
As I try to position Cal Lab Solutions for the future, I think about the effects of these technologies on metrology. What can I do to insure our technologies are not obsolete the same day they are introduced to the market? What I learned from the book Technopoly, by Neil Postman, the best we can do is speculate on the future and technologies. My idea about AI’s effects is just a vision of an unknown future.
AI, the Cloud, & IoTMichael Schwartz
Cal Lab Solutions, Inc.

AUTOMATED RF POWER SENSOR CALIBRATIONPS-Cal™ by Cal Lab Solutions
Supporting Rohde & Schwarz Sensors
· TEGAM thermistor standards
·Measurereflectionandcalfactors
· Customizable calibration templates
· Read and adjust EPROM data ofmostmanufacturers
· Supports over 250 sensors
· Wide instrument support
· Historical data storage
·Editablereports,17025format
· Worldwide support
· Turnkey systems
www.tegam.com
AVAILABLE NOW

www.mintl.com • [email protected]
Accredited Calibration Services
• Traceability to NRC, NIST, NPL UK, and METAS
• Industry’s best uncertainties
• Fast turnaround
• Accredited since 2004 (Uninterrupted)
MI’s cal lab provides measurement uncertainties unmatched by any other commercial calibration lab.
Contact us at [email protected] with yourinquiry.