january designstorm: picking the right tool for the job
TRANSCRIPT

Design-storm | January
Picking the Right Tool for the Job
Amanda Makulec
John Snow Inc.
With thanks to Sarah Melendez, Alexis Strader, Kirstin Krudwig, and Jay Heavner
for their contributions and thinking around these ideas.

There’s no shortage of data visualization tools out there. We wrote a summary deck on some of our favorite resources, but new ones pop up every week and every new email blast seems to champion a new choice.
In an effort to think through how and why a few of our JSI thought leaders on design and visualization choose one tool over another, we sat down and discussed the design process, hitting the myriad of different kinds of visualizations you may want to create.
The result is a collection of questions to ask as you’re embarking on a new effort to visualize information more effectively and suggestions on which of our favorite tools may be more or less suited to a particular design challenge. By no means is this an exhaustive resource, but hopefully it will give you a great place to start from.
So many tools.So little time.

If you give a nerd a number…
Watch the video here (start at 16:33 for the feature): https://www.youtube.com/watch?v=JHKwY103Tbg
Even focusing on chart types alone, there’s a huge continuum of options for what you can design and sometimes it’s hard to know the right fit.

Picking your product type
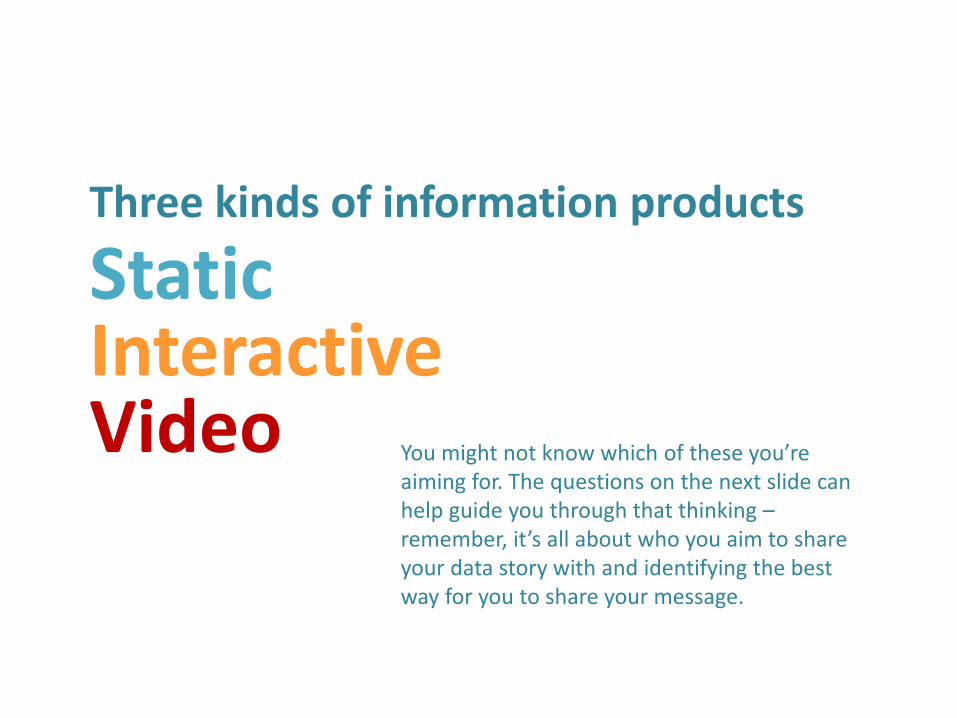
StaticInteractiveVideo You might not know which of these you’re
aiming for. The questions on the next slide can help guide you through that thinking –remember, it’s all about who you aim to share your data story with and identifying the best way for you to share your message.
Three kinds of information products

Questions to start with:• What’s the goal of the product (e.g.
learning, advocacy, sparking action)• Who is the client / audience?• How much time do they have to read /
explore the product you’re giving them?• How do they want to receive the
information?• Internet connectivity?• What is the dissemination plan?• How do you want to share (e.g. print,
embedded on a website, social media)?• What languages does this need to be in?• Is there an approval process you need to
be mindful of?

Question Food for thought
What’s the goal of theproduct?
Whether it’s to spark action, promote learning, or advertise some great piece of work we’ve done to build our JSI brand, consider this question first. It should guide you to whether you need short sound bites and stats or more detailed technical document.
Who is the client / audience?How much time do they have to read / explore the product you’re giving them?How do they want to receive information?
Your audience is the biggest driver for your product choice.
A wide “global health community” audience means you can’t presuppose they have technical knowledge of the subject matter, but a more tailored technical audience may better know the context of the work you’re doing.
Plus, remember that some very busy folks might not have time for more than a quick glance at an infographic, while others want to explore data through products like interactive visualizations. The more you understand what your audience/client wants, the better you can tailor your product choice to their needs.
Internet connectivity?Slow or no internet? A video might be frustrating to play on a low bandwidth connection, and interactive visuals won’t filter terribly quickly. Consider something you can view on the web and doesn’t require a download of a hefty file.
What is the dissemination plan?How do you want to share the final product?
Do you need to be able to print this and have it look stunning? You need a product that’s high resolution, so some of the free web-based tools won’t really give you what you need. Looking to post on the web?Consider the size: smaller images (mini infographics, for example) lend themselves better to posting and sharing. Do you have the backend ability to embed something on a website? That opens the doors to interactivity.
What languages does this need to be in?
Budget time and money for translation if you’ll need the final product in multiple languages, and consider finalizing the content in all necessary languages in a storyboard or word document before moving to a design – word and text length matter a lot as you’re laying out an infographic or other visual product.
Is there an approval process you need to be mindful of?
Many reviewers can mean a lengthy approval process with many small changes. Some programs are better for making those small incremental changes than others, particularly web-based video development programs. Consider the time it takes to input revisions and if you want multiple people to be able to access the product to revise, instead of having it linked to one person.
Is the data proprietary or from a public source?
Many openly available visualization and design programs have text in their user agreement that by putting data into their program, it will be come publicly available in their library. Read the data sharing agreement.

Picking a platform
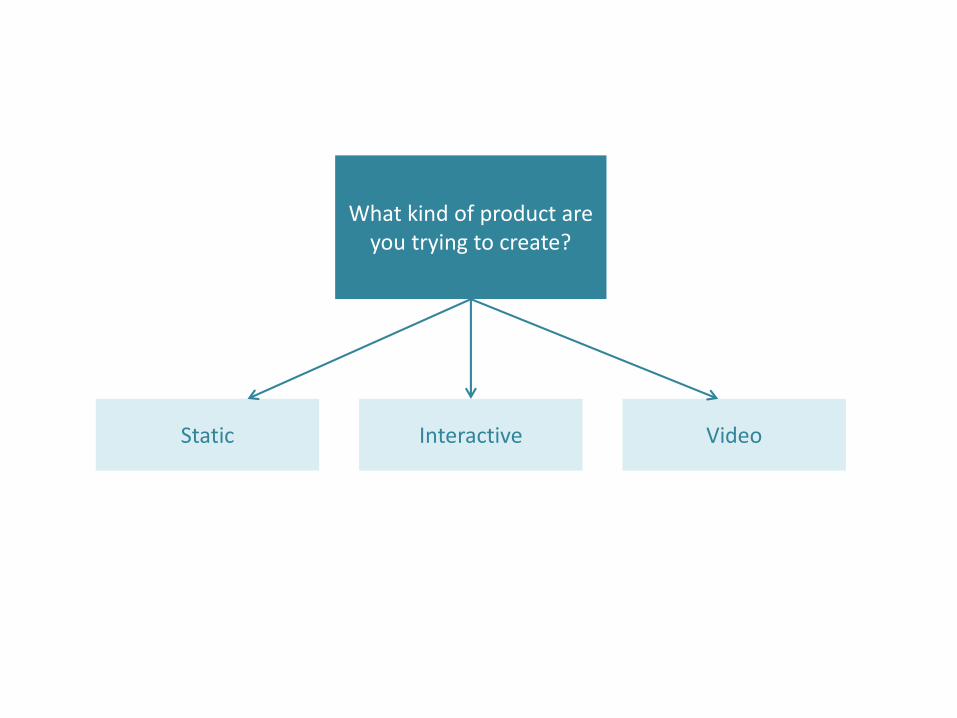
What kind of product are you trying to create?
Static Interactive Video

Web Print Both print & web
Where will it be published?
Static
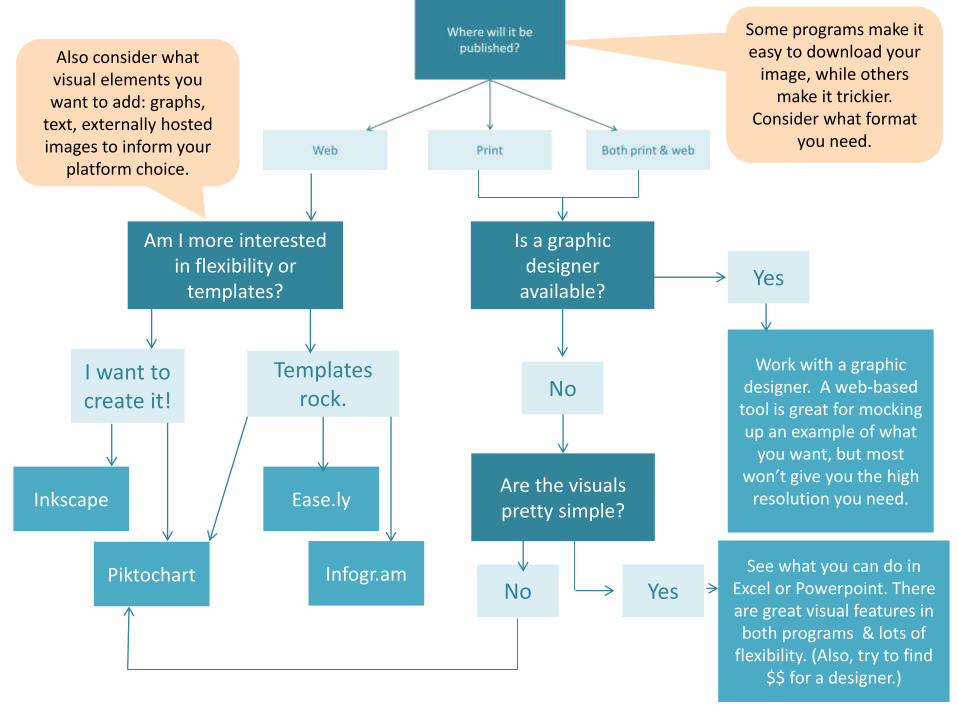
Is a graphic designer
available?Yes
NoWork with a graphic
designer. A web-based tool is great for mocking up an example of what
you want, but most won’t give you the high
resolution you need.Are the visuals pretty simple?
No YesSee what you can do in
Excel or Powerpoint. There are great visual features in both programs & lots of
flexibility. (Also, try to find $$ for a designer.)
Am I more interested in flexibility or
templates?
Templates rock.
I want to create it!
Also consider what visual elements you want to add: graphs,
text, externally hosted images to inform your
platform choice.
Piktochart Infogr.am
Ease.lyInkscape
Some programs make it easy to download your
image, while others make it trickier.
Consider what format you need.

Prescriptive: Tell an interactive,
moving story that the user clicks through
Data exploration: using a number of filter features and clickable options for the user to
customize their experience
Is your goal to be prescriptive or promote
data exploration?
Interactive

Prescriptive Data exploration
Is the interactive feature you want to make a map?
This is important, because it can drive
what you can do without hiring an external firm (which can always be
considered).
Not much.
Tableau Public
How much coding expertise do you have?Yes!
Work with that person to map out
your options. Drupal, HighCharts,
and other code-driven platforms
are really powerful.
Do you have a GIS team who should be working on this?
MapboxGoogle Maps
Talk to them first – they have great tools like ArcGIS and technical
expertise in this space.
Sure do!
Nope.
Lots!
No
Prezi

Short message “Happy holidays from JSI!”
Story about major achievement(s)End of project video
Moving Powerpoint/ Simple Animatione.g. DELIVER end of year
What kind of story is this video trying to share?
VideoVideos are great, but are usually the most costly of the three options.
Will making a video help meet your needs in
unique ways?
PowToon
GoAnimate
PreziUse a designer. This sounds important.
Vine

Which gives us…

A few friendly reminders when working with our awesome graphic designers…
Copy edit your content before sending it to a designer. They’ll usually use your text as-is.
Designers have different skill sets: find one who’s great at creating your product type.

Thank you!
Datavizhub.co [email protected]
To join JSI’s internal interest group on data visualization, email HelpDesk and ask to be added to dataviz.