january 2019 commentary
TRANSCRIPT
Quarterly Commentary
January 2019
DEAR JEROME, (Jerome Powell, Chairman of the U.S. Federal Reserve)
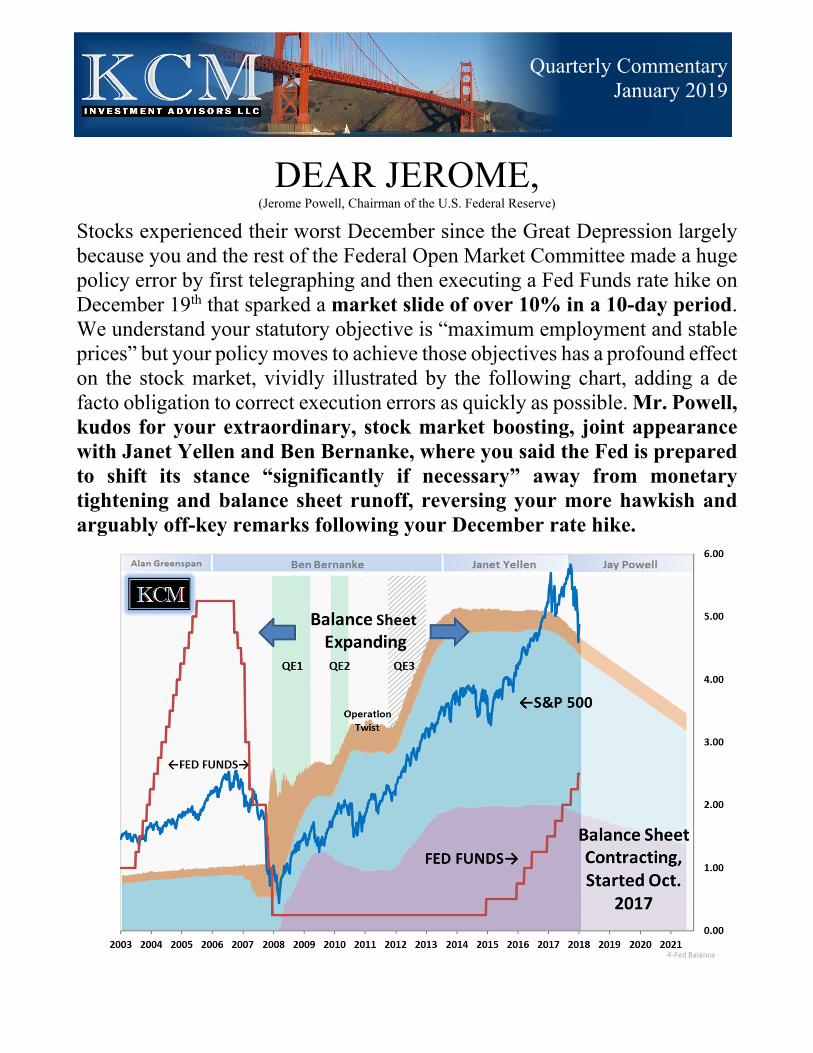
Stocks experienced their worst December since the Great Depression largely because you and the rest of the Federal Open Market Committee made a huge policy error by first telegraphing and then executing a Fed Funds rate hike on December 19th that sparked a market slide of over 10% in a 10-day period. We understand your statutory objective is “maximum employment and stable prices” but your policy moves to achieve those objectives has a profound effect on the stock market, vividly illustrated by the following chart, adding a de facto obligation to correct execution errors as quickly as possible. Mr. Powell, kudos for your extraordinary, stock market boosting, joint appearance with Janet Yellen and Ben Bernanke, where you said the Fed is prepared to shift its stance “significantly if necessary” away from monetary tightening and balance sheet runoff, reversing your more hawkish and arguably off-key remarks following your December rate hike.
KCM INVESTMENT ADVISORS LLC __________________________________________________________________________________
2
KCM chart/ Bloomberg data
KCM chart/ Bloomberg data
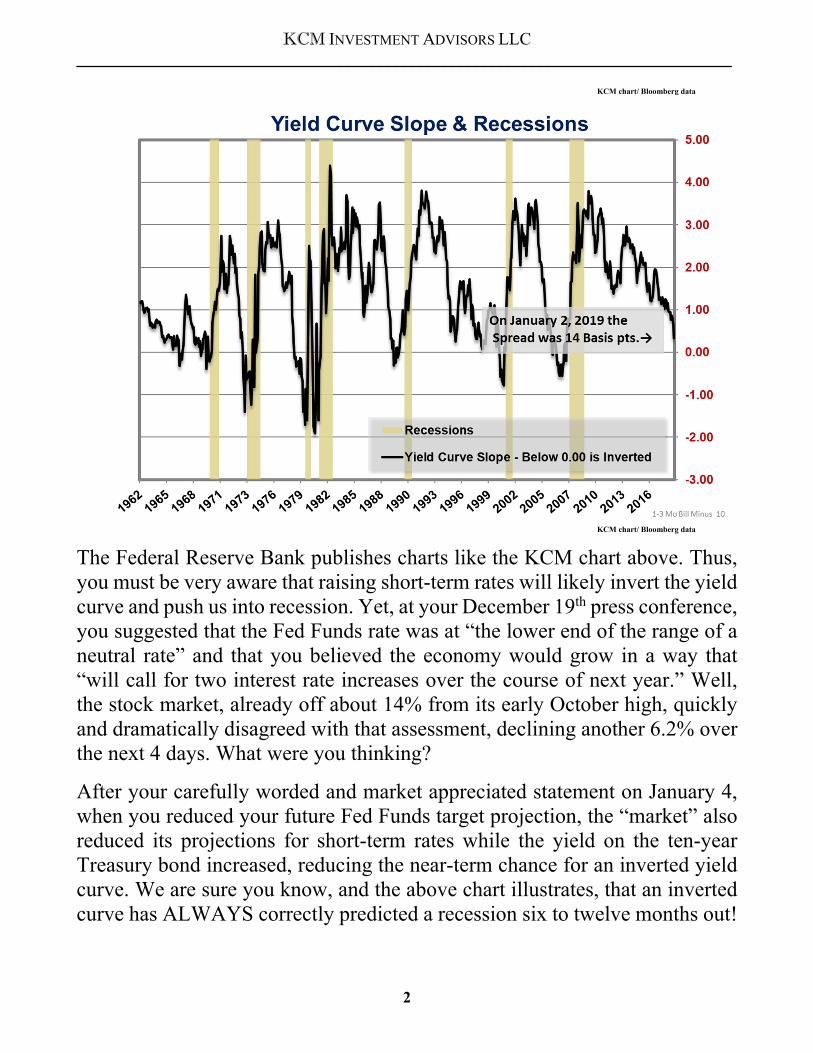
The Federal Reserve Bank publishes charts like the KCM chart above. Thus, you must be very aware that raising short-term rates will likely invert the yield curve and push us into recession. Yet, at your December 19th press conference, you suggested that the Fed Funds rate was at “the lower end of the range of a neutral rate” and that you believed the economy would grow in a way that “will call for two interest rate increases over the course of next year.” Well, the stock market, already off about 14% from its early October high, quickly and dramatically disagreed with that assessment, declining another 6.2% over the next 4 days. What were you thinking?
After your carefully worded and market appreciated statement on January 4, when you reduced your future Fed Funds target projection, the “market” also reduced its projections for short-term rates while the yield on the ten-year Treasury bond increased, reducing the near-term chance for an inverted yield curve. We are sure you know, and the above chart illustrates, that an inverted curve has ALWAYS correctly predicted a recession six to twelve months out!
KCM INVESTMENT ADVISORS LLC __________________________________________________________________________________
3
KCM chart/ Bloomberg data
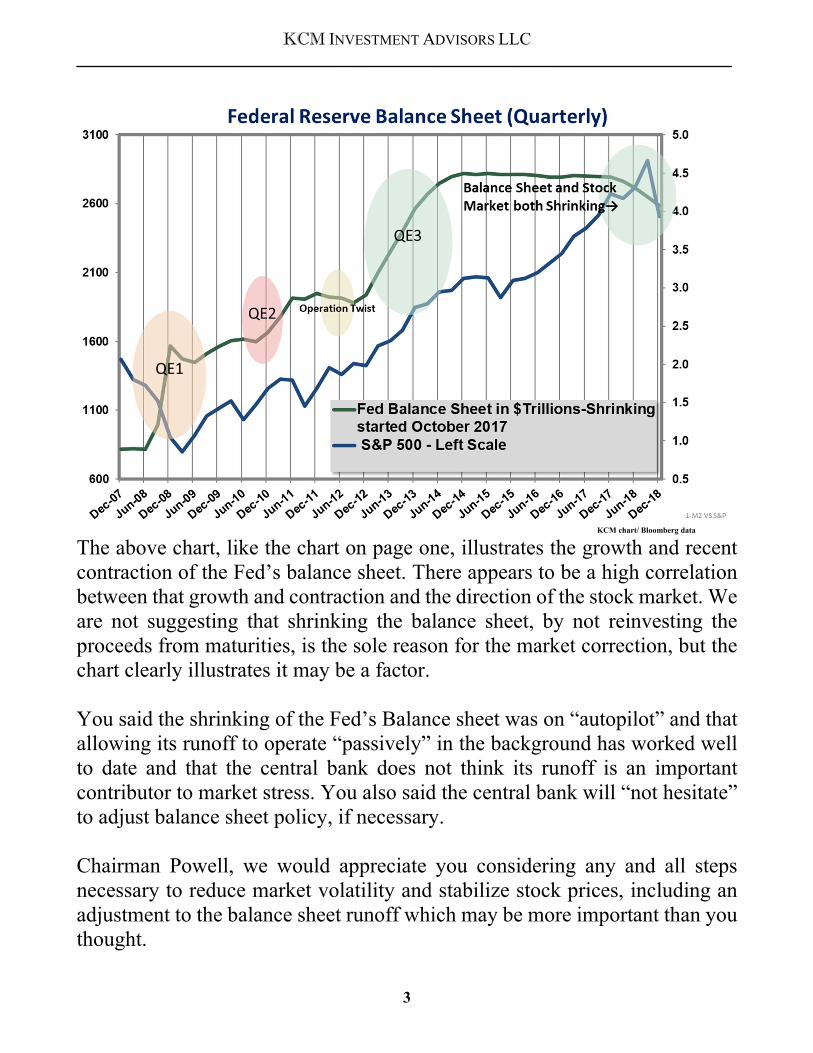
The above chart, like the chart on page one, illustrates the growth and recent contraction of the Fed’s balance sheet. There appears to be a high correlation between that growth and contraction and the direction of the stock market. We are not suggesting that shrinking the balance sheet, by not reinvesting the proceeds from maturities, is the sole reason for the market correction, but the chart clearly illustrates it may be a factor. You said the shrinking of the Fed’s Balance sheet was on “autopilot” and that allowing its runoff to operate “passively” in the background has worked well to date and that the central bank does not think its runoff is an important contributor to market stress. You also said the central bank will “not hesitate” to adjust balance sheet policy, if necessary. Chairman Powell, we would appreciate you considering any and all steps necessary to reduce market volatility and stabilize stock prices, including an adjustment to the balance sheet runoff which may be more important than you thought.

KCM INVESTMENT ADVISORS LLC __________________________________________________________________________________
4
KCM chart/ Bloomberg data
As the unemployment rate drops, there is upward pressure on wages as workers demand pay increases which, historically,have accounted for ~70% of inflation. So far, this cycle is different, inflationary pressures are muted. (See charts)
KCM charts/ Bloomberg data

KCM INVESTMENT ADVISORS LLC __________________________________________________________________________________
5
KCM charts/ Bloomberg data
On December 15th, it was clear that economic growth worldwide was slowing (upper chart) and U.S. market valuations were not stretched (lower chart). A 17.1x PE ratio is below the long-term median, still you chose to raise the Fed Funds rate.
Chairman Powell, as the markets soured, President Trump repeatedly lashed out at you over your plans to increase interest rates. Despite economic data to the contrary, you stuck to your plan and raised interest rates, which sparked a 10% market decline. We hope decisions were not made with vindictiveness toward the President. Recently, you changed directions, for which we thank you.
Sincerely, Jay Kellett
Peak 2000 Peak 2007 Bottom 2009 CY 2015 CY 2016 CY 2017 CY 2018 Current
12 Months Ending 3/31/2000 9/28/2007 3/31/2009 12/31/2015 12/31/2016 12/31/2017 12/15/2018 1/5/2019
Price/Earnings 28.91 17.10 14.38 18.78 20.54 21.74 17.12 17.29
Price/Cash Flow 17.08 20.06 5.18 10.67 12.31 14.66 11.27 11.39
Price/Sales 2.25 1.64 0.82 1.85 1.98 2.21 1.91 1.93
Price/EBITDA 10.74 6.92 5.15 10.47 10.58 11.52 10.06 10.15
Dividend Yield 1.10 1.82 3.59 2.15 2.09 1.89 2.15 2.27
Fed Funds 6.00 5.25 0.25 0.50 0.75 1.50 2.50 2.50
3 Month T-Bill Yield 5.87 3.80 0.20 0.16 0.50 1.38 2.35 2.41
Ten Year Treasury Bond Yield 6.00 4.59 2.66 2.27 2.44 2.41 2.68 2.67
Leverage Ratio-Lehman 35.50 32.00
Leverage Ratio-Goldman 24.80 28.40 19.00 11.46 11.47 12.69 12.53 12.16
Various Company & Market Valuations

KCM INVESTMENT ADVISORS LLC __________________________________________________________________________________
6
KCM charts/ Bloomberg data
The Fed’s and the market’s prediction for future interest rate levels changed to the downside on January 4th. The FOMC now predicts Fed Funds will peak at ~3.0% in two years while the futures market predicts they will decline to ~2 1/8%. The above graph illustrates today’s Treasury bond yields and KCM’s prediction in two years with Fed Funds at 3.0%. The yellow line and right-hand scale predict the total return over the next two years. Clearly, if we are going to invest in the U.S. Treasury market, we recommend owning short-term bonds.

KCM INVESTMENT ADVISORS LLC __________________________________________________________________________________
7
The lower chart on the previous page illustrates our projected returns for corporate bonds. The yellow dots project an increasingly positive return out to ten years or so. We now recommend a “ladder” of maturities out to about five years, minimizing duration risk in this period of economic uncertainty while potentially capturing similar total return as investing in slightly higher yields with considerably greater duration risk.
KCM chart/ Bloomberg data
Treasury bonds and most corporate bonds are not “callable,” while municipal bonds with maturities greater than ten years are callable. This changes how we invest in the municipal bond market. The above chart illustrates that the “sweet spot” for investing in municipal bonds starts at about twenty years to maturity, very different than investing in Treasury or corporate bonds. The difference is that the twenty-year maturity bond is callable in ten years or less. To assure the bond is called, we only buy municipal bonds with a high coupon, 5% or higher. A municipal bond with a twenty-year maturity, a 5% coupon and 10 years to its call date gives an investor a yield-to-call of ~2.95% with a better risk/reward (illustrated by the yellow dots) than investing in shorter bonds with maturities out to ten years or so. This has been and remains our single best idea for fixed income investors who seek tax exempt income.

KCM INVESTMENT ADVISORS LLC __________________________________________________________________________________
8
Preferred Stocks: Ten years after the credit collapse of 2008, the globe remains yield starved. Preferred stocks are offering some of the highest yields with what we consider excellent risk/reward characteristics. We believe their unique credit quality, security structure, coupon type and volatility profiles can help serve as an attractive diversifier in a multi-asset portfolio.
The FOMC made a costly error on December 19th, which, judging by the market’s reaction on January 4th, Chairman Powell may have corrected when he promised a data-driven pause toward monetary tightening and balance sheet runoff, making a near term recession unlikely. KCM believes this pause, the market selloff, reasonable equity valuations and stable inflation have created an attractive stock market environment for 2019. We continue to focus on high-quality companies that are market leaders, pay an attractive dividend and have a policy to raise their dividend: KCM’s Dividend BlueBloods.
An important wild card for continued economic growth is trade and trade tensions which are impacting global growth and global markets. We need positive developments on that front to sustain market and economic growth. Hopefully, we will see progress soon.
A 50-basis point lower “peak Fed Funds” rate outlook in two years has slightly changed our fixed income investment strategy. KCM is now comfortable laddering corporate bonds out to five years while remaining cautious toward extending Treasury maturities. We are maintaining our successful municipal bond investment strategy of buying high coupon securities with about ten years to their call date and a final maturity of about twenty years. We thank you for your continued support. Jay Kellett, Founder & CEO, and your KCM Team This material has been prepared by KCM Investment Advisors LLC based on publicly available information, internally developed data and other third-party sources believed to be reliable. KCM Investment Advisors LLC has not sought to independently verify information taken from public and third-party sources and does not make any representation as to the accuracy, completeness or reliability of the information contained herein. This material is presented solely for informational purposes and nothing herein constitutes investment, legal, accounting or tax advice, or a recommendation or solicitation to buy, sell or hold a security. No recommendation or advice is being given as to whether any investment or strategy is suitable for an investor. It should not be assumed that any investment in securities, companies, sectors or markets identified and described were or will be profitable. Actual investments or investment decisions made by KCM, whether for its own account or on behalf of clients, will not necessarily reflect the views expressed in this document. Since economic and market conditions change frequently, there can be no assurance that the trends described here will continue or that any forecasts are accurate.