management commentary / welltec · accounting year: january 1, 2013 ... is one of maximizing...
TRANSCRIPT
1 MANAGEMENT COMMENTARY / WELLTEC® ANNUAL REPORT 2013
ANNUAL REPORT
Our
late
st t
ool a
dditi
on, t
he a
war
d-w
inni
ng W
ell C
utter®
Gam
e-ch
angi
ng s
olut
ions
for o
ur c
lient
s in
trans
form
ing th
e industry
Safe
r and
mor
e su
stain
able
with higher
recovery
2013Welltec International ApS
Central Business Registration No: 30 69 50 03

2 / MANAGEMENT COMMENTARYWELLTEC® ANNUAL REPORT 2013
Company Welltec International ApS
Gydevang 25
3450 Allerød
Denmark
Phone: +45 48 14 35 14
Fax: +45 48 14 35 18
Website: www.welltec.com
E-mail: [email protected]
Central Business Registration No: 30 69 50 03
Registered in: Allerød
Accounting year: January 1, 2013 – December 31, 2013
Executive Board Jørgen Hallundbæk, Chief Executive Officer
Board of Directors Søren Jørgensen, Chairman
Jørgen Hallundbæk
Johannes K. J. Sikkens
Scott C. Collins
Company auditors Deloitte Statsautoriseret Revisionspartnerselskab
COMPANY DETAILS
our VALUES
DISRUPTIVE INNOVATIONISRU – We move with courage thto challenge conventional thinkinggto c
CLIENT DEDICATIONN – We do what it takes to completelyomaddress our clients’ challengeso
LEADERSHIP – We pride ourselves on taking actions that keep hrus in the forefronth
PROFESSIONALISM – We deliver what we promiseee
PERFORMANCE – We drive results through the dskills and committment of our people

3 MANAGEMENT COMMENTARY / WELLTEC® ANNUAL REPORT 2013
CONTENTS
Company Details 2
Company Profile 4
CEO Letter 5
Consolidated Key Figures 6
Management Commentary 7
Financial Review 7
Outlook 12
Strategy 15
Competitive Strengths 17
Risks 19
Corporate Governance 21
Corporate Social Responsibility 22
Statement by Management on the Annual Report 28
Independent Auditor’s Reports 29
Financial Statements 30
Consolidated Group 30
Parent Company 71
Group Chart 85

4 / MANAGEMENT COMMENTARYWELLTEC® ANNUAL REPORT 2013
COMPANY PROFILE
Welltec® is a leading provider of robotic intervention services
and completion solutions to the oil and gas industry. Our pi-
oneering technology enables operators to optimize the man-
agement and development of their assets throughout their
life-cycle. We address the factors that maximize value creation,
continuously innovating to reduce well construction time,
speed up access to the hydrocarbons and reduce the capital ex-
penditure compared to more conventional methods. The effect
is one of maximizing hydrocarbon production and increasing
total recovery while minimizing operating downtime.
Our lightweight technology also reduces the risk to personnel
and increases many safety aspects of the industry by enabling
smaller work crews and minimizing heavy lifting. Furthermore,
our technology allows operators to avoid the use of rigs, sig-
nificantly reducing the industry’s carbon footprint. Our ability
to operate in extended reach and horizontal wells allows op-
erators to drill multiple wells from the same topside location,
thereby further reducing the environmental footprint.
This is Welltec’s philosophy; to challenge existing conventions
and think laterally in order to develop products and services
which increase oil and gas recovery while improving the sus-
tainable, economic, environmental, and safety aspects of our
industry. In practice we develop, test and manufacture state-
of-the-art technology to enhance the production and recov-
ery rates for our clients, thereby improving their profitability
through a longer term revenue stream, while at the same time
improving upon health, safety and environmental attributes.
Our game-changing solutions allow our customers, some of
the world’s largest national and independent oil companies,
to optimize production through ground-breaking flexible well
completion solutions (WCS) and innovative well intervention
services (WIS). Our disruptive innovation challenges the con-
ventions, maximizing production, increasing oil recovery and
improving well-integrity and safety, with faster and less intru-
sive solutions in environments that are becoming increasingly
complex, remote and hostile.
In an industry characterized by maturing fields and increasing
depletion, the premium attached to technology which aids in
reversing these trends is continuing to gain momentum. Our
value proposition is compelling; our technology enables clients
to unlock more production from their assets and to address res-
ervoir complexities and uncertainties with a greater number of
options, which are cleaner, safer and more sustainable.
WE EMPLOY OVER 1,000 PEOPLE WORLD WIDE
– WITH 47 BASES IN 31 COUNTRIES
,

5 MANAGEMENT COMMENTARY / WELLTEC® ANNUAL REPORT 2013
CEO LETTER
During the past year we decided to change our organizational
structure and implemented a more decentralized set-up that
balances global coordinated management with fast, local de-
cision-making to provide flexibility and strengthen our regional
capabilities.
While this transformation seems logical, the transition has not
been without challenges and a continued effort is needed in
2014. Regional differences, steep learning curves and organi-
zational alignment challenges have all prolonged the adapta-
tion process, and we did not deliver on our high expectations.
However, I remain confident that our efforts in 2014 will pave
the way for continued growth.
We have remained true to our vision of transforming the oil in-
dustry into one that is safer and more sustainable while achiev-
ing a higher recovery.
Our safety records were already well above industry standards
yet in 2013 we have taken this even higher with unprecedent-
ed safety improvements. Being a truly safe company to work
with is not only part of our vision; it is a critical element in posi-
tioning for winning major contracts worldwide.
The industry focus is shifting towards higher recovery and more
sustainable ways of extracting hydrocarbons, but we still have a
major task in driving the adoption of our enabling technology.
All three elements of our vision: safer, sustainable, higher re-
covery, are leading to lower lifting costs and therefore provide
significant value creation and improved margins for our clients.
The conventional wisdom is still, however, that these elements
increase costs, which may be true with the old technologies,
but the application of our technology achieves the best of both
worlds.
Operationally, we have managed to improve on our unparal-
leled levels of service quality. Our technology works, our opera-
tional processes work and our execution works. This provides a
reliable solution in the face of uncertain well conditions. Push-
ing the boundaries isn’t easy and when we look behind the
stats it becomes clear that we don’t improve because we ‘play-
it-safe’; we improve because we constructively learn from our
experiences.
We have a solid base on which to progress. Our clients have
firmly embraced our latest award-winning innovation, the Well
Cutter®, which eliminates the need to use explosives and the
risks and costs involved. Our largest clients’ satisfaction with
their early adoption of our Flex-Well® Completion Concept
proves that Welltec® has an expanding role to play in that mar-
ket too.
We have established the strategic framework to take Welltec®
to the next level in its corporate development. Our vision is
prevailing and our mission is to continue to drive the industry
adoption. The key is how successfully we can implement real
shifts in behaviors both from an internal and an external per-
spective. I believe that a united, refocused organization with a
stronger regional presence, continued technological leadership
and unparalleled service quality, will provide the foundation for
further success in the years to come
Jørgen Hallundbæk, CEO
nued technological leadership
will provide the foundatttiooioioooioiooioioooiooiooooooiooioioooiooiooooioiooioiooooooooooiooooooooooooooiooooooooioooooooooioooooioooooooiooooooooooon nnnnnnnnnnnnnnnnnnnn for
ome
Jørgen Hallundbæk, CEO

6 / MANAGEMENT COMMENTARYWELLTEC® ANNUAL REPORT 2013
CONSOLIDATED KEY FIGURES Welltec International ApS – group
2013Restated
2012 2011 2010 2009
STATEMENT OF COMPREHENSIVE INCOME (USD in millions)
Revenue 321 295 229 164 135
Earnings before interest, tax depreciation and amortization (EBITDA)* 135 140 111 87 78
Operating profit (EBIT) before special items 72 86 57 48 39
Operating profit (EBIT) 68 86 57 46 37
Net financials (26) (38) (24) (16) (22)
Profit before tax 42 48 33 30 16
Net profit for the year 21 24 17 18 8
CASH FLOWS (USD in millions)
Cash flows from operating activities 100 95 84 74 74
Cash flows from investment activities (86) (79) (61) (46) (36)
Cash flows from financing activities (18) 12 (26) (29) (32)
Total cash flows (4) 29 (3) (1) 5
BALANCE (USD in millions)
Trade receivables 83 85 50 36 39
Equity 279 246 315 300 293
Total assets 712 692 596 577 602
Investments in intangible assets** 34 31 28 26 21
Investments in tangible assets** 55 51 36 22 17
Investments in financial assets 0 0 0 0 0
KEY RATIOS (%)
EBITDA-margin 42.1 47.3 48.5 52.7 57.8
EBIT-margin before special items 22.5 29.2 24.9 29.1 28.9
ROIC excl. goodwill 29.2 36.7 33.7 25.9 22.0
Return on equity 7.9 8.6 5.5 6.1 2.8
Number of employees, average 1,055 916 730 590 527
*EBITDA is defined as profits/loss before income taxes, financial expenses, financial income, special items and total depreciation and amortization. Depreciation for these purposes includes
depreciation attributable to development and manufacturing which is capitalized because it is considered a part of the costs that are directly attributable to the manufacturing of our products.
Furthermore, EBITDA has been adjusted for issued warrants (non-cash).
**Investments in intangible and tangible assets are defined as addition of fixed assets including additions from financial leasing and additions through business combinations.
The key figures are prepared in accordance with the Danish Society of Financial Analysts’ “Recommendations & Financial Ratios 2010”.
Change in presentation and functional currency
In the third quarter, Management decided to change the reporting currency of its consolidated financial statements to USD in order, to best represent the core business performance and its un-
derlying exposures. This is both from an operational and a capital structure perspective. In addition this accommodates requests from investors and serves to make the consolidated financial state-
ments more comparable within Welltec’s peer group. At the same, Management reconsidered the group’s functional currency and assessed the USD to be the functional currency for the Danish
operation and operations in some other countries. Management identified the issuance of USD bonds in the beginning of 2012 as the main event triggering the change in functional currency from
DKK to USD, and consequently the change in functional currency is deemed to have taken place at that date.
7 MANAGEMENT COMMENTARY / WELLTEC® ANNUAL REPORT 2013
alternatives. In Europe and Russia CIS, geographic expansion in
the Caspian region has counterbalanced lower activity in the
North Sea and on land Russia earlier in the year. In the Middle
East we have expanded operations in Qatar, Oman and Yemen,
where we set a new record for the 218 Well Tractor® with the
longest distance covered in one descent. The tool string, con-
veying a Production Logging Tool (PLT), was tractored for an im-
pressive 14 kilometers in difficult borehole conditions to depths
and inclinations that conventional methods cannot achieve.
In the Americas, revenues of USD 112 million represented
growth of 5%. In the US new client activity on land and in-
creased subsea activity in the Gulf of Mexico has primarily con-
tributed to the growth. This included two world firsts using
Riserless Light Well Interventions (RLWI). The first to retrieve
Crown Plugs and the second for the clean out of asphaltene.
Welltec’s RLWI capabilities open up the possibility of intervening
Revenue
Revenues increased 9% year on year to USD 321 million. The
growth has been primarily activity driven and a combination of
delivering a wider scope of services to existing clients, acquiring
new clients and commercializing new products and services.
Revenues in Europe, Middle East, Africa & Russia/CIS (EMEAR)
amounted to USD 170 million, an increase of 11% year on
year. The growth has been diverse. In Scandinavia, continued
advances with our largest client, Statoil, have allowed for an
increasing share of their operations and improvements in both
volume and service mix under the first year of our new con-
tract. In Africa, we have successfully demonstrated the strength
of our value proposition with high-complexity intervention
work for major operators in the sub-Sahara region. This in-
cluded a milling operation to retrieve a stuck safety valve that
enabled the operator to avoid having to pull the entire comple-
tion string and saved more than USD 2 million compared to the
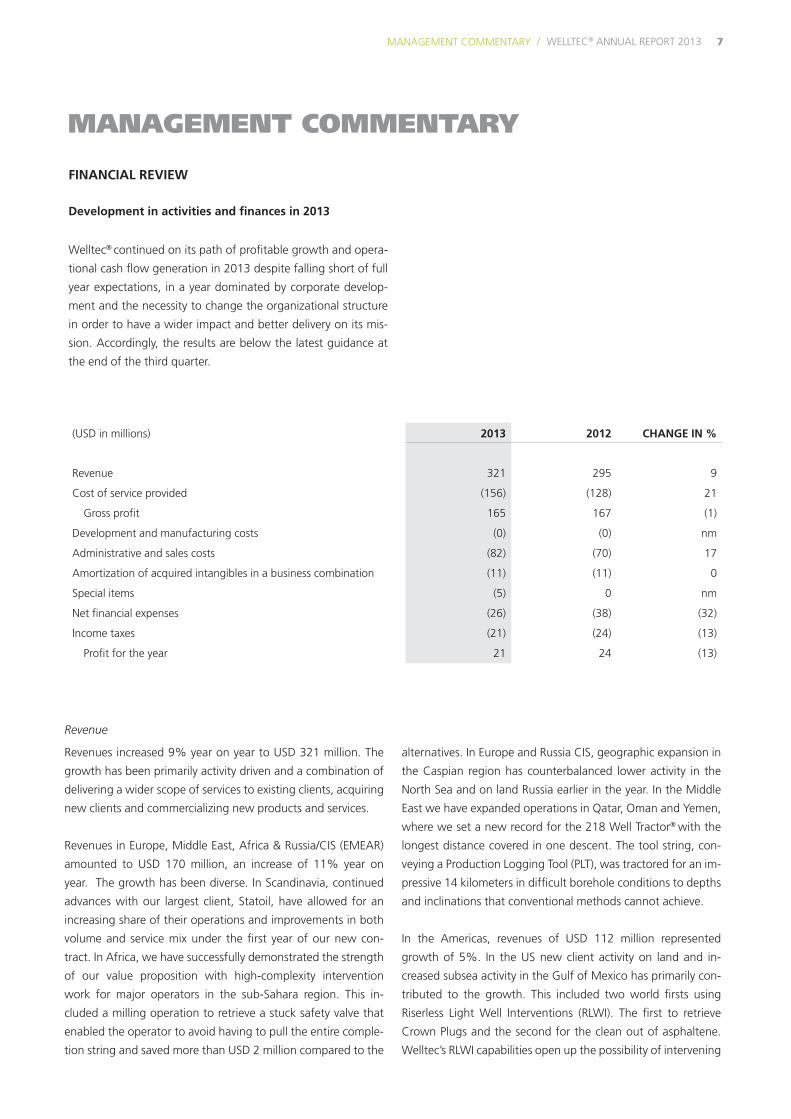
(USD in millions) 2013 2012 CHANGE IN %
Revenue 321 295 9
Cost of service provided (156) (128) 21
Gross profit 165 167 (1)
Development and manufacturing costs (0) (0) nm
Administrative and sales costs (82) (70) 17
Amortization of acquired intangibles in a business combination (11) (11) 0
Special items (5) 0 nm
Net financial expenses (26) (38) (32)
Income taxes (21) (24) (13)
Profit for the year 21 24 (13)
MANAGEMENT COMMENTARY
FINANCIAL REVIEW
Development in activities and finances in 2013
Welltec® continued on its path of profitable growth and opera-
tional cash flow generation in 2013 despite falling short of full
year expectations, in a year dominated by corporate develop-
ment and the necessity to change the organizational structure
in order to have a wider impact and better delivery on its mis-
sion. Accordingly, the results are below the latest guidance at
the end of the third quarter.

8 / MANAGEMENT COMMENTARYWELLTEC® ANNUAL REPORT 2013
in subsea wells and actively managing fields that are not eco-
nomically viable with conventional methods. Successes on the
East Coast of Canada have increased our share of operations
with major operators and offset the adverse effects of some
extreme weather conditions in the third quarter. Across Latin
America, Welltec® has grown in all of the markets it operates
in, leveraging on an expanded tool fleet to widen the scope of
services with the region’s national oil companies, particularly in
Mexico and Brazil.
In Asia Pacific, revenues grew 10% to USD 40 million. A high-
light for the region was the completion of seven years with no
lost time incidents (LTI’s), demonstrating utmost dedication to
safety. Financially, India was the main driver following land-
mark direct contract awards with major operators and delivery
of high value mechanical services, such as opening sliding side
doors (SSDs) on wireline, using the Well Stroker® in place of coil
tubing due to its superior depth control, power and precision.
Cost of service provided
The cost of service provision was USD 156 million, an increase
of 21% compared to last year. This was higher relative to the
revenue growth and explained in terms of both the growth and
change in activity mix, geographically and in the type of ser-
vices performed.
The increase in cost of service provision was primarily attribut-
able to increased field staff costs of USD 11 million, with aver-
age operational headcount increasing 20% to support higher
levels of activity. The number of jobs performed increased by
19% over the same period, partly reflecting an increased in-
vestment in operational capacity at the start of the year to sup-
port growth, and partly on account of qualitative changes in
the sales mix.
The service mix is diverse and dynamic, reflecting an ever-
changing-mix of operations across the globe, onshore and off-
shore, in established and emerging markets, and for new and
existing clients. Other direct operational costs have increased
27%, with proportionally higher levels of leasing, freight and
direct material costs, largely reflecting the growth from new
clients and emerging countries that require greater operational
investments. A characteristic of our growth cycle and indeed
strategy is the broadening of the client base within our core
tractor conveyance offerings and leveraging to provide a more
value-adding scope of services. The reduction in gross margin
can partly be explained by this development, with an increased
share of conveyance activity in the full year.
Administrative and sales costs
Administrative and sales costs were USD 82 million, an increase
of 17% compared to last year. The increase was a combination
of the increased scale of operations, through higher premises,
IT and administrative costs, a 16% growth in average head-
count and increased consultancy fees relating to HR strategy
and executive level projects.
Earnings before interest, tax, depreciation, amortization and
special items (EBITDA)
EBITDA reduced by 3% to USD 135 million, representing an
EBITDA margin of 42% against 47% in 2012. This develop-
ment was the combination the change in service mix, with in-
creased conveyance activity, and reduced gross margins with
the expansion of activity.
Operating profit before special items (EBIT)
EBIT decreased by 16% to USD 72 million. The EBIT margin was
23% against 29% in 2012, reflecting the reduction in earnings
and the relative development in depreciations and amortizations.

9 MANAGEMENT COMMENTARY / WELLTEC® ANNUAL REPORT 2013
Special items
Special items of USD 5 million relate the adjustment to head-
count in the second quarter as part of the decentralization
initiative and non-recurring consultancy fees.
Net financial expenses
Net financial expenses were USD 26 million, a decrease of 32%
compared to last year. Interest expenses were 2% higher, re-
flecting the first, full year following the bond offering. This was
countered by gains on the fair value adjustment of derivative
financial instruments and a net reduction in unrealized currency
losses.
Income taxes
Income taxes were USD 21 million, a decrease of 13% year
on year, reflecting the reduced level of operating profit, partly
offset by an increase in the effective tax rate. This increase was
due to the revision of tax provisions on issues addressed during
the year and the adverse effects arising from the non-deduct-
ibility of the higher interest expense and non-deductibility of
withholding taxes.
Profit for the year
Profit was USD 21 million, a decrease of 13% on 2012. This
development was due to the reduction in EBIT and increase in
special items, partly offset by the reduction in net financial ex-
penses and income taxes.
Free cash flows
Welltec® continued to generate strong cash flows from opera-
tions and improved the level of days’ sales outstanding (DSO)
across the year through improved processes and strict working
capital discipline. The cash generated was used to service inter-
est payments, repurchase shares and reinvested in D&E proj-
ects, patents and additional tractors and tools as part of the
cycle of continued growth delivery. Additionally, capital expen-
ditures increased in support of the well completions business,
including the acquisition of Alslev Rustfri Montage and lease-
hold improvements on the new production facility in Esbjerg.
CAPEX % of Revenue
3748
64
8289
28% 29% 28% 28% 28%
2009 2010 2011 2012 2013
CF from operations % of Revenue
74 7484
95 100
55%45%
37% 32% 31%
2009 2010 2011 2012 2013
REVENUE (USD in millions) EBITDA (USD in millions)
CAPEX (USD in millions)CASH FLOW FROM OPERATIONS (USD in millions)
Revenue YOY Growth
135164
229295 321
4%
21%40%
29%
9%
2009 2010 2011 2012 2013
EBITDA Margin
78 87111
140 135
58%53%
49% 47%42%
2009 2010 2011 2012 2013
Branches
Welltec International ApS group has several branches with sales activities in foreign countries. Please see group chart on page 85.

10 / MANAGEMENT COMMENTARYWELLTEC® ANNUAL REPORT 2013
Significant events in 2013
Adjustment to headcount
As part of the initiative to decentralize while ensuring the
right mix of competencies and capabilities, Welltec® reduced
the number of employees at its Danish headquarters by 27 in
April 2013. This mainly related to indirect capacity costs and re-
aligned the business on the underlying growth trajectory.
Capital increase
During the third quarter, Welltec® completed a private place-
ment with PFA, Denmark’s largest pension fund. Gross pro-
ceeds amounted to USD 46 million, securing PFA a minority
interest, and have been designated to strengthen Welltec’s
capital structure and further develop the business.
BID PRICE (USD)
96
98
100
102
104
106
108
110
Jan-13 Feb-13 Mar-13 Apr-13 May-13 Jun-13 Jul-13 Aug-13 Sep-13 Oct-13 Nov-13 Dec-13
BID YIELD (%)
5.0
5.5
6.0
6.5
7.0
7.5
8.0
8.5
Jan-13 Feb-13 Mar-13 Apr-13 May-13 Jun-13 Jul-13 Aug-13 Sep-13 Oct-13 Nov-13 Dec-13
Bond performance
The Senior Secured Notes have continued to trade above par,
with meaningful demand in the secondary trading. The im-
plied funding cost has been reduced from 8.5% upon issuance
to 6.4% at year end.
,

11 MANAGEMENT COMMENTARY / WELLTEC® ANNUAL REPORT 2013
Development in activities and finances in Q4
The fourth quarter demonstrated sequential growth but was
slightly lower than last year due to the activity mix and adverse
currency developments.
A plateau in the growth rate was recognized earlier in the year
and dedicated efforts to address the underlying challenges
have continued, including several strategic initiatives that have
been set in motion to transition the organization to the next
phase of corporate development and accelerate growth.
Revenues increased sequentially to USD 84 million; represent-
ing a 2% reduction on the fourth quarter last year which was
boosted by the client-sponsored development of our Coil Tub-
ing Well Tractor® and a relatively large sale of our well comple-
tion products.
Adjusting for currency developments, however, underlying
revenues showed continued growth with further operational
successes with our Well Cutter®, RCB Well Cleaner® and Well
Stroker®.
Another operational highlight was the delivery of additional
Well Annular Barriers, WAB® to both existing and new clients,
with multiple qualifications made for more sales and product
releases in 2014. This followed the announcement of an agree-
ment to lease a new dedicated and purpose-built production
facility in Esbjerg, and represents the next step in our expansion
in the Well Completions market. This also contributed to the
increase in CAPEX in the period.
CAPEX % of Revenue
23 26 21 1626
26%35%
25%21%
30%
2012 Q4 2013 Q1 2013 Q2 2013 Q3 2013 Q4
CAPEX (USD in millions)
CF from operations % of Revenue
3329
17 1936
39% 38%
20%25%
42%
2012 Q4 2013 Q1 2013 Q2 2013 Q3 2013 Q4
CASH FLOW FROM OPERATIONS (USD in millions)
Revenue YOY Growth
86 75 84 78 84
39% 16% 23%
2% (2%)
2012 Q4 2013 Q1 2013 Q2 2013 Q3 2013 Q4
REVENUE (USD in millions) EBITDA (USD in millions)
EBITDA Margin
3927
3933 36
46%
36%
47% 42% 43%
2012 Q4 2013 Q1 2013 Q2 2013 Q3 2013 Q4
Quarterly numbers in above graphs are unaudited.

12 / MANAGEMENT COMMENTARYWELLTEC® ANNUAL REPORT 2013
OUTLOOK
While macro-economic factors continue to impact the opera-
tions of our clients, the total potential market that Welltec® can
address far exceeds any boundaries imposed by the capacity of
our organization or short term trends in the industry.
Strong market fundamentals underlie the increasing demand
for our services. With the shale gas revolution and increasing
depletion of maturing oilfields, operating environments are be-
coming increasingly unconventional, remote and hostile. The
strategic focus of the oil and gas industry is shifting towards
the development and optimization of assets with a step change
in complexity and development risk. This is Welltec’s sphere of
expertise.
Our technology offers advantages in all types of wells. As the
absolute leader within robotic well intervention technology,
Welltec® remains in a prime position to benefit from these mar-
ket drivers. However, the industry adoption of robotic technol-
ogy to displace tried-and-tested conventional methods rep-
resents a significant barrier to growth in a conservative and
risk-averse industry. The ability to drive this transformation is a
primary element of the organizational changes implemented in
the second half of 2013.
We expect a decentralized organization with a stronger region-
al presence and a unified approach to gain further traction over
the course of the coming year. Organic growth will result from
increased activity and uptake of all our services, leveraging on
the many contract awards and extensions secured in 2013
as well as building on the operational successes in our wide
portfolio of offerings. This will be predominantly within well
intervention. Continued momentum in our well completions
business will provide an increased contribution, although the
associated lead times will naturally limit this development in the
coming year.
Innovation remains an integral part of our competitive advan-
tage. The release pipeline for 2014 includes the launch of our
next generation tractor, the Well Tractor CR® (compact rig-
up), which will be the shortest, fastest tractor in the market.
This provides value in applications globally with limited rig-up
heights such as small platforms and provides synergies with our
efforts to provide applications supporting RLWI initiatives. Also
planned is the launch of the first of Welltec’s diagnostic tools,
the Welltec® Hardware Scanner, which adds value for our cus-
tomers through its capabilities to provide real-time measure-
ments for correlation as well as hardware position.
Management expects continued growth in revenue in 2014
and an improvement in EBITDA. Revenue is expected to be
around USD 340 million (6% growth) with an EBITDA of USD
140 million, equating to an EBITDA margin around 42% on the
basis of a similar service-mix as delivered in 2013.
Forward-looking statements provide current expectations or
forecasts for events, such as product launches, and financial
performance. Such statements are subject to risks, uncertain-
ties and inaccurate assumptions. Actual results may differ from
expected results. Factors that may affect future results include
fluctuations in exchange rates, oil and gas prices, changes in in-
terest rates, production problems, unexpected contract breach-
es or terminations, market-driven price decreases, introduction
of a competing product, Welltec’s ability to successfully market
both new and existing products, exposure to lawsuits and un-
expected growth in costs and expenses.

13 MANAGEMENT COMMENTARY / WELLTEC® ANNUAL REPORT 2013
ouurrrr VVVVVVVAAAALLLLLLUES
DISRUPTIVE INNOOVVVVAAATAATAA IOOOOONNNN – We move wwiith ccooouuuraagto challennnngggeege cooooonno ventional thhinkinnggggto challennnngggeeg cooooonnventional thhinkingnggg
CLIENT DEDICATIOOONNNNN ––– WeWee ddddo o what it taakkekekeeesss toto ccompletely addrrreeeessssss s ouuur clclieieentnts’ chaallllennne gggegess
LEADERSHIP – We pppprririiriddede oouururseseelvlvlvlvlvvveeeseseses on taakikikkikikikikikingngggngngngngnggg aaaaaaaactctctctctctccc ioioioioi nsn that keep usus iinnnnnnn ttthththe forefront
PROFESSIOOONONNNAAAAAALISSSSM – We deliver wwwwhahahat t wewe pprooromimimimimisesesese
PERFORRRRRMMMMAMAMANNNCE – WeWeWeWeWeWeeWee dddddddddddddddrirrrr ve resullltstsstt tthrough tthehe skskskkkilililillllllsl aaaandndndndnn cccoommmmmmimittmmmmemeeeeeeeem ntnnnnnn of ouuurr r ppeoplee
ge
oououourrrr MMMMMMMIISSSSIIOONNissss tttoooo o dddedevelop and deliver
GAGAAMMMME-CHANGINGGAGAAGGAMMME-C solutions
enable our clients towwwhwhwhicich e
E THE MANAGEMENT OOOOOPTIMIZE
D DEVELOPMENTAND
of their assets.o
VISION, MISSION AND VALUES
our VVVVISIONNNNis too TTRRRRANSFORMMMM the
upupststrereaammmmm oil and gggaas indus-
try suchh,,, ttthht at it beeccoomes SAFER
and mooooorrrere SUSTAAAIAINABLE while
aaaachievinnngg higher
RECCCOOVERY.

14 / MANAGEMENT COMMENTARYWELLTEC® ANNUAL REPORT 2013

15 MANAGEMENT COMMENTARY / WELLTEC® ANNUAL REPORT 2013
STRATEGYWelltec® has a simple, coherent strategic concept and
framework.
Our Vision
Welltec’s unique perspective is to transform the upstream oil
and gas industry such that it becomes safer and more sustain-
able while achieving higher recovery.
Our Mission
Our mission, therefore, is to develop and deliver game-chang-
ing solutions, which allow our clients to optimize the manage-
ment and development of their assets.
Our Values
We hold and adhere to a constant set of values that resonate in
our everyday work:
Disruptive Innovation
We move with courage to challenge conventional thinking
Client Dedication
We do what it takes to completely address our clients’
challenges
Leadership
We pride ourselves on taking actions that keep us in the
forefront
Professionalism
We deliver what we promise
Performance
We drive results through the skills and commitment of our
people
Together, our mission and values create a core guiding philoso-
phy that embodies what Welltec® stands for. This is the corner-
stone of our success and provides the constant unifying ele-
ment as we strive to realize of transforming the oil and gas
industry.
Welltec® is strategically focused on driving the company’s
growth through continued development on four strategic
themes: Growth, Strength, Position and Profitability.
Growth
We believe that challenging conventional solutions will con-
tinue to allow us to deliver disruptive technology that adds
significant value for our clients. Coupled with improved service
delivery and responsiveness to our client’s needs, we will de-
liver growth in several key regions:
• Scandinavia: Welltec® will continue to leverage on the
long-standing relationships with our largest clients, which
provide both the impetus and pathway for introducing
new solution concepts to them as well as their peers in the
Norwegian Sea.
• Americas: Our value proposition allows for continued
growth in the highly competitive onshore markets. The cur-
rent footprint in the conveyance market for unconventional
oil and gas plays in North America provides the platform for
further client penetration with higher-value services such as
milling, cleaning and mechanical services that continue to
be served by conventional technologies. Increased penetra-
tion in the Gulf of Mexico and in offshore Latin America
constitute a potential for significant growth in the majority
of offerings.
• Europe, Russia and CIS (ERC): Welltec® will seek to
MANAGEMENT EXPECTS CONTINUED GROWTH IN REVENUESAND MAINTAINED EBITDA MARGINS IN 2014
GROWTHOour VISION
is to TRANSFORM the up-
stream oil and gas industry such,
that it becomes SAFER and more
SUSTAINABLE while achieving
higher RECOVERY.YY

16 / MANAGEMENT COMMENTARYWELLTEC® ANNUAL REPORT 2013
accelerate the uptake of its services in some of the emerg-
ing territories, such as the Caspian where international
access and production continues to increase. In Continen-
tal Europe and the more established markets, Welltec® will
increase its market share through growth in more complex
services, such as riserless well intervention services (RLWI) in
the North Sea.
• Africa: Continued business development with the region’s
dominant international oil companies will provide the main
driver of growth, leveraging on key direct contract awards
• Middle East: Welltec® remains committed to pursuing con-
tinued collaborations and contracts in Saudi Arabia as well
as further opportunities throughout the region. Many of
the national oil companies continue to express sustained in-
terest in our products, particularly in UAE, Qatar and Oman.
• Asia Pacific: Welltec® plans to capitalize on the considerable
market growth potential, both through increased penetra-
tion of existing clients in Malaysia and India, and further
penetration of new clients the south of the region, adding
new business in Indonesia and Australia.
Strength
We plan to continuously strengthen our business and opera-
tional models to provide better services in a way that endorses
long term relationships with our customers. Working more
closely with our customers over longer periods of time ensures
not only a more stable revenue stream but also allows Welltec®
to develop faster and more accurate solutions to meet our
customers’ challenges; thereby perpetuating the value cycle.
We have begun several projects which support this initiative,
including:
• Expansion of our service offerings and product ranges to
broaden our portfolio and reduce dependency upon any
single service or solution;
• Establishing more direct, contractual ties with our custom-
ers as well as longer duration agreements which secure
more planned, dedicated work;
• Streamlining our organizational structure to reflect our
value chain, and thereby matching a global, company-wide
integration of services where roles, responsibilities and
interactions between different parts of the organization are
being clarified to improve performance;
• Recruiting and retaining engineering and management
talent;
• Introducing scalable structures and procedures across our
organization that support our growth, primarily through le-
veraging our already established IT-driven infrastructure and
ensuring that knowledge is built into the structure of the
organization rather than depending on specific individuals;
• Patenting our technology and protecting our intellectual
property and proprietary know-how.
Position
Welltec® is focused on providing unique solutions and avoiding
those markets where services are effectively commoditized. We
intend to attract and satisfy more reference customers through
a focus on global account management, increasing the skill
sets of our current account managers, maintaining our focus
on direct customer relationships and by accelerating the rate of
technology replacement to our offerings across all geographies.
We pursue and maintain strategic partnerships with other ser-
vice providers, such as selected wireline providers, vessel provid-
ers and technology companies, where our combined offerings
BROADEN OUR PORTFOLIO AND REDUCE DEPENDENCY UPON ANY SINGLE SERVICE OR SOLUTION
STRENGTH &POSITION

17 MANAGEMENT COMMENTARY / WELLTEC® ANNUAL REPORT 2013
can be presented to clients as a complete solution. Welltec® can
therefore leverage on both direct client relationships to act as
lead contractor as well as serve as subcontractor to strategic
partners.
Furthermore we actively engage in developing new solution
concepts that addresses our customer’s largest challenges, such
as RLWI for subsea wells, plug and abandonment of wells and
open-hole intervention services in horizontals that require inte-
grated, specialized solutions and equipment. These solutions
provide significant value to our customers as they enable them
to redefine the manner in which they operate and establish
new industry standards. We believe the value creation this de-
livers for our clients will be rewarded through an increase in our
own business. Overall, Welltec’s goal is to maintain its position
as a top provider of the current offerings while simultaneously
providing unique, new solutions in other segments. Our pipe-
line of new service and product initiatives are aimed at develop-
ing a diversified and growing business in terms of revenues and
margins in 2014 and beyond.
Strong market fundamentals support the increasing demand
for well intervention services. The market remains advanta-
geous and our clients continue to embrace our technology and
the services and solutions we provide. While increased activity
in our segments by large service companies may create short
term challenges, it also brings a welcomed boost in driving the
industry’s adoption of our technology and in doing so signifi-
cantly increases the addressable market. It also represents a sig-
nificant endorsement of the robotic well intervention technol-
ogy we have pioneered.
Profitability
Optimizing on costs is an integral part of creating value for our
clients and we are proactively looking for more effective and ef-
ficient ways to deliver without impairing the exceptionally high
standards of our operations. Cost-consciousness in conjunction
with providing solutions which serve to optimize production se-
cures high margins and ensures financial strength for continued
expansion.
The financial goals for growth and profitability enable continual
investments in line with the company’s strategies to strengthen
Welltec’s position and ultimately deliver its mission.
COMPETITIVE STRENGTHS
Global presence
Over the last decade, operational and capital expenditure by oil
and gas companies has increased. Welltec® expects this trend
to continue given the ongoing efforts to improve production
from existing fields and search for new reserves. Forecast spend
for the major oil and gas companies is up and this trend will
favor companies such as Welltec® that have advanced and dif-
ferentiated technological offerings covering all phases of the
well lifecycle.
From a global perspective, oil fields are maturing and new dis-
coveries are not keeping pace with declines or demand consid-
eration. This combination of increasingly mature fields, reduced
quantity and size of new discoveries and increasing global
WE PURSUE STRATEGIC
PARTNERSHIPS WITH OTHER
SERVICE PROVIDERS, SUCH
AS SELECTED WIRELINE PRO-
VIDERS, VESSEL PROVIDERS AND
TECHNOLOGY COMPANIES, WHERE OUR
COMBINED OFFERINGS CAN BE PRESENTED TO
CUSTOMERS AS A COMPLETE SOLUTION.
our MISSIONis to develop and deliver GAME-
CHANGING solutions which
enable our clients to OPTIMIZE THE
MANAGEMENT AND DEVELOPMENT
of their assets.
18 / MANAGEMENT COMMENTARYWELLTEC® ANNUAL REPORT 2013
demand represents a huge challenge for all. Welltec’s expec-
tations are that our value proposition of developing methods
for increased reservoir optimization will resonate with our cus-
tomer’s around the world as they seek to increase the life span
of existing fields.
New discoveries are increasingly being made in areas present-
ing significant operational complexity for exploration and de-
velopment. Almost half of all newly discovered oil reserves
since 2000 have been made in offshore deep-water or ultra
deep-water. An increasing portion of new supply is also com-
ing from unconventional reserves (such as shale gas or shale oil)
adding further complexity in the form of more horizontal well
designs. The shift in discoveries and resource types have also
increased the technical risk of projects and the requirements
of the equipment and services necessary to handle these more
challenging operating conditions, which have also driven the
need to use advanced technologies in well intervention. It is
our experience that oil and gas companies are becoming more
likely to work with suppliers of high-quality services as they de-
liver a higher long-term value. With the increased complexity
and costs of new discoveries, well interventions have become
an attractive economic proposition compared to exploring for
new reserves. Welltec’s technology, which has a proven record
of successful operations in these environments, will continue to
be in demand.
TECHNOLOGY
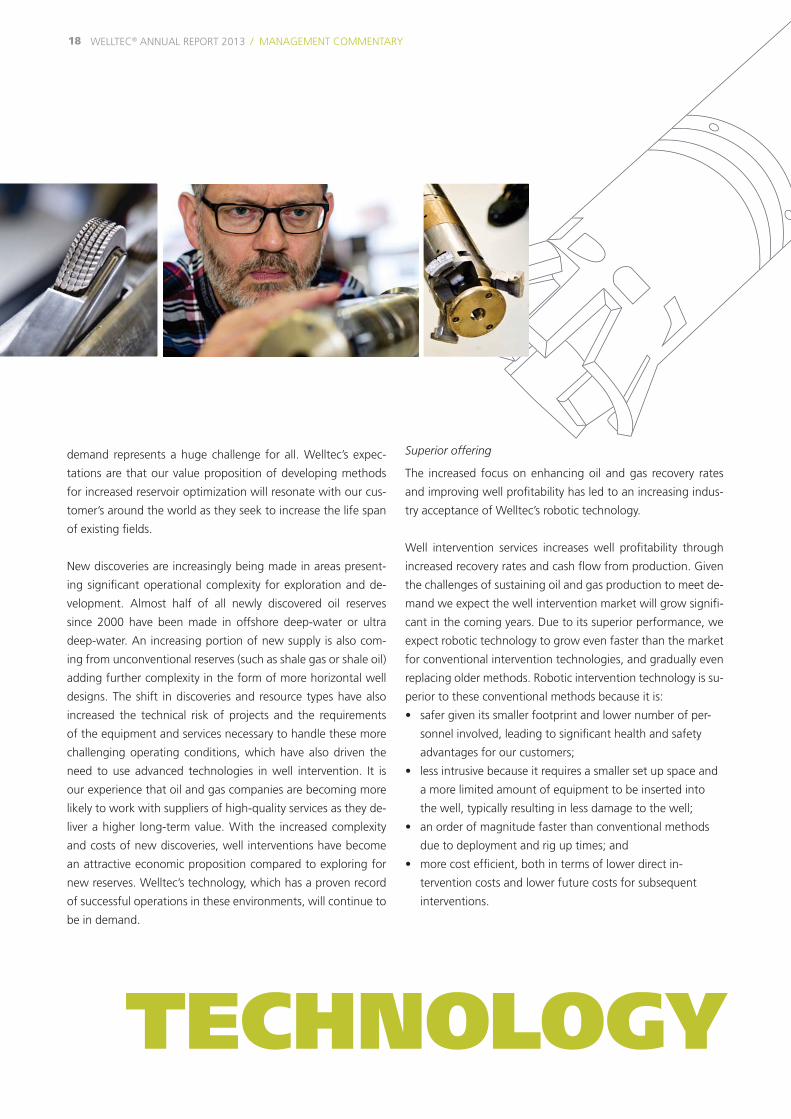
Superior offering
The increased focus on enhancing oil and gas recovery rates
and improving well profitability has led to an increasing indus-
try acceptance of Welltec’s robotic technology.
Well intervention services increases well profitability through
increased recovery rates and cash flow from production. Given
the challenges of sustaining oil and gas production to meet de-
mand we expect the well intervention market will grow signifi-
cant in the coming years. Due to its superior performance, we
expect robotic technology to grow even faster than the market
for conventional intervention technologies, and gradually even
replacing older methods. Robotic intervention technology is su-
perior to these conventional methods because it is:
• safer given its smaller footprint and lower number of per-
sonnel involved, leading to significant health and safety
advantages for our customers;
• less intrusive because it requires a smaller set up space and
a more limited amount of equipment to be inserted into
the well, typically resulting in less damage to the well;
• an order of magnitude faster than conventional methods
due to deployment and rig up times; and
• more cost efficient, both in terms of lower direct in-
tervention costs and lower future costs for subsequent
interventions.

19 MANAGEMENT COMMENTARY / WELLTEC® ANNUAL REPORT 2013
Market Leader
We pioneered the well intervention services market with our
robotic technology. Our technological leadership has been rec-
ognized by both customers and industry associations, and we
have been awarded a number of industry awards annually. We
have also accumulated a long list of “firsts” for our intervention
solutions within the industry and hold the majority of World
Records for the operations we perform, including deepest well
intervention, highest deviation well intervention, deepest wa-
ter depth intervention using RLWI, most footage tractored on
one trip to the well site, et al.
To maintain our leading position and further grow our business
we continue to focus on technological innovation. We often
work in conjunction with our clients on developing new ap-
plications and tools in order to solve specific needs of our cus-
tomers. This enables us to develop a deep understanding of
our customers’ business requirements and the challenges they
face while strengthening our relationships with them. We de-
vote considerable time and resources to development and engi-
neering, and are working on several projects to deliver the next
generation of tools and solutions.
Hand-in-hand with our dedicated efforts on technology inno-
vations, we vigorously protect our intellectual property. In 2013
alone, 144 patents were issued and we now have in the region
of 2,500 forecasted patents based on patent families at various
stages of registration or application. Welltec® operates a com-
prehensive program to protect critical intellectual property and
proprietary know-how, comprising the following internal pro-
tective barriers (the list is not exhaustive):
• Physical restrictions on access to and restrictions on record-
ing and photographic activities on Welltec® facilities;
• Application of various encrypting measures and the use of
either specially adapted or internally developed software
• Limited access to view, print and distribute technology blue-
prints and other sensitive documentation, with none, or
distorted, drawing specs on externally distributed drawings;
• Extensive IT-system log on access and security measures,
combined with limited off-site access and remote deletion
of sensitive information on lost IT-hardware;
• Extended use and tracking of non-disclosure agreements,
disclaimers and confidentiality agreements;
• Rigorous patenting of certain technology advances in rel-
evant countries and associated patent prosecution.
These measures are in place to avoid unintended dissemina-
tion of our trade secrets, know-how and sensitive information
in general.
We believe that our leading position will be maintained and
our business will grow as a consequence of our commitment
to quality in execution and customer service. In the oil and gas
service industry, technical reliability and overall service qual-
ity are paramount factors in customers’ purchasing decisions.
Through continuous evolution and improvement of work pro-
cesses, Welltec® offers superior service quality, as reflected in
the achievement of a 96% ratio of runs to misruns, which is
the generally accepted industry measure of service quality.
RISKS
Risks Related to Our Business
Business and industry related risks
While we believe our business to be relatively unaffected by
macro-economic factors, it is ultimately affected by the level of
expenditures of companies engaged in the production, explo-
ration and development of oil and gas.
Cyclical market
The oil and gas industry is cyclical and while demand for
Welltec’s services is primarily dependent on customer’s operat-
ing expenditures, demand for Welltec’s services also depends
somewhat on the capital expenditures of customers. A de-
crease in operating expenditures may have adverse effects on
Welltec’s revenue and profits in the shorter term, while a de-
crease in the capital expenditures may have adverse effects on
Welltec’s revenue and profits in the longer term.
Customers
Welltec’s clients are typically not required to make minimum
purchases under sales contracts and customers can typically
terminate contracts without cause and on short notice. Not-
withstanding our broad customer base, Welltec® have one cus-
tomer that accounted for more than 16% of our revenue, and
loss of the trading relationship with this customer would have
an adverse effect on our revenue and profits. As such, visibility
with respect to future revenues is limited and there can be no
assurance that a trading relationship with important customers
will continue.

20 / MANAGEMENT COMMENTARYWELLTEC® ANNUAL REPORT 2013
Competitors
Welltec® competes with large multinational companies that can
offer integrated services which Welltec® cannot offer. Further,
Welltec are, to some extent, dependent on equipment provided
by our competitors and such competitors could restrict us from
accessing wells using their equipment. In general, competition
can result in pricing pressures, lower sales and reduced mar-
gins that could have an adverse effect on Welltec’s revenue and
profits.
Operational risks
Service quality
Welltec’s ability to provide a high quality product and service
provision is of importance in respect of securing repeat sales
with new and existing clients. Our service quality can be nega-
tively affected by an inability to attract, train and retain highly
skilled and qualified personnel to develop, manufacture and
operate our equipment, with an adverse effect on Welltec’s
revenue.
Supply chain
Welltec® may experience constraints, anomalies or interruptions
in our supply chain, restricting Welltec’s ability to provide the
service or product in alignment with the expectations of the
customers. Such constraints may be due to supply chain bottle-
necks, delays or disruptions in clearing goods from customs or
events restricting Welltec’s ability to procure, develop or manu-
facture new equipment or spare parts or maintain the existing
fleet, and such could negatively affect our results of operations.
Catastrophic events
Welltec’s business operations could be subject to various cat-
astrophic events, including blow outs, explosions, damage to
or loss of third party property, injury to personnel, reputational
damage and oil and hazardous substance spills into the envi-
ronment, both on and off shore. Such events could, if the im-
pact of such event is not covered by Welltec’s insurance or are
not subjected to Welltec’s contractual indemnification protec-
tion, have an adverse effect on Welltec’s revenue and profits.
Financial risks
Financial exposure
Due to Welltec’s foreign activities and credit facilities in foreign
currencies, its profit/loss, cash flows and equity are affected by
changes in exchange rates and interest rates for a number of
currencies.
Foreign exchange fluctuations
The reporting currency of the group is US Dollars and the func-
tional currency for most of the group’s subsidiaries is that of
the country in which the subsidiary is domiciled. The functional
currency of the Danish operation and operations in some other
countries is US dollars. This reflects the revenue and principal
source of financing. A significant proportion of the group’s rev-
enues, expenses and other liabilities are denominated in curren-
cies other than the US Dollar, in particular Norwegian Kroner,
Danish Kroner and Canadian Dollar. Fluctuations in the value of
other currencies as compared with the US Dollar could result in
translation losses or gains.

21 MANAGEMENT COMMENTARY / WELLTEC® ANNUAL REPORT 2013
Taxes
Welltec® files income tax returns in multiple jurisdictions.
Welltec’s effective tax rate could be adversely affected by sev-
eral factors, including changes in the income taxed by or al-
located to the various jurisdictions with differing statutory tax
rates; changing tax laws, regulations and interpretations of
such tax laws in multiple jurisdictions; and the resolution of is-
sues arising from tax audits or examinations together with any
related interest or penalties. The determination of local tax li-
ability is always subject to review or examination by authori-
ties in operating jurisdictions. If a tax authority in any jurisdic-
tion reviews filed tax returns and based on filing proposes an
adjustment, including adjustments of transfer prices and terms
applied, such an adjustment could have a negative impact on
Welltec’s net profit.
Liquidity risk
Welltec’s ability to make payments on and to refinance our in-
debtedness and to fund planned capital expenditures and oth-
er strategic investments will depend on our ability to generate
cash in the future. This, to a certain extent, is subject to gen-
eral economic, financial, competitive, legislative, regulatory and
other factors that are beyond our control. Welltec® expects to
continue making capital investments in order to develop and
purchase additional equipment to expand our services, increase
our capacity and replace existing equipment. Such capital in-
vestments require cash that could otherwise be applied to oth-
er business needs. However, if Welltec® does not incur these
expenditures while our competitors make substantial invest-
ments, our market share may decline and our business may be
adversely affected.
Legal risks
Regulatory
Welltec® conducts business in multiple jurisdictions in a highly
regulated industry. As such, Welltec® is directly or indirectly,
subject to a variety of federal, provincial, state and local laws,
regulations and guidelines, in all such jurisdictions, including
laws and regulations relating to health and safety, the conduct
of operations including business ethics and trade compliance,
taxation, the protection of the environment and the manufac-
ture, management, transportation and disposal of certain ma-
terials used in operations. Accordingly, Welltec® could become
subject to liabilities relating to the violation of such regulations
in multiple jurisdictions, with an adverse effect on the profits.
Technology
Welltec® is a technology company, constantly challenging the
operational boundaries in the industry. However, third parties
may assert that our products, services, solutions and other in-
tellectual property may infringe, on their proprietary rights. Any
such potential future claims, regardless of merit, could result in
multi-jurisdictional litigation, which could result in substantial
expenses, causes significant delays and materially disrupt the
conduct of business and have an adverse effect on our financial
condition and results of operations.
CORPORATE GOVERNANCE
Welltec® aims to establish, maintain and operate a corporate
governance system that is compliant with best practice, rec-
ognized governance principles sufficient to satisfy the require-
ments of a public Danish company.

22 / MANAGEMENT COMMENTARYWELLTEC® ANNUAL REPORT 2013
CORPORATE SOCIAL RESPONSIBILITY
The following statement of Corporate Social Responsibility
(CSR) pursuant to the Danish Financial Statements Act Section
99a is part of the Management’s Commentary in the Annual
Report 2013.
Corporate Social Responsibility Policy
Welltec® focuses its CSR efforts on areas and issues directly af-
fecting our business. We have outlined our responsibility in po-
lices developed to comply with the objectives of CSR and ap-
proved by the Board of Directors. These principles are reviewed
on a regular basis and updated against relevant codes of cor-
porate governance and international standards, including the
UN’s Universal Declaration of Human Rights, the ILO’s Declara-
tion on Fundamental Principles and Rights at Work, the OECD’s
Guidelines for Multinational Enterprises, the Rio Declaration
on Environment and Development, the UN Convention against
Corruption, as well as applicable legislation governing the in-
terest of our stakeholders.
In 2013 the Board has adopted a new code of conduct to sup-
port the CSR initiatives. The areas currently covered by CSR pol-
icies are: (i) Business Ethics, (ii) Anti-Corruption, (iii) Health and
Safety, (iv) Environment, (v) Employment, (vi) Customers, and
(vii) Community.
The responsibility of monitoring overall CSR compliance has
been delegated to the heads of Legal, Human Resources, QHSE
(Quality, Health, Safety, and Environment) and Commercial De-
partments. Key performance indicators are regularly monitored
and appropriate audits are performed and followed up.
The policies have been incorporated into our code of conduct
and continue to be communicated to all employees. It is acces-
sible on both our website and intranet. Moreover, a concert-
ed effort is made to ensure that these are deep rooted in our
thinking and our way of doing business.
Business Ethics
Policy
At Welltec® ‘we say what we do and we do what we say’.
This principle is the back bone of Welltec’s Code of Conduct
and promotes certainty in relation to all our stakeholders that
predictability and reliability are the norm when dealing with
Welltec®. It is our policy to comply with all governmental laws,
rules and regulations applicable to our business and we strive
to follow the course of action leading to the highest degree of
integrity in situations where the law may be permissive.
Implementation
Integrity and ethical conduct is a fundamental part of manage-
ment procedures and Welltec´s Code of Conduct and is an un-
derlying driver in all we do. The methods we employ to attain
results are as important as the results themselves.
Welltec® employees are expected to perform their work with
honesty, truthfulness and integrity, and conduct their business
affairs fairly. All employees are responsible for the immediate
and accurate reporting to higher management of work-relat-
ed information of importance to the governing guidelines. We
strongly encourage dialogue to make each other aware of situ-
ations that give rise to ethical questions and to articulate ac-
ceptable ways of handling those situations.
Key results in 2013 and future plans
Welltec® has performed appropriate internal investigations into
possible non-ethical behavior by employees following internal
controls or whistle-blowing. We have in continuation of the
investigative findings applied consequences towards the em-
ployees when relevant and further strengthened internal com-
munication in respect of compliance programs.
To improve our efforts to facilitate sound business ethics, we
applied in August 2012 for permission from the Danish author-
ities to establish a formalized whistle-blower program, which
we expected to launch in 2013. In January 2014 the Danish
authorities have issued permission to establish a formalized
whistle-blower program.
Anti-Corruption
Policy
Our conviction to uphold ethical standards in all our corporate
activities is a common mind-set of all our employees and we
strive to do business with customers and suppliers of sound
business character and reputation. We have strict guidelines
covering facilitation payments, bribery, entertainment and
gifts, and our screening processes provide full transparency to
mitigate the risk of corruption.

23 MANAGEMENT COMMENTARY / WELLTEC® ANNUAL REPORT 2013
Implementation
Welltec® maintains a general Partner Screening Program appli-
cable for agents, representatives and joint venture partners in
territories where transparency and corruption are imminent is-
sues. This comprises a questionnaire combined with a review
process under which a potential partner is vetted for undue
relationships and channels of influence.
Furthermore, Welltec® operates a zero-tolerance policy towards
corruptive behavior of employees and representatives. Any indi-
cation implying corruption will immediately trigger an internal
investigation led by the Legal Department and supplemented
by the HR Department.
Key results in 2013 and future plans
One screening was performed in 2013 and the partnership is
still being considered.
We have strengthened our screening abilities by the application
of external screening partners and their databases.
We expect to initiate a new Anti-Bribery and Corruption pro-
gram and supplement the implementation with an employee
training program. We will continue to improve the screening
procedures, review processes and further incorporate addi-
tional FCPA (Foreign Corrupt Practices Act) based initiatives.
Furthermore, we continue to monitor the initiatives and guide-
lines issued by OECD (Organization for Economic Cooperation
and Development) and Transparency International to identify
policies and procedures that could improve our anti-corruption
measures.
Health, Safety and Environment (HSE)
Policy
Our paramount concern is the health and safety of our employ-
ees, customers and everyone else that comes into contact with
our activities. This concern reaches far beyond such measures
required under applicable law. Health and safety underpins all
our operations and we continuously monitor HSE performance
and work to identify improvement initiatives. All our employees
are aware that the safety of people and protection of the envi-
ronment is an absolute priority.
Implementation
HSE is an integral part of decision-making, processes and train-
ing. Comprehensive incident reporting systems are in place to
review and address:
• Any injury or near miss in relation to our activities. Perfor-
mance statistics are kept and analyzed to ensure adoption of
best practices protecting the health and safety of individuals.
• Any unintentional discharge into the environment of dam-
aging substances or near misses in relation to one of our
operations. These are carefully analyzed to ensure adoption
of best practices in order to protect the environment to the
benefit of us all.
Weekly corporate management meetings are opened with a re-
view on any health and safety issues which may have occurred.
All locations have an HSE Officer employed to lead the HSE ef-
fort, ensure compliance with Welltec’s policies and local legisla-
tion and conduct monthly meetings where all employees are
required to attend.
All new hires attend an HSE introduction program and we oper-
ate a Safety Card Observation Program (SCOP) to report on and
encourage safe working practices.
As part of Welltec’s commitment to manage climate change
SCOP CARD
DESCRIPTION OF OBSERVATION
DISCUSSION AND AGREED ACTION
FOLLOW-UP / REMARKS
Observer’s Name
Date (Month/year)
Country
Client
Job ID
Place
Unsafe observation Safe Near miss (CA only)
What (code )
Why (code )
Yes No
Follow-up required
All new hires
attend an HSE
introduction
program and we
operate a Safety
Card Observa-
tion Program
(SCOP) to report
on and encour-
age safe working
practices.

24 / MANAGEMENT COMMENTARYWELLTEC® ANNUAL REPORT 2013
impacts, Welltec’s facilities are audited by the relevant Munici-
pality, Nature and Environment Auditor. At any local operation,
we ensure that respect for the environment is applied such
that sustainability and recycling is promoted and secured to
the greatest extent reasonably possible, while at the same time
closely monitoring consumption of chemicals, waste, electric-
ity, heat and water.
The corporate QHSE function performs internal HSE audits at
the headquarters and local bases worldwide in order to assess
the effectiveness of the internal QHSE Management System of
Welltec. The audits are the prime instrument for reviewing the
business interfaces internally between HQ and bases, and ex-
ternally with customers, and create specific action points for
the cycle of continuous improvement.
Key results in 2013 and future plans
Only five small environmental accidents occurred, where the
spill is less than 1kg, and four of them were fully recovered.
Respect for and preservation of the environment is a key ele-
ment of our business proposition.
Despite the growth in activity, Welltec® experienced no change
in the total number of Medical Treatments (MTO) and Restrict-
ed Work Case Frequency (RWC/RWCF), and only an incre-
mental increase in Lost Time Incidents (LTI), while Vehicle Ac-
cident Frequency (VA/VAF). This followed an increased focus on
strengthening the vehicle safety culture through training and
the implementation of processes designed to share knowledge
and analyze trends and root causes. There were no Fatalities
(FTL) in 2013 or previously
A worldwide survey of Safety Culture assessing the physical and
psychological work climate did not indicate any major issues,
and subsequent action plans have been drawn up to oversee
improvements in the physical workplace within each sector.
Quality is and has always been deeply ingrained in all processes
at Welltec®. Welltec® is ISO 9001 certified by Det Norske Veritas
(DNV) with periodic re-certification audits every 3 years.
Furthermore, oil operators, service partners and authorities
perform external audits to assess Welltec’s ability to effectively
manage the hazards associated with the services provided. In
2013, Welltec® Denmark was audited by DNV and local bas-
es were audited by Petrobras, BHP, BP, Chevron, and Statoil,
among others. None of these audits resulted in significant
remarks.
2009 2010 2011 2012 20130
2
4
6
8
10
MTO LTI RWC FTL
NUMBERS OF INCIDENTS
INCIDENTS FREQUENCY
2009 2010 2011 2012* 2013*0
1
2
3
4
5
Inci
dent
s pe
r 20
0,00
0 w
orki
ng
hour
s
MTOF LTIF RWCF TRCF
VEHICLE ACCIDENTS
0
5
10
15
20
25
2009 2010 2011 2012* 2013*0.0
0.2
0.4
0.6
0.8
1.0
VA p
r. 2
00.0
00 k
m
VA VAF
Employment
Policy
Welltec® believes that its employees, both as individuals and as
part of a team, are the most important assets of the business.
Hence, and with due consideration to the often challenging
working conditions in the field, applies measures which ‘go
beyond the norm’ to safeguard and maximize the health and
safety aspects of the employees performing their duties.
Welltec® recognizes a shared responsibility on behalf of all em-
ployees to exercise the human rights principles of mutual re-
spect and dignity in all working relationships and consequently
enforces a policy of zero tolerance with regard to harassment
or discrimination.
*All incidents from 2012-2013 have been re-evaluated to align with industry standards

25 MANAGEMENT COMMENTARY / WELLTEC® ANNUAL REPORT 2013
In 2013, as a natural extension of previous practice, the board
of directors adopted a Diversity and Equal Opportunity Employ-
ment Policy. The policy formalizes our commitment to always
choosing the best person for the job regardless of that person’s
race, color, religion, disability, gender, sexual orientation, age or
nationality. Furthermore, Welltec® will actively work to increase
the share of females in management positions, for example, by
putting the needed extra effort into identifying relevant female
candidates when recruiting.
Implementation
Welltec® actively recruits employees from many sources, includ-
ing first-tier academic institutions as well as leading companies
in the industry, depending on the requirements of a given posi-
tion. A variety of objective profiling tools are used to help as-
sess the candidates. Furthermore, we actively encourage mobil-
ity and career progression within Welltec®.
Welltec® operates an extensive in-house training program cov-
ering core operational aspects as well as sales skills and pro-
grams aimed at legal compliance. Participation is registered
and tracked in the HR system, enabling on-going identification
of training needs and supporting work-force planning.
For long-term ill employees, we work closely and actively with
local authorities and community centres in order to define indi-
vidual solutions, including definition of flex jobs (permanently
reduced work time), temporarily reduced work time, redefini-
tion of work area, etc.
Our workforce
The employee population is very diverse with respect to na-
tionalities, reflecting the truly global nature of the company. As
such there are around 50 nationalities employed in Welltec®.
As is common in the oil industry, the share of females is low in
Welltec®. Women make up 12% of the total employee popu-
lation and 8% of management level employees. There are no
women on the Board of Directors.
Key results in 2013 and future plans
During the year, more than 200 employees have received in-
ternal training in the areas of Field Engineer courses, special
equipment courses, Project Management courses, sales train-
ing etc.
2013 has seen the launch of several new initiatives on the HR
front. A standardized on boarding program has been launched
for all staff worldwide. A single HR system has been imple-
mented globally. As intended, this enables greater consistency
in data, workforce transparency and supports the continued
implementation of uniform and streamlined processes. Further,
Employee Self Service was launched in late 2013.
All five employees that have been long-term ill during 2013
have benefitted from the individual solutions Welltec® provides.
12 % vs. 88 % of all employees
50NATIONALITIES
EMPLOYED

26 / MANAGEMENT COMMENTARYWELLTEC® ANNUAL REPORT 2013
Welltec® will continue to improve in the area of employment.
Plans for 2014 include implementing a standardized approach
to performance management worldwide and increasing trans-
parency to employee competencies beyond those captured
today.
In 2013 Welltec® saw one incident in violation of the Diversity
and Equal Employment Opportunity Policy. The matter was in-
vestigated and appropriate disciplinary actions and reinforce-
ment of policy were applied.
Also during 2013 Welltec® initiated the Welltec Fellowship
which enables the retention of senior employees at or beyond
age of retirement, which have recognized industry experience
for internal and external training, coaching and marketing in
Welltec´s interests.
Welltec® will also continue to evaluate ways to increase the
share of females in management and expect to report on the
results of this following 2014. Furthermore, the board of direc-
tors has set the goal of having at least one female member of
the board of directors by April 1, 2017.
Customers
Policy
Welltec® views customers as business partners and pursues an
open and transparent relationship characterized by frequent
dialogue and a focus on serving their best interests.
It is our policy to provide solutions that excel in quality, con-
form to industry best practice and adhere to responsible
standards of performance, including taking due care and
consideration to protection of the environment and the health
and safety of all people involved.
We operate an open door policy in situations where a custom-
er or regulatory body wishes to investigate a non-successful
operation or an issue of regulatory non-compliance. All non-
optimal or non-compliant findings from the internal Welltec®
investigation are openly disclosed to achieve maximum trans-
parency and optimal lessons learned.
0
1,000
2,000
3,000
4,000
5,000
6,000
2011 2012 2013
Run Count Misrun - Welltec
SERVICE QUALITY
SERVICE QUALITY
90%
92%
94%
96%
98%
100%
2011 2012 2013

27 MANAGEMENT COMMENTARY / WELLTEC® ANNUAL REPORT 2013
Implementation
In such situations, a failure investigation is initiated to ensure:
• that investigations requested by the clients are performed;
• that conformed and controlled methods are followed when
handling misruns, covering from job planning, equipment,
procedures, communication to human factors;
• lessons learned are properly communicated throughout the
organization in order to minimize the risk of re-occurrence;
• A failure report is prepared on a timely manner for the cli-
ent, prior to officially closing the investigation.
Key results in 2013 and future plans
The overall numbers of customer-requested quality investiga-
tions increased in 2013, with Welltec’s corporate QHSE depart-
ment increasingly involved to ensure the highest standards are
applied to match heightened expectations from customers as
the scope and complexity of services increase.
A global training program, as part of the Welltec® Academy,
serves to increase expertise in the use of our operational plan-
ning software to ensure continuous improvement of service
quality on jobs performed. The program underlines the con-
stant focus on maintaining the very highest levels of service
quality and is reflected in the continued service quality delivery
above 95% as compared to a 39% increase in run count with
the growth in activity.
Service Quality (SQ) is derived from the total number of con-
ducted runs as compared to misruns, and defined as:
SQ = (total number of runs – total number of misruns) / total
number of runs.
Welltec® will continue its efforts to minimize the risk of non-
successful operations by communicating lessons learned
throughout the organization and with the customer or regula-
tory body.
The dedication to meeting client objectives and focus on driv-
ing dialogue continues to lead to an increase in the number of
regular customer meetings, with a 25% rise in 2013.
Community
Policy
At Welltec®, we inherently share a responsibility that reaches
beyond our immediate business and has an impact on the in-
terests of all our stakeholders. These encompass not only our
shareholders but also our customers, employees, suppliers,
the local communities in which we operate, as well as the sur-
rounding environment and the human beings occupying it.
Improving the environment in and around our operations is
an integral part of our business. We operate from a significant
number of properties in a variety of countries, and we have re-
sponsibility to our employees, to the people living and working
nearby as well as the environment. It is our policy therefore to
engage with the local community as both a neighbor and resi-
dent and support efforts to improve the local area, for example
by addressing antisocial behavior, crime and vandalism as well
as promoting road safety.
Implementation and future plans
We will actively promote engagement between our staff and
the community, supporting local community-based projects
and charities, including fund-raising and initiatives for the de-
velopment and education of young people in the areas where
we operate.

28 / MANAGEMENT COMMENTARYWELLTEC® ANNUAL REPORT 2013
STATEMENT BY MANAGEMENT ON THE ANNUAL REPORTWe have today considered and approved the annual report
of Welltec International ApS for the financial year January 1,
2013 to December 31, 2013.
The consolidated financial statements and parent financial
statements are prepared in accordance with International
Financial Reporting Standards as adopted by the EU and addi-
tional Danish disclosure requirements for annual reports.
In our opinion, the consolidated financial statements and the
parent financial statements give a true and fair view of the
group’s and the parent’s financial position at December 31,
2013 as well as of their financial performance and their cash
flows for the financial year January 1, 2013, to December 31,
2013.
We also believe that the management commentary contains a
fair review of the development of the group’s and the parent’s
activities and financial position, together with a description
of the principal risks and uncertainties that the group and the
parent face.
We recommend the annual report for adoption at the Annual
General Meeting.
Allerød, February 27, 2014
Executive Board:
Jørgen Hallundbæk
Chief Executive Officer
Board of Directors:
Søren Jørgensen Scott C. Collins
Chairman
Jørgen Hallundbæk Johannes K. J. Sikkens

29 MANAGEMENT COMMENTARY / WELLTEC® ANNUAL REPORT 2013
Copenhagen, 27 February 2014
Deloitte
Statsautoriseret Revisionspartnerselskab
Anders Dons Martin Faarborg State Authorized State Authorized Public Accountant Public Accountant
INDEPENDENT AUDITOR’S REPORTS
To the shareholders of Welltec International ApS
Report on the consolidated financial statements
and parent financial statements
We have audited the consolidated financial statements and
parent financial statements of Welltec International ApS for
the financial year 1 January to 31 December 2013, which
comprise the statement of comprehensive income, statement
of financial position, statement of changes in equity, state-
ment of cash flows, and notes, including the accounting poli-
cies for the group as well as for the parent. The consolidated
financial statements and parent financial statements have
been prepared in accordance with International Financial Re-
porting Standards as adopted by the EU and additional Danish
disclosure requirements for annual reports.
Management’s responsibility for the consolidated
financial statements and parent financial statements
Management is responsible for the preparation of consoli-
dated financial statements and parent financial statements
that give a true and fair view in accordance with International
Financial Reporting Standards as adopted by the EU and dis-
closure requirements of the Danish Financial Statements Act
and for such internal control as Management determines is
necessary to enable the preparation of consolidated financial
statements and parent financial statements that are free from
material misstatement, whether due to fraud or error.
Auditor’s responsibility
Our responsibility is to express an opinion on the consolidated
financial statements and parent financial statements based on
our audit. We conducted our audit in accordance with Inter-
national Standards on Auditing and additional requirements
under Danish audit regulation. This requires that we comply
with ethical requirements and plan and perform the audit to
obtain reasonable assurance about whether the consolidated
financial statements and parent financial statements are free
from material misstatement.
An audit involves performing procedures to obtain audit evi-
dence about the amounts and disclosures in the consolidated
financial statements and parent financial statements. The pro-
cedures selected depend on the auditor’s judgment, including
the assessment of the risks of material misstatements of the
consolidated financial statements and parent financial state-
ments, whether due to fraud or error. In making those risk
assessments, the auditor considers internal control relevant to
the entity’s preparation of consolidated financial statements
and parent financial statements that give a true and fair view
in order to design audit procedures that are appropriate in the
circumstances, but not for the purpose of expressing an opin-
ion on the effectiveness of the entity’s internal control. An au-
dit also includes evaluating the appropriateness of accounting
policies used and the reasonableness of accounting estimates
made by Management, as well as the overall presentation of
the consolidated financial statements and parent financial
statements.
We believe that the audit evidence we have obtained is suffi-
cient and appropriate to provide a basis for our audit opinion.
Our audit has not resulted in any qualification.
Opinion
In our opinion, the consolidated financial statements and
parent financial statements give a true and fair view of the
group’s and the parent’s financial position at 31 December
2013, and of the results of their operations and cash flows
for the financial year 1 January to 31 December 2013 in ac-
cordance with International Financial Reporting Standards as
adopted by the EU and additional Danish disclosure require-
ments for annual reports.
Statement on the management commentary
Pursuant to the Danish Financial Statements Act, we have read
the management commentary. We have not performed any
further procedures in addition to the audit of the consolidated
financial statements and parent financial statements.
On this basis, it is our opinion that the information provided in
the management commentary is consistent with the consoli-
dated financial statements and parent financial statements.

30 WELLTEC® ANNUAL REPORT 2013 / FINANCIAL STATEMENTS
FINANCIAL STATEMENTS

WELLTEC® ANNUAL REPORT 2013 FINANCIAL STATEMENTS / 31
For the years ended December 31, 2013, 2012 and 2011 (USD in thousands)
NOTE 2013Restated
2012 2011
Revenue 3 321,165 295,387 229,223
Cost of services provided (155,668) (128,326) (97,032)
Gross profit 165,497 167,061 132,191
Development and manufacturing costs 4, 5 (99) (45) (128)
Administrative and sales costs 4, 5 (82,379) (70,162) (64,397)
Amortization of acquired Intangibles in a business combination 5 (10,616) (10,705) (10,657)
Operating profit (EBIT) before special items 72,403 86,149 57,009
Special items 6 (4,698) 0 0
Operating profit (EBIT) 67,705 86,149 57,009
Financial income 7 23,236 1,068 4,628
Financial expenses 8 (49,411) (39,329) (28,778)
Profit before tax 41,530 47,888 32,859
Income taxes 9 (20,887) (23,537) (16,093)
Profit for the year 20,643 24,351 16,766
Other comprehensive income for the year
Items that will be reclassified subsequently to the income statement,
when specific conditions are met:
Unrealized exchange rate adjustments of foreign subsidiaries and
branches (9,342) (3,551) 62
Total comprehensive income 11,301 20,800 16,828
Distribution of profit/loss for the year
Profit for the year attributable to:
Welltec International ApS shareholders’ share of profit 20,654 24,193 17,165
Non controlling interests share of profit / (loss) for the period (11) 158 (399)
20,643 24,351 16,766
Total comprehensive income attributable to:
Welltec International ApS shareholders’ share of comprehensive income 11,312 20,642 17,259
Non controlling interests share of comprehensive income / (loss) (11) 158 (431)
11,301 20,800 16,828
CONSOLIDATED STATEMENT OF COMPREHENSIVE INCOME

32 WELLTEC® ANNUAL REPORT 2013 / FINANCIAL STATEMENTS
As of December 31, 2013 and 2012(USD in thousands)
NOTE 2013Restated
2012
Non-current assets
Intangible assets
Goodwill 242,340 242,340
Technology 61,227 65,927
Customer relationship 18,752 24,499
Brand 13,924 13,924
Completed development projects 56,362 51,117
Development projects in progress 33,784 27,912
Patents and licences 8,737 5,693
Total intangible assets 12 435,126 431,412
Tangible assets
Land and buildings 3,062 2,502
Leasehold improvements 2,786 2,013
Plant equipment and fleet 84,139 59,083
Other fixtures and fittings, tools and equipment 12,994 14,059
Plant equipment and fleet under construction 25,467 27,337
Total tangible assets 13 128,448 104,994
Financial assets
Tax receivables 9 1,382 1,321
Deferred tax assets 20 2,856 2,959
Other receivables 1,764 3.318
Total financial assets 6,002 7,598
Total non-current assets 569,576 544,004
Current assets
Inventories 16 2,476 1,733
Receivables
Current portion of non-current assets 2,120 2,120
Trade receivables 17 83,361 85,329
Tax receivables 9 2,070 1,924
Other receivables 6,630 9,902
Prepayments 18 7,151 5,150
Total receivables 101,332 104,425
Cash and cash equivalents 38,812 41,985
Total current assets 142,620 148,143
Total assets 712,196 692,147
CONSOLIDATED STATEMENT OF FINANCIAL POSITION
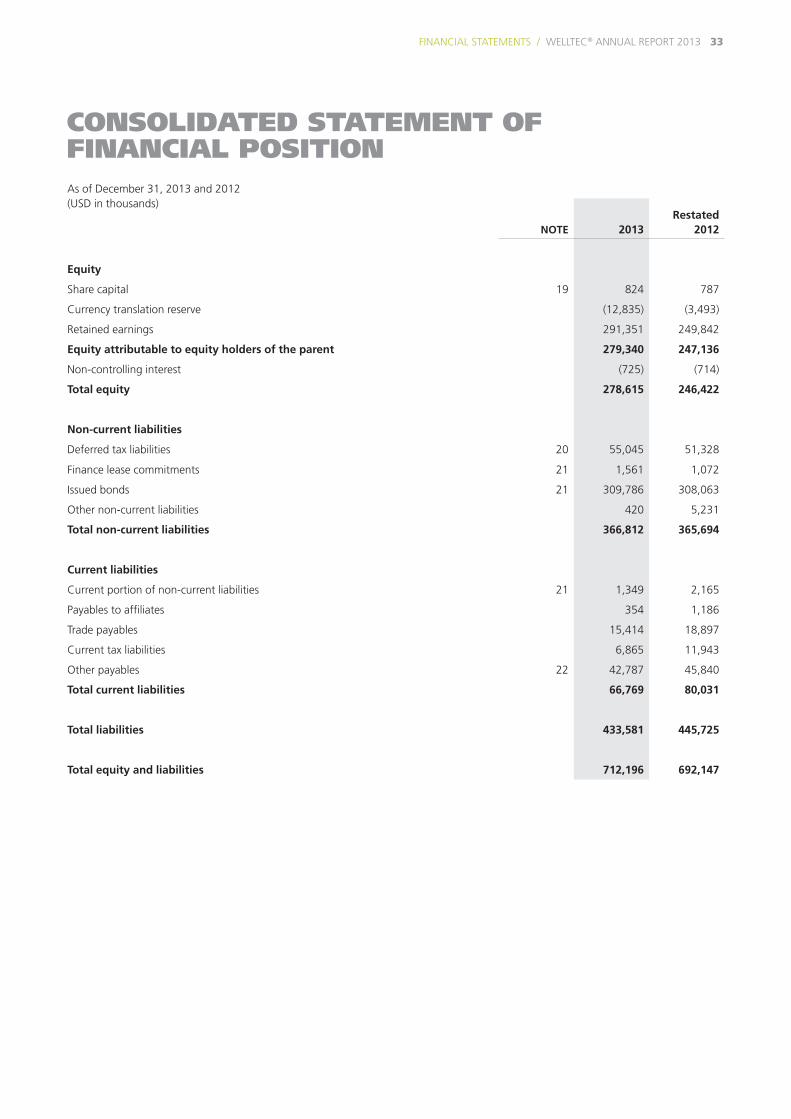
WELLTEC® ANNUAL REPORT 2013 FINANCIAL STATEMENTS / 33
As of December 31, 2013 and 2012(USD in thousands)
NOTE 2013Restated
2012
Equity
Share capital 19 824 787
Currency translation reserve (12,835) (3,493)
Retained earnings 291,351 249,842
Equity attributable to equity holders of the parent 279,340 247,136
Non-controlling interest (725) (714)
Total equity 278,615 246,422
Non-current liabilities
Deferred tax liabilities 20 55,045 51,328
Finance lease commitments 21 1,561 1,072
Issued bonds 21 309,786 308,063
Other non-current liabilities 420 5,231
Total non-current liabilities 366,812 365,694
Current liabilities
Current portion of non-current liabilities 21 1,349 2,165
Payables to affiliates 354 1,186
Trade payables 15,414 18,897
Current tax liabilities 6,865 11,943
Other payables 22 42,787 45,840
Total current liabilities 66,769 80,031
Total liabilities 433,581 445,725
Total equity and liabilities 712,196 692,147
CONSOLIDATED STATEMENT OF FINANCIAL POSITION

34 WELLTEC® ANNUAL REPORT 2013 / FINANCIAL STATEMENTS
For the years ended December 31, 2013, 2012 and 2011
(USD in thousands)
Share capital
Currency translation
reserveRetained earnings
Non-control-ling interest Total
Equity at 31 December, 2011 817 58 314,630 (872) 314,633
Profit/loss for the year 0 0 24,193 158 24,351
Unrealized exchange rate adj. of foreign subsidiaries and branches 0 (3,551) 0 0 (3,551)
Total comprehensive income for the year 0 (3,551) 24,193 158 20,800
Purchase of own shares 0 0 (62,207) 0 (62,207)
Sale of own shares 0 0 4,676 0 4,676
Dividend 0 0 (34,500) 0 (34,500)
Capital increase 30 0 821 0 851
Capital decrease (60) 0 60 0 0
Share-based payment to executives 0 0 2,169 0 2,169
Other transactions (30) 0 (88,981) 0 (89,011)
Equity at 31 December, 2012 - Restated 787 (3,493) 249,842 (714) 246,422
Profit/loss for the year 0 0 20,654 (11) 20,643
Unrealized exchange rate adj. of foreign subsidiaries and
branches 0 (9,342) 0 0 (9,342)
Total comprehensive income for the year 0 (9,342) 20,654 (11) 11,301
Sale of own shares 0 0 1,416 0 1,416
Purchase of own shares 0 0 (33,202) 0 (33,202)
Capital increase 37 0 45,928 0 45,965
Capital increase cost 0 0 (1,884) 0 (1,884)
Share-based payment to executives 0 0 2,710 0 2,710
Tax credit related to share option scheme 0 0 5,887 0 5,887
Other transactions 37 0 20,855 0 20,892
Equity at 31 December, 2013 824 (12,835) 291,351 (725) 278,615
CONSOLIDATED STATEMENT OF CHANGES IN EQUITY

WELLTEC® ANNUAL REPORT 2013 FINANCIAL STATEMENTS / 35
For the years ended December 31, 2013, 2012 and 2011 (USD in thousands)
NOTE 2013Restated
2012 2011
Operating profit (EBIT) 67,705 86,149 57,004
Non-cash adjustments 10 55,149 46,606 50,043
Changes in working capital 11 (7,554) (30,376) (11,873)
Income taxes paid (16,465) (13,291) (12,279)
Other receivables, long-term 1,554 1,390 1,601
Other payables, long-term (249) 4,334 (590)
Cash flows from operating activities 100,138 94,812 83,905
Investments in intangible assets (33,818) (28,603) (28,116)
Investments in tangible assets (52,020) (43,839) (33,009)
Sale of tangible assets 442 229 (88)
Financial income received 1,241 1,004 557
Acquisition of activities (1,797) (7,464) 0
Cash flows from investing activities (85,952) (78,673) (60,656)
Financial expenses paid (30,849) (15,387) (9,311)
Other financial expenses (1,455) (10,616) (3,823)
Derivative financial instruments 0 (6,226) (1,268)
Dividend paid out to shareholders 0 (34,500) 0
Purchase of own shares (33,202) (62,207) 0
Sale of own shares 5,377 752 0
Proceeds from issued bonds 0 316,583 0
Proceeds from non-current debt 14,976 0 0
Installments on current and non-current debt (17,419) (176,850) (12,093)
Capital increase 45,965 851 0
Costs related to capital increase (1,884) 0 0
Cash flows from financing activities (18,491) 12,400 (26,494)
Increase / (decrease) in cash and cash equivalents (4,305) 28,538 (3,244)
Cash and cash equivalents at beginning of period 41,985 13,447 16,691
Exchange rate adjustment at beginning of period 1,132 0 0
Cash and cash equivalents at 31 December 38,812 41,985 13,447
CONSOLIDATED STATEMENT OF CASH FLOWS

36 WELLTEC® ANNUAL REPORT 2013 / FINANCIAL STATEMENTS
TABLE OF CONTENTS, NOTES – GROUP
1. Accounting policies . . . . . . . . . . . . . . . . . . . . . . . . . . . . . . . . . . . . . . . . . . . . . . . . . . . . . . . . . . . . . . . . . . . . . . . . . . . . . . . . . . . . . . . . . . . . . . 37
2. Critical accounting judgments and key sources of estimation uncertainty . . . . . . . . . . . . . . . . . . . . . . . . . . . . . . . . . . . . . 44
Statement of comprehensive income
3. Revenue. . . . . . . . . . . . . . . . . . . . . . . . . . . . . . . . . . . . . . . . . . . . . . . . . . . . . . . . . . . . . . . . . . . . . . . . . . . . . . . . . . . . . . . . . . . . . . . . . . . . . . . . . . 44
4. Staff costs . . . . . . . . . . . . . . . . . . . . . . . . . . . . . . . . . . . . . . . . . . . . . . . . . . . . . . . . . . . . . . . . . . . . . . . . . . . . . . . . . . . . . . . . . . . . . . . . . . . . . . . . 45
5. Depreciation, amortization and impairment losses . . . . . . . . . . . . . . . . . . . . . . . . . . . . . . . . . . . . . . . . . . . . . . . . . . . . . . . . . . . . . 48
6. Special items . . . . . . . . . . . . . . . . . . . . . . . . . . . . . . . . . . . . . . . . . . . . . . . . . . . . . . . . . . . . . . . . . . . . . . . . . . . . . . . . . . . . . . . . . . . . . . . . . . . . . 48
7. Financial income . . . . . . . . . . . . . . . . . . . . . . . . . . . . . . . . . . . . . . . . . . . . . . . . . . . . . . . . . . . . . . . . . . . . . . . . . . . . . . . . . . . . . . . . . . . . . . . . . 49
8. Financial expenses . . . . . . . . . . . . . . . . . . . . . . . . . . . . . . . . . . . . . . . . . . . . . . . . . . . . . . . . . . . . . . . . . . . . . . . . . . . . . . . . . . . . . . . . . . . . . . . 49
9. Income taxes . . . . . . . . . . . . . . . . . . . . . . . . . . . . . . . . . . . . . . . . . . . . . . . . . . . . . . . . . . . . . . . . . . . . . . . . . . . . . . . . . . . . . . . . . . . . . . . . . . . . . 50
Statement of cash flows
10. Non-cash adjustments . . . . . . . . . . . . . . . . . . . . . . . . . . . . . . . . . . . . . . . . . . . . . . . . . . . . . . . . . . . . . . . . . . . . . . . . . . . . . . . . . . . . . . . . . . . 51
11. Changes in working capital . . . . . . . . . . . . . . . . . . . . . . . . . . . . . . . . . . . . . . . . . . . . . . . . . . . . . . . . . . . . . . . . . . . . . . . . . . . . . . . . . . . . . 51
Statement of Financial position
12. Intangible assets . . . . . . . . . . . . . . . . . . . . . . . . . . . . . . . . . . . . . . . . . . . . . . . . . . . . . . . . . . . . . . . . . . . . . . . . . . . . . . . . . . . . . . . . . . . . . . . . . 52
13. Tangible assets . . . . . . . . . . . . . . . . . . . . . . . . . . . . . . . . . . . . . . . . . . . . . . . . . . . . . . . . . . . . . . . . . . . . . . . . . . . . . . . . . . . . . . . . . . . . . . . . . . . 54
14. Investments in subsidiaries . . . . . . . . . . . . . . . . . . . . . . . . . . . . . . . . . . . . . . . . . . . . . . . . . . . . . . . . . . . . . . . . . . . . . . . . . . . . . . . . . . . . . . 55
15. Investments in associates . . . . . . . . . . . . . . . . . . . . . . . . . . . . . . . . . . . . . . . . . . . . . . . . . . . . . . . . . . . . . . . . . . . . . . . . . . . . . . . . . . . . . . . . 56
16. Inventories . . . . . . . . . . . . . . . . . . . . . . . . . . . . . . . . . . . . . . . . . . . . . . . . . . . . . . . . . . . . . . . . . . . . . . . . . . . . . . . . . . . . . . . . . . . . . . . . . . . . . . . 56
17. Trade receivables . . . . . . . . . . . . . . . . . . . . . . . . . . . . . . . . . . . . . . . . . . . . . . . . . . . . . . . . . . . . . . . . . . . . . . . . . . . . . . . . . . . . . . . . . . . . . . . . 57
18. Prepayments . . . . . . . . . . . . . . . . . . . . . . . . . . . . . . . . . . . . . . . . . . . . . . . . . . . . . . . . . . . . . . . . . . . . . . . . . . . . . . . . . . . . . . . . . . . . . . . . . . . . . 58
19. Share capital . . . . . . . . . . . . . . . . . . . . . . . . . . . . . . . . . . . . . . . . . . . . . . . . . . . . . . . . . . . . . . . . . . . . . . . . . . . . . . . . . . . . . . . . . . . . . . . . . . . . . 58
20. Deferred tax assets and liabilities . . . . . . . . . . . . . . . . . . . . . . . . . . . . . . . . . . . . . . . . . . . . . . . . . . . . . . . . . . . . . . . . . . . . . . . . . . . . . . . . 59
21. Current and non-current financial liabilities . . . . . . . . . . . . . . . . . . . . . . . . . . . . . . . . . . . . . . . . . . . . . . . . . . . . . . . . . . . . . . . . . . . . 60
22. Other payables . . . . . . . . . . . . . . . . . . . . . . . . . . . . . . . . . . . . . . . . . . . . . . . . . . . . . . . . . . . . . . . . . . . . . . . . . . . . . . . . . . . . . . . . . . . . . . . . . . 63
Other
23. EBITDA reconciliation . . . . . . . . . . . . . . . . . . . . . . . . . . . . . . . . . . . . . . . . . . . . . . . . . . . . . . . . . . . . . . . . . . . . . . . . . . . . . . . . . . . . . . . . . . . . 63
24. Fees to auditor appointed at the Annual General Meeting . . . . . . . . . . . . . . . . . . . . . . . . . . . . . . . . . . . . . . . . . . . . . . . . . . . . 63
25. Assets charged and contingent liabilities . . . . . . . . . . . . . . . . . . . . . . . . . . . . . . . . . . . . . . . . . . . . . . . . . . . . . . . . . . . . . . . . . . . . . . . 64
26. Operating lease commitments . . . . . . . . . . . . . . . . . . . . . . . . . . . . . . . . . . . . . . . . . . . . . . . . . . . . . . . . . . . . . . . . . . . . . . . . . . . . . . . . . . 64
27. Financial instruments . . . . . . . . . . . . . . . . . . . . . . . . . . . . . . . . . . . . . . . . . . . . . . . . . . . . . . . . . . . . . . . . . . . . . . . . . . . . . . . . . . . . . . . . . . . . 65
28. Related parties . . . . . . . . . . . . . . . . . . . . . . . . . . . . . . . . . . . . . . . . . . . . . . . . . . . . . . . . . . . . . . . . . . . . . . . . . . . . . . . . . . . . . . . . . . . . . . . . . . . 68
29. Business combinations . . . . . . . . . . . . . . . . . . . . . . . . . . . . . . . . . . . . . . . . . . . . . . . . . . . . . . . . . . . . . . . . . . . . . . . . . . . . . . . . . . . . . . . . . . 69
30. Events after the balance sheet date . . . . . . . . . . . . . . . . . . . . . . . . . . . . . . . . . . . . . . . . . . . . . . . . . . . . . . . . . . . . . . . . . . . . . . . . . . . . . 70

WELLTEC® ANNUAL REPORT 2013 FINANCIAL STATEMENTS / 37
NOTES
Basis of accounting
The consolidated financial statements for 2013 are presented in ac-
cordance with International Financial Reporting Standards (‘IFRS’) as
adopted by the EU and additional Danish disclosure requirements
for annual reports of reporting class C (large) enterprises. Please see
the Danish Executive Order on IFRS adoption issued in accordance
with the Danish Financial Statement Act.
The consolidated financial statements are presented in thousands
of US dollar (USD), which is regarded as the primary currency in
relation to the group’s activities and the functional currency of the
parent company.
The consolidated financial statements have been prepared on the
historical cost basis, except for certain derivative financial instru-
ments which are measured at fair value. The principal accounting
policies adopted are set out below.
The consolidated financial statements are presented in accordance
with the new and revised standards (IFRS/IAS) and Interpretations
(IFRIC) which apply for the financial year
Future IFRS changes
At the date of the publication of these consolidated financial state-
ments, a number of new and amended standards and interpreta-
tions have not yet entered into force or have not yet been adopted
by the EU. Therefore, they are not incorporated in the consolidated
financial statements.
None of the new standards or amendments of existing standards
are expected to have a material impact on future consolidated fi-
nancial statements.
Change in accounting policies as a result of change in presen-
tation currency
Management has decided to change the presentation currency of
its consolidated financial statements to USD in order to best repre-
sent the core business performance and its underlying exposures.
This is both from an operational and a capital structure perspective.
In addition this accommodates requests from investors and serves
to make the consolidated financial statements more comparable
within Welltec’s peer group.
Restatement as a result of change in functional currency
At the same time, Management has reconsidered the group’s func-
tional currency. For most of the foreign operations the functional
currency continues to be the local currency. However, for the Danish
operation and operations in some other countries our assessment is
that USD is the functional currency.
In evaluating the functional currency of the Danish operation, rev-
enue and the principal source of financing have been considered
the determining factors, whereas historically the cost base was con-
sidered the most significant factor. On that basis Management has
assessed that USD is the functional currency of the Danish opera-
tion and the operations in some other countries. Management has
identified the issuance of USD bonds in the beginning of 2012 as
the main event triggering the change in functional currency from
DKK to USD, and consequently the change in functional currency
is deemed to have taken place at that date. All financial statements
in 2012 and 2013 for the relevant operations have been restated to
USD effective 1 January 2012.
Effect of the changes in presentation and functional currency
The primary effect of the changes is elimination of significant vola-
tility in the income statement due to unrealized foreign exchange
gains or losses related to revenue and USD denominated bond debt,
as these are now denominated in the functional currency of relevant
operations and bonds issued.
1. ACCOUNTING POLICIES
2012 2013 Development in %
(Amounts in thousands) DKK USD DKK USD DKK USD
Operating profit (EBIT) before special items 492,251 86,149 383,010 67,705 (22.2) (21.4)
Profit before tax 263,421 47,888 311,805 41,530 18.4 (13.3)
Net profit for the year 128,783 24,351 196,682 20,643 52.7 (15.2)
Equity 1,442,523 246,422 1,496,555 278,615 3.7 13.1
Return on equity 13.38% 7.86%
The main changes can be disclosed as the following:

NOTES
38 WELLTEC® ANNUAL REPORT 2013 / FINANCIAL STATEMENTS
Recognition and measurement
Assets are recognized in the statement of financial position if it is
probable that future financial benefits will flow to the group and
the value of the asset can be measured reliably.
Liabilities are recognized in the statement of financial position if
they are probable and can be measured reliably. On initial recogni-
tion assets and liabilities are measured at cost or fair value. Sub-
sequently assets and liabilities are measured as described for each
item bellow.
Income is recognized in the statement of comprehensive income
as earned and includes value adjustments of financial assets and
liabilities measured at fair value or amortized cost.
Consolidated financial statements
The consolidated financial statements comprise the parent com-
pany and the group enterprises (subsidiaries) that are controlled
by the parent company, see group chart on page 85. Control is
achieved where the parent company, either directly or indirectly,
holds more than 50% of the voting rights or in any other way pos-
sibly or actually exercises controlling influence over a subsidiary. If
the parent company holds less than 50% of the share capital, con-
trol exists when the parent company under agreement has more
than 50% of the voting rights, has the power to govern financial
and operating policies of the subsidiary, to appoint members of the
Board of Directors or to cast the majority of votes at meetings of
the Board of Directors of the subsidiary.
Basis of consolidation
The consolidated financial statements are prepared on the basis of
the financial statements of the parent company and its subsidiar-
ies, which are all prepared in accordance with the group’s account-
ing policies. Upon consolidation, intra group income and expenses,
balances, investments and dividends as well as profits and losses on
transactions between the consolidated enterprises are eliminated.
Subsidiaries’ financial statement items are recognized in full in the
consolidated financial statements. Non-controlling interests’ pro
rata share of profit/loss and equity is shown as separate line items
in the statement of comprehensive income and in the group’s eq-
uity, respectively.
Business combinations
Newly acquired or newly established enterprises are recognized in
the consolidated financial statements from the date of acquisition.
The date of acquisition is when the parent company obtains control
of the company. Divested or wound-up enterprises are recognized
in profit or loss up to the time of their divestment or winding-up.
The purchase method is applied to the acquisition of new enterpris-
es. According to this method, identifiable assets, including separa-
ble intangible assets, liabilities and contingent liabilities of acquired
enterprises are measured at fair value at the acquisition date. Non-
current assets acquired for the purpose of resale, however, are mea-
sured at fair value less anticipated selling costs. Restructuring costs
are only recognized in the pre-acquisition statement of financial po-
sition if they constitute a liability for the acquired enterprise. If there
is a tax effect, a corresponding asset or liability is booked. If the final
determination of the consideration is conditional upon one or sev-
eral future events, the value thereof will be recognized at fair value
at the date of acquisition. Changes to contingent considerations
are recognized in the profit or loss. Costs directly attributable to the
business combination are recognized in the profit or loss.
Positive differences (goodwill) between cost of the enterprise ac-
quired and the fair value of the assets, liabilities and contingent li-
abilities acquired are recognized as an asset under intangible assets
and are tested for impairment at least once a year. If the carrying
amount of goodwill is higher than its recoverable amount, it is writ-
ten down to this lower recoverable amount.
Foreign currency translation
On initial recognition, transactions denominated in foreign curren-
cies are translated at the transaction date exchange rate. Receiv-
ables, payables and other monetary items denominated in foreign
currencies that have not been settled at the end of the reporting
period are translated using the exchange rate at the end of the re-
porting period. Exchange differences that arise between the rate at
the transaction date and the exchange rate effective at the payment
date or the exchange rate at the end of the reporting period are
recognized in statement of comprehensive income as financial in-
come or financial expenses. Property, plant equipment fleet, intan-
gible assets, inventories and other non-monetary assets purchased
in foreign currencies and measured on the basis of historical cost are
translated at the transaction date exchange rate. If non-monetary
items are restated at fair value, they are translated using the ex-
change rate at the date of restatement.
When foreign subsidiaries that use a functional currency different
from USD are recognized in the consolidated financial statements,
the statement of comprehensive income is translated at average ex-
change rates on a monthly basis unless such rates vary significantly
from the actual exchange rates at the transaction dates. In the latter

WELLTEC® ANNUAL REPORT 2013 FINANCIAL STATEMENTS / 39
NOTES
case, the actual exchange rates are used. Statement of financial po-
sition items is translated using the exchange rates at the end of the
reporting period. Goodwill is considered to belong to the relevant
entity acquired and is translated using the exchange rate at the end
of the reporting period.
Exchange differences resulting from the translation of foreign enti-
ties’ equity at the beginning of the year using the end of the report-
ing period exchange rates and by translating statements of com-
prehensive income from average exchange rates to the exchange
rates at the end of the reporting period are recognized in other
comprehensive income. Similarly, exchange differences resulting
from changes made in a foreign entity’s other comprehensive in-
come are also taken to other comprehensive income.
Exchange adjustments on receivables from, or payables to, subsid-
iaries that are considered part of the parent company’s total invest-
ment in the subsidiary in question, are also recognized in other
comprehensive income.
When foreign subsidiaries that use USD as their functional curren-
cy but present their financial statements in another currency are
recognized in the consolidated financial statements, monetary as-
sets and liabilities are translated using the end of the reporting pe-
riod exchange rate. Non-monetary assets and liabilities measured
on the basis of historical cost are translated using the transaction
date exchange rate. Non-monetary items measured at fair value
are translated at the exchange rate at the time of the last fair value
adjustment.
The items in profit or loss are translated at average exchange rates
on a monthly basis, with the exception of items deriving from non-
monetary assets and liabilities, which are translated using the his-
torical rates applicable to the relevant non-monetary assets and
liabilities.
Derivative financial instruments
On initial recognition, derivative financial instruments are measured
at fair value. Directly attributable expenses related to the purchase
or issue of a derivative financial instrument are expensed.
Subsequent to initial recognition, derivative financial instruments
are measured at fair value at the end of the reporting period with-
changes in fair value recognized directly in profit or loss as financial
income or financial expenses.
The group does not apply hedge accounting to its derivatives finan-
cial instruments
Share-based payment
Share based incentive arrangements under which employees can
only opt to receive new shares in Welltec International ApS (equity
arrangements) are measured at the equity instruments’ fair value
at the grant date and are recognized in profit or loss under staff
costs over the vesting period. The related set-off entry is recog-
nized in equity.
Income taxes and deferred tax
The Welltec group’s Danish subsidiaries are jointly taxed with the
principal shareholder JH Holding Allerød, ApS. The current Danish
income tax is allocated among the jointly taxed companies in por-
tion to their taxable income (full allocation subject to reimburse-
ment in respect of tax losses).
Tax for the year consists of current tax for the year and changes in
deferred tax. The portion of tax attributable to profit is recognized
in the income statement, and the portion of tax attributable to en-
tries directly in other comprehensive income is recognized in other
comprehensive income. The portion of tax attributable to equity
transactions is recognized in equity.
The current tax payable or receivable is recognized in the state-
ment of financial position, computed as tax calculated on the tax-
able income for the year, adjusted for prepaid tax.
The current tax charge for the year is calculated based on the tax
rates and tax legislation in each country applicable at the balance
sheet date.
Deferred tax is recognized on all temporary differences between
carrying values and tax-based values of assets and liabilities, except
from deferred tax on all temporary differences on initial recogni-
tion of goodwill or on initial recognition of a transaction that is not
a business combination, and for which the temporary difference
found at the time of initial recognition neither affects profit nor
loss for the year nor taxable income.
Deferred tax is calculated based on the expected use of each asset
and the settlement of each liability, respectively.
Deferred tax is measured at the tax rates that are expected to ap-
ply to the period when the asset is realized or the liability settled,
based on the tax rates and tax legislation that have been enacted
or substantively enacted in the respective countries on the bal-
ance sheet date. Changes in deferred tax resulting from changed
tax rates or tax rules are recognized in profit or loss, unless the

NOTES
40 WELLTEC® ANNUAL REPORT 2013 / FINANCIAL STATEMENTS
deferred tax is attributable to items previously recognized in other
comprehensive income or in equity. If so, such changes are also rec-
ognized in other comprehensive income or in equity.
Exchange adjustments on deferred tax are recognized as part of the
year’s adjustment in deferred tax.
Changes in local tax rates, affecting deferred tax, are used and thus
affecting the value of the calculated deferred tax asset, alterna-
tively deferred tax liability at year end.
Deferred tax assets, including the tax base of tax loss carry for-
wards, are recognized in the statement of financial position at their
estimated realizable value, either as a set-off against deferred tax
liabilities or as net tax assets for set-off against future positive tax-
able income. At the end of each reporting period, it is reassessed
whether sufficient taxable income is probable to arise in the future
for the deferred tax asset to be used.
Balances calculated according to the rules on interest deductibility
limitations in the Danish Corporate Income Tax Act are allocated
according to a joint taxation agreement between the companies
that are subject to deductibility limitation in proportion to their
share of the total limitation. Deferred tax liabilities in respect of
these balances are recognized in the statement of financial posi-
tion; whereas deferred tax assets are recognized only of the criteria
for recognition of deferred tax assets are met.
Statement of comprehensive income
Revenue
The group provides multiple solutions to oil and gas companies
around the world at their onshore and offshore locations using pro-
prietary remote control precision robotic equipment that Welltec®
designs and manufactures.
Provision of services is recognized in revenue when the work is
performed or when the agreed service is provided. Revenue from
sales of products is recognized in the income statement if delivery
and transfer of risk to the buyer have taken place before year end,
and if the income can be reliably measured and is expected to be
received.
Revenue is measured at fair value of the consideration received
or receivable. If an interest-free credit has been arranged for pay-
ment of the consideration receivable that is longer than the usual
credit period, the fair value of the consideration is determined by
discounting future payments receivable. The difference between fair
value and nominal amount of the consideration is recognized as
financial income in profit or loss by applying the effective interest
method.
Revenue is recorded net of VAT, duties, etc. collected on behalf of
a third party.
In addition, income from the sale of development projects is con-
sidered part of the group’s activities and therefore is recognized as
revenue.
Cost of services provided
Cost of services provided comprises direct and indirect expens-
es incurred to realize revenue including salaries, depreciation and
amortization.
Development and manufacturing costs
Development and manufacturing costs comprise all development
and engineering costs that are not capitalized.
Administrative and sales costs
Administrative and sales costs comprise costs required to sustain the
business including finance, IT, legal, HR and other overhead.
Special items
Special items consist of costs of a special nature in relation to the ac-
tivities of the group, including costs of structural changes and oth-
er significant amounts of a one-off nature. These items are shown
separately to facilitate the comparability of the profit or loss and
provide a better picture of the operational results.
Financial income and expenses
These items comprise interest income and expenses, the interest
portion of finance lease payments, realized and unrealized capital
gains and losses on payables and transactions in foreign currencies,
amortization premium/allowance on mortgage debt, etc. as well as
tax interest.
Statement of financial position
Intangible assets
Goodwill
Upon initial recognition, goodwill is recognized in the statement of
financial position and measured as the difference between cost of
the enterprise acquired and the fair value of the assets, liabilities and
WELLTEC® ANNUAL REPORT 2013 FINANCIAL STATEMENTS / 41
NOTES
contingent liabilities acquired.
When goodwill is recognized, the goodwill amount is distributed
on those of the group’s activities generating separate payments
(cash-generating units). Determination of cash-generating units
follows the management structure and internal finance manage-
ment and reporting of the group.
Subsequently, goodwill is measured at cost less accumulated write
downs. There is no amortization of goodwill but the carrying value
of goodwill is tested for impairment at least once a year togeth-
er with the other long-term assets in the cash-generating unit to
which the goodwill is allocated. It is written down to recoverable
amount in profit or loss if the accounting value exceeds the recov-
erable amount, this representing the higher of the fair value of the
asset less expected disposal costs and the value in use. The recov-
erable amount is generally determined as the present value of the
expected future net cash flows from the cash-generating unit to
which the goodwill is allocated. Impairment losses of goodwill are
stated in profit or loss under amortization and impairment losses of
intangible assets.
Development projects
Development projects on clearly defined and identifiable service
equipment and processes are recognized as intangible assets if it is
probable that the service equipment or process will generate future
financial benefits for the group, and the development costs of each
asset can be measured reliably. Other development costs are recog-
nized as costs in the profit or loss as incurred.
On initial recognition, development costs are measured at cost.
The cost of development projects comprises costs such as salaries,
amortization/depreciation and other indirect costs that are directly
attributable to the development projects (e.g. field tests) and are
needed to complete the project, calculated from the time at which
the development project first meets the specific criteria for being
recognized as an asset.
Completed development projects are amortized on a straight-line
basis using the estimated useful lives of the assets. The amortiza-
tion period is usually 5 years, but in certain cases it may be up to
20 years if the longer amortization period is considered to better
reflect the group’s benefit from the developed product, etc. For
development projects protected by intellectual property rights, the
maximum amortization period is the remaining duration of the rel-
evant rights, however, no more than 20 years.
Development projects and other intangible assets are written
down to recoverable amount. Development projects in progress
are tested at least once a year for impairment. Borrowing costs to
finance the investments in development projects are recognized in
cost of these assets if such expenses relate to qualifying assets for
which their development period last longer than 12 months. Other
borrowing costs are included in finance expenses in the statement
of comprehensive income.
Other intangible assets
Acquired intellectual property rights in the form of patents and
licenses are measured at cost less accumulated amortization and
impairment losses. Patents are amortized over their remaining du-
ration, usually 5 years, and licenses are amortized over the term of
the agreement. If the actual useful life is shorter than the remain-
ing duration and the term of the agreement, respectively, amorti-
zation is made over such shorter useful life.
Separable intangible assets acquired through business combina-
tions are brand, customer relationship and technology. Brand is not
amortized as the useful life is considered indefinite. Customer rela-
tionship is amortized on a straight-line basis over its estimated use-
ful life of 10 years. Technology is amortized on a straight-line basis
over its estimated useful life of 10 to 20 years.
Tangible assets
Land and buildings, plant and machinery as well as other fixtures
and fittings, tools and equipment are measured at cost less ac-
cumulated depreciation and impairment losses. Land is not
depreciated.
Cost comprises the acquisition price, costs directly attributable to
the acquisition and preparation costs of the asset until the time
when it is ready to be put into operation. For assets manufactured
and owned by the group, cost comprises expenses directly attrib-
utable to the manufacture of the asset, including materials, com-
ponents, sub-suppliers and labor costs. In the year when the tool
is completed and ready to generate income for the company, it
is recognized under ‘Plant equipment and fleet’. During construc-
tion, the asset is recognized under ‘Plant equipment and fleet un-
der construction’.
Interest expenses on loans to finance the investments in tangible
assets are recognized in cost of these assets if such expenses relate
to qualifying assets for which their production period lasts longer
than 12 months. Other borrowing costs are taken to finance ex-
penses in the statement of comprehensive income.

NOTES
42 WELLTEC® ANNUAL REPORT 2013 / FINANCIAL STATEMENTS
For assets held under finance leases, cost is measured as the lower
of the asset’s fair value or present value of future lease payments.
The basis of depreciation is cost less estimated residual value after
the end of useful life. The residual value is the estimated amount
that would be earned if selling the asset today net of selling costs if
the asset is of an age and a condition that is expected after the end
of useful life Straight-line depreciation is made on the basis of the
following estimated useful lives of the assets:
Buildings: 50 years
Leasehold improvements: 3-10 years
Plant equipment and fleet: 3-10 years
Other fixtures and fittings, tools and equipment: 3-5 years
Depreciation methods, useful lives and residual amounts are reas-
sessed annually.
Property, plant equipment and fleet are written down to the lower
of recoverable amount and carrying amount.
Impairment of property, plant equipment and fleet and intangible
assets
The carrying amounts of property, plant equipment and fleet and
intangible assets with definite useful lives are tested at the end of
the reporting period for any indication of impairment. If impaired,
the recoverable amount of the asset is estimated to determine the
need for any write-down and the extent thereof.
The recoverable amount of intangible assets with indefinite use-
ful lives, development projects in progress, brand and goodwill
is estimated annually irrespective of any recorded indications of
impairment.
If the asset does not generate cash flows separately from other as-
sets, an estimate is made of the recoverable amount of the smallest
cash-generating unit of which the asset forms part.
The recoverable amount is calculated as the higher of the asset’s
and the cash-generating unit’s fair value less selling costs and net
present value. When the net present value is determined, estimat-
ed future cash flows are discounted at present value using a dis-
count rate that reflects current market estimates of the value of
money in terms of time, as well as the particular risks related to the
asset and the cash-generating unit, respectively, and for which no
adjustment is made in the estimated future cash flows.
If the recoverable amount of the asset or the cash-generating unit is
estimated to be lower than the carrying amount, the asset is written
down to this lower recoverable amount. For cash-generating units,
write-down is allocated in such a way that goodwill amounts are
written down first and then any remaining need for write-down is
allocated to other assets of the unit, however, the individual asset is
not written down to an amount that is lower than its fair value net
of estimated selling costs.
Impairment losses are recognized in the profit or loss. In case of any
subsequent reversals of impairment losses resulting from change in
assumptions of the estimated recoverable value, the carrying values
of the asset and the cash-generating unit, respectively, are increased
to the adjusted estimate of the recoverable value, however, no more
than the carrying value which the asset or the cash-generating unit
would have had if the write-down had not been performed. Impair-
ment losses of goodwill are not reversed.
Profits or losses from the sale of property, plant equipment and fleet
are calculated as the difference between selling price less selling
costs and carrying value at the time of sale. Profits or losses are
recognized in the statement of comprehensive income if the selling
price differs from the carrying amount.
Financial assets
Other receivables
Other receivables with a fixed maturity are measured at amortized
cost, less any impairment.
Current assets
Inventories
Inventories are measured at cost according to the FIFO method. The
cost of finished goods and work in progress includes direct and indi-
rect production costs. Inventories are written down to net realizable
value if it is lower than the cost price.
Trade receivables
On initial recognition, trade receivables are measured at fair value
and subsequently at amortized cost, which usually equals nominal
amount less bad debt provisions.
Prepayments
Prepayments comprise incurred costs relating to subsequent finan-
cial years. Prepayments are measured at cost.

WELLTEC® ANNUAL REPORT 2013 FINANCIAL STATEMENTS / 43
NOTES
Liabilities
Other provisions
Other provisions are recognized when the group has a legal or con-
structive obligation as a result of past events in the financial year or
prior years, and it is probable that settlement of such obligation will
lead to an outflow of the company’s financial resources.
Lease commitments
Lease commitments relating to assets held under finance leases are
recognized in the statement of financial position as liabilities other
than provisions, and, at the time of inception of the lease, mea-
sured at the lower of the lease asset’s fair value and the present
value of future lease payments. Subsequent to initial recognition,
lease commitments are measured at amortized cost. The difference
between the present value and nominal amount of the lease pay-
ments is recognized in profit or loss as a financial expense over the
term of the leases.
Lease payments on operating leases are recognized on a straight-
line basis in profit or loss over the term of the lease.
Other financial liabilities
On initial recognition, other liabilities, including issued bond loans,
bank loans and trade payables, are measured at fair value. Subse-
quently, these liabilities are measured at amortized cost applying
the effective interest method to the effect that the difference be-
tween proceeds and nominal amount is recognized in profit or loss
as a financial expense over the term of the loan.
Pension obligations
The group has entered into pension agreements with certain
groups of employees, which are classified as defined contribution
pension plans.
Periodical payments to defined contribution pension plans are rec-
ognized in profit or loss at the due date, and any contributions
payable are recognized in the statement of financial position under
liabilities.
Statement of cash flows
The group’s statement of cash flows is presented using the indi-
rect method and shows cash flows from operating, investing and
financing activities as well as the group’s cash and cash equivalents
at the beginning and end of the financial year.
Cash flows from operating activities are calculated as EBIT adjusted
for non-cash operating items, working capital changes and income
taxes paid. In the adjustment for non-cash operating items, depre-
ciations and amortizations capitalized on tangible and intangible
assets are included.
Cash flows from investing activities comprise payments in connec-
tion with the acquisition and divestment of enterprises, tangible
fixed asset investments, and purchase, development, improvement
and sale, etc. of intangible assets, and property, plant equipment
and fleet. Depreciations and amortizations capitalized on tangi-
ble and intangible assets are included in cash-flow from investing
activities.
If any, cash flows from acquired and divested enterprises are shown
as separate line items within cash flows from investing activities.
Cash flows related to acquired enterprises are recognized in the
statement of cash flow from their date of acquisition, and cash
flows from divested enterprises are recognized up to the date of
sale.
Cash flows from financing activities comprise financial expenses
paid and changes in the size or composition of the parent com-
pany’s share capital and related costs, the raising of loans, instal-
ments on interest-bearing debt, purchase of treasury shares, and
payment of dividends.
Cash and cash equivalents comprise cash.
Ratios
The following ratios are compiled in accordance with Recommen-
dations & Ratios 2010 issued by the Danish Society of Financial
Analysts and generally accepted calculation formulas.
EBIT margin before
special items = Operating profit/loss [EBIT] before special items x 100
Revenue
EBITDA margin = Operating profit before depreciation and amortization x 100
Revenue
Return on equity = Net profit/loss for the year x 100
Average equity
ROIC excl. goodwill EBITA
Average capital investment excl. goodwill
* See definition on page 6

NOTES
44 WELLTEC® ANNUAL REPORT 2013 / FINANCIAL STATEMENTS
Geographical information
The group’s revenue is divided into the following geographic areas:
3. REVENUE
3.1 Segment information
Based on IFRS 8 Operating Segment, it is considered if the group has more than one operating segment. The internal monthly manage-
ment reporting follows the group’s accounting policies. The management group of Welltec International ApS constitutes the chief operat-
ing decision maker of Welltec International ApS.
The internal monthly management reporting is focused on group level as a whole, including revenue divided into geographical areas. It
has been determined that Welltec International ApS only has one reporting segment.
2. CRITICAL ACCOUNTING JUDGMENTS AND KEY SOURCES OF ESTIMATION UNCERTAINTY
The determination of carrying values and preparation of the annual report build upon estimates made by Management of the likely effect
of future events on the value of plant equipment and fleet and development projects. In addition Management has determined fair value
of separable intangible assets acquired through business combination, including impairment test of goodwill and other intangible assets.
The estimates used build upon assumptions which, in the opinion of Management, are valid albeit inherently uncertain and unpredictable.
An assessment is made of the possibility of recovering the carrying value of intangible and tangible assets. The assessment of recoverable
amounts is based upon estimated returns generated by those assets in the cash-generating unit. Refer to the additional information and
amounts disclosed in the notes to the consolidated financial statements.
Only an insignificant part of the group’s revenue is generated in Denmark.
Information on major customers:
Out of total revenue for 2013, USD 52 million (2012: USD 51 million, 2011: USD 48 million) is derived from one customer.
Non-current assets
The group’s non-current assets are divided into the following geographic areas:
(USD in thousands)2013
Restated 2012 2011
Europe, Middle East, Africa and Russia/CIS (EMEAR) 169,523 152,308 124,166
Americas 111,925 107,051 85,188
Asia Pacific 39,717 36,028 19,869
Total revenue 321,165 295,387 229,223
(USD in thousands)2013
Restated 2012 2011
Denmark 546,358 519,325 499,223
Other countries 23,038 24,679 14,631
Total non-current assets 569,396 544,004 513,854

WELLTEC® ANNUAL REPORT 2013 FINANCIAL STATEMENTS / 45
NOTES
Defined contribution plans
The group operates pension schemes that cover certain groups of employees in Denmark and abroad. Those pension schemes take the
form of defined contribution plans. Welltec® arranges for the regular payment (e.g. a fixed amount or a fixed percentage of the salary)
of premiums to independent insurers who are responsible for the pension commitments. Once Welltec® has made payments of the con-
tribution under the defined contribution pension plans, Welltec® has no further pension commitments related to employees or former
employees.
Remuneration to members of the Executive Board, Board of Directors and other Key management personnel
The total remuneration of the Executive Board and Board of Directors of the Welltec International ApS group, including bonus, pension,
other security costs and share based payments can be specified as follows:
The total remuneration of other Key management personnel of Welltec International ApS group, including bonus, pension, other social
security costs and share based payments can be specified as follows:
(USD in thousands)
2013Restated
2012 2011
Short-term staff benefits 905 866 843
Pension benefits 89 95 101
Share-based payments 16 104 2,057
Total remuneration to Executive Board and Board of Directors 1,010 1,065 3,001
(USD in thousands)2013
Restated 2012 2011
Breakdown of staff costs:
Wages and salaries 122,165 105,250 84,514
Share-based payment to executives 2,710 2,169 6,251
Payment to defined contribution pension plans 3,448 2,758 2,589
Other social security costs 6,258 6,090 4,820
Total staff costs 134,581 116,267 98,174
Recognition of staff costs:
Cost of services provided 72,274 61,257 47,676
Development and manufacturing costs capitalized 20,026 15,908 15,133
Administrative costs 42,281 39,102 35,365
Total staff costs 134,581 116,267 98,174
Number of employees:
Average number of employees 1,055 916 730
4. STAFF COSTS
(USD in thousands)
2013Restated
2012 2011
Short-term staff benefits 4,775 5,598 2,661
Pension benefits 90 89 57
Share-based payments 623 1,020 1,122
Total remuneration to other Key management personnel 5,488 6,707 3,840

NOTES
46 WELLTEC® ANNUAL REPORT 2013 / FINANCIAL STATEMENTS
Incentive programs
The group operates incentive schemes in the form of warrants (Equity-settled) to the Board of Directors of Welltec International ApS,
Executive Board of Welltec A/S, certain senior executives (VPs) and other key personnel in the Welltec group. The purpose is to retain and
motivate the said persons. The schemes are based on the shares of Welltec International ApS, and the warrants have no voting rights
attached.
In 2005, Welltec Holding ApS issued 80,080 warrants to the Executive Board of Welltec A/S. The issued warrants were exercised in 2012.
In 2006, Welltec Holding ApS issued 105,820 warrants to senior executives (VPs) in the Welltec group. The warrants vested over an em-
ployment period until 2009. If employment ceased before a warrant is vested, the warrant would be reduced proportionally. The warrant
scheme is exercisable not earlier than 1 year (for warrants that vest first), and not later than 9 years, after the grant date.
In 2007, Welltec International ApS took over from Welltec Holding ApS 185,900 warrants issued to the Executive Board of Welltec A/S
and senior executives (VPs) in the Welltec group. This number of warrants was converted to 400,052 warrants in Welltec International ApS
and the exercise price was adjusted accordingly.
In 2009 a new warrants scheme to Key management personnel was granted. The warrant scheme consists of 68,000 warrants vested over
an employment period until 2012. The warrants are exercisable not earlier than 3 years and not later than 6 years after the grant date.
The total fair value of these warrants was at grant date USD 229 thousand of which USD 115 thousand was recognized in the statement
of comprehensive income in 2009, USD 84 thousand in 2010 and USD 30 thousand in 2011.
In November 2011, new warrants schemes to the Board of Directors, the Executive Board of Welltec group and Key management person-
nel were granted. The warrant schemes consist of 290,850 warrants of which 50,000 warrants did not have any vesting conditions, and
the remaining warrants vest over an employment period between one and four years until the end of 2014. The total fair value of these
warrants was at grant date USD 8.5 million of which USD 5.9 million was recognized in statement of comprehensive income in 2011, USD
2.3 million was recognized in the statement of comprehensive income in 2012 and USD 0.3 million in 2013. The fair value of the war-
rants schemes at grant date was calculated on the basis of the Black-Scholes model. The calculation for the 2011 schemes is based on an
expected volatility of 33%, a risk-free interest rate at 0.85%, a share price of USD 143 before deducting an estimated illiquidity discount,
the exercise price, an average option life of 60 month and no annual payment of dividends. The expected volatility has been determined
using a historical volatility for a five-year period for comparable listed companies adjusted for a small-cap factor.
In September 2013 warrants schemes to the Key management personnel was granted. The warrant schemes consist of 50,800 warrants
and vest over an employment period between one and four years until the end of 2016. The total fair value of these warrants was at grant
date USD 3.7 million of which USD 2.4 million was recognized in the statement of comprehensive income in 2013. The fair value of the
warrants schemes at grant date was calculated on the basis of the Black-Scholes model. The calculation for the 2013 schemes is based on
an expected volatility of 45%, a risk-free interest rate at 0.01%, a share price of USD 174-309, the exercise price, an average option life
of 36 month and no annual payment of dividends. The expected volatility has been determined using a historical volatility for a five-year
period for comparable listed companies adjusted for a small-cap factor.
In the event of an IPO or certain changes in the ownership structure (e.g. listing or sale of the company) all warrants will vest and become
exercisable.
As a result of the dividend distribution in 2012, the exercise prices of outstanding warrant schemes from 2011 and before, were adjusted
in 2012 to avoid a dilution of the fair values of those warrants. The new exercise prices were adjusted to ensure that the fair values before
and after the dividend pay-out were the same. Therefore these adjustments had no effect on the consolidated financial statements in
2012.
The following schemes were in existence during the current and prior year:

WELLTEC® ANNUAL REPORT 2013 FINANCIAL STATEMENTS / 47
NOTES
The following reconciles the warrants outstanding at the beginning and at the end of the year:
NUMBER OF WARRANTSBoard of Directors
of Welltec Interna-
tional ApS
Executive Board of
Welltec A/S
Senior executives
and key management
personnel Total
Weighted average exercise
price USD 3)
Balance at 01.01.2011 0 172,331 264,948 437,279 13
Granted 10,000 50,000 230,850 290,850 123
Balance at 31.12.2011 10,000 222,331 495,798 728,129 56
Forfeited 0 0 (1,800) (1,800) 175
Exercised 0 (172,331) (55,537) (227,868) 6
Balance at 31.12.2012 10,000 50,000 438,461 498,461 69
Granted 0 0 50,800 50,800 239
Forfeited 0 0 (4,000) (4,000) 171
Balance at 31.12.2013 10,000 50,000 485,261 545,261 88
Exercisable at 31.12.2011 3,333 222,331 315,731 541,395 29
Exercisable at 31.12.2012 6,666 50,000 327,612 384,278 50
Exercisable at 31.12.2013 10,000 50,000 416,859 476,859 69
3) The exercise prices in 2012 are adjusted for the dilution impact from dividend paid in 2012. The weighted average remaining contractual life and range of exercise price of outstanding warrants was 30 months and a price of USD 0,18 - 295 (adjusted for dilution impact) at December 31, 2013, 39 months and a price of USD 0,18-181 at December 31, 2012 and 48 months and a price of USD 0,18 -181 at December 31, 2011.
The total expense recognized in the statement of comprehensive income for all warrants schemes amounted to USD 2,710 thousand for 2013 from all warrants schemes. The total expense recognized in the statement of comprehensive income for all warrants schemes amounted to USD 2,169 thousand in 2012 and USD 6,251 thousand in 2011.
Warrant schemeNumber
exercisedExercise
date
Weighted average
share price at exercise
date USD
Granted in 2005 172,331 Mar. 2012 143
Granted in 2006 30,773 Aug. 2009 143
Granted in 2006 49,237 Dec. 2012 143
Granted in 2011 6,300 Dec. 2012 143
Warrant scheme Number1) Grant date Vesting date Expiry date
Exercise price per warrant
USD 2)
Fair value per warrant
at grant date USD
Outstanding at
31.12.2013
Granted in 2005 172.331 Dec. 2005 2005 Apr. 2015 5 0.6 0
Granted in 2006 227.721 Feb. 2006 2007 - 2009 Apr. 2015 0.18 0.9 147,711
Granted in 2009 68.000 Sept. 2009 2010 - 2012 Sep. 2015 41 3.7 68,000
Granted in 2011 290.850 Nov. 2011 2011 - 2014 Nov. 2016 41 - 181 29.7 278,750
Granted in 2013 50.850 Sep. 2013 2013 - 2016 Jun. 2020 180 - 295 73.5 50,800
545,261
1) The numbers for the 2005 and 2006 grant are after the conversion to warrants on shares in Welltec International ApS. 2) The exercise prices are adjusted for the dilution impact from dividend paid in 2012.

NOTES
48 WELLTEC® ANNUAL REPORT 2013 / FINANCIAL STATEMENTS
5. AMORTIZATION, DEPRECIATION AND IMPAIRMENT LOSSES
(USD in thousands)2013
Restated
2012 2011
Completed development projects 18,682 14,609 11,262
Patents and licenses 477 379 487
Customer relationship 5,661 5,374 5,637
Technology 4,955 4,539 5,020
Total amortization of intangible assets 29,775 24,901 22,406
Other fixtures and fittings, tools and equipment 4,596 4,034 3,070
Land and buildings 74 79 53
Plant equipment and fleet 20,927 17,070 16,662
Leasehold improvements 567 511 513
Gain/loss from disposal of plant equipment and fleet (54) (228) (88)
Total depreciation of tangible assets 26,110 21,466 20,210
Total depreciation and amortization 55,885 46,367 42,616
Write-down of development projects 461 1,435 1,673
Write-down of plant equipment and fleet 3,609 3,246 4,015
Total impairment losses 4,070 4,681 5,688
Recognition of amortization, depreciation and impairment by function
Cost of service provided 42,315 34,270 31,020
Development and manufacturing costs capitalized 1,077 1,127 2,133
Administrative and sales costs 5,947 4,946 4,495
Amortization of acquired intangible assets in a business combination 10,616 10,705 10,657
Total depreciation, amortization and impairment losses 59,955 51,048 48,305
6. SPECIAL ITEMS
(USD in thousands)2013
Restated
2012 2011
Salary cost related to resigned employees and special bonus 1,517 0 0
Non-recurring consultancy fees 3,181 0 0
Total special items 4,698 0 0

WELLTEC® ANNUAL REPORT 2013 FINANCIAL STATEMENTS / 49
NOTES
7. FINANCIAL INCOME
(USD in thousands)2013
Restated
2012 2011
Interest income 1,241 1,047 536
Interest from subsidiaries and affiliates 0 0 21
Interest income from financial assets that are not measured at fair value through profit or loss
1,241 1,047 557
Fair value adjustment of derivative financial instruments 3,717 0 0
Exchange rate gains 18,278 21 4,071
Total financial income 23,236 1,068 4,628
8. FINANCIAL EXPENSES
(USD in thousands)2013
Restated
2012 2011
Interest expenses (29,440) (26,853) (12,535)
Redemption fee* 0 0 (2,547)
Other financial expenses (3,815) (4,685) (1,492)
Interest expenses from financial liabilities that are not measured at fair value through profit or loss
(33,255) (31,538) (16,574)
Exchange rate loss (16,156) (5,779) (4,511)
Fair value adjustment of derivative financial instruments 0 (2,012) (7,693)
Total financial expenses (49,411) (39,329) (28,778)
*Redemption fee consists of costs related to refinancing of earlier credit facilities.
Borrowing costs capitalized on development projects are calculated based on the incurred costs and a weighted average capitalization rate of 8.8% (7.5% in 2012). The amount capitalized in 2013 is USD 0.8 million (USD 0.5 million in 2012 and USD 0.4 million in 2011).
The impact at group level of derivative financial instruments measured at fair value through profit or loss amounted to a gain of USD 3,717 thousand at December 31, 2013 (a net loss of USD 2,012 thousand in 2012 and a net loss of USD 7,693 thousand in 2011).
The net exchange rate loss at December 31, 2013 was USD 2,122 thousand (a net exchange rate loss of USD 5,758 thousand in 2012 and a net exchange rate loss of USD 440 thousand in 2011).

NOTES
50 WELLTEC® ANNUAL REPORT 2013 / FINANCIAL STATEMENTS
9. INCOME TAXES
(USD in thousands)2013
Restated
2012 2011
Current tax 14,931 17,671 11,488
Adjustment in corporation tax previous years 4,550 (355) 55
Current tax incl. Adj. in corporation tax previous years 19,481 17,316 11,543
Adjustment in deferred tax previous years (363) 1,836 709
Change in deferred tax 1,969 482 (795)
Effect from change in tax rate, deferred tax (4,651) 0 0
Tax effect from tax provision 4,370 257 3,493
Other taxes 81 3,646 1,143
Income taxes 20,887 23,537 16,093
A breakdown of tax:
Profit before tax 41,530 47,888 32,859
41,530 47,888 32,859
Reconciliation of tax rate USD (%)
Danish corporation tax rate 25 25 25
Effect of exchange rate adjustment in USD and DKK on Danish corporation tax 8 0 0
Effect of difference between tax rate for subsidiaries outside Denmark and Danish tax rate 0 2 4
Tax effect from tax provision 10 1 11
Non-taxable income and non-deductible expenses 4 1 (1)
Interest limitation, thin capitalization etc 4 11 5
Withholding taxes non deductible 4 4 0
Change in Corporate income Tax rate, current and coming years (11) 0 0
Other taxes, including adjustment to previous years 6 5 5
50 49 49
Management has decided to change the functional and presentation currency of its consolidated financial statements to USD, however, tax returns for the Danish companies are still submitted in DKK with numbers based on consolidation in DKK.
The reconciliation of tax rate is presented both to the USD result and DKK result, the latter to reflect the reconciliation in the tax return currency.
Difference in tax rates illustrated is caused by the exchange rate adjustments between USD and DKK in the USD account. Reference is made to note 1. Accounting Policies.
Reconciliation of tax rate DKK (%)
Danish corporation tax rate 25 25 25
Effect of difference between tax rate for subsidiaries outside Denmark and Danish tax rate
0 2 4
Tax effect from tax provision 8 1 11
Non-taxable income and non-deductible expenses 3 1 (1)
Interest limitation, thin capitalization etc 3 11 5
Withholding taxes non deductible 3 4 0
Change in Corporate income Tax rate, current and coming years (8) 0 0
Other taxes, including adjustment to previous years 4 7 5
38 51 49

WELLTEC® ANNUAL REPORT 2013 FINANCIAL STATEMENTS / 51
NOTES
11. CHANGES IN WORKING CAPITAL
(USD in thousands)2013
Restated
2012 2011
Change in receivables and prepayments 393 (34,535) (21,641)
Change in inventories (743) 115 (1,837)
Change in trade payables (3,482) 811 4,551
Change in other payables (2,203) 2,201 7,004
Change in other receivables (687) 0 0
Change in working capital from acquisition of companies 0 153 0
Change in payables to affiliates (832) 879 50
Total changes in working capital (7,554) (30,376) (11,873)
10. NON-CASH ADJUSTMENTS
(USD in thousands)2013
Restated
2012 2011
Depreciation of intangible and tangible assets 55,938 46,595 42,704
Disposal and write down 4,070 4,681 5,688
Exchange rate adjustment on depreciation and fixed assets (1,255) (273) 60
Currency adjustments, other (5,888) (7,158) (2,770)
Write-down on trade receivables (426) 592 167
Special items 0 0 (1,659)
Share-based payments 2,710 2,169 5,853
Total non-cash adjustments 55,149 46,606 50,043
No income tax has been recognized directly in other comprehensive income in 2011 and 2012. In 2013 USD 5,887 thousand is recognized directly in equity related to tax credit from the warrant scheme.
Norway – allocation of income between Norwegian branch and Danish parent
In 2007, the Norwegian tax authorities adjusted the taxable income related to income years 2001-2004 resulting in an additional payment of taxes equal USD 1,382 thousands. The company has paid the outstanding amount, which has been recognized as a receivable in the consolidated financial statements.
Welltec® has in 2009 and in 2013 requested a Mutual Agreement Procedure (MAP) in order to settle the principles for allocation of income between Welltec’s Norwegian branch and the Danish parent, Welltec A/S.
Welltec® believes that subsequent income years will be subject to the final agreement entered into by the Norwegian and the Danish tax authorities.
Final closure of MAP proceedings with the Danish and the Norwegian tax authorities agreeing on the principles for distribution of income is expected in 2014. Expectations are based on the ongoing dialogue with both the Danish and Norwegian tax authorities.
Denmark – credit for taxes paid abroad
The Danish tax authorities have for the income year 2008 adjusted the tax payable due to non-recognition of credit relief calculated on witholding taxes paid abroad. The additional tax payable is USD 1,658 thousand and has been paid.
The decision is appealed to the National Tax Tribunal.
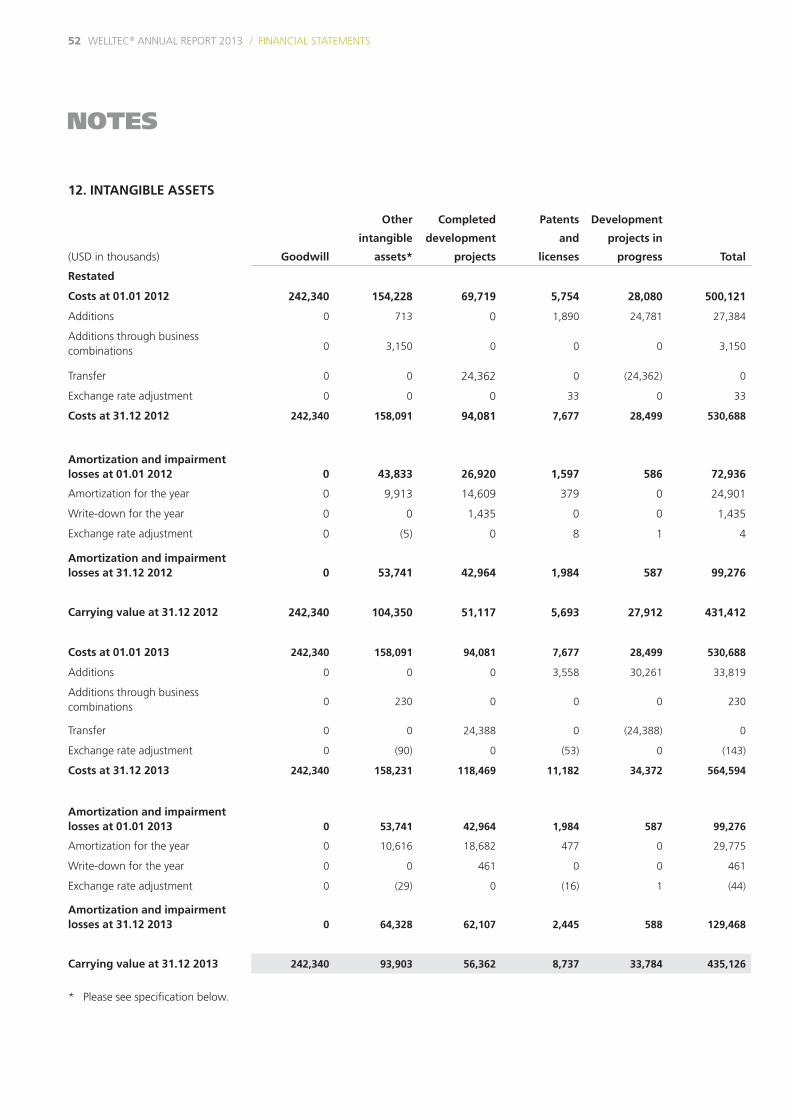
NOTES
52 WELLTEC® ANNUAL REPORT 2013 / FINANCIAL STATEMENTS
12. INTANGIBLE ASSETS
(USD in thousands) Goodwill
Other
intangible
assets*
Completed
development
projects
Patents
and
licenses
Development
projects in
progress Total
Restated
Costs at 01.01 2012 242,340 154,228 69,719 5,754 28,080 500,121
Additions 0 713 0 1,890 24,781 27,384
Additions through business combinations 0 3,150 0 0 0 3,150
Transfer 0 0 24,362 0 (24,362) 0
Exchange rate adjustment 0 0 0 33 0 33
Costs at 31.12 2012 242,340 158,091 94,081 7,677 28,499 530,688
Amortization and impairment losses at 01.01 2012 0 43,833 26,920 1,597 586 72,936
Amortization for the year 0 9,913 14,609 379 0 24,901
Write-down for the year 0 0 1,435 0 0 1,435
Exchange rate adjustment 0 (5) 0 8 1 4
Amortization and impairment losses at 31.12 2012 0 53,741 42,964 1,984 587 99,276
Carrying value at 31.12 2012 242,340 104,350 51,117 5,693 27,912 431,412
Costs at 01.01 2013 242,340 158,091 94,081 7,677 28,499 530,688
Additions 0 0 0 3,558 30,261 33,819
Additions through business combinations 0 230 0 0 0 230
Transfer 0 0 24,388 0 (24,388) 0
Exchange rate adjustment 0 (90) 0 (53) 0 (143)
Costs at 31.12 2013 242,340 158,231 118,469 11,182 34,372 564,594
Amortization and impairment losses at 01.01 2013 0 53,741 42,964 1,984 587 99,276
Amortization for the year 0 10,616 18,682 477 0 29,775
Write-down for the year 0 0 461 0 0 461
Exchange rate adjustment 0 (29) 0 (16) 1 (44)
Amortization and impairment losses at 31.12 2013 0 64,328 62,107 2,445 588 129,468
Carrying value at 31.12 2013 242,340 93,903 56,362 8,737 33,784 435,126
* Please see specification below.

WELLTEC® ANNUAL REPORT 2013 FINANCIAL STATEMENTS / 53
NOTES
Other intangible assets:
(USD in thousands) Technology
Customer
relationship Brand Total
Restated
Costs at 01.01 2012 88,640 51,664 13,924 154,228
Additions 449 264 0 713
Additions through business combinations 1,796 1,354 0 3,150
Costs at 31.12 2012 90,885 53,282 13,924 158,091
Amortization and impairment losses at 01.01 2012 20,419 23,414 0 43,833
Amortization for the year 4,539 5,374 0 9,913
Exchange rate adjustment 0 (5) 0 (5)
Amortization and impairment losses at 31.12 2012 24,958 28,783 0 53,741
Carrying value at 31.12 2012 65,927 24,499 13,924 104,350
Costs at 01.01 2013 90,885 53,282 13,924 158,091
Additions 0 0 0 0
Additions through business combinations 230 0 0 230
Exchange rate adjustment 25 (115) 0 (91)
Costs at 31.12 2013 91,140 53,167 13,924 158,230
Amortization and impairment losses at 01.01 2013 24,958 28,783 0 53,741
Amortization for the year 4,955 5,661 0 10,616
Exchange rate adjustment 0 (30) 0 (30)
Amortization and impairment losses at 31.12 2013 29,913 34,415 0 64,327
Carrying value at 31.12 2013 61,227 18,752 13,924 93,903
Goodwill
Goodwill from the acquisitions is related to Welltec Holding ApS of USD 242,340 thousand. The goodwill amount is allocated to the group’s cash-generating unit Welltec International ApS group. It is the opinion of management that the carrying amount for goodwill does not exceed its recoverable value based on an estimate of present value of expected future net cash flows from Welltec International ApS group. The estimate is based on a risk-adjusted after tax discount rate (weighted average cost of capital) of 10.6%, applied to expectations about future earnings based on approved budget for 2014 and management’s forecasts for the period 2015-2022. In the terminal period ending after 2022 management uses a terminal value growth of 2.5%. The weighted average cost of capital before tax is 11.1%.
In 2012 weighted average cost of capital used was 11.1% which equals a before tax discount rate of 12.0%.
Impairment of other intangible assets
Impairment of development projects amounted to USD 0.4 million (2012: USD 1.4 million), which has been recognized in the statement of comprehensive income under cost of services provided as the projects are closed. The recoverable amount was calculated on the basis of
management’s re-assessed estimate of the value in use of the assets.

NOTES
54 WELLTEC® ANNUAL REPORT 2013 / FINANCIAL STATEMENTS
13. TANGIBLE ASSETS
(USD in thousands)Land andbuildings
Leasehold improvement
Plantequipment
and fleet
Other fixtures,fittings, tools
and equipment
Plant equipment
and fleetunder
construction Total
Restated
Costs at 01.01 2012 1,563 3,992 118,585 18,849 21,405 164,394
Additions 12 467 970 5,688 37,944 45,081
Additions through business combinations
1,167 0 0 4,792 0 5,959
Reclassification 0 (7) 0 (59) 0 (66)
Transfer 0 0 32,033 0 (32,033) 0
Exchange rate adjustment 49 276 10 324 21 680
Disposals 0 (12) (8,457) (897) 0 (9,366)
Costs at 31.12 2012 2,791 4,716 143,141 28,697 27,337 206,682
Depreciation and impairment losses at 01.01 2012 177 1,950 72,192 11,250 0 85,569
Reclassification 0 (7) 0 (59) 0 (66)
Depreciation for the year 79 511 17,070 4,034 0 21,694
Write-down for the year 0 0 3,246 0 0 3,246
Exchange rate adjustment 33 259 7 137 0 436
Depreciation of disposals 0 (10) (8,457) (724) 0 (9,191)
Depreciation and impairment losses at 31.12 2012 289 2,703 84,058 14,638 0 101,688
Carrying value at 31.12 2012 2,502 2,013 59,083 14,059 27,337 104,994
Costs at 01.01 2013 2,791 4,716 143,141 28,697 27,337 206,682
Additions 809 1,415 2,665 4,331 45,676 54,895
Additions through business combinations 0 0 0 0 0
Reclassification 0 0 0 (127) 0 (127)
Transfer 0 0 47,092 385 (47,477) 0
Exchange rate adjustment (197) (119) (43) (1,967) (54) (2,379)
Disposals 0 (74) (1,166) (3,131) (15) (4,387)
Costs at 31.12 2013 3,403 5,938 191,689 28,187 25,467 254,684
Depreciation and impairment losses at 01.01 2013 289 2,703 84,058 14,638 0 101,688
Reclassification 0 0 (2) 0 0 (2)
Depreciation for the year 74 567 20,927 4,596 0 26,164
Write-down for the year 0 0 3,609 0 0 3,609
Exchange rate adjustment (22) (72) (1) (1,128) 0 (1,223)
Disposals 0 (46) (1,041) (2,912) 0 (3,999)
Depreciation and impairment losses at 31.12 2013 341 3,152 107,550 15,194 0 126,237
Carrying value at 31.12 2013 3,062 2,786 84,139 12,994 25,467 128,448

WELLTEC® ANNUAL REPORT 2013 FINANCIAL STATEMENTS / 55
NOTES
Write-downs in 2013 and in 2012 related to scrapped tools and tools lost in the wells.
(USD in thousands)
2013
Restated
2012
The carrying amount includes:
Assets held under finance leases 2,999 2,074
14. INVESTMENTS IN SUBSIDIARIES
The group has investments in the following subsidiaries:
NameRegistered
officePrincipalactivity
Year /currency Capital Share
Pt. Welltec Oilfield Services Indonesia* Indonesia Sales Company 2005 / USD 500,000 95%
Welltec Oilfield Services (Malaysia) Sdn. Bhd* Malaysia Sales Company 2005 / MYR 350,000 49%
Welltec (UK) Ltd. * Scotland - UK Sales Company 2002 / GBP 1 100%
Welltec Canada Inc. * Canada Sales Company 2001 / CAD 6,000,001 100%
Welltec Inc. * USA Sales Company 2000 / USD 100,000 100%
RS 2001 ApS* Denmark Sales Company 2001 / DKK 125,000 100%
Welltec Oilfield Services Pty. Ltd.* Australia Sales Company 2005 / AUD 10 100%
Welltec Latinamerica ApS* Denmark Sales Company 2005 / DKK 475,000 100%
Welltec Africa ApS* Denmark Sales Company 2005 / DKK 125,000 100%
Welltec Venezuela, C.A.** Venezuela Sales Company 2005 / VEF 1,000 100%
Welltec do Brasil Ltda.** Brasil Sales Company 2006 / BRL 423,790 100%
Welltec Angola Lda.*** Angola Sales Company 2006 / USD 5,000 49%
Welltec Oilfield Services (Nigeria) Ltd. *** Nigeria Sales Company 2006 / NGN 25,000,000 30%
Welltec Oilfield Services (RUS) LLC.* Russia Sales Company 2007 / RUB 100,000 100%
Welltec Oilfield Services (Azerbaijan) Ltd.* Azerbaijan Sales Company 2007 / USD 5,000 100%
Welltec Oilfield Services Mexico S.A.** Mexico Sales Company 2007 / MXN 50,000 100%
Welltec Oilfield Services (India) Private Limited * India Sales Company 2008 / INR 100,000 100%
Welltec Oilfield Services (Saudi Arabia) Ltd* Saudi Arabia Sales Company 2008 / SAR 500,000 75%
Welltec A/S**** Denmark Manufacture 1989 / DKK 292,005,743 100%
Welltec Holding ApS Denmark Holding Company 2005 / DKK 254,865,743 100%
High Pressure Innovation AS* Norway Sales Company 2009 / NOK 1,500,000 100%
HPI Technology AS* Norway Sales Company 2009 / NOK 500,000 100%
Welltec Oilfield Services (Proprietary) (South Africa) Limited*** South Africa Sales Company 2010 / ZAR 1,000 100%
Welltec Oilfield Services (Kazakhstan) LLP* Kazakhstan Sales Company 2011 / KZT 151,200 100%
Welltec Oilfield Services (Uganda) Limited* Uganda Sales Company 2012 / USD 10,000 100%
Welltec Oilfield Services (Ghana) Limited*** Ghana Sales Company 2013 / GHC 40,818 49%
Welltec Oilfield services (Ukraine) LLC* Ukraine Sales Company 2013 / UAH 1,000 100%
* Held by Welltec A/S, ** Held by Welltec Latinamerica ApS, ***Held by Welltec Africa ApS, ****Held by Welltec Holding ApS
Even though Welltec A/S only holds a 49% and 30% ownership interest in four subsidiaries, Welltec A/S controls the four subsidiaries through holdings of more than half of the voting power.

56 WELLTEC® ANNUAL REPORT 2013 / FINANCIAL STATEMENTS
15. INVESTMENTS IN ASSOCIATES
Alslev Rustfri Montage A/S is considered to be an associated company due to the holding of warrants by Welltec A/S. Welltec A/S can exercise the warrants at any time and this will result in an ownership share up to 33%. As no warrants have been exercised during 2013 no share of profit or equity is recognized in the consolidated financial statements. As of December 31, 2013 the warrant agreement was terminated due to the purchase of assets from Alslev Rustfri Montage (see note 29. Business combinations).
Key financial figures
(USD in thousands)
2013*
Restated
2012
Gross profit - 5,875
Profit for the year - 229
Assets - 7,297
Liabilities - 5,654
*2013 figures are not shown above as per December 31 2013 Alslev Rustfri Montage A/S is no longer an associated company
16. INVENTORIES
(USD in thousands)2013
Restated
2012
Raw materials 2,184 1,733
Finished goods 292 0
Total inventories 2,476 1,733
NOTES
Investments in associates
Name
Registered
country
Principal
activity Year/currency Capital
% of share
and voting
rights
Alslev Rustfri Montage A/S Denmark Production 2011/DKK 2,862,000 0

WELLTEC® ANNUAL REPORT 2013 FINANCIAL STATEMENTS / 57
17. TRADE RECEIVABLES
(USD in thousands)2013
Restated
2012
Trade receivables before allowance for doubtful accounts 83,870 86,264
Write-downs (509) (935)
Total trade receivables 83,361 85,329
Trade receivables – average fixed time of credit (days) 90 91
Development in write-downs of trade receivables
Write-downs at 01.01 (935) (343)
Reversed, unrealized write-downs 667 13
Amounts written off during the year as uncollectible 24 (137)
Write-down in profit or loss (265) (468)
Write-downs at 31.12 (509) (935)
Specification of trade receivables by due date
Not due 55,630 55,531
Up to 30 days 12,933 13,748
30-60 days 2,094 2,917
60-90 days 5,147 7,172
90-120 days 4,930 1,708
120+ days 2,627 4,253
Total trade receivables 83,361 85,329
NOTES
In 2013 the write-downs on receivables of USD 509 thousand are all related to trade receivables due by 120+ days.
Credit risk management
The group’s credit risk on liquid funds and derivative financial instruments is limited because the counter parties are banks with high credit ratings assigned by the international credit-rating agencies.
The group’s services are provided to a variety of contractual counter parties and are therefore subject to the risk of non payment for services or non reimbursement of costs. Receivables consist of a relatively small number of customers, but the customers are large cor-porations in the oil industry. Companies with high credit ratings and the group’s loss on trade receivables are historically immaterial. There is an ongoing centralized follow-up on out-standing trade receivables in accordance with the group’s dunning procedures. If there is uncertainty of a customer’s ability or will to pay, and if the management assess that the receivables is doubtful, the receivables will be written down to avoid this risk.
The maximum credit risk related to financial assets corresponds to the carrying amount. In case where there may be a risk of loss, a write-down will be made based on individual assessment.

58 WELLTEC® ANNUAL REPORT 2013 / FINANCIAL STATEMENTS
18. PREPAYMENTS
(USD in thousands)
2013
Restated
2012
Prepaid insurance 617 219
Prepaid lease 173 590
Prepaid rent 1,016 453
Prepaid creditors 2,901 2,188
Other prepayments 2,444 1,700
Total prepayments 7,151 5,150
19. SHARE CAPITAL
The share capital consists of 4,724,519 units of DKK 1 / USD 0.18. All shares are fully paid.
(USD in thousands) Class A Shares
Class B Shares
2013 Total
Class A Shares
Class B Shares
2012 Total
Share units 01.01 550 237 787 535 282 817
Capital increase 08.03.12 0 0 0 30 0 30
Capital decrease 30.05.12 0 0 0 (15) (45) (60)
Capital increase 15.04.13 10 0 10 0 0 0
Capital increase 26.09.13 27 0 27 0 0 0
Share units 31.12 587 237 824 550 237 787
Both the Class A and Class B Shares are considered to be equity instruments as they do not include any unconditional contractual obligations to deliver cash to the shareholders. Class A and Class B shares have equal voting rights. The Class A shares issued on 26 September 2013 are preferences shares as they within a certain time frame have certain preference rights over the other Class A shares if Welltec does not complete an IPO. Class B shares are also preference shares as they within a certain time frame have certain preference rights over Class A shares when distributions are made by Welltec.
In 2007 Welltec International ApS issued 71,601 warrants to Jørgen Hallundbæk as owner, which can be exercised as of December 31, 2011. The total fair value of these warrants is USD 18,794 thousand as at December 31, 2013 (December 31, 2012: USD 7,338 thousand).
No dividend was paid out in 2013 and no dividend is proposed related to the financial year 2013. Dividend of USD 34,300 thousand was paid in March 2012, corresponding to USD 7.30 in average per share
NOTES
Number of
sharesNominal
value in DKK
Share of capital
in %
Own shares 01.01.2012 0 0 0
Purchase of shares 96,238 96,238 2.1
Sale of shares (27,741) (27,741) (0.6)
Own shares 31.12.2012 68,497 68,497 1.5
Purchase of shares 120,928 120,928 2.6
Sale of shares (9,800) (9,800) (0.3)
Own shares 31.12.2013 179,625 179,625 3.8

WELLTEC® ANNUAL REPORT 2013 FINANCIAL STATEMENTS / 59
20. DEFERRED TAX ASSETS AND LIABILITIES
(USD in thousands)2013
Restated
2012
Deferred tax 01.01 48,369 45,817
Exchange rate adjustments 2,495 (22)
Adjustment in deferred tax previous years (363) 1,836
Change in deferred tax for the year 6,339 738
Effect of change in income tax rate, current year (1,046) 0
Effect of change in income tax rate, coming years (3,605) 0
Deferred tax assets (-)/liabilities 31.12 52,189 48,369
Deferred tax breakdown:
Intangible assets 50,942 46,844
Tangible assets (2,124) (1,347)
Current and non-current liabilities 10,670 (586)
Current assets (1,890) 397
Change in tax rate, coming years (3,681) 0
Tax contingencies 0 4,759
Tax loss carried forward (1,728) (1,698)
Deferred tax assets (-)/liabilities 31.12 52,189 48,369
Deferred tax breakdown:
Deferred tax assets, not recognized:
Value of deferred tax assets, not recognized 168 136
Deferred tax liability, not recognized:
Value of deferred tax liability, not recognized 0 0
Deferred tax is recognized in the statement of financial position with:
Deferred tax assets (2,856) (2,959)
Deferred tax liabilities 55,045 51,328
Deferred tax assets (-)/liabilities 31.12 52,189 48,369
The group does not recognize deferred tax losses that are unlikely to be realized or otherwise exposed to major risk or uncertainty.
NOTES

60 WELLTEC® ANNUAL REPORT 2013 / FINANCIAL STATEMENTS
21. CURRENT AND NON-CURRENT FINANCIAL LIABILITIES
(USD in thousands)2013
Restated
2012
Issued bonds 309,786 308,063
Finance lease commitments 2,910 3,237
312,696 311,300
Due within 1 year 1,349 2,165
Due within 1-2 years 676 841
Due within 2-3 years 369 226
Due within 3-4 years 324 5
Due within 4-5 years 192 0
Due after 5 years 309,786 308,063
312,696 311,300
Recognition of short-term and long-term financial liabilities in the statement of financial position:
Non-current financial liabilities — lease commitments 1,561 1,072
Non-current financial liabilities — issued bonds 309,786 308,063
Current financial liabilities 1,349 2,165
312,696 311,300
NOTES
Restated 2012
Currency Expiry
Fixed or floating interest
Effective interest rate
%
Carrying amount local
(thousands)
Carrying amount USD
(thousands)
DKK 2014 floating 0.19-6.69 17,289 3,055
USD 2019 fixed 8.5 308,063 308,063
RUB 2014 floating 0-5 1,181 39
GBP 2016 floating 5 6 10
CAD 2012 floating 1.37-7.44 132 133
311,300
2013
Currency Expiry
Fixed or floating interest
Effective interest rate
%
Carrying amount local
(thousands)
Carrying amount USD
(thousands)
DKK 2018 floating 0.29-9.98 15,522 2,910
USD 2019 fixed 8.5 309,786 309,786
312,696

WELLTEC® ANNUAL REPORT 2013 FINANCIAL STATEMENTS / 61
21.1 Finance lease obligations
Finance lease relates to manufacturing equipment with lease terms of 3-5 years. The group has options to purchase the equipment for a
nominal amount at the end of the lease agreements. The group’s obligations under finance leases are secured by the lessors’ title to the
leased assets.
2013 Restated 2012
(USD in thousands)Minimum lease
payments
Present value of minimum
lease paymentMinimum lease
payments
Present value of minimum
lease payment
Maturity of finance lease obligations:
Within 1 year 1,396 1,349 2,241 2,165
Between 1 and 5 years 1,623 1,561 1,103 1,072
Over 5 years 0 0 0 0
Total finance lease obligations 3,019 2,910 3,344 3,237
(USD in thousands)
2013
Restated
2012
Interest from finance lease, expensed (175) (133)
The fair value of the finance lease liabilities is approximately equal to their carrying amount as of December 31, 2013 and December 31, 2012
NOTES
Issued bonds
In February 2012 Welltec A/S issued bonds of a value of USD 325 million. The bonds have a fixed interest of 8% and an effective rate of 8.5%. The bonds are repayable in full in February 2019.
The fair value of issued bonds at December 31, 2013 is USD 347 million (December 31, 2012 USD 347 million).
The fair value is based on the quoted market price (106.75 USD per note) (level 1) on Bourse Luxembourg.

62 WELLTEC® ANNUAL REPORT 2013 / FINANCIAL STATEMENTS
21.2 Maturity dates for financial liabilities
Restated 2012
(USD in thousands)Less than 1
yearBetween 1 and
5 yearsLater than 5
years Total
Finance lease commitments 2,165 1,072 0 3,237
Issued bonds 0 0 308,063 308,063
Other non-current liabilities 0 5,231 0 5,231
Payables to affiliates 1,186 0 0 1,186
Trade payables 18,897 0 0 18,897
Other payables 45,840 0 0 45,840
Total financial liabilities 68,088 6,303 308,063 382,454
All debt is measured at amortized cost, except from derivative financial instruments of USD 4,747 thousand that are measured at fair value through profit or loss. Derivative financial instruments are included in ‘Other non-current liabilities’. The amounts in the table above are exclusive of interest.
Interest on issued bonds mature on an annual basis with USD 26 million until maturity on February 1, 2019.
2013
(USD in thousands)Less than 1
yearBetween 1 and
5 yearsLater than 5
years Total
Finance lease commitments 1,349 1,561 0 2,910
Issued bonds 0 0 309,786 309,786
Other non-current liabilities 0 420 0 420
Payables to affiliates 354 0 0 354
Trade payables 15,414 0 0 15,414
Other payables 42,787 0 0 42,787
Total financial liabilities 59,904 1,981 309,786 371,671
All debt is measured at amortized cost, except from derivative financial instruments of USD 1,030 thousand that are measured at fair value through profit or loss. Derivative financial instruments are included in ‘Other payables’. The amounts in the table above are exclu-sive of interest.
Interest on issued bonds mature on an annual basis with USD 26 million until maturity on February 1, 2019.
NOTES

WELLTEC® ANNUAL REPORT 2013 FINANCIAL STATEMENTS / 63
24. FEES TO AUDITOR APPOINTED AT THE ANNUAL GENERAL MEETING
(USD in thousands)2013
Restated
2012 2011
Statutory audit services 620 588 584
Statutory audit services 620 588 584
Non-audit services:
Opinions 22 2 4
Tax advisory services 1,226 551 310
Other 1,044 469 901
Non-audit services 2,292 1,022 1,215
Total fees to auditor 2,912 1,610 1,799
22. OTHER PAYABLES
(USD in thousands)2013
Restated
2012
Wages and salaries, personal income taxes, social security costs, etc. payable 7,541 9,361
Holiday pay obligation 8,671 7,467
Derivative financial instruments 1,030 0
Earn out related to HPI (see note. 29 Business combinations) 0 1,796
VAT and duties 29 3,468
Accrued interests 11,596 12,484
Other costs payable 13,920 11,264
Total other payables 42,787 45,840
23. EBITDA RECONCILIATION
(USD in thousands)2013
Restated
2012 2011
EBITDA 135,122 139,594 111,254
Depreciations and impairment losses (29,773) (24,940) (24,313)
Amortizations and impairment losses (30,236) (26,336) (24,079)
Issued warrants (2,710) (2,169) (5,853)
EBIT 72,403 86,149 57,009
NOTES

64 WELLTEC® ANNUAL REPORT 2013 / FINANCIAL STATEMENTS
26. OPERATING LEASE COMMITMENTS
(USD in thousands)
2013
Restated
2012 2011
Rental and leasing obligations
Due within 1 year 6,452 5,817 4,664
Due within 1-5 years 10,044 12,910 10,982
Over 5 years 8,592 10,474 0
Total rental and leasing obligations 25,088 29,201 15,646
Rental and leasing expenses for the year 10,418 5,817 5,445
The group has entered into operational leasing agreements regarding house rental, office furniture and company cars.
In 2013 the group has issued bank guarantees to third parties in the amount of USD 3,780 thousand. In 2012 guarantees to third par-
ties were USD 5,416 thousand.
Welltec International ApS is part of a Danish joint taxation scheme with JH Holding, Allerød ApS and its Danish subsidiaries. As from
the 2013 financial year, the company has partly a joint and several liability and partly a secondary liability with respect to income taxes
etc. for the jointly-taxed companies. As from 1 July 2012 it also has partly a joint and several liability and partly a secondary liability with
respect to any obligations to withhold tax on interest, royalties and dividends for these companies. However, in both cases the second-
ary liability is capped at an amount equal to the share of the capital of the company directly or indirectly owned by the ultimate parent
company.
The debt established under the bond program is guaranteed by Welltec International ApS, Welltec Holding ApS, Welltec Canada Inc.,
Welltec Africa ApS, Welltec Latinamerica ApS, RS 2001 ApS, Welltec (UK) Ltd, Welltec Inc. and Welltec Oilfield Services (RUS) LLC. Sub-
ject to certain exceptions and permitted liens, the debts established under the bond program are secured, by (i) all of the issued shares
of the Issuer and each of the Guarantors (other than Welltec International ApS, Welltec (UK) Ltd and Welltec Oilfield Services (RUS) LLC),
(ii) certain intercompany loans and receivables of the Issuer and the Guarantors, (iii) the bank accounts of the Issuer and certain of the
Guarantors and (iv) certain other assets of certain of the subsidiary Guarantors, including receivables and intellectual property rights.
The bonds and the bond guarantees are secured by first-ranking liens over the same property and assets that will secure the obligations
outstanding under the Revolving Credit Facility, certain hedging obligations and certain other indebtedness.
Welltec International group is involved in legal proceedings in a number of countries against businesses and individuals. It is the opin-
ion of management that the outcome of these proceedings will not have a material impact on the group’s financial position, results of
operations or cash flows.
NOTES
25. ASSETS CHARGED AND CONTINGENT LIABILITIES

WELLTEC® ANNUAL REPORT 2013 FINANCIAL STATEMENTS / 65
The carrying amounts of the group’s foreign currency denominated monetary assets and monetary liabilities at the end of the report-
ing period are as follows stated in the material currencies affecting the group:
Assets Liabilities
(USD in thousands) 2013 Restated
2012 2013 Restated
2012
DKK 132,447 171,338 (83,313) (165,141)
GBP 10,062 7,535 (949) (472)
NOK 23,770 71,431 (16,380) (24,362)
NOTES
27.1 General capital structure
The group is financed partly through equity and partly through long-term debt. Management assesses on a regular basis whether the
group’s capital structure is in accordance with the group’s and Shareholders’ interests. The overall objective is to ensure a capital struc-
ture that supports long-term growth and also maximizes returns to the shareholders of the group by optimizing the debt to equity ratio.
The group’s overall objective remains the same as previously.
27.2 Market risk
Due to the group’s foreign activities and credit facilities in foreign currencies, its profit/loss, cash flows and equity are affected by chang-
es in exchange rates and interest rates for a number of currencies.
A significant part of this change in exchange rates has been eliminated by changing functional currency for the Danish companies to
USD.
27.2.1 Foreign currency risk management
The reporting currency of the group is US dollars. The functional currency of the Danish companies is considered to be US dollars, and
the rest of the group’s subsidiaries have the functional currency of the country in which the subsidiary is domiciled. A proportion of the
group’s revenues, expenses and other liabilities are denominated in currencies other than US dollars, in particular Danish kroner, Norwe-
gian kroner and British pounds. Exchange rate exposures are managed within approved policy parameters.
27. FINANCIAL INSTRUMENTS

66 WELLTEC® ANNUAL REPORT 2013 / FINANCIAL STATEMENTS
NOTES
27.2.2 Foreign currency sensitivity analysis
The following table details the group’s sensitivity to a 10% increase and decrease in DKK, GBP and NOK against the relevant foreign
currencies. The percentage used is the sensitivity rate and is representing Management’s assessment of the reasonably possible change
in foreign exchange rates. The sensitivity analysis includes only outstanding foreign currency denominated monetary items and adjusts
their translation at the period end for a change in foreign currency rates. The sensitivity analysis includes external loans as well as loans
to foreign operations within the group where the denomination of the loan is in a currency other than the currency of the lender or the
borrower. A positive number below indicates an increase in profit and equity where the currency strengthens 10% against the relevant
currency. For a 10% weakening of the currency against the relevant currency, there would be a comparable impact on the profit and
other equity, and the balances below would be negative:
Currency DKK impact Currency GBP impact Currency NOK impact
(USD in thousands)2013
Restated 2012 2013
Restated 2012 2013
Restated 2012
Profit/(Loss) 4,913 620 911 706 739 4,707
Equity 0 0 933 828 1,193 5,144
27.2.3 Fair value of interest swaps
Restated 2012
(USD in thousands) Principal Market value
Exchange gain recognized in the
P/L Maturity period
Interest swap
DKK 445,000 (3,125) 826 2014
EUR 31,000 (1,622) 25 2014
Total swap contracts (loss) (4,747) 851
2013
(USD in thousands) Principal Market value
Exchange gain recognized in the
P/L Maturity period
Interest swap
DKK 445,000 (680) 2,445 2014
EUR 31,000 (350) 1,272 2014
Total swap contracts (loss) (1,030) 3,717

WELLTEC® ANNUAL REPORT 2013 FINANCIAL STATEMENTS / 67
NOTES
27.2.4 Fair value hierarchy of derivative financial instruments that are measured at fair value in the statement of financial
position
Restated 2012
(USD in thousands) Quoted prices level 1
Observable input level 2
Non-observable input level 3 Total
Derivative financial instruments 0 (4,747) 0 (4,747)
Total financial liabilities 0 (4,747) 0 (4,747)
2013
(USD in thousands) Quoted prices level 1
Observable input level 2
Non-observable input level 3 Total
Derivative financial instruments 0 (1,030) 0 (1,030)
Total financial liabilities 0 (1,030) 0 (1,030)
Financial instruments measured at fair value are classified using the following fair value hierarchy:
Listed prices in active markets of identical assets or liabilities (Level 1).
Listed prices in active markets of similar assets or liabilities, or other valuation methods where all material input is based on observable market data (Level 2).
Valuation methods under which any material input is not based on observable market data (Level 3).
The valuation of derivative financial instruments in 2013 and 2012 is based on Mark to Market (MTM) values from financial institutions (level 2).
27.2.5 Interest rate risk management
From the beginning of 2012 the group’s interest rate risk relates to the group’s interest bearing debt to bondholders. The interest is fixed at an effective rate of 8.5%.
As the interest rate is fixed the group does not apply hedge accounting to its derivative financial instruments. Thus changes in fair value are recognized directly in statement of comprehensive income as financial income or financial expenses.
22.7.2.6 Interest rate sensitivity analysis
The group’s interest-bearing debt for 2013 is fixed to 8.5% due to the bond loan.
Previously the group held loans with a floating interest. At that time a 250 basis point increase or decrease represented Management’s assess-ment of the reasonably possible change in interest rate.
If interest rates had been 250 basis points higher/lower and all other variables were held constant, the group’s:
Profit for the year and equity as of December 31, 2013 would be unaffected (2012: Unaffected).
The effect of derivative financial instruments has not been included in the calculation.
27.3 Liquidity risk management
It is the group’s policy that capital raising and distribution of cash are managed centrally by the group’s finance department to the extent it is
deemed appropriate. The group manages liquidity risk by maintaining adequate reserves, banking facilities and reserve borrowing facilities, by
continuously monitoring forecast and actual cash flows.

68 WELLTEC® ANNUAL REPORT 2013 / FINANCIAL STATEMENTS
NOTES
Welltec’s related parties
The ultimate parent company of the group is JH Holding, Allerød ApS, Haregabsvej 15, 3230 Græsted, Denmark
1. The parent company’s principal shareholder (control), JH Holding. Allerød, ApS, Haregabsvej 15, 3230 Græsted, Denmark, which is
wholly owned by Jørgen Hallundbæk
2. Summit Partners WT-A S.a.r.l., Rue du Plébiscite 5, L-2341 Luxembourg, Luxembourg (owns more than 5%)
3. Summit Partners WT-B S.a.r.l., Rue du Plébiscite 5, L-2341 Luxembourg, Luxembourg (owns more than 5%)
4. Companies in which the principal shareholder exercises control, i.e. Haregabgaard ApS and Tinkerbell ApS, Haregabsvej 15, Esbønd-
erup Skovhuse, 3230 Græsted
5. Members of the parent company’s Executive Management and Board of Directors as well as close relatives of these members
6. Subsidiaries of Welltec International ApS – see note. 14 Investments in subsidiaries in the consolidated financial statements
7. Alslev Rustfri Montage A/S (associated company)
Balances and transactions between the Company and its subsidiaries, which are related parties of the Company, have been eliminated on
consolidation in accordance with the accounting policies and are not disclosed in this note, but in note 18 to the financial statements of
the parent company. Details of transactions between the group and other related parties are disclosed below.
28. RELATED PARTIES
27.4 Categories of financial instruments
(USD in thousands)2013
Restated
2012
Other receivables (non-current) and current portion of non-current assets 3,884 5,438
Trade receivables 83,361 85,329
Other receivables 6,630 9,902
Prepayments 7,151 5,150
Cash and cash equivalents 38,812 41,985
Receivables and loans 139,838 147,804
Derivative financial instruments 1,030 4,747
Financial liabilities measured at fair value through profit or loss 1,030 4,747
Finance lease commitments 2,910 3,237
Issued bonds 309,786 308,063
Other non-current liabilities 420 484
Payables to affiliates 354 1,186
Trade payables 15,414 18,897
Current tax liabilities 6,865 11,943
Other payables 41,757 45,840
Financial liabilities measured at amortized cost 377,506 389,650
The group is adjusting centrally the cash outflow in investments in intangible assets and property, plant and equipment in Denmark.
Please see note 21.2. Maturity dates for financial liabilities.

WELLTEC® ANNUAL REPORT 2013 FINANCIAL STATEMENTS / 69
NOTES
28.1 Related parties transactions
During the year, group entities entered into the following trading transactions with related parties that are not members of the group:
(USD in thousands)
Restated 2012 Affiliates*Key
managementBoard of Directors Associates
Dividend paid to shareholders 31,955 979 0 0
Raw materials and finished goods 0 0 0 4,371
Share buyback 45,226 15,644 0 0
Legal services 0 0 701 0
Total transactions 77,181 16,623 701 4,371
2013 Affiliates*Key
managementBoard of Directors Associates
Raw materials and finished goods 0 0 0 3,778
Purchase of activities 0 0 0 942
Share buyback 30,062 0 0 0
Legal services 0 0 1,397 0
Total transactions 30,062 0 1,397 4,720
*The parent company’s principal shareholder(s) are defined as affiliates.
The following balances were outstanding at the end of the reporting period:
(USD in thousands)Amounts owed by related parties Amounts owed to related parties
2013 2012 2013 2012
JH Holding. Allerød, ApS 0 0 (354) (1,185)
Alslev Rustfri Montage A/S 0 356 (329) (1,006)
Board of Directors 0 0 (125) 0
Total balances 0 356 (808) (2,191)
See note 4. Staff costs – remuneration to members of the Executive Board, Board of Directors and other Key management personnel.
2012
Asset Acquisition of Endeavor E-line Services
On February 1, 2012, Welltec® announced that the company, through its wholly owned subsidiary Welltec Canada Inc., grew its opera-tions with the acquisition of Endeavour E-line Services, the wireline portion of Essential Energy Services, Ltd. in Calgary, Alberta. The total payment for the business combination was agreed at USD 7.5 million.
The group has incurred acquisition-related expenses totaling USD 157 thousand which have been included in administrative and sales costs in the consolidated statement of comprehensive income for 2012.
As a consequence of fully integrating Endeavour E-Line Services with Welltec Canada Inc.’s other activities immediately after the acquisi-tion, the group has not been able to quantify and thus disclose the impact on the group’s revenue and net profit for the year as a result of the acquisition. Additionally, based on lacking registrations, the group has not been able to quantify and thus disclose the impact on the group’s revenue and net profit for the year if the acquisition had taken place with effect from January 1, 2012.
29. BUSINESS COMBINATIONS

70 WELLTEC® ANNUAL REPORT 2013 / FINANCIAL STATEMENTS
2013Asset Acquisition of Alslev Rustfri MontageOn December 31, 2013, Welltec® announced that the company, through its wholly owned subsidiary Welltec A/S, grew its operations with the acquisition of certain assets and key employees of Alslev Rustfri Montage, Esbjerg.
The group has not incurred acquisition-related expenses and the group’s revenue and net profit has not been impacted by the acquisition in 2013. Based on lacking registrations, the group has not been able to quantify and thus disclose the impact on the group’s revenue and net profit for the year if the acquisition had taken place with effect from January 1, 2013.
The preliminary purchase price allocation can be specified as follows:
Alslev Rustfri Montage
(USD in thousands)
Total opening balance
at fair value
Technology 230
Plant, equipment and fleet 758
Other payables (46)
Net assets 942
Cost of business combination consist of:
Other non-current liabilities 185
Other payables 757
942
NOTES
The purchase price allocation can be specified as follows:
Endeavor E-line Services HPI Technology AS
(USD in thousands)Carrying amount*
Fair value adjustment
Carrying amount*
Fair value adjustment
Total opening
balance at fair
value
Customer relationship 0 1,354 0 0 1,354
Technology 0 0 0 1,796 1,796
Land and buildings 1,167 0 0 0 1,167
Other fixture and fittings, tools and equipment 4,792 0 0 0 4,792
Prepayments 151 0 0 0 151
Net assets 6,110 1,354 0 1,796 9,260
Cost of business combination consist of:
Cash paid 7,464
Other payables 1,796
9,260
No significant events regarding the group’s activities have occurred since December 31, 2013.
30. EVENTS AFTER THE BALANCE SHEET DATE
Earn out regarding HPI Technology AS
On April 1 2009 Welltec® acquired HPI Technology AS. In 2012 a second and final earn-out milestone was reached and an additional earn out provision was triggered resulting in an earn-out of USD 1.8 million, which has been capitalized as technology in accordance with IFRS 3 (Business Combination 2004). The earn-out has been settled in 2013

WELLTEC® ANNUAL REPORT 2013 FINANCIAL STATEMENTS / 71
FINANCIAL STATEMENTS
2013

72 WELLTEC® ANNUAL REPORT 2013 / FINANCIAL STATEMENTS
FINANCIAL STATEMENTS PARENT COMPANY
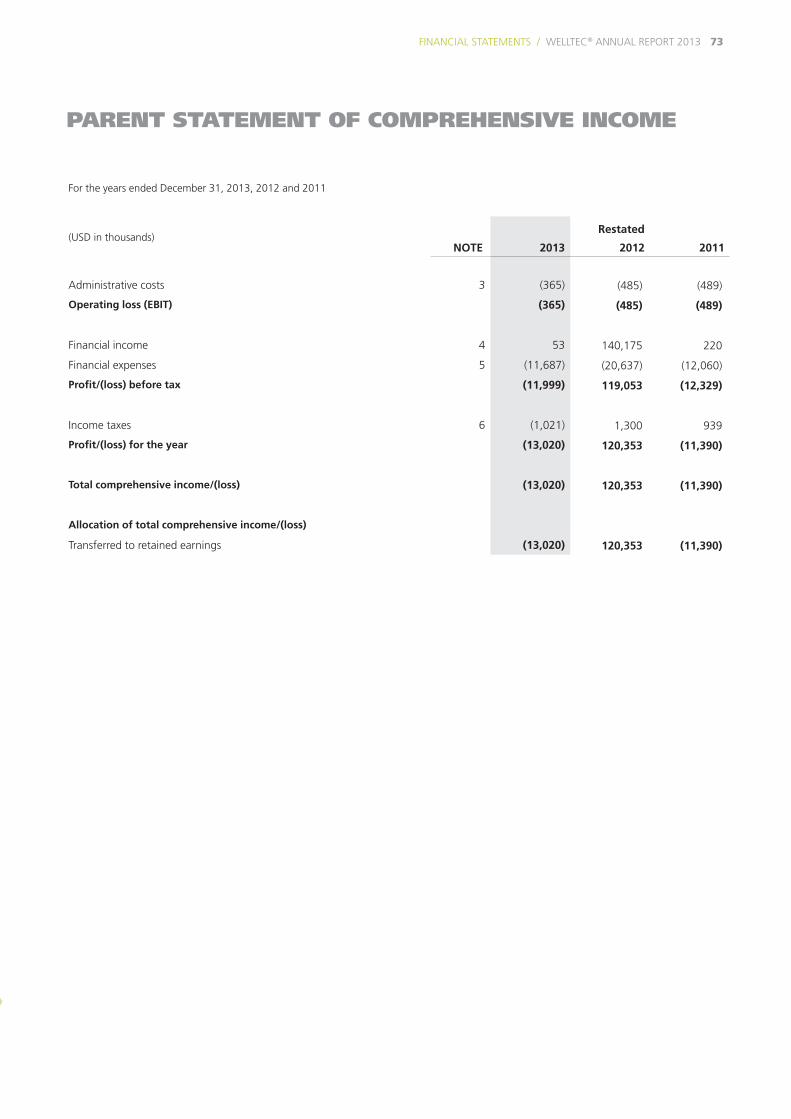
WELLTEC® ANNUAL REPORT 2013 FINANCIAL STATEMENTS / 73
For the years ended December 31, 2013, 2012 and 2011
(USD in thousands)NOTE 2013
Restated
2012 2011
Administrative costs 3 (365) (485) (489)
Operating loss (EBIT) (365) (485) (489)
Financial income 4 53 140,175 220
Financial expenses 5 (11,687) (20,637) (12,060)
Profit/(loss) before tax (11,999) 119,053 (12,329)
Income taxes 6 (1,021) 1,300 939
Profit/(loss) for the year (13,020) 120,353 (11,390)
Total comprehensive income/(loss) (13,020) 120,353 (11,390)
Allocation of total comprehensive income/(loss)
Transferred to retained earnings (13,020) 120,353 (11,390)
PARENT STATEMENT OF COMPREHENSIVE INCOME

74 WELLTEC® ANNUAL REPORT 2013 / FINANCIAL STATEMENTS
As of December 31, 2013 and 2012
(USD in thousands)NOTE 2013
Restated
2012
Non-current assets
Financial assets
Investments in subsidiaries 9 392,576 346,319
Total financial assets 392,576 346,319
Total non-current assets 392,576 346,319
Current assets
Receivables
Tax receivables 958 2,499
Receivables from subsidiaries and affiliates 68,670 65,088
Other receivables 1 6
Total receivables 69,629 67,593
Cash and cash equivalents 815 788
Total current assets 70,444 68,381
Total assets 463,020 414,700
PARENT STATEMENT OF FINANCIAL POSITION

WELLTEC® ANNUAL REPORT 2013 FINANCIAL STATEMENTS / 75
As of December 31, 2013 and 2012
(USD in thousands)NOTE 2013
Restated
2012
Equity
Share capital 10 824 787
Retained earnings 310,779 277,044
Total equity 311,603 277,831
Non-current liabilities
Deferred tax liabilities 11 0 0
Total non-current liabilities 0 0
Current liabilities
Loan from subsidiaries 12 146,535 125,077
Payables to subsidiaries 12 4,294 11,713
Other payables 588 79
Total current liabilities 151,417 136,869
Total liabilities 151,417 136,869
Total equity and liabilities 463,020 414,700
PARENT STATEMENT OF FINANCIAL POSITION

76 WELLTEC® ANNUAL REPORT 2013 / FINANCIAL STATEMENTS
For the years ended December 31, 2013, 2012 and 2011
(USD in thousands)Share capital
Retained earnings Total
Equity at 31 December, 2011 817 236,864 237,681
Profit for the year 0 120,353 120,353
Total comprehensive income for the year 0 120,353 120,353
Purchase of own shares 0 (49,500) (49,500)
Sale of own shares 0 777 777
Dividend 0 (34,500) (34,500)
Capital increase 30 821 851
Capital decrease (60) 60 0
Share-based payment to executives 0 2,169 2,169
Other transactions (30) (80,173) (80,203)
Equity at 31 December, 2012 787 277,044 277,831
Loss for the year 0 (13,020) (13,020)
Total comprehensive loss for the year 0 (13,020) (13,020)
Capital increase 37 45,928 45,965
Costs related to capital increase 0 (1,884) (1,884)
Share-based payment 0 2,710 2,710
Other transactions 37 46,755 46,792
Equity at 31 December, 2013 824 310,779 311,603
PARENT STATEMENT OF CHANGES IN EQUITY

WELLTEC® ANNUAL REPORT 2013 FINANCIAL STATEMENTS / 77
For the years ended December 31, 2013, 2012 and 2011
(USD in thousands)NOTE 2013
Restated
2012 2011
Operating loss (EBIT) (365) (485) (489)
Non-cash adjustments 7 (4,323) (313) 656
Changes in working capital 8 (7,776) 82,793 13,512
Income taxes received (paid) 520 283 880
Other receivables, long-term 0 0 483
Other payables, long-term 0 0 (63)
Cash flows from operating activities (11,944) 82,278 14,979
Financial income received 53 38 220
Capital increase in subsidiary (46,257) 0 0
Loan from affiliates 21,458 0 0
Dividend received from subsidiaries 0 140,035 0
Cash flows from investing activities (24,746) 140,073 220
Financial expenses paid (7,364) (11,995) (7,286)
Other financial expenses 0 (2,083) (2,723)
Dividend paid out to shareholders 0 (34,500) 0
Purchase of own shares 0 (49,500) 0
Sale of own shares 0 777 0
Capital increase 45,928 851 0
Costs related to capital increase (1,884) 0 0
Installments on current and non-current debt 0 (125,133) (5,227)
Cash flows from financing activities 36,680 (221,583) (15,236)
Increase/decrease in cash and cash equivalents (10) 768 (37)
Exchange rate adjustment at beginning of period 37 0 0
Cash and cash equivalents at beginning of period 788 20 57
Cash and cash equivalents at 31 December 815 788 20
PARENT STATEMENT OF CASH FLOWS

78 WELLTEC® ANNUAL REPORT 2013 / FINANCIAL STATEMENTS
TABLE OF CONTENTS, NOTES – PARENT
1. Accounting policies . . . . . . . . . . . . . . . . . . . . . . . . . . . . . . . . . . . . . . . . . . . . . . . . . . . . . . . . . . . . . . . . . . . . . . . . . . . . . . . . . . . . . . . . . . . . . . 79
2. Critical accounting judgments and key sources of estimation uncertainty . . . . . . . . . . . . . . . . . . . . . . . . . . . . . . . . . . . . . 79
Statement of comprehensive income
3. Staff costs . . . . . . . . . . . . . . . . . . . . . . . . . . . . . . . . . . . . . . . . . . . . . . . . . . . . . . . . . . . . . . . . . . . . . . . . . . . . . . . . . . . . . . . . . . . . . . . . . . . . . . . . 79
4. Financial income . . . . . . . . . . . . . . . . . . . . . . . . . . . . . . . . . . . . . . . . . . . . . . . . . . . . . . . . . . . . . . . . . . . . . . . . . . . . . . . . . . . . . . . . . . . . . . . . . 79
5. Financial expenses . . . . . . . . . . . . . . . . . . . . . . . . . . . . . . . . . . . . . . . . . . . . . . . . . . . . . . . . . . . . . . . . . . . . . . . . . . . . . . . . . . . . . . . . . . . . . . . 80
6. Income taxes . . . . . . . . . . . . . . . . . . . . . . . . . . . . . . . . . . . . . . . . . . . . . . . . . . . . . . . . . . . . . . . . . . . . . . . . . . . . . . . . . . . . . . . . . . . . . . . . . . . . . 80
Statement of cash flows
7. Non-cash adjustments . . . . . . . . . . . . . . . . . . . . . . . . . . . . . . . . . . . . . . . . . . . . . . . . . . . . . . . . . . . . . . . . . . . . . . . . . . . . . . . . . . . . . . . . . . . 81
8. Changes in working capital . . . . . . . . . . . . . . . . . . . . . . . . . . . . . . . . . . . . . . . . . . . . . . . . . . . . . . . . . . . . . . . . . . . . . . . . . . . . . . . . . . . . . 81
Statement of Financial position
9. Investments in subsidiaries . . . . . . . . . . . . . . . . . . . . . . . . . . . . . . . . . . . . . . . . . . . . . . . . . . . . . . . . . . . . . . . . . . . . . . . . . . . . . . . . . . . . . . 81
10. Share capital . . . . . . . . . . . . . . . . . . . . . . . . . . . . . . . . . . . . . . . . . . . . . . . . . . . . . . . . . . . . . . . . . . . . . . . . . . . . . . . . . . . . . . . . . . . . . . . . . . . . . 82
11. Deferred tax assets and liabilities . . . . . . . . . . . . . . . . . . . . . . . . . . . . . . . . . . . . . . . . . . . . . . . . . . . . . . . . . . . . . . . . . . . . . . . . . . . . . . . . 82
12. Current and non-current financial liabilities . . . . . . . . . . . . . . . . . . . . . . . . . . . . . . . . . . . . . . . . . . . . . . . . . . . . . . . . . . . . . . . . . . . . 82
Other
13. Fees to auditor appointed at the Annual General Meeting . . . . . . . . . . . . . . . . . . . . . . . . . . . . . . . . . . . . . . . . . . . . . . . . . . . . 83
14. Assets charged and contingent liabilities . . . . . . . . . . . . . . . . . . . . . . . . . . . . . . . . . . . . . . . . . . . . . . . . . . . . . . . . . . . . . . . . . . . . . . . 83
15. Financial instruments . . . . . . . . . . . . . . . . . . . . . . . . . . . . . . . . . . . . . . . . . . . . . . . . . . . . . . . . . . . . . . . . . . . . . . . . . . . . . . . . . . . . . . . . . . . . 84
16. Related parties . . . . . . . . . . . . . . . . . . . . . . . . . . . . . . . . . . . . . . . . . . . . . . . . . . . . . . . . . . . . . . . . . . . . . . . . . . . . . . . . . . . . . . . . . . . . . . . . . . . 84
17. Events after the balance sheet date . . . . . . . . . . . . . . . . . . . . . . . . . . . . . . . . . . . . . . . . . . . . . . . . . . . . . . . . . . . . . . . . . . . . . . . . . . . . . 84

WELLTEC® ANNUAL REPORT 2013 FINANCIAL STATEMENTS / 79
NOTES
Basis of accounting
The annual report for 2013 of the parent company Welltec Interna-
tional ApS is presented in accordance with International Financial
Reporting Standards (‘IFRS’) as adopted by the EU and additional
Danish disclosure requirements for annual reports of reporting class
C (large) enterprises. Please see the Danish Executive Order on IFRS
adoption issued in accordance with the Danish Financial Statements
Act.
The annual report is presented in thousands of US dollar (USD),
which also is the functional currency of the parent company.
The accounting policy has been changed compared to 2012.
See Note 1. Accounting policies in the consolidated financial state-
ments for further information.
Differences compared to the group’s accounting policies
The parent company’s accounting policies for recognition and mea-
surement are in accordance with the group’s policies with the ex-
ceptions stated below:
Investments in subsidiaries
Investments in subsidiaries are measured at cost in the parent com-
pany’s financial statements. Where the recoverable amount of the
investments is lower than cost, the investments are written down to
this lower value.
1. ACCOUNTING POLICIES 2. CRITICAL ACCOUNTING JUDGMENTS AND KEY SOURCES OF ESTIMATION UNCERTAINTY
The determination of carrying values and preparation of the annual
report build upon estimates made by Management of the likely ef-
fect of future events on the value of investments and receivables in/
from subsidiaries.
The estimates used build upon assumptions which, in the opinion
of Management, are valid albeit inherently uncertain and unpre-
dictable. An assessment is made of the possibility of recovering the
carrying value of intangible and tangible assets. The assessment of
recoverable amounts is based upon estimated returns generated by
those assets in the cash-generating unit.
3. STAFF COSTS
There have been no employees in the parent company for the finan-
cial years 2011-2013.
See note 4. Staff costs in the consolidated financial statement for
information on remuneration for management
4. FINANCIAL INCOME
(USD in thousands)2013
Restated
2012 2011
Interest income 0 38 36
Interest from subsidiaries and affiliates 53 102 184
Interest income from financial assets that are not measured at fair value through profit or loss
53 140 220
Dividend from subsidiary 0 140,035 0
Total financial income 53 140,175 220

NOTES
80 WELLTEC® ANNUAL REPORT 2013 / FINANCIAL STATEMENTS
6. INCOME TAXES
(USD in thousands)2013
Restated
2012 2011
Current tax (896) (1,200) (1,600)
Adjustment in corporation tax previous years 1.917 (99) 32
Current tax incl. Adj. in corporation tax previous years 1,021 (1,299) (1,568)
Adjustment in deferred tax previous years 0 0 628
Change in deferred tax 0 (1) 1
Income taxes 1,021 (1,300) (939)
A breakdown of tax:
Profit/(loss) before tax (11,999) 119,053 (12,329)
(11,999) 119,053 (12,329)
No income tax has been recognized directly in other comprehensive income (loss) or in equity in 2011, 2012 and 2013.
5. FINANCIAL EXPENSES
(USD in thousands)2013
Restated
2012 2011
Interest expenses (25) (659) (9,614)
Interest expenses to subsidiaries and affiliates (7,339) (11,438) 0
Redemption fee* 0 0 (2,193)
Other financial expenses 0 (2,083) 0
Interest expenses from financial liabilities that are not measured at fair value through profit or loss
(7,364) (14,180) (11,807)
Exchange rate loss (4,323) (6,457) (253)
Total financial expenses (11,687) (20,637) (12,060)
*Redemption fee consists of costs related to refinancing of earlier credit facilities.
The net exchange rate loss at December 31, 2013 was USD 4,323 thousand (a net exchange rate loss of USD 6,457 thousand in 2012 and a net exchange rate loss of USD 253 thousand in 2011).

WELLTEC® ANNUAL REPORT 2013 FINANCIAL STATEMENTS / 81
NOTES
8. CHANGES IN WORKING CAPITAL
(USD in thousands)2013
Restated
2012 2011
Change in receivables and prepayments 5 (6) 103
Change in receivables from subsidiaries and affiliates (net) (8,290) 82,849 13,350
Change in other payables 509 (50) 59
Total changes in working capital (7,776) 82,793 13,512
7. NON-CASH ADJUSTMENTS
(USD in thousands)2013
Restated
2012 2011
Currency adjustments, other (4,323) (313) 656
Total non-cash adjustments (4,323) (313) 656
9. INVESTMENTS IN SUBSIDIARIES
(USD in thousands)2013
Restated
2012
Acquisition cost 01.01 346,319 346,319
Additions 46,257 0
Acquisition cost 31.12 392,576 346,319
The carrying amount of the investment in the subsidiary is pledged as security for issued bonds.
The parent company has an investment in the following subsidiary:
Name
Registered
country 2013 2012
Welltec Holding ApS Denmark 100%* 100%*
* Welltec Holding ApS was acquired on July 27, 2008

82 WELLTEC® ANNUAL REPORT 2013 / FINANCIAL STATEMENTS
11. DEFERRED TAX ASSETS AND LIABILITIES
(USD in thousands)2013
Restated
2012
Deferred tax 01.01 0 (1)
Adjustment in deferred tax previous years 0 6
Change in deferred tax for the year 0 (5)
Deferred tax assets (-)/liabilities 31.12 0 0
Deferred tax breakdown:
Current and non-current liabilities 0 0
Deferred tax assets (-)/liabilities 31.12 0 0
Deferred tax are recognized in the balance with:
Deferred tax assets 0 0
Deferred tax liabilities 0 0
The parent company does not recognize deferred tax losses that are unlikely to be realized or otherwise exposed to major risk or uncertainty.
NOTES
See note 19. Share capital in the consolidated financial statements.
The parent company Welltec International ApS holds no own shares. All own shares bought in 2012 were cancelled
10. SHARE CAPITAL
12. CURRENT AND NON-CURRENT FINANCIAL LIABILITIES
12.1 Maturity dates for financial liabilities
Restated 2012
(USD in thousands)
Less than 1 year
Between 1 and 5 years
Later than 5 years
Total
Payables to subsidiaries 11,713 0 0 11,713
Loan from subsidiary 125,077 0 0 125,077
Other payables 79 0 0 79
Total financial liabilities 136,869 0 0 136,869
All liabilities shown in the table above are measured at amortized cost. The amounts are exclusive of interest.

WELLTEC® ANNUAL REPORT 2013 FINANCIAL STATEMENTS / 83
NOTES
13. FEES TO AUDITOR APPOINTED AT THE ANNUAL GENERAL MEETING
(USD in thousands)
2013
Restated
2012 2011
Statutory audit services 23 22 22
Statutory audit services 23 22 22
Non-audit services:
Opinions 0 0 0
Other 0 0 0
Non-audit services 0 0 0
Total fees to auditors 23 22 22
See note 25. Assets charged and contingent liabilities in the consolidated financial statements.
The debt established under the bond program is guaranteed by Welltec International ApS, Welltec Holding ApS, Welltec Canada Inc.,
Welltec Africa ApS, Welltec Latinamerica ApS, RS 2001 ApS, Welltec (UK) Ltd, Welltec Inc. and Welltec Oilfield Services (RUS) LLC. Sub-
ject to certain exceptions and permitted liens, the debts established under the bond program are secured, by (i) all of the issued shares
of the Issuer and each of the Guarantors (other than Welltec International ApS, Welltec (UK) Ltd and Welltec Oilfield Services (RUS) LLC),
(ii) certain intercompany loans and receivables of the Issuer and the Guarantors, (iii) the bank accounts of the Issuer and certain of the
Guarantors and (iv) certain other assets of certain of the subsidiary Guarantors, including receivables and intellectual property rights.
The bonds and the bond guarantees are secured by first-ranking liens over the same property and assets that will secure the obligations
outstanding under the Revolving Credit Facility, certain hedging obligations and certain other indebtedness.
14. ASSETS CHARGED AND CONTINGENT LIABILITIES
2013
(USD in thousands)
Less than 1 year
Between 1 and 5 years
Later than 5 years
Total
Payables to subsidiaries 4,294 0 0 4,294
Loan from subsidiary 146,535 0 0 146,535
Other payables 588 0 0 588
Total financial liabilities 151,417 0 0 151,417
All liabilities shown in the table above are measured at amortized cost. The amounts are exclusive of interest.

84 WELLTEC® ANNUAL REPORT 2013 / FINANCIAL STATEMENTS
NOTES
For group overview please see note 27. Financial instruments in the consolidated financial statements.
15. FINANCIAL INSTRUMENTS
See note 28. Related parties in the consolidated financial statements.
16. RELATED PARTIES
16.1 Related party transactions
During the year, group entities entered into the following transactions with related parties that are not members of the parent company:
2013 Restated 2012
(USD in thousands) Subsidiaries Affiliates Subsidiaries Affiliates
Purchase of own shares 0 0 0 (45,226)
Dividend 0 0 140,035 (31,955)
Interest income/-expenses (-) (7,339) 53 (11,438) 102
Total transactions (7,339) 53 128,597 77,079
The following balances were outstanding at the end of the reporting period:
(USD in thousands) Amounts owed by related parties Amounts owed to related parties
2013 Restated 2012 2013 Restated 2012
JH Holding. Allerød, ApS 3,724 2,019 0 0
Subsidiaries 64,946 63,069 (150,829) (136,790)
Total balances 68,670 65,088 (150,829) (136,790)
See note 30. Events after the balance sheet date in the consolidated financial statements.
17. EVENTS AFTER THE BALANCE SHEET DATE
Currency risks
The parent company is affected by currency risks on its Intercompany balances with other group companies
The carrying amounts of the foreign currency denominated monetary assets and monetary liabilities at the end of the reporting period
are as follows stated in the material currencies affecting the company:
Assets Liabilities
(USD in thousands) 2013 Restated
2012 2013 Restated
2012
DKK 69,486 65,882 (151,417) (136,869)

WELLTEC® ANNUAL REPORT 2013 FINANCIAL STATEMENTS / 85
*Welltec’s ownership of shares is held by more than one Welltec holding company
GROUP CHART
Welltec GabonBranch
Welltec AS GhanaBranch
Welltec Oilfield Services (Uganda) Limited
(100% Ownership)*
Welltec Oilfield Services (Kazakhstan) LLP
(100% Ownership)*
RS 2001 ApS(100% Ownership)
Welltec Africa ApS(100% Ownership)
Welltec Oilfield Services (Malaysia) Sdn. Bhd.(49% Ownership)
Welltec (UK) Ltd.(100% Ownership)
Welltec Canada Inc.(100% Ownership)
Welltec Oilfield Services Pty. Ltd.
(100% Ownership)
Welltec Latinamerica ApS(100% Ownership)
Pt. Welltec Oilfield Services Indonesia
(95% Ownership)
Welltec Inc.(100% Ownership)
Welltec Oilfield Services (RUS) LLC
(100% Ownership)*
Welltec Oilfield Services (Azerbaijan) Limited(100% Ownership)*
Welltec Oilfield Services (India) Private Limited(100% Ownership)
Welltec Oilfield Services (Saudi Arabia) Ltd.(75% Ownership)
Welltec Angola Lda.(49% Ownership)
Welltec Oilfield Services (Nigeria) Ltd.
(30% Ownership)
Welltec do Brasil Ltda(100% Ownership)
Welltec Venezuela C.A.(100% Ownership)
Welltec Oilfield Services (Mexico) S.A.
(100% Ownership)*
Welltec Latin America ApS Sucursal
Columbiana Branch
Welltec Africa G.E. Branch
WelltecInternational ApS
Welltec Holding ApS(100% Ownership)
Welltec A/S(100% Ownership)
High Pressure Innovation AS
(100% Ownership)
HPI Technology AS (100% Ownership)
Welltec Oilfield Services(South Africa)
(Proprietary) Ltd.(100% Ownership)
Welltec IndiaBranch
Welltec AzerbaijanBranch
Welltec NorwayBranch
Welltec AS Abu DhabiBranch
Welltec Oilfield Services (Congo) S.A.R.L.
Welltec Oilfield Services (Ghana) LLC
(49% Ownership)
Welltec Oilfield Services (Argentina) S.A.
(100% Ownership)*
Welltec Oilfield Services (Ukraine) LLC
(100% Ownership)