janet m. audunson, p.e., esq. senior counsel ii
TRANSCRIPT

300 Erie Blvd. West, A-4, Syracuse, New York 13202 T: 315/428-3411M: 315/[email protected] www.nationalgrid.com
June 30, 2016
VIA ELECTRONIC DELIVERY Honorable Kathleen H. Burgess Secretary New York State Public Service Commission Three Empire State Plaza, 19th Floor Albany, New York 12223-1350
RE: Case 14-M-0101 – Proceeding on Motion of the Commission in Regard to Reforming the Energy Vision (REV)
INITIAL DISTRIBUTED SYSTEM IMPLEMENTATION PLAN
Dear Secretary Burgess: Niagara Mohawk Power Corporation d/b/a National Grid (“National Grid” or the “Company”) hereby submits for filing its initial Distributed System Implementation Plan (“DSIP”) in accordance with the Commission’s April 20, 2016 Order Adopting Distributed System Implementation Plan Guidance in Case 14-M-0101 and the DSIP-related provisions set forth in the Commission’s May 19, 2016 Order Adopting a Ratemaking and Utility Revenue Model Policy Framework in Case 14-M-0101. National Grid’s Benefit Cost Analysis Handbook is included as an attachment to this initial DSIP as directed in the Commission’s January 21, 2016 Order Establishing the Benefit Cost Analysis Framework in Case 14-M-0101. Please direct any questions regarding this filing to: Robert Sheridan Director, Network Solutions New Energy Solutions National Grid 40 Sylvan Road Waltham, MA 02451 Tel.: 781-907-3080
Mobile: 508-328-6373 Email: [email protected]
Janet M. Audunson, P.E., Esq. Senior Counsel II

Hon. Kathleen H. Burgess, Secretary National Grid Initial DSIP Filing June 30, 2016 Page 2
National Grid looks forward to continuing to work collaboratively with Department of Public Service Staff and other stakeholders as the Company embarks on the path to Distributed System Platform provider.
Respectfully submitted,
/s/ Janet M. Audunson Janet M. Audunson, P.E., Esq. Senior Counsel II
Enc. cc: Tammy Mitchell, DPS Staff, w/enclosure (via electronic mail) Michael Worden, DPS Staff, w/enclosure (via electronic mail) Denise Gerbsch, DPS Staff, w/enclosure (via electronic mail) Carlos Nouel, w/enclosure (via electronic mail) Robert Sheridan, w/enclosure (via electronic mail) John Leana, w/enclosure (via electronic mail) Peter Zschokke, w/enclosure (via electronic mail) Pamela Dise, w/enclosure (via electronic mail) Cathy Hughto-Delzer, w/enclosure (via electronic mail) Lauri Mancinelli, w/enclosure (via electronic mail) Thomas Canino, w/enclosure (via electronic mail) Carol Teixeira, w/enclosure (via electronic mail) Kristoffer Kiefer, w/enclosure (via electronic mail)

National Grid Distributed System Implementation Plan
Table of Contents Page i
Table of Contents
List of Acronyms.............................................................................................................................. iii
Executive Summary ........................................................................................................................ 1
Introduction and Background ................................................................................................ 14 1.
Guiding Principles and Priorities ........................................................................................... 19 2.
Ongoing Engagements .......................................................................................................... 21 3.
Stakeholder Engagement .................................................................................................... 21 a.
Demonstration Projects ....................................................................................................... 27 b.
National Grid’s Distributed System Implementation Plan ..................................................... 36 4.
Developing DSP Capabilities ............................................................................................... 36 a.
System Planning ............................................................................................................... 36 i.
Criteria, Process and Tools ........................................................................................... 38 1.
System Data................................................................................................................... 41 2.
Advanced Analytics Platform ......................................................................................... 43 3.
Load and DER Forecasting ........................................................................................... 44 4.
Hosting Capacity Analysis ............................................................................................. 50 5.
Non-Wires Alternative Opportunities ............................................................................. 52 6.
Market Enablement and Operations ................................................................................. 58 ii.
Energy Efficiency ........................................................................................................... 58 1.
DG Interconnections ...................................................................................................... 61 2.
Distribution Demand Response Program ...................................................................... 65 3.
Customer Portals and DERMS ...................................................................................... 71 4.
Emerging Technologies ................................................................................................. 76 5.
Advanced Metering Functionality ........................................................................................ 82 b.
Grid Modernization............................................................................................................... 90 c.
IT/OT Convergence .......................................................................................................... 91 i.
Telecommunications and Networking .............................................................................. 97 ii.
Control Center Enhancements ....................................................................................... 100 iii.
Integrated Data Management ......................................................................................... 107 iv.
Grid Edge Monitoring ...................................................................................................... 108 v.
Advanced Distribution Automation ................................................................................. 109 vi.
Volt-VAR Optimization .................................................................................................... 110 vii.

National Grid Distributed System Implementation Plan
Table of Contents Page ii
Field Force Mobility................................................................................................... 112 viii.
Cybersecurity and Privacy ................................................................................................. 114 d.
Benefits ................................................................................................................................ 120 5.
BCA Handbook .................................................................................................................. 120 a.
DSIP Benefits ..................................................................................................................... 121 b.
Investment Planning ............................................................................................................ 124 6.
Appendices ................................................................................................................................. 131

National Grid Distributed System Implementation Plan
List of Acronyms Page iii
List of Acronyms
Acronyms and abbreviations are used extensively throughout this initial DSIP and are presented here at the front for ease of reference.
3V0: Zero Sequence Voltage AC: Air Conditioning ADA: Advanced Distribution Automation ADMS: Advanced Distribution Management System AMF: Advanced Metering Functionality AMF Business Case: Advanced Meter Functionality Business Case attached as
Appendix 3. AMI: Advanced Metering Infrastructure AMR: Automated Meter Reading ANSI: American National Standards Institute API: Application Programming Interfaces BCA: Benefit Cost Analysis BCA Framework: The benefit-cost framework structure presented initially in the
“Staff White Paper on Benefit Cost Analysis” and finalized in the BCA Order
BCA Handbook: Benefit Cost Analysis Handbook attached as Appendix 1 in accordance with the BCA Order
BCA Order: Case 14-M-0101 – Proceeding on Motion of the Commission in Regard to Reforming the Energy Vision, Order Establishing the Benefit Cost Analysis Framework (Issued January 21, 2016)
BNMC: Buffalo Niagara Medical Campus BYOT: Bring Your Own Thermostat CCA: Community Choice Aggregation CCO: Control Center Operations CDG: Community Distributed Generation CEF: Clean Energy Fund CES: Clean Energy Standard CHP: Combined Heat and Power C&I: Commercial and Industrial CIM: Common Information Model CIP: Capital Investment Plan CIS: Comprehensive Integration Services CMI: Customer Minutes Interrupted Commission: New York State Public Service Commission
National Grid Distributed System Implementation Plan
List of Acronyms Page iv
CPP: Critical Peak Pricing CSRP: Commercial System Relief Program CVR: Conservation Voltage Reduction DER: Distributed Energy Resources DERMS: Distributed Energy Resource Management System DG: Distributed Generation DLC: Direct Load Control DLM: Dynamic Load Management DLRP: Distribution Load Relief Program DMS: Distribution Management System DMZ: Demilitarized Zone DOE: Department of Energy DR: Demand Response DR&S: Digital Risk and Security DSCADA: Distribution Supervisory Control and Data Acquisition DSIP: Distributed System Implementation Plan DSIP Guidance Order: Case 14-M-0101 – Proceeding on Motion of the Commission in
Regard to Reforming the Energy Vision, Order Adopting Distributed System Implementation Plan Guidance (issued April 20, 2016).
DSP: Distributed System Platform EE: Energy Efficiency EEPS: Energy Efficiency Portfolio Standard EFT: Early Field Trial EMS: Energy Management System EPRI: Electric Power Research Institute EPS: Electric Power System ERT: Encoder Receiver Transmitters ESCOs: Energy Service Companies ETIP: Energy Efficiency Transition Implementation Plan EV: Electric Vehicle EVSE: Electric Vehicle Supply Equipment FLISR: Fault Location, Isolation, and Service Restoration FY: Fiscal Year GIS: Geographic Information System HAN: Home Area Network HVAC: Heating, Ventilating, and Air Conditioning
National Grid Distributed System Implementation Plan
List of Acronyms Page v
IEEE: Institute of Electrical and Electronics Engineers IHD: In-Home Display INOC: Integrated Network Operations Center IS: Information Services ISMS: Information Security Management System IT/OT: Information Technology/Operational Technology ITWG: Interconnection Technical Working Group Joint Utilities: The Joint Utilities consist of Consolidated Edison Company of
New York, Inc., Orange and Rockland Utilities, Inc., Central Hudson Gas & Electric Corporation, Niagara Mohawk Power Corporation d/b/a National Grid, New York State Electric and Gas Corporation, and Rochester Gas & Electric Corporation
kV: Kilovolt kW: Kilowatt kWh: Kilowatt Hour LAN: Local Area Network LMI: Low- to Moderate-Income LMP+D Location-based Marginal Price + Distribution-level resource values LROV: Load Rejection Over-Voltage LSR: Large-Scale Renewables MACNY: Manufacturers Association of Central New York MDPT: Market Design and Platform Technology MHz: Megahertz MI: Multiple Intervenors MPLS: Multiprotocol Label Switching MW: Megawatt MWh: Megawatt Hour NEC: National Electrical Code NEM: Net Energy Metering NERC: North American Electric Reliability Corporation NGSC: National Grid USA Service Company, Inc. NIST: National Institute of Standards and Technology NWA: Non-Wires Alternative NY Prize: NYSERDA New York Prize Community Microgrid Competition NYISO: New York Independent System Operator NYSERDA: New York State Energy Research and Development Authority NYSRC: New York State Reliability Council

National Grid Distributed System Implementation Plan
List of Acronyms Page vi
O&E: Outreach and Education O&M: Operation and Maintenance OMS: Outage Management System OPGW: Optical Ground Wire P2P: Point-to-Point PEV: Plug-in Electric Vehicles POC: Point of Control PQ: Power Quality PTR: Peak-Time Rebate PV: Photovoltaic REV: Reforming the Energy Vision RFI: Request for Information RIM: Rate Impact Measure RFP: Request for Proposal RTU: Remote Terminal Units SAIDI: System Average Interruption Duration Index SCADA: Supervisory Control and Data Acquisition SCT: Societal Cost Test SES: Smart Energy Solutions SIR: Standard Interconnection Requirements Staff: New York State Department of Public Service Staff T&D: Transmission and Distribution TOU: Time-of-Use Track One Order: Case 14-M-0101 – Proceeding on Motion of the Commission in
Regard to Reforming the Energy Vision, Order Adopting Regulatory Policy Framework and Implementation Plan (issued February 26, 2015)
Track Two Order: Case 14-M-0101 – Proceeding on Motion of the Commission in
Regard to Reforming the Energy Vision, Order Adopting a Ratemaking and Utility Revenue Model Policy Framework (issued May 19, 2016)
UCT: Utility Cost Test
VVO: Volt-VAR Optimization
VAP: Vendor Assurance Program
VAR: Volt-Ampere Reactive
WBH: WeatherBug Home
WAN: Wide Area Network

National Grid Distributed System Implementation Plan
Executive Summary Page 1
Executive Summary
Niagara Mohawk Power Corporation d/b/a/ National Grid (“National Grid” or the “Company”) is pleased to provide its initial Distributed System Implementation Plan (“DSIP”) in an effort to advance the objectives of New York State’s Reforming the Energy Vision (“REV”) Proceeding. The contents of this initial DSIP are focused on the elements of REV addressed in the New York State Public Service Commission’s (the “Commission”) Track One Order,1 and the Commission’s DSIP Guidance Order,2 as well as the DSIP-related provisions set forth in the Commission’s recently issued Track Two Order.3 The Company’s Benefit Cost Analysis (“BCA”) Handbook is also included as Appendix 1 to this initial DSIP as directed in the Commission’s BCA Order.4 Updates to the BCA Handbook are also to be filed contemporaneously with each subsequent DSIP filing, scheduled to be updated every other year.5
On April 25, 2014 the Commission initiated the REV Proceeding in Case 14-M-01016 with the following policy objectives:
Enhanced customer knowledge and tools that will support effective management of the total energy bill;
Market animation and leverage of customer contributions; System wide efficiency; Fuel and resource diversity; System reliability and resiliency; and Reduction of carbon emissions.
This initial DSIP marks the starting point for National Grid along its evolution as a Distributed System Platform (“DSP”) provider. The contents of this initial DSIP are intended to:
Inform customers and stakeholders as to the existing capabilities of the Company and the compatibility of its transmission and distribution (“T&D”) system with respect to the objectives of REV and the functionalities of a DSP;
Provide information to stakeholders that may facilitate the integration of increasing penetrations of Distributed Energy Resources (“DER”); and
1 Case 14-M-0101 – Proceeding on Motion of the Commission in Regard to Reforming the Energy Vision (“REV
Proceeding”), Order Adopting a Regulatory Policy Framework and Implementation Plan (issued February 26, 2015)
(“Track One Order”). 2 REV Proceeding, Order Adopting Distributed System Implementation Plan Guidance (issued April 20, 2016) (“DSIP
Guidance Order”). 3 REV Proceeding, Order Adopting a Ratemaking and Util ity Revenue Model Policy Framework (issued May 19,
2016) (“Track Two Order”). 4 REV Proceeding, Order Establishing the Benefit Cost Analysis Framework (issued January 21, 2016) (“BCA Order”).
5 See DSIP Guidance Order, pp. 63-64, at Ordering Clause 4, requiring the fi l ing of “subsequent Distributed System
Implementation Plans on a biennial basis beginning June 30, 2018.” 6 REV Proceeding, Order Instituting Proceeding (issued April 25, 2014).

National Grid Distributed System Implementation Plan
Executive Summary Page 2
Present a roadmap and five-year plan of potential investments to enhance the Company’s DSP capabilities.
This initial DSIP addresses the development of the Company’s DSP capabilities in four focus areas: DSP Development; Advanced Metering Functionality (“AMF”); Grid Modernization; and Cybersecurity and Privacy.
DSP Development To progress in this area the Company will deploy multiple customer portals to share key distribution system information, facilitate DER interconnections, and enable customers to better manage their energy consumption; develop an advanced analytics platform to enable hosting capacity analysis, bottom-up DER and load forecasting, and evaluation of NWA; and begin to evaluate future implementations of distributed energy resource management systems (“DERMS”) and DSP technologies. Capital and operations and maintenance (“O&M”) investments in the first five years are estimated at approximately $40M (in 2016 dollars).
AMF The Company completed an assessment of various advanced metering deployment scenarios and considered costs and benefits in accordance with the BCA Handbook. A Company-wide deployment of AMF, for both electric and gas customers, has positive cost/benefit ratios and is proposed. Deployment is anticipated to begin in 2018 and extend beyond the horizon of the initial DSIP, concluding in 2024. Capital and O&M investments in the first five years are estimated at approximately $256M (in 2016 dollars) and an additional $316M (in 2016 dollars) is forecasted over the subsequent five year period.
Grid Modernization The Company identified the need for grid modernization investments similar to those discussed in this plan in its “2014 Electric Transmission and Distribution 15 Year Plan” but they are not yet in an approved rate plan. Proposed projects in this area include enhancement to information systems architecture, telecommunications, control center systems, and automated distribution equipment, to improve the monitoring of granular system data, automated service restoration, and voltage optimization. The deployment of back office and control center applications discussed in this plan are multi-year projects and the deployment schedule extends beyond the five year horizon of this plan. The deployment of distribution automation devices in the field will be long term programs and the technology will be rolled out over many years feeder by feeder. Capital and O&M Investments in the first five years are estimated at approximately $269M (in 2016 dollars).
Cybersecurity and Privacy The integration of utility and third-party systems will increase the vulnerability for cybersecurity threats and the improper access to private information. A strong framework for cyber protections is imperative and the Company has developed a five-year plan to provide the

National Grid Distributed System Implementation Plan
Executive Summary Page 3
necessary security and privacy services. Capital and O&M investments in the first five years are estimated at approximately $64M (in 2016 dollars).
It is the intention of the Company to seek cost recovery for spending associated with this initial DSIP in the Company's next rate case filing, which it anticipates filing with the Commission within the first half of 2017. The Development of National Grid’s Initial DSIP National Grid’s Guiding Principles National Grid is committed to providing safe, reliable, and affordable service to customers. At the same time, the Company needs to continuously evolve in the way it invests for growth, operates it electric and gas delivery systems, and serves its customers, by addressing cybersecurity, customer privacy, environmental sustainability, and resiliency.
National Grid is aligned with the objectives of REV as demonstrated by the Company’s Connect21 strategy. Progressing the objectives of REV will be a continuous and evolving process over many years and many projects.
The following tenets are shaping National Grid’s roadmap for the future:
First, we must put customers in charge. Customers will make the right choices if they have the right tools and information.
Second, we must embrace our technology partners. We need to open our networks to high-tech partners focused on energy efficiency (“EE”), energy storage, and distributed generation (“DG”), and turn the grids into innovation playgrounds.
Last, yet most important, we must change how utilities are regulated and financed. Traditional utility regulation has not prioritized aggressive investments in innovation and infrastructure. We see REV as an opportunity to transform the regulator-utility-customer relationship.
This initial DSIP has been developed with ongoing engagement and feedback from stakeholders, lessons learned from recent and ongoing projects, and consideration of the State’s policy objectives. Continuing to “listen, test and learn” will be critical as the expectations of REV and the DSP evolve. Listen, Test and Learn
The Company and its subject-matter experts have been actively engaged in the REV Proceeding and related proceedings since their inception two years ago. During this same period National Grid and its affiliates have engaged with customers and key stakeholders in various initiatives and demonstration projects to enhance the understanding of customer

National Grid Distributed System Implementation Plan
Executive Summary Page 4
expectations, and have learned valuable lessons concerning customer offerings and the integration of new technologies and processes.
A formal stakeholder engagement plan specific to the development of the initial and supplemental DSIPs was filed by the Joint Utilities on May 5, 2016 in compliance with the DSIP Order7 and continues to evolve as the result of initial stakeholder engagements. While that submission identified a robust process for garnering stakeholder input, the breadth of stakeholder engagements goes beyond the formal processes described in the May 5, 2016 filing as discussed in more detail within this initial DSIP.
The best lessons are learned through doing. In recent years National Grid and its affiliates in New England have been actively testing and demonstrating many of the functionalities that will be essential to progress the REV objectives. This initial DSIP has been informed by several small scale projects by National Grid and its affiliates and will discuss how the REV demonstration projects will inform a number of DSIP project implementations.
In July 2015 National Grid filed four proposed REV demonstration projects with the Commission to test business models and new avenues of customer engagement. Since then the Company has been working with Department of Public Service staff (“Staff”) to refine the scope of work and progress the projects. Three REV demonstration projects, Fruit Belt Neighborhood Solar, Potsdam Community Resilience, and Distributed System Platform, have received the green light from Staff and are in varying stages of implementation. The refinement of the project scope for the proposed Clifton Park Demand Reduction REV demonstration project is nearing completion.
Lessons learned will be compiled throughout project implementation to continue to shape the development of projects considered in this initial DSIP. The proposed Clifton Park demonstration project includes AMF and volt-VAR optimization (“VVO”) / conservation voltage reduction (“CVR”) elements that will directly impact the larger-scale deployment of these technologies planned in future years. Similarly, the DSP demonstration project will inform the long-term plans for DERMSs and other DSP technologies that are anticipated to be needed soon after the five-year horizon of this initial DSIP.
The Company also has benefitted from demonstration projects undertaken by National Grid affiliates in other jurisdictions. Most notable is the Smart Energy Solutions (“SES”) pilot program in Worcester, Massachusetts. This comprehensive pilot included testing different advanced grid applications on eleven distribution feeders, deployment of approximately 15,000 advanced
7 REV Proceeding, Stakeholder Engagement Plan of Central Hudson Gas & Electric Corporation, Consolidated Edison Company of New York, Inc., New York State Electric & Gas Corporation, Niagara Mohawk Power Corporation d/b/a National Grid, Orange and Rockland Util ities, Inc., and Rochester Gas and Electric Corporation
(collectively, the “Joint Util ities”) (fi led May 5, 2016).

National Grid Distributed System Implementation Plan
Executive Summary Page 5
meters, implementation of time-varying rates, and a multiple-tiered offering of various load management tools that customers could choose from. Initial results from the first year of the pilot are favorable and have provided insights that National Grid has leveraged for this initial DSIP.
National Grid’s Initial Distributed System Implementation Plan
National Grid serves approximately 1.6 million electric customers in Upstate New York. The Company’s service territory covers over 25,000 square miles and includes everything from densely populated urban areas in Buffalo, Syracuse, and Albany, to remote and sparsely populated rural areas throughout Upstate New York. The Company’s peak demand in 2015 was 6,622 MW which was 7% below the Company’s all-time high of 7,150 MW reached on July 21, 2011.
The electric T&D infrastructure that spans the Company’s service territory and forms the “grid” has been put in place over decades and is comprised of many different generations of technology. Today’s grid is performing well and consistently meeting reliability targets and is interconnecting distributed generation in exponentially increasing volumes. However, there are a number of challenges to achieving REV objectives across the National Grid service territory given that:
Only 0.3% of customers have interval meters; Only 50% of the Company’s distribution substations and feeder circuits have interval
metering; More than 50% of the distribution line miles operate below 5 kV and as such have limited
capacity to host significant DER; and There is limited two-way communication with distribution equipment located outside of
the substation.
A safe, reliable, and resilient T&D system is critical to serving the needs of customers, and investment to address additional system needs are still necessary. To achieve the degree of integration necessary to progress REV objectives, additional investments are necessary for system monitoring, information management, and platform control.
1. Development of DSP Capabilities The development of DSP capabilities is a key area of focus in this initial DSIP including efforts to integrate DER into system planning and early actions to animate the market. This DSIP will discuss the Company’s plans to integrate DER system planning and operations.

National Grid Distributed System Implementation Plan
Executive Summary Page 6
System Data
The planning cycle begins and ends with system monitoring which relies on data. Situational awareness is critical for DSP planners as well as active participants who may be, or wish to be, integrated with the system.
A key objective of the DSIP is to provide transparency of system needs and information that may lead to the most efficient operation of the grid through the combined utilization of utility and third-party resources. National Grid has developed a System Data Portal that will make data available to third-parties and customers. The System Data Portal will provide reliability data, distribution system 8760 hour load profiles where they are available, the Company’s current load and DER forecast, and capital investment details. In addition, information with regard to the ability of the distribution system to host additional DER and to identify the areas of the distribution system where DER may best be located to provide grid benefits will be presented via online interactive maps. The Company will schedule a number of engagement sessions over the summer to demonstrate the functionality of the new portal. The System Data Portal can be accessed at the following URL: http://arcg.is/28XscPy.
Load and DER Forecasting
National Grid currently produces top-down peak demand forecasts of electric system growth. These forecasts are produced at various aggregated geographic and customer grouping levels and apply regulatory and market-driven policies, and their impacts, on a Company-wide perspective.
National Grid’s most recent load forecast estimates low growth (0.1% annually) over a fifteen-year horizon considering the economic outlook and increasing adoption of EE and DG.

National Grid Distributed System Implementation Plan
Executive Summary Page 7
Figure 4-5 National Grid Upstate New York Coincident Summer Peak Forecast
Over the next fifteen years EE is expected to reduce the system peak by 0.4% annually and DG (predominantly solar photovoltaic (“PV”)) is expected to reduce the system peak by 0.7% annually.
Advancements in load and DER forecasting are necessary in order to enhance load and DER forecasting both temporally and geographically. System load forecasting in the future will be a very detailed and data-intensive probabilistic integration of economic modeling, weather normalization, modeling of customer response to numerous market offerings, and T&D system capabilities. An analytics platform and a number of new tools, models, and intensive cloud computing capabilities will need to be utilized in the development of new forecasting processes. The full range of forecasting advancements will be delivered over a five-year period.
Hosting Capacity Analysis
Hosting capacity is defined as the amount of DER that can be accommodated without adversely impacting power quality or reliability under existing control configurations and without requiring electric system infrastructure upgrades.
National Grid anticipates linking its tools for distribution load flow with a hosting capacity analysis application being developed by the Electric Power Research Institute (“EPRI”) to determine the level of hosting capacity on each distribution feeder. The assessment of each

National Grid Distributed System Implementation Plan
Executive Summary Page 8
individual feeder will take significant time and resources. This initial DSIP describes a phased approach for providing increasingly detailed hosting capacity information over time.
Non-Wires Alternatives Opportunities National Grid adopted guidelines for the review and consideration of non-wires alternatives (“NWAs”) in the Company’s planning processes in 2011. The guidelines outline two stages of review: one to identify potential areas of need in which NWAs may be feasible; and one to determine NWA feasibility and design, if applicable, for each area of need.
The Company is currently evaluating one NWA to resolve issues in an area near the Village of Baldwinsville, a suburb of Syracuse. Loading on the substations serving portions of the Towns of Lysander and Van Buren and all of the Village of Baldwinsville has increased to a level at which the load at risk for a single T&D contingency exceeds the acceptable risk threshold in National Grid’s Distribution Planning Criteria. The Company is seeking NWA proposals that will reduce the area’s load at risk in order to maintain reliability performance. The Company is currently evaluating the responses to request for proposals (“RFPs”) issued for this project.
In the development of this initial DSIP, the Company broadened its NWA considerations in an attempt to identify additional projects for which NWAs may be appropriate. Six projects with potential investments totaling over $17M have been identified for vendor solicitations to consider the NWA potential for those projects. A seventh opportunity has also been preliminarily identified but that project is early in the planning process and therefore a budget has not yet established. Solicitations through RFPs for these potential NWA projects are expected to be undertaken by year end.
Customer Portals National Grid is developing several portal applications to facilitate customer access to information and enhance customer engagement. These include the System Data Portal discussed above, a DG application portal, an online Audit and E-Commerce Platform for EE measures, and a Customer Energy Management and Connected Device Platform to help customers view and better manage their energy usage.
2. Advanced Metering Functionality
The impacts of AMF are broad and are expected to provide benefits across system planning, grid operations and market enablement/operations. As such, AMF is presented in this initial DSIP as its own focus area.
Timely interval data from advanced metering will provide new opportunities for customers and their energy service providers to manage their energy. Currently, National Grid utilizes an automated meter reading (“AMR”) system that retrieves energy consumption from the majority
National Grid Distributed System Implementation Plan
Executive Summary Page 9
of customers on a monthly basis only. The Company conducted an AMF study to assess the benefits and costs of replacing its AMR system with a state-of-the-art system that provides two-way communications so that interval metering data is available on a very frequent basis, in one day or less. In addition to addressing meter-to-cash functionalities, AMF and its supporting two-way communications provides additional benefits for system operations including grid edge monitoring, remote reads, and remote connect/disconnect. Additional customer benefits can be realized with the availability of more granular consumption data and the ability to integrate with home area networks (“HANs”) and intelligent load management and demand response (“DR”) devices.
Multiple deployment options were considered for this filing including a full system deployment, a targeted deployment, and a customer opt-in deployment. A benefit-cost analysis was completed in alignment with the recommendations of the BCA Order.
The AMF Business Case, attached as Appendix 3, supports full deployment of AMF across the Company’s service territory. Ultimately, National Grid’s customers, its electric grid, energy service providers, and the State will be able to realize substantial benefits from a Company, consumers, and societal perspective, all while working toward the common goals set forth in REV. The technology and systems proposed as part of this AMF deployment provide considerable benefits in the near term and also a solid foundation for the future.
3. Grid Modernization
This area of focus includes efforts to develop the information architecture necessary to effectively integrate systems both internal and external to the DSP, enhance control center operations to manage a more dynamic distribution system, and deploy advanced monitoring and control systems beyond the bounds of the substation fence to manage the distribution system at the edge. Grid Operations National Grid is responsible for the safe, economic, and reliable delivery of electricity service to our customers and the safety and protection of Company personnel and equipment.
The proliferation of DER increases the complexity of the distribution grid and escalates the challenges associated with daily and emergency operation. Operators must be aware of the location and performance of all DER assets to assess their impact on the electric delivery system. The current DG interconnected on the system has not yet posed a significant impact on operation of the delivery system. However, the penetration of DG is increasing rapidly and system operations are becoming more complex.
National Grid Distributed System Implementation Plan
Executive Summary Page 10
The integration of DER at this level into real-time grid operations will require significant enhancements in telecommunications and information management systems to coordinate the interactions of large volumes of interdependent devices within a complex system that must continuously remain balanced and stable. The grid modernization investments proposed are foundational to enable the envisioned transactional markets on the delivery system. Information Technology/Operational Technology (“IT/OT”) Integration National Grid utilizes a large number of information systems, however they are not as integrated as necessary to support the DSP functionalities. Many of these systems do not move data in real time, which inherently limits their capabilities.
To develop the necessary DSP functionalities, National Grid proposes an information management approach that will enable a platform for convergence of application services. The major components of the architectural framework are a set of services comprised of:
Applications and Devices; Communications and Networking Services; Enterprise Advanced Analytics Services; Integrated Network Operations Center (“INOC”); Enterprise Information Management; GIS / Mapping Services; Customer Engagement and Interaction Services; and Cybersecurity.
Implementation of the enhanced information system architecture and enhanced services in this initial DSIP will be completed in phases and extend beyond the horizon of this initial DSIP.
Telecommunications
National Grid currently utilizes a number of different communications technologies for the collection of meter, T&D system data, and substation information. The existing telecommunication networks that support these functions need to be upgraded and expanded.
The Company proposes a tiered telecommunications strategy that integrates various technologies and service providers in support of all grid and market operations including AMF, distribution automation, and substation protection and operational control. The Company will utilize communications capable of 900 MHz unlicensed mesh topology and 4G cellular networks in most cases. This integrated telecommunications system will enable collection of interval customer data, voltage, real-time consumption, and real-time power state. In addition, it will

National Grid Distributed System Implementation Plan
Executive Summary Page 11
provide a means for receiving near real-time customer consumption data and delivering utility DR communications to the customer.
Control Center Enhancements The integrated electric delivery grid will require enhanced situational awareness and sophisticated management systems to operate reliably and safely. National Grid has developed a comprehensive road map of future enhancements. Control center operations currently utilize supervisory control and data acquisition (“SCADA”), energy management system (“EMS”), and operation management system (“OMS”) as the primary management tools. The proposed elements on the roadmap will leverage and build on the recent EMS/OMS deployments.
There is currently limited automation capability of the Company’s distribution system. National Grid proposes investment in advanced distribution management system (“ADMS”) capabilities and the deployment of sensors and advanced controllers on distribution equipment to enable real time response to system events. ADMS capabilities will allow for improvements in operations resulting in fewer customers impacted by sustained interruptions, faster response to outages, and an improved efficiency of grid operations.
4. Cybersecurity
This overarching area of focus ensures that all elements of the integrated electric grid maintain the privacy of customer information and are secure from current and future cyber threats.
Threats to the cybersecurity of critical infrastructure emanates from a wide spectrum of potential perpetrators: domestic terrorism, international terrorism, domestic militants, malevolent ‘hacktivists’, or even disaffected insiders. The cyber threat to the electric grid is one that is real, particularly as threats continue to evolve and become more sophisticated.
A risk-based cybersecurity framework is proposed across people, process and technology. Such a framework will: (i) provide a common language for understanding and managing cybersecurity risk; (ii) aid in help identifying and prioritizing actions for reducing cybersecurity risk; and (iii) be a tool for aligning policy, business, and technological approaches to managing that risk. The framework will allow National Grid to align its cybersecurity activities with its business requirements, risk tolerances, and resources.
Benefits of the DSIP Proposals In aggregate, the investments proposed in this initial DSIP will have long-term benefits that are expected to increase as customer awareness develops and the market matures. Key objectives in REV include increased DER penetration and the utilization of these varied resources and
National Grid Distributed System Implementation Plan
Executive Summary Page 12
services to improve the efficiency of the electric power system. The elements of National Grid’s plans are intended to meet this challenge.
The Company is providing its BCA Handbook as Appendix 1 to this initial DSIP. The principles of the handbook have been initially applied in the assessment of the AMF and VVO programs proposed in this initial DSIP.
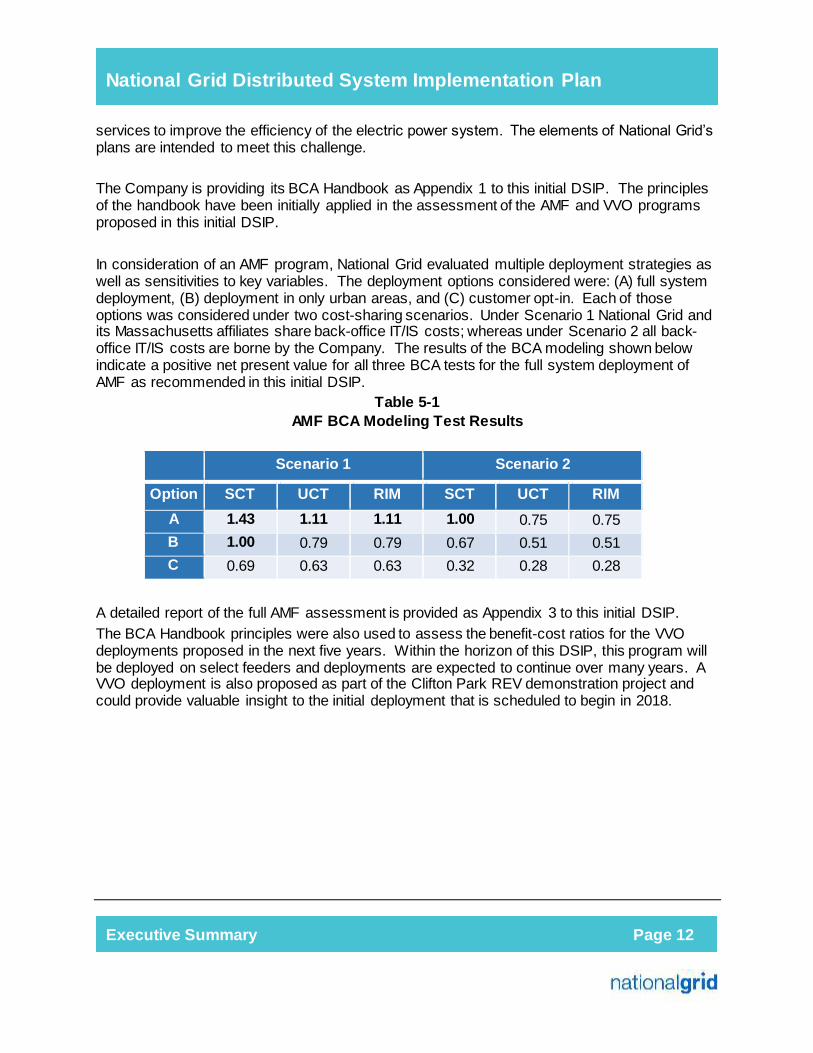
In consideration of an AMF program, National Grid evaluated multiple deployment strategies as well as sensitivities to key variables. The deployment options considered were: (A) full system deployment, (B) deployment in only urban areas, and (C) customer opt-in. Each of those options was considered under two cost-sharing scenarios. Under Scenario 1 National Grid and its Massachusetts affiliates share back-office IT/IS costs; whereas under Scenario 2 all back-office IT/IS costs are borne by the Company. The results of the BCA modeling shown below indicate a positive net present value for all three BCA tests for the full system deployment of AMF as recommended in this initial DSIP.
Table 5-1 AMF BCA Modeling Test Results
Scenario 1 Scenario 2
Option SCT UCT RIM SCT UCT RIM A 1.43 1.11 1.11 1.00 0.75 0.75
B 1.00 0.79 0.79 0.67 0.51 0.51
C 0.69 0.63 0.63 0.32 0.28 0.28
A detailed report of the full AMF assessment is provided as Appendix 3 to this initial DSIP.
The BCA Handbook principles were also used to assess the benefit-cost ratios for the VVO deployments proposed in the next five years. Within the horizon of this DSIP, this program will be deployed on select feeders and deployments are expected to continue over many years. A VVO deployment is also proposed as part of the Clifton Park REV demonstration project and could provide valuable insight to the initial deployment that is scheduled to begin in 2018.

National Grid Distributed System Implementation Plan
Executive Summary Page 13
Table 5-2 VVO/CVR BCA Ratios
As shown in the table above, the societal cost test (“SCT”) ratio is beneficial for VVO while the utility cost test (“UCT”) ratio is below 1.0. The measurement and verification of early deployments will help refine project designs, the BCA evaluations, and prioritization of targeted deployments.
Going forward the Company’s intent is to apply the BCA Handbook to additional investment including:
1. Investments in DSP capabilities; 2. Procurement of DER through competitive selection (i.e., procurement of NWAs); 3. Procurement of DER through tariffs;8 and 4. EE programs.
8 These may include, for example, demand response tariffs or successor tariffs to net energy metering (“NEM”).

National Grid Distributed System Implementation Plan
Introduction and Background Page 14
Introduction and Background 1. Introduction National Grid herein provides its initial DSIP, documenting the Company’s existing capabilities to accommodate and host DERs as well as near-term plans to enhance its capabilities as the DSP provider and advance the objectives of the REV Proceeding within the National Grid electric service territory.
In furtherance of those objectives, and in accordance with BCA Order, the Company also provides its BCA Handbook as Appendix 1. National Grid will also update the BCA Handbook contemporaneously with each subsequent DSIP filing, scheduled to occur every other year.9
This initial DSIP is organized as follows: Chapter 2 details the close alignment of the Company’s Connect21 framework with the REV objectives; Chapter 3 summarizes the Company’s ongoing efforts around stakeholder engagement and numerous pilot-scale projects, across all of its jurisdictions, that have helped shape the DSIP; Chapter 4 provides a detailed discussion of near-term plans to establish the Company as the DSP and animate the retail market; and Chapter 5 discusses the company’s BCA Handbook and its application in this DSIP; and Chapter 6 discusses the company’s budget process and historical spending.
The Company has put a substantial effort into crafting this initial DSIP to address the full spectrum of issues presented in the Commission’s guidance documents and orders. To that end, this initial DSIP focuses on four areas: (1) projects and programs to develop DSP capability through integrated system planning and market enablement/operations; (2) the deployment of AMF as a broad enabler; (3) modernization of grid operations; and (4) an overarching strategy for cybersecurity and privacy. A key tenet of the DSP is the integration of systems, information and technologies. Achieving that integration, however, requires interdependent project designs, which presents challenges for the allocation of costs and benefits. As such, cost and schedule information provided in this initial DSIP are preliminary and additional engineering is required in advance of implementation. Moreover, while this initial DSIP addresses projects individually, those projects have been developed in an integrated fashion and changes made to one element may result in the need to redesign another element. The Commission required the initial DSIPs to consider a five-year horizon; some projects and programs, however, that are initiated in the first five years will continue with deployments beyond that horizon (those instances are noted herein as appropriate). Likewise, as demonstration projects produce results and the REV Proceeding progresses, project and program plans will be refreshed and presented in future DSIPs.
9 See DSIP Guidance Order, pg. 63-64, at Ordering Clause 4, requiring the fi l ing of “subsequent Distributed System
Implementation Plans on a biennial basis beginning June 30, 2018.”

National Grid Distributed System Implementation Plan
Introduction and Background Page 15
Background
On April 25, 2014 the Commission initiated the REV Proceeding in with the following policy objectives:
Enhanced customer knowledge and tools that will support effective management of the total energy bill;
Market animation and leverage of customer contributions; System wide efficiency; Fuel and resource diversity; System reliability and resiliency; and Reduction of carbon emissions.
The REV Proceeding has progressed along two tracks: Track One focuses on developing distributed resource markets, inclusive of market design and platform technologies while Track Two focuses on reforming utility ratemaking practices. The content of this initial DSIP focuses on the elements of REV addressed in the Track One Order, as well as the DSIP-related provisions set forth in the Track Two Order.
In the Track One Order the Commission indicated that utilities would become the initial DSP providers having responsibility for: integrated system planning, grid operations, and market operations. The Track One Order also stipulated that each utility would deliver DSIPs and stated, “…the Distributed System Implementation Plan (DSIP) which will be a multi-year plan filed with the Commission, subject to public comment, and updated regularly. The DSIP will contain (among other things) a proposal for capital and operating expenditures to build and maintain DSP functions, as well as the system information needed by third parties to plan for effective market participation.”10
On April 20, 2016 the Commission issued the DSIP Guidance Order which sets out the requirements for this initial DSIP. As described in the Track One Order, the goal of the DSIP is to “serve as a source of public information regarding DSP plans and objectives, including specific system needs allowing market participants to identify opportunities [as well as to] serve as the template for utilities to develop and articulate an integrated approach to planning, investment, and operations, . . . enabl[ing] the Commission to supervise the implementation of REV in the context of system operations.”11 The Commission continued, “[t]he DSIP will contain (among other things) a proposal for capital and operating expenditures to build and maintain DSP functions, as well as the system information needed by third-parties to plan for effective market participation.”
12
10
Track One Order, p. 32 (emphasis added). 11
DSIP Guidance Order, p. 8. (citing Track One Order, p. 129). 12
Id. (citing Track One Order, p. 32).

National Grid Distributed System Implementation Plan
Introduction and Background Page 16
The Commission reiterated its DSIP goals in the Track Two Order. As with its earlier statements, the Commission emphasized the important role the DSIP process will play in facilitating market development, DER integration, and profit opportunities for all parties through “improved access to system and customer information.”13 Further, the Commission explained that the DSIP will serve as the foundation for its “careful review” of the utilities’ initial investment decisions to build DSP functionalities. That review is aimed at “reduc[ing] overall risk” and positively “affect[ing] the cost of not only DSP investments but all utility investments.”14
The open process offered by the DSIPs is intended to promote utility/stakeholder relations, allow third parties to provide cost-effective market solutions to identified energy needs, expand the use of DER, and increase EE measures. Furthermore, making utility data and planning processes more visible to all parties will encourage beneficial DER solutions and investments that will maximize use of the distribution system to meet customer needs. The Commission envisions the DSIP process as a multi-year plan, subject to public comment and regular updates.
In the DSIP Guidance Order, the Commission requires utilities to make the following three filings in 2016:
1. a plan and associated timeline for a stakeholder engagement process during initial DSIP filing development (filed May 5, 2016);
2. an individual utility initial DSIP addressing each utility’s own system and identifying immediate changes that can be made to effectuate state energy goals and objectives; and
3. a joint — and as necessary, individual — supplemental DSIP by all utilities addressing the tools, processes, and protocols that will be developed jointly or under shared standards to plan and operate a modern grid capable of dynamically managing distribution resources and supporting retail markets (due November 1, 2016).
In addition to the REV Proceeding, the Commission has undertaken a number of REV-related proceedings progressing in parallel that will chart the course for the evolution of REV. While the stakeholder engagements associated with these parallel proceedings may have helped shape the Company’s initial DSIP, it is not intended to describe the Company’s implementation or compliance plans in any of these parallel proceedings. The parallel proceedings include: Community Choice Aggregation (Case 14-M-0224): Proceeding establishing a Community Choice Aggregation (“CCA”) program to support REV goals. CCA allows local governments to procure energy supply services for their residents on an opt-out basis. As part of a CCA program, local government can also develop DER or otherwise engage in energy planning.
13
Track Two Order, p. 8. 14
Track Two Order, pp. 105-106.

National Grid Distributed System Implementation Plan
Introduction and Background Page 17
Community Net Metering (Case 15-E-0082): Proceeding establishing a Community Distributed Generation (“CDG”) program centered on a net metering paradigm to provide opportunities for participation in solar and other forms of clean distributed generation to utility customers that would not otherwise be able to access such generation directly.
Clean Energy Fund (Case 14-M-0094): Proceeding to establish a framework for a Clean Energy Fund (“CEF”) that will operate in the context of the Clean Energy Standard (“CES”) and support the delivery of energy efficiency and other DER at scale in order for the CES to achieve its mandate and for New York State to achieve its energy and environmental policy objectives. The CEF is a critical component of REV. Dynamic Load Management (Case14-E-0423): Proceeding to develop and implement distribution-level DR programs and other dynamic load management (“DLM”) programs to improve system reliability and resiliency, capture the benefits of increased system efficiency, and provide customers with another set of options to help them manage their utility bills.
Distributed Energy Resources Oversight (Cases 15-M-0180): Proceeding to develop rules regarding Commission regulation and oversight of DER providers and products.
Large-Scale Renewable Program and a Clean Energy Standard (Case 15-E-0302): Proceeding to develop a CES, expanding the original mandate of a large-scale renewables (“LSR”) proceeding to encompass a CES, and consisting of four main policy objectives: (1) increase renewable electricity supply to achieve the goal that 50% of all electricity used in New York State by 2030 should be generated from renewable energy sources; (2) support construction of new renewable generation in New York State; (3) prevent premature closure of Upstate New York nuclear facilities; and (4) promote the progress of REV market objectives.
Energy Affordability Program for Low Income Utility Customers (Case 14-M-0565): Proceeding to standardize utility low-income programs to reflect best practices where appropriate, streamline the regulatory process, and ensure consistency with the Commission’s statutory and policy objectives. The Commission’s policy to maintain universal, affordable service is a critical driver of REV. Utility Energy Efficiency Programs (Case 15-M-0252): Proceeding authorizing electric and gas utilities energy efficiency program budgets and savings targets for 2016-2018 with approved budgets collected through an Energy Efficiency Tracker (“EE Tracker”). Utility energy efficiency efforts funded through the EE Tracker are critical components of REV and also align with the CEF framework;

National Grid Distributed System Implementation Plan
Introduction and Background Page 18
Value of Distributed Energy Resources (Case 15-E-0751): Proceeding to; (1) identify an interim approach to valuing DER including a transition plan for moving from net metering to DER valuation that can be adopted prior to December 31, 2016; and (2) establish a methodology and process for determining the full value of DER for the larger purposes of developing DER compensation mechanisms built upon an LMP+D approach where “LMP” represents the location-based marginal price of energy and “D” represents the full range of additional values provided by the distribution-level resource.
Details on any of these proceedings can be accessed at:
http://www3.dps.ny.gov/W/PSCWeb.nsf/All/CC4F2EFA3A23551585257DEA007DCFE2?OpenDocument
Additionally, complementing REV and the evolving portfolio of clean energy programs enumerated above:
NY Green Bank: A state-sponsored, specialized financial entity working in partnership with the private sector to increase investments into New York’s clean energy markets, creating a more efficient, reliable and sustainable energy system. NY Green Bank is a division of the New York State Energy Research and Development Authority (“NYSERDA”). Details on the NY Green Bank can be accessed at: http://greenbank.ny.gov/

National Grid Distributed System Implementation Plan
Guiding Principles and Priorities Page 19
Guiding Principles and Priorities 2.
National Grid is committed to providing safe, reliable, and affordable service to our customers. At the same time, the Company needs to continuously evolve in the way it, invests for growth, operates its electric and gas delivery systems, and serve our customers by addressing cybersecurity, customer privacy, environmental sustainability, and resiliency. This chapter examines how the REV objectives align with the Company’s principles and priorities. Simply put, REV fits squarely within National Grid’s “Connect21” strategy for connecting customers to the energy networks of the 21st century.
The Connect21 strategy is a product of the recognition that as energy companies’ fostered growth and innovation by building engineering marvels over the last hundred years, they now must call upon that same spirit of ingenuity to lead the way toward the decarbonized networks of the next century. Getting the transition right is no small feat. At National Grid, this desire for a decarbonized energy network is not wishful thinking. It has been the Company’s motivation for years.
National Grid, together with its affiliates, serves the energy needs of 20 million people across New York, Massachusetts, and Rhode Island, and all the National Grid companies understand that the touchstone should always be our customers, large and small. Navigating the transition to a decarbonized energy network, however, will take collaboration with the entire energy supply chain – from system operators and generators, to policy makers, technology companies, and climate change activists.
For starters, customers’ energy must remain affordable. If affordability is not the prerequisite of the transition solution, working, middle-class families and capital-challenged communities will be stranded. This, in turn, will risk crippling local economies in a downward spiral of high energy costs, increasing unemployment, and decreasing entrepreneurship and business investment. That means more community needs chasing fewer and fewer community revenue sources.
How do we transition to a decarbonized energy network while growing local economies and ensuring our families’ long-term economic and environmental health? How do we do this while building a solution that engages everyone with a stake in our energy future?
First, we must put customers in charge. Customers will make the right choices if they have the right tools and information. More web-based, big-data solutions will be transformational. Increasing the use of such smart technology will make choosing energy efficiency and productivity easier for all customers.
Second, we must embrace our technology partners. The legacy of our electricity and gas networks is that utilities were incentivized to become generally reactive and risk-averse to

National Grid Distributed System Implementation Plan
Guiding Principles and Priorities Page 20
innovation. Utilities should be incented to take reasonable risks in the development of new opportunities for customers or improvements in service to customers. This would rely on the ability to discover what does not work in a cooperative environment. We need to open our networks to high-tech partners focused on energy efficiency, energy storage, and distributed generation such as solar, wind, and biogas. By turning the grids into innovation playgrounds we can propel the type of market-based advances that lifted the telecommunications and personal computing industries decades ago.
Last, yet most important, we must change how utilities are regulated and financed. The fragmented energy industry in the U.S. – 1,100 electric distribution companies plus 1,600 local natural gas delivery companies – answers to an array of state and local regulators.
While that regulatory relationship encourages a form of accountability, it has not traditionally prioritized aggressive investments in innovation and infrastructure. National Grid sees REV as an opportunity to transform the regulator-utility-customer relationship. Instead of a narrow focus on next month’s bill, the Commission has widened the aperture to increased energy efficiency programming and facilitating connections to renewable sources.
National Grid is aligned with the Commission’s vision through our Connect21 strategy, and our New Energy Solutions division: a team dedicated to driving our plan for the energy company of the future.
Progressing the objectives of REV will be a continuous and evolving process over many years and many projects, including DG, microgrids, smart grids, offshore wind energy, green transmission, and other opportunities that advance our electricity and natural gas networks so that our 21st century digital economy is sitting atop a truly 21st century energy infrastructure.
This initial DSIP has been shaped through ongoing engagement and feedback from stakeholders, lessons learned from recent and ongoing projects, and consideration of the State’s policy objectives. Continuing to “listen, test and learn” will be critical as the concepts of REV and the expectations of a DSP evolve.
Initiatives like REV signal the transition to a decarbonized, 21st century energy network. At the same time, they reinforce our fundamental approach to energy in the U.S.— we find ways to ensure our communities’ long-term economic and environmental health. And we do this while building a solution that engages everyone with a stake in our energy future.

National Grid Distributed System Implementation Plan
On-going Engagements Page 21
Ongoing Engagements 3.
As discussed in the previous chapter, National Grid’s priorities align well with the objectives of REV and the Company is ready to move forward on the REV journey. National Grid has adopted a “Listen, Test & Learn” approach to guide its actions through these transformational times.
The Company and its subject matter experts have been actively engaged in REV and related proceedings since their inception two years ago. During this same period National Grid and National Grid affiliates in other jurisdictions have also engaged customers and key stakeholders in many initiatives and demonstration projects to enhance the understanding of customer expectations, and to gain valuable lessons learned concerning the deployment and integration of new technologies and processes.
This chapter highlights a few of the key engagements that have informed the scope and priority of projects included in this initial DSIP.
Stakeholder Engagement a.
Voice of the Customer Listening to customers and stakeholders is the critical first step in the development of new processes and projects at National Grid. The development of this initial DSIP was shaped by the input and feedback from stakeholders through countless engagements, both formal and informal.
Specific to the REV Proceeding, the Company has actively participated in all engagement forums including initial collaborative sessions, the Market Design & Platform Technologies (“MDPT”) working group, as well as numerous technical conferences and meetings. National Grid has also reviewed the stakeholder submissions and comments submitted throughout the REV Proceeding.
In addition, National Grid, as part of the Joint Utilities group, filed a formal engagement plan specific to the development of the initial and supplemental DSIPs on May 5, 2016 in compliance with the DSIP Order. While this submission identified a robust process for garnering stakeholder input, the breadth of stakeholder engagements goes beyond the formal processes described in the May 5, 2016 filing.
Initial DSIP Engagement: National Grid agrees with the Commission that stakeholder engagement is a critical element to maximize transparency in both the initial and supplemental DSIP filings. To that end, the Company maintains a focus on ensuring that stakeholders understand the intent of the Company’s plans by employing an engagement approach that includes in-person technical sessions, in-person outreach sessions by our jurisdiction team, and surveys where appropriate.
National Grid Distributed System Implementation Plan
On-going Engagements Page 22
Diversity in the stakeholder process is key; a cross-sectional view of technology providers, market animators, and the consumer will enable the Company to gain a better picture of the New York energy market as it relates to REV and how to communicate the DSIP approach more broadly.
National Grid is engaging with a wide breadth of stakeholders including technical participants and jurisdiction/government relations participants. “Technical participants” tend to be those individuals/companies that are active in the regulatory intervention space inclusive of those that were active in the MDPT working group and other aspects of the REV Proceeding. The “jurisdiction/government relations participants” tend to be those business groups (e.g., chambers of commerce, manufacturing councils, local, state and federal public officials, economic development groups, developers, large commercial & industrial customers, etc.) who typically interface with National Grid’s jurisdiction and government relation’s teams.
The Company hosted a pre-initial DSIP filing stakeholder meeting in Syracuse on May 18, 2016. Over 300 invitations were sent utilizing the interested parties list for the REV Proceeding. Sixty-eight individuals attended the meeting, representing various market participants. The stakeholders were given a choice of attending a general information session and/or a more detailed session intended with the latter intended to take more of a deep dive into key facets of National Grid’s initial DSIP filing; most participants chose to participate in both sessions. The agenda for the meeting included a summary of DSIP objectives, a discussion of the various elements of the plan being considered by National Grid, and a deep dive into the need for and availability of various system data elements. The session was very interactive with half the time allocated to presentations by the Company and half of the time dedicated to active engagement with the stakeholders.
To date, National Grid has received feedback from ten stakeholders that was then shared with internal subject matter experts to be viewed from the perspective of both the initial and supplemental DSIP filings, where applicable. Survey responses indicated that most attendees were satisfied with the engagement session and are likely to attend similar events in the future. Moreover, survey respondents indicated that the length of the stakeholder engagement session was just right and advance notice was sufficient. Most agreed that topics were relevant, they learned something new, speakers were informative, it was a good use of time, and they had ample opportunity to provide input. National Grid plans to hold a post-initial DSIP filing in-person technical conference on July 19, 2016 utilizing a similar format.
Prior to National Grid’s engagement session in May, the Company, in concert with the Joint Utilities, held a day-long informational forum on February 29, 2016 dedicated to an overview of electric system planning. More than one hundred stakeholders attended this session, representing a broad array of organizations and interests. Representatives from each of the utilities provided presentations and took questions on transmission planning, underground and
National Grid Distributed System Implementation Plan
On-going Engagements Page 23
overhead distribution systems, forecasting, and capital investment planning. Through demonstrations of current utility system infrastructure, stakeholders had the opportunity to build a shared understanding of current system capabilities and planning parameters. Supplemental DSIP Engagement
The Joint Utilities have been charged to lead an extensive stakeholder process in support of the supplemental DSIP filing due on November 1, 2016. A detailed description of the engagement plan for the supplemental DSIP was filed with the Commission on May 5, 2016 (“Stakeholder Engagement Plan”). As detailed in the Stakeholder Engagement Plan, the Joint Utilities have retained a consultant to lead stakeholder engagement efforts on their behalf. The consultant, ICF International (“ICF”), brings significant technical expertise in the topics covered by the DSIP filings, as well as experience facilitating the “More Than Smart” multi-stakeholder discussions underway in California. ICF also brings relevant experience from other states, including Hawaii, Arizona, and Minnesota. This experience brings a broad perspective to the engagements for the supplemental DSIP filing.
To help guide the stakeholder engagement process, the Joint Utilities have convened an advisory group comprised of organizations representing the breadth of stakeholders that are parties to the REV Proceeding. The advisory group’s purpose is to advise the Joint Utilities on the priorities and sequence of topics requiring a more detailed technical review. These technical discussions will be facilitated through engagement groups formed around specific topic areas. The engagement groups are intended to foster shared understanding of the technical details and strive toward common ground through iterative discussion and feedback. Similar to the advisory group, the engagement groups’ membership will be comprised of organizations representing the diverse interests of the parties to the REV Proceeding.
Customer Knowledge Surveys
To supplement the stakeholder engagement efforts, National Grid and its affiliates gathered and synthesized its customer knowledge as part of a holistic approach to the development of the DSIP for the Initial Filing. Understanding customers’ current and future needs and the customer benefits of a modernized grid is key to creating sustainable value. The customer knowledge effort, which encompassed market research and industry studies, captured insights on residential and small business customers. Relevant insights from the customer knowledge work were provided to the internal working groups developing the various elements of this DSIP.
Project Specific Engagements
As important as engagement in the regulatory proceedings, the Company has solicited input and feedback from customers and stakeholders in the development and implementation of its

National Grid Distributed System Implementation Plan
On-going Engagements Page 24
many innovation projects and demonstrations across all of National Grid’s affiliate jurisdictions that directly or indirectly align with REV.
A representative sample of residential and small business customers were surveyed from across the footprint of National Grid and its affiliates to understand what is most important to them with respect to grid modernization and interests in Distributed Energy Resources (DER). The study delivered: (1) a quantitative analysis of top ranked customer needs, (2) an assessment of customer familiarity, interest, and behavior around various grid and distributed generation technologies, and (3) an understanding of what role customers expect the utility to play in these initiatives.
The research provided a direct view into Upstate New York customer perspectives:15
About half of mass market customers expressed high interest in grid modernization. Information and ‘choice’ are among the top needs for all customers related to grid
modernization. Additional top needs for residential customers was cost, whereas for commercial
customers, their top needs include reliability and control. The utility was viewed as the information source and provider among mass market
customers would most likely go to for high-tech energy services. Most customers are interested in energy management devices that provide information,
control, and automation. Regarding time-of-use (“TOU”) rates, there is a higher willingness to shift usage to avoid
costs among residential customers than commercial customers.
Energy Efficiency and ETIP Engagement The Company’s ETIP plans and filings were made outside of the DSIP effort this year, however it is expected that in future DSIP and ETIP filings will be integrated. National Grid’s 2016-2018 ETIPs aim to progress market-based solutions and the penetration of emerging and transformative technologies within New York State. Expanded offerings will take a more holistic approach encompassing customer education and awareness, coordination with external stakeholders, reduction of program costs, new technologies, financing, and increased flexibility. Programs will be evaluated and fine-tuned annually to ensure increased participation and satisfaction in order to achieve energy savings.
Customer sectors include non-residential, residential, and multifamily. In order to maximize savings, National Grid seeks to offer customer-specific solutions to increase education and program awareness. Through targeted marketing, aided by propensity modeling, National Grid
15 National Grid, Value Proposition Research: A Study of 3 Energy Solution Areas, New York (July 9, 2014).

National Grid Distributed System Implementation Plan
On-going Engagements Page 25
will get the message out that “energy efficiency makes the things that matter, better.” By coordinating with external stakeholders to reduce overlap and reduce confusion, consistent messaging will flow through diverse channels. Through outreach, technical services, and diverse incentives, National Grid will help customers construct customized solutions that best fit their needs. ETIPs will respond to site-specific needs for large commercial and industrial customers, including the introduction of a self-direct option in 2017; reduce barriers to small business entry; address split incentives within the multifamily sector; support opportunities for low-income customers; and expand residential offerings that support education.
Distributed Generation Interconnection Engagements The rapid growth in DG interconnections is expected to continue to increase exponentially and enhancements in process and tools are necessary to improve the efficiency of the interconnection process and to enhance the potential for the integration of DG in system operations. In addition to working with Staff through participation on the Interconnection Technical Working Group (“ITWG”), the Company is actively engaged with key stakeholders through a number of venues to enhance the interconnection process. Some of these engagements include:
1. The Company is actively engaged with a number of large solar developers (e.g.,
SolarCity, NextEra, Borrego Solar, Monolith Solar, SunEdison) on general and specific interconnection issues. One outcome from these engagements was the Company implementing a “key account” approach to help developers manage their portfolio of work.
2. The ITWG is comprised of a number of relevant stakeholders, including utility technical representatives, solar developers, and others from the DG community, who meet regularly to explore possible technical improvements to the SIR process. While the initial focus of the ITWG is focused on solar DG, National Grid supports the expansion of discussions by the ITWG to include other DG technologies such as wind, small hydro, and combined heat and power (“CHP”).
3. The Company hosted an interconnection information session on April 12, 2016 in Syracuse, with a simultaneous webinar, to further educate customers, developers, and installers on the DG interconnection process.
4. The Company attends and presents at numerous industry meetings and workshops. Recent examples include presentations at the New York State Solar Installers Workshop at SUNY Canton, Central New York Community Solar Conference in Syracuse, and Empire Chapter IAEI Code Seminar in Canastota. These forums allow the Company to engage with DER developers, consultants, engineers, contractors, and other stakeholders to share information and perspectives and to consider best practices.
5. The Company is active on several industry work groups to develop appropriate standards and protocols, including the National Electrical Code (“NEC”) Committee considering changes for the 2017 NEC and the Institute of Electrical and Electronics Engineers (“IEEE”) 1547 working group drafting requirements for the inverters that interconnect most DG to the utility system.

National Grid Distributed System Implementation Plan
On-going Engagements Page 26
Moving beyond DG interconnection to DER integration requires much closer coordination between all stakeholders. National Grid is actively testing new business models and technologies to further enable the efficient use of DER for system operations. In developing these projects, we always start with the customer. A more detailed discussion of near-term plans with respect to tools and processes is presented in Chapter 4.
Demand Response, Non-Wires Alternatives and Microgrid Engagements Other REV-related activities have progressed in parallel with the development of the DSIP and the Company’s engagement in those efforts has also shaped the DSIP.
The Commission ordered all utilities to develop and implement distribution-level demand response programs in 2015 modeled after programs currently offered by Con Edison. The following three programs were implemented by National Grid beginning with the 2015 summer capability period:
1. Distribution Load Relief Program (“DLRP”) – a commercial customer-focused contingency program;
2. Commercial System Relief Program (“CSRP”) – a commercial customer-focused peak shaving program; and
3. Direct Load Control (“DLC”) program – a residential and small commercial customer- focused device control program.
Development of the DLC program involved numerous and detailed interactions with the other utilities, Staff, and several vendors including but not limited to: ThinkEco, Earth Networks’ WeatherBug Home (“WBH”), EnergyHub, Honeywell, Ecobee, Comverge, Alstom, and Opower. Simultaneously, National Grid engaged with EPRI on work that was being done on its CEA 2045 standard for modular DR device controls including A.O. Smith water heaters, and Islandaire and Friedrich window air conditioning (“AC”) units. Additional stakeholder involvement for the DLC program included: Kenmore Village Improvement Society, Village of Kenmore government representatives, Kenmore Farmer’s market officials, and National Fuel Gas Distribution Corporation.
Development of the CSRP and DLRP programs included stakeholder involvement from Staff, the other utilities, the New York Independent System Operator (“NYISO”), and various aggregators including, but not limited to, EnerNOC, Trane/Fellon McCord, ConEdison Solutions, NRG, and Direct Energy. During the planning stages National Grid met with Multiple Interveners (“MI”) and the Manufacturers Association of Central New York (“MACNY”) to gauge interest, discuss any concerns, and introduce high-level pricing mechanisms. Later, as program development was underway, the Company met with several stakeholders concerning implementation details. The Company also met with Lime Energy, an EE contractor in Western New York performing work for National Grid, to introduce the programs and seek marketing

National Grid Distributed System Implementation Plan
On-going Engagements Page 27
advice. Other vendors who could deliver various DR assets were also engaged including Retroficiency, Smart Utility Systems, Alstom, and Cortland Research, among others.
To facilitate consistency across the State, the Joint Utilities worked together to develop similar DR programs which would in turn improve efficiency for DR vendors and DR aggregators. NWA projects endeavor to develop a portfolio of cost-effective solutions that utilize DER as an alternative to, or in conjunction with, a traditional utility infrastructure solution to T&D system needs. The Commission ordered each utility to identify one or more potential NWA project(s) by May 1, 2015. National Grid evaluated its system needs and identified a potential project in the Village of Baldwinsville, an electrically strained area located just north of the City of Syracuse. To further evaluate this opportunity, the Company issued a request for information (“RFI”) and two RFPs seeking input and support from a wide array of market participants. The evaluation of this potential NWA project continues as the Company evaluates the RFP responses. The expanded use of NWA solutions is a key objective of this initial DSIP and the Company’s near-term efforts will be discussed in Chapter 4. The development of consistent long-term practices will be the subject of a stakeholder engagement group in the supplemental DSIP process. There is significant work underway across the state and within National Grid to understand how microgrids may be effectively and efficiently integrated. NYSERDA’s NY Prize competition focuses on community-based microgrids throughout New York State. Stakeholders include the local governments where the microgrid projects are proposed to be sited, Staff, utilities, various microgrid/DG engineering/development firms including GE, ASI, Cogen Technologies, and Booz Allen Hamilton, and others. The Company’s interactions with the municipalities and their engineering firms includes vetting of proposed microgrid connections to the electrical system as well as information exchange including electric and gas system mapping, reliability information, system protection, and system planning projects. National Grid representatives have participated in numerous meetings with NY Prize microgrid project teams and corresponding community leaders.
Demonstration Projects b.
The best lessons are learned through doing. In recent years, National Grid and its affiliates in New England have been actively testing and demonstrating many of the functionalities that will be essential to advancing the REV objectives. This initial DSIP highlights only a few of the lessons learned from the Company’s REV demonstration projects as well as other pilot-scale projects involving advanced metering deployment, variable pricing, NWAs, distribution demand response, VVO, smart inverter integration, and/or vendor partnerships.

National Grid Distributed System Implementation Plan
On-going Engagements Page 28
REV Demonstration Projects The REV demonstration projects are examples of innovation that will inform decision making as to what the utility of the future could become. These projects align regulatory innovation and technological innovation, and everyone – customers, regulators, and energy providers – will learn what works for customers or what does not work. While not developed as part of the DSIP, these demonstration projects will test hypotheses that are expected to help evaluate and design the scalable solutions presented in this initial DSIP.
Each National Grid REV demonstration project has been designed to better serve customers and deliver comfort, convenience, energy bill savings, education, and value. Most of these projects are early in the implementation stage and lessons learned are not yet known.
Moving forward, a deep process-oriented engagement will be necessary with stakeholders and customers in order to maintain a platform for both receiving feedback and implementing recommendations in a timely manner. Regularly scheduled meetings have been helpful and these will continue as REV demonstration projects progress
The Company initially filed its four REV demonstration projects with the Commission on July 1, 2015, with each aimed at integrating clean energy, harnessing new technologies, and delivering new options – and more control – for customers. The projects focus on three distinct geographic regions with very different customer needs.
Western New York REV Demonstration Projects Distributed System Platform In Western New York the Company will partner with the Buffalo Niagara Medical Campus (“BNMC”) to test the integration of DER and dynamic load management. The BNMC, which includes Roswell Park Cancer Institute, the University at Buffalo and Kaleida Health, is a consortium of the region's premier healthcare, research and medical education institutions, located on 120 acres in downtown Buffalo. This demonstration project will test how National Grid, as a DSP, can integrate customer-owned energy resources to manage system demands by creating market opportunities and pricing models for investment in DER/DR capabilities that are intended to optimize utilization and operation of the area T&D system through the integration of customer energy assets.
The project will be deployed in three phases. The first phase will focus on the development of a financial model for the utilization of DER and test functional, operational and economic benefits for grid operations. Phase two involves developing a platform for DSP operations that will include a designed Point of Control (“POC”) at the BNMC, which will serve to aggregate participating DERs by integrating energy supply and demand through a single interface with the DSP. The final phase includes real-time operation of the DSP to determine if prevailing values
National Grid Distributed System Implementation Plan
On-going Engagements Page 29
will provide sufficient financial motivation for customers to investment in DER and manage those assets in a fashion that supports grid operations.
This is a complex project and the Company has worked diligently with partners and Staff to develop an appropriate scope which Staff recently accepted. National Grid will file the DSP Implementation Plan early in July.
The development and implementation of DSP platform technologies through this demonstration project will provide excellent lessons learned for a scalable deployment of a DERMS or DSP within the Company’s broad service territory. As discussed in Chapter 4, a system-wide deployment of DSP technology is beyond the five-year horizon of this initial DSIP. However, the platform being pursued in this demonstration project can be expanded on a per feeder basis if necessary as opportunities are presented. The foundational telecommunications, information systems, and control systems that are discussed in this initial DSIP are also being designed with the flexibility and intent to integrate the lessons learned from this project in future DSIPs.
Neighborhood Solar: Fruit Belt Neighborhood Solar This creative partnership between National Grid, BNMC, Solar Liberty, and NYSERDA will attempt to remove various barriers for DG and EE adoption by traditionally under-served customer segments by installing solar PV arrays in front of the meter on 100 qualifying residential rooftops totaling 500 kW in capacity within the Fruit Belt neighborhood. The Fruit Belt is a low- to moderate-income (“LMI”) neighborhood located within the City of Buffalo and immediately adjacent to the BNMC.
Scheduled to be complete by October 2017, the arrays, when aggregated, will provide a minimum monthly bill credit for the 100 solar host residences hosting rooftop solar PV panels with up to an additional fifty non-host customers within the Fruit Belt Neighborhood, selected through a lottery process, also sharing in the generation output and receiving a bill credit. This will serve to enhance the community aggregated benefit and drive awareness of the savings created by participation in distributed generation. Additionally, up to 300 neighborhood customers will be given additional opportunities to save more money, reduce energy consumption, and increase their homes’ value through participation in energy efficiency improvements from NYSERDA.
The partnership began customer engagement in April and May with face-to-face community meetings that provided information on what customer benefits matter most to potential participants. This resulted in a direct-mail campaign that has produced a total of fifteen potential hosts with thirteen residences currently engaged in the structural review necessary to determine suitability to host solar panels on their rooftops.

National Grid Distributed System Implementation Plan
On-going Engagements Page 30
When complete, the partnership’s 100 rooftop solar PV units (totaling 500 kW) concentrated in a LMI community will fill an existing market demographic gap, lead to an increase in grid efficiency, and test the effect of closely clustered solar PV on distribution system efficiency. Northern New York REV Demonstration Project Potsdam Community Resilience The North Country of Upstate New York is home to some of the nation’s most severe storms. There is a critical need for improving crisis preparedness and response. National Grid has launched an innovative energy partnership with Clarkson University and other major Potsdam stakeholders: the Village of Potsdam government, the Canton-Potsdam Hospital, and SUNY Potsdam. This partnership will examine the feasibility of building a community microgrid to add resiliency and efficiency to the area’s electricity grid.
In emergencies the microgrid would separate from the electricity system and independently provide power to the campuses and to local police, fire, hospital and emergency response facilities. Concurrently, National Grid will develop and test new utility services that may be required for further microgrid deployment in New York State.
For this demonstration project the Company will develop and test four services addressing: storm-hardening and tiered restoration; central procurement for DER; microgrid control and operations service; and billing and financial transaction services.
Information gleaned from this project will support numerous microgrid opportunities under consideration across National Grid’s service territory.
Proposed Eastern New York REV Demonstration Project Demand Reduction
In Eastern New York, the proposed Clifton Park Demand Reduction REV demonstration project will incorporate intelligent and automated systems so that residential and small commercial customers can actively monitor and control energy consumption. When accepted by Staff to proceed to implementation, the project will offer customers more predictable energy bills, opportunities to better manage energy usage, and new energy technologies such as state-of-the-art home appliances, smart thermostats, and home solar energy. The initiative is intended to improve reliability and reduce energy consumption for approximately 15,000 area customers.

National Grid Distributed System Implementation Plan
On-going Engagements Page 31
Originally filed as a “Customer Convenience” demonstration project, the Company renamed the project the “Demand Reduction” demonstration project with a focus on providing an expanded set of price signals and rewards to incentivize customers to reduce their total energy bill. There is also an additional opportunity for the Town of Clifton Park, in collaboration with National Grid, to engage with Energy Service Companies (“ESCOs”) for community-wide electric and gas supply and services.
The revised project will provide Clifton Park residents with price signals, tools and information enabled by infrastructure investments and partner-provided DERs to reduce demand during peak times. The project also includes critical guidance on evaluating the impact of varying pricing signals such as TOU rates and demand rates on customer response and resulting electric demand. In addition, the project will include an evaluation of the cost-effectiveness of a rewards program to stimulate demand reductions. Further assessments will look at the impacts of procuring ESCO supply and offerings by a community, as well as the extent to which AMF coupled with customer communications can support the adoption of DER services by market players. As this project progress there are many areas in which learnings will inform the deployment of programs identified in the DSIP including AMF and VVO.
National Grid expects the diverse initiatives and innovations offered in its REV demonstration projects will provide customers and strategic partners with data, metrics, and analytics that will open the door to new successes, opportunities, and efficiency and reliability enhancements. Feedback collected from the projects will inform how National Grid will better serve customers by measuring customer interest, engagement, and support of options, opportunities, and new pricing models.
Demonstrations Projects in Other Jurisdictions
The Company has also gained valuable information from demonstration projects undertaken by National Grid affiliates in other jurisdictions which have provided insights with respect to advanced metering, distribution automation, VVO integration of utility-scale DG, smart inverter functionality, electric vehicle (“EV”) charging, NWAs, and demand response. Most notable is the Smart Energy Solutions pilot program in Worcester, Massachusetts.
Smart Energy Solutions Pilot Program – Worcester, Massachusetts
The Worcester Smart Energy Solutions (“SES”) pilot program is an industry-leading initiative that built and demonstrated the value of an end-to-end smart grid. When National Grid’s Massachusetts affiliate launched the project, most of the technology and solutions represented best-of-breed and leading-edge solutions not in use anywhere else. This included an advanced metering infrastructure (“AMI”) based on future networking protocols, advanced distribution automation that delivered true self-healing capabilities, and innovative home technology that allows the Company’s affiliate to deliver residential demand response using the metering

National Grid Distributed System Implementation Plan
On-going Engagements Page 32
network. This pilot is the most complex and innovative effort undertaken by National Grid’s affiliate to date.
The pilot delivered advanced capabilities and technologies, integrating the technologies into the National Grid affiliate’s Energy Management System (“EMS”) control center and enhancing the customer-billing systems to support meter-interval based billing that support TOU pricing. The pilot also incorporated new technologies and capabilities into electric standards, design, and training. Safety was a key aspect for field workers and the control center with the pilot establishing protocols and processes to sustain this innovative technology and capabilities. The pilot has produced a positive customer experience where customers save money and energy while also demonstrating the value of advanced grid technologies and communications.
A first year assessment of the pilot shows positive results as illustrated in Figure 3-1 below.
Figure 3-1
First-Year Assessment of the Worcester SES Pilot Project
A number of lessons learned through the deployment of the pilot are directly applicable to the elements proposed in this DSIP. The key takeaways from the pilot to be applied in the AMF deployment proposed in the DSIP include: (1) ensuring the communications network for all tiers

National Grid Distributed System Implementation Plan
On-going Engagements Page 33
is installed, tested, and enabled to provide for an efficient deployment of meters and distribution automation; (2) the need for a broader set of roles and capabilities than exists in the current utility workforce in order to deliver and manage the enhanced solutions and technologies; and (3) outreach and education must be a constant and evolving dialogue with customers and stakeholders in order to advance the opportunities and benefits that are enabled through these investments. Key lessons learned regarding grid modernization initiatives include the need for an ADMS and distribution SCADA (“DSCADA”) to accommodate the large number of monitoring and control points being managed and to ensure there is sufficient time necessary to plan, engineer, construct, and maintain the smart grid technologies. These lessons clearly impacted the proposed grid modernization programs discussed in chapter 4. Voltage Regulation Pilots National Grid’s affiliates are actively investigating advanced voltage regulation systems in multiple projects. In New York, the Company plans to include an advanced VVO/CVR scheme in its Clifton Park REV demonstration project. In Rhode Island, a centralized VVO/CVR system is being piloted on two substations. In Massachusetts, ‘grid edge’ devices are being evaluated for secondary power quality and voltage regulation capabilities, and utility-owned solar is being evaluated for next generation system support capabilities through advanced inverter control methods.
In Rhode Island, National Grid’s affiliate is piloting advanced grid control schemes for reliability and VVO in targeted locations. This effort utilizes a centralized VVO control scheme that manages the substation voltage regulation equipment, distribution switched capacitors and line regulators to enhance CVR. This represents a more advanced approach to voltage and VAR management by coordinating multiple assets remotely rather than relying on local-only control devices. Deployments are still in progress, with two of seven feeders currently in-service. A long-duration measurement and verification process is planned and will run through the summer months of 2016; however, to date, the performance of these technologies and complex schemes have been positive.
The Rhode Island project will utilize a combination of mesh network communications and public cellular to integrate the field controlled devices with the centralized controllers and the affiliate’s SCADA system, placing the scheme under EMS operators’ control. The costs and complex implementation requirements for these enabling technologies is significant. Through this pilot, the Company’s affiliate has realized the importance of performing as much engineering, configuration and commissioning as possible, ahead of physical installation.
In the area of grid edge / secondary regulation, National Grid’s affiliate in Massachusetts has piloted the use of power electronics-enabled series secondary voltage regulators to improve power quality issues such as steady state voltage, transient voltage, and harmonics. These units are partial power processing devices which allow for low power loss correction of targeted power quality issues, and provide a way to insulate individual distribution transformers from

National Grid Distributed System Implementation Plan
On-going Engagements Page 34
nearby system issues or insulate the system from target customer issues. The pilot was quite successful and the use of these power electronic devices range from addressing localized voltage issues that may arise with high penetration of small-scale intermittent DER, to proactive deployments to increase the effectiveness of VVO/CVR schemes by correcting outlying spot voltage concerns. Currently the size of the series voltage regulators available is limited to 50 kVA per phase, and therefore deployments are limited to residential grid edge applications. In addition, these devices provide enhanced monitoring capability at the edge of the distribution grid, where there is no current monitoring.
Lastly, in Massachusetts, National Grid’s affiliate has been authorized to own and operate a limited amount of distributed solar generation. With this generation, the Company’s affiliate is evaluating the impact of smart inverters for the benefit of system operation. A limited amount of advanced inverter testing was enabled as part of the affiliate’s phase 1 installations, with significantly more planned with its phase 2 installations currently under construction. These phase 2 sites will be equipped with advanced inverter controls which meet, and sometimes exceed, the required control behavior being discussed and drafted in IEEE 1547. These system control behaviors include real power curtailment, power factor, direct KVAR, Volt-VAR, and power-watt control, in addition to low voltage and frequency ride-through, and frequency droop response. Initial tests of Volt-VAR control through smart inverters showed a significant improvement in voltage variability at the point of interconnection, as shown in Figure 3-2 below.

National Grid Distributed System Implementation Plan
On-going Engagements Page 35
Figure 3-2 Smart Inverter Impact on Solar PV Voltage
This testing illustrates improved voltage stability, which directly results in better customer service as well as reduced operations on other voltage regulating equipment. While these results are quite encouraging, the tests also identified challenges with predictable response when multiple inverters were in simultaneous operation. Coordination of multiple DERs as penetrations increase will be of paramount importance and included as part of testing in the solar phase 2 program.
Through these pilots, National Grid’s affiliates have documented numerous lessons learned to facilitate and improve future implementations at larger scale as proposed in this initial DSIP.

National Grid Distributed System Implementation Plan
National Grid’s Distributed System Implementation Plan Page 36
National Grid’s Distributed System Implementation Plan 4.
This chapter provides an assessment of National Grid’s existing capabilities with respect to system planning, grid operations, and market enablement/operations, as well as the actions and investments the Company anticipates carrying out over the coming five-year horizon, and beyond, to enhance those capabilities. The Company has organized the chapter in four sections focusing on: (1) developing DSP capabilities; (2) AMF; (3) grid modernization; and (4) cybersecurity and privacy.
As part of this initial DSIP National Grid also describes proposed investments for each of the four focus areas enumerated above to advance REV objectives. Cost estimates presented in these schedules are incremental to any costs included in the Company’s existing rate plan or costs being addressed in other proceedings (e.g., ETIP, DR programs, REV demonstration projects).
While ETIPs, distribution DR programs, the NY Prize competition, and additional REV demonstration projects were not developed as part of this initial DSIP, a brief discussion about each is provided to present a more complete picture of DER opportunities within the Company’s service territory.
Developing DSP Capabilities a.
System Planning i.
National Grid’s Upstate New York Electric System National Grid serves approximately 1.6 million electric customers in Upstate New York. The Company’s service territory covers over 25,000 square miles and includes everything from densely populated urban areas in Buffalo, Syracuse, and Albany, to remote and sparsely populated rural areas throughout Upstate New York. The electric distribution system includes over 1.2 million distribution poles; over 43,000 miles of primary distribution wires and cable, on 2,171 distribution circuits from 527 distribution substations. The Company’s peak demand in 2015 was 6,622 MW, on Tuesday, September 8th. The 2015 peak was 7% below the Company’s all-time high of 7,150 MW reached on Thursday, July 21, 2011. Residential and C&I customers alike depend on National Grid to provide safe, reliable, and affordable electric service. The Company has met all state electric reliability metrics for the past eight years.
The Company’s distribution system, consists of lines and substations typically operating at 15 kV and below in a radial configuration. A large portion (55%) of the distribution line miles operate at primary voltages below 5 kV as illustrated in Figure 4-1 below. These relatively low distribution voltages have limited capacity for growth for either load or DG.
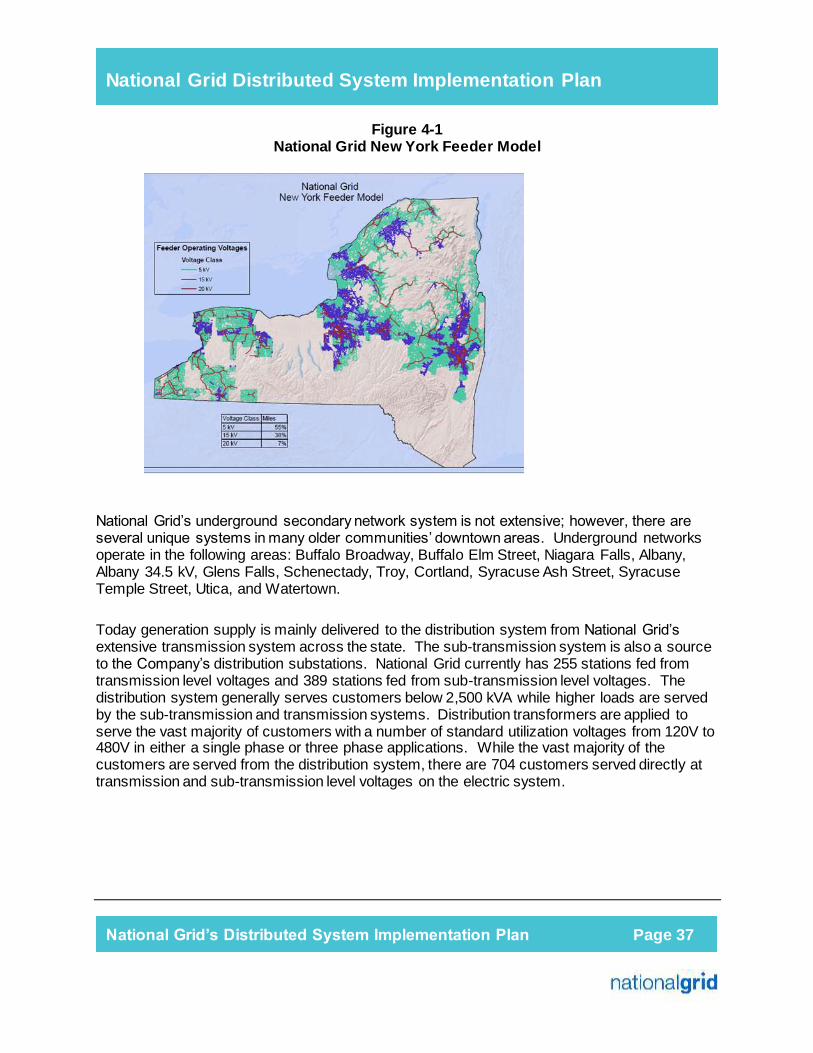
National Grid Distributed System Implementation Plan
National Grid’s Distributed System Implementation Plan Page 37
Figure 4-1 National Grid New York Feeder Model
National Grid’s underground secondary network system is not extensive; however, there are several unique systems in many older communities’ downtown areas. Underground networks operate in the following areas: Buffalo Broadway, Buffalo Elm Street, Niagara Falls, Albany, Albany 34.5 kV, Glens Falls, Schenectady, Troy, Cortland, Syracuse Ash Street, Syracuse Temple Street, Utica, and Watertown.
Today generation supply is mainly delivered to the distribution system from National Grid’s extensive transmission system across the state. The sub-transmission system is also a source to the Company’s distribution substations. National Grid currently has 255 stations fed from transmission level voltages and 389 stations fed from sub-transmission level voltages. The distribution system generally serves customers below 2,500 kVA while higher loads are served by the sub-transmission and transmission systems. Distribution transformers are applied to serve the vast majority of customers with a number of standard utilization voltages from 120V to 480V in either a single phase or three phase applications. While the vast majority of the customers are served from the distribution system, there are 704 customers served directly at transmission and sub-transmission level voltages on the electric system.

National Grid Distributed System Implementation Plan
National Grid’s Distributed System Implementation Plan Page 38
Figure 4-2 National Grid New York Transmission Study Areas
To assess the needs of the T&D system, the Company performs a series of studies across its service territory, which it segments into eight transmission study areas as depicted in Figure 4-2 above. Within the eight transmission study areas, the Company divides and evaluates the sub-transmission and distribution systems into forty-three distribution study areas.
Criteria, Process and Tools 1.Planning Process Planning for the T&D system is a cyclical process that considers a wide array of variables to ensure that the system will achieve service quality standards and reliability targets in a cost-effective manner. Planning is a repetitive process that progresses through these steps; system monitoring, modeling and forecasting, risk assessment, solution development, prioritization and budgeting, and finally solution implementation.

National Grid Distributed System Implementation Plan
National Grid’s Distributed System Implementation Plan Page 39
T&D system planning goes well beyond capacity planning and must consider and integrate a wide range of operational variables as shown in Figure 4-3 below.
Figure 4-3 National Grid T&D Planning Operational Variables
There are a number of planning strategies, criteria and standards that guide the Company’s planning engineers in developing comprehensive solutions to system needs.
Distribution Planning Criteria The Company’s distribution planning criteria is reliability risk-based. Due to the radial nature of the majority of the Company’s distribution system there is an expectation that customers will be interrupted for various contingencies impacting the grid and then restored in a reasonable period of time. For N-1 contingency situations it is expected that load will be returned to service within twenty-four hours via system reconfiguration through switching, the installation of temporary equipment such as mobile transformers, or by the repair of a failed device. Where

National Grid Distributed System Implementation Plan
National Grid’s Distributed System Implementation Plan Page 40
practical, switching flexibility should be integrated into the system design to minimize the duration of customer outages and meet reliability objectives.
The National Grid service territory ranges from urban areas to suburbs to lightly populated rural areas. Some substations have a single transformer, others have two. In the Cities of Buffalo and Niagara Falls, for example, urban substations may have three or four transformers. Where more than one transformer exists in a substation, transformers are sized to facilitate the transfer of load from one transformer to another in support of planned maintenance and emergencies.
Distribution circuits tend to be radial and are routed to connect all customers within the service territory. Opportunities to create circuit ties with neighboring circuits are considered when geographically and economically appropriate. In more rural areas there may be limited or no ability to reconfigure the distribution system by switching, while in more densely populated areas there may be many opportunities to employ a switching solution, resulting in more flexibility. While the vast majority of the distribution system is of radial design, there are eleven general low-voltage alternating current networks that supply urban cores. Depending on the development of the general network, they may be designed to either an N-1 or N-2 criteria.
The primary thresholds applied in distribution planning are:
For normal operations, substation transformers, sub-transmission circuits, and distribution feeder circuits should not be loaded above their normal seasonal rating;
During contingency operations, to the extent possible, load should be switched to alternative supplies up to the emergency rating of equipment; and
Outage exposure at peak (expressed in MWh) should be limited to 240 MWh for a substation or transmission failure and 16 MWh for a distribution failure.
In 1984, the Commission implemented CVR by lowering the maximum service voltage to 2.5% above nominal which is lower than the 5% found in American National Standards Institute (“ANSI”) C84.1. National Grid’s upper voltage limit is 123V with a lower voltage limit of 114V on 120V systems. The design voltage ranges on general low-voltage alternating current networks will vary depending on the development/design of the network. This difference in criteria may lower the hosting capacity of distribution feeders and limit the marginal CVR capabilities of voltage optimization. As the Company progresses with its initial efforts in these areas, it will evaluate the impact of the reduced allowable operating.
The detailed distribution planning criteria can be accessed in its entirety via the System Data Portal developed as part of this initial DSIP and available at this URL: http://arcg.is/28XscPy
National Grid Distributed System Implementation Plan
National Grid’s Distributed System Implementation Plan Page 41
System Data 2.System Data Transparency A key deliverable in the DSIP Guidance Order is the Commission’s emphasis on system data transparency. As evidenced by the discussion in the sections above, significant data from multiple sources is required to effectively plan the T&D system. System planners have been responsible to get the data needed, scrub the data to ensure quality inputs into various models, and research the context in which the data was recorded to ensure its appropriateness for use in the scenarios being modeled in the planning process. These manual data management processes have been acceptable when the users of the data are intimately familiar with the Company’s systems and processes and only had to plan the system for peak-hour capabilities. A shift towards more integrated system planning with high levels of third-party DER penetration will require enhancements in both the data available and the tools and processes for its use.
The Company routinely makes publically available a large amount of system information through a number of annual reports and filings. In addition to the information provided in these reports, the DSIP Guidance Order requires utilities to provide, to the extent possible, more granular information on system loading and forecasting, as well as information to facilitate DER integration, such as hosting capacity analysis and the identification of beneficial locations of DER for system operations. The amount of data requested is significant and it would not be practical to provide in a hard copy format. Therefore, the Company undertook an effort to create a System Data Portal (http://arcg.is/28XscPy) to access and present the data that could be collected or generated in response to the DSIP.
From this System Data Portal, users will have access to the traditional system reports produced annually by National Grid, as well as a number of interactive maps that were created to provide more granular information as requested in the DSIP Order.
Initial Content available on the System Data Portal will include:
Annual System Reports in .pdf format o Five-year T&D Capital Investment Plan o Condition Assessment Report o Peak Load Forecast o Reliability Report o Summer Preparedness o Power Quality
Interactive Maps o Distribution Assets Overview
Circuit layout and connectivity o Capital Investment Plan
Location of specific projects in CIP Highlighting of potential NWA opportunities
o DG Red Zones

National Grid Distributed System Implementation Plan
National Grid’s Distributed System Implementation Plan Page 42
Areas where DER interconnection may be more costly o DER Opportunities
Hosting Capacity Indicators Operating Voltage Circuit Loading (8760 hrs. where available for one 12-month period) Forecasted peak load Existing DG connected to each feeder
The System Data Portal is intended to provide DER developers with information and insight as to the state of the distribution system and its ability to accommodate and leverage DER. The Company has made a significant effort to make the information available in conjunction with the June 30, 2016 delivery of this initial DSIP and the System Data Portal will continue to evolve with additional information and enhanced functionalities over time. The System Data Portal will bring transparency to large volumes of data that are the foundation of the Company’s system planning efforts. The data presented via the interactive maps is “raw” data pulled from a variety of Company data sources. Users are cautioned that there are data gaps and the data is provided without reference to the state of the Company’s distribution system at the time of data capture. Data gaps can be the result of a power system interruption, an interruption to the telecommunications or controls that capture and transmit the data, or other actions associated with the system operations. Scrubbing of the data in advance of its use for system planning is generally a prerequisite of any system assessment. Those that access the System Data Portal should give careful consideration to the context and appropriateness of any data retrieved as part of any analysis.
National Grid has developed a two-stage deployment plan to enhance the efficiency and effectiveness of the System Data Portal tool:
Phase 1 – Leveraging systems and techniques already utilized at National Grid, the
Company will provide a map-based tool accessible via the internet. Phase 2 – An expansion of capabilities delivered in Phase 1. Key deliverables in this
stage include:
Process alignment to facilitate underlying planning and data needs to support a reduction in the time needed to refresh asset and planning data available via the portal;
System enhancements to automate data feeds to the portal; and Process, system, and data preparation activities to facilitate deployment of future
stages.
To get the System Data Portal deployed coincident with the Initial DSIP, the Company has leveraged systems and techniques already in place. Most of the information provided for Phase 1 required a significant manual effort to gather, analyze, and format the data for presentation via the portal. Phase 2 of the System Data Portal deployment is largely focused on streamlining and automating this process. This will enable the Company to provide information via the portal in a more timely fashion.

National Grid Distributed System Implementation Plan
National Grid’s Distributed System Implementation Plan Page 43
During Phase 1 the Company anticipates refreshing the data roughly every six months. Following the completion of Phase 2, the Company will endeavor to refresh data on a more frequent basis. The System Data Portal has a look and feel similar to other geospatial tools available on the internet and it is anticipated navigation will be straightforward for users. The Company will host a number of webinars for interested users during the summer of 2016 to demonstrate the various functionalities of the new tool.
Advanced Analytics Platform 3.
The DSP will introduce new data as well as enable the sharing of data and insights with market participants, customers, and stakeholders. There is a need for advanced data processing and analytics to support integrated planning, DER and load forecasting, hosting capacity analysis , and the integration of DER into real-time operations. In furtherance of that effort, National Grid envisions providing the following advanced analytics capabilities:
Modern Data Platform - to store data and perform analytics: o Store data in its native form; o Ingest information in both streaming and batch, structured or unstructured; and o Run complex distributed processing.
Master Data Management - Provides processes for collecting, aggregating, matching, consolidating, quality-assuring, persisting, and distributing data throughout an organization to ensure consistency and control in the ongoing maintenance and application use of this information.
Utility Data Model - This is a pre-built, standards-based data framework to establish a foundation for business and operational analytics across the enterprise, allowing users to leverage common analytics and pre-defined cross-domain relationships.
Enhancement of existing advanced analytics capabilities: o There are multiple levels of analytics:
Advanced analytics environments, which are comprised of various engines for:
Data mining & analysis; Intelligent insight; Modeling and simulation; and
Multi-goal optimization. Business intelligence – Graphical User Interface (“GUI”) - based data
extraction and reporting tool sets that enable visualization and reporting of data in a user-friendly fashion to support business decision making.

National Grid Distributed System Implementation Plan
National Grid’s Distributed System Implementation Plan Page 44
Visualization analytics and business intelligence - Provide flexible reporting, dashboards, data exploration, and visualization capabilities.
Further developing advanced analytics capabilities will enable the Company to better manage the grid and embrace products and services that put energy decisions squarely in the customer’s grasp. The analytics platform will have the capability for third parties to access the data directly in a secure manner allowing them to combine DSP information with their own business data.
Figure 4-4below depicts the proposed advanced analytics environment:
Figure 4-4
Proposed National Grid Advanced Analytics Environment
Load and DER Forecasting 4.
Load and DER Forecasting Current State
Existing peak load forecasts incorporate the impacts of projected economic and demographic changes as well as the impacts of technological and policy-driven changes. Specifically, National Grid considers the impacts of EE, DR, DG, and EV in its forecasts. These forecasts, in turn, inform both the Company’s reliability and financial planning processes. The Company is

National Grid Distributed System Implementation Plan
National Grid’s Distributed System Implementation Plan Page 45
an active participant in a number of NYSIO committees and working groups and components of the Company’s forecasting process become major inputs into the NYISO’s and the New York State Reliability Council’s (“NYSRC”) annual capability planning processes. Forecast Process Overview: National Grid produces forecasts of electric system growth that cover its transmission service territories and each of its local distribution companies. These forecasts are referred to as “top-down” because they are produced at various aggregated geographic and customer-grouping levels and apply regulated and market driven policies and impacts on a Company-wide basis. Market and policy driven impacts, such as EE, are determined at a statewide level and allocated proportionately downward.
Currently Six top-down forecasts are produced:
1. Baseline Retail Deliveries Forecast 2. Retail Customers Forecast 3. Wholesale Peak Forecast 4. Adjusted Retail Deliveries Forecast 5. Adjusted Adjustment Wholesale Peak Forecast 6. Wholesale Supply Procurement Forecast
The general steps to complete the full forecasting cycle are:
1. Generate baseline retail deliveries and retail customers forecast for each load distribution company (i.e., econometric model-based forecasts not yet adjusted for post-model market/policy impacts);
2. Then generate a wholesale peak forecast using the growth rates from the baseline retail deliveries forecast to set the growth trajectory;
3. Produce the adjusted retail deliveries and adjusted wholesale peak by applying adjustments for market/policy impacts to the baseline retail deliveries and wholesale peak forecasts; and
4. Finally, produce the supply procurement forecast using the growth rate from the adjusted retail deliveries forecast to set the growth trajectory.
Existing forecasts provide planners with annual load growth forecasts for peak hours only under a number of different weather scenarios along with forecasted impacts of EE and DG. The most recent forecast is illustrated in Figure 4-5 below.

National Grid Distributed System Implementation Plan
National Grid’s Distributed System Implementation Plan Page 46
Figure 4-5 National Grid Upstate New York Coincident Summer Peak Forecast
A complete version of the Company’s most recent published forecast can be viewed on the System Data Portal.
Enhancements to Load Forecasting
National Grid is now in the process of developing a complementary “bottom up” view that transcends from the customer-level to the total local distribution company. An appropriate process to consider the forecasts from both perspectives will be necessary to support the probabilistic planning approaches envisioned in REV. Load forecasting needs to be more dynamic in its ability to forecast demand growth, changes in load profiles, and the adoption of DER by both existing customers and future customers. To this end, the forecast must transition to one that predicts customer activities, behaviors, and decisions and their impacts on the existing and potential future system instead of simply describing the end result in terms of load. By making the forecast more dynamic, the Company can achieve a tighter coordination between T&D planning and forecasting resulting in more effective system plans.
To achieve the level of detail and accuracy needed to support this new type of system planning and to enable retail markets, the forecasting process must evolve. It can do so by using simulation and optimization, through which all of the components making up the distribution

National Grid Distributed System Implementation Plan
National Grid’s Distributed System Implementation Plan Page 47
system, the customers, and the DER markets can interact to achieve defined goals. Part of that evolution involves a number of key forecast model paradigm requirements:
Customer perspective requirements: o Must support a bottom-up, activity-based view of energy production and
consumption that can accurately assess choices and behavioral responses to energy-sensitive policies and distribution planning decisions; and
o Must support an understanding of lifestyle choices, motivations, and activity at the level of individual households and business entities.
Distribution system perspective requirements: o Must support a bottom-up, functional view of all system components and
operation in response to any and all customer and environmental activity; and o Must support an understanding of operational performance, reliability, quality,
and safety at the level of individual system and DER components.
The new forecast model paradigm brings with benefits associated with the following:
Breadth – expansion of view; Depth – refinement of scale in terms of time, space, functional detail, activities, etc.; Accuracy – temporal & level accuracy of loads; and Functionality Enablement.
The vision for Load and DER forecasting in the future establishes a comprehensive, unified, simulation environment that provides a spatial and temporal view of load and DER growth (both existing and future) at any given point in time and with any system design to support planning, energy procurement, customer engagement, operations, system process, assets, and efficient energy utilization optimization. This will entail developing a power-flow feeder model for each distribution feeders and probabilistic and predictive hourly load shape models for every customer, as well as probabilistic and predictive models for all current and future DER installations. The feeder and customer models will receive input from DER growth models for each type of DER as well appropriate environmental models (e.g., weather, cloud cover models based on satellite cloud imagery, and solar radiance). Individual DER market growth models will produce probabilistic and predictive views of rooftop solar PV, non-rooftop solar PV, active and passive DR, EE, EVs, and storage growth on an individual customer basis. These customer level load and DER forecasts with then coupled with electric system models of distribution, substation and transmission thereby enabling a fully uniform and integrated simulation environment that supports both top-down and bottom-up perspectives of market and load growth. To achieve this vision, National Grid has developed a multifaceted forecasting approach with regard to its DER growth models. This approach is comprised of two forecasting methodologies that are modeled independently and then integrated utilizing a third methodology to form a unified and consistent view. The three methodologies are:

National Grid Distributed System Implementation Plan
National Grid’s Distributed System Implementation Plan Page 48
1. Top-Down – econometric and growth models; 2. Bottom-Up – customer-specific load and DER growth models; 3. Hierarchical or Integrated – “top-down” & “bottom-up” forecasting
Top-Down: Econometric and Growth Models These are policy driven forecasts that assume the attainment of specific predefined goals or market projections.
Bottom-Up: Customer-Specific load and DER Growth Models National Grid builds a load and DER model for each customer it serves. Each DER component has a retail market unto itself. There are DER-specific vendors, designs, costs, financing structures, etc., and not every DER component is suitable for every customer. However, in determining the potential for DER adoption by a customer, there are a number of analyses that are quite similar across DER components. National Grid has developed a DER model framework that enables it to model all DER components in the same fashion.
Hierarchical or Integrated “Top-Down” & “Bottom-Up” Forecasting The hierarchical model is currently in development, and the methodology integrates the top-down and bottom-up forecasts, ensuring that they are both in sync. Producing the forecasts in this manner will enable National Grid to have a complete, comprehensive, and unified simulation environment that provides a categorical, distribution system, spatial, and temporal view of load and DER (existing and future) to support planning, energy procurement, customer engagement, operations, system process, assets, and efficient energy utilization optimization.
National Grid will provide a probabilistic load forecast over the five-, ten-, and fifteen-year time horizon. The foundation of the forecast will be the creation of 8760 load profiles with a five-year time horizon created using the bottom-up methodology.
These bottom-up load profiles will be probabilistic in nature, and will be co-simulated with the feeder model to provide feeder-level load profiles with a five-year time horizon. Modeling DER with the DER model framework will also enable the disaggregation of DER so that the Company can understand the load growth of all load contributing components of DER. Coincident Load Profile will be available for the following load contributing DER components:
Distributed Generation; Energy Efficiency; Demand Response; Electric Vehicles; and Energy Storage.
A further benefit of the hierarchical model construct is that it enables an 8760 forecasted load profile at every level of the hierarchy across all levels and categories.

National Grid Distributed System Implementation Plan
National Grid’s Distributed System Implementation Plan Page 49
Probabilistic forecasts rely on the distribution of scenarios that can occur over time. The distribution of these scenarios can be developed by utilizing historical data or they can be developed by setting parameters around what is believed to occur and running advanced simulation modeling to develop the distribution of scenarios. At the core of the probabilistic load and DER model that is being proposed are several probabilistic models of key input variables. The consideration of all of the input variable’s probabilistic scenarios is what drives the load and DER model. These input variables include probabilistic views of:
Environmental inputs, including: o Weather; o Cloud cover; and o Solar radiance.
DER market drivers;
DER technology drivers; Customer adoption of DER drivers;
Customer load drivers; Financial drivers; Societal drivers;
Land development drivers; and Policy and regulatory drivers.
The probabilistic views of the input variables, and ultimately the load and DER model being proposed, will be built upon scenarios that consider what will occur, where it will occur, and how it will occur over time.
The Company will be able to validate the accuracy of the forecasts in two ways: 1) through the process of back-casting; and 2) through the process of variance analysis.
The forecast will evolve over a five-year time horizon. At first, not all components of DER mentioned above will be modeled; however, it is estimated that by year five, National Grid should have the ability to forecast all components. The 8760 load profile methodology will also evolve over the five-year period. Table 4-1 below details the development schedule and various methodology evolutions.
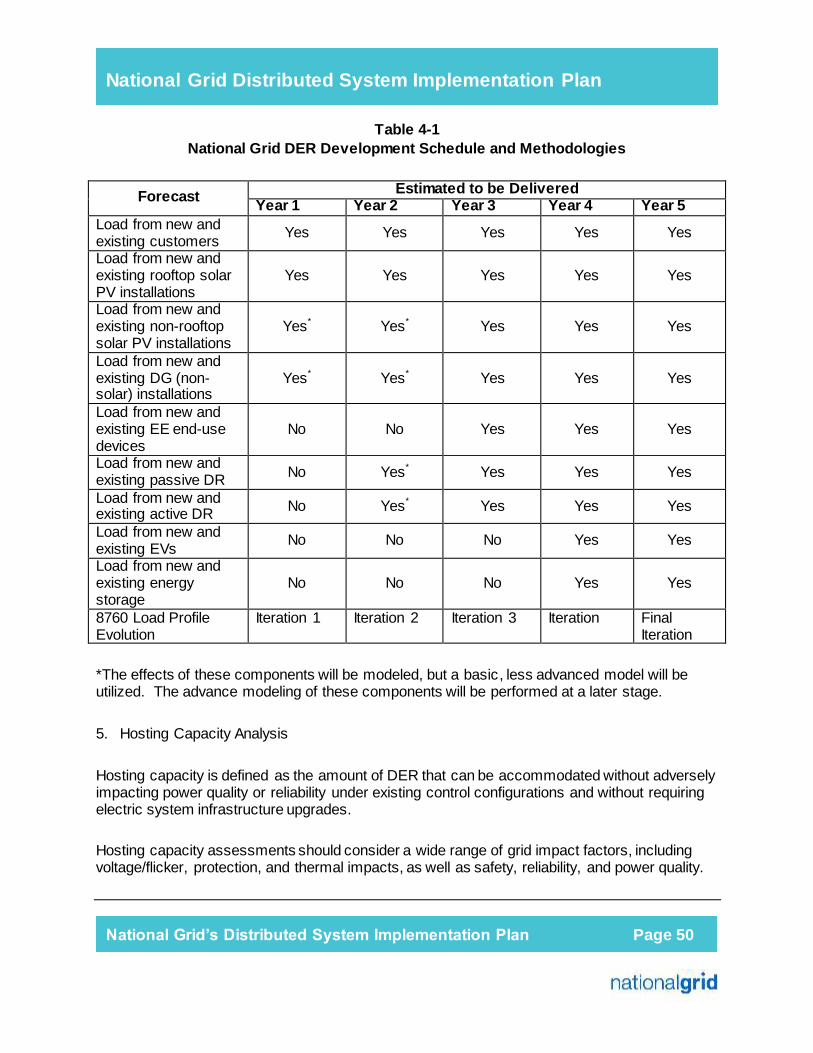
National Grid Distributed System Implementation Plan
National Grid’s Distributed System Implementation Plan Page 50
Table 4-1 National Grid DER Development Schedule and Methodologies
Forecast Estimated to be Delivered Year 1 Year 2 Year 3 Year 4 Year 5
Load from new and existing customers
Yes Yes Yes Yes Yes
Load from new and existing rooftop solar PV installations
Yes Yes Yes Yes Yes
Load from new and existing non-rooftop solar PV installations
Yes* Yes* Yes Yes Yes
Load from new and existing DG (non-solar) installations
Yes* Yes* Yes Yes Yes
Load from new and existing EE end-use devices
No No Yes Yes Yes
Load from new and existing passive DR No Yes* Yes Yes Yes
Load from new and existing active DR No Yes* Yes Yes Yes
Load from new and existing EVs
No No No Yes Yes
Load from new and existing energy storage
No No No Yes Yes
8760 Load Profile Evolution
Iteration 1 Iteration 2 Iteration 3 Iteration Final Iteration
*The effects of these components will be modeled, but a basic, less advanced model will be utilized. The advance modeling of these components will be performed at a later stage.
Hosting Capacity Analysis 5.
Hosting capacity is defined as the amount of DER that can be accommodated without adversely impacting power quality or reliability under existing control configurations and without requiring electric system infrastructure upgrades.
Hosting capacity assessments should consider a wide range of grid impact factors, including voltage/flicker, protection, and thermal impacts, as well as safety, reliability, and power quality.
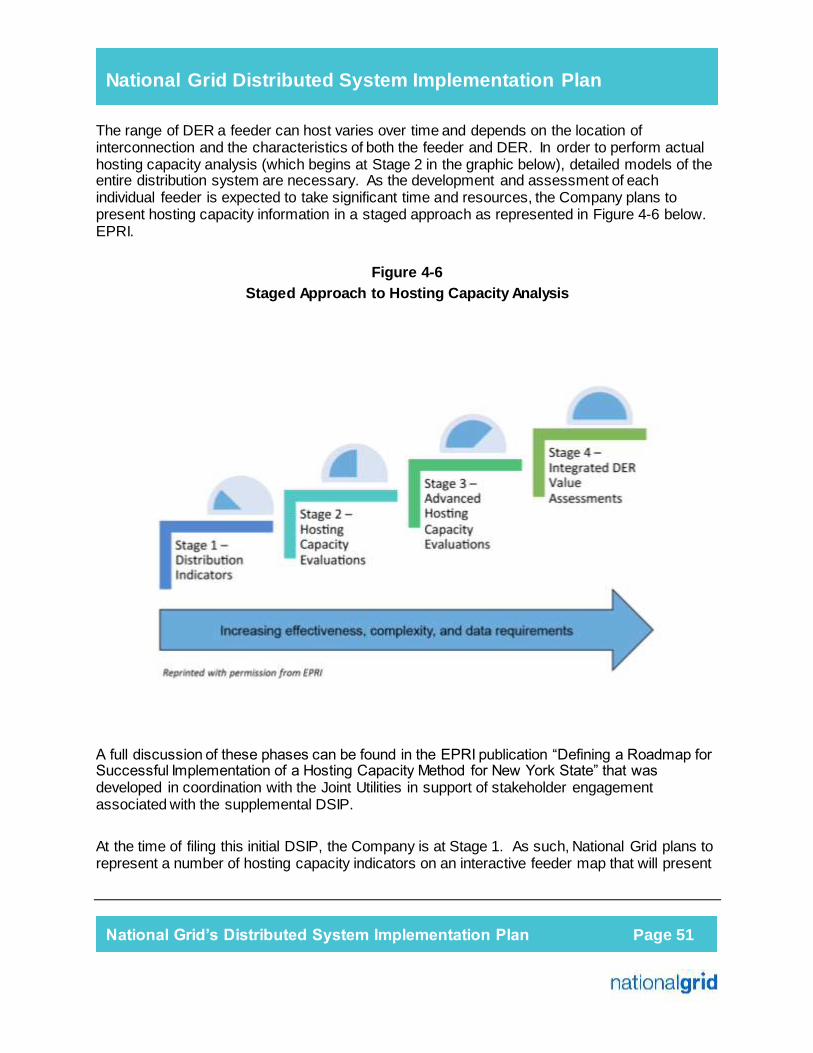
National Grid Distributed System Implementation Plan
National Grid’s Distributed System Implementation Plan Page 51
The range of DER a feeder can host varies over time and depends on the location of interconnection and the characteristics of both the feeder and DER. In order to perform actual hosting capacity analysis (which begins at Stage 2 in the graphic below), detailed models of the entire distribution system are necessary. As the development and assessment of each individual feeder is expected to take significant time and resources, the Company plans to present hosting capacity information in a staged approach as represented in Figure 4-6 below. EPRI.
Figure 4-6
Staged Approach to Hosting Capacity Analysis
A full discussion of these phases can be found in the EPRI publication “Defining a Roadmap for Successful Implementation of a Hosting Capacity Method for New York State” that was developed in coordination with the Joint Utilities in support of stakeholder engagement associated with the supplemental DSIP.
At the time of filing this initial DSIP, the Company is at Stage 1. As such, National Grid plans to represent a number of hosting capacity indicators on an interactive feeder map that will present
National Grid Distributed System Implementation Plan
National Grid’s Distributed System Implementation Plan Page 52
system data which could prove insightful as to the potential for DER hosting. While true hosting capacity analysis requires detailed load-flow analysis of each feeder, the indicators will provide knowledgeable viewers with information that could help inform expectations about potential DER impact. As part of Stage 1, National Grid will provide an interactive map on its System Data Portal. In this initial pass, the Company will present as much of the information requested in DG interconnection pre-application requests as possible. The Company will also provide additional information to guide DER applicants via the System Data Portal, such as a “Red Zone” map and “DER Potential Benefits” maps. The red zones include 5 kV distribution, areas that may result in back-feed due the volume of aggregated DG already installed, the number of DG applications in the queue, and areas with substations that lack high-side protection. National Grid will provide and update the map quarterly until it completes a hosting capacity analysis and makes it available to the applicant community.
To progress to Stage 2, the Company is working with EPRI to integrate their hosting capacity analysis application with the Company’s load flow modeling tools to complete the necessary analysis on each distribution feeder. The Company has worked with EPRI and performed Stage 2 analysis on a sample feeder to determine the necessary data sharing between the two tools. That test was successful and the Company is currently developing the appropriate scripts to automate the integration of tools. National Grid expects that the EPRI application will be available to funding members during the second half of 2016. In parallel, the Company is working to develop the necessary load-flow models for all of its feeders. Finally, the Company must develop an appropriate means to present the results of the hosting capacity analyses in an efficient and useful fashion. National Grid expects that the hosting capacity information will be presented via interactive feeder maps uploaded to the System Data Portal as they become available. The Company further anticipates that the first set of Stage 2 hosting capacity maps will be available in January 2017 and full deployment across all distribution feeders will take one year.
To move through Stages 3 and 4, National Grid will continue to work with EPRI and other utilities to develop the necessary tools. The stages represent a long-term vision, but the Company does not have a more specific schedule for the availability of the necessary tool set at this time.
Non-Wires Alternative Opportunities 6.
Non-Wires Alternative Opportunities
NWA is the umbrella term for ensuring that a portfolio of alternatives to distribution and/or transmission lines is analyzed and considered in the planning and possible permitting of such facilities. The Company’s efforts to identify, evaluate and develop NWAs are an important component of its strategy to help advance REV goals, since NWA projects include any DR, DG, conservation, or EE measure, generation altering pricing strategies that individually or in combination delay or eliminate the need for upgrades to transmission and/or distribution system.

National Grid Distributed System Implementation Plan
National Grid’s Distributed System Implementation Plan Page 53
Projects Reviewed To date the Company has not successfully implemented a NWA project although it has considered hundreds of projects for potential NWA solutions. Generally the capital projects considered have not passed the initial screening process because they: (1) were driven by asset condition issues; (2) had need dates that were too immediate; (3) had cost estimates that did not meet the criteria; (4) or were unrelated to electric load (e.g., involved equipment retirements or non-infrastructure projects). Several projects passed the initial feasibility screening, but then did not pass the secondary review because a viable NWA solution could not be identified. There has been one project that did make it through the secondary NWA review – the West Sweden/Brockport load relief project – and the NWA project was being actively developed until loads in the West Sweden/Brockport area increased to an extent that an NWA project was no longer a feasible solution.
Active NWA/Demand Response Projects/Proposals Non-Wires Alternatives Project
In 2016, National Grid began developing a high-potential NWA project in an area of electrical stress located in and around the Village of Baldwinsville, a suburb of Syracuse. Loading on the substations serving portions of the Towns of Lysander and Van Buren and the Village of Baldwinsville has increased to a level in which the load at risk for a single T&D contingency exceeds the risk threshold accepted in National Grid’s distribution planning criteria. The Company is seeking NWAs that will reduce the area load at risk in order to maintain or improve reliability performance. Through this NWA project the Company intends to better understand DER capabilities in support of electric system needs and to build a repeatable process for NWA assessment. With this aim, the Company issued two RFPs in February 2016. The services solicited in the two RFPs are outlined below in five phases. RFP 1 is for “Professional Services” to address various analyses related to solution development as identified in Phases 1, 3, 4 and 5. RFP 2 is for “Project Development Solutions” and is expected to build/develop the NWA solution as set forth in Phase 2. The phases are outlined below:
Phase 1 – High Level Screening Study (RFP 1 vendor):
Create a demographic analysis of the identified area; Evaluate the NWA measure(s) potential for deferring a capital project; Identify technology categories that can address the area constraints; and Support the development of project development solicitations, if appropriate.
Phase 2 – NWA Solutions Solicitation (RFP 2 vendor):
Bid NWA solutions/DERs that reliably solve the electrical constraint; Determine the implementation requirements/DER mix; Determine the availability and reliability of identified NWA solutions; Identify all costs and benefits; Identify availability of resources and time to implement;

National Grid Distributed System Implementation Plan
National Grid’s Distributed System Implementation Plan Page 54
Identify project management requirements needed to implement each DER; and
Leverage any state, federal or other funding sources.
Phase 3 – Detailed Solution(s) Evaluation and Procurement (RFP 1 vendor):
Evaluate the feasibility of the proposals/DERs; Assess the impact the DERs will have on constraints/forecasts; Update power flow models with DER solutions and evaluate impacts on
power system performance; and Develop an optimal portfolio of NWAs/DERs and wires solutions that resolve
the system constraints;
Phase 4 – Management/Oversight of NWA Solution Measures (RFP 1 vendor):
Project manage NWA development; Oversee solution deployment; and Provide the Commission with quality periodic reports.
Phase 5 – NWA Performance Assessment (RFP 1 vendor):
Evaluate the capacity and reliability impacts of the solution set; Evaluate the economic impact of the solution set; Identify any risks and their potential economic and/or system impact; and Enforce any warranties and/or penalties for not delivering needed relief
The Baldwinsville NWA project evaluation is progressing with submitted RFP proposals under review by National Grid. On average, the professional services respondents are estimating more than a six-month timeline for Phase 1 analysis work. Timelines for Phases 3, 4 and 5 are dependent on the type of solution, timing of the solution development, and other factors. Therefore, a clear timeline for the Baldwinsville project will be determined once a solution set is determined.
Evolution of NWA Opportunities
The design and implementation of NWA sourcing processes will continue to evolve as experience is gained from NWA projects and as utilities begin to incorporate NWAs as a routine aspect of distribution system planning. A major component of this evolution is the development of suitability criteria that can help utilities identify NWAs with the best chance of success in a competitive procurement process. These criteria represent the initial high level principles that will serve as the starting point for the development of proposed NWA suitability criteria to be included in the supplemental DSIP filing.
National Grid Distributed System Implementation Plan
National Grid’s Distributed System Implementation Plan Page 55
The application of suitability criteria for NWAs can help utilities identify projects where DER solutions have the greatest chance of successfully deferring or eliminating the need for traditional grid infrastructure. To the extent the criteria target those projects where NWAs have the greatest chance of providing comparable value and being chosen in a competitive solicitation, they can help make the NWA procurement process more efficient and cost-effective for utilities and market participants. Additionally, the criteria would provide DER providers with greater clarity, certainty and long-term visibility to the market and help avoid misallocation of time and resources for both providers and utilities. As these criteria are incorporated into planning processes, they will provide a means by which NWA procurement can become a routine aspect of system planning.
In designing the NWA suitability criteria, it is important that they not be overly restrictive, such that the criteria eliminate potentially valuable projects. Also, the criteria should be sufficiently adaptive to allow utilities to incorporate experience gained with NWA procurement and respond to changing cost structures and market conditions. Additionally, the criteria should reflect stakeholder input and experience. To that end, the Joint Utilities have launched the Stakeholder Engagement Process in conjunction with the preparation of their supplemental DSIP filing that will solicit input from stakeholders on the NWA suitability criteria concepts described below.
NWA Suitability Criteria NWA suitability criteria captures the various dimensions of project characteristics that influence the ability of the project to defer or avoid traditional utility infrastructure. These include: (1) the type of work and category of project; (2) the lead time of the project relative to the need date on the system; and (3) the cost structure of the project.
Type of Work. The type of work places the project into broad categories of utility projects that can help bound their overall suitability. For example, to the extent that capacity concerns (e.g., thermal load, voltage, power quality) represent a large share of projects with high potential for NWA solicitation, projects in this category would have relatively high project applicability. Reliability projects in which system enhancements are intended to prevent the occurrence of a fault, for example, tree-resistant wiring or flood mitigation in a substation, would be difficult to resolve with DER, but reliability projects that mitigate outage impacts may be well suited to NWAs. New business might present an attractive opportunity for DERs to work with customers directly prior to issuance of their load letter rather than addressing capacity issues through a NWA solicitation. Therefore, in the context of NWA suitability, the NWA project applicability for new business projects might be relatively low despite fruitful opportunities for DERs to participate in other avenues.
In some cases, the type of work does not lend itself to procurement of NWAs. For example, in the case of planned repairs or replacements of existing infrastructure, the ability of NWAs to displace the utility solution must include the repair or replacement of the asset or otherwise

National Grid Distributed System Implementation Plan
National Grid’s Distributed System Implementation Plan Page 56
obviate the need for the asset altogether. To the extent that asset condition upgrades are needed to maintain safety and reliability of the T&D system, this type of work will likely need to meet a very high standard of availability and performance and, therefore, might have a relatively low project applicability with respect to NWAs. The same could be said for damage failure repairs that must be addressed under extremely short timeframes, as well as non-T&D infrastructure such as telecommunications, tools, and systems.
Lead Time Required. For the NWA to be suitable from a timing perspective, the Company must procure the NWA and implement it prior to when a solution is needed on the T&D system. The time needed to design and implement a competitive solicitation will depend on the scale and complexity of the project. This includes the time needed to produce the RFP, solicit proposals, review bids, complete procurement processes, secure appropriate Company approvals, and contract with the winning bidder(s). The NWA solicitation time is typically ten to twenty months based on recent NWA experience. The timeframe for the implementation of the solution is also a function of scale and complexity, and is typically in the range of twenty to forty months. Therefore, based on recent experience, the minimum amount of lead time required is typically thirty to sixty months in advance of when it is needed on the system. Experience conducting competitive solicitations for NWAs and implementing DER solutions can help to achieve greater efficiencies; therefore, the lead time criteria should be updated regularly to reflect current experience.
Cost Structure. Finally, the cost of the utility project will also have an impact on its suitability for a NWA solicitation. In some cases, a utility solution might be available at such a low cost that it would not be efficient or cost effective to carry out a competitive solicitation for NWA proposals to meet the need. Using the cost of the utility project as a threshold should be set so that it does not overly restrict project suitability for NWA consideration and could perhaps be implemented as guidance criteria in parallel with the type of work considerations described above as opposed to using a bright line test.
The specific design and implementation of these criteria will continue to evolve and the input provided by the stakeholder engagement groups will help to inform the Joint Utilities’ further development of these concepts.
National Grid is actively participating in the supplemental DSIP stakeholder engagement process concerning NWAs in an effort to bring consistency to the process across the state. In advance of any recommendations and in support of this initial DSIP filing, the Company considered the types of projects where a NWA solution would be an appropriate tool for a planning engineer to utilize in developing solutions on the electric system. Through this assessment the potential NWA opportunity projects were expanded. The Company reviewed all projects in the five-year plan developed from National Grid’s recent rate case filing extension. The types of projects noted below were removed from consideration. The remaining projects were reviewed for NWA opportunities.

National Grid Distributed System Implementation Plan
National Grid’s Distributed System Implementation Plan Page 57
The types of projects noted below were removed from further consideration of NWA opportunity.
Inspection and Maintenance Minor Equipment Replacement (non-refurbishment, non-transformer); Distribution rebuilds (asset condition/reliability); Time-sensitive solutions (less than 30 months); Storm hardening and flood mitigation; Communications (remote terminal units (“RTUs”), sensors, telemetry, etc.); Potential safety issues for the public or employees (e.g., arc flash resolution, addressing
elevated voltage concerns, etc.); Reliability reviews (SAIFI); Creation of feeder tie points (SAIFI/CAIDI); and Programs
o Deteriorated cable; o Station battery; o Relay; o Breaker; o Metal-clad switchgear; o Fusing; o Overloaded distribution transformer; and o Buffalo street light cable replacement.
This review led to the classification of potential NWA projects in three categories. The specific projects in each category are presented in Appendix 2.
The first category identifies seven projects areas where the Company wishes to solicit for potential NWA solutions. Detailed system needs assessments will be developed in advance of DER solicitations which are anticipated to be presented in RFP’s to be issued in late 2016 for each project. The second category identifies a list of projects where NWA solutions could potentially be utilized but there is a lower likelihood of fit. The Company is prioritizing its near-term NWA efforts on the first category of projects and does not plan to actively solicit NWAs under the second category at this time. If a DER developer is interested in offering a solution to a project on this list, the Company would evaluate the proposal.
The third category identifies projects where NWA solutions cannot be utilized and traditional utility projects must progress as planned.
The Company looks to gain experience on these projects with third parties over the next few years to determine the data and format required for developers’ effectively consider DER options, evaluation through the use of the BCA Handbook, and the use of third-party vendors in development and review of NWA opportunities
National Grid Distributed System Implementation Plan
National Grid’s Distributed System Implementation Plan Page 58
Market Enablement and Operations ii.
National Grid’s role helping to enable and animate DER markets As the Company evolves as the DSP provider, it will continue to expand its role in enabling and animating markets for DERs.
The Company has filed proposals with the Commission to address a number of initiatives under the broad umbrella of the REV Proceeding, including:
REV demonstration projects; ETIPs; DR program plans for the 2016 summer capability period; and NWA filings
Energy Efficiency 1.
National Grid’s Current Role in Administering Electric Efficiency Programs
Through 2015, the Company’s electric and gas EE programs were administered under the Energy Efficiency Portfolio Standard (“EEPS”) proceeding as part of a statewide program first implemented by the Commission in June 2008 to reduce New Yorkers’ electricity usage by 15% of forecast levels by the year 2015, with comparable results in natural gas conservation.16 In initiating the Clean Energy Fund (“CEF”) Proceeding, the Commission’s objectives were to ensure continuity of EE programs post-2015 while enhancing EE program efficiency and leverage and managing the transition from an exclusive reliance on utility customer bill surcharges to tariff and sustainable market-based clean energy activities such as those envisioned in the REV Proceeding. The Commission ordered the utilities to transition existing EEPS programs into the REV-envisioned market-based distributed energy system and to outline this transition in annual ETIP filings.17 The primary focus of ETIP programs is to support REV priorities.
The CEF Proceeding parallels the REV Proceeding and was initiated to determine the future of the NYSERDA clean energy programs.18 Historically, NYSERDA’s EE programs have competed in the same markets as the utilities – creating confusion for customers and restricting individual program momentum. One goal of the CEF Proceeding is to eliminate this competition among the state’s EE program administrators. As chapters of the CEF are filed by NYSERDA,19 the Company will continuously monitor program offerings to minimize gaps in cost effective electric energy efficiency offerings and avoid market overlap.
16
Case 07-M-0548 – Proceeding on Motion of the Commission Regarding an Energy Efficiency Portfolio Standard . 17 Track One Order, Appendix C. 18
Case 14-M-0094, Proceeding on Motion of the Commission to Consider a Clean Energy Fund (“CEF Proceeding). 19
CEF Proceeding, Order Authorizing the Clean Energy Fund Framework (issued January 21, 2016), pg. 25.
National Grid Distributed System Implementation Plan
National Grid’s Distributed System Implementation Plan Page 59
National Grid filed its first draft ETIP for the 2016-2018 program years in July 2015, received Commission approval of budgets and metrics in January 2016, and filed the final ETIP in April 2016. For 2016, the Company largely proposed a continuation of the programs that existed under EEPS, including several direct incentive programs. The strategic vision for ETIPs is expected to evolve as the Company incorporates findings from and enhances its alignment with other REV initiatives. National Grid will file the second draft ETIP in September 2016 to reflect program changes made in 2016, update the strategic vision for 2017 and 2018, and request Commission approval of budgets and targets for 2019. It is anticipated that future ETIP filings will converge with future DSIP filings and therefore summary information is being shared in this initial DSIP. Today’s Electric EE Alignment with the REV Objectives Below is a summary of how the Company’s existing programs align with each of REV’s six policy objectives.
Enhanced customer knowledge and tools – The Company uses EE as a first step to engaging customers in clean energy programs. The electric and gas portfolios include behavioral programs for aimed at providing residential customers with insight into their energy consumption patterns, as well as to benchmark their usage against their neighbors. The goal is to use these communications to show customers how their behaviors affect their energy bill.
As residential and C&I customers engage with NYSERDA to receive audits and in-home assessments, National Grid can work with these customers where the Company’s EE programs offer relevant measures. In doing so, the Company aims to turn information into action by selling to engaged customers.
National Grid is developing its own online audit and e-commerce website that will provide customers with information on their household use and recommend EE measures for purchase.
As required by the Commission, the Company will implement a program that allows commercial customers to “Self-Direct” funds that they would otherwise pay towards the National Grid EE electric budget to instead be applied towards their own EE projects. In doing so, large customers can overcome the barrier of not having dedicated capital funds to be applied towards EE investments.
Market animation – EE supports other clean energy programs and engages third parties.
National Grid is developing its own online audit and e-commerce website. The scope of the e-commerce site is expected to be expanded in the future to cross-promote other clean energy programs offered by the Company.
The Company is identifying measures that enable participation in DR programs, but still contribute to energy savings, and will incorporate those measures into the EE programs.
As part of the Company’s Fruit Belt Neighborhood Solar project, which was approved to move forward as a demonstration of the various REV principles, the Company will promote EE in the LMI market through NYSERDA’s EmPower NY Program.
System-wide efficiency – EE programs encourage deeper energy savings to help reduce demand and offset capital investment.

National Grid Distributed System Implementation Plan
National Grid’s Distributed System Implementation Plan Page 60
The impact of previous National Grid and NYSERDA EE programs has been incorporated into the Company’s forecasting process for Company system peak (kW) and sales (kWh). Over the fifteen-year forecast planning horizon, these programs are targeted to reduce the growth rate of the Company’s peak by 0.4% annually.
The “Self-Direct” program, discussed above, will be a first step in engaging the large customers who will be the major contributors to reducing overall demand. Establishing a strong relationship with these large customers will be critical, and the Self-Direct Program will be a first touch point to begin to map an energy plan for each customer.
System reliability and resiliency – Using EE to reduce demand and support the installation of DG improves reliability of the system.
As discussed above, the Self-Direct Program will be a first to mapping an energy plan for individual large customers. As part of this energy plan, the Company will look for ways to integrate measures that reduce peak demand.
The Fruit Belt Neighborhood Solar REV demonstration project leverages solar PV installations in this LMI community to encourage participation in EE programs that will deepen the energy savings achieved by customers. In doing so, the Company is able to support stable service for all customers in a critical part of its electric system.
Reduction of carbon emissions – EE’s main goal will remain to reduce energy consumption, which will support public policy goals to reduce carbon emissions.
Since 2013, National Grid customers have reduced energy by 1.4 million annual MWhs and natural gas consumption by 50 million therms as a result of participation in the Company’s EE programs.
While the state’s utilities have had energy savings goals in the past, those same goals are being reaffirmed under REV as the minimum amount of energy savings to be achieved going forward. These energy savings goals are established directly in an effort to reduce carbon emissions.
The 2015 New York State Energy Plan established a goal to reduce energy consumption in buildings by 23% from 2012 levels using EE by 2030. In addition, there is a goal to reduce greenhouse gas emissions by 40% from 1990 levels by 2030 and 80% by 2050. EE programs will be used to support this goal
Online Audit and E-Commerce Platform
In each of the National Grid final 2016-2018 ETIP filings, the Company proposed to budget funding for an e-commerce platform initiative, to be developed beginning in 2016, which will offer an online audit marketplace where customers can explore and purchase EE measures. The initial scope of the e-commerce platform includes outreach and energy efficiency product offerings to residential customers, but this scope is expected to be expanded to commercial customers as the platform is built. While the initial phase of this project will continue to be funded out of the ETIP portfolios, this project is expected to be transitioned into the regular utility offerings as other DER markets develop under REV. The Company expects to expand the

National Grid Distributed System Implementation Plan
National Grid’s Distributed System Implementation Plan Page 61
platform further to include considerations beyond EE, including DR-enabling measures, recommendations for DG, and perhaps marketing opportunities for third parties. The Company will leverage its existing customer experience transformation project, which is aligning the customer experience on National Grid’s website with future needs, to support a single experience, self-service options, and easy-to-use tools.
DG Interconnections 2.
Distributed Generation Interconnection Services
National Grid is responsible for the safe and reliable interconnection of DG to the Company’s electric system. The Company’s DG-related business processes focus on:
Application Processing – receiving and reviewing applications for proposed DG installations
System Analysis/Study – evaluating potential electric system impacts that may arise from proposed projects
System Upgrades – implementation of system upgrades to accommodate proposed projects (when needed), and
Interconnection – meter installation, inspection, and authorization for customers to energize their systems.
The DG and New Connections Application Portal being developed represents a significant change to how the Company will process DG interconnections. This online system will enable customers and third parties to apply for interconnection and track their inquiries. This has also been referred to as the DG Application Portal and the Company has issued an RFI from vendors.
National Grid will implement the DG and New Connections Application Portal project in multiple phases beginning with the deployment of the DG functionality in late 2016, followed by the deployment of online functionality for new electric and gas connections in 2017. In both the DG and connections areas new capabilities for customer self-service will be added and the process will be redesigned to enable a streamlined and intuitive customer experience. Customer feedback will inform the design of the portal throughout the process and new technologies will drive execution of the initiative.
A business-to-business online portal element of the new system will primarily service contractors doing repeated work with National Grid. Each contractor will have a logon profile, the ability to apply for service online, see the status of all of their work with National Grid, and receive proactive notifications via email. The first phase of the DG and New Connections Application Portal project will design for all three application processes but will execute on DG only at first due to the minimal interfaces required with other systems. A second phase will follow for electric and Gas new connect processes, which is expected to be more complex and have significant system interfaces.

National Grid Distributed System Implementation Plan
National Grid’s Distributed System Implementation Plan Page 62
The new system will transform the DG process and customer experience from application through commissioning by delivering:
A fully automated application process via the online portal where
developers/contractors will submit DG applications on behalf of National Grid customers;
Robust validation to assure applications are complete and correct before being submitted to the National Grid DG team;
Connection process tracking throughout the project life cycle; Proactive notifications for both the developer/contractor and the customer as the
process progresses from application, study, through construction and commissioning; and
A central repository for all documentation including engineering drawings for each DG project.
The goal of the first phase of the project is to automate the application process for all types of DG connections and to be able to track and report status to the customer.
For simple DG applications, National Grid expects to:
Fully automate the application process; Screen the applications; and Automatically create and send the “Authorization to Connect” letter to the
customer and contractors.
For all types of DG connections the elapsed time that an application remains in each state of the connection process will be tracked to assure compliance with tariff regulations and provide appropriate management reports.
The second phase of the project, scheduled for 2017, will include additional automation to the complex DG connections projects, provide a pre-screening function as to the viability for a DG connection at a particular site, and expand the DG application portal to include the same level of automation for the applications requesting gas and electric service at new locations. Benefits from a streamlined process include increased customer satisfaction, greater accuracy along the project lifecycle, and a reduction in redundant work and handoffs.

National Grid Distributed System Implementation Plan
National Grid’s Distributed System Implementation Plan Page 63
Interconnections Requirements
As discussed in the system planning section, and as is shown in Figure 4-7 below, the level of DG interconnection is dramatically increasing. The Company is working diligently to efficiently integrate DG while maintaining a safe and reliable power system. In furtherance of that objective, National Grid is considering several changes to its standard interconnection practices.
Figure 4-7 National Grid New York DER Interconnection Applications
The following are four key interconnection elements and changes the Company expects will more efficiently and effectively accommodate the addition of generators without compromising electric power system (“EPS”) safety and reliability: 1. Anti-islanding protection equipment may be required by the utility to ensure that an
unintentional island is not sustained on a feeder or line section or substation bus. The IEEE 1547 states that anti-islanding protection is required for parallel generation on the EPS where “an unintentional island in which the distributed resource (“DR”) energizes a portion of the Area EPS through the point of common coupling (“PCC”), the DR Interconnection system shall detect the island and cease to energize the Area EPS within two seconds of the formation of an island.” Utility practice has required direct transfer trip as a definitive protection means for anti-islanding protection. Industry standardization of islanding detection methods is needed to help reduce the volume of direct transfer trip installations.
0
1000
2000
3000
4000
5000
6000
7000
2009 2010 2011 2012 2013 2014 2015 2016YTD
NY Applications
Int'd
Rec'd

National Grid Distributed System Implementation Plan
National Grid’s Distributed System Implementation Plan Page 64
National Grid expects to make the following changes: Evaluate frequency signal-based power line carrier communication alternative for anti-
islanding protection systems; Accept certified inverter operation as the means of protection from islanding or potential
back feed onto the grid; and
Utilize standard models developed for certain inverter types in short circuit and load flow analysis.
2. Protection of transmission-side ground fault overvoltage on power transformer equipment
from any source on the secondary side may, depending on the protection schemes in place at any substation, require zero sequence voltage (“3V0”) protection equipment. A delta connection on the transmission side and wye-grounded connection on the distribution side cannot contribute zero sequence ground fault current during single line to ground faults on a transmission line, resulting in the voltage on the unfaulted phases to rise significantly and rapidly. These overvoltages have the potential to exceed insulation levels of the substation and transmission line equipment, and maximum continuous operating voltage of surge arresters. In order to detect these overvoltage conditions, 3V0 protection on the primary side of the transformer is required. This 3V0 protection will disconnect the generation from the substation transformer and stop the generation and the transformer from contributing to the transmission-side overvoltage condition. National Grid expects to make the following changes: Utilize bushing potential devices where complications with installing standard 115kV
coupling capacitor voltage transformers occur in substations; and Consider 3V0 in the standard design of all new substations.
3. DG ranging from 300 kW in capacity and above on radial distribution systems may require
SCADA communication for visibility and control from National Grid’s control center operators. This visibility is essential in maintaining daily system operability and the flexibility to transfer loads and feeder segments to allow for system upgrades, repairs, seasonal loading transfers, and other normal distribution system management functions that may require a SCADA RTU at a DG facility. These circumstances include and are not limited to: Planned or forced EPS reconfigurations (not permanent) lasting three weeks in duration
or less; or occurring on less than a seven-day advance notice. For long-term planned reconfigurations (not permanent), lasting over three weeks with a
seven-day advance notice requirement. For emergency switching (e.g., de-energizing a feeder or feeder section manually that
sources a DG facility). Where there is distribution EPS feeder selectivity operation (e.g., loop scheme). National Grid expects to make the following changes:

National Grid Distributed System Implementation Plan
National Grid’s Distributed System Implementation Plan Page 65
Simplified RTU for DG facilities that is capable of using multiple communications methods;
Use of cell phone technology for EMS communications from the DG facility; and Use customer-generator protective equipment to communicate the signals to EMS
without need of an RTU.
At high solar PV penetration levels load rejection over-voltage (“LROV”) protection is necessary to protect the Company and customer equipment from temporary overvoltage. National Grid expects to make the following change: Revise National Grid parallel generation technical requirements to incorporate LROV
protection specifications for DG facilities.
Distribution Demand Response Program 3.
National Grid Offered Customer DR Programs for the First Time in 2015
In 2015, Upstate New York utilities, including National Grid, developed and implemented distribution-level DR programs for their respective service territories in accordance with the Commission’s directives in Case 14-E-0423. The Company worked with Consolidated Edison Company of New York, Inc., who was already offering such DR programs, and the other electric utilities, to develop three demand response programs as follows:
The DLC program equips residential and small commercial customers with load control devices that the Company (or the customer) can remotely control during times of electric system stress.
There are two commercial program offerings: o The CSRP may be called for peak shaving; and o The DLRP may be called in contingencies when identified equipment exceeds
operational limits.
For the 2015 summer capability period, these utility DR programs were offered on a pilot basis by National Grid as part of a NWA solution for the Village of Kenmore, located just north of the City of Buffalo. The area is populated by 18,000 residential and small commercial customers. Many of the homes and small businesses were built before central heating, ventilating, and air conditioning (“HVAC”) systems were common, making window air conditioning (“AC”) a high-potential source of controllable load.
The Commission approved National Grid’s system-wide expansion of the DLC Program and CSRP for the 2016 summer capability period with certain modifications in its May 23, 2016 order. The Company’s DLRP will remain focused on stressed electrical equipment and only be
offered in targeted areas within the service territory for the 2016 summer capability period.
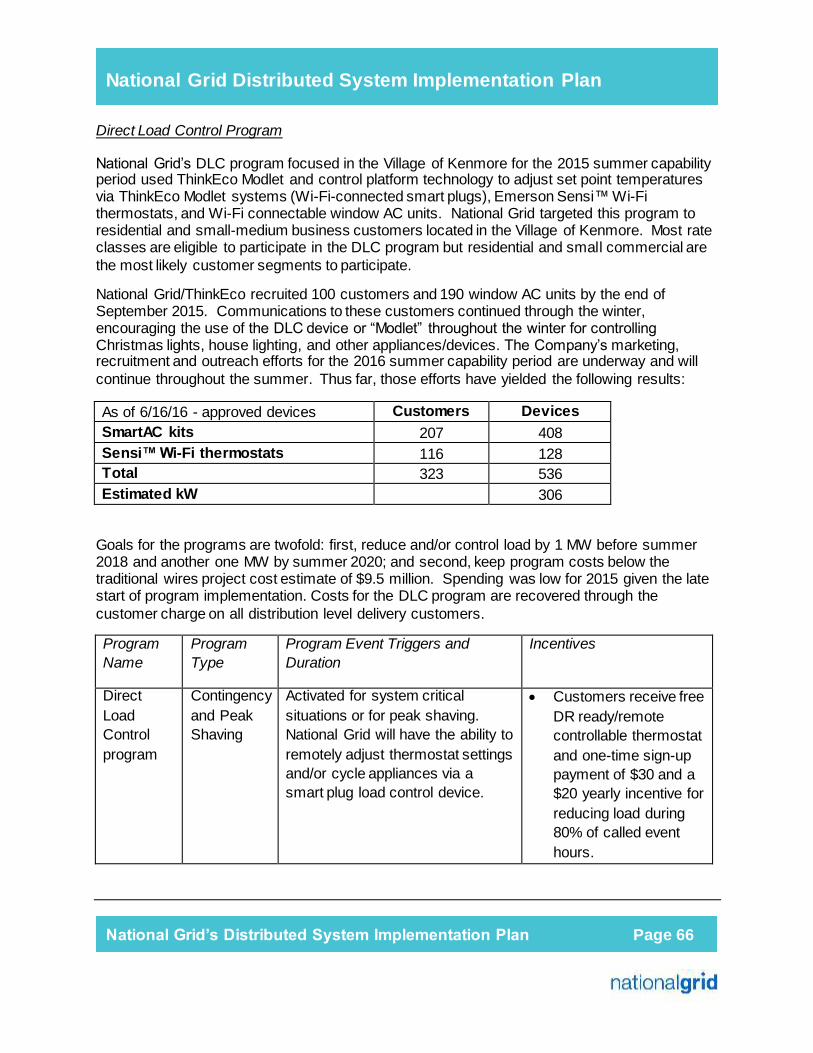
National Grid Distributed System Implementation Plan
National Grid’s Distributed System Implementation Plan Page 66
Direct Load Control Program
National Grid’s DLC program focused in the Village of Kenmore for the 2015 summer capability period used ThinkEco Modlet and control platform technology to adjust set point temperatures via ThinkEco Modlet systems (Wi-Fi-connected smart plugs), Emerson Sensi™ Wi-Fi thermostats, and Wi-Fi connectable window AC units. National Grid targeted this program to residential and small-medium business customers located in the Village of Kenmore. Most rate classes are eligible to participate in the DLC program but residential and small commercial are the most likely customer segments to participate.
National Grid/ThinkEco recruited 100 customers and 190 window AC units by the end of September 2015. Communications to these customers continued through the winter, encouraging the use of the DLC device or “Modlet” throughout the winter for controlling Christmas lights, house lighting, and other appliances/devices. The Company’s marketing, recruitment and outreach efforts for the 2016 summer capability period are underway and will continue throughout the summer. Thus far, those efforts have yielded the following results:
As of 6/16/16 - approved devices Customers Devices SmartAC kits 207 408 Sensi™ Wi-Fi thermostats 116 128 Total 323 536 Estimated kW 306
Goals for the programs are twofold: first, reduce and/or control load by 1 MW before summer 2018 and another one MW by summer 2020; and second, keep program costs below the traditional wires project cost estimate of $9.5 million. Spending was low for 2015 given the late start of program implementation. Costs for the DLC program are recovered through the customer charge on all distribution level delivery customers.
Program
Name
Program
Type
Program Event Triggers and
Duration
Incentives
Direct Load Control program
Contingency and Peak Shaving
Activated for system critical situations or for peak shaving. National Grid will have the ability to remotely adjust thermostat settings and/or cycle appliances via a smart plug load control device.
Customers receive free DR ready/remote controllable thermostat and one-time sign-up payment of $30 and a $20 yearly incentive for reducing load during 80% of called event hours.

National Grid Distributed System Implementation Plan
National Grid’s Distributed System Implementation Plan Page 67
Recoverable costs for the DLC program for the 2015 summer capability period are illustrated in the chart below:
Item Cost Comments
Hardware $48,000 Modlet and smart AC thermostats
Program Services
$55,000 Hub set-up, marketing, and program management
Central AC Program
$35,000 Central AC set-up, marketing, and program management
Total $138,000
Distribution Load Relief Program
DLRP is a contingency demand response program which targeted large commercial customers also focused in the Village of Kenmore for the 2015 summer capability period and which continues for the 2016 summer capability period. Contingency programs call for load relief during distribution electrical emergencies such as overloaded conductors or substation equipment. DLRP customers can choose to participate in a monthly reservation payment option wherein they pledge load by contract. Reservation option participants are required to shed their contracted load level during called DR events. Along with monthly reservation payments during the capability period (May 1- September 30) reservation customers are also paid for their performance/curtailment during a National Grid declared DR event. A voluntary participation option pays customers for event performance/curtailment only. The payment structure is outlined in the table below. DLRP events may be called when targeted equipment exceeds its limits.
Program
Name
Program
Type
Program Event Triggers and
Duration
Incentives
Distribution Load Relief Program
Contingency
Contingency program activated for system critical situations - unforeseen distribution system emergencies wherein stressed electrical equipment may exceed limits.
Events are called with short/no advance notice ("Immediate") or at
Reservation Payment Option:
Reservation Payment = $4.69/kW Month;
Performance Payment = $1.02/kWh;

National Grid Distributed System Implementation Plan
National Grid’s Distributed System Implementation Plan Page 68
least two hours advance notice ("Test" or "Contingency").
Test events last 1 hour - Contingency or Immediate events may last 4 or more hours.
Includes Reservation and Voluntary participants.
Voluntary Option:
Performance Payment = $1.20/kWh
Commercial System Relief Program
The CSRP is a peak shaving program which targeted large commercial customers in the Village of Kenmore for the 2015 summer capability period. It is dispatched to relieve the electrical system during summer load peaks. CSRP customers can choose to participate in a monthly reservation payment option wherein they pledge load by contract. Reservation option participants are required to shed the contracted load level during DR events. Along with monthly reservation payments during the capability period (May 1-September 30) reservation customers are also paid for performance/curtailment during a National Grid declared DR event. A voluntary participation option pays customers for event performance/curtailment only. The payment structure is outlined below. Peak shaving events may be called when targeted area loads or whole system loads are forecasted to exceed a designated percentage of National Grid’s 95/5 peak load forecast. For the 2015 summer capability period this was set at 97%. For the 2016 summer capability period National Grid was directed by the Commission to use 92%.
Program
Name
Program
Type
Program Event Triggers and
Duration
Incentives
Commercial System Relief Program
Peak Shaving
Activated for peak shaving needs. For "Planned Events" the Company provides > 21 hours’ notice and
may last 4 hours or more.
For "Unplanned Events" the Company will provide < 21 hours’
notice.
Includes Reservation and Voluntary options for participants.
Reservation Payment Option:
Reservation Payment (up to 4 events) = $2.75/kW Month;
Reservation Payment (over 4 events) = $3.00/kW Month;
Performance Payment - Planned Event = $0.17/kWh;
Performance Payment Unplanned Event =

National Grid Distributed System Implementation Plan
National Grid’s Distributed System Implementation Plan Page 69
$0.21/kWh.
Voluntary Option:
Performance Payment Planned Event = $0.16/kWh;
Performance Payment Unplanned Event + $0.19/kWh
Demand Response Program Expansion During the DSIP Period
The Bring Your Own Thermostat (“BYOT”) aspect of the DLC program falls under National Grid’s newly developed “ConnectedSolutions” suite of products and services aimed at energy reduction and load control. ConnectedSolutions n Upstate New York will invite all customers to allow National Grid to control devices during times of electrical stress. For 2016, ConnectedSolutions will control Honeywell and Ecobee Wi-Fi-enabled thermostats. Later in the summer the Company plans to add Wi-Fi enabled/controlled washers and dryers. National Grid, WBH and ThinkEco are working on connections for ThinkEco Modlets and other Wi-Fi enabled thermostats. The Customer Energy Management & Connected Device Platform section further discusses future expansion plans for these programs.
Marketing channels will include OEM marketing to customers who own qualified devices, mass marketing via bill inserts and electronic newsletters, and targeted communications to customers who applied for National Grid’s Wi-Fi thermostat rebate. In addition, the Company is exploring outreach partnerships with gas utilities where we share franchise territories such as National Fuel Gas in Western New York.
The DLC program will grow to include as many cost-effective devices and thermostats as technology allows. Short-term targeted devices include: pool pumps, ductless mini splits, EV chargers, water heaters, and dehumidifiers.
Potential Partnership: EPRI and the Consumer Electronics Association CEA Standard 2045
National Grid is exploring a partnership with EPRI to test and/or implement their ANSI CEA 2045 modular demand response technology. EPRI is working with device manufacturers to enable communication and control through a module which a consumer can easily attach to a demand-response ready device. Devices include water heaters, thermostats, window AC, solar inverters, and packaged terminal AC units. The CEA 2045 devices can connect through open access communications. Like a USB port, the CEA 2045 provides a seamless communication channel. The utility, customer, or vendor can choose their communication channel, including: AMI meters, cellular, power lines, or Wi-Fi.
National Grid Distributed System Implementation Plan
National Grid’s Distributed System Implementation Plan Page 70
The modular technology allows for mass production of DR-ready devices and eliminates the concern of replacing a device due to aging technology. The technology can be updated through the module while the device stays in place. The Company is considering adoption of this technology for a future NWA project area and for the proposed Clifton Park REV demonstration project.
Potential Partnership: Energy Efficiency – Optimization and Customer Energy Reports
National Grid currently uses Opower to deliver home energy reports, which rate a customer’s energy usage as compared to its similarly sized neighbors, and provide recommendations for ways to save energy. The Company plans to review the OPower report and leverage it with other options offered by our DR platform provider – WBH. WBH/Earth Networks has a network of hyper local weather stations which provide them the ability to optimally control various devices in a participant’s home while also keeping them comfortable. The Company will explore a partnership with National Grid EE teams to study adoption of this technology – especially in areas of electrical stress.
In addition, WBH/Earth Networks has a home energy scorecard which taps into customer behavior to lower energy usage. The scorecard engages customers by combining WBH’s unique ability to tie together weather data and home energy use. The scorecard has saved customers 2% on their energy bill through behavior changes by the customer in response to education. Since WBH is the Company’s DR platform provider/vendor for the DLM BYOT program, adopting the scorecards and optimization technologies could be a cost-effective addition, especially if paired with targeted marketing tactics to promote EE incentives.
For the CSRP, as of June 20, 2016, National Grid has enrolled 127 assets under three aggregators who are contracted to deliver 132 MW of load when called. The Company is targeting CSRP dispatches between the hours of 1200 and 1800 for its four-hour CSRP events during the 2016 summer capability period. Benefits of this available load include:
Peak load reduction; Extended equipment life – reduced CapEx spending; Reduced commodity purchases; Income stream for DR participants; Outage mitigation/avoidance; Control center flexibility; Reduced O&M costs due to reduction in in field switching needs; Behavioral considerations/changes; Increased adoption of building management technologies; and GHG reductions.
The benefits above can result in monetary savings for all customers due to reduced O&M and capital expenditures. Reductions in peak loads can also drive down GHH emissions. In addition, DR can enhance customer behavior regarding reactions to electric system stress and/or emergencies.

National Grid Distributed System Implementation Plan
National Grid’s Distributed System Implementation Plan Page 71
For the DLRP, the Company has proposed that the program remain focused in electrically stressed areas, such as the Village of Kenmore. However, the DLRP may be additionally applied by National Grid in areas of stress that are under NWA review.
National Grid was directed by the Commission to study a system-wide expansion of the DLRP for future summer capability periods. The Company will review costs and benefits for such an expansion with results required to be submitted to the Commission by December 1, 2016.
Customer Portals and DERMS 4.
Achieving a dynamic distribution market requires informed and engaged participants as well as the platform technologies necessary to integrate third-party offerings with real-time grid operations. The customer energy management and connected device platform will enable the Company to be a conduit of the information for customer and market participants who may desire to better manage their energy consumption and opportunities in the distribution market. The second platform is a DSP enabler, such as a DERMS, to permit real-time grid and market operations. These systems are not envisioned until later in the DSIP as they are contingent on expanded interval metering and the results of the Company’s DSP REV demonstration project where lessons will be learned at a demonstration scale in advance of full-scale deployment.
Customer Energy Management & Connected Device Platform
The vast majority of residential and small business customers are on standard rate structures which provide no price signal for peak demand reduction. A key goal of the REV initiative is peak demand reduction. Today, residential and small business customers have no means to view their energy usage in intervals less than a full month, limiting their ability to understand or better manage their electric bills. They are also unable to view their electric usage in near real-time.
During the DSIP rollout, National Grid plans to provide a broad set of new energy information services and tools to its customers, enabled by AMF and related systems and tools. Advanced metering will allow customers to opt in for this enhanced service and become actively engaged and empowered for making decisions in regard to how they manage their energy usage. Advanced metering will enable the Company to offer new TOU and demand-based pricing structures to all of its customers. Customers will have the ability to view historic usage via Green Button Download My Data.
National Grid’s Proposed Customer Energy Management & Connected Device Platform
At the center of the customer’s experience of advanced metering will be the Company’s proposed customer energy management and connected device platform.
Energy Monitoring Portal (Desktop or Mobile)

National Grid Distributed System Implementation Plan
National Grid’s Distributed System Implementation Plan Page 72
The Company’s customer website will host the energy monitoring portal that will allow customers to view their energy usage, along with their current and previous billing history. The opt-in energy monitoring portal will allow customers to see their historical usage compared to current usage with a projected amount forecast for the same period. National Grid is planning on 25% of eligible customers participating in this portal over the ten year planning period. Customers will be able to understand how their current consumption may affect their future bill. Customers will be empowered to make decisions based on near real-time information, which may enable them to reduce their energy usage or allow them to shift their energy use during the course of the day to benefit from TOU or demand rates.
Customers will have access to the energy/connected device portal through the use of either a mobile device (Android/IOS) or a desktop application. The website will be created so that customers are able to go to one common Company site and then select different options as required from one page. From the National Grid homepage, they will have the ability to view their connected devices and energy usage on demand by logging in using a single National Grid user ID and password.
Connected Devices
National Grid will provide a connected device portal in parallel to the energy portal which will allow customers to view and control approved EE devices and appliances that are connected to the platform. Furthermore, National Grid will work with participating manufacturers to create a Bring Your Own Device environment that will enable customers to view device/appliance usage, control devices/appliances, and participate in demand curtailment events if they so choose.
Demand Response Participation
Customers may be notified of DR events through the web portal and mobile devices. This notification process will allow customers to customize how they would like to receive event notices and whether they would prefer to opt out of an event. They will also have the ability to opt out or override devices during a demand curtailment event. National Grid will have the information to report on DR participation, opt out, overrides, and non-communication on an account-level basis. National Grid will also use this information to better forecast demand reduction capabilities based on a historical baseline and past performance.
Expected Customer Applications
Energy Efficiency
AMF has shown to provide a positive impact for EE when used with energy portals and energy monitoring devices that present energy usage to customers. In Massachusetts, for example, one of National Grid’s affiliates conducted a pilot project using multiple pricing mechanisms. Customers who installed an in-home energy monitoring device saved 38 kWh per month. Third-party devices would allow customers to choose how they view their usage. This is key, since

National Grid Distributed System Implementation Plan
National Grid’s Distributed System Implementation Plan Page 73
experience has shown that customers who actively viewed their energy usage on a web-based energy portal saved 30 kWh per month. The results demonstrate that customers are able to achieve savings of 360-456 kWh annually depending on how their personal energy information is presented and whether it is accessible.
Customers will receive behavioral messaging as to how they might realize more energy savings. For instance, a tip could provide customers a demonstration about how a set point change on their thermostat may affect energy usage over the course of the heating season; or a message could inform customers how a behavioral change might impact their energy usage. The Company could personalize messages so they will be actionable and relevant to each customer.
The advanced functionality of meters also allow for customers to enroll in TOU rates and other potential pricing plans.
Increased Customer Energy Intelligence
With the customer permission, National Grid will store customer information received from customer devices in accordance with all applicable rules, regulations, and guidelines. Storing this information with customer permission will allow National Grid to provide actionable personalized information to those customers. The Company may, for example, suggest to a customer that they could benefit from an energy audit or that they might need additional insulation in their home based on an HVAC load profile assessment through information gathered from the customer’s communicating thermostat or AMF meter.
The Company is developing techniques to profile homes that have smart thermostat data that will allow the Company to work with partners to provide home audit assessments that determine whether a home might need energy upgrades such as insulation or windows. National Grid is also exploring opportunities to work with partners that will use AMF meter data to disaggregate loads and inform customers how they currently are using their energy on a segmented basis.
Ease of EE Incentive Payments
A customer portal will facilitate rebate processing. Customers who join technologies through the online energy portal could apply for a qualifying incentive if the unit is from a qualified manufacturer and the manufacturer supports the relevant information needed to qualify for an incentive.
Communication with Other Devices in the Home
Participants will realize the ability to control home appliances devices through the use of the National Grid energy portal. National Grid will work with third parties to integrate communicating thermostats and appliances in an intuitive platform, giving customers the ability to monitor and control devices from different manufacturers in one Company platform. The users will maintain the ability to interact with the manufacturer on their respective websites as well which will allow customers to determine their provider of choice for the services they choose to use.
National Grid Distributed System Implementation Plan
National Grid’s Distributed System Implementation Plan Page 74
Platform Enablement of Third Party Devices
Customers shall have the ability to purchase third-party energy monitoring devices that communicate directly to the AMF meter. Customers may purchase an energy monitoring device by selecting a pre-approved vendor from a list provided by National Grid. The device provider would have the ability to present the customer’s meter usage in near real-time using a ZigBee 1.1 or greater chipset meter signal for communication on an energy display purchased by the customer from the vendor.
The Company intends to engage external stakeholders to actively participate and enroll devices capable of two-way communications on National Grid’s platform that will allow customers to realize the benefits of communicating devices, such as thermostats, water heaters, or household appliances. Devices must be capable of being controlled for DR and allowing customer energy savings. Manufacturers will help support the costs of integration into the National Grid platform.
Platform Participation by Manufacturers and Third-Party Device Providers
Manufacturers are expected to support the integration of devices for participation in the portal. Each manufacturer will support the costs to deploy their respective technology on the portal, including application programming interfaces (“API”) integration costs, vendor fees, testing, security fees, and other associated costs. The Company will strive to keep costs as low as possible to allow for robust manufacturer participation and for the highest level of customer choice.
Manufacturers will benefit from the ability to offer connected devices to customers. As a result, customers will have a more convenient method to process EE incentive applications. The Company will also provide customers a list of qualifying connected devices that will allow them to control/view devices through the National Grid portal, as well as information about where they can purchase the devices.
Connected devices will also drive innovation. Customers will want to purchase products from manufacturers for devices that fit their lifestyle. In turn, manufacturers that are best able to respond to these customer demands will increase sales by promoting new innovative technologies that better meet customer needs and their evolving expectations. To help defray costs and incentivize early adoption, customers may be able to partially finance the purchase of devices through EE rebates and DR payments for demand reductions.
DERMS / DSP
The Company’s DSP REV demonstration project in Buffalo will test the concepts and technologies necessary to operate a local DSP. As set forth in Figure 4-8 below , the Company expects the DSP REV demonstration project to show that a variety of components, universal
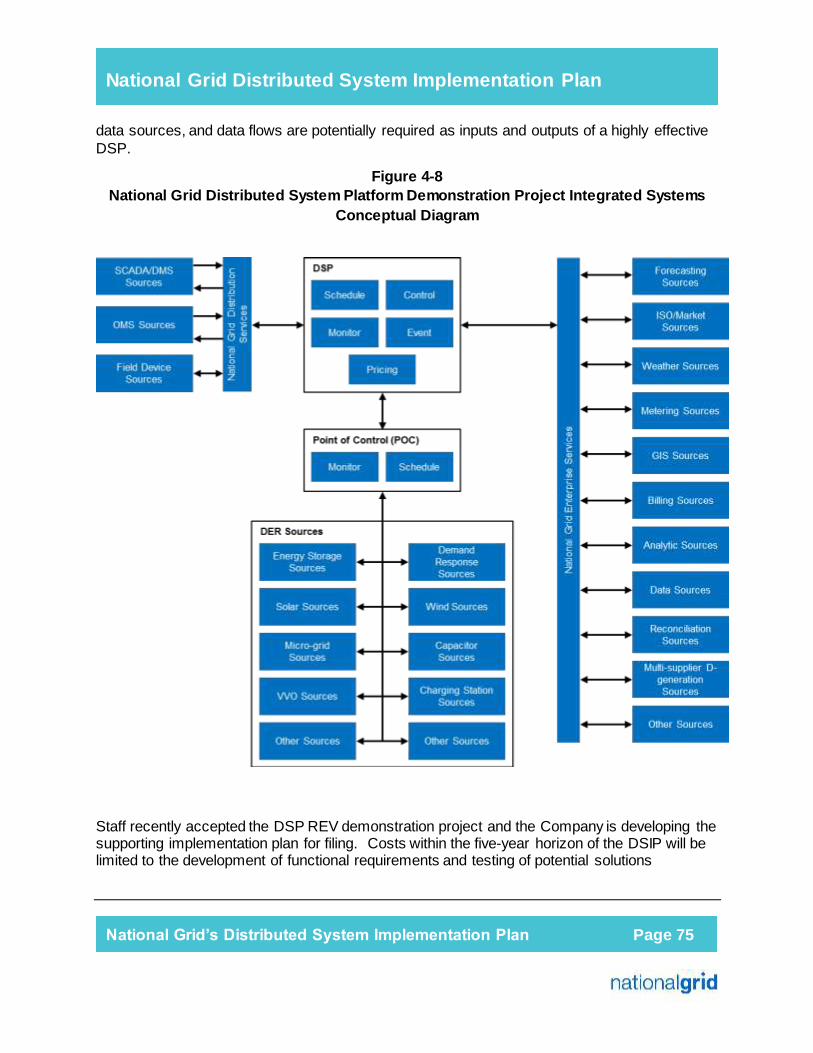
National Grid Distributed System Implementation Plan
National Grid’s Distributed System Implementation Plan Page 75
data sources, and data flows are potentially required as inputs and outputs of a highly effective DSP.
Figure 4-8 National Grid Distributed System Platform Demonstration Project Integrated Systems
Conceptual Diagram
Staff recently accepted the DSP REV demonstration project and the Company is developing the supporting implementation plan for filing. Costs within the five-year horizon of the DSIP will be limited to the development of functional requirements and testing of potential solutions
National Grid Distributed System Implementation Plan
National Grid’s Distributed System Implementation Plan Page 76
beginning in 2019. The platform proposed in the DPS REV demonstration project may be scalable on a feeder basis if necessary to advance an NWA project before a larger scale deployment is implemented.
Emerging Technologies 5.Energy Storage Energy storage will be an important technology for integrating increasing amounts of DG into the electric distribution system, as well as providing capacity and other needed services in targeted parts of the distribution system.
Currently, National Grid and its affiliates are undertaking an internal education effort to introduce storage evaluation into distribution planning. This education effort consists of familiarizing engineering staff with the technical terminology, performance characteristics, and cost trends across a range of storage options. The Company and its affiliates expect storage will be routinely considered as a “tool in the broader toolbox” of solutions at the early stage of all
network assessments.
National Grid is interested to demonstrate storage technologies in its service territory through NWA initiatives or future REV demonstration projects.
Microgrids
During the DSIP period, National Grid will promote market animation for microgrid services through its continued support of the NYSERDA NY Prize Competition, the Potsdam Community Resiliency REV demonstration project (“Potsdam Community Microgrid”), and the BNMC NY Prize initiative (“BNMC Community Microgrid”) which, in parallel with National Grid's proposed DSP REV demonstration project, will help to strengthen the electric distribution gird and provide system relief during periods of high demand. NY Prize Overview and Current Status NY Prize is a community-based, three-stage microgrid competition administered by NYSERDA with support from the Governor’s Office of Storm Recovery, as well as support and consultation from the Commission and the State’s utilities. Community-based microgrids are intended to create storm-resilient areas of the electric distribution system where standalone energy systems can operate independently in the event of a power outage. Applicants were encouraged to utilize renewable power sources and to select locations within residing within designated “Opportunity Zones,” which are geographic areas identified by utilities where microgrids may reduce utility system constraints and defer major infrastructure investments. Applicants were also advised to consider the utilization of existing and/or new renewable energy resources and DERs within their microgrid feasibility studies.

National Grid Distributed System Implementation Plan
National Grid’s Distributed System Implementation Plan Page 77
Stage 1 applicants have submitted their final microgrid feasibility studies to NYSERDA for Stage 2 consideration. The Joint Utilities are currently reviewing Stage 1 feasibility studies and providing their individual comments to NYSERDA. National Grid worked with twenty-two applicants within its service territory. Likewise, the Company’s downstate gas affiliates worked with eighteen NY Prize project teams. In April 2016, NYSERDA issued the RFPs for Stage 2 of NY Prize, which consists of audit-grade engineering design and business planning. Nearly all forty applicants that participated in Stage 1 in National Grid or its affiliates’ service territories are expected to participate in the Stage 2 RFP. NYSERDA expect to select Stage 2 award recipients in the fall of 2016. NYSERDA’s recently released Stage 2 RFP 3044 provides applicants with the requirements for Stage 2’s detailed engineering and commercial assessment of the community microgrid proposals developed either independently or in conjunction with Stage 1’s feasibility studies. National Grid expects to partner with the Stage 2 award recipients in its service territory to assist them in designing viable and beneficial community microgrids with an emphasis on providing system capacity, loading benefits, and overall electric distribution system efficiencies. National Grid expects NYSERDA will release the Stage 3 NY Prize RFP, the microgrid build-out that will award funding to projects for construction, in January 2018, with awards expected in June 2018. National Grid will also continue to work with the Joint Utilities, the Commission, and NYSERDA to provide input on RFP-related documents as well as to identify, evaluate, and implement potential solutions. National Grid’s Support of Customer NY Prize Applications National Grid has served on the project teams for two NY Prize community microgrid proposals: the Potsdam Community Microgrid, which will not compete for a NY Prize Stage 2 award, but will develop detailed design with the help of REV demonstration project funding, and the BNMC Community Microgrid, which submitted a NY Prize feasibility study for Stage 2 award consideration by NYSERDA. The Potsdam Community Microgrid: Resiliency REV Demonstration Project The Potsdam Community Microgrid focuses on how community resiliency during severe weather events in New York’s north country region can be improved through the development of a community-based microgrid that utilizes a hybrid utility microgrid ownership model and a proposed, new underground distribution network. Through testing utility services that provide coordination and aggregation to enable a financially sustainable multi-customer microgrid business model, National Grid expects to offer in-house and third-party microgrid control services to help overcome commercial barriers to the development of multi-customer hybrid utility microgrids

National Grid Distributed System Implementation Plan
National Grid’s Distributed System Implementation Plan Page 78
The Potsdam Community Microgrid builds upon Clarkson University’s successful NYSERDA Program Opportunity Notice (“PON”) 2715 project proposal and implementation, of which National Grid pledged in-kind contributions and funding support, to develop the conceptual design of a community-based microgrid for Potsdam. The Buffalo Niagara Medical Campus Community Microgrid BNMC has completed a NY Prize Stage 1 feasibility report and will apply for Stage 2 consideration. The BNMC Community Microgrid seeks to meet the resiliency needs of the BNMC as a whole, including individual BNMC member institutions, and the Greater Buffalo region through a tiered approach (see Figure 4-9) that builds upon the resiliency of its underground network, existing and scoped DERs, and energy-efficient facilities. BNMC expects the project will ultimately lead to a regional community microgrid capable of withstanding a catastrophic weather event or system failure, while also positioning itself to leverage ‘blue-sky’ monetization opportunities.
Figure 4-9 Proposed BNMC Community Microgrid Strategy

National Grid Distributed System Implementation Plan
National Grid’s Distributed System Implementation Plan Page 79
The BNMC’s completed NY Prize Stage 1 feasibility study report evaluated the feasibility of Layer 2 of its tiered community microgrid strategy as a complement to a parallel effort funded by NYSERDA and National Grid to evaluate Layer 1 of the BNMC community microgrid strategy.20 National Grid served on the BNMC Community Microgrid project team that assessed Stage 1 feasibility. National Grid has further committed to providing engineering support as well as serving as a project advisor on electric interconnection and regulatory issues going forward. Through supporting the development and operation of the BNMC Community Microgrid project, National Grid seeks to help BNMC and its member institutions achieve their project objectives. The Company also anticipates the added advantages of potentially deferring future electric grid investments and gaining experience it could use to inform and/or support similar customer projects in the future – projects that could maximize the value of DERs and optimize the day-to-day operation of the electric distribution grid.
Electric Transportation
National Grid believes the State’s ambitious carbon reduction and overall climate change mitigation goals can only be attained with the inclusion of the transportation sector through efforts to scale up EV technology. The Company believes there is great potential to support the Commission’s policy objectives and further enable customers’ transition to EVs. However, in the short term the Company believes the current EV-adoption rate will not yield substantive benefits or create risks to the electric distribution system. Over time, as more EVs are connected to the distribution system, the benefits of EVs and charging stations as DERs (e.g., vehicle-to-grid charging) and risks (e.g., overloaded feeders) may become more impactful.
Current State Assessment
National Grid operates sixty-six Level 2 EV charging stations at public locations across its service territory.
More than 1,000 unique drivers have used these stations since installation in 2012. By the Company’s estimation, there are about 3,800 EV drivers in its service territory. National Grid has proposed revisions to its SC-1 Voluntary TOU rate to include a one-time
option for owners of PEVs. After the initial one-year term, customers who received supply service from the Company and provided verification of a PEV at its premises will have a one-time option of receiving a comparison of twelve months of charges under this special provision L with what they would have paid under the SC-1 standard tariff rate (excluding the incremental customer charge of $3.36 per month and the new hedge adjustment component of the Electricity Supply Reconciliation Mechanism). If this comparison indicates the customer would have paid less on the SC-1 standard tariff rate, the Company will
20
“Assessment of an Urban Micro-grid”, NYSERDA Project #: 36660.

National Grid Distributed System Implementation Plan
National Grid’s Distributed System Implementation Plan Page 80
provide the customer with a refund for the difference. At that time, the customer may choose to stay on this special provision L or move to the SC-1 standard tariff rate.
Future Electric Transportation Efforts During the DSIP Period
National Grid plans to coordinate with its peer utilities in New York, when developing its plans to increase the deployment of EVs and electric vehicle supply equipment (“EVSE”). The following include some of the Company’s program concepts:
EV Customer Outreach & Education – EVs are relatively new to consumers and greater effort is required to educate consumers on EV benefits (e.g., air and health quality, lower costs to operate and maintain, quiet). While this outreach and education will not directly impact the distribution system, step changes in EV adoption might accelerate distribution system issues (and benefits).
EV Charging Infrastructure Concepts – The Company believes it may help accelerate EV adoption by installing EV charging stations in targeted segments such as work places and multi-unit dwellings (e.g., apartment buildings with large common parking lots). Charging stations availability in these particular segments help address EV drivers’ refueling concerns.
Monitoring EV Adoption & Charging –The Company believes that information, such as EV home location (registered address), year/make/model, charger load rating, and regular charging times, are all valuable data points to consider for distribution system planning. Also of value is information regarding public and multi-user EV charging stations such as location and real-time detailed usage information should that data be available (e.g., through a smart meter). Currently, this information does not get back to the Company in any meaningful way with the exception of data (e.g., make/model/type/zip code) purchased from R.L. Polk. Specific EV home address data and vehicle make and model is maintained by the New York Department of Motor Vehicles and if made available to the Company, with appropriate privacy protections and the EV owner’s express permission, could be mapped to the distribution system to identify where distribution system issues could occur over the longer term.
Beyond Five Years –The Future of EVs as Controllable Load: EV batteries have the potential of supporting the distribution system both by providing power to the grid (vehicle-to-grid charging) and storing power from the grid (absorbing excess generation from renewables). The Company will continue to monitor ongoing pilots and explore the extent to which they can be implemented to support the distribution system.
Table 4-2 National Grid Incremental Investment for DSP Development
2016 2017 2018 2019 2020 5 year 10 year 2016 2017 2018 2019 2020 5 yr 10 yr
Project FY16-17 FY17-18 FY18-19 FY19-20 FY20-215-yr Total Yr 5-10
10-yr Total FY16-17 FY17-18 FY18-19 FY19-20 FY20-21
5-yr Total Yr 5-10
10-yr Total
System Data and DG Application Portals 1.7 3.9 0.0 0.0 0.0 5.6 0.0 5.6 0.7 1.3 1.1 0.7 0.7 4.6 3.6 8.2Integratged Planning & Forecasting/HCA/NWA 0.1 0.3 0.3 0.3 0.3 1.4 1.7 3.1 1.0 1.5 1.7 1.9 2.0 8.0 10.0 18.0Advanced Analytics Platform 0.0 5.9 0.7 0.7 7.3 1.3 8.6 0.0 0.0 1.5 0.9 0.9 3.3 1.8 5.0Customer Energy Mgt Platform 1.2 0.0 1.2 0.0 1.2 0.0 0.0 0.0 2.7 4.5 7.2 22.5 29.7DERMS / DSP Platform 0.6 1.5 2.0 0.0 2.0 0.0 0.0 0.0 0.0 0.0 0.0 0.0 0.0
Capex ($m) Operation & Maintenance ($m)
National Grid Distributed System Implementation Plan
National Grid’s Distributed System Implementation Plan Page 81
(Estimates are provided in 2016 dollars)
The investments in Table 4-2 above are considered incremental to the Company’s existing Capital Investment Plan (“CIP”), ETIPs, REV demonstration projects, and DR filings.
The incremental investments identified in the development of this initial DSIP focus on increasing the transparency and availability of information to customers and potential market participants and the development of tools and process to better integrate DER into system planning and operations. These benefits are difficult to quantify, but they are foundational to the ability to animate a retail market.
The System Data Portal will provide access to information that will help third parties understand the potential opportunities for DER and efficiently target DER in their business plans. The DG and New Connections Application Portal will streamline the interconnections process which should lead to savings for developers as the volume of requests continues to grow. Additionally, the Customer Energy Management and Connected Device Platform, which will inform customers of their options, connect customers with services and service providers, and enable informed customers to make more efficient decisions.
Investment in analytical tools and processes will permit the Company to develop the hosting capacity analysis, load and DER forecasting and probabilistic planning functions necessary to develop and operate the future electric system in a safe, reliable, and cost-effective manner.
There is no identified incremental spending request represented in this plan for NWA projects as it is assumed that the budget allocated for the wires project would be utilized by any NWA selected for implementation.
Beyond the first five years of this DSIP the Company anticipates the need to invest in DERMS-type tools and systems to more efficiently integrate DER into grid operations. The Company’s DSP REV demonstration project will commence shortly and National Grid anticipates it will provide valuable information from both a technology perspective and a process and policy perspective. During the DSIP period the Company expects to leverage the lessons learned through the REV demonstration project and expects to use those findings to develop and test additional functional requirements.

National Grid Distributed System Implementation Plan
National Grid’s Distributed System Implementation Plan Page 82
Advanced Metering Functionality b.
The following section summarizes the company’s recent, Advanced Meter Functionality Business Case (“AMF Business Case”) assessment of alternative AMF deployment options and the resulting proposed direction and investment plan. The complete AMF Business Case report is included as Appendix 3. The Potential of Advanced Meter Functionality In response to an evolving regulatory and market landscape National Grid has developed an AMF Business Case. The AMF Business Case demonstrates the viability of a full electric and gas smart meter technology deployment, as well as supporting infrastructure and systems. Such deployment builds the foundation to support fundamental change in the energy future of the Company’s customers, the electric and gas distribution system and the State of New York. By investing in AMF, National Grid will be taking a key step toward achieving the REV objectives as adopted in the Commission Track One Order and enabling the Company to assume the role of the DSP. These objectives include:
Empowering greater customer control over energy usage through participation in DR programs EE programs, and pricing programs;
Allowing granular electric and gas consumption data to be available to customers and approved third-party vendors in a timely and efficient basis;
Providing customers access to a marketplace, and the ability to choose new and innovative energy solutions from third-party vendors; and
Increasing electric grid reliability and resiliency.
In the broader context of the REV framework, AMF is a key component for building a robust, dynamic electric distribution grid, well positioned to integrate DERs as adoption accelerates. AMF provides the granular and spatial consumption and system information that supports and optimizes many of the planning, grid operations and market functions of the DSP. AMF can increase productivity and efficiency, allowing operations to restore outages faster and optimize grid performance, in combination with grid modernization investments. Further, AMF enables DSP planning functions such as demand modeling, load forecasting, and capital investment planning. Beyond the core data granularity and meter-reading-to-bill functions, AMF can act as a coordinated group of sensors stretching across National Grid’s service territory. Combined with other capabilities envisioned in the DSIP, but outside the scope of the AMF Business Case, this ability can enhance the functionality of various systems and business units. An ADMS, for instance, is enhanced by the grid of sensors, leveraging them to expand the situational awareness of grid operators, to more quickly identify and respond to outages. Additionally, with “grid optimization” AMF data is an enabler resulting in more accurate, more efficient outcomes for currently available capabilities such as voltage optimization and DER integration.

National Grid Distributed System Implementation Plan
National Grid’s Distributed System Implementation Plan Page 83
AMF Deployment Options The AMF Business Case presents a comparative assessment of the benefits and costs of three AMF deployment options of different scale. They are described in Figure 4-10.
Figure 4-10 High-level Descriptions of National Grid’s AMF Deployment Options
Option Description
A Full deployment of both electric Advanced Metering Infrastructure (“AMI”) meters and gas Encoder Receiver Transmitters (“ERT”) across National Grid’s service territory.
B Deployment of both electric AMI meters and gas ERTs across National Grid’s service territory in high-density population areas (approximately 40% of total electric and gas meter points).
C Deployment to any customers in National Grid’s service territory who choose to opt-in (approximately 10% of total electric and gas meter points)
Common Systems and Functionalities across Deployment Options While the deployment size may vary significantly from Option A to C, there are a number of common systems and functionalities that will be implemented no matter which option is chosen. These common AMF pieces include:
Energy Consumption Data Availability: Electric customers will have access to their raw, not validated, edited and estimated, usage data within four hours after an interval. Gas customers will have access to this raw usage information within eight hours due to battery limitations. In both cases, customers will have bill quality data within approximately 24 hours of the end of a given interval. The Company expects to engage stakeholders further with respect to their real-time information access needs following the initial DSIP filing as well as in conjunction with the supplemental DSIP stakeholder engagement process.
Metering Back Office Systems: The hardware and software that support metering functionality like the AMI Head-End, Meter Data Management System, and Data Warehouse will be integrated into the back office systems.
Customer Service System: The Customer Service System is a set of adaptable applications designed to manage customer-facing activities. These applications pull meter data to communicate comprehensible billing and energy use information to customers.
Web Portal: A secure and accessible web portal will interact with customers providing them with the tools, support, and educational materials to understand their energy consumption data and the insight to manage their energy usage effectively. This interface will empower customers to become active and informed energy consumers.
National Grid Distributed System Implementation Plan
National Grid’s Distributed System Implementation Plan Page 84
Green Button Connect My Data: This system gives every utility customer the ability to securely authorize both National Grid and designated third parties to send and receive their energy usage data.
Customer Education and Engagement: National Grid is prepared to pair the enabling technology of AMF with proactive customer engagement initiatives in order for the benefits of smart meter technology to be fully realized by the customer. National Grid’s three-stage program prepares customers to engage with the new technology and data streams as well as integrate with other energy modernization efforts.
Integrated Network Operations: The INOC oversees the day-to-day operations for the smart meter program. This function is a component of the broader INOC that is part of the grid modernization investment plan in the Company’s initial DSIP. The INOC will oversee the AMF rollout and respond to any meter related issues that occur during that phase. Once the rollout is complete, the INOC will mature into the central management hub to mitigate any meter related issues.
Key Input Assumptions and Sensitivity Analysis There are a number of key business case input assumptions, both cost and benefit, that have a measurable impact on the results of the benefit-cost analysis. These assumptions are described below including their treatment, if any, in the sensitivity analysis that was performed as part of the AMF Business Case analysis.
Status Quo AMR Replacement: National Grid currently has a fleet of automatic meter reading (“AMR”) meters covering its service territory that it expects to replace in the early 2020’s according to operational life expectancy documentation from the vendor. The AMF Business Case considers only the AMF costs above and beyond the baseline AMR replacement.
New York/Massachusetts Back-Office IT/IS Cost Sharing: Back office IT/IS costs can be shared across National Grid’s operating companies. The AMF Business Case evaluates as a sensitivity the impact of shared costs between National Grid and National Grid’s Massachusetts affiliates, Massachusetts Electric and Nantucket Electric. AMF implementation is under consideration for both of these affiliate companies as part of the Massachusetts Grid Modernization proceeding. Hearings in this proceeding are currently scheduled to conclude late this year.
AMF/Initial DSIP Cost Sharing: Certain cost components, such as IT/IS and Cybersecurity enable both AMF and the other grid modernization and DSP elements of the initial DSIP and thus are appropriately shared with the DSIP filing. If the AMF is approved and elements of the DSIP are not, these shared elements would need to be fully supported by the AMF effort.
Meter Deployment Opt-Out: Meter deployment opt-out is an area with large potential variability due to the uncertainties associated with the public perception of smart meter technology. The experience of other U.S. utilities show opt-out rates as low as one percent while National Grid’s Massachusetts affiliate observed opt-out rates approaching six percent during the Worchester Grid Modernization pilot. National Grid experienced an AMR opt-out rate of approximately one percent. Under Deployment Options A and B the AMF Business Case assumes a two percent opt-out rate.

National Grid Distributed System Implementation Plan
National Grid’s Distributed System Implementation Plan Page 85
Time-Varying Rates Pricing Program Opt-Out: The deployment of AMI meters will be accompanied by new rate structures. These programs do not mandate customer participation, and can be deployed as Opt-In (with approximately 20% participation anticipated) or Opt-Out (with approximately 80-100% participation anticipated, depending on the scenario analyzed). Benefits are significantly more impactful in an Opt-Out approach which is to be considered further as part of the REV Track 2 proceeding. This assumption is evaluated as part of the AMF Business Case sensitivity analysis.
An essential feature of the AMF Business Case analysis was the thorough examination of a range of variables that influence the economics of each deployment option. To articulate the range of likely outcomes for each deployment option two sensitivity scenarios are presented in the benefit-cost analysis. The key deployment option sensitivity scenarios are summarized as follows: Sensitivity Scenario 1
National Grid and National Grid’s Massachusetts affiliates share back-office IT/IS costs – Option A: 55%/45% (Upstate New York / Massachusetts), Option B: 42%/57%, and Option C: 15%/85%;
Time-Varying Rates - Customer participation rates vary among scenarios under an Opt-Out pricing program model. – Option A: 80% participate, Option B: 90% participate, and Option C: 100% participate.
Sensitivity Scenario 2 All back-office IT/IS costs, 100%, are attributed to the Upstate New York service territory
for all deployment scenarios. Time-Varying Rates achieve 20% participation for all deployment scenarios under an
Opt-In pricing program model.
AMF Benefit-Cost Analysis The results of the AMF Business Case analysis are found below in Figure 4-11. The analysis was performed in alignment with the BCA Order and the Company’s BCA Handbook included as Appendix 1 to this initial DSIP.
Figure 4-11
Results of National Grid AMF Business Case Analysis
20-Year NPV ($ in Millions) A: Full Deployment
B: Urban Deployment
C: Dispersed Deployment
Number of Electric Meters 1.7M 0.7M 0.17M Number of Gas Meter ERTs 0.7M 0.3M 0.07M MA/NY Back-Office IT/IS Cost Sharing
NY 55%
NY 100%
NY 42%
NY 100%
NY 15%
NY 100%

National Grid Distributed System Implementation Plan
National Grid’s Distributed System Implementation Plan Page 86
Pricing Program Participation Rates 80% 20% 90% 20% 100% 20%
Scenario 1 2 1 2 1 2 Benefits
SCT Benefits 603.22 451.46 248.09 193.56 143.77 84.69
UCT / RIM Benefits 467.54 339.77 195.39 145.33 131.45 73.81
Costs
Capital – Full AMF 382.77 392.21 185.55 197.75 73.37 91.53
Capital – AMR Replacement
(110.15) (110.15) (43.89) (43.89) (15.67) (15.67)
AMF Net Capital Expenditures 272.62 282.06 141.66 153.86 57.80 75.86
Operating Expenditures 147.85 168.94 106.08 133.33 150.35 190.67
SCT Costs 420.47 451.00 247.74 287.20 208.16 266.53
UCT / RIM Costs 420.47 451.00 247.74 287.20 208.16 266.53
SCT Ratio 1.43 1.00 1.00 0.67 0.69 0.32
UCT / RIM Ratio 1.11 0.75 0.79 0.51 0.63 0.28
Est. Monthly Customer Impact (per meter)21 $ 2.37 $ 2.49 $ 3.04 $ 3.41 $ 9.25 $ 11.58
AMF Benefit and Cost Components The following charts shown in Figures 4-12 and 4-13 highlight the major benefit and cost components for Option A – Full Deployment across a 20-year time horizon.
Figure 4-12 National Grid AMF Business Case Benefits Components for Option A
21 The Estimated Monthly Customer Impact is a value calculated to provide an understanding of how the basic service fee of Upstate New York customers would reflect National Grid’s AMF investment. The dollar per meter value derived for each Option and corresponding Scenario does not reflect a customer class allocation. The value is calculated by (1) present valuing an estimated revenue requirement stream calculated for the 20 year business case timeline, (2) translating the NPV revenue requirement into a levelized annual payment, and (3) distributing the levelized revenue requirement to the in-scope electric and gas meter count on a monthly basis. The initial revenue requirement stream is calculated in accordance with PSC Case No. 12-G-0202 / E-0201, Rate Year Ending March 31, 2016 methodologies.
timeline, (2) translating the NPV revenue requirement into a levelized annual payment, and (3) distributing the levelized revenue requirement to the in-scope electric and gas meter count on a monthly basis. The initial revenue requirement stream is calculated in accordance with PSC Case No. 12-G-0202 / E-0201, Rate Year Ending March 31, 2016 methodologies.
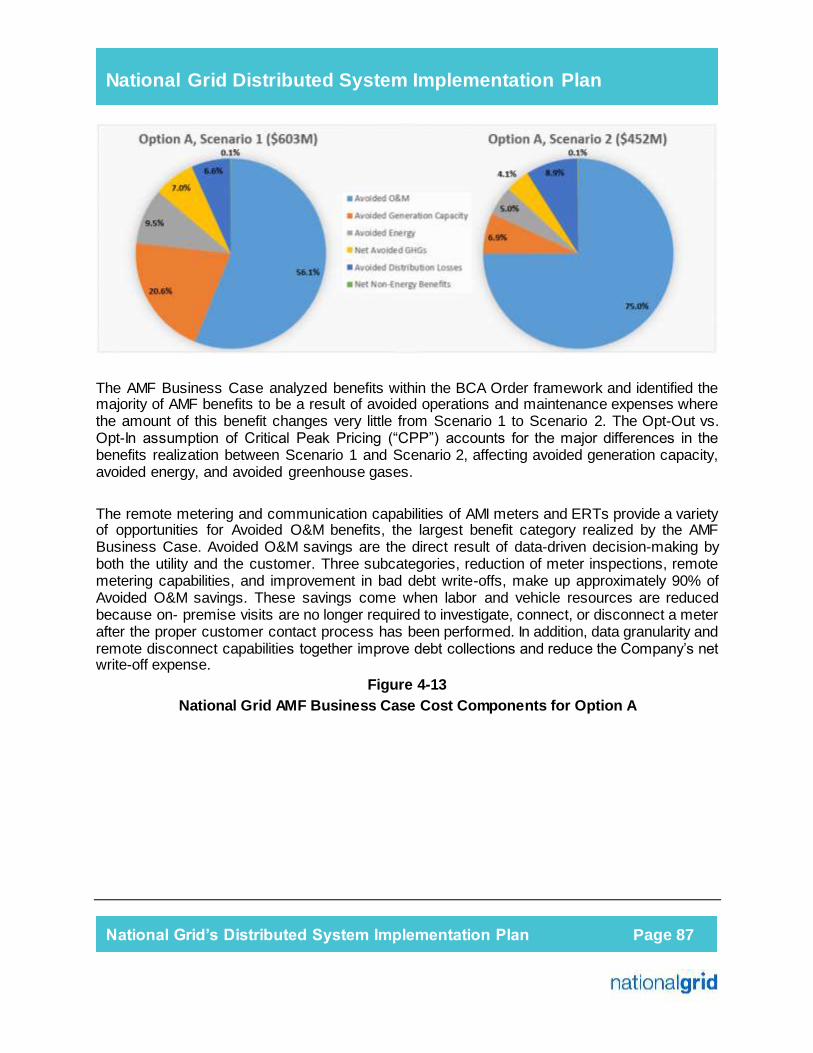
National Grid Distributed System Implementation Plan
National Grid’s Distributed System Implementation Plan Page 87
The AMF Business Case analyzed benefits within the BCA Order framework and identified the majority of AMF benefits to be a result of avoided operations and maintenance expenses where the amount of this benefit changes very little from Scenario 1 to Scenario 2. The Opt-Out vs. Opt-In assumption of Critical Peak Pricing (“CPP”) accounts for the major differences in the benefits realization between Scenario 1 and Scenario 2, affecting avoided generation capacity, avoided energy, and avoided greenhouse gases.
The remote metering and communication capabilities of AMI meters and ERTs provide a variety of opportunities for Avoided O&M benefits, the largest benefit category realized by the AMF Business Case. Avoided O&M savings are the direct result of data-driven decision-making by both the utility and the customer. Three subcategories, reduction of meter inspections, remote metering capabilities, and improvement in bad debt write-offs, make up approximately 90% of Avoided O&M savings. These savings come when labor and vehicle resources are reduced because on- premise visits are no longer required to investigate, connect, or disconnect a meter after the proper customer contact process has been performed. In addition, data granularity and remote disconnect capabilities together improve debt collections and reduce the Company’s net write-off expense.
Figure 4-13 National Grid AMF Business Case Cost Components for Option A

National Grid Distributed System Implementation Plan
National Grid’s Distributed System Implementation Plan Page 88
In both scenarios, meter and ERT equipment and installation together account for approximately half of the AMF cost. The software, labor, and hosting and analytics capabilities housed within the Information Technology and Systems Integration costs portion contribute over one-quarter of the total cost.
Proposed Direction
The BCA Order’s Societal Cost Test (“SCT”), Utility Cost Test (“UCT”) and Rate Impact Measure (“RIM”) support the pursuit of Option A, Full AMF Deployment across National Grid’s electric and gas service territory. The number and large expense for systems that allow meters and ERTs to be brought online falls marginally as the scope of deployment decreases from Option A to C. As such Option A, Full Deployment, spreads consistently large costs out over the largest group of customers, making it the most economical on a per meter basis. Beyond the economics, there are a number of intangible benefits associated with AMF, the most important being the ability to put National Grid on the path toward achieving REV goals and positioning National Grid to help usher in an energy future for the benefit of its customers and the State of New York.
AMF Deployment Timeline and Investment Plan The proposed AMF implementation timeline is six years beginning in fiscal year 2019.
Figure 4-14 National Grid AMF Implementation Schedule

National Grid Distributed System Implementation Plan
National Grid’s Distributed System Implementation Plan Page 89
The start date for the project reflects the time required to engage stakeholders following the initial DSIP filing to further develop and refine the plan, and to achieve regulatory approval either separately or as part of a general rate case. The anticipated timing of the filing of National Grid’s next electric and gas general rate case is within the first half of 2017. Year 1 of AMF implementation includes detailed technology design and the formal procurement process, followed by the installation of back office systems and communication infrastructure. This will be followed by a five-year meter and ERT installation program.
The estimated schedule of investment is shown in Table 4-3 below. Table 4-3
National Grid AMF Estimated Schedule of Investments
(Investments are estimated in 2006 dollars)
2016 2017 2018 2019 2020 5 year 10 year 2016 2017 2018 2019 2020 5 yr 10 yr
Project FY16-17 FY17-18 FY18-19 FY19-20 FY20-215-yr Total Yr 5-10
10-yr Total FY16-17 FY17-18 FY18-19 FY19-20 FY20-21
5-yr Total Yr 5-10
10-yr Total
Advanced Metering Functionality 26.8 88.9 93.2 208.8 253.1 461.9 0.0 0.0 11.2 18.1 18.0 47.2 62.9 110.1
Capex ($m) Operation & Maintenance ($m)
National Grid Distributed System Implementation Plan
National Grid’s Distributed System Implementation Plan Page 90
Grid Modernization c.
This section addresses a number of infrastructure and systems enhancements that will facilitate the effective and efficient operation of the distribution system in high DER penetration environment. Investments of this nature were initially identified in the Company’s “Electric Transmission and Distribution New York 15-Year Plan” filed in 2014 in advance of the REV Proceeding, and they have not yet been included in an approved rate plan. As such, the Company will consider the projects proposed herein when it develops its next rate plan filing.
Current State of System
Through its operation of the T&D system National Grid is responsible for the safe and reliable, supply of electricity service to customers and the safety of the public and Company personnel.
The tasks associated with operating the electric system include continuous situational awareness, preparation for adverse events, maintenance of a significant interconnected asset base, coordination with bulk power operations, and support of market operations.
Standard operating practice is to maintain system components within prescribed limits for voltage, thermal loading, and frequency using typical control actions such as switching capacitors, generator dispatch of real and reactive power, and system configuration changes. Under normal operating conditions there are minimal customer interruptions resulting from system faults, whatever the cause. Operational planning associated with normal operations considers the risks associated with unexpected contingencies to understand how best to respond to system contingencies and return to normal operations as quickly as possible.
If operational limits are exceeded, grid operations is responsible to make informed decisions to return the system to a normal state as soon as possible using all available system information and established processes and procedures. Tools such as EMS, SCADA, OMS, etc., provide control center operators with the situational awareness to assist in establishing mitigating actions on a priority basis and a means to remotely operate system devices and appropriately dispatch field resources.
During emergency conditions operators review and communicate situational awareness, isolate trouble areas, direct the restoration of customer service, and perform analysis and reporting as required.
Near-term effects of DER Penetration:
As the proliferation of DERs increases, the challenges associated with T&D system operation become more complex. To safely and reliably control the system, operators must be aware of the location, capabilities, and performance of all assets integrated with the electric system, regardless of ownership, to assess their respective impacts on overall system performance.

National Grid Distributed System Implementation Plan
National Grid’s Distributed System Implementation Plan Page 91
The current operational topology has not yet had a significant impact on operations; however, the impact is an increasing concern as the volume of interconnection applications grows substantially. National Grid anticipates that the management of resources and load will become increasingly complex for grid operations.
A consequence of increased penetration of DERs is the need to provide capacity within our current energy management tools and operational data historians to facilitate operations and analysis. For these reasons, the Company proposes state-of-the-art tools, such as a modern DMS with advanced applications, to provide the tools to manage the distribution system in the near future. The integration of DER into real-time grid operations will require significant enhancements in telecommunications and information management systems to coordinate the interactions of large volumes of interdependent devices within a complex system that must continuously remain balanced and stable.
IT/OT Convergence i.Service Bus Architecture & Comprehensive Integration Services National Grid utilizes a large number of information systems, however they are not as integrated as necessary to support the DSP functionalities. Many of these systems do not move data in real time, which inherently limits their capabilities. Integrating distributed energy resources requires greater reporting, predictive analytics, insights and management of the distributed network and the management of a large volume, variety and velocity data. In the current architecture environment, data is made available through the development of batch interfaces, for ingestion into other applications. Communications to devices are usually done from device to application. The development of specific interfaces for applications is resource intensive. Data is not available for real-time use. To address these challenges and enable the Company to deliver services in a more effective manner, National Grid is moving toward a service-based IS architecture to support the data requirements of applications in real time from disparate sources. An architectural framework that can deliver the “right data, right service, anytime” is a fundamental enabler of the DSP.
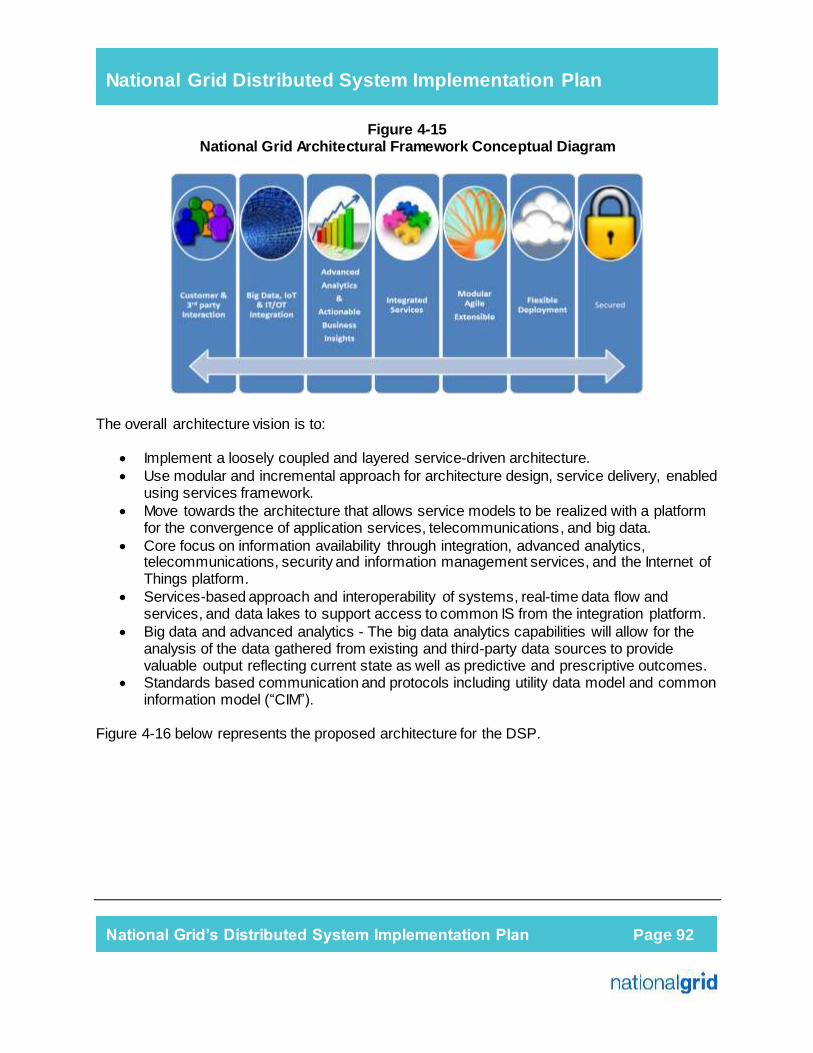
National Grid Distributed System Implementation Plan
National Grid’s Distributed System Implementation Plan Page 92
Figure 4-15 National Grid Architectural Framework Conceptual Diagram
The overall architecture vision is to:
Implement a loosely coupled and layered service-driven architecture. Use modular and incremental approach for architecture design, service delivery, enabled
using services framework. Move towards the architecture that allows service models to be realized with a platform
for the convergence of application services, telecommunications, and big data. Core focus on information availability through integration, advanced analytics,
telecommunications, security and information management services, and the Internet of Things platform.
Services-based approach and interoperability of systems, real-time data flow and services, and data lakes to support access to common IS from the integration platform.
Big data and advanced analytics - The big data analytics capabilities will allow for the analysis of the data gathered from existing and third-party data sources to provide valuable output reflecting current state as well as predictive and prescriptive outcomes.
Standards based communication and protocols including utility data model and common information model (“CIM”).
Figure 4-16 below represents the proposed architecture for the DSP.

National Grid Distributed System Implementation Plan
National Grid’s Distributed System Implementation Plan Page 93
Figure 4-16 National Grid Proposed DSP Architecture
Key elements of the aforementioned architecture vision include: Comprehensive Integration Services (“CIS”) – This is the enterprise integration platform that is required to move data between systems, automate and manage business processes, transfer files between entities and enable real-time and batch integration. National Grid will develop these capabilities to enable real-time integration, automation and orchestration of business processes enterprise-wide for existing legacy systems, and implementation of new systems building on process and systems efficiencies. API Framework/API Management – This has been a key part and an enabler of the National Grid Enterprise Integration Strategy. Open APIs represent the leading edge of a new business model, providing innovative ways for National Grid to expand brand value and routes to market,

National Grid Distributed System Implementation Plan
National Grid’s Distributed System Implementation Plan Page 94
and create new value chains for intellectual property. API management is the process of publishing, promoting and overseeing APIs in a secure, scalable environment.
The API framework allows data sharing and the management of services through multiple channels—web, mobile, social, and others resulting in more consumable services.
Field Communications Message Service Bus – This provides the capabilities for the data exchange of solutions deployed in the field. The functionality may include business rules, protocol translation, CIM requirements, monitoring, and analytics. This integration service can provide a unified message bus across OT systems deployed at the edge of the grid and IT systems deployed in a data center or cloud. It also integrates easily with an existing enterprise messaging systems or Enterprise Service Bus.
Information Management Capabilities It is essential that the information management capabilities are designed with certain key data principles in mind.
Proposed National Grid Enterprise Information Management technology tools and capabilities are organized into several interrelated domains:

National Grid Distributed System Implementation Plan
National Grid’s Distributed System Implementation Plan Page 95
Figure 4-17 National Grid Enterprise Informaiton Management Technology Tools and Capabilities
Data governance and data quality solutions are required to support this initial DSIP. GIS data is an area that is foundational and needs to be complete and accurate to enable the complex models and control systems envisioned to operate the modern grid. Cloud Hosting, Data Lakes & Advanced Analytics The Company’s Compute and Storage strategy is based on a hybrid sourcing vision. Currently National Grid contracts with an external service provider for computation and data storage and utilizes various cloud providers for agility and cost effectiveness where appropriate.
Benefits of cloud computing:
• Reduce provisioning time of computing resources through administered governance;
• Quicker delivery of applications and business capabilities;
• Dynamically scale/flex computing resources to meet business demand; and • Provide infrastructure at competitive costs.

National Grid Distributed System Implementation Plan
National Grid’s Distributed System Implementation Plan Page 96
Service Management
National Grid would support the interface of service management with the DSIP in the following ways:
• Create proper governance; • Implement service level agreements (“SLA’s”) with supplier(s) to assure expectations are
met; • Initially, interface directly with the DSP vendor for IT Service Management (“ITSM”), but
future is to integrate into National Grid’s ServiceNow application; and • Manage computing resources deployed in a cloud environment. Interface between
business community and cloud provider’s Service Management group.
IT/OT Network Architecture and Upgrade The Company anticipates using its existing private network infrastructure (both private fiber and multiprotocol label switching (“MPLS”) WAN) to support the REV objectives. To this end, National Grid will continue to use the environment of multiple virtual networks. Currently the Company has networks implemented to support corporate functions, substations RTU/SCADA, off-site data center connectivity, and Company facility interconnections. What’s more, the Company is in the process of building out new virtual networks for a recloser communications project being deployed across its service territory. National Grid anticipates further development of virtual networks for meter data, field mobility, and DSP requirements.
In order to handle the significant increase in the amount of data that will traverse these networks, the Company anticipates increasing the bandwidth at a number of main corporate facilities. The Company also anticipates a significant increase in the amount of data from meters with its proposed AMF rollout, an increase in the number and type of distribution monitoring and control devices, and increases in substation data. This will require enhancements at the Company’s three control center locations and their back-up facilities, its data centers, security demilitarized zone (“DMZ”), and possibly other large facilities. The Company plans to design and implement the bandwidth and security upgrades over a three-year period. As systems go live, bandwidth utilization at all facilities will be monitored and further upgrades implemented as required. Distributed System Platform - IS System Connectivity The development of the DSP for data exchange among utilities and third parties will require significant planning and design. The Company envisions this platform as a highly resilient, data consolidation and presentment platform that will allow third parties the access to the data they need to support the REV goals. There is significant work that needs to be done in this area, as the Company believes this platform will require secure, redundant, high-capacity connectivity between the utilities and the data center(s) hosting the system. During the process of further defining the data requirements, the design of the supporting network and services will also be refined.

National Grid Distributed System Implementation Plan
National Grid’s Distributed System Implementation Plan Page 97
Telecommunications and Networking ii. Communication between devices in the field and Company systems is essential to the overall success of the DSIP. The main drivers for the telecommunications network plan are:
Provide a reliable, cost-effective two-way communications capability to end devices including meters, grid automation controls, field sensors, substations, field force and customer HAN devices;
Ensure the network meets all technical requirements for the devices and systems deployed, including availability, latency, bandwidth, security, and other factors;
Provide the operations groups the capability to manage, maintain, and troubleshoot the communications network; and
Enable new grid technologies as they become available and future-proof the network as much as possible.
National Grid currently utilizes a number of different communications technologies for the collection of meter and T&D system data. In addition, the Company gathers substation information through a variety of means. The existing communication networks that support these functions are suitable for the data requirements at the current time; however they require upgrade and expansion to support the integrated grid envisioned in REV. Some of the communications systems currently utilized by the Company are highlighted below:
Automated Meter Reading - National Grid currently utilizes AMR. Meters are read using a drive-by 900 MHz wireless system. Sensus Telemetric/Cellular Communications - Sensus Telemetric is used for the majority of reclosers that are communications enabled. This system uses a public 2G and 3G cellular network. Due to the wireless carrier’s decision to terminate 2G services and the transition of 3G frequencies to 4G cellular networks. S&C Utilinet and SpeedNet – The Company operates several S&C Intelliteam distribution automation schemes in its territory. They utilize 900 MHz unlicensed frequencies and are highly dependent on a clear line of sight path which may require a large number of repeaters to achieve the necessary communications reliability Private 900 MHZ point to multipoint radio – The Company operates a private 900MHz licensed and unlicensed radio network in Western New York for monitoring and control of select switches.

National Grid Distributed System Implementation Plan
National Grid’s Distributed System Implementation Plan Page 98
Distributed Generation Communications - The Company utilizes a combination of private and public communications services for metering, protective relaying and control of select DG assets. Technologies include the use of leased digital and analog services, cellular communications, private wireless, microwave systems, and direct fiber connectivity. The decision on the appropriate communications technology for each location and application is based on a number of factors including cost, proximity to existing network connectivity, and local terrain. Private Communications – National Grid maintains a SONET fiber communications system that ties a number of larger transmission substations and corporate facilities together. In addition to fiber optic systems, the Company operates a large number of licensed and unlicensed microwave links that provide backhaul connectivity for multiple operational and corporate systems. Public Communications – National Grid uses several public service providers to provide communication to substations. Public communications to our substations are typically carried over copper cables with high voltage protection or via fiber optic cables. Security DMZ – All communications between National Grid and third parties are required to pass through a security perimeter or DMZ. Prior to interfacing with the National Grid network, the data must traverse the appropriate DMZ security zones and be inspected by National Grid security services to ensure the integrity of the National Grid network.
Telecommunications Upgrades and Expansion Required for REV Data Gathering As previously discussed, the Company proposed to deploy and AMF system across its service territory. The AMI system will be designed to accommodate multiple types of communications solutions, but the primary communications is expected to be a 900 MHz unlicensed mesh topology. In areas where it is cost prohibitive to build a reliable mesh, 4G cellular communications will be utilized direct to the meter. Cellular communication to meters will be the design in the proposed Clifton Park demonstration project. AMI collectors will backhaul their data utilizing 4G cellular networks or Company private networks when located at substations or other Company facilities.
A potential benefit of deploying an AMI system is that the communications infrastructure can support other field devices besides meters. Transformer monitors, feeder monitors, capacitor banks, and street lighting controls can all be carried over the AMI system.
Distributed Energy Resource Communications - The Company proposes to continue to use private and public communications services for metering, protective relaying, and SCADA for select DER. For all new installations, National Grid will complete a technical evaluation to
National Grid Distributed System Implementation Plan
National Grid’s Distributed System Implementation Plan Page 99
determine the most appropriate and cost-effective method of establishing communications on a project-specific basis. Options for connectivity continue to be leased digital and analog services, cellular communications, private wireless, microwave systems, and direct fiber connectivity for these installations. Substation Communications and Expansion of Backhaul Network The Company proposes an expansion of its fiber network to reach more substations and expand the reach of its backhaul network. In addition to the data gathered from substations, expansion of the network creates more data backhaul points for meter collectors and potential private wireless base stations. This will reduce the need for cellular service plans and the reliance on a public network for critical communications.
One means of expanding the Company’s fiber network is by embedding communication fibers into the shield wires installed with major transmission projects. As part of new transmission line, re-conductoring or shield wire replacement projects, the Company reviews the costs and benefits of including Optical Ground Wire (“OPGW”) and, where appropriate, implements this solution to expand the reach of the corporate fiber network. In locations where expansion of the private network is cost prohibitive, the Company proposes connectivity utilizing one of the current public communications alternatives, which include, MPLS service, 4G cellular networks, satellite service, and digital leased circuits.
Integrated Network Operations Center
Overview
As the communications infrastructure expands and grid operations becomes more dependent on integrated operation with DER, an INOC will be necessary to maintain the reliability of the communications network. The purpose of the INOC is to actively monitor, manage and maintain the meter and telecommunications infrastructure and services necessary to integrate the distributed telecommunications. The INOC will provide a single point of contact for support and operations through a cross functional set of personnel, processes and technologies.
As depicted in the graphic below, the INOC provides a central location from which network administrators manage, control, troubleshoot, and monitor one or more networks. The overall function is to maintain optimal network performance across a variety of platforms, mediums, networks, network segments, and communications channels. An INOC is similar to a dispatch control center used for managing the electric grid, and the network operation center for all IS-related items that support the grid. The INOC would monitor the health and behavior of all aspects of the telecommunications network using an operation support system and have the capabilities to provide a first level of incident response. Monitoring, provisioning, and configuring is accomplished by computer-based tools that create alarms when anomalous activity, performance issues, or system failures are detected.

National Grid Distributed System Implementation Plan
National Grid’s Distributed System Implementation Plan Page 100
Figure 4-18 Diagram of an INOC
Control Center Enhancements iii.
National Grid’s current EMS consists of a SCADA system, network applications, and an operator training simulator. The Company commissioned the applications in February 2015. Substation and line data is acquired from the T&D substation RTUs and pole-top reclosers for logical diagrammatic display to operators. In addition to status, the system also provides monitoring, control and alarming for system limits pertaining to voltage, and real and reactive power as well as other system parameters. The network model consists of a state estimator and security analysis (contingency analysis) applications. The model mainly consists of transmission (345, 230 and 115 KV) data and devices and has limited capabilities at the sub-transmission and distribution levels.

National Grid Distributed System Implementation Plan
National Grid’s Distributed System Implementation Plan Page 101
In addition, the EMS contains an application to port operational data to a historian, OSI’s Plant Information Historian (“PI Historian”) system. The PI system records approximately 195,000 pieces of information at various frequencies, with the majority being recorded every few seconds. The distribution system parameters are currently monitored by a T&D SCADA system. This system includes substation RTUs, which provide data from remote device, over fiber, and phone lines to a control center for use in the SCADA system. The SCADA system also obtains information from pole-top reclosers for presentation and control to the control system operator. The following table shows the current usage against current size which is indicative of the ability of future growth. APPLICATION PARAMETER SIZING CURRENT
USAGE PERCENT CAPACITY
EMS SCADA Status Points 250,000 204,000 82% EMS SCADA Analog Points 160,000 83,000 52% PI Historian Tags 200,000 195,000 98%
Efficient control center operations is critical to the success of advanced distribution automation schemes, including CVR/VVO, FLISR, and the dispatch of DG is dependent on the deployment of other elements of the REV Proceeding. Automation will depend on a reliable communications infrastructure, DSCADA, ADMS, and an effective data historian. Historically, the Control Center’s core mission was to ensure electric system reliability and safety through monitoring, operational actions and outage response. Increasingly, distribution grid operators are playing a role in optimizing the distribution system. Emerging control center functions include proactively monitoring circuits with improved visibility from intelligent electric devices, balancing multiple sources of load or generation, and dynamically predicting outages to improve response time. As the optimization role expands, control center operators will require sophisticated central management systems to monitor and coordinate remote distribution automation servers/devices, communicate to the edge of the distribution grid, and collect data from grid edge devices. Expected changes in the role of Distribution Control Centers are summarized in Table 4-4 below.
Table 4-4 The Changing Role of the Distribution Control Center
Today – Keep the Lights On Tomorrow – Optimize the Platform
Paper schematic maps and manual cross- As-operated network model in easy-to-use

National Grid Distributed System Implementation Plan
National Grid’s Distributed System Implementation Plan Page 102
reference to GIS as needed geographic and schematic electronic interface
SCADA communicating to substations with no or limited quantity feeder devices Extensive SCADA “outside the substation”
Very limited visibility into feeder electrical state, including DER
Monitoring, state estimation, and load flow provide improved visibility, including DER
Single real power source to manage Multiple real power sources to manage
Manually-created switch orders Switch orders generated automatically or with assistance from ADMS
Outage prediction most often based on customer interruption calls
Outage prediction enhanced with AMF and SCADA devices
Limited historic electrical data that requires significant effort to bring value
Easily-obtained historic data on electrical state and system configuration easily accessed by planners, engineering and design, and operations
Minimal short-term load forecasting for use in planned switching
More extensive short-term load and distribution generation forecasting in distribution operations
Limited advanced applications to assist in maximizing performance
Advanced DMS applications to improve Volt/VAR control, reliability, and equipment utilization
Deliver power Enable customer electric power choices and markets
The evolution of control center responsibilities will require increased system monitoring and control to support the integration of DER and meet increasing expectations relative to reliability and safety. To that end, the Company and its affiliates, with assistance from Accenture, developed a control center technology roadmap to develop the capabilities required in the future. This roadmap describes a five-year distribution Control Center Operations (“CCO”) technology roadmap for National Grid and its affiliates, considering the expected changes associated with operations in a DSP environment. The roadmap describes the drivers for change in distribution operations, key considerations in defining the distribution CCO technology roadmap, evaluates a key decision centered on DSCADA/DMS/OMS, and summarizes a high-level five-year investment plan. The estimated costs presented in the investment schedule in

National Grid Distributed System Implementation Plan
National Grid’s Distributed System Implementation Plan Page 103
this section reflect the anticipated share of costs to be allocated to the Company’s UNY operations. Error! Reference source not found.4-19, the “As-Is” state of the distribution CCO systems, and Error! Reference source not found.4-20, the “To-Be” depict the distribution CCO systems and illustrate the changes that are forecasted to occur. Major changes include:
Deployment of a new DSCADA system, created in part by a split in the existing SCADA/EMS into a TSCADA and DSCADA.
Short-term deployment of RTU-based Advanced Distribution Applications (ADA) in the control centers
Deployment of DMS Applications utilizing the as-operated distribution network model Retirement of legacy serial RTU’s, and retirement of the Sensus recloser
communications platform and SCADA Xchange Deployment of AMF, and eventually DERMS, to provide connections of customer and
aggregator data to distribution operations Connections between higher quantities of weather stations that will provide more
granular data, both geographic and temporal, for more accurate load and DER forecasts that will be required.
Figure 4-19 National Grid’s “As-Is” Distribution Operations Platform

National Grid Distributed System Implementation Plan
National Grid’s Distributed System Implementation Plan Page 104
Figure 4-20 National Grid’s "To-Be" Distribution Operations Platform
Figure 4-21 depicts the five-year timeline to progress these initiatives. The technologies shown are industry mature with the exception of the DERMS , where both the drivers and the technology are undergoing definition. It should be noted that major dependencies among the projects on the timeline exist.
“GIS and Data Readiness”, as well as the continued roll-out of feeder devices and communications, will drive the ability to go into production with DMS Applications.
Small scale application of DMS will be tested early in the plan to develop appropriate lessons learned for wide scale deployment. The DMS Applications testing will inform the Data Readiness project, by providing a clearer definition of gaps in the data required to run the DMS Applications Integration of AMF to DMS/OMS will be dependent upon AMF roll-out. Due to resource constraints, the EMS refresh is scheduled to occur after DSCADA deployment and testing.
Integration of AMF to DMS/OMS is dependent upon AMF roll-out.
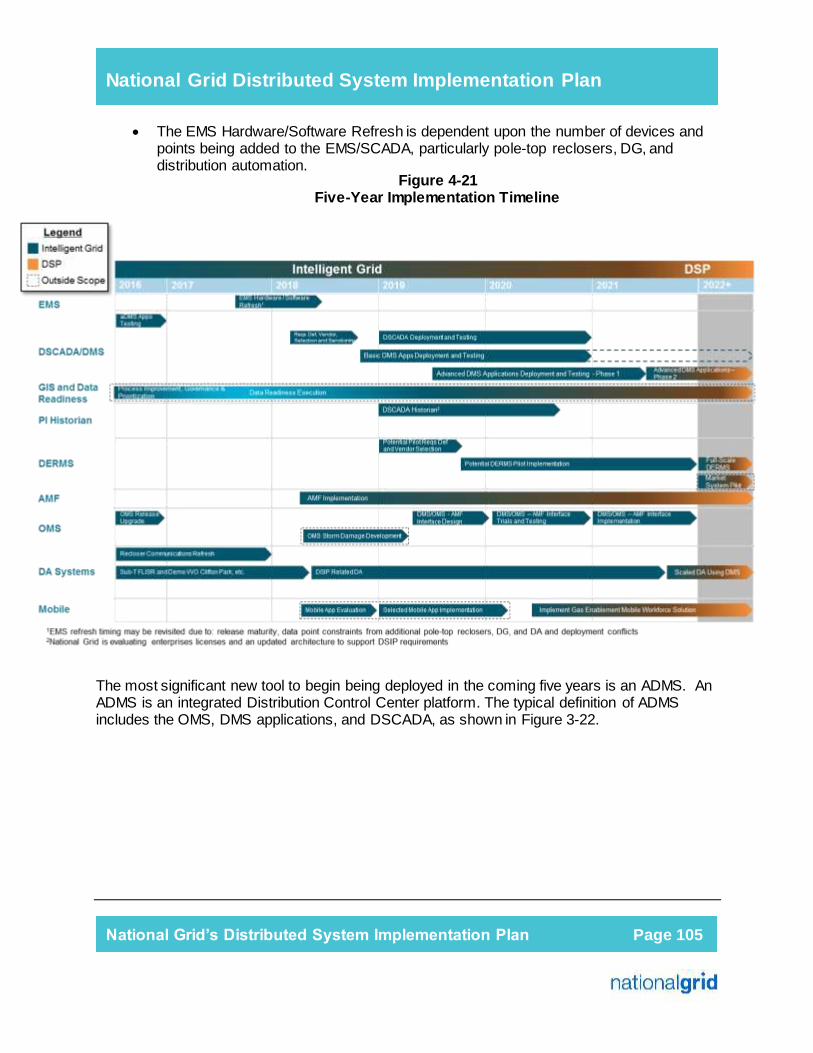
National Grid Distributed System Implementation Plan
National Grid’s Distributed System Implementation Plan Page 105
The EMS Hardware/Software Refresh is dependent upon the number of devices and points being added to the EMS/SCADA, particularly pole-top reclosers, DG, and distribution automation.
Figure 4-21 Five-Year Implementation Timeline
The most significant new tool to begin being deployed in the coming five years is an ADMS. An ADMS is an integrated Distribution Control Center platform. The typical definition of ADMS includes the OMS, DMS applications, and DSCADA, as shown in Figure 3-22.

National Grid Distributed System Implementation Plan
National Grid’s Distributed System Implementation Plan Page 106
Figure 3-22
Overview of ADMS Functionality
ADMS is a platform that enables distribution operations to manage the modern distribution grid by providing improved visibility and control, operational flexibility, system efficiency, and automated outage response. DMS Applications and DSCADA, when well-integrated with the OMS, enable operators to monitor, control and predict operations, operate the distribution network, and proactively and safely guide operators during storms and outage-related restoration activities.
The primary role of the DSCADA is to collect data from intelligent electronic devices on the distribution network for use by the DMS, and transmit commands, settings, and other operational functions from the ADMS to the intelligent electronic devices. The DMS consists of engineering-focused applications, called the DMS applications that can either assist in the operations of the distribution network, or automatically monitor and control devices on the distribution network. DMS applications utilize the as-operated network model in the DMS, as well as monitoring data from Intelligent Electronic Devices (“IED’s”) throughout the distribution network and substations.
National Grid and its affiliates operate distribution systems in multiple jurisdictions and this roadmap is intended to be applicable across all service territories. The costs reflected in this plan assume synergies with a similar deployment in the CNew England service area.

National Grid Distributed System Implementation Plan
National Grid’s Distributed System Implementation Plan Page 107
The table below identifies the expected benefits of deploying an ADMS.
Integrated Data Management iv.
Modern system and network operation and planning activities require deep insight into the physical, operating, and electrical characteristics of the Company’s assets. Where utilities have traditionally operated with a more local focus, centralized operations and decision making has been a trend that has required operators, like National Grid, to invest in making data available via electronic repositories and implement processes to support key aspects of the business. The result of this was a step change in the utility space which presented significant change management and implementation challenges.
With data now largely centralized, enhanced insight into the data itself has shed light on a number of areas where the Company could improve by empowering personnel to make better educated, cost-effective decisions. In addition, automation of system modeling tools have highlighted gaps in data. Grid modernization will increase the demand for accurate and timely data.
In order to address these data needs the Company needs to carefully consider how people, processes, and systems rely on, and are enabled by, data. All aspects of the data need to be considered not only to address known areas for improvement but also to enable a formal approach to data quality assurance and control. In support of many of the initiatives previously discussed including integrated system planning, and grid operations utilizing and ADMS, the Company must undertake an integrated data management project focused primarily on data within the GIS system.
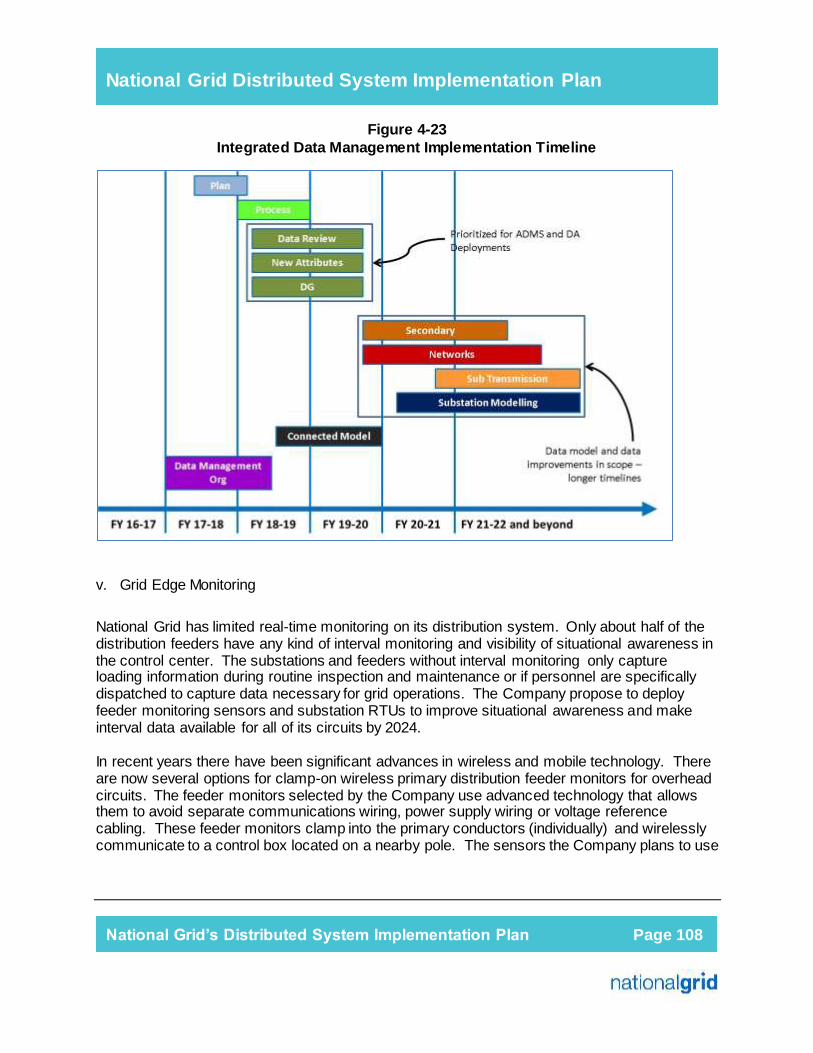
National Grid Distributed System Implementation Plan
National Grid’s Distributed System Implementation Plan Page 108
Figure 4-23 Integrated Data Management Implementation Timeline
Grid Edge Monitoring v.
National Grid has limited real-time monitoring on its distribution system. Only about half of the distribution feeders have any kind of interval monitoring and visibility of situational awareness in the control center. The substations and feeders without interval monitoring only capture loading information during routine inspection and maintenance or if personnel are specifically dispatched to capture data necessary for grid operations. The Company propose to deploy feeder monitoring sensors and substation RTUs to improve situational awareness and make interval data available for all of its circuits by 2024. In recent years there have been significant advances in wireless and mobile technology. There are now several options for clamp-on wireless primary distribution feeder monitors for overhead circuits. The feeder monitors selected by the Company use advanced technology that allows them to avoid separate communications wiring, power supply wiring or voltage reference cabling. These feeder monitors clamp into the primary conductors (individually) and wirelessly communicate to a control box located on a nearby pole. The sensors the Company plans to use

National Grid Distributed System Implementation Plan
National Grid’s Distributed System Implementation Plan Page 109
will monitor voltage, power, and harmonic content and will be integrated with the SCADA system and PI Historian. The Company has developed priority lists for further RTU expansion and feeder sensors with input from its System Operations and Distribution Planning departments.
The information will allow for more data to be utilized for determining DG impact studies, ADA schemes, and CVR/VVO schemes.
Advanced Distribution Automation vi.
Advanced Distribution Automation
Traditional distribution design utilizes several types of sectionalizing devices. For radial distribution feeders, there is typically a three-phase breaker at the substation, which acts as the primary disconnecting means for the whole feeder. From the substation, there are three-phase reclosers and switches which are used to sectionalize the mainline of the feeder. Three-phase reclosers are designed to autonomously interrupt fault currents and segment the feeder following a contingency event, which switches are in place for manual circuit reconfiguration and restoration purposes only.
Reclosers can be integrated with SCADA to allow control center operators to monitor and control the devices remotely. However, autonomous recloser operation without communications is common. For lateral taps off the mainline, where three-phase voltage is not run, fuses and manual switches are used for sectionalization, both of which are manual operating devices with no advanced control. Lastly, both the laterals and mainline of the feeder may interface to other nearby feeders through manual switches that are normally left open, called feeder ties. While protection and sectionalization devices extend from the three-phase substation all the way to single phase cut off fuses feeding secondary transformers, centralized control of sectionalization is traditionally only done at a mainline (three phase) level today.
In the event of a fault, traditionally implemented distribution systems will attempt to isolate the faulted section of the feeder through the Fuse, Recloser, or breaker protection capabilities. Once isolated, crews will manually find the fault, isolate, and then reconfigure the circuit using switches and feeder ties (In addition to reclosers and fuses). This ‘human in the loop’ method of service restoration necessarily takes time to implement, which results in additional customers interrupted and customer minutes interrupted (“CMI”) over a system where these devices were automated.
Distribution Automation, specifically FLISR, is a system which and incorporates communications and automated control of key switching devices in the autonomous operation of the service restoration. This greatly impacts the resulting customers interrupted and CMI metrics from a fault event that occurs within the zone of protection. As part of a FLISR system, manual switches and feeder ties may be upgraded to automated switches at three phase mainline

National Grid Distributed System Implementation Plan
National Grid’s Distributed System Implementation Plan Page 110
locations. Remote monitoring and control also will be provided to manual override of automated control schemes. In addition, these devices will integrate operational performance data to an ADMS/DSCADA system.
National Grid proposes to deploy equipment and control systems designed to accomplish FLISR. FLISR reduces the impact of interruptions on the distribution system through the installation of automated switches along the main line and tie points of a feeder. This allows a fault to be automatically isolated into a sub-section of the feeder and the uninvolved sub-sections to be resupplied via automated tie points, significantly reducing both impacted customers and outage durations.
The deployment of this technology will be targeted to a relatively small number of feeders each year. As the ADMS rolls out, it will be able to support FLISR on an expanded number of feeders.
There are many anticipated benefits of ADA that align with REV objectives. These include:
National Grid anticipates an average reduction of main line CMI on the selected individual feeders targeted for the ADA deployment. Projected reductions for each feeder is based on historical analysis of past performance in the Company’s service territory and anticipated reductions from historic interruptions for similar fault events; and
The additional operational data collected by the automated switches will support the improved management of the distribution system, assisting in demand optimization, DER integration, and operational efficiency.
Volt-VAR Optimization vii.
Traditional distribution planning utilizes capacitors and voltage regulators, installed along distribution feeders with autonomous controls to maintain system voltages within allowable limits. The Company has historically managed voltage primarily with the use of Load Tap Changing transformers and distribution line regulators more so than with capacitors. When installed, regulators are typically programmed to maintain a specific voltage at its location as specified by a distribution planning engineer. Capacitors, when installed, are usually fixed, and manually switched in and out of the circuit seasonally or as needed.
VVO/CVR is a distribution level program where voltage control devices are intelligently controlled in a coordinated manner to optimize the distribution system performance. This program is designed to minimize system losses, while simultaneously reducing demand and energy use. A comprehensive CVR/VVO program would add a layer of coordination, via communication and control, to optimize the use of these devices to respond to system dynamics in real-time. As part of the program, distribution circuits would be studied by engineering for optimal placement of any additional capacitors and regulators required to achieve an optimal voltage profile. Communications would then be layered on the additional and existing devices, with a centralized server managing the coordinated control.

National Grid Distributed System Implementation Plan
National Grid’s Distributed System Implementation Plan Page 111
VVO refers to a process where the reactive power flows of the distribution system are minimized to reduce system losses and present a unity power factor to transmission. As mentioned above, station capacitors are typically used as the primary reactive power compensation device, while regulators are used to directly modify the voltage past the regulation device.
CVR refers to a process where the utility deliberately delivers voltage to customers at the lower end of the allowable range. This is done with the intent to reduce a customer’s demand and energy usage by modifying the way customer-owned devices consume energy. The effect of lowering voltage to achieve this is well known in the industry. CVR has been required in New York since 1984 and has limited the upper range of allowable voltage the Company can deliver to customers. It is unclear how this will impact the magnitude of benefits that can be delivered by any modern CVR control system. To gather more information, the Company plans to deploy a VVO/CVR system as part of its proposed Clifton Park Demand Reduction REV demonstration project. The Company anticipates positive results from this demonstration project, with additional VVO/CVR proposed beginning in 2018 on a small scale, ramping up later as benefits are confirmed with initial deployments.
Within the horizon of this DSIP the deployment of VVO/CVR will be on a limited number of targeted feeders. As the DSCADA/ADMS system becomes available, it is expected that VVO will be managed centrally and the rate of deployment of the VVO/CVR scheme can increase.
There are several anticipated benefits of a CVR/VVO deployment, which will make progress on the objectives. These benefits include:
The implementation of a CVR/VVO system is expected to result in improved feeder power factor, flatter voltage profiles, reduced feeder losses, reduced peak demand and reduced energy consumption by customers. The estimated reduction in energy consumption is expected to be approximately 3% but will vary from feeder to feeder based on the individual characteristics.
The additional operational data collected by automated capacitors and regulators, and available to control center operators, should support the improved management of the distribution system which will assist in the integration of distributed resources. Actively maintaining proper voltage via intelligent centralized control will also improve feeder voltage performance, keeping the voltage flat and low, allowing for higher DER penetration.
The deployment of CVR/VVO schemes will integrate improved system awareness into the daily operations and planning processes.
A benefit cost analysis in alignment with the BCA tool was completed on the VVO/CVR deployments envisioned in the first five years of deployment. Benefits considered in the analysis were reduced system losses, capacity reduction and energy reduction. Within the horizon of this DSIP, this program will be deployed on select feeders and deployments are expected to continue over many years. A VVO deployment is also proposed as part of the proposed Clifton Park demonstration project and will provide valuable insight to the initial deployment scheduled to begin in 2018.

National Grid Distributed System Implementation Plan
National Grid’s Distributed System Implementation Plan Page 112
Table 5-2 VVO/CVR BCA Ratios
As shown in the table above, the SCT ratio is beneficial while the UTC ratio is below 1.0. The measurement and verification of early deployments will help refine project designs, the BCA evaluations and prioritization of targeted deployments.
Field Force Mobility viii.
Utilities are becoming increasingly reliant on the data quality and timeliness to inform operational decisions. The networks of the future will require a higher level of accuracy and completeness to fulfill their potential. To effectively manage a distributed network it is increasingly important to communicate digital information to our field forces. As part of its grid modernization efforts the Company plans on tablet style devices and develop five mobility applications:
Map Access & Feedback – Deployment of an application to provide access to the latest operating maps from the field - vastly reducing our reliance on paper processes. Additional functionality would give field personnel an electronic feedback tool to report discrepancies between our map records and real world observations for expedited correction.
Electronic As Built Data Collection – Deployment of an application to capture asset information when facilities are constructed, replaced or retired.
Time Entry – Deployment of an application to allow field personnel to electronically capture their time worked.

National Grid Distributed System Implementation Plan
National Grid’s Distributed System Implementation Plan Page 113
Electronic Standards & EOPs (Electric Operating Procedures)– Deployment of an application to provide access to the latest standards and procedures.
Full Electronic Asset Inspections – Applications to capture asset inspection data electronically.
The devices would be deployed to Overhead, Underground, PTO, and Complex Construction crews. Additionally, three of the applications above would be available on multiple operating systems so they could be made available to already deployed field devices used by Substation and CMS.
Investment plan for Grid Modernization:
(investments are estimated in 2016 dollars) Several of the above estimates can be impacted by the potential for cost sharing among National Grid and its affiliates as similar grid modernization efforts are planned in other states. The investments in the table above are considered incremental to the Company’s existing CIP which aligns with its current general rate case approved and 2013 and an extension to that plan approved in 2016 that extend through the Company’s FY17-18 fiscal year. The Company believes strongly that in order to manage the increasingly complex systems that will result from the integration of significant DER, for both Grid Operations and Market Operations, these investments in Grid Modernization are necessary.
IT/OT Convergence
Systems Architecture and Information Management Information System Infrastructure
o Cybersecurity and Privacy
2016 2017 2018 2019 2020 5 year 10 year 2016 2017 2018 2019 2020 5 yr 10 yr
Project FY16-17 FY17-18 FY18-19 FY19-20 FY20-215-yr Total Yr 5-10
10-yr Total FY16-17 FY17-18 FY18-19 FY19-20 FY20-21
5-yr Total Yr 5-10
10-yr Total
Service Bus Archetecture 6.6 8.4 1.7 16.7 8.4 25.1 0.0 0.0 0.6 0.8 1.0 2.4 3.7 6.0
Cloud Hosting and Data Lake 0.5 1.5 2.0 0.0 2.0 0.0 0.0 1.6 2.5 3.7 7.8 10.9 18.7
DSCADA 0.9 4.3 4.3 9.5 0.0 9.5 0.0 0.0 0.0 4.1 4.2 8.3 13.1 21.4
PI Historian 0.9 0.1 1.0 0.0 1.0 0.0 0.0 0.1 1.0 1.0 2.1 2.0 4.0
ABB - ADMS 0.2 3.4 5.2 5.2 14.0 1.5 17.0 0.0 0.0 0.0 4.1 4.2 8.3 13.1 21.4
OMS - DMS 0.1 0.1 0.3 0.5 1.0 0.8 2.6 0.0 0.0 0.0
INOC 0.0 1.3 2.6 3.8 1.3 5.1 0.0 0.0 1.3 1.3 1.3 3.8 6.4 10.2
Telecommunications 0.8 9.8 9.6 20.2 19.2 39.4 0.0 0.0 2.0 4.2 4.4 10.5 22.6 33.1
EMS/RTU Installs 6.50 6.50 6.18 19.2 2.3 21.5 0.0 0.0 0.2 0.2 0.2 0.6 0.0 0.6
Feeder Monitor Sensors 3.00 3.00 3.00 9.0 6.0 15.0 0.0 0.0 0.1 0.1 0.1 0.2 0.4 0.6
Field Automation - VVO/CVR 3.6 6.6 7.7 17.9 85.0 102.9 0.0 0.0 0.2 0.4 0.6 1.2 7.8 9.0
Field Automation - DA Reliability 3.6 9.7 10.7 24.0 74.0 98.0 0.0 0.0 0.1 0.2 0.4 0.7 4.9 5.6
Data Quality - Improvement/Enhancement 11.1 20.7 14.0 45.8 2.6 48.4 0.0 0.0 7.6 8.7 5.9 22.2 9.4 31.6
Field Force Enablement 0.5 3.7 1.4 5.5 2.7 8.2 0.0 0.0 1.3 1.9 2.3 5.4 11.2 16.6
Training 0.0 0.0 0.0 0.0 0.0 2.0 2.0 2.0 6.0 4.0 10.0
Capex ($m) Operation & Maintenance ($m)
National Grid Distributed System Implementation Plan
National Grid’s Distributed System Implementation Plan Page 114
Cybersecurity and Privacy d.
Threats to the cybersecurity of critical infrastructures emanate from a wide spectrum of potential perpetrators: international espionage and sabotage, terrorism, domestic militants, malevolent ‘hacktivists’ or even disaffected insiders. The cyber threat to the electric grid is one that is real, particularly as threats continue to evolve and become more sophisticated. The question at hand is only a matter of when, not if, that organizations will experience attempts to infiltrate US critical systems and infrastructure. The threat only continues to grow as the industry moves to upgrade its systems to more advanced and automated technologies, with the convergence of Information and operational technologies becoming inevitable.
A reliable and secure grid is necessary to safely enable both the customer-facing and grid-facing aspects of modernizing the grid, including automated demand response, providing customers a myriad of options to manage their energy costs through technology-enabled programs, limiting outages with a self-healing resilient energy network, the integration of distributed energy resources, and other strategically important functions.
Cybersecurity and privacy provisions are important considerations for any REV initiative in order to maintain a reliable and secure electric and gas infrastructure and ensuring the protection needed for the confidentiality and integrity of the digital overlay. Mere compliance with cybersecurity standards will not assure security; cybersecurity provisions must evolve as technology advances and as threats to grid security inevitably multiply and diversify. The changing requirements of REV on utilities’ operational technology will differ from ‘traditional’ information security and will require separate architectures to support and address challenges posed by the new threat landscape.
As part of the REV Proceeding, the Company proposes a risk-based cybersecurity framework across people, processes, and technology that recognizes that the electric grid is changing from a relatively closed system, to a complex, highly interconnected environment. This framework is guided by and is aligned to the Joint Utilities’ cyber and privacy framework. The framework will:
Set forth a set of policies and standards to ensure National Grid is working to a common set of security objectives;
Provide architecturally secure cybersecurity and privacy services for an efficient, easy to use and agile way to deliver the required capabilities to manage cyber risks;
Look to build and enhance capability – reuse existing security capabilities where possible, and where capability is absent, invest;
Deliver the necessary capability to protect and ensure the resiliency of critical National Grid systems and infrastructure; and
Address privacy throughout the lifecycle for sensitive customer and system data, as well as information sharing practices.

National Grid Distributed System Implementation Plan
National Grid’s Distributed System Implementation Plan Page 115
As part of the framework, cybersecurity and privacy provisions in the form of multiple security services to support each functional area will be implemented. These security services will be the cornerstone for any cybersecurity or privacy related component of the overall solution. This will include a program to provide regular privacy training and ongoing awareness communications and activities to all workers and third parties who have access to customer information within the distributed system platform.
The implementation plan is a phased roll out of security services, based on business priority and cyber risk appetite being established throughout the five-year period. A formal review will occur every two years to ensure the proposed cybersecurity and privacy services evolve along with the ever changing threats that are monitored continuously to ensure National Grid systems, people, and information, remain protected and secured. The anticipated costs to develop and maintain appropriate privacy and security across the integrated environments envisioned are shown in the table below.
Cybersecurity Strategy and Vision
The National Grid Cybersecurity REV Framework provides a common language for understanding and managing cybersecurity risk to help identify and prioritize actions for reducing cybersecurity risk. It is a tool for aligning policy, business, and technological approaches to managing that risk. The Framework provides for National Grid to align its cybersecurity activities with its business requirements, risk tolerances, and resources. This framework is guided by and is aligned to the NYS Joint Utilities Cybersecurity and Privacy framework that has been established by the Joint Utilities Cybersecurity Working Group.
The cyber framework consists of the following components:
Information Security Management System (“ISMS”): This component provides for a set of policies and standards that aim to focus all the security services towards a common set of cybersecurity and privacy objectives to meet the vision that is set; the objective of the ISMS is to provide requirements for establishing, implementing, maintaining and continuously improving the cybersecurity capabilities.
Risk Methodology: This component provides for a standardized approach to identifying assets, vulnerabilities, threats and their impacts to provide a good understanding of the cyber risk to National Grid;
Security Design Principles: The foundation of the security architecture is a set of design principles that act as a high-level set of security assumptions, leveraged to promote an adaptable architecture, and to provide the tools and infrastructure necessary to deliver a competitive advantage to our business and its customers. These principles govern the overall framework that is established.

National Grid Distributed System Implementation Plan
National Grid’s Distributed System Implementation Plan Page 116
Privacy management: This component provides for a privacy framework that is embedded within the overall strategic vision to protect the Company’s private information as well as that of its customers in compliance with all legal and regulatory requirements;
Cybersecurity Capabilities to Manage Risk: This component provides the necessary capabilities within the cybersecurity and privacy activities at their highest level to mitigate the threat exposure. These capabilities are “Identify, Protect, Detect, Respond, and Recover,” and they will enable National Grid to make risk-based management decisions in addressing the threats that it faces; and
Vendor Assurance: This component provides a method to assess the level of compliance of third-party service providers to National Grid including information security requirements to identify alignment and to provide recommendations for risk mitigation.
Integrated Data Privacy Framework Overview
National Grid has adopted an integrated approach to data privacy based on people, process and technology perspectives to classify privacy and information management components into four primary categories:
Key compliance program elements and culture; Key data handling and identity theft risks; Consumer privacy awareness and rights; and Security safeguards.
The supporting data privacy program utilizes a cross-functional framework that seeks to address not only legal and regulatory requirements but also the ever changing landscape of privacy and identity theft vulnerabilities that can result in information and data compromise. The framework for compliance, privacy, security and identity theft prevention (see below) incorporates accountabilities, policies, procedures and business practices, and a fabric of technical and operational controls to manage data privacy related risks more effectively.
People (Based on Federal Sentencing Guidelines, Seven Principles for an Effective Compliance Program & US Federal, State and Global Breach Notification Laws / Guidance
Process (Based on Fact Act, FTC Destruction Rule, Identity Theft Incidents / Enforcements, GLBA, GAPP, OECD, EU Data Protection Principles)
Technology (Based on GLBA Safeguards Rule, HIPPA Security Rule/ HITECH Rule, Global Data Protection Laws, NIST, Standards for Encryption)
Compliance & Culture Key Data Handling & Identity Theft Risks
Consumer Privacy Awareness & Rights
Security Safeguards
– Policies & procedures – Governance & accountability – Due diligence – Communication, training &
awareness
– Collecting/ Processing more information than necessary
– Social Security Number/sensitive information masking
– Call centers, social engineering &
– Notice – Choice – Access & change of
address – Redress complaints
– Conduct risk assessments – Access controls – Physical security – Encryption in storage & transit – Dual controls/ segregation of
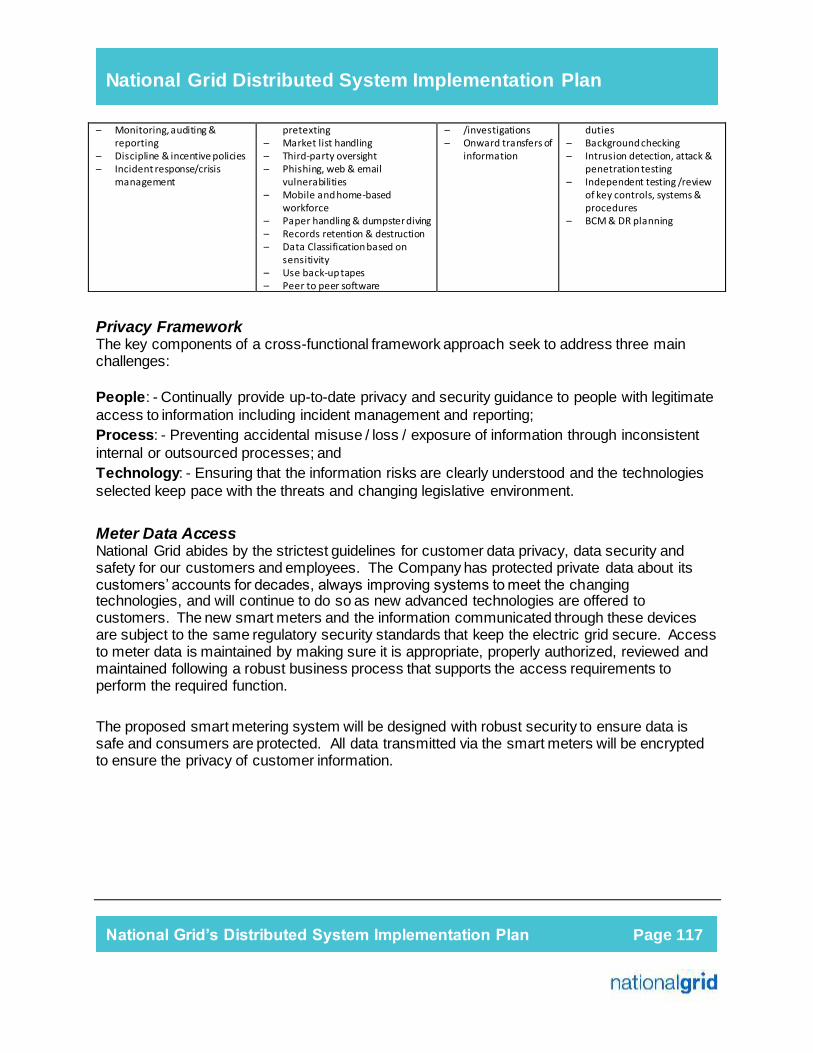
National Grid Distributed System Implementation Plan
National Grid’s Distributed System Implementation Plan Page 117
Privacy Framework The key components of a cross-functional framework approach seek to address three main challenges: People: - Continually provide up-to-date privacy and security guidance to people with legitimate access to information including incident management and reporting; Process: - Preventing accidental misuse / loss / exposure of information through inconsistent internal or outsourced processes; and Technology: - Ensuring that the information risks are clearly understood and the technologies selected keep pace with the threats and changing legislative environment.
Meter Data Access National Grid abides by the strictest guidelines for customer data privacy, data security and safety for our customers and employees. The Company has protected private data about its customers’ accounts for decades, always improving systems to meet the changing technologies, and will continue to do so as new advanced technologies are offered to customers. The new smart meters and the information communicated through these devices are subject to the same regulatory security standards that keep the electric grid secure. Access to meter data is maintained by making sure it is appropriate, properly authorized, reviewed and maintained following a robust business process that supports the access requirements to perform the required function.
The proposed smart metering system will be designed with robust security to ensure data is safe and consumers are protected. All data transmitted via the smart meters will be encrypted to ensure the privacy of customer information.
– Monitoring, auditing & reporting
– Discipline & incentive policies – Incident response/crisis
management
pretexting – Market list handling – Third-party oversight – Phishing, web & email
vulnerabilities – Mobile and home-based
workforce – Paper handling & dumpster diving – Records retention & destruction – Data Classification based on
sensitivity – Use back-up tapes – Peer to peer software
– /investigations – Onward transfers of
information
duties – Background checking – Intrusion detection, attack &
penetration testing – Independent testing /review
of key controls, systems & procedures
– BCM & DR planning

National Grid Distributed System Implementation Plan
National Grid’s Distributed System Implementation Plan Page 118
Implementation Plan
The implementation plan for cybersecurity and privacy services will span over a five-year period, with the inclusion of a formal recurring review every two years to account for the ever evolving threat landscape and to address any new potential areas of risk as a result of the modernization of the electric grid to meet REV and DSIP objectives. This initial DSIP is subject to business priority and other grid investments, ensuring cybersecurity provisions are embedded in all investments and upgrades made to National Grid infrastructure. All of the following security services are critical to the REV efforts of the company and essential to maintaining the security posture of the organization. Below is the proposed plan to support the various priorities and provide for a scalable approach to the implementation of the security services.
The various security lifecycle stages include four phases: initiation / development, implementation / assessment, operations / maintenance, and disposal / refresh. Each phase includes a minimum set of security tasks needed to effectively incorporate security in the system development process. Note that phases may continue to be repeated through a system’s life prior to disposal.
1. Cost Schedule
(Investment estimates are in 2016 dollars)
2016 2017 2018 2019 2020 5 year 10 year 2016 2017 2018 2019 2020 5 yr 10 yr
Project FY16-17 FY17-18 FY18-19 FY19-20 FY20-215-yr Total Yr 5-10
10-yr Total FY16-17 FY17-18 FY18-19 FY19-20 FY20-21
5-yr Total Yr 5-10
10-yr Total
Cyber Security 0.4 11.6 21.7 15.5 49.0 17.6 66.6 0.1 0.0 3.1 5.2 6.2 14.7 33.3 48.0
Capex ($m) Operation & Maintenance ($m)

National Grid Distributed System Implementation Plan
National Grid’s Distributed System Implementation Plan Page 119
The cost estimates above are based on industry research, best practices and built on the investments and costs National Grid spends today for cybersecurity and privacy services. Every effort has been made to capture a reasonable end-state of the Company’s REV business objectives and any risk mitigation efforts required. For services that are required and do not yet exist at National Grid, costs were based on industry/market research and best practices, such as EPRI guidance and the Department of Education and NIST’s “Information Technology Security Cost Estimate Guide, specifically for cybersecurity and privacy hardware, software, and services. The proposed costs are subject to change as detailed requirements are identified.

National Grid Distributed System Implementation Plan
Benefits Page 120
Benefits 5.
BCA Handbook a.
The Company’s BCA Handbook is included as Appendix 1. The Commission directed the utilities to develop and file BCA Handbooks by June 30, 2016 as a requirement of the BCA Order. The BCA Handbook is to be filed contemporaneously with the Company’s initial DSIP
filing and with each subsequent DSIP, scheduled to be filed every other year.
The purpose of the BCA Handbook is to provide a common methodology for calculating benefits and costs of projects and investments. The BCA Order requires that benefit-cost analysis be applied to the following four categories of utility expenditure:22
1. Investments in DSP capabilities;
2. Procurement of DE through competitive selection (i.e., procurement of NWAs);
3. Procurement of DER through tariffs; and
4. EE programs.
The BCA Handbook provides methods and assumptions that may be used to inform the BCA for each of these four types of expenditure.
The BCA Order also includes a list of principles for the BCA Framework that are reflected in the BCA Handbook.23 BCA should:
1. Be based on transparent assumptions and methodologies; list all benefits and costs including those that are localized and more granular.
2. Avoid combining or conflating different benefits and costs.
3. Assess portfolios rather than individual measures or investments (allowing for consideration of potential synergies and economies among measures).
4. Address the full lifetime of the investment while reflecting sensitivities on key assumptions.
5. Compare benefits and costs to traditional alternatives instead of valuing them in isolation.
The BCA Handbook provides the methodologies to be used by the Company for calculating the benefits and costs included in the three cost-effectiveness tests, as identified and defined in Appendix C of the BCA Order. Values and sources for input assumptions that are common across projects and applications are also provided, as well as example characterizations of DER
22
BCA Order, pp. 1-2. 23
BCA Order, p. 2.
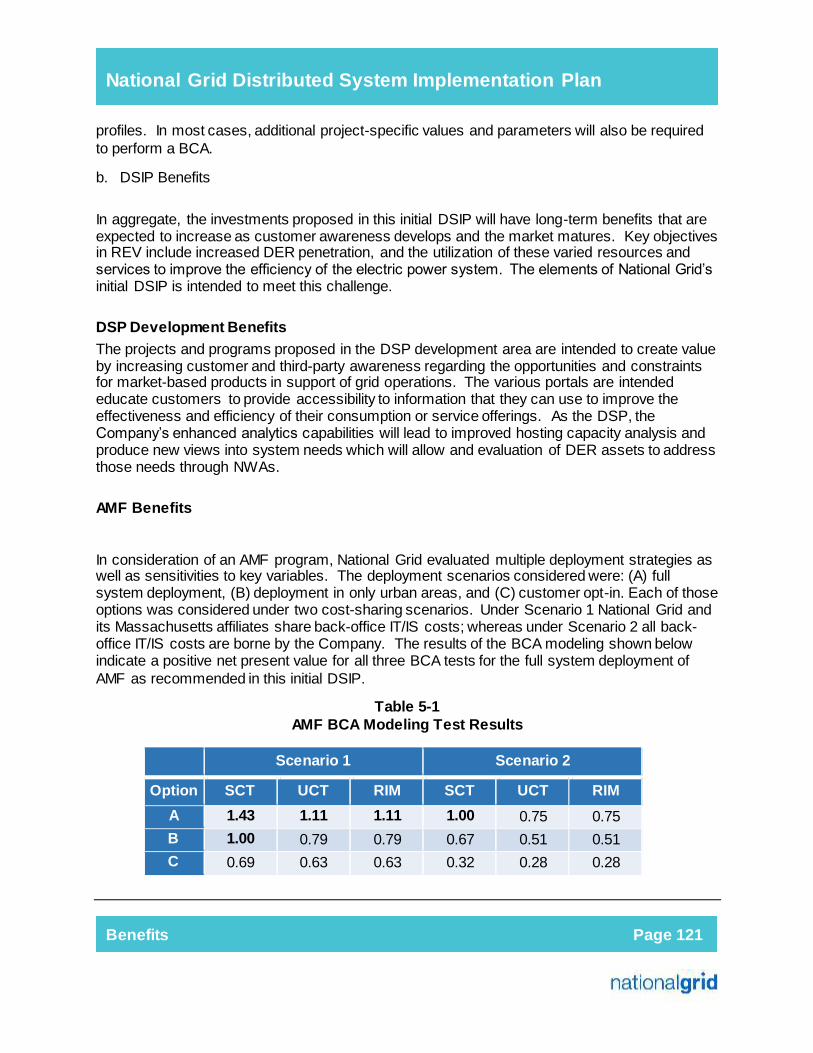
National Grid Distributed System Implementation Plan
Benefits Page 121
profiles. In most cases, additional project-specific values and parameters will also be required to perform a BCA.
DSIP Benefits b.
In aggregate, the investments proposed in this initial DSIP will have long-term benefits that are expected to increase as customer awareness develops and the market matures. Key objectives in REV include increased DER penetration, and the utilization of these varied resources and services to improve the efficiency of the electric power system. The elements of National Grid’s initial DSIP is intended to meet this challenge.
DSP Development Benefits The projects and programs proposed in the DSP development area are intended to create value by increasing customer and third-party awareness regarding the opportunities and constraints for market-based products in support of grid operations. The various portals are intended educate customers to provide accessibility to information that they can use to improve the effectiveness and efficiency of their consumption or service offerings. As the DSP, the Company’s enhanced analytics capabilities will lead to improved hosting capacity analysis and produce new views into system needs which will allow and evaluation of DER assets to address those needs through NWAs.
AMF Benefits
In consideration of an AMF program, National Grid evaluated multiple deployment strategies as well as sensitivities to key variables. The deployment scenarios considered were: (A) full system deployment, (B) deployment in only urban areas, and (C) customer opt-in. Each of those options was considered under two cost-sharing scenarios. Under Scenario 1 National Grid and its Massachusetts affiliates share back-office IT/IS costs; whereas under Scenario 2 all back-office IT/IS costs are borne by the Company. The results of the BCA modeling shown below indicate a positive net present value for all three BCA tests for the full system deployment of AMF as recommended in this initial DSIP.
Table 5-1 AMF BCA Modeling Test Results
Scenario 1 Scenario 2
Option SCT UCT RIM SCT UCT RIM A 1.43 1.11 1.11 1.00 0.75 0.75
B 1.00 0.79 0.79 0.67 0.51 0.51
C 0.69 0.63 0.63 0.32 0.28 0.28

National Grid Distributed System Implementation Plan
Benefits Page 122
A detailed report of the full AMF assessment is provided as an attachment to the DSIP.
Grid Modernization
The grid modernization investments can deliver quantifiable and intangible benefits to National Grid and its customers. Benefits are expected in the following core areas: increasing operational visibility, improving reliability, enhancing grid performance, augmenting core operations in servicing the grid, and improving internal operating effectiveness.
The BCA tool was also used to assess the benefit-cost ratios for the VVO deployments proposed in the next five years. Within the horizon of this initial DSIP, this program will be deployed on select feeders and deployments are expected to continue over many years. A VVO deployment is also proposed as part of the Clifton Park demonstration project and will provide valuable insight to the initial deployment that is scheduled to begin in 2018.
Table 5-2 VVO/CVR BCA Ratios
As shown in the table above, the SCT ratio is beneficial while the UTC ratio is below 1.0. The measurement and verification of early deployments will help refine project designs, the BCA evaluations and prioritization of targeted deployments.
Cybersecurity and Privacy
By integrating various existing networks, systems, and touch-points that are capable of exchanging information seamlessly, the older proprietary and often manual methods of securing utility services will give way to more open, automated and networked solutions. The benefits of this increased connectivity depends upon robust security services and implementations that are necessary to minimize disruption of vital services and provide increased reliability, manageability, customer services, and survivability of the energy network. Recognizing the unique challenges outlined within REV is imperative to deploying a secure and reliable solution.

National Grid Distributed System Implementation Plan
Benefits Page 123
The key benefit of incorporating cybersecurity and privacy provisions will ensure the reliability of the State’s energy services, with information integrity built in and the confidentiality of customer information maintained within all business processes, thereby addressing any privacy concerns.

National Grid Distributed System Implementation Plan
Investment Planning Page 124
Investment Planning 6.
All of the investments presented are incremental to approved plans and will be considered in the development of the Company’s next rate filing. It is the intention of the Company to seek cost recovery for spending associated with the DSIP in its next rate case filing which is anticipated to be filed with the Commission within the first half of 2017.
As the investment considerations discussed in this DSIP are integrated into the next rate filing, various cost mitigation approaches will be considered including the efficient alignment of work and resources, the extension of implementation horizon for various programs, and the potential offset of other previously planned work, if appropriate. In the Company’s next rate filing, the investments outlined in each of the focus areas in Chapter 4; DSP Development, Advanced Metering Functionality, Grid Modernization and Cybersecurity and Privacy, must converge with the infrastructure investments outlined in the existing CIP with due consideration of overall value for safe, reliable and affordable service.
Capital Planning Process
Capital budgets are developed though a ten-month capital planning process that begins in June and continues through various stages of development and approval in advance of the Company’s fiscal year that begins on April 1st and ends on March 31st. The capital plan is managed by the Investment Planning organization with inputs from Asset Management, Long Term Planning, Resource Management, Operations and Finance. The resulting plan is approved by the Company’s New York jurisdictional president and the National Grid Board.
The capital plan provides a roadmap to resolve priority issues on the electrical grid and for resource planning to deliver projects. Progress against the current year plan is managed monthly through a series of Portfolio Calibration Meetings in which key internal stakeholders review project status, forecast remaining fiscal year spending, and make any necessary adjustments to the plan. In January of each year the Company submits a Five Year CIP in compliance with the Commission’s Order issued August 15, 2008 in Case 06-M-0878.24
24
Case 06-M-0878 – Joint Petition of National Grid PLC and KeySpan Corporation for Approval of Stock Acquisitio n and Other Regulatory Authorizations (National Grid’s Transmission and Distribution Capital Investment Plan and
Condition of Physical Elements of Transmission and Distribution System report) , Order Concerning Transmission and Distribution Capital Investment Plan (issued and effective August 15, 2008).
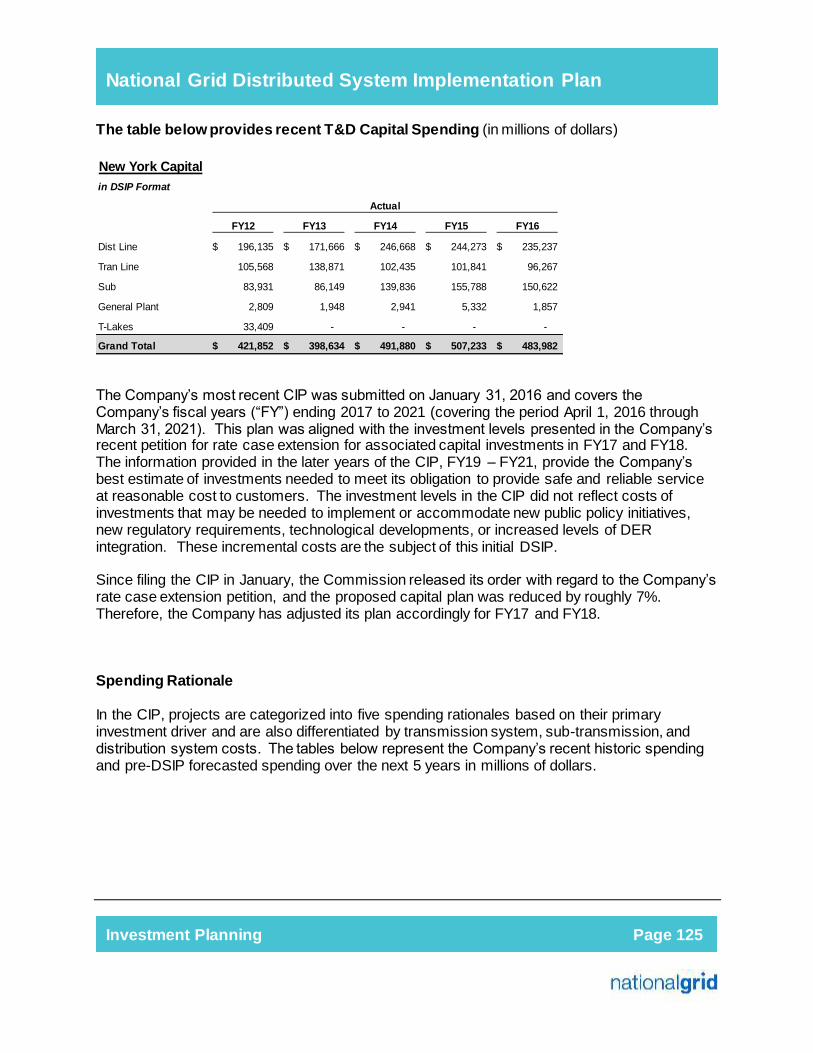
National Grid Distributed System Implementation Plan
Investment Planning Page 125
The table below provides recent T&D Capital Spending (in millions of dollars)
The Company’s most recent CIP was submitted on January 31, 2016 and covers the Company’s fiscal years (“FY”) ending 2017 to 2021 (covering the period April 1, 2016 through March 31, 2021). This plan was aligned with the investment levels presented in the Company’s recent petition for rate case extension for associated capital investments in FY17 and FY18. The information provided in the later years of the CIP, FY19 – FY21, provide the Company’s best estimate of investments needed to meet its obligation to provide safe and reliable service at reasonable cost to customers. The investment levels in the CIP did not reflect costs of investments that may be needed to implement or accommodate new public policy initiatives, new regulatory requirements, technological developments, or increased levels of DER integration. These incremental costs are the subject of this initial DSIP. Since filing the CIP in January, the Commission released its order with regard to the Company’s rate case extension petition, and the proposed capital plan was reduced by roughly 7%. Therefore, the Company has adjusted its plan accordingly for FY17 and FY18. Spending Rationale In the CIP, projects are categorized into five spending rationales based on their primary investment driver and are also differentiated by transmission system, sub-transmission, and distribution system costs. The tables below represent the Company’s recent historic spending and pre-DSIP forecasted spending over the next 5 years in millions of dollars.
New York Capitalin DSIP Format
FY12 FY13 FY14 FY15 FY16
Dist Line 196,135$ 171,666$ 246,668$ 244,273$ 235,237$
Tran Line 105,568 138,871 102,435 101,841 96,267
Sub 83,931 86,149 139,836 155,788 150,622
General Plant 2,809 1,948 2,941 5,332 1,857
T-Lakes 33,409 - - - -
Grand Total 421,852$ 398,634$ 491,880$ 507,233$ 483,982$
Actual

National Grid Distributed System Implementation Plan
Investment Planning Page 126
System FY17 FY18 FY19 FY20 FY21
Transmission 177,605
190,165
206,000
210,000
214,200
Sub-Transmission 20,993
22,101
47,949
36,954
42,333
Distribution 263,002
261,655
283,051
302,045
303,667
Grand Total 461,600
473,921
537,000
548,999
560,200
Investment by Spending Rationale The Company classifies capital projects into five spending rationales based on their primary investment driver: (A) Customer Requests/Public Requirements; (B) Damage/Failure; (C) System Capacity and Performance; (D) Asset Condition; and (E) Non-infrastructure. Customer Requests/Public Requirements Customer Requests/Public Requirements projects are required to respond to, or comply with external requests or mandated obligations. These items include new business residential, new business commercial, outdoor lighting, third party attachments, land rights and public requirements including municipal, and distributed generation interconnections. Damage/Failure Damage/Failure projects are required to replace failed or damaged equipment and to restore the electric system to its original configuration and capability following equipment damage or failure. Damage may be caused by storms, vehicle accidents, vandalism or other unplanned events. The Damage/Failure spending rationale is typically nondiscretionary in terms of scope and timing. The Damage/Failure budget may also include the cost of purchasing strategic spares to respond to equipment failures. System Capacity and Performance
New York Capitalin DSIP Format
FY12 FY13 FY14 FY15 FY16 FY17 FY18 FY19 FY20 FY21
Dist Line 196,135$ 171,666$ 246,668$ 244,273$ 235,237$ 214,791$ 211,436$ 238,603$ 242,631$ 232,938$
Tran Line 105,568 138,871 102,435 101,841 96,267 108,244 109,135 155,008 149,319 152,584
Sub 83,931 86,149 139,836 155,788 150,622 135,802 150,527 140,241 153,855 171,418
General Plant/Other 2,809 1,948 2,941 5,332 1,857 2,763 2,823 3,148 3,194 3,260
T-Lakes 33,409 - - - - - - - - -
Grand Total 421,852$ 398,634$ 491,880$ 507,233$ 483,982$ 461,600$ 473,921$ 537,000$ 548,999$ 560,200$
Actual Petition Level Plan Level

National Grid Distributed System Implementation Plan
Investment Planning Page 127
System Capacity and Performance projects are required to ensure the electric network has sufficient capacity to meet the growing and/or shifting demands of our customers, as well as changes in the generation landscape. Projects in this category are intended to reduce degradation of equipment service lives due to thermal stress and to provide appropriate degrees of system configuration flexibility to limit adverse reliability impacts of large contingencies. In addition to accommodating load growth, the expenditures in this category are used to install new equipment such as capacitor banks to maintain power quality, and also include investments to adhere to NERC, NPCC, and similar standards. Asset Condition Asset Condition projects are required to reduce the likelihood and consequences of failures of transmission and distribution assets. Replacing system elements such as overhead lines, underground cable or substation equipment are examples of such projects. Investments in the Asset Condition category reflect the targeted replacement of assets based on condition rather than wholesale replacement based on “end of useful life” criteria, especially for transmission line refurbishment projects. Non-Infrastructure Non-Infrastructure projects are ones that do not fit into one of the foregoing categories, but which are necessary to run the electric system. Examples in this rationale include substation physical security, radio system upgrades and the purchase of test equipment. Investment by spending rationale for fiscal years FY17 to FY21 is provided in the Table below.
Spending Rationale FY17 FY18 FY19 FY20 FY21
Asset Condition 152,413
185,131
253,857
268,951
277,253
Customer Requests/Public Requirements
112,745
107,707
108,919
110,225
113,216
Damage/Failure 64,519
59,813
62,205
65,697
60,747
Non-Infrastructure 4,718
8,070
10,014
10,995
9,219
System Capacity & Performance 127,205
113,199
102,004
93,131
99,765
Grand Total 461,600
473,921
537,000
548,999
560,200
DER in the current planning process is considered in a similar fashion as to traditional customer requests for new electric service. In general the net capital budget impact of DER interconnections has been assumed to be small due to the contribution in aid of construction associated with interconnection projects. However the resource impacts to implement these projects are substantial and can impact the delivery of other work in the capital plan and are considered during the development of work plans.

National Grid Distributed System Implementation Plan
Investment Planning Page 128
In reviewing the potential investments identified in the DSIP, the Company is considering an adjustment to its spending rationale classifications to better align with future drivers. Provided below is a comparison table of existing and possible future categories.
Existing Future Asset Condition Asset Condition
Customer Requests/Public Requirements Customer Requests/Public Requirements Non-Infrastructure Non-Infrastructure Damage Failure Damage Failure
System Capacity and Performance System Capacity Reliability DER Electric System Access Communications/ Control Systems and IT/OT
To enhance consideration of NWAs, the Company is considering separate spending rationales for projects driven by system load versus reliability performance. Currently all such projects are included in the System Capacity and Performance spending rationale. Going forward, projects such as capacity additions and voltage or power factor improvement would be classified as System Capacity while projects such as recloser installations or efforts to address poor performing circuits would be classified as Reliability. This additional segmentation will assist identification of potential NWA opportunities. From this DSIP, the VVO would be classified as System Capacity and the grid monitoring and advanced distribution automation would be classified as Reliability. The majority of the grid modernization investments identified in this plan would be classified in the Communications, Control Systems and IT/OT spending rationale. In the past these would have been classified in the Non-Infrastructure category. The DER Electric System Access rationale is being considered to capture work where the Company will be supporting items such as NWA, microgrids, storage, DG interconnections, and other third party and market driven needs. In the past this work has been accounted for in the Customer Request/Public Requirements category with other work such as new service requests and requests for the relocation of existing facilities to accommodate such things as street widening projects. The investments proposed for various portals, upgraded information systems, control center systems, and a future DERMS are proposed to support greater integration of DER in grid operations. In addition the Company is considering changing its standard design practices as follows to facilitate the interconnection of increasing penetrations of DER:
Consider 3Vo in new substation designs; Build all substations to 15 kV standard clearances;

National Grid Distributed System Implementation Plan
Investment Planning Page 129
All new grid devices with a local controller will be compatible with the installation of future telecommunications; and
When addressing asset condition concerns in 5 kV areas, consider rebuilding to 15 kV for enhance hosting capacity for DERs.
The Company has not, however, developed any specific budget expectations for proactive system enhancements to increase hosting capacity or to accommodate DER in specific locations. System upgrades in response to specific interconnection requests are typically identified in an interconnection study and paid for by the applicant of the DER as a Contribution in Aid of Construction as part of the individual interconnection project. Since the Company recovers these costs through the interconnection tariff, changing the design standards to proactively build the system for DG interconnection should have a corresponding allowance for cost recovery for distribution costs from interconnecting DG. Also included in the proposed DSIP investments are efforts to expand the development of NWA opportunities. While the DSIP identifies seven additional projects it will solicit NWA proposals for, there is not a specific budget identified for NWA projects. Rather, projects are budgeted with the expected costs of an appropriate wires alternative, and if a preferred NWA option can be identified, then the project will progress with the NWA scope, if not it will progress as originally budgeted.
In this initial DSIP the Company was requested to provide past and future spending for information technologies, communications and shared services. Most of these expenditures originate from services provided to the Company from its service company affiliate. At times these costs are an allocated share of services performed for the benefit of multiple affiliates. For example, the Company’s information system rental expense represents “rental” charges from National Grid USA Service Company, Inc. (“NGSC”) to each Operating Company for access and use of the computing and information systems necessary to conduct operations. NGSC owns the information systems plant and invoices each of its affiliated companies a pro-rated share of system asset recovery costs, including asset depreciation and an associated return. Information systems determines, on a project by project basis, which allocation code is appropriate to allocate the costs across the operating affiliates based on the nature of the services provided, the scale of services use and whether there is a cost-causal relationship.
The table below represents the allocated charges from several key departments required to deliver the proposals identified in this DSIP. Three years of historical data is captured as well as the current year budget.

National Grid Distributed System Implementation Plan
Investment Planning Page 130
Several of the recommendations of this DSIP may be financially impacted if implementations align with similar efforts under consideration by the Company’s affiliates in other jurisdictions. The IS, Cybersecurity, AMF and Control Center projects have all been identified as having cost sharing potential. To find a more detailed discussion of the Company’s capital plans the entire CIP filing can now be viewed via the System Data Portal. In the portal the projects from the CIP have been geocoded and plotted on an interactive map for additional context and they have been color coded in an effort to help identify potential NWA opportunities.
NIMOE
Department FY14 FY15 FY16 FY17 Budget
Information Services $42.51 $42.03 $38.13 $40.83
Digital Risk and Security $0.7 $1.3 $1.2 $2.0
Critical Network Infrastructure $2.5 $2.3 $9.7 $8.4
Control Center Ops $13.9 $14.3 $14.5 $14.7
Protection and Telecommunications Eng $1.5 $1.5 $1.3 $1.3
Distribution Control and Integration (UoF Mgmt) $2.5 $2.5 $2.3 $2.4
Total: $63.63 $63.91 $67.08 $69.67
Notes:
* Digital Risk and Security & CNI are part of Info Services SAP hierarchy therefore they are excluded in the Info Services totals to avoid double counts.
** DC&I is a sub-dept under Utility of the Future hierarchy
SAP Data tab contains historical data since SAP Go-Live on Nov 2012 (6 months of FY13).
Fiscal Year ($m)

National Grid Distributed System Implementation Plan
Appendices Page 131
Appendices

National Grid Distributed System Implementation Plan
Appendix 1: BCA Handbook
Appendix 1: BCA Handbook

[Typ
e text]
Be
Niag
enefit-C
gara Md
Cost AVers
ohawk/b/a Na
Case 1
REV P
Bene
Analysision 1
of
k Poweationa
14-M-0
Proceed
efit-Cos
is Han.0
er Corpl Grid
0101
ding
st Analy
dbook
poratio
ysis Ha
k
on
ndbookk

Page i
National Grid Benefit-Cost Analysis Handbook
TABLE OF CONTENTS
Acronyms and Abbreviations ..................................................................................... iii
1. Introduction ............................................................................................................... 1
1.1 Application of the BCA Handbook .................................................................................. 2 1.2 BCA Handbook Version ................................................................................................. 4 1.3 Structure of the Handbook ............................................................................................. 5
2. General Methodological Considerations ................................................................. 6
2.1 Avoiding Double Counting .............................................................................................. 6 2.1.1 Accounting of Benefits and Costs across Multiple Value Streams ..................... 6 2.1.2 Benefit Definitions and Differentiation ................................................................ 8
2.2 Incorporating Losses into Benefits ............................................................................... 12 2.3 Establishing Credible Baselines ................................................................................... 13 2.4 Normalizing Impacts ..................................................................................................... 14 2.5 Establishing Appropriate Analysis Time Horizon ......................................................... 14 2.6 Granularity of Data for Analysis ................................................................................... 15 2.7 Performing Sensitivity Analysis .................................................................................... 15
3. Relevant Cost-Effectiveness Tests ........................................................................ 16
3.1 Societal Cost Test ........................................................................................................ 20 3.2 Utility Cost Test ............................................................................................................ 21 3.3 Rate Impact Measure ................................................................................................... 21
4. Benefits and Costs Methodology ........................................................................... 22
4.1 Bulk System Benefits ................................................................................................... 23 4.1.1 Avoided Generation Capacity Costs ................................................................ 23 4.1.2 Avoided LBMPs ................................................................................................ 25 4.1.3 Avoided Transmission Capacity Infrastructure and Related O&M ................... 27 4.1.4 Avoided Transmission Losses .......................................................................... 29 4.1.5 Avoided Ancillary Services (Spinning Reserves, and Frequency Regulation) . 32 4.1.6 Wholesale Market Price Impact ........................................................................ 34
4.2 Distribution System Benefits ........................................................................................ 36 4.2.1 Avoided Distribution Capacity Infrastructure .................................................... 36 4.2.2 Avoided O&M ................................................................................................... 39 4.2.3 Distribution Losses ........................................................................................... 40
4.3 Reliability/Resiliency Benefits ...................................................................................... 42 4.3.1 Net Avoided Restoration Costs ........................................................................ 42 4.3.2 Net Avoided Outage Costs ............................................................................... 45
4.4 External Benefits .......................................................................................................... 48 4.4.1 Net Avoided CO2 .............................................................................................. 48 4.4.2 Net Avoided SO2 and NOx ................................................................................ 51 4.4.3 Avoided Water Impact ...................................................................................... 52

Nation
4.5
5. Chara
5.1
5.25.3
5.4
5.5
5.6
Append
nal Grid Be
4.4.4 Avo4.4.5 Net
Costs Analy4.5.1 Prog4.5.2 Add4.5.3 Incr4.5.4 Part4.5.5 Lost4.5.6 Sha4.5.7 Net
acterizatio
Coincidenc5.1.1 Bulk5.1.2 Tran5.1.3 Dist
Estimating Solar PV Ex
5.3.1 Exa5.3.2 Ben
Combined H5.4.1 Exa5.4.2 Ben
Demand Re5.5.1 Exa5.5.2 Ben
Energy Effi5.6.1 Exa5.6.2 Ben
Utilitdix A.
enefit-Cost
oided Land ImNon-Energy
ysis .............gram Admin
ded Ancillaryremental Traticipant DERt Utility Reve
areholder IncNon-Energy
n of DER p
e Factors ...k System ....nsmission ...tribution ......Coincidencexample .......
ample Systemnefit ParameHeat and Po
ample Systemnefit Parameesponse Exa
ample Systemnefit Parameciency Exam
ample Systemnefit Parame
ty-Specific
t Analysis
mpact ..........y Benefits R...................
nistration Cosy Service Coansmission &R Cost .........enue ...........centives .......y Costs .......
profiles ....
...................
...................
...................
...................e Factors ........................m Descriptioters .............
ower Exampm Descriptioters .............ample .........m Descriptioters .............
mple ............m Descriptioters .............
Assumpti
Handbook
...................elated to Uti...................sts ..............
osts .............& Distribution............................................................................
.................
...................
...................
...................
...................
...................
...................on ..................................
ple ...............on .....................................................on .....................................................on ..................................
ons ..........
k
...................ility or Grid O.........................................................n and DSP C............................................................................
.................
...................
...................
...................
...................
...................
...................
...................
...................
...................
...................
...................
...................
...................
...................
...................
...................
...................
.................
...................Operations ...........................................................Costs ......................................................................................
.................
...................
...................
...................
...................
...................
...................
...................
...................
...................
...................
...................
...................
...................
...................
...................
...................
...................
.................
Pag
...................
...................
...................
...................
...................
...................
...................
...................
...................
...................
.................
...................
...................
...................
...................
...................
...................
...................
...................
...................
...................
...................
...................
...................
...................
...................
...................
...................
.................
e ii
.... 53
.... 53
.... 53
.... 53
.... 54
.... 54
.... 55
.... 58
.... 59
.... 59
... 60
.... 66
.... 66
.... 68
.... 68
.... 69
.... 70
.... 70
.... 71
.... 72
.... 72
.... 72
.... 74
.... 74
.... 75
.... 76
.... 76
.... 76
. A-1

Page iii
National Grid Benefit-Cost Analysis Handbook
ACRONYMS AND ABBREVIATIONS
Acronyms and abbreviations are used extensively throughout the BCA Handbook and are presented here at the front of the Handbook for ease of reference. AC Alternating Current AGCC Avoided Generation Capacity Costs BCA BCA Framework
Benefit-Cost Analysis The benefit-cost framework structure presented initially in the “Staff White Paper on Benefit-Cost Analysis” and adopted as described in the BCA Order.
BCA Order Case 14-M-0101 – Proceeding on Motion of the Commission in Regard to Reforming the Energy Vision, Order Establishing the Benefit-Cost Analysis Framework (issued January 21, 2016).
CAIDI Customer Average Interruption Duration Index CARIS Congestion Assessment and Resource Integration Study C&I Commercial and Industrial CO2 Carbon Dioxide DC Direct Current DER Distributed Energy Resources DR Demand Response DSIP Distributed System Implementation Plan DSIP Guidance Order
Case 14-M-0101 – Proceeding on Motion of the Commission in Regard to Reforming the Energy Vision, Order Adopting Distributed System Implementation Plan Guidance (issued April 20, 2016)
DSP Distributed System Platform EPA ETIP
Environmental Protection Agency Energy Efficiency Transition Implementation Plan
GHG Greenhouse Gas ICAP Installed Capacity JU Joint Utilities (Consolidated Edison Company of New York, Inc., Orange and
Rockland Utilities, Inc., Central Hudson Gas & Electric Corporation, Niagara Mohawk Power Corporation d/b/a National Grid, New York State Electric & Gas Corporation, and Rochester Gas and Electric Corporation)
kV Kilovolt LBMP Locational Based Marginal Prices LCR Locational Capacity Requirements LHV Lower Hudson Valley LI Long Island MW Megawatt MWh Megawatt Hour NPV Net Present Value NOx Nitrogen Oxide

Page iv
National Grid Benefit-Cost Analysis Handbook
NWA Non-Wires Alternatives NYC New York City NYISO New York Independent System Operator NYPSC New York Public Service Commission or Commission NYSERDA New York State Energy Research and Development Authority O&M Operations and Maintenance PV Photovoltaic REV Reforming the Energy Vision REV Proceeding
Case 14-M-0101 – Proceeding on Motion of the Commission in Regard to Reforming the Energy Vision
RGGI Regional Greenhouse Gas Initiative RIM Rate Impact Measure RMM Regulation Movement Multiplier ROS Rest of State SAIDI System Average Interruption Duration Index SAIFI System Average Interruption Frequency Index SAM System Advisor Model (National Renewable Energy Laboratory) SCC Social Cost of Carbon SCT Societal Cost Test SENY Southeast New York (Ancillary Services Pricing Region) SO2 Sulfur Dioxide T&D Transmission and Distribution UCT WACC
Utility Cost Test Weighted Average Cost of Capital

Page 1
National Grid Benefit-Cost Analysis Handbook
1. INTRODUCTION
The State of New York Public Service Commission (NYPSC) directed the Joint Utilities (JU)1 to develop and file Benefit-Cost Analysis (BCA) Handbooks by June 30, 2016 as a requirement of the Order Establishing the Benefit-Cost Analysis Framework (BCA Order).2 The BCA Framework included in Appendix C of the BCA Order is incorporated into the BCA Handbooks. These handbooks are to be filed contemporaneously with each utility’s initial Distributed System Implementation Plan (DSIP) filing and with each subsequent DSIP, scheduled to be filed every other year.3 The purpose of the BCA Handbook is to provide a common methodology for calculating benefits and costs of projects and investments. The BCA Order requires that benefit-cost analysis be applied to the following four categories of utility expenditure:4
1. Investments in distributed system platform (DSP) capabilities
2. Procurement of distributed energy resources (DER) through competitive selection5
3. Procurement of DER through tariffs6
4. Energy efficiency programs The BCA Handbook provides methods and assumptions that may be used to inform BCA for each of these four types of expenditure. The BCA Order also includes a list of principles for the BCA Framework that is reflected in the BCA Handbook.7 BCA should:
1. Be based on transparent assumptions and methodologies; list all benefits and costs including those that are localized and more granular.
2. Avoid combining or conflating different benefits and costs.
1 For the purpose of this document, the Joint Utilities includes Consolidated Edison Company of New York, Inc. (Con Edison), Orange and Rockland Utilities, Inc., Central Hudson Gas & Electric Corporation, Niagara Mohawk Power Corporation d/b/a National Grid (National Grid), New York State Electric & Gas Corporation, and Rochester Gas and Electric Corporation. 2 Case 14-M-0101 – Proceeding on Motion of the Commission in Regard to Reforming the Energy Vision (REV Proceeding), Order Establishing the Benefit Cost Analysis Framework (issued January 21, 2016) (BCA Order). 3 REV Proceeding, Order Adopting Distributed System Implementation Plan Guidance (issued April 20, 2016) (DSIP Guidance Order), pg. 64: “…shall file subsequent Distributed System Implementation Plans on a biennial basis beginning June 30, 2018.” 4 BCA Order, pg. 1-2. 5 Also known as non-wires alternatives (NWA). 6 These may include, for example, demand response tariffs or successor tariffs to net energy metering (NEM). 7 BCA Order, pg. 2.

Page 2
National Grid Benefit-Cost Analysis Handbook
3. Assess portfolios rather than individual measures or investments (allowing for consideration of potential synergies and economies among measures).
4. Address the full lifetime of the investment while reflecting sensitivities on key assumptions.
5. Compare benefits and costs to traditional alternatives instead of valuing them in isolation.
The BCA Order states: “Because market engagement should be consistent across New York, the Handbooks would establish methodologies based on common analytics and standardized assumptions.”8 In order to ensure the most accurate and consistent BCA methodology, Niagara Mohawk Power Corporation d/b/a National Grid (“National Grid” or the “Company”) developed this BCA Handbook in collaboration with the JU. Navigant Consulting, Inc. (Navigant) facilitated the development of a standard BCA template at the request of the JU. By design, the key assumptions, scope, and approach for a BCA included herein are largely consistent amongst all utilities’ BCA Handbooks. Where applicable, National Grid has customized the Handbook to account for utility-specific assumptions and information.
1.1 Application of the BCA Handbook
The BCA Handbook provides a common methodology to be applied in BCA across investment projects and portfolios. Version 1 of the BCA Handbook is meant to inform investments in DSP capabilities or the procurement of DERs through tariffs, and to be specifically applicable to procurement of DERs through competitive selections (i.e., non-wire alternatives) and/or energy efficiency programs. Common input assumptions and sources that are applicable statewide (e.g., information publicly provided by the New York Independent System Operator (NYISO) or by NYPSC directly in Appendix C to the BCA Order) and utility-specific inputs (e.g., marginal cost of service and losses) that may be commonly applicable to a variety of project-specific BCAs are provided within. Individual BCAs for specific projects or portfolios are likely to require additional, project-specific information and inputs. Table 1-1 lists the statewide data and sources to be used for BCA and referenced in this Handbook (full citations are provided in the footnotes).
8 BCA Order, pg. 29

Page 3
National Grid Benefit-Cost Analysis Handbook
Table 1-1. New York Assumptions
New York Assumptions Source
Energy and Demand Forecast NYISO: Load & Capacity Data9
Avoided Generation Capacity Cost (AGCC)
DPS Staff: ICAP Spreadsheet Model10
Locational Based Marginal Prices (LBMP)
NYISO: Congestion Assessment and Resource Integration Study Phase 2 (CARIS Phase 2)11
Historical Ancillary Service Costs NYISO: Markets & Operations Reports12
Wholesale Energy Market Price Impacts DPS Staff: To be provided13
Allowance Prices (SO2, and NOX) NYISO: CARIS Phase 214
Net Marginal Damage Cost of Carbon DPS Staff: To be provided15
Utility-specific assumptions include data available from the utility published documents listed below in Table 1-2 (full citations are provided in the footnotes). The values to be relied on for weighted average cost of capital (WACC), losses, and system average marginal cost of service are provided in Appendix A. Utility-Specific Assumptions.
9 The 2016 Load & Capacity Data report is available in the Planning Data and Reference Docs folder at: http://www.nyiso.com/public/markets_operations/services/planning/documents/index.jsp 10 The ICAP Spreadsheet Model is found under Case 14-M-0101 at the Commission’s website: http://www.dps.ny.gov. The filename is BCA Att A Jan 2016.xlsm. 11 The finalized annual and hourly values from 2016 CARIS Phase 2 will be available in the CARIS Study Outputs folder within the Economic Planning Studies folder at: http://www.nyiso.com/public/markets_operations/services/planning/planning_studies/index.jsp. In the interim, work with DPS Staff on appropriate values to use for the Energy Efficiency Transition Implementation Plan (ETIP) filing. 12 Historical ancillary service costs are available at: http://www.nyiso.com/public/markets_operations/market_data/custom_report/index.jsp. The values to apply are described in Section 4.1.5. 13 DPS Staff will perform the modeling and file the results with the Secretary to the Commission on or before July 1 of each year. 14 The allowance price assumptions for the 2016 CARIS Phase 2 study will be available in the CARIS Input Assumptions folder within Economic Planning Studies at: http://www.nyiso.com/public/markets_operations/services/planning/planning_studies/index.jsp. 15 DPS Staff will perform the modeling and file the results with the Secretary to the Commission on or before July 1 of each year.
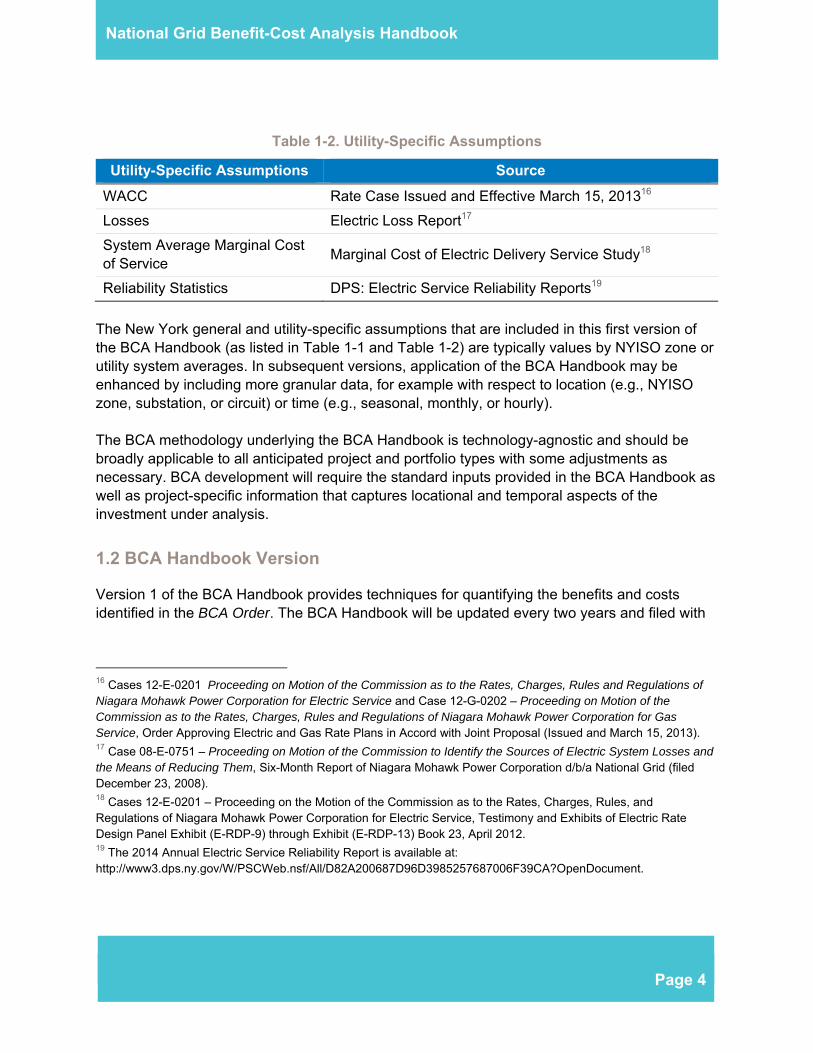
Page 4
National Grid Benefit-Cost Analysis Handbook
Table 1-2. Utility-Specific Assumptions
Utility-Specific Assumptions Source
WACC Rate Case Issued and Effective March 15, 201316
Losses Electric Loss Report17
System Average Marginal Cost of Service
Marginal Cost of Electric Delivery Service Study18
Reliability Statistics DPS: Electric Service Reliability Reports19
The New York general and utility-specific assumptions that are included in this first version of the BCA Handbook (as listed in Table 1-1 and Table 1-2) are typically values by NYISO zone or utility system averages. In subsequent versions, application of the BCA Handbook may be enhanced by including more granular data, for example with respect to location (e.g., NYISO zone, substation, or circuit) or time (e.g., seasonal, monthly, or hourly). The BCA methodology underlying the BCA Handbook is technology-agnostic and should be broadly applicable to all anticipated project and portfolio types with some adjustments as necessary. BCA development will require the standard inputs provided in the BCA Handbook as well as project-specific information that captures locational and temporal aspects of the investment under analysis.
1.2 BCA Handbook Version
Version 1 of the BCA Handbook provides techniques for quantifying the benefits and costs identified in the BCA Order. The BCA Handbook will be updated every two years and filed with
16 Cases 12-E-0201 Proceeding on Motion of the Commission as to the Rates, Charges, Rules and Regulations of Niagara Mohawk Power Corporation for Electric Service and Case 12-G-0202 – Proceeding on Motion of the Commission as to the Rates, Charges, Rules and Regulations of Niagara Mohawk Power Corporation for Gas Service, Order Approving Electric and Gas Rate Plans in Accord with Joint Proposal (Issued and March 15, 2013). 17 Case 08-E-0751 – Proceeding on Motion of the Commission to Identify the Sources of Electric System Losses and the Means of Reducing Them, Six-Month Report of Niagara Mohawk Power Corporation d/b/a National Grid (filed December 23, 2008). 18 Cases 12-E-0201 – Proceeding on the Motion of the Commission as to the Rates, Charges, Rules, and Regulations of Niagara Mohawk Power Corporation for Electric Service, Testimony and Exhibits of Electric Rate Design Panel Exhibit (E-RDP-9) through Exhibit (E-RDP-13) Book 23, April 2012. 19 The 2014 Annual Electric Service Reliability Report is available at: http://www3.dps.ny.gov/W/PSCWeb.nsf/All/D82A200687D96D3985257687006F39CA?OpenDocument.
Page 5
National Grid Benefit-Cost Analysis Handbook
the DSIP.20 Interim revisions will be limited to material changes to input assumptions and/or new guidance or orders.
1.3 Structure of the Handbook
The four remaining sections of the Handbook explain the methodology and assumptions to be applied under the BCA Framework:
Section 2. General Methodological Considerations describes key issues and challenges to be considered when developing project-specific BCA models and tools based on this BCA Handbook.
Section 3. Relevant Cost-Effectiveness Tests defines each cost-effectiveness test included in the BCA Framework. These include the Societal Cost Test (SCT), the Utility Cost Test (UCT), and the Rate Impact Measure (RIM). The BCA Order specifies the SCT as the primary measure of cost-effectiveness.
Section 4. Benefits and Costs Methodology provides detailed definitions, calculation methods, and general considerations for each benefit and cost.
Section 5. Characterization of DER profiles discusses which benefits and costs are likely to apply to different types of DER, and provides examples for a sample selection of DERs.
Appendix A. Utility-Specific Assumptions includes value assumptions to be applied to the quantifiable energy and non-energy impacts of projects and portfolios.
20 DSIP Guidance Order, pg. 64: “…shall file subsequent Distributed System Implementation Plans on a biennial basis beginning June 30, 2018.”

Page 6
National Grid Benefit-Cost Analysis Handbook
2. GENERAL METHODOLOGICAL CONSIDERATIONS
This section describes key issues and challenges that that must be considered when developing project- or portfolio-specific BCAs. These considerations are incorporated into the benefit and cost calculation methods presented in Section 4.
2.1 Avoiding Double Counting
A BCA must be designed to avoid double counting of benefits and costs. Doubling counting can be avoided by 1) careful tracking of the value streams resulting from multiple investment elements in a project, program, or portfolio and 2) clear definition of and differentiation between the benefits and costs included in the analysis. Sections 2.1.1 and 2.1.2 discuss these considerations in more detail.
2.1.1 Accounting of Benefits and Costs across Multiple Value Streams
The BCA Handbook provides a methodology for calculating the benefits and costs resulting from utility investments as portfolios of projects and programs or as individual projects or programs. A project or program will typically involve multiple technologies, each associated with specific costs. Each technology also provides one or more functions that result in quantified impacts, which are valued as monetized benefits. Figure 2-1 is an illustrative example of value streams that may be associated with a portfolio of projects or programs.

Nation
Figure 2
Source: Na
Investmefunction ttechnologthe benetechnologmeasureimpacts aand/or in Benefits This mayinvestmebenefits f
nal Grid Be
2-1. Illustrat
ational Grid
ents may be to enable orgies (e.g., te
efits of other gyc in Figures or technoland benefits what order
and costs shy present chaent in technofrom this tec
enefit-Cost
tive Exampl
made in tecr facilitate theechnologyb intechnologie
e 2-1). It is imogies functio
s are derivedthe element
hould also ballenges esp
ologyc in Figuchnology are
t Analysis
le of Value of Projec
chnologies the realizationn Figure 2-1s and result mportant notoning togethd from whichts are implem
be allocated pecially in thure 2-1 is ince realized for
Handbook
Streams thacts or Progr
hat do not re of benefits ). Some tecin direct ben
t to double cher to achievh investmentmented.
properly acrhe case of encluded as par project/pro
k
at May be Arams
esult in direcfrom additiohnologies mnefits though
count benefitve an impactt elements w
ross differennabling techart of projectograma, howe
Associated
ct benefits buonal measuremay both enah a parallel fts resulting ft. Determina
will often dep
nt projects wnologies. Fot/programa. Sever technol
Pag
with a Portf
ut instead es or able or enhafunction (e.gfrom multipleation of whicpend on how
ithin a portfoor example, Some direct logyc also
e 7
folio
ance g., e h
w
olio. the

Page 8
National Grid Benefit-Cost Analysis Handbook
enables technologyd that is included as part of project/programb. In this example, the costs of technologyc and the directly resulting benefit should be accounted for in project/programa, and the cost for technologyd and the resulting incremental benefits should be accounted for in project/programb. Enabling technologies such as an advanced distribution management system or a communications infrastructure are often crucial in achieving the impact and benefits of grid modernization projects. These infrastructure investments may be necessary for the implementation of other technologies, projects, or programs, and in some cases the same investments could also enable a given asset to achieve additional benefits beyond what that asset may have been able to achieve on its own. Overtime, investments made as part of previous projects or portfolios may also enable or enhance new projects. The BCA Order states that utility BCA shall consider incremental transmission and distribution (T&D) costs “to the extent that the characteristics of a project cause additional costs to be incurred.”21 Multiple technologies may result in impacts that produce the same benefits. For example, there are many ways in which distribution grid modernization investments could affect the frequency and duration of sustained outages. Advanced meters equipped with an outage notification feature, an outage management system, automated distribution feeder switches or reclosers, and remote fault indicators are some examples of technologies that could all reduce the frequency or duration of outages on a utility’s distribution network and result in Avoided Outage Cost or Avoided Restoration Cost benefits. The utility BCA must also address the non-linear nature of electric grid and DER project benefits. For example, impact on Avoided Distribution Capacity Infrastructure of an energy storage project may be capped based on the interconnected load on the given feeder. If there is 1 MW of potentially deferrable capacity on a feeder with a new battery storage system, installation of a 5 MW storage unit will not result in a full 5 MW-worth of capacity deferral credit for that feeder. As another example, the incremental improvement on reliability indices may diminish as more automated switching projects are in place.
2.1.2 Benefit Definitions and Differentiation
A key consideration identified in performing a BCA is to avoid double counting of benefits and costs by appropriately defining each benefit and cost. As discussed in Section 3, the BCA Order identified sixteen benefits to be included in the cost-effectiveness tests. The calculation methodology for each of these benefits is provided in Section 4 herein. Two bulk system benefits, Avoided Generation Capacity Costs (AGCC) and
21 BCA Order, Appendix C, pg. 18.

Page 9
National Grid Benefit-Cost Analysis Handbook
Avoided Locational Based Marginal Pricing (LBMP), result from system coincident peak demand reduction and energy reduction impacts respectively, with avoided cost values derived from multiple components. These impacts and embedded component values included in the AGCC and Avoided LBMP benefits may be confused with other benefits identified in the BCA Order that must be calculated separately. Sections 2.1.2.1 and 2.1.2.2 below define the avoided transmission and distribution loss impacts resulting from energy and demand reductions that should be included in the calculations of the AGCC and Avoided LBMP, and differentiate them from the impacts that should be counted as separate Avoided Transmission Losses and Avoided Distribution Losses benefits. Sections 2.1.1.1 and 2.1.1.2 also provide differentiation between the transmission capacity values embedded as components of the AGCC and Avoided LBMP values, as well as differentiation between the CO2, SO2, and NOx values embedded in Avoided LBMP values and those values that must be applied separately in the Net Avoided CO2 and Net Avoided SO2, and NOx benefits calculations. Table 2-1 provides a list of potentially overlapping AGCC and Avoided LBMP benefits.
Table 2-1. Benefits with Potential Overlaps
Main Benefits Potentially Overlapping Benefits
Avoided Generation Capacity Costs
• Avoided Transmission Capacity
• Avoided Transmission Losses
• Avoided Distribution Losses
Avoided LBMP
• Net Avoided CO2
• Net Avoided SO2 and NOx
• Avoided Transmission Losses
• Avoided Transmission Capacity
• Avoided Distribution Losses
2.1.2.1 Benefits Overlapping with Avoided Generation Capacity Costs
Figure 2-2 graphically illustrates potential overlaps of benefits pertaining to the AGCC.

Nation
Figure
Source: Na
In this stavalues inimpacts ebenefit sare captumargin, taffect thecalculatio If a projeitself, the
22 The AGCclearing pr23 For examimpact on t
nal Grid Be
e 2-2. Benef
avigant
acked columncluded in thexcluded frohown aboveured in the Atransmissione calculationon accounts
ect changes te incrementa
CC includes a pice.
mple, an impacthe AGCC due
enefit-Cost
fits Potentia
mn chart, thee calculation
om the main e, Avoided GAGCC value.n capacity, a of AGCC, dfor these di
the electricaal changes in
portion of avoid
ct on the secon to higher losse
t Analysis
ally Overlap(Ill
e boxes withn of the mainbenefit, but
Generation C. These inclund transmis
depending ostribution los
al topology an transmissio
ded transmissio
dary distributioes.
Handbook
pping with Alustrative)
solid bordern benefit, whincluded in
Capacity Cosude installedsion tosses.n the projecsses.
nd thereforeon losses wo
on capacity inf
on system com
k
Avoided Ge
rs representhile boxes wcalculation o
sts, includes d capacity (IC.22 Additiona
ct location on
e changes thould be alloc
frastructure cos
pared to the pr
eneration Ca
t impacts andwith dotted boof a separatemultiple com
CAP) includally, distributin the system
he transmisscated to the
sts as zonal dif
rimary system
Page
apacity Cos
d embeddedorders repree benefit. Thmponents thing reserve ion losses ca
m.23 The AGC
sion loss perAvoided
fferences in the
will have a hig
10
sts
d esent he hat
an CC
rcent
e ICAP
her

Nation
Transmisa result obenefits a
2.1.2.2 Be
Figure 2-
Figure
In this stavalues inimpacts eseen in tbeyond senergy m
• Ac
nal Grid Be
ssion Lossesof the projecare calculate
enefits Ove
-3 graphicall
e 2-3. Bene
acked columncluded in thexcluded frohe figure, thsimple energmarket. The f
Avoided transharge which
enefit-Cost
s benefit. Simt would be ined separatel
erlapping wi
y illustrates
fits Potenti
mn chart, thee calculation
om the main e stacked so
gy cost per mfollowing are
smission caph is embedde
t Analysis
milarly, any ncluded in thly from the A
ith Avoided
potential ov
ally Overlap
Sou
e boxes with n of the mainbenefit, but olid boxes inmegawatt-hoe included in
pacity infrased in the LB
Handbook
incremental he Avoided DAGCC benef
d LBMP
verlaps of be
pping with A
urce: Navigant
solid bordern benefit, whincluded in
n the Avoideour (MWh) on the Avoided
tructure cosMP
k
changes to Distribution fit.
enefits pertai
Avoided LB
rs representhile boxes wcalculation o
ed LBMP benf the electricd LBMP ben
ts built into t
distribution Losses bene
ining to Avoi
BMP Benefit
t impacts andwith dotted boof a separatenefit include city traded innefit:
the transmis
Page
loss percenefit. These
ided LBMP.
t (Illustrativ
d embeddedorders repree benefit. Ascosts for fac
n the wholes
ssion conges
11
nt as
ve)
d esent s ctors
sale
stion

Page 12
National Grid Benefit-Cost Analysis Handbook
• Transmission-level loss costs which are embedded in the LBMP
• Compliance costs of various air pollutant emissions regulations including the value of CO2 via the Regional Greenhouse Gas Initiative (RGGI) and the values of SO2 and NOx via cap-and-trade markets which are embedded in the LBMP
Additionally, distribution losses can affect LBMP purchases, depending on the project location on the electric system, and should gross up the calculated LBMP benefits.24 To the extent a project changes the electrical topology and changes the distribution loss percent itself, the incremental changes in distribution losses would be allocated to the Avoided Distribution Losses benefit. Similarly, there may be projects that would specifically impact Avoided Transmission Capacity or change the transmission loss percent. In these instances, the impacts would be captured outside of the Avoided LBMP benefit.
2.2 Incorporating Losses into Benefits
Many of the benefit equations provided in Section 4 include a parameter to account for losses. In calculating a benefit or cost resulting from load impacts, the variable losses occurring upstream from the load impact must be accounted for to arrive at the total energy or demand impact. Losses can be accounted for either by adjusting the impact parameter or the valuation parameter. For consistency, all equations in Section 4 are shown with a loss adjustment to the impact parameter. The following losses-related nomenclature is used in the BCA Handbook:
• Losses (MWh or MW) are the difference between the total electricity send-out and the total output as measured by revenue meters. This difference includes technical and non-technical losses. Technical losses are the losses associated with the delivery of electricity of energy and have fixed (no load) and variable (load) components. Non-technical losses represent electricity that is delivered, but not measured by revenue meters.
• Loss Percent (%) are the total fixed and/or variable25 quantity of losses between relevant voltage levels divided by total electricity send-out unless otherwise specified.
• Loss Factor (dimensionless) is a conversion factor derived from “loss percent”. The loss factor is 1 / (1 - Loss Percent).
24 For example, an impact on the secondary distribution system compared to the primary system will have a higher impact on the LBMP purchases due to higher losses. 25 In the BCA equations outlined in Section 4 herein, project-specific energy and demand impacts at the retail delivery point are adjusted to the bulk system (or other relevant system location) based on only the variable component of the loss percent. In cases where the T&D loss percent is altered due to a project, the fixed and/or variable loss percent impacts are considered.
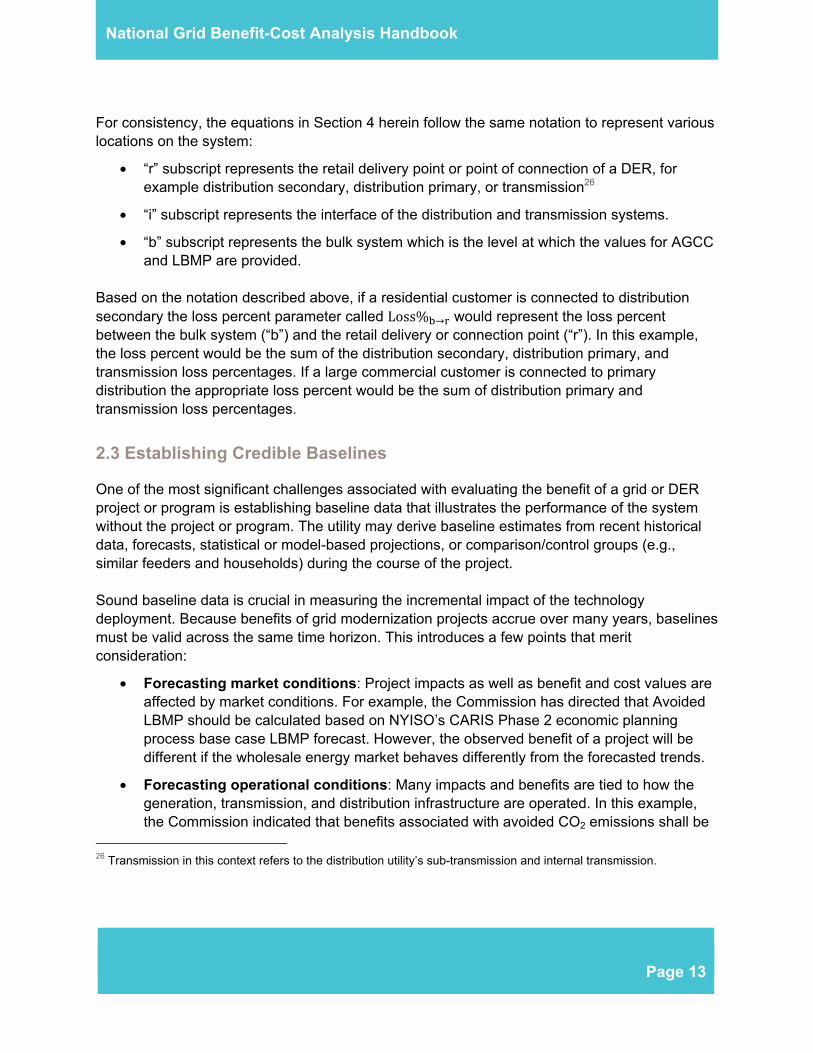
Page 13
National Grid Benefit-Cost Analysis Handbook
For consistency, the equations in Section 4 herein follow the same notation to represent various locations on the system:
• “r” subscript represents the retail delivery point or point of connection of a DER, for example distribution secondary, distribution primary, or transmission26
• “i” subscript represents the interface of the distribution and transmission systems.
• “b” subscript represents the bulk system which is the level at which the values for AGCC and LBMP are provided.
Based on the notation described above, if a residential customer is connected to distribution secondary the loss percent parameter called Loss% → would represent the loss percent between the bulk system (“b”) and the retail delivery or connection point (“r”). In this example, the loss percent would be the sum of the distribution secondary, distribution primary, and transmission loss percentages. If a large commercial customer is connected to primary distribution the appropriate loss percent would be the sum of distribution primary and transmission loss percentages.
2.3 Establishing Credible Baselines
One of the most significant challenges associated with evaluating the benefit of a grid or DER project or program is establishing baseline data that illustrates the performance of the system without the project or program. The utility may derive baseline estimates from recent historical data, forecasts, statistical or model-based projections, or comparison/control groups (e.g., similar feeders and households) during the course of the project. Sound baseline data is crucial in measuring the incremental impact of the technology deployment. Because benefits of grid modernization projects accrue over many years, baselines must be valid across the same time horizon. This introduces a few points that merit consideration:
• Forecasting market conditions: Project impacts as well as benefit and cost values are affected by market conditions. For example, the Commission has directed that Avoided LBMP should be calculated based on NYISO’s CARIS Phase 2 economic planning process base case LBMP forecast. However, the observed benefit of a project will be different if the wholesale energy market behaves differently from the forecasted trends.
• Forecasting operational conditions: Many impacts and benefits are tied to how the generation, transmission, and distribution infrastructure are operated. In this example, the Commission indicated that benefits associated with avoided CO2 emissions shall be
26 Transmission in this context refers to the distribution utility’s sub-transmission and internal transmission.

Page 14
National Grid Benefit-Cost Analysis Handbook
based on the change in the tons of CO2 produced by the bulk system when system load levels are reduced by 1%. It is important to note that this impact calculation is an approximation and it is still very difficult to determine the actual CO2 reductions at the bulk system level from the impacts of projects implemented at the distribution system level. Project-specific reductions are tied to dispatch protocols based on the optimized operation of the bulk system given a set of preventive post-contingency settings. In addition, the carbon intensity of the generation mix will inevitably change over time independent of any investment at the distribution level.
• Predicting asset management activities: Some impacts and benefits, such as Avoided Distribution Capacity Infrastructure, are affected by distribution-level capital investments that may take place independent of the projects being evaluated. In this example, the amount of available excess capacity may change if key distribution assets are replaced and uprated.
There are significant uncertainties surrounding the benefits and costs. Regulatory approvals, technological advances, operational budgets, and other business conditions all affect the cost of deployment, expected system performance, or both. As such, the utility may re-evaluate and revise its baseline data as significant events or developments alter the assumed or implied conditions underlying the existing baseline.
2.4 Normalizing Impacts
In addition to establishing an appropriate baseline, normalizing impact data presents similar challenges. This is particularly true for distribution-level projects, where system performance is significantly affected by external conditions beyond that which occurs on the distribution system. For instance, quantifying the impact of technology investment on reliability indices would require the baseline data to be representative of expected feeder reliability performance. This is a challenging task, as historical data would require weather adjustments and contemporaneous data would be drawn from different, but similar, feeders. A distribution feeder may go through changes that could influence feeder performance independent of the technologies implemented. For instance, planned outages due to routine maintenance activities or unplanned outages due to damages from a major storm could impact reliability indices and changes in the mix of customer load type (e.g., residential vs. commercial and industrial), which may impact feeder peak load.
2.5 Establishing Appropriate Analysis Time Horizon
The duration over which the impact and benefits of new grid and DER investments accrue varies significantly. The time horizon for the analysis must consider several factors, including differences among the lengths of expected useful life of various hardware and software across

Page 15
National Grid Benefit-Cost Analysis Handbook
multiple projects and how to reconcile the differences in these lengths of expected useful lives. The analysis timeframe should be based on the longest asset life included in the portfolio/solution under consideration.27
2.6 Granularity of Data for Analysis
The most accurate assumptions to use for assessing a BCA would leverage suitable location or temporal information. When the more granular data is not available, an appropriate annual average or system average may be used, if applicable, in reflecting the expected savings from the use of DER. More granular locational or temporal assumptions are always preferred to more accurately capture the savings from use of a resource. However, the methodology included in the BCA Handbook would accommodate appropriate system averages in cases where their use is required (e.g., in the absence of more granular locational data).
2.7 Performing Sensitivity Analysis
The BCA Order indicates the BCA Handbook shall include a “description of the sensitivity analysis that will be applied to key assumptions.”28 As Section 4 herein presents, there is a discussion of each of the benefits and costs, and a sensitivity analysis can be performed by changing selected parameters. The largest benefits for DER are typically the bulk system benefits of Avoided LBMP or AGCC. A sensitivity of LBMP ($/MWh) could be assessed by adjusting the LBMP by +/-10 %. In addition to adjusting the values of an individual parameter as part of a sensitivity analysis, the applicability of certain benefits and costs would be considered as a sensitivity analysis of the cost-effectiveness tests. For example, inclusion of the Wholesale Market Price Impacts in the UCT and RIM would be assessed as part of a sensitivity analysis.29
27 BCA Order, pg. 2 28 BCA Order, Appendix C, pg. 31. 29 BCA Order, pg. 25 (“The evaluation would then be conducted showing separately the impacts both with and without the wholesale market price effect.”)

Page 16
National Grid Benefit-Cost Analysis Handbook
3. RELEVANT COST-EFFECTIVENESS TESTS
The BCA Order states that the Societal Cost Test (SCT), Utility Cost Test (UCT), and the Rate Impact Measure (RIM) make up the relevant cost-effectiveness tests to be used in the BCA. These cost-effectiveness tests are summarized in Table 3-1.
Table 3-1. Cost-Effectiveness Tests
Cost Test
Perspective Key
Question Answered
Calculation Approach
SCT Society
Is the State of New York better off as a whole?
Compares the costs incurred to design and deliver projects, and customer costs with avoided electricity and other supply-side resource costs (e.g., generation, transmission, and natural gas); also includes the cost of externalities (e.g., carbon emissions and other net non-energy benefits)
UCT Utility How will utility costs be affected?
Compares the costs incurred to design, deliver, and manage projects by the utility with avoided electricity supply-side resource costs
RIM Ratepayer How will utility rates be affected?
Compares utility costs and utility bill reductions with avoided electricity and other supply-side resource costs
The BCA Order positions the SCT as the primary cost-effectiveness measure because it evaluates impact on society as a whole. The role of the UCT and RIM is to assess the preliminary impact on utility costs and ratepayer bills from the benefits and costs that pass the SCT. The results of the UCT and RIM test are critical in identifying projects that may require a more detailed analysis of their impact to the utility and utility customers. Some projects may not provide benefits to the utility and its customers, even if it is beneficial to society as a whole. It is important to note, however, that if a measure passes the SCT but its results do not satisfy the UCT and RIM tests, the measure would not be rejected unless a complete bill impact analysis determines that the impact is of a “magnitude that is unacceptable”.30
30 BCA Order, pg. 13.

Page 17
National Grid Benefit-Cost Analysis Handbook
Each cost-effectiveness test included in the BCA Framework is defined in greater detail in the following subsections. Which of the various benefits and costs to include in analysis of individual projects or investment portfolios requires careful consideration, as discussed earlier in Section 2 - General Methodological Considerations.

Page 18
National Grid Benefit-Cost Analysis Handbook
Table 3-2 summarizes which cost-effectiveness tests can be applied to the benefits and costs included in the BCA Order. The subsections below provide further context for each cost-effectiveness test.
Table 3-2. Summary of Cost-Effectiveness Tests by Benefit and Cost
Section #
Benefit/Cost SCT UCT RIM
Benefit
4.1.1 Avoided Generation Capacity Costs†
4.1.2 Avoided LBMP‡
4.1.3 Avoided Transmission Capacity Infrastructure†‡
4.1.4 Avoided Transmission Losses†‡
4.1.5 Avoided Ancillary Services*
4.1.6 Wholesale Market Price Impacts**
4.2.1 Avoided Distribution Capacity Infrastructure
4.2.2 Avoided O&M
4.2.3 Avoided Distribution Losses†‡
4.3.1 Net Avoided Restoration Costs
4.3.2 Net Avoided Outage Costs
4.4.1 Net Avoided CO2‡
4.4.2 Net Avoided SO2 and NOx‡
4.4.3 Avoided Water Impacts
4.4.4 Avoided Land Impacts
4.4.5 Net Non-Energy Benefits***
Cost
4.5.1 Program Administration Costs
4.5.2 Added Ancillary Service Costs*
4.5.3 Incremental T&D and DSP Costs
4.5.4 Participant DER Cost
4.5.5 Lost Utility Revenue
4.5.6 Shareholder Incentives
4.5.7 Net Non-Energy Costs**
† See Section 2.1.2.1 for discussion of potential overlaps in accounting for these benefits. ‡ See Section 2 for discussion of potential overlaps in accounting for these benefits.

Page 19
National Grid Benefit-Cost Analysis Handbook
* The amount of DER is not the driver of the size of NYISO’s Ancillary Services markets since a change in load will not result in a reduction in the NYISO requirements for Regulation and Reserves as the requirements for these
services are set periodically by NYISO to maintain frequency and to cover the loss of the largest supply element(s) on the bulk power system. Therefore, there is no impact within the SCT as the overall Ancillary Services requirement remains unchanged. DER has potential to provide new distribution-level ancillary service. However, it is uncertain whether such service can be cost-effectively provided. DER has potential to provide new distribution-level ancillary
service. However, it is uncertain whether such service can be cost-effectively provided. ** The Wholesale Market Price Impacts in the UCT and RIM would be assessed as part of a sensitivity analysis.
*** It is necessary to identify which cost-effectiveness test should include the specific benefit or cost in the Net Non-Energy Benefit or Net Non-Energy Cost as it may apply to the SCT, UCT and/or RIM.
Performing a cost-effectiveness test for a specific project or a portfolio of projects requires the following steps:
• Select the relevant benefits for the investment.
• Determine the relevant costs from each cost included over the life of the investment.
• Estimate the impact the investment will have in each of the relevant benefits in each year of the analysis period (i.e., how much will it change the underlying physical operation of the electric system to produce the benefits).
• Apply the benefit values associated with the project impacts as described in Section 4 below.
• Apply the appropriate discount rate to perform a cost-effectiveness test for a specific project or portfolio. The discount rate used to calculate the present value of all benefits and costs is the utility WACC provided in Table A-1.
• Treat inflation consistently by discounting real cash flow by real discount rates and nominal cash flows by nominal discount rates. A 2% annual inflation rate should be assumed unless otherwise specified.

Page 20
National Grid Benefit-Cost Analysis Handbook
3.1 Societal Cost Test
Cost Test
Perspective Key Question Answered
Calculation Approach
SCT Society Is the State of New York better off as a whole?
Compares the costs incurred to design and deliver projects, and customer costs with avoided electricity and other supply-side resource costs (e.g., generation, transmission, and natural gas); also includes the cost of externalities (e.g., carbon emissions, and net non-energy benefits)
A majority of the benefits included in the BCA Order are included in the SCT because their impact can be applied to society as a whole. This includes all distribution system benefits, all reliability/resiliency benefits, and all external benefits. Lost Utility Revenue and Shareholder Incentives do not apply to the SCT, as these are considered transfers between stakeholder groups that have no net impact on society as a whole. Similarly, the Wholesale Market Price Impact sensitivity is not performed for the SCT because price suppression is also considered a transfer from large generators to other market participants in the BCA Order:
“Wholesale markets already adjust to changes in demand and supply resources, and any resource cost savings that result are reflected in the SCT. Any price suppression over and above those market adjustments is essentially a transfer payment -- simply a shift of monetary gains and losses from one group of economic constituents to another. No efficiency gain results if, for example, generators are paid more or less while consumers experience equal and offsetting impacts. Therefore, the price suppression benefit is not properly included in the SCT beyond the savings already reflected there.”31
31 BCA Order, pg. 24.

Page 21
National Grid Benefit-Cost Analysis Handbook
3.2 Utility Cost Test
Cost Test
Perspective Key Question Answered
Calculation Approach
UCT Utility How will utility costs be affected?
Compares the costs incurred to design, deliver, and manage projects by the utility with avoided electricity supply-side resource costs
The UCT evaluates the impact of a project, program, or portfolio on utility costs associated with energy, capacity, generation, T&D, and overhead, as well as general and administrative costs. For this reason, external benefits such as Avoided CO2, Avoided SO2 and NOX, and Avoided Water and Land Impacts do not apply to the UCT. Utilities in New York do not currently receive incentives for decreased CO2 or other environmental impacts. Benefits related to avoided outages would go to customers and not utilities, so this benefit also does not apply to the UCT. Participant DER Cost and Lost Utility Revenue are not considered in the UCT because the cost of the DER is not a utility cost and any reduced revenues from DER are made-up by non-participating DER customers through the utility’s revenue decoupling mechanism or other means.
3.3 Rate Impact Measure
Cost Test
Perspective Key Question Answered
Calculation Approach
RIM Ratepayer How will utility rates be affected?
Compares utility costs and utility bill reductions with avoided electricity and other supply-side resource costs
The RIM test can address rate impacts to non-participants. External benefits such as Avoided CO2, Avoided SO2 and NOX, and Avoided Water and Land Impacts do not apply to the RIM as they do not directly affect customer rates. Net Avoided Outage Cost benefits accrue to customers but, again, would have no effect on rates. Participant DER Cost does not apply to the RIM because the cost of the DER is not a utility cost. However, any reduced revenues from DER are included as increased costs to other utility customers as Lost Utility Revenue because of revenue decoupling or other means that transfer costs from participants to non-participants.

Page 22
National Grid Benefit-Cost Analysis Handbook
4. BENEFITS AND COSTS METHODOLOGY
Each subsection below aligns with a benefit or cost listed in the BCA Order. Each benefit and cost includes a definition, equation, and general considerations. There are four types of benefits which are further explained in the subsections below:
• Bulk System: Larger system responsible for the generation, transmission and control of electricity that is passed on to the local distribution system.
• Distribution System: System responsible for the local distribution of electricity to end-use consumers.
• Reliability/Resiliency: Efforts made to reduce duration and frequency of outages.
• External: Consideration of social values for incorporation in the SCT.
Additionally, there are four types of costs that are also considered in the BCA Framework and explained in the subsections below. They are:
• Program Administration: Includes the cost of state incentives, measurement and verification, and other program administration costs to start, and maintain a specific program
• Utility-related: Those incurred by the utility such as incremental T&D, DSP, lost revenues, and shareholder incentives
• Participant-related: Those incurred to achieve project or program objectives
• Societal: External costs for incorporation in the SCT In this version of the Handbook, for energy, operational, and reliability-related benefits and costs,32 it is assumed that impacts generate benefits/costs in the same year as the impact. In other words, there is no time delay between impacts and benefits/costs. However, for capacity
32 Energy, operational, and reliability-related benefits and costs include: Avoided , the energy component of Avoided Transmission Losses, Avoided Ancillary Services (Spinning Reserves, and Frequency Regulation), the energy portion of Wholesale Market Price Impact, Avoided O&M, Avoided Distribution Capacity Infrastructure, Error! Reference source not found., Error! Reference source not found., the energy component of Distribution Losses, Net Avoided CO2, Net Avoided SO2 and NOx, Avoided Water Impact, Avoided Land Impact, Net Non-Energy Benefits Related to Utility or Grid Operations, Program Administration Costs, Participant DER Cost, Lost Utility Revenue, Shareholder Incentives, and Net Non-Energy Costs.

Page 23
National Grid Benefit-Cost Analysis Handbook
and infrastructure benefits and costs,33 it is assumed that impacts generate benefits/costs in the following year of the impact. For example, if a project reduces system peak load in 2016, the AGCC benefit would not be realized until 2017.
4.1 Bulk System Benefits
4.1.1 Avoided Generation Capacity Costs
Avoided Generation Capacity Costs are due to reduced coincident system peak demand. This benefit is calculated by NYISO zone, which is the most granular level for which AGCC are currently available.34 It is assumed that the benefit is realized in the year following the peak load reduction impact.
4.1.1.1 Benefit Equation, Variables, and Subscripts
Equation 4-1 presents the benefit equation for AGCC. This equation follows “Variant 1” of the Demand Curve savings estimation described in the 2015 Congestion Assessment and Resource Integration Study (CARIS) Appendix. Each NYISO zone is mapped to one of the four NYISO localities as follows: ROS = A-F, LHV = G-I, NYC = J, LI = K.
Equation 4-1. Avoided Generation Capacity Costs Benefit = ∆PeakLoad , ,1-Loss% , , → *SystemCoincidenceFactor , *DeratingFactor , *AGCCZ,Y,b The indices of the parameters in Equation 4-1 include:
• Z = NYISO zone (A K)
• Y = Year
• b = Bulk System
• r = Retail Delivery or Connection Point
33 Capacity, infrastructure, and market price-related benefits and costs include: Avoided Generation Capacity Costs, or ICAP, including Reserve Margin, the capacity component of Avoided Transmission Losses, Avoided O&M, the capacity component of Distribution Losses, Avoided Transmission Capacity Infrastructure and Related O&M, the capacity portion of the Wholesale Market Price Impact, , Added Ancillary Service Costs, and Incremental Transmission & Distribution and DSP Costs. 34 For a portfolio of projects located within multiple NYISO zones, it may be necessary to calculate weighted average across zones to obtain a benefit value.

Page 24
National Grid Benefit-Cost Analysis Handbook
∆PeakLoadZ,Y,r (∆MW) is the project’s expected maximum demand reduction capability, or “nameplate” impact at the retail delivery or connection point (“r”), by NYISO zone if applicable. This input is project or program specific. A positive value represents a reduction in peak load. % , → (%) is the variable loss percent between bulk system (“b”) and the retail delivery or connection point (“r”). The loss percentages by system level are found in Error! Reference source not found.. , (dimensionless) captures a project’s or program’s contribution to reducing bulk system peak demand relative to its expected maximum demand reduction capability. For example, a nameplate demand reduction capacity of 100 kW with a system coincidence factor of 0.8 would reduce the bulk system peak demand by 80 kW. This input is project specific. , (dimensionless) is presented here as a factor to de-rate the coincident peak load reduction based on the availability of a resource during system peak hours. For example, a demand response program may only be allowed to dispatch a maximum of ten events per year, which could limit the availability of the resource during peak hours. Another example is the variability and intermittence (e.g., due to cloud cover) of a solar array which could limit its contribution to system peak load reduction. This input is project specific. AGCCZ,Y,b ($/MW-yr) represents the annual AGCCs at the bulk system (“b”) based on forecast of capacity prices for the wholesale market provided by DPS Staff. This data can be found in Staff’s ICAP Spreadsheet Model in the “AGCC Annual” tab in the “Avoided GCC at Transmission Level” table. This spreadsheet converts “Generator ICAP Prices” to “Avoided GCC at Transmission Level” based on capacity obligations for the wholesale market. Note that the AGCC values provided in this spreadsheet are in the units of $/kW-mo, which must be converted to $/MW-yr to match the peak load impact in MW. To convert units, the summer and winter $/kW-mo values are multiplied by six months each and added together, and then multiplied by 1,000 to convert to $/MW-yr. AGCC costs are calculated based on the NYISO’s capacity market demand curves, using supply and demand by NYISO zone, Minimum Locational Capacity Requirements (LCR), and the Reserve Margin.
4.1.1.2 General Considerations
The AGCC forecast provided by DPS Staff is based on capacity market demand curves using the demand forecasts and available supply from NYISO’s Load & Capacity Data report. CARIS can be used for guidance on how demand curves are applied to the AGCC forecast.35 The 35 2015 CARIS Phase 1 Study Appendix, available at http://www.nyiso.com/public/webdocs/markets_operations/services/planning/Planning_Studies/Economic_Planning_Studies_(CARIS)/CARIS_Final_Reports/2015_CARIS_Final_Appendices_FINAL.pdf.

Page 25
National Grid Benefit-Cost Analysis Handbook
Reserve Margin is determined annually by New York State Reliability Council. Minimum LCR, set by the NYISO, are applicable to several localities (NYC, LI, “G-J” Regions) and account for transmission losses. See NYISO Installed Capacity Manual36 for more details on ICAP. AGCC benefits are calculated using a static forecast of AGCC prices provided by DPS Staff. Any wholesale market capacity price suppression effects are not accounted for here and instead are captured in Wholesale Price Impacts, described in Section 4.1.6. Impacts from a measure, project, or portfolio must be coincident with the system peak and accounted for losses prior to applying the AGCC valuation parameter. The “nameplate” impact (i.e., ∆ , , ) should also be multiplied by a coincidence factor and derating factor to properly match the planning impact to the system peak. The coincident factor quantifies a project’s contribution to system peak relative to its nameplate impact. It is also important to consider the persistence of impacts in future years after a project’s implementation. For example, participation in a demand response program may change over time. Also, a peak load reduction impact will not be realized as a monetized AGCC benefit until the year following the peak load reduction, as capacity requirements are set by annual peak demand and paid for in the following year. The AGCC values provided in DPS Staff’s ICAP Spreadsheet Model account for the value of transmission losses and infrastructure upgrades. In instances where projects change the transmission topology, incremental infrastructure and loss benefits not captured in the AGCC values should be modeled and quantified in the Avoided T&D Losses and Avoided T&D Infrastructure benefits, below.
4.1.2 Avoided LBMPs
Avoided LBMP is avoided energy purchased at the LBMP. The three components of the LBMP (i.e., energy, congestion, and losses) are all included in this benefit. See Section 2.1.2.2 for details on how the methodology avoids double counting between this benefit and others.
4.1.2.1 Benefit Equation, Variables, and Subscripts
Equation 4-2 presents the benefit equation for Avoided LBMP:
36 NYISO Installed Capacity Manual, available at http://www.nyiso.com/public/webdocs/markets_operations/documents/Manuals_and_Guides/Manuals/Operations/icap_mnl.pdf.

Page 26
National Grid Benefit-Cost Analysis Handbook
Equation 4-2. Avoided LBMP Benefit = ∆Energy , , ,1 − Loss% , →P *LBMPZ,P,Y,bZ
The indices of the parameters in Equation 4-2 include:
• Z = zone (A K)
• P = period (e.g., year, season, month, and hour)
• Y = Year
• b = Bulk System
• r = Retail Delivery or Connection Point ∆EnergyZ,P,Y,r (∆MWh) is the difference in energy purchased at the retail delivery or connection point (“r”) before and after project implementation, by NYISO zone and by year and by time-differentiated periods, for example, annual, seasonal, monthly, or hourly as appropriate. This parameter represents the energy impact at the project location and is not yet grossed up to the LBMP location based on the losses between those two points on the system. This adjustment is performed based on the % , → parameter. This input is project- or program-specific. A positive value represents a reduction in energy. % , → (%) is the variable loss percent between bulk system (“b”) and the retail delivery or connection point (“r”). The loss percentages by system level are found in Error! Reference source not found.. LBMPZ,P,Y,b ($/MWh) is the Locational Based Marginal Price, which is the sum of energy, congestion, and losses components by NYISO zone at the bulk system level (“b”). The NYISO forecasts 20-year annual and hourly LBMPs by zone. To determine time-differentiated LBMPs, for example, annual, seasonal, monthly, or hourly, leverage NYISO’s hourly LBMP forecast by zone rather than developing an alternative forecast of time-differentiated LBMPs based on shaping annual averages by zone from historical data. The NYISO hourly LBMP forecast is a direct output from the CARIS Phase 2 modeling. To extend the LBMP forecast beyond the CARIS planning period, if necessary, assume that the last year of the LBMPs stay constant in real (inflation adjusted) $/MWh.
4.1.2.2 General Considerations
Avoided LBMP benefits are calculated using a static forecast of LBMP. Any wholesale market price changes as a result of the project or program are not accounted for in this benefit, and are instead captured in Wholesale Market Price Impacts, described in Section 4.1.6.

Page 27
National Grid Benefit-Cost Analysis Handbook
The time differential for subscript P (period) will depend on the type of project, and could be season, month, day, hour, or any other interval. The user must ensure that the time-differentiation is appropriate for the project being analyzed. For example, it may be appropriate to use an annual average price and impact for a DER that has a consistent load reduction at all hours of the year. However, using the annual average may not be appropriate for energy storage which may be charging during non-peak hours and discharging during peak hours. In that case, it may be appropriate to multiply an average on-peak (or super-peak) and off-peak LBMP by the on-peak (or super-peak) and off-peak energy impacts, respectively. It is important to consider the trend (i.e., system degradation) of impacts in future years after a project’s implementation. For example, a solar PV system’s output may decline over time. It is assumed that the benefit is realized in the year of the energy impact.
4.1.3 Avoided Transmission Capacity Infrastructure and Related O&M
Avoided Transmission Capacity Infrastructure and Related O&M benefits result from location-specific load reductions that are valued at the marginal cost of equipment that is avoided or deferred by a DER project or program. A portion of Avoided Transmission Capacity is already captured in the congestion charge of the LBMP and the AGCC prices. Because static forecasts of LBMPs and AGCC values are used, this benefit will be quantified only in cases where a measure, project, or portfolio alters the planned transmission system investments from that level embedded in those static forecasts.
4.1.3.1 Benefit Equation, Variables, and Subscripts
Equation 4-3 presents the benefit equation for Avoided Transmission Capacity Infrastructure and Related O&M:
Equation 4-3. Avoided Transmission Capacity Infrastructure and Related O&M Benefit = ∆PeakLoad ,Loss% , → *TransCoincidentFactorC,Y*DeratingFactor *MarginalTransCostC,Y,b The indices37 of the parameters in Equation 4-3 include:
• C = constraint on an element of transmission system38
• Y = Year
37 In future versions of the Handbook, additional indices such as time period and voltage level can be included as this data becomes available. 38 If system-wide marginal costs are used, this is not an applicable subscript.

Page 28
National Grid Benefit-Cost Analysis Handbook
• b = Bulk System
• r = Retail Delivery or Connection Point ∆ , (∆MW) is the project’s expected maximum demand reduction capability, or “nameplate” impact at the retail delivery or connection point (“r”). This input is project specific. A positive value represents a reduction in peak load. % , → (%) is the variable loss percent between the bulk system (“b”) and the retail delivery point (“r”). Thus, this reflects the sum of the T&D system loss percent values, both found in Error! Reference source not found.. TransCoincidentFactorC,Y (dimensionless) quantifies a project’s contribution to reducing transmission system peak demand relative to its expected maximum demand reduction capability. For example, an expected maximum demand reduction capability of 100 kW with a coincidence factor of 0.8 will reduce the transmission system peak by 80 kW (without considering ). This input is project specific.
(dimensionless) is presented here as a generic factor to de-rate the transmission system coincident peak load based on the availability of the load during peak hours. For example, a demand response program may only be allowed to dispatch a maximum of ten events per year, which could limit the availability of the resource during peak hours. Another example is the variability and intermittence (e.g., due to cloud cover) of a solar array which could limit its contribution to peak load reduction on the transmission system. This input is project specific. MarginalTransCostC,Y,b ($/MW-yr) is the marginal cost of the transmission equipment from which the load is being relieved. It is assumed that the marginal cost of service is based on the bulk system (“b”). If the available marginal cost of service value is based on a different basis, then this parameter must first be converted to represent load at the bulk system prior to using in the equation above. Localized or equipment-specific marginal costs of service should be used in most cases. In some limited circumstances use of the system average marginal cost has been accepted, for example, for evaluation of energy efficiency programs. System average marginal cost of service values are provided in Table A-3.
4.1.3.2 General Considerations
In order to find the impact of the measure, project, or portfolio on the transmission system peak load, the “nameplate” capability or load impact must be multiplied by the transmission system coincidence factor and derating factor. Coincidence factors and derating factors would need to be determined by a project-specific engineering study.
Page 29
National Grid Benefit-Cost Analysis Handbook
Some transmission capacity costs are already embedded in both LBMP and AGCC. Both the AGCC and transmission congestion charges could be decreased in the event that additional transmission assets are built or load is reduced. To the extent that deferred or avoided transmission upgrades are incremental to the value captured in LBMP and AGCC and can be modeled or calculated, these benefits would be reported in this benefit. This value would need to be project-specific based on the specific deferral and/or change to the system topology rather than through generic utility marginal cost of service studies. Using system average marginal costs to estimate avoided transmission and infrastructure need may result in significant over- or under-valuation of the benefits or costs and may result in no savings in utility costs for customers. The use of project-specific values helps ensure that the calculated impact is applicable to the specific impact of the project both on a temporal and locational basis, adjusting for losses (i.e., locational alignment) and coincidence with the transmission peak (i.e., temporal alignment). In other words, the load reduction ultimately used to value this benefit must be coincident with the load on the relieved equipment. It is important to distinguish between system and local constraints in order to match the impact with the avoided cost. It is assumed that the marginal cost of service is based on the load at the bulk system. If the available marginal cost of service value is based on a different location in the system (e.g., interface between transmission and distribution), then this parameter must first be converted to represent load at the bulk system prior to using in the equation above. Avoided transmission infrastructure cost benefits are realized only if the project improves load profiles that would otherwise create a need for incremental infrastructure. Benefits are only accrued when a transmission constraint is relieved due to coincident peak load reduction from DER. Under constrained conditions, it is assumed that a peak load reduction impact will produce benefits in the following year as the impact. Once the peak load reduction is less than that necessary to avoid or defer the transmission investment and infrastructure must be built, or the constraint is relieved, this benefit would not be realized from that point forward. The marginal cost of transmission capacity values provided in Error! Reference source not found. include both capital and operation and maintenance (O&M), and cannot be split between the two benefits. Therefore care should be taken to avoid double counting of any O&M values included in this benefit and in the Avoided O&M benefit described in Section 4.2.2.
4.1.4 Avoided Transmission Losses
Avoided Transmission Losses is the benefit that is realized when a project changes the topology of the transmission system and results in a change to the transmission system loss percent. Reductions in end-use consumption and demand that result in reduced losses are included in Avoided LBMP and Avoided Generation Capacity benefits as described above in Sections 4.1.2 and 4.1.1. In actuality, both the LBMP and AGCC would adjust to a change in
Page 30
National Grid Benefit-Cost Analysis Handbook
system losses in future years; however, the static forecast used in this methodology does not capture these effects.
4.1.4.1 Benefit Equation, Variables, and Subscripts
Equation 4-4 presents the benefit equation for Avoided Transmission Losses:
Equation 4-4. Avoided Transmission Losses
Benefit = SystemEnergy , , ∗ LBMPZ,Y+1,b ∗ ∆Loss%Z,Y+1,b→i + SystemDemand , ,∗ AGCCZ,Y,b ∗ ∆Loss%Z,Y,b→i
Where, ∆Loss%Z,Y,b→i = Loss% , , → , − Loss% , , → ,
The indices39 of the parameters in Equation 4-4 include:
• Z = NYISO zone (for LBMP: A K; for AGCC: NYC, LHV, LI, ROS40)
• Y = Year
• b = Bulk System
• i = Interface of the transmission and distribution systems SystemEnergyZ,Y+1,b (MWh) is the annual energy forecast by the NYISO in the Load & Capacity Report at the bulk system (“b”), which includes T&D losses. Note that total system energy is used for this input, not the project-specific energy, because this benefit is only included in the BCA when the system topology is changed resulting in a change in the transmission loss percent, which affects all load in the relevant area. LBMPZ,Y+1,b($/MWh) is the LBMP, which is the sum of energy, congestion, and losses components by NYISO zone at the bulk system level (“b”). To determine time-differentiated LBMPs, for example, annual, seasonal, monthly, or hourly, leverage NYISO’s hourly LBMP forecast by zone rather than developing an alternative forecast of time-differentiated LBMPs based on shaping annual averages by zone from historical data. The NYISO hourly LBMP forecast is a direct output from the CARIS Phase 2 modeling. To extend the LBMP forecast
39 In future versions of the Handbook, additional indices such as time period and voltage level can be included as this data becomes available. 40 Mapping NYISO localities to NYISO zones: ROS = A-F, LHV = G-I, NYC = J, LI = K.

Page 31
National Grid Benefit-Cost Analysis Handbook
beyond the CARIS planning period, if necessary, assume that the last year of the LBMPs stay constant in real (inflation adjusted) $/MWh. SystemDemandZ,Y,b (MW) is the system peak demand forecast by the NYISO at the bulk system level (“b”), which includes T&D losses by zone. Note that the system demand is used in this evaluation, not the project-specific demand, because this benefit is only quantified when the system topology is changed resulting in a change in transmission losses percent, which affects all load in the relevant zone. AGCCZ,Y,b($/MW-yr) represents the annual AGCCs based on forecast of capacity prices for the wholesale market provided by DPS Staff. This data can be found in DPS Staff’s ICAP Spreadsheet Model in the “AGCC Annual” tab in the “Avoided GCC at Transmission Level” table. This spreadsheet converts “Generator ICAP Prices” to “Avoided GCC at Transmission Level”41 based on capacity obligations at the forecast of capacity prices for the wholesale market. Note that the AGCC values provided in this spreadsheet are in the units of $/kW-mo, which must be converted to $/MW-yr to match the peak load impact in MW. To convert units, the summer and winter $/kW-mo values are multiplied by six months each and added together, and then multiplied by 1,000 to convert to $/MW-yr. ∆Loss%Z,Y,b→i (∆%) is the change in fixed and variable loss percent between the bulk system (“b”) and the interface of the T&D systems (“i”) resulting from a project that changes the topology of the transmission system. This value would typically be determined in a project-specific engineering study. Two parameters are provided in the equations above: one with a “Y” subscript to represent the current year, and one with a “Y+1” subscript to represent the following year. % , , → , (%) is the baseline fixed and variable loss percent between bulk system (“b”) and the interface of the T&D (“i”). Thus, this reflects the sub-transmission and internal transmission losses pre-project, which is found in Error! Reference source not found.. % , , → , (%) is the post-project fixed and variable loss percent between bulk system
(“b”) and the interface of the T&D systems (“i”). Thus, this reflects the sub-transmission and internal transmission losses post-project.
4.1.4.2 General Considerations
Transmission losses are already embedded in the LBMP. This benefit is incremental to what is included in LBMP and is only quantified when the transmission loss percent is changed (e.g.,
41 “Transmission level” represents the bulk system level (“b”).

Page 32
National Grid Benefit-Cost Analysis Handbook
from 3% to 2.9%). For most projects, this benefit will be zero unless an engineering study determines otherwise. The energy and demand impacts are based on system-wide energy and demand, not project-specific, because this benefit is only quantified when the losses percentage is changed which affects all customers in the affected area. Transmission losses will not affect downstream distribution losses. It is assumed that the LBMP component of the avoided losses benefit is accrued in the same year as the impact, and the AGCC component of the benefit is accrued in the following year of the benefit. This is reflected in the equation above with “Y” and “Y+1” subscripts to indicate the timing of the benefits relative to the impacts.
4.1.5 Avoided Ancillary Services (Spinning Reserves, and Frequency Regulation)
Avoided Ancillary Services benefits may accrue to selected DERs that are willing and qualify to provide ancillary services to the NYISO. The NYISO could purchase ancillary services from these DERs in lieu of conventional generators at a lower cost without sacrificing reliability. This benefit will only be quantified in cases where a measure, project, or portfolio is qualified to, or has the ability and willingness to provide ancillary services to the NYISO. This value will be zero for nearly all cases and by exception would a value be included as part of the UCT and RIM. DER causes a reduction in load but will not directly result in a reduction in NYISO requirements for regulation and reserves since these requirements are not based on existing load levels but instead are based on available generating resource characteristics. Regulation requirements are periodically set by the NYISO to maintain frequency and reserve requirements are set to cover the loss of the largest supply element(s) on the bulk power system. Some DERs may have the potential to provide a new distribution-level ancillary service such as the voltage support and power quality. However, it is uncertain whether such attributes can be cost-effectively provided by dispersed DERs. The infrastructure costs required to monitor the applicable system conditions (voltage, flicker, etc.) and individual DERs as well as the operations and communications system to communicate with and effectively dispatch those DER attributes are also uncertain. It is premature to include any value in the BCA for such services unless and until the utilities can cost-effectively build the systems to monitor and dispatch DERs to capture net distribution benefits.
4.1.5.1 Benefit Equation, Variables, and Subscripts
The benefits of each of two ancillary services (spinning reserves and frequency regulation) are described in the equations below. The quantification and inclusion of this benefit is project specific.

Page 33
National Grid Benefit-Cost Analysis Handbook
Frequency Regulation Equation 4-5 presents the benefit equation for frequency regulation:
Equation 4-5. Frequency Regulation Benefit =Capacity ∗ n ∗ (CapPrice + MovePrice ∗ RMM ) The indices of the parameters in Equation 4-5 include:
• Y = Year (MW) is the amount of annual average frequency regulation capacity when provided to the NYISO by the project. The amount is difficult to forecast. n (hr) is the number of hours in a year that the resource is expected to provide the service.
($/MW·hr) is the average hourly frequency regulation capacity price. The default value is the two-year historical average for day-ahead regulation capacity prices from the NYISO.
($/∆MW): is the average hourly frequency regulation movement price. The default value is the two-year historical average for real-time dispatch of regulation movement prices from the NYISO.
(∆MW/MW·hr): is the Regulation Movement Multiplier (RMM) used for regulation bids and accounts for the ratio between movement and capacity. It is assumed to be 13 ∆MW/MW-hr. Spinning Reserves Equation 4-6 presents the benefit equation for spinning reserves:
Equation 4-6. Spinning Reserves Benefit =Capacity *n*CapPrice The indices of the parameters in Equation 4-6 include:
• Y = Year (MW) is the change in the amount of annual average spinning reserve capacity when provided to the NYISO by the project. The amount is difficult to forecast.

Page 34
National Grid Benefit-Cost Analysis Handbook
n (hr): is the number of hours in a year that the resource is expected to provide the service.
($/MW·hr) is the average hourly spinning reserve capacity price. Default value uses the two-year historical average spinning reserve pricing by region.
4.1.5.2 General Considerations
There are no reductions in annual average frequency regulation, and spinning reserve, because those are set by the NYISO independent of load levels and DER penetration. The NYISO in late 2015 changed the number of regions for Ancillary Services from two to three and two-year historical data is not available for all three regions. Thus, assume that EAST and SENY are equal to the historical data for EAST. The corresponding NYISO zones for EAST are F – K, and the corresponding zones for WEST are A – E. The average hourly prices for frequency regulation capacity, frequency regulation movement, and spinning reserve capacity can be calculated from historical pricing data posted by the NYISO. The recommended basis is a historical average of interval pricing over the prior two-year period. To avoid the complication of the change in regions, the two-year historical average is based on November 1, 2013 through October 31, 2015. The NYISO Ancillary Services Manual suggests that the day-ahead market is the predominant market for regulation capacity and spinning reserves; regulation movement is only available in real time. The RMM is fixed by the NYISO at a value of 13 ∆MW/MW per hour. While the NYISO does not publish historical interval volume data to calculate actual movement, this value can be considered a reasonable proxy for actual movement.
4.1.6 Wholesale Market Price Impact
Wholesale Market Price Impact includes the benefit from reduced wholesale market prices on both energy (i.e., LBMP) and capacity (i.e., AGCC) due to a measure, project, or portfolio. LBMP impacts will be provided by DPS Staff and are determined using the first year of the most recent CARIS database to calculate the static impact on wholesale LBMP of a 1% change in the level of load that must be met.42 LBMP impact will be calculated for each NYISO zone. AGCC price impacts are characterized using DPS Staff’s ICAP Spreadsheet Model.
42 BCA Order, Appendix C, pg. 8.

Page 35
National Grid Benefit-Cost Analysis Handbook
4.1.6.1 Benefit Equation, Variables, and Subscripts
Equation 4-7 presents the benefit equation for Wholesale Market Price Impact:
Equation 4-7. Wholesale Market Price Impact Benefit = (1-Hedging% )*(∆LBMPImpactZ,Y+1,b ∗ ∆Energy , ,1 − Loss% , →+ ∆AGCCZ,Y,b*ProjectedAvailableCapacityZ,Y,b) The indices of the parameters in Equation 4-7 include:
• Z = NYISO zone (A K43)
• Y = Year
• b = Bulk System %(%) is the fraction of energy or capacity hedged via fixed price or multi-year agreements or other mechanisms. Price hedging via long-term purchase contracts should be considered when assessing wholesale market price impacts. The JU have generally assumed that the percent of purchases hedged is 50% and equal for both energy and capacity. ∆LBMPImpactZ,Y+1,b (∆$/MWh) is the change in average annual LBMP at the bulk system (“b”) before and after the project(s); requires wholesale market modeling to determine impact. This will be provided by DPS Staff. ∆ , , (∆MWh) is the change in energy purchased at the retail delivery or connection point (“r”) as a result of the project. This parameter considers the energy impact at the project location, which is then grossed up to the bulk system level based on the % , → parameter. A positive value represents a reduction in energy. % , → (%) is the variable loss percent from the bulk system level (“b”) to the retail delivery or connection point (“r”). These values can be found in Error! Reference source not found.. WholesaleEnergyZ,Y,b (MWh) is the total annual wholesale market energy purchased by zone at the bulk system level (“b”). This must represent the energy at the LBMP. ∆AGCCZ,Y,b (∆$/MW-yr) is the change in AGCC price by ICAP zone calculated from DPS Staff’s ICAP Spreadsheet Model before and after the project is implemented. This value is determined based on the difference in zonal prices in DPS Staff’s ICAP Spreadsheet Model, “AGCC
43 Mapping NYISO localities to NYISO zones: ROS = A-F, LHV = G-I, NYC = J, LI = K.

Page 36
National Grid Benefit-Cost Analysis Handbook
Annual” tab, based on a change in the supply or demand forecast (i.e., “Supply” tab and “Demand” tab, respectively) due to the project.44 The price impacts are based on the size and location of the project. A positive value represents a reduction in price. ProjectedAvailableCapacityZ,Y,b(MW) is the projected available supply capacity by ICAP zone at the bulk system level (“b”) based on Staff’s ICAP Spreadsheet Model, “Supply” tab, which is the baseline before the project is implemented.
4.1.6.2 General Considerations
Wholesale market price impacts or demand reduction induced price effects are project specific based on the size and shape of the demand reduction. LBMP market price impacts will be provided by DPS Staff and will be determined using the first year of the most recent CARIS database to calculate the static impact on LBMP of a 1% change in the level of load that must be met in the utility area where the DER is located. These impacts must be considered in the benefit calculation once available. The capacity market price impacts can be calculated using DPS Staff’s ICAP Spreadsheet Model. The resultant price effects are not included in SCT, but would be included in RIM and UCT as part of a sensitivity analysis. It is assumed that Wholesale Market Price Impacts do not result in benefits for more than one year, as these markets will respond quickly to the reduced demand, quickly reducing the benefit.45 It is also assumed that the capacity portion of Wholesale Market Price Impacts will produce benefits in the year following the impact, and the energy portion of Wholesale Market Price Impacts will produce benefits in the same year as the impact.
4.2 Distribution System Benefits
4.2.1 Avoided Distribution Capacity Infrastructure
Avoided Distribution Capacity Infrastructure benefit results from location-specific distribution load reductions that are valued at the marginal cost of distribution system infrastructure that is avoided or deferred by a DER project or program. The load reduction impact must be coincident with the distribution equipment peak or otherwise defer or avoid the need for incremental
44 As in the AGCC benefit equation, System Coincidence Factors and Derating Factors adjust the maximum load reduction of the project. 45 The one year assumption is based on an overview of price suppression provided in the New England Avoided Cost Study 2015 (Hornby et al., “Avoided Energy Supply Costs in New England: 2015 Report,” prepared for the Avoided-Energy-Supply-Component (AESC) Study Group March 27, 2015 and revised April 3, 2015).

Page 37
National Grid Benefit-Cost Analysis Handbook
distribution infrastructure based on the characteristics of the specific load and the design criteria of the specific equipment that serves it.
4.2.1.1 Benefit Equation, Variables, and Subscripts
Equation 4-8 presents the benefit equation for Avoided Distribution Capacity Infrastructure:
Equation 4-8. Avoided Distribution Capacity Infrastructure Benefit = ∆PeakLoad ,1 − Loss% , → *DistCoincidentFactorC,V,Y*DeratingFactor *MarginalDistCostC,V,Y,bCV The indices of the parameters in Equation 4-8 include:
• C = Constraint on an element (e.g., pole-mounted transformer, distribution line, etc.) of the distribution system46
• V = Voltage level (e.g., primary, and secondary)
• Y = Year
• b = Bulk System
• r = Retail Delivery or Connection Point ∆PeakLoadY,r (∆MW) is the nameplate demand reduction of the project at the retail delivery or connection point (“r”). This input is project specific. A positive value represents a reduction in peak load. % , → (%) is the variable loss percent between the bulk system (“b”) and the retail delivery point (“r”). Thus, this reflects the sum of the T&D system loss percent values, both found in Error! Reference source not found.. This parameter to used to adjust the ∆PeakLoadY,r parameter to the bulk system level. DistCoincidentFactorC,V,Y (dimensionless) captures the contribution to the distribution element’s peak relative to the project’s nameplate demand reduction. For example, a nameplate demand reduction of 100 kW on the distribution feeder with a coincidence factor of 0.8 would contribute an 80 kW reduction to peak load on an element of the distribution system. This input is project specific. (dimensionless) is presented here as a generic factor to de-rate the distribution coincident peak load based on the availability of the load during peak hours. For
46 In limited cases where use of system-wide marginal cost values is required, this subscript is not applicable.

Page 38
National Grid Benefit-Cost Analysis Handbook
example, a demand response program may only be allowed to dispatch a maximum of ten (10) events per year, which could limit the availability of the resource during peak hours. Another example is the variability and intermittence (e.g., due to cloud cover) of a solar array which could limit its peak load reduction contribution on an element of the distribution system. This input is project specific. MarginalDistCostC,V,Y,b ($/MW-yr) is the marginal cost of the distribution equipment from which the load is being relieved. It is assumed that the marginal cost of service is based on the bulk system (“b”). If the available marginal cost of service value is based on a different basis, then this parameter must first be converted to represent load at the bulk system prior to using in the equation above. Localized or equipment-specific marginal costs of service should be used in most cases. In some limited circumstances use of the system average marginal cost has been accepted, for example, for evaluation of energy efficiency programs. System average marginal cost of service values are provided in Error! Reference source not found..
4.2.1.2 General Considerations
Project- and location- specific avoided distribution costs and deferral values should be used when and wherever possible. Using system average marginal costs to estimate avoided T&D infrastructure need may result in significant over- or under-valuation of the benefits or costs, and may result in no savings in utility costs for customers. Coincidence and derating factors would be determined by a project-specific engineering study. Avoided distribution infrastructure benefits for a specific location are realized only if a DER project or portfolio of DER projects meets the engineering requirements for functional equivalence (i.e., DER reliably reduces coincident load to a level that allows the deferral or avoidance of the distribution project. The DSIP identifies specific areas where a distribution upgrade need exists and where DERs could potentially provide this benefit. Use of system average avoided cost assumptions may be required in some situations, such as system-wide programs or tariffs. These values are provided in Error! Reference source not found.. The timing of benefits realized from peak load reductions is project and/ or program specific. It is assumed that a peak load reduction impact will produce benefits in the year of the impact. Once the peak load reduction is no longer enough to avoid or defer investment and infrastructure must be built, the constraint is relieved and benefits should not be realized from that point forward. The marginal cost of distribution capacity values provided in Error! Reference source not found. includes both capital and O&M, and cannot be split between the two benefits. Therefore, whenever these system average values are used, care should be taken to avoid double
Page 39
National Grid Benefit-Cost Analysis Handbook
counting of any O&M values included in this benefit and in the Avoided O&M benefit described in Section 4.2.2.
4.2.2 Avoided O&M
Avoided O&M includes any benefits incremental to the value captured in the Avoided Distribution Capacity Infrastructure benefit (Section 4.2.1). As discussed above, marginal cost studies include O&M and that O&M is not separately included in this benefit. Therefore, this benefit includes reduced expenses not tied to avoided or deferred distribution system investment from DER. This benefit may capture O&M savings from investments to improve customer service that reduces phone calls to the call center or O&M savings from migrating toward advanced meter functionality reducing meter reading costs. At this time, for most DER projects this benefit will be zero. For example, DER may reduce equipment loading, which reduces failure rates, but somewhat higher equipment loading may have led to the installation of new equipment with lower O&M costs. Further analysis is required to understand how DER would impact O&M.
4.2.2.1 Benefit Equation, Variables, and Subscripts
Equation 4-9 presents the benefit equation for Avoided O&M Costs:
Equation 4-9. Avoided O&M Benefit = ∆ExpensesAT,Y The indices of the parameters in Equation 4-9 include:
• AT = activity type (e.g., line crews to replace equipment, engineering review of DER interconnection applications, responding to calls received at call centers)
• Y = Year ∆ExpensesAT,Y (∆$): Change in O&M expenses due to a project, including an appropriate allocation of administrative and common costs. These costs would increase by inflation, where appropriate.
4.2.2.2 General Considerations
Distribution O&M benefits from DERs may be limited to instances where DERs can avoid or defer new distribution equipment, which is already captured in the Avoided Distribution Capacity Infrastructure benefit (Section 4.2.1), where the O&M costs are embedded in the marginal cost of service values. DER interconnections could increase O&M costs, while lower equipment

Page 40
National Grid Benefit-Cost Analysis Handbook
failure rates could decrease these costs. In general, these impacts are difficult to quantify for DER investments and may be zero for most cases. Avoided O&M benefits would be quantifiable for some non-DER investments, such as utility investments in DSP capabilities. For example, a utility investment in advanced metering functionality may avoid truck rolls and other costs by collecting meter data remotely. Labor and crew rates can be sourced using the utility’s activity-based costing system or work management system, if that information is available.
4.2.3 Distribution Losses
Avoided Distribution Losses are the incremental benefit that is realized when a project changes distribution system losses, resulting in changes to both annual energy use and peak demand. Distribution losses are already accounted for in the LBMP and AGCC when grossing impacts at the project location to the price locations. Because static forecasts of LBMPs and AGCC are used, this benefit will be quantified only in cases where a measure, project, or portfolio alters the distribution system losses percentage (e.g., from 3% to 2.9%).
4.2.3.1 Benefit Equation, Variables, and Subscripts
Equation 4-10 presents the benefit equation for Avoided Distribution Losses:
Equation 4-10. Avoided Distribution Losses
Benefit = SystemEnergy , , *LBMPZ,Y+1,b*∆Loss%Z,Y+1,i→r+ SystemDemand , , *AGCCZ,Y,b*∆Loss%Z,Y,i→r
Where, ∆Loss%Z,Y,i→r = Loss% , , → , − Loss% , , → ,
The indices47 of the parameters in Equation 4-10 include:
• Z = NYISO zone (for LBMP: A K; for AGCC: NYC, LHV, LI, ROS48)
• Y = Year
47 In future versions of the Handbook, additional indices such as time period and voltage level can be included as this data becomes available. 48 Mapping NYISO localities to NYISO zones: ROS = A-F, LHV = G-I, NYC = J, LI = K.

Page 41
National Grid Benefit-Cost Analysis Handbook
• i = Interface Between T&D Systems
• b = Bulk System
• r = Retail Delivery or Connection Point SystemEnergyZ,Y,b (MWh) is the system energy purchased in the relevant area of the distribution system (i.e., the portion of the system where losses were impacted by the project) at the retail location by zone. Note that the system energy is used here, not the project-specific energy, because this benefit is only quantified when the distribution loss percent value is changed, which affects all load in the relevant part of the distribution system. LBMPZ,Y,b($/MWh) is the LBMP, which is the sum of energy, congestion, and losses components by NYISO zone at the bulk system level (“b”). To determine time-differentiated LBMPs, for example, annual, seasonal, monthly, or hourly, leverage NYISO’s hourly LBMP forecast by zone rather than developing an alternative forecast of time-differentiated LBMPs based on shaping annual averages by zone from historical data. The NYISO hourly LBMP forecast is a direct output from the CARIS Phase 2 modeling. To extend the LBMP forecast beyond the CARIS planning period, if necessary, assume that the last year of the LBMPs stay constant in real (inflation adjusted) $/MWh. SystemDemandZ,Y,b (MW) is the system peak demand for the portion of the retail location on the distribution system(s) (i.e., the portion of the system where losses are impacted by the project) for the relevant NYISO capacity zone. This parameter is grossed up to the bulk system level (i.e., location of the AGCC) based on the Loss% , → parameter. Note that the system demand is used in this evaluation, not the project-specific demand, because this benefit is only quantified when the system topology is changed resulting in a change in distribution loss percent, which affects all load in the relevant part of the distribution system. AGCCZ,Y,b($/MW-yr) represents the annual AGCCs at the bulk system level (“b”) based on forecast of capacity prices for the wholesale market provided by DPS Staff. This data can be found in DPS Staff’s ICAP Spreadsheet Model in the “AGCC Annual” tab in the “Avoided GCC at Transmission Level” table. This spreadsheet converts “Generator ICAP Prices” to “Avoided GCC at Transmission Level” based on capacity obligations at the forecast of capacity prices for the wholesale market. Note that the AGCC values provided in this spreadsheet are in the units of $/kW-mo, which must be converted to $/MW-yr to match the peak load impact in MW. To convert units, the summer and winter $/kW-mo values are multiplied by six months each and added together, and then multiplied by 1,000 to convert to $/MW-yr. ∆Loss%Z,Y,i→r (∆%) is the change in fixed and variable loss percent between the interface between the T&D systems (“i”) and the retail delivery point (“r”) resulting from a project that changes the topology of the distribution system. This value would typically be determined in a project-specific engineering study. Two parameters are provided in the equations above: one
Page 42
National Grid Benefit-Cost Analysis Handbook
with a “Y” subscript to represent the current year, and one with a “Y+1” subscript to represent the following year. % , , → , (%) is the baseline fixed and variable loss percent between the interface of the T&D systems (“i”) and the retail delivery point (“r”). Thus, this reflects the distribution loss percent pre-project, which is found in Error! Reference source not found.. % , , → , (%) is the post-project fixed and variable loss percent between the interface of
the T&D systems (“i”) and the retail delivery point (“r”).
4.2.3.2 General Considerations
Distribution losses are already accounted for in the LBMP and AGCC when grossing impacts at the project location to the price locations. Because static forecasts of LBMPs and AGCC are used, this benefit will be quantified only in cases where a measure, project, or portfolio alters the distribution system losses percentage (e.g., from 3% to 2.9%). For most projects, this benefit will be zero unless an engineering study determines otherwise. The energy and demand impacts are grossed up from retail impacts to transmission system impacts based on losses in the equations above. Impacts are based on system-wide energy and demand, not project-specific, because this benefit is only quantified when the loss percentage is changed which affects all load in the affected area. Note that distribution losses also affect upstream transmission losses. Because losses data is usually only available on an annual average basis, the energy and demand impacts should be on an annual average basis as well. It is assumed that the LBMP component of the avoided losses benefit is accrued in the same year as the impact, and the AGCC component of the benefit is accrued in the following year of the benefit. This is reflected in the equation above with “Y” and “Y+1” subscripts to indicate the time delay of benefits relative to the impacts.
4.3 Reliability/Resiliency Benefits
4.3.1 Net Avoided Restoration Costs
Avoided Restoration Costs accounts for avoided costs of restoring power during outages. For most DER investments, this benefit will not be quantified, since utilities are required to fix the cause of an outage regardless of whether the DER allows the customer to operate independently of the grid. For some non-DER investments such as automatic feeder switching, distribution automation, and enhanced equipment monitoring, the utility may save time and other expenses dispatching restoration crews as a result of having improved visibility into the type and nature of the fault. Storm hardening and other resiliency investments can reduce the

Page 43
National Grid Benefit-Cost Analysis Handbook
number of outage events, resulting in reduced restoration crew hours. Two methodologies to capture the potential value of specific programs or specific projects are identified below. Use of methodology depends on the type of investment/technology under analysis. Equation 4-11 will generally apply to non-DER investments that allow the utility to save time and other expenses dispatching restoration crews; Equation 4-12 will generally apply to DER investments that are able to provide functionally equivalent reliability as the alternative traditional utility investment.
4.3.1.1 Benefit Equation, Variables, and Subscripts
Equation 4-11 presents the benefit equation for Net Avoided Restoration Costs associated with non-DER investments:
Equation 4-11. Net Avoided Restoration Costs Benefit =−∆CrewTime *CrewCost +∆Expenses Where,∆CrewTime = #Interruptions , ∗ (CAIDI , − CAIDI , ∗ (1 −%ChangeSAIFI )) %ChangeSAIFI = SAIFI , − SAIFI ,SAIFI ,
System Average Interruption Frequency Index (SAIFI), Customer Average Interruption Duration Index (CAIDI), and System Average Interruption Duration Index (SAIDI) values could be utilized at the system level for non-DER projects/programs that are applicable across a total system basis. More targeted data should be substituted for localized, geographically specific projects that exhibit localized impacts. Other reliability metrics will need to be developed to more suitably quantify reliability or resiliency benefits and costs associated with localized projects or programs. Once developed, the localized restoration cost metric will be applied and included in this handbook. There is no subscript to represent the type of outage in Equation 4-11 because it assumes an average restoration crew cost that does not change based on the type of outage. The ability to reduce outages would be dependent on the outage type. ∆ (∆hours/yr) is the change in crew time to restore outages based on an impact on frequency and duration of outages. This data is project and/or program specific. A positive value represents a reduction in crew time.
($/hr) is the average hourly outage restoration crew cost for activities associated with the project under consideration.

Page 44
National Grid Benefit-Cost Analysis Handbook
∆ (∆$) are the average expenses (e.g. equipment replacement) associated with outage restoration. # , (int/yr) are the baseline (i.e., pre-project) number of sustained interruptions per year, excluding major storms. The system-wide five-year average number of interruptions excluding major storms is available from the annual Electric Service Reliability Reports. , (hr/int) is the baseline (i.e., pre-project) Customer Average Interruption Duration Index. It represents the average time to restore service, excluding major storms. The system-wide five-year average CAIDI excluding major storms is available from the annual Electric Service Reliability Reports. Generally, this parameter is a system-wide value. In localized project/program specific cases, it should be representative of the relevant area of the system that the measure, project, or portfolio affects. , (hr/int) is the post-project Customer Average Interruption Duration Index. It
represents the average time to restore service, excluding major storms. Determining this parameter would require development of a distribution level model and a respective engineering study to quantify appropriately. % (∆%) is the percent change in System Average Interruption Frequency Index. It represents the percent change in the average number of times that a customer experiences an outage per year. , (int/cust/yr) is the baseline (i.e., pre-project) System Average Interruption Frequency Index. It represents the average number of times that a customer experiences an outage per year, excluding major storms. The baseline system-wide value is a five-year average and excludes major storms. It is available from the annual Electric Service Reliability Reports. Generally, this parameter is a system-wide value. In localized project/program specific cases, it should be representative of the relevant area of the system that the measure, project, or portfolio affects. , (int/cust/yr) is the post-project System Average Interruption Frequency Index. It
represents the average number of times that a customer experiences an outage per year in the post-project scenario. Determining this parameter would require development of a distribution level model and a respective engineering study to quantify appropriately.
Equation 4-12. Net Avoided Restoration Costs Benefit =MarginalCostR,Y The indices of the parameters in Equation 4-12 are applicable to DER installations and include:
Page 45
National Grid Benefit-Cost Analysis Handbook
• R = Reliability constraint on an element (e.g., pole-mounted transformer, distribution line, etc.) of T&D system
• Y = Year MarginalDistCostR,Y ($/yr): Marginal cost of the reliability investment. This value is very project- and location- and a system average value is not applicable. This benefit only applies for an individual project or portfolio of DER which is able to provide functionally equivalent reliability as compared to the reliability provided by the traditional distribution reliability investment that would have otherwise been installed/built; if the DER does not defer or avoid a traditional reliability investment, this benefit does not apply. When an individual or portfolio of DER is able to defer a distribution reliability investment, the value of the avoided restoration cost is already reflected in the Avoided Distribution Capacity Infrastructure benefit calculation. Care must be taken to avoid double counting.
4.3.1.2 General Considerations
The impact on SAIFI or CAIDI is due to the implementation of the project relative to a baseline, not based on outside factors such as weather. The changes to these parameters should consider the appropriate context of the project, for example, impact to one feeder or impact to a portion of the distribution system. The baseline values should match the portion of the system impacted. In addition, one should consider the types of outage event and how the project may or may not address each type of outage event to inform the magnitude of impact. In addition to being project-specific, the calculation of avoided restoration costs is dependent on projection of the impact of specific investments affecting the facilitation of actual system restoration and the respective costs. It is unrealistic to expect that DER investments will limit or replace the need to repair field damage to the system, and as such, system restoration benefits attributable to DER type investments are unlikely. Application of this benefit would be considered only for investments with validated reliability results.
4.3.2 Net Avoided Outage Costs
Avoided Outage Costs accounts for customer outage costs due to a reduction in frequency and duration of outages, then multiplying that expected change by an estimated outage cost. The quantification of this benefit is highly dependent on the type and size of affected customers.
4.3.2.1 Benefit Equation, Variables, and Subscripts
Equation 4-13 presents the benefit equation for Net Avoided Outage Costs:

Page 46
National Grid Benefit-Cost Analysis Handbook
Equation 4-13. Net Avoided Outage Costs Benefit = ValueOfServiceC,Y,r*AverageDemandC,Y,r*∆SAIDIC Where,
∆SAIDI =SAIFI , ∗ CAIDI , − SAIFI , ∗ CAIDI ,
The indices of the parameters in Equation 4-13 include:
• C = Customer class (e.g., residential, small commercial and industrial (C&I), large C&I) – BCA should use customer-specific values if available.
• Y = Year
• r = Retail Delivery or Connection Point ValueOfServiceC,Y,r ($/kWh) is the value of electricity service to customers, by customer class, in dollars per unserved kWh at the retail delivery point. The value(s) should be determined based on the customers’ willingness to pay for reliability. If location-, customer class- or customer-specific values are not available, these values should default to the retail rate of electricity by customer class. AvgDemandC,Y,r (kW) is the average demand in kW at the retail delivery or connection point (“r”) that would otherwise be interrupted during outages but can remain electrified due to DER equipment and/or utility infrastructure. This would need to be identified by customer class, or by customer, if available. If the timing of outages cannot be predicted, this parameter can be calculated by dividing the annual energy consumption by 8,760 hours per year. ∆ (∆hr/cust/yr): is the change in System Average Interruption Duration Index due to the project. The impact on SAIDI can be determined based on the impact on CAIDI and SAIFI.49 A positive value represents a reduction in SAIDI. , (int/cust/yr) is the post-project System Average Interruption Frequency Index;
represents the average number of times that a customer experiences an outage per year in the post-project case. Determining this parameter would require development of a distribution level model and a respective engineering study to quantify appropriately. , (hr/int) is the post-project Customer Average Interruption Duration Index; represents
the impact of a project on the average time to restore service in the post-project case.
49 SAIDI = SAIFI * CAIDI

Page 47
National Grid Benefit-Cost Analysis Handbook
Determining this parameter would require development of a distribution level model and a respective engineering study to quantify appropriately. , (int/cust/yr) is the baseline (i.e., pre-project) System Average Interruption Frequency Index. It represents the average number of times that a customer experiences an outage per year, excluding major storms. The baseline system-wide value is a five-year average and excludes major storms, and is available from the annual Electric Service Reliability Reports. This parameter is not necessarily a system-wide value. Rather, it should be representative of the relevant area of the system that the measure, project, or portfolio affects. , (hr/int) is the baseline (i.e., pre-project) Customer Average Interruption Duration Index. It represents the impact of a project on the average time to restore service, excluding major storms. The baseline system-wide is a five-year average and excludes major storms, and is available from the annual Electric Service Reliability Reports. This parameter is not necessarily a system-wide value. Rather, it should be representative of the relevant area of the system that the measure, project, or portfolio affects.
4.3.2.2 General Considerations
The value of the avoided outage cost benefit is to be customer-specific, customer class should match or be consolidated properly between the utility and the study area to ensure that the value of reliability matches, what the customer would be willing to pay. For this version of the BCA Handbook, the outage cost can be estimated by assuming that the customer would be willing to pay the same retail rate they pay for electricity, to avoid an outage. The full retail rate value can be found in the utility’s latest tariff by customer class. At this time, the New York State Standardized Interconnection Requirements (NY SIR) do not allow for islanding, and therefore limit this configuration to a DER that meets the needs of a customer during an outage. Therefore, there are limited instances where DER allows the customer to supply local load in a blackout and resulting benefits would then be limited to that load picked up by DER.

Page 48
National Grid Benefit-Cost Analysis Handbook
4.4 External Benefits
4.4.1 Net Avoided CO2
Net Avoided CO2 accounts for avoided CO2 emissions due to a reduction in system load levels50 or an increase in CO2 emissions from onsite generation. The CARIS forecast of LBMP contains a cost of carbon based on the Regional Greenhouse Gas Initiative (RGGI) prices. DPS Staff will provide a $/MWh adder to account for the net marginal damage cost of carbon that is not already captured in the LBMP. This adder is calculated based on the United States Environmental Protection Agency (U.S. EPA) damage cost estimates for a 3% real discount rate, multiplied by a marginal emissions rate to provide a $/MWh value for the full marginal damage cost of CO2. The net marginal damage cost is the full marginal damage cost less the cost of carbon embedded in the LBMP.
4.4.1.1 Benefit Equation, Variables, and Subscripts
Equation 4-14 presents the benefit equation for Net Avoided CO2:
Equation 4-14. Net Avoided CO2 Benefit =CO2Cost∆LBMP − CO2Cost∆OnsiteEmissions
Where, CO2Cost∆LBMP= ∆Energy ,1 − Loss% , → + ∆Energy , + ∆Energy ,∗ NetMarginalDamageCost ∆Energy , = SystemEnergy , ∗ ∆Loss% , → ∆Energy , = SystemEnergy , ∗ ∆Loss%Y,i→r ∆Loss%Z,Y,b→i = Loss% , , → , − Loss% , , → ,
∆Loss%Z,Y,i→r = Loss% , , → , − Loss% , , → ,
CO2Cost∆OnsiteEmissions = ∆OnsiteEnergy ∗ CO2IntensityY*SocialCostCO2
50 The Avoided CO2 benefit considers the change in energy as a result of the project by including the change in energy identified in the Avoided LBMP, Avoided Transmission Losses, and Avoided Distribution Losses benefits.

Page 49
National Grid Benefit-Cost Analysis Handbook
The indices of the parameters in Equation 4-14 include:
• Y = Year
• b = Bulk System
• i = Interface of the T&D Systems
• r = Retail Delivery or Connection Point ∆ ($) is the cost of CO2 due to a change in wholesale energy purchased. A portion of the full CO2 cost is already captured in the Avoided LBMP benefit. The incremental value of CO2 is captured in this benefit, and is valued at the net marginal cost of CO2, as described below. ∆ ($) is the cost of CO2 due to DER that is not emission-free. The cost of carbon for customer-sited emissions is based upon the gross marginal cost of CO2, as described below. ∆ , (∆MWh) is the change in energy purchased at the retail delivery or connection point (“r”) as a result of the project. This parameter considers the energy impact at the project location, which is then grossed up to the bulk system level based on the % → parameter. A positive value represents a reduction in energy. % , → (%) is the variable loss percent from the bulk system level (“b”) to the retail delivery or connection point (“r”). These values can be found in Error! Reference source not found.. ∆ , (∆MWh) represents the change in electricity lost on the transmission system due to the Avoided Transmission Losses benefit. Refer to Section 4.1.4 for more details. In most cases, unless the transmission system loss percent is altered due to a project or portfolio, this parameter will be zero. A positive value represents a reduction in energy lost in transmission system losses. ∆ , (∆MWh) represents the change in energy lost on the distribution system due to the Avoided Distribution Losses benefit. Refer to Section 4.2.3 for more details. In most cases, unless the distribution system loss percent is altered due to a project or portfolio, this parameter will be zero. A positive value represents a reduction in energy lost in distribution system losses.
($/MWh) is the “adder” DPS Staff will provide to account for the full marginal damage cost of carbon that is not already captured in the forecast of LBMP from CARIS. The LBMP forecast from CARIS includes the cost of carbon based on the RGGI, but does include the SCC from the U.S. EPA.

Page 50
National Grid Benefit-Cost Analysis Handbook
∆Loss%Z,Y,b→i (∆%) is the change in fixed and variable loss percent between the interface between the bulk system (“b”) and the interface between the T&D systems (“i”). This represents the change in the transmission system loss factor. This value would typically be determined in a project-specific engineering study. % , , → , (%) is the baseline fixed and variable loss percent between the interface between the bulk system (“b”) and the interface between the T&D systems (“i”). Thus, this reflects the transmission loss percent pre-project, which is found in Error! Reference source not found.. % , , → , (%) is the post-project fixed and variable loss percent between the interface
between the bulk system (“b”) and the interface between the T&Dsystems (“i”). Thus, this reflects the transmission loss percent post-project, which is found in Error! Reference source not found.. ∆Loss%Z,Y,i→r (∆%) is the change in fixed and variable loss percent between the interface between the T&D systems (“i”) and the retail delivery point (“r”) resulting from a project that changes the topology of the distribution system. This represents the change in the distribution system loss factor. This value would typically be determined in a project-specific engineering study. % , , → , (%) is the baseline fixed and variable loss percent between the interface of the T&D systems (“i”) and the retail delivery point (“r”). Thus, this reflects the distribution loss percent pre-project, which is found in Error! Reference source not found.. % , , → , (%) is the post-project fixed and variable loss percent between the interface of
the T&D systems (“i”) and the retail delivery point (“r”). Thus, this reflects the distribution loss percent post-project, which is found in Error! Reference source not found.. ∆ Energy (∆MWh) is the energy produced by customer-sited carbon-emitting generation. CO2IntensityY (metric ton of CO2 / MWh) is the average CO2 emission rate of customer-sited pollutant-emitting generation. This is a project-specific input based on the type of onsite generation. Note that there is a difference between metric tons and short tons.51
($ / metric ton of CO2) is an estimate of the total monetized damages to society associated with an incremental increase in carbon dioxide emissions. Annual values are provided by U.S. EPA, and are also located in Table A of Attachment B of the BCA Order. Per
51 1 metric ton = 1.10231 short tons

Page 51
National Grid Benefit-Cost Analysis Handbook
the BCA Order, the values associated with a 3% real discount rate shall be used. Note that Table A provides values in 2011 dollars; these values must be converted to nominal values prior to using the equation above.
4.4.1.2 General Considerations
The equation above represents two sources of emissions based on: (1) a change in LBMP purchases, which is valued at the $/MWh adder (i.e., parameter above) to be provided by DPS Staff, and (2) customer-sited carbon emissions from onsite generation (e.g., such as combined heat and power [CHP]), which is valued at the social cost of carbon from the U.S. EPA. The energy impact is project-specific and should be linked to the impacts determined in the Avoided LBMP benefit. The LBMP impacts due to the Avoided Transmission Losses and Avoided Distribution Losses benefits also need to be account for when determining the total change in LBMP due to a project. It is assumed that the benefit value due to an impact on emissions is accrued in the same year as the impact. The methodology outlined in this section to value Avoided CO2 may change. The BCA Order indicates “utilities shall rely on the costs to comply with New York’s Clean Energy Standard once those costs are known.”52
4.4.2 Net Avoided SO2 and NOx
Net Avoided SO2 and NOx includes the incremental value of avoided or added emissions. The LBMP already includes the cost of pollutants (i.e., SO2 and NOx) as an “internalized” cost from the Cap & Trade programs. Emitting customer-sited generation <25 MW will be included in this benefit since the generators do not participate in the Cap & Trade programs.
4.4.2.1 Benefit Equation, Variables, and Subscripts
Equation 4-15 presents the benefit equation for Net Avoided SO2 and NOx:
Equation 4-15. Net Avoided SO2 and NOx Benefit = OnsiteEmissionsFlagp ∗ OnsiteEnergy , *PollutantIntensityp,Y*SocialCostPollutantp,Y
52 BCA Order, Appendix C, 16.

Page 52
National Grid Benefit-Cost Analysis Handbook
The indices of the parameters in Equation 4-15 include:
• p = Pollutant (SO2, NOx)
• Y = Year
• r = Retail Delivery or Connection Point
is a binary (i.e., 0 or 1) parameter, where a value of 1 indicates that customer-sited pollutant-emitting generation <25 MW is implemented as a result of the project. Energy , (∆MWh) is the energy produced by customer-sited pollutant-emitting generation. PollutantIntensityp,Y (ton/MWh) is average pollutant emissions rate of customer-sited pollutant-
emitting generation. This is a project-specific input. SocialCostPollutantp,Y ($/ton) is an estimate of the monetized damages to society associated
with an incremental increase in pollutant emissions in a given year. The allowance prices are provided in CARIS Phase 2
4.4.2.2 General Considerations
LBMPs already include the cost of pollutants (i.e., SO2 and NOx) as an “internalized” cost from the Cap & Trade programs. Emitting customer-sited generation <25 MW will be included in this benefit since the generators do not participate in the Cap & Trade programs. This would be a positive benefit to the extent that the DER emits less than NYISO generation and a negative benefit for the DER if it has a higher emissions rate than NYSO generation or emissions - free DER. Two values are provided in CARIS for NOx costs: “Annual NOx” and “Ozone NOx.” Annual NOx prices are used October through May; Ozone NOx prices May through September. The breakdown of energy in these two time periods must be accounted for and applied to the appropriate NOx cost. It is assumed that the benefit value due to an impact on emissions is accrued in the same year as the impact.
4.4.3 Avoided Water Impact
A suggested methodology for determining this benefit is not included in this version of the Handbook. This impact would be assessed qualitatively in the SCT.

Page 53
National Grid Benefit-Cost Analysis Handbook
4.4.4 Avoided Land Impact
A suggested methodology for determining this benefit is not included in this version of the Handbook. This impact would be assessed qualitatively in the SCT.
4.4.5 Net Non-Energy Benefits Related to Utility or Grid Operations
A suggested methodology for determining this benefit is not included in this version of the Handbook. This impact would be assessed qualitatively or if can be estimated quantitatively. It is necessary to identify which cost-effectiveness test should include the specific benefit or cost as it may apply to the SCT, UCT and/or RIM.
4.5 Costs Analysis
4.5.1 Program Administration Costs
Program Administration Costs includes the cost to administer and measure the effect of required program administration performed and funded by utilities or other parties. This may include the cost of incentives, measurement and verification, and other program administration costs to start and maintain a specific program. Payments to program participants to support certain investments, such as tax benefits and rebates, increase non-participant costs.
4.5.1.1 Benefit Equation, Variables, and Subscripts
Equation 4-16 presents the cost equation for Program Administration Costs:
Equation 4-16. Program Administration Costs Cost = ∆ProgramAdminCostM,YM The indices of the parameters in Equation 4-16 include:
• M = Measure
• Y = Year ∆ProgramAdminCostM,Y is the change in Program Administration Costs, which may include one-time or annual incentives such as rebates, program administration costs, measurement and verification, state incentives, and other costs.
Page 54
National Grid Benefit-Cost Analysis Handbook
4.5.1.2 General Considerations
Program Administration Costs are program- and project-specific, therefore without a better understanding of the details it is not possible to estimate in advance the Project Administration Costs. Program-specific details that are necessary to calculate the cost impact may include, but are not limited to, the scale of the activity, the types of participating technologies, and locational details. Sub-categories that could fall under Program Administration Costs may include, but are not limited to, programmatic measurement and verification costs, utility-specific rebates and/or incentives, and costs of market interventions (e.g., state and federal incentives).
4.5.2 Added Ancillary Service Costs
Added Ancillary Service Costs occur when DER causes additional ancillary service cost on the system. These costs shall be considered and monetized in a similar manner to the method described in the 4.1.5 Avoided Ancillary Services (Spinning Reserves, and Frequency Regulation).
4.5.3 Incremental Transmission & Distribution and DSP Costs
Additional incremental T&D Costs are caused by projects that contribute to the utility’s need to build additional infrastructure. Additional T&D infrastructure costs caused shall be considered and monetized in a similar manner to the method described in Section 4.1.3 Avoided Transmission Capacity Infrastructure and Related O&M. The potential for incremental T&D costs depends on the interconnection location, type of DER, and penetration of other DER in the area. These factors make estimating a value of incremental T&D costs in advance without project-specific information difficult. Depending on the nature of a specific DER project the incremental costs could be borne by the interconnecting facility or shared among all utility customers. For instance, a utility may need to make further investment in their T&D infrastructure, such as expanding system capacity, implementing more sophisticated control functionalities, or enhancing protection to ensure seamless grid integration of new DER assets. In some situations enhanced capabilities of a DSP would be required. These incremental costs would be identified and included within this cost.

Page 55
National Grid Benefit-Cost Analysis Handbook
4.5.4 Participant DER Cost
Participant DER Cost includes the equipment and participation costs assumed by DER providers which need to be considered when evaluating the societal costs of a project or program. These costs are the full cost of the DER net of program rebates and incentives that are included as part of Program Administration Costs. Together Participant DER Cost and Program Administration Costs equal the total cost of the DER project. The Participant DER Cost includes the installed cost of the device or system, as well as any ongoing operations and maintenance expenses to provide the solution. Installed costs include the capital cost of the equipment, balance of system, and labor for the installation. Operating costs include ongoing maintenance expenses. This section provides four examples of DER technologies with illustrative cost information based on assumptions that will ultimately vary given the facts and circumstances specific to each DER application:
• Solar PV – residential (4 kW)
• Combined Heat and Power (CHP) – reciprocal engine (100 kW)
• Demand Response (DR) – controllable thermostat
• Energy Efficiency (EE) – commercial lighting All cost numbers presented herein should be considered illustrative estimates only. These represent the full costs of the DER and do not account for or net out any rebates or incentives. Actual Participant DER costs will vary by project based upon factors including:
• Make and model: The DER owner typically has an array of products to choose from each of which have different combinations of cost and efficiency
• Type of installation: The location of where the DER would be installed influences the capital costs, for example, ground-mounted or roof-mounted solar PV
• Geographic location: Labor rates, property taxes, and other factors vary across utility service areas and across the state
• Available rebates and incentives: including federal, state, and/or utility funding The Commission noted in the February 26, 2015 Track One Order that the approach employed to obtain DER will evolve over time:
“The modernization of New York’s electric system will involve a variety of products and services that will be developed and transacted through market initiatives Products, rules, and entrants will develop in the market over time, and markets will value the attributes and capabilities of all types of technologies. As DSP capabilities evolve, procurement of
Page 56
National Grid Benefit-Cost Analysis Handbook
DER attributes will develop as well, from a near-term approach based on RFPs and load modifying tariffs, towards a potentially more sophisticated auction approach.”53
Thus, the acquisition of most DER in the near term will be through competitive solicitations rather than the establishment of tariffs. The BCA Order requires a fact-specific basis for quantifying costs that are considered in any SCT evaluation.54 Company competitive solicitations for DER will require the disclosure of costs by the bidders, including but not limited to capital, installation, marketing, administrative, fixed and variable O&M, lost opportunity and/or behavioral incentive costs. The Company will use the submitted costs in the project/program/portfolio BCA evaluation. Additionally, the Company will employ this information to develop and update technology specific benchmark costs as they evolve over time. For illustrative purposes, examples for a small subset of DER technologies are provided below.
4.5.4.1 Solar PV Example
The solar PV used in this example is a 4 kW-AC residential rooftop system which is connected to the local distribution system through the customer’s meter. All cost parameters in Table 4-1 for the intermittent solar PV example are derived based on information provided in the E3’s NEM Study for New York (“E3 Report”).55 In this study, E3 used cost data provided by NYSERDA based on solar PV systems that were installed in NY from 2003 to 2015. This is just one example of evaluating the potential cost of solar PV technology. The Company would need to incorporate service territory specific information when developing its technology benchmarks. For a project-specific cost analysis, actual estimated project costs would be used.
Table 4-1. Solar PV Example Cost Parameters
Parameter Cost
Installed Cost (2015$/kW-AC)56
4,430
Fixed Operating Cost ($/kW) 15
Note: These costs would change as DER project-specific data is considered.
53 REV Proceeding, Order Adopting Regulatory Policy Framework and Implementation Plan (issued February 26, 2015) (Track One Order), Apg. 33. 54 BCA Order, Appendix C, pg. 18. 55 The Benefits and Costs of Net Energy Metering in New York, Prepared for: New York State Energy Research and Development Authority and New York State Department of Public Service, December 11, 2015. 56 This cost is per kW of nameplate AC capacity. AC capacity is calculated from DC capacity using a factor of 1.1 DC:AC as provided in E3’s NEM report.

Page 57
National Grid Benefit-Cost Analysis Handbook
1. Capital and Installation Cost: Based on E3’s estimate for NYSERDA of 2015 residential solar PV panel installed cost. For solar the $/kW cost usually includes both the cost of the technology and installation cost, which is the case in this example. Costs could be lower or higher depending on the size of project, installation complexity, and location. This example assumes a 4 kW residential system for an average system in New York. This cost is per kW of nameplate AC capacity. AC capacity is calculated from DC capacity using a factor of 1.1 DC:AC as provided in E3’s NEM report.
2. Fixed Operating Cost: E3’s estimate for NYSERDA of O&M for a residential solar PV panel array in 2015. This estimate is applied to all New York electric utilities in the NYSERDA paper.
4.5.4.2 CHP Example
The CHP system used in this example is a 100 kW capacity natural gas-fired engine unit sized for commercial thermal load-following applications. For this illustration cost parameter values were obtained from the U.S. EPA’s Catalog of CHP Technologies57 for this baseload CHP example based on estimations of representative system costs. There are many site-specific factors that can affect cost parameters that are not examined in this example including: property tax, local permitting, gas and electric interconnection costs, local emissions constraints, and possible structural requirements. Natural gas costs would need to be considered for the natural-gas fired CHP system. All these elements would need to be reviewed and incorporated to develop the Company’s service territory technology-specific benchmarks.
Table 4-2. CHP Example Cost Parameters
Parameter Cost
Installed Capital Cost ($/kW) 3,000
Variable Operating Cost ($/kWh)
0.025
Note: This illustration would change as projects and locations are considered.
1. Capital and Installation Cost: U.S. EPA’s estimate of a reciprocating engine CHP system capital cost. This includes of the project development costs associated with the system including equipment, labor and process capital. 58
2. Variable: U.S. EPA’s estimate of a 100 kW reciprocating engine CHP system’s non-fuel O&M costs.59
57 EPA CHP Report, available at: https://www.epa.gov/chp/catalog-chp-technologies. 58 EPA CHP Report. pp. 2-15. 59 EPA CHP Report. pp. 2-17.

Page 58
National Grid Benefit-Cost Analysis Handbook
4.5.4.3 DR Example
The system dispatchable DR technology described herein is a programmable and controllable thermostat in a residence with central air conditioning that is participating in a direct load control program. The capital cost is based on an average of Wi-Fi enabled controllable thermostats from Nest, Ecobee, and Honeywell. The Company would need to incorporate its service territory specific information when developing its DR technology benchmarks.
Table 4-3. DR Example Cost Parameters
Parameter Cost
Capital Cost ($/Unit) $233
Installation Cost ($/Unit) $140
Note: This illustration would change as projects and locations are considered.
1. Capital and Installation Costs: These costs differ by thermostat model and capabilities, and as such should be considered representative. The installation costs estimates represent a New York system, but will vary substantially depending on the program nature.
2. Operating Costs: Assumed to be $0 for the DR asset participant based on comparison with the alternative technology.
4.5.4.4 EE Example
The energy efficient lighting used in this example is indoor installation of linear fluorescent lighting in a commercial office setting. Lighting cost estimates are based on the full cost of the measure, not the incremental cost over what is currently installed.
Table 4-4. EE Example Cost Parameters
Parameter Cost
Installed Capital Cost ($/Unit) $80
Note: This illustration would change as projects and locations are considered.
1. Installed Capital Cost: Based on Navigant Consulting’s review of manufacturer information and energy efficiency evaluation reports. The Company would need to incorporate its service territory specific information when developing its EE technology benchmarks.
4.5.5 Lost Utility Revenue
Lost Utility Revenue includes the distribution and other non-bypassable revenues that are shifted on to non-participating customers due to the presence of revenue decoupling mechanisms, in which sales-related revenue “losses” due to a decrease in electricity sales or
Page 59
National Grid Benefit-Cost Analysis Handbook
demand is recovered by marginally increasing the rate of electricity sales or demand to non-participating customers. Lost utility revenue is not included in the SCT and UCT as the reduced participant revenues are offset by the increased non-participant revenues. Therefore, this cost is only included in the RIM. As DER reduces utility sales and the associated revenues, a revenue decoupling mechanism enables the utility to be made whole by recovering these lost revenues from other customers. The impact to non-participating customers would be estimated by evaluating the type of DER and the tariffs applicable to the affected customers.
4.5.6 Shareholder Incentives
Shareholder Incentives include the annual costs to ratepayers of utility shareholder incentives that are tied to the projects or programs being evaluated. Shareholder incentives should be project or program specific and should be evaluated as such.
4.5.7 Net Non-Energy Costs
A suggested methodology for determining this benefit is not included in this version of the Handbook. In cases where non-energy impacts are attributable to the specific project or program, they may be assessed qualitatively. Net Non-Energy Costs may be applicable to any of the cost-effectiveness tests defined in the BCA Order depending on the specific project and non-energy impact.
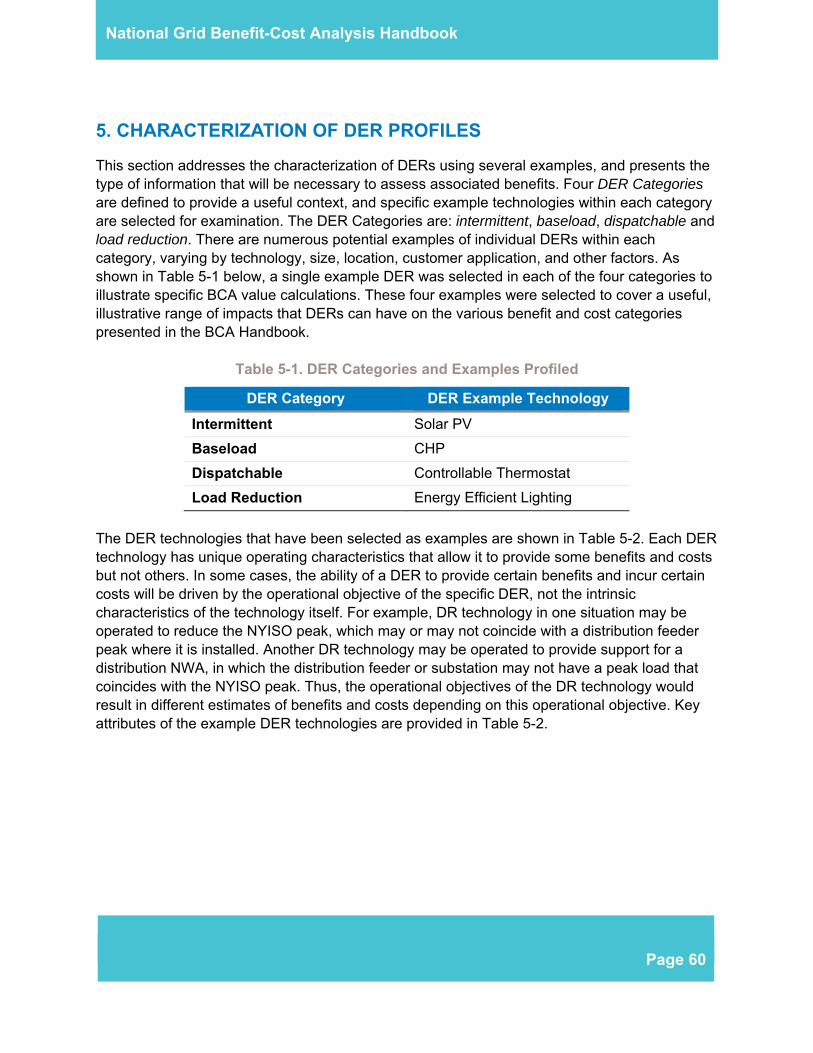
Page 60
National Grid Benefit-Cost Analysis Handbook
5. CHARACTERIZATION OF DER PROFILES
This section addresses the characterization of DERs using several examples, and presents the type of information that will be necessary to assess associated benefits. Four DER Categories are defined to provide a useful context, and specific example technologies within each category are selected for examination. The DER Categories are: intermittent, baseload, dispatchable and load reduction. There are numerous potential examples of individual DERs within each category, varying by technology, size, location, customer application, and other factors. As shown in Table 5-1 below, a single example DER was selected in each of the four categories to illustrate specific BCA value calculations. These four examples were selected to cover a useful, illustrative range of impacts that DERs can have on the various benefit and cost categories presented in the BCA Handbook.
Table 5-1. DER Categories and Examples Profiled
DER Category DER Example Technology
Intermittent Solar PV
Baseload CHP
Dispatchable Controllable Thermostat
Load Reduction Energy Efficient Lighting
The DER technologies that have been selected as examples are shown in Table 5-2. Each DER technology has unique operating characteristics that allow it to provide some benefits and costs but not others. In some cases, the ability of a DER to provide certain benefits and incur certain costs will be driven by the operational objective of the specific DER, not the intrinsic characteristics of the technology itself. For example, DR technology in one situation may be operated to reduce the NYISO peak, which may or may not coincide with a distribution feeder peak where it is installed. Another DR technology may be operated to provide support for a distribution NWA, in which the distribution feeder or substation may not have a peak load that coincides with the NYISO peak. Thus, the operational objectives of the DR technology would result in different estimates of benefits and costs depending on this operational objective. Key attributes of the example DER technologies are provided in Table 5-2.

Page 61
National Grid Benefit-Cost Analysis Handbook
Table 5-2. Key Attributes of Selected DER Technologies
Resource Attributes
Solar Photovoltaic (PV)
Solar PV is an intermittent resource with energy output determined by solar irradiance. The directional orientation and vertical angle of PV panels are important considerations for determining energy output and thus the corresponding coincidence factors with system-wide or local power delivery. Solar PV energy output may also degrade over time.
Combined Heat and Power (CHP)
CHP is a resource typically sized to meet a customer’s thermal energy requirements, but which also provides electrical energy. The particular customer’s characteristics determine the ability of CHP to contribute to various benefit and cost categories.
Energy Efficiency (EE)
EE reduces the energy consumption for delivery of a particular service (use) without degrading or reducing the level of service delivered.
Demand Response (DR)
DR reduces energy demand for a particular service (use) during specific hours of the day—typically peak demand hours—without reducing the service to an unacceptable level. DR is typically available only for limited hours in a year (e.g., <100 hrs.). The operational objective of the DR determines how it may contribute to various benefit and cost categories.
Each of the example DERs is capable of enabling a different set of benefits and incurs a different set of costs. Table 5-3 illustrates the general applicability of the four example DERs to each benefit and cost. A specific DER application may or may not impact these benefits and costs depending on the project.
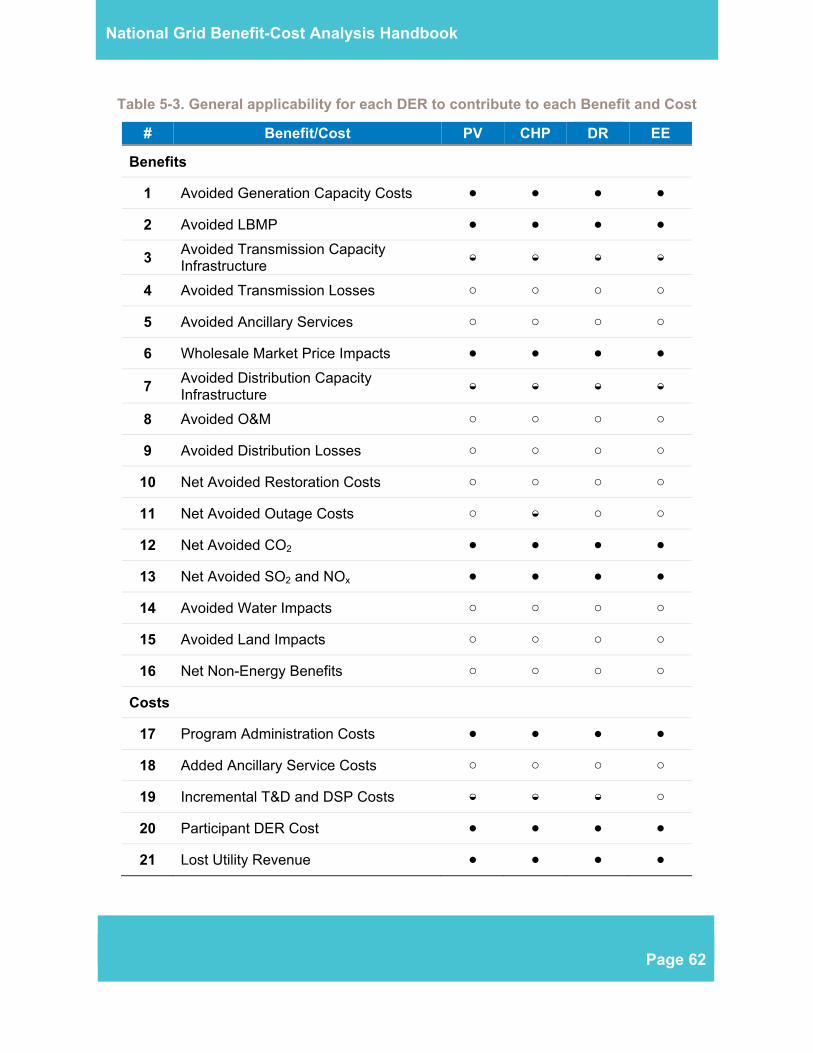
Page 62
National Grid Benefit-Cost Analysis Handbook
Table 5-3. General applicability for each DER to contribute to each Benefit and Cost
# Benefit/Cost PV CHP DR EE
Benefits
1 Avoided Generation Capacity Costs ● ● ● ●
2 Avoided LBMP ● ● ● ●
3 Avoided Transmission Capacity Infrastructure ◒ ◒ ◒ ◒
4 Avoided Transmission Losses ○ ○ ○ ○
5 Avoided Ancillary Services ○ ○ ○ ○
6 Wholesale Market Price Impacts ● ● ● ●
7 Avoided Distribution Capacity Infrastructure ◒ ◒ ◒ ◒
8 Avoided O&M ○ ○ ○ ○
9 Avoided Distribution Losses ○ ○ ○ ○
10 Net Avoided Restoration Costs ○ ○ ○ ○
11 Net Avoided Outage Costs ○ ◒ ○ ○
12 Net Avoided CO2 ● ● ● ●
13 Net Avoided SO2 and NOx ● ● ● ●
14 Avoided Water Impacts ○ ○ ○ ○
15 Avoided Land Impacts ○ ○ ○ ○
16 Net Non-Energy Benefits ○ ○ ○ ○
Costs
17 Program Administration Costs ● ● ● ●
18 Added Ancillary Service Costs ○ ○ ○ ○
19 Incremental T&D and DSP Costs ◒ ◒ ◒ ○
20 Participant DER Cost ● ● ● ●
21 Lost Utility Revenue ● ● ● ●
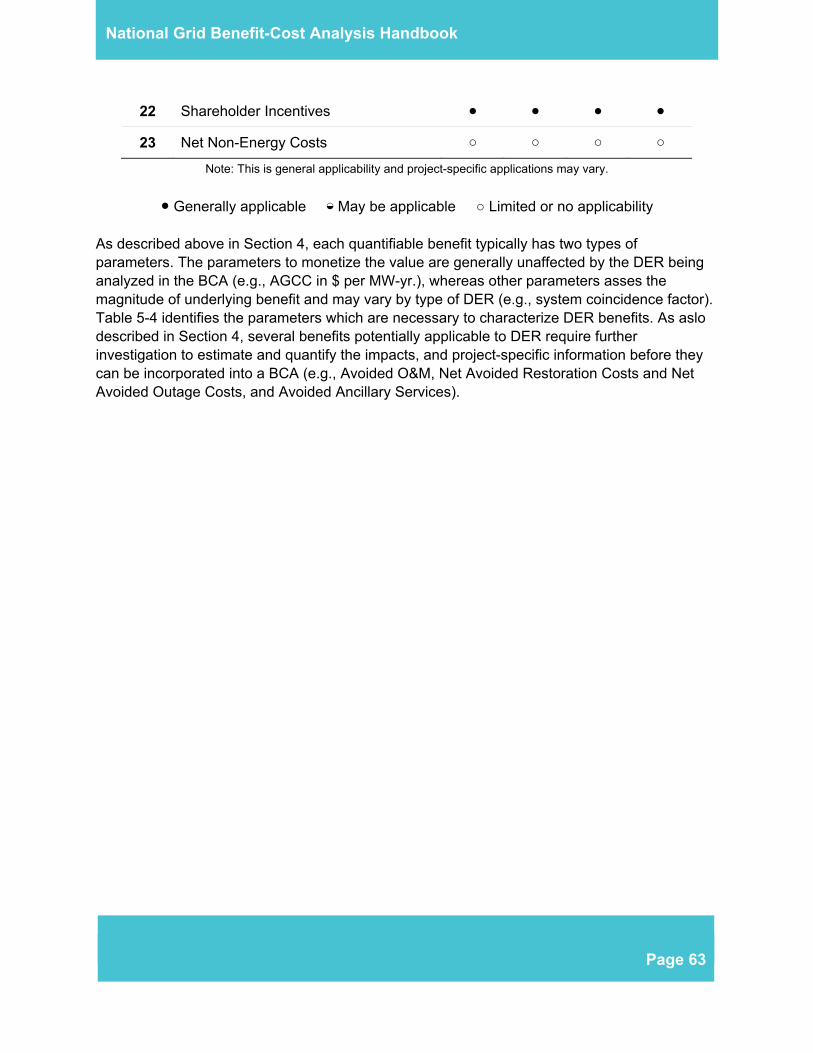
Page 63
National Grid Benefit-Cost Analysis Handbook
22 Shareholder Incentives ● ● ● ●
23 Net Non-Energy Costs ○ ○ ○ ○
Note: This is general applicability and project-specific applications may vary.
● Generally applicable ◒ May be applicable ○ Limited or no applicability
As described above in Section 4, each quantifiable benefit typically has two types of parameters. The parameters to monetize the value are generally unaffected by the DER being analyzed in the BCA (e.g., AGCC in $ per MW-yr.), whereas other parameters asses the magnitude of underlying benefit and may vary by type of DER (e.g., system coincidence factor). Table 5-4 identifies the parameters which are necessary to characterize DER benefits. As aslo described in Section 4, several benefits potentially applicable to DER require further investigation to estimate and quantify the impacts, and project-specific information before they can be incorporated into a BCA (e.g., Avoided O&M, Net Avoided Restoration Costs and Net Avoided Outage Costs, and Avoided Ancillary Services).
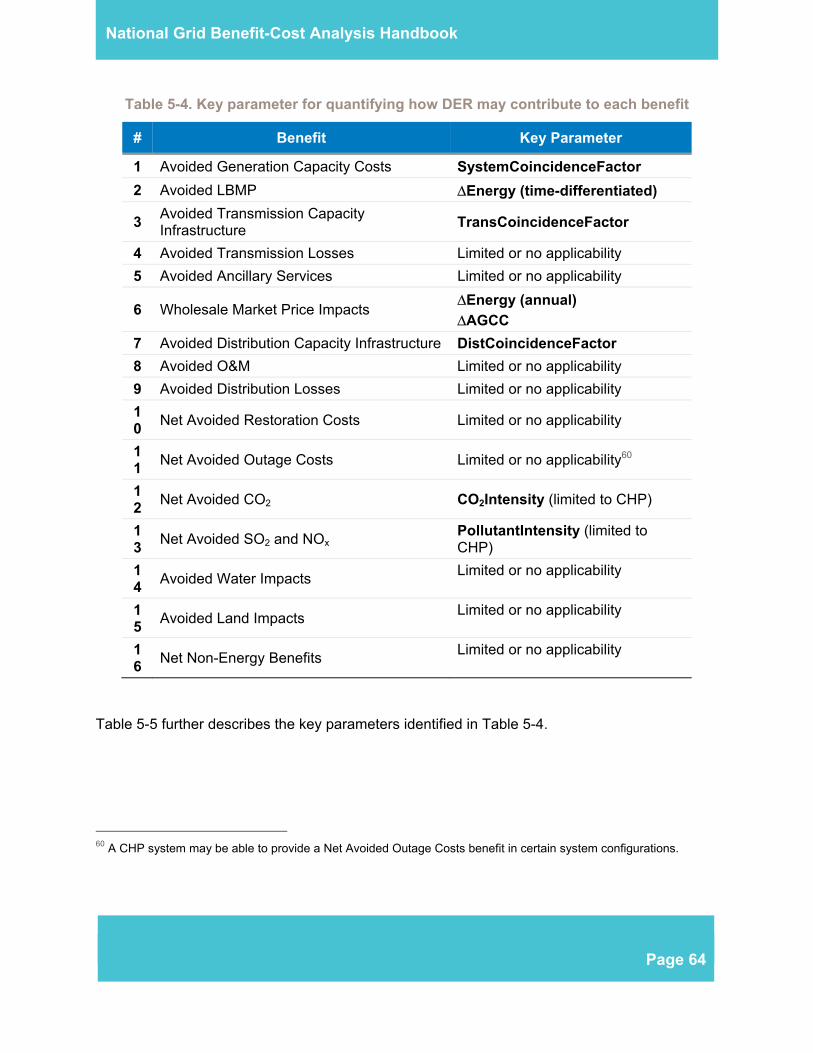
Page 64
National Grid Benefit-Cost Analysis Handbook
Table 5-4. Key parameter for quantifying how DER may contribute to each benefit
# Benefit Key Parameter
1 Avoided Generation Capacity Costs SystemCoincidenceFactor
2 Avoided LBMP ΔEnergy (time-differentiated)
3 Avoided Transmission Capacity Infrastructure
TransCoincidenceFactor
4 Avoided Transmission Losses Limited or no applicability
5 Avoided Ancillary Services Limited or no applicability
6 Wholesale Market Price Impacts ΔEnergy (annual)
ΔAGCC
7 Avoided Distribution Capacity Infrastructure DistCoincidenceFactor
8 Avoided O&M Limited or no applicability
9 Avoided Distribution Losses Limited or no applicability
10
Net Avoided Restoration Costs Limited or no applicability
11
Net Avoided Outage Costs Limited or no applicability60
12
Net Avoided CO2 CO2Intensity (limited to CHP)
13
Net Avoided SO2 and NOx PollutantIntensity (limited to CHP)
14
Avoided Water Impacts Limited or no applicability
15
Avoided Land Impacts Limited or no applicability
16
Net Non-Energy Benefits Limited or no applicability
Table 5-5 further describes the key parameters identified in Table 5-4.
60 A CHP system may be able to provide a Net Avoided Outage Costs benefit in certain system configurations.

Page 65
National Grid Benefit-Cost Analysis Handbook
Table 5-5. Key parameters
Key Parameter Description
Bulk System Coincidence Factor
Necessary to calculate the Avoided Generation Capacity Costs benefit.61 It captures a project’s or program’s contribution to reducing bulk system peak demand relative to its expected maximum demand reduction capability
Transmission Coincidence Factor62
Necessary to calculate the Avoided Transmission Capacity Infrastructure benefit. It quantifies a project’s contribution to reducing a transmission system element’s peak demand relative to the project’s expected maximum demand reduction capability. This would be evaluated on localized basis in most cases, but in some instances an assessment of coincidence with a system coincidence factor would be appropriate.
Distribution Coincidence Factor
Distribution Coincidence Factor is required to calculate the Avoided Distribution Capacity Infrastructure benefit. It captures the contribution to the distribution element’s peak relative to the project’s expected maximum demand reduction capability. This would be evaluated on localized basis in most cases, but in some instances an assessment of coincidence with a system coincidence factor would be appropriate.
CO2 Intensity
CO2 intensity is required to calculate the Net Avoided CO2 benefit. This parameter is dependent on the type of DER being evaluated – emission-free or emission-generating. It is the average CO2 emission rate of customer-sited pollutant-emitting generation. This is a project-specific input based on the type of onsite generation.
Pollutant Intensity
Pollutant Intensity is required to calculate the Net Avoided SO2 and NOX benefit. This parameter is dependent on the type of DER being evaluated – emission-free or emission-generating. It is the average SO2 and/or NOX emission rate of customer-sited pollutant-emitting generation. This is a project-specific input based on the type of onsite generation.
61 This parameter is also used to calculate the Wholesale Market Price Impact benefit. 62 Bulk transmission effectively has the same coincidence factor as generation since non-project specific transmission benefits are included in the Avoided LBMP and AGCC. This transmission coincidence factor is applicable for the Avoided Transmission Capacity Infrastructure and Related O&M benefit which incorporates incremental value beyond what is included in the Avoided Generation Capacity Costs and Avoided LBMPs benefits.

Page 66
National Grid Benefit-Cost Analysis Handbook
ΔEnergy (time-differentiated)
This parameter measures the change in bulk system energy consumed as a result of specific DER project implementation. This value is reliant on project-specific details including location. The ΔEnergy is dependent on the type of DER (e.g., intermittent vs. baseload), and how the DER would be operated (e.g., load reduction vs. energy conservation vs. backup generation). Thus, the ΔEnergy is time-differentiated. It may be appropriate to use an annual average value for some DER, while for others it may be more appropriate to use an average on-peak hours of operation, or even hourly operation. In each case the corresponding LBMP data would be required to value the benefit. The examples provided herein discuss potential approaches to consider time-differentiation by DER type.63
5.1 Coincidence Factors
Coincidence factors for DER are an important part of the benefit calculations and can be estimated in a variety of ways. What follows is a general approach for calculating the coincidence factors. Typical values are presented as examples in the sections below, however determining appropriate values for a specific project or portfolio may require additional information and calculation. The first step is to identify the respective peak times for Bulk System, Transmission element or Distribution element as needed. Illustrations using a single peak hour are provided below.
5.1.1 Bulk System
According to the NYISO, the bulk system peaks generally occur during the afternoon hours of the hottest non-holiday weekday. The peak day might occur from May to October depending on the weather. For example, the New York Control Area (NYCA) peak typically occurs around hour ending 5 PM.
63 Note also that annual change in bulk system energy is used in the calculation of Wholesale Market Price Impact benefit.

Page 67
National Grid Benefit-Cost Analysis Handbook
Table 5-6 below represents the NYCA peak dates and times for the last 5 years, for illustrative purposes.

Page 68
National Grid Benefit-Cost Analysis Handbook
Table 5-6. NYCA Peak Dates and Times
Year Date of Peak Time of Peak
2011 7/22/2011 Hour Ending 5
PM
2012 7/17/2012 Hour Ending 3
PM
2013 7/19/2013 Hour Ending 6
PM
2014 9/2/2014 Hour Ending 5
PM
2015 7/29/2015 Hour Ending 5
PM
5.1.2 Transmission
The transmission peak as defined for the BCA may occur on a different day or hour than that of the NYCA peak. The peak is dependent on the location of specific transmission constraints where utility capital investment may be needed. If applicable, use the hour that the constrained element on the transmission system experiences its peak load. In general, the benefits of a reduced transmission peak would be captured through the Avoided LBMP and AGCC benefits.
5.1.3 Distribution
The distribution peak as defined for the BCA may occur on a different day or hour than that of the NYCA peak. The distribution system coincidence factor is highly project specific. The distribution system serving predominantly large office buildings will peak at a different time or day than that of a distribution system that serves a residential neighborhood. The distribution system peak may differ or coincide with the NYCA system peak and the transmission peak. System-wide averages have been historically acceptable to use for some investment portfolios such as Energy Efficiency where the programs are broad based, and system-wide averages are provided in the Technical Resource Manual (TRM), which assumes a historical coincidence for the NYCA peak. Going forward, for investments that are more targeted in nature, a more localized coincidence factor is likely to be appropriate. The value of reducing the distribution peak is dependent on the location of constraints in the distribution equipment where utility capital investment may be needed. Note that in some cases with very local benefits objectives, even if the coincidence factor is high, the capacity value of a DER to the distribution system may be low or zero if no constrained element is relieved (e.g., no distribution investment is otherwise required in capacity in that location, thus there is no distribution investment to be deferred even with highly coincident DER behavior).
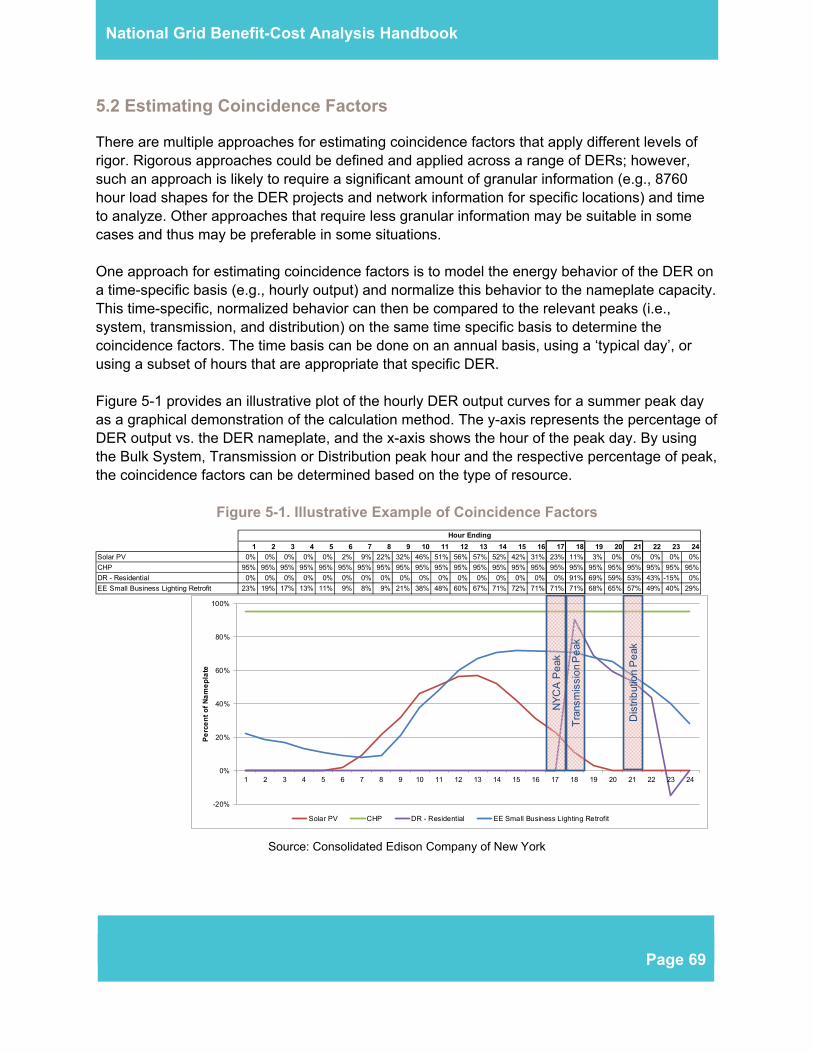
Page 69
National Grid Benefit-Cost Analysis Handbook
5.2 Estimating Coincidence Factors
There are multiple approaches for estimating coincidence factors that apply different levels of rigor. Rigorous approaches could be defined and applied across a range of DERs; however, such an approach is likely to require a significant amount of granular information (e.g., 8760 hour load shapes for the DER projects and network information for specific locations) and time to analyze. Other approaches that require less granular information may be suitable in some cases and thus may be preferable in some situations. One approach for estimating coincidence factors is to model the energy behavior of the DER on a time-specific basis (e.g., hourly output) and normalize this behavior to the nameplate capacity. This time-specific, normalized behavior can then be compared to the relevant peaks (i.e., system, transmission, and distribution) on the same time specific basis to determine the coincidence factors. The time basis can be done on an annual basis, using a ‘typical day’, or using a subset of hours that are appropriate that specific DER. Figure 5-1 provides an illustrative plot of the hourly DER output curves for a summer peak day as a graphical demonstration of the calculation method. The y-axis represents the percentage of DER output vs. the DER nameplate, and the x-axis shows the hour of the peak day. By using the Bulk System, Transmission or Distribution peak hour and the respective percentage of peak, the coincidence factors can be determined based on the type of resource.
Figure 5-1. Illustrative Example of Coincidence Factors
Source: Consolidated Edison Company of New York
1 2 3 4 5 6 7 8 9 10 11 12 13 14 15 16 17 18 19 20 21 22 23 24
Solar PV 0% 0% 0% 0% 0% 2% 9% 22% 32% 46% 51% 56% 57% 52% 42% 31% 23% 11% 3% 0% 0% 0% 0% 0%
CHP 95% 95% 95% 95% 95% 95% 95% 95% 95% 95% 95% 95% 95% 95% 95% 95% 95% 95% 95% 95% 95% 95% 95% 95%
DR - Residential 0% 0% 0% 0% 0% 0% 0% 0% 0% 0% 0% 0% 0% 0% 0% 0% 0% 91% 69% 59% 53% 43% -15% 0%
EE Small Business Lighting Retrofit 23% 19% 17% 13% 11% 9% 8% 9% 21% 38% 48% 60% 67% 71% 72% 71% 71% 71% 68% 65% 57% 49% 40% 29%
Hour Ending
-20%
0%
20%
40%
60%
80%
100%
1 2 3 4 5 6 7 8 9 10 11 12 13 14 15 16 17 18 19 20 21 22 23 24
Pe
rce
nt
of
Na
me
pla
te
Solar PV CHP DR - Residential EE Small Business Lighting Retrofit
NY
CA
Pe
ak
Tra
nsm
issi
on
Pe
ak
Dis
trib
utio
n P
eak

Page 70
National Grid Benefit-Cost Analysis Handbook
The individual DER example technologies that have been selected are discussed below.64 The values for the DER examples have been compiled from various sources and each of these sources may apply different valuation techniques. Some sources performed extensive simulations to generate statewide averages, while others performed calculations on a variety of system specification assumptions. For example, the coincidence factors for the solar PV example below were calculated in E3’s NEM Study for New York (“E3 Report”)65 based on a simulation of a large number of solar PV systems across New York. An area for further investigation will be to assess and develop a common approach and methodology for determining the values for DER-specific parameters for each type of DER.
5.3 Solar PV Example
Solar PV is selected to depict an intermittent DER, where the electricity generation is dependent on the resource availability, in this case solar irradiance. The parameter assumptions and methodology used to develop those assumptions were obtained from the E3 Report.
5.3.1 Example System Description
The solar PV used in this example is a 4 kW-AC residential rooftop system which is connected to the local distribution system through the customer’s meter. These details allow for an estimate of material and installation costs, but there are several other system details required to estimate system energy output, and therefore a full benefit analysis. Local levels of solar irradiance, panel orientation (azimuth angle from north, south, east, west), tilt (typically, 0°-25° for rooftop systems located in NY) and the addition of a tracking feature, as well as losses associated with the balance of system equipment (e.g., inverters, transformers) and system degradation over time each impact the system’s capacity factor and coincidence factors with the bulk system, transmission and distribution. 64 The BCA Handbook does not attempt to provide an example of a portfolio of interdependent DERs, such as those that might be procured to provide an NWA approach. Such a combination of project-specific DERs and distribution system information is less generalizable for assessing T&D coincidence factors, and less informative as an example than the individual DER examples selected. For example, when assessing NWAs it is necessary to assess their functional equivalence with traditional wired solutions. This requires understanding the potentially complex interactions between the DERs, assessing their joint reliability relative to that of traditional wired investment, and understanding the uncertainties in performance that may impact ability to maintain safe, reliable, economic energy delivery. The BCA handbook incorporates derating factors in various benefit calculations to account for these elements, but a discussion of those factors would complicate this section significantly, and so it was not included. 65 The Benefits and Costs of Net Energy Metering in New York, Prepared for: New York State Energy Research and Development Authority and New York State Department of Public Service, December 11, 2015.
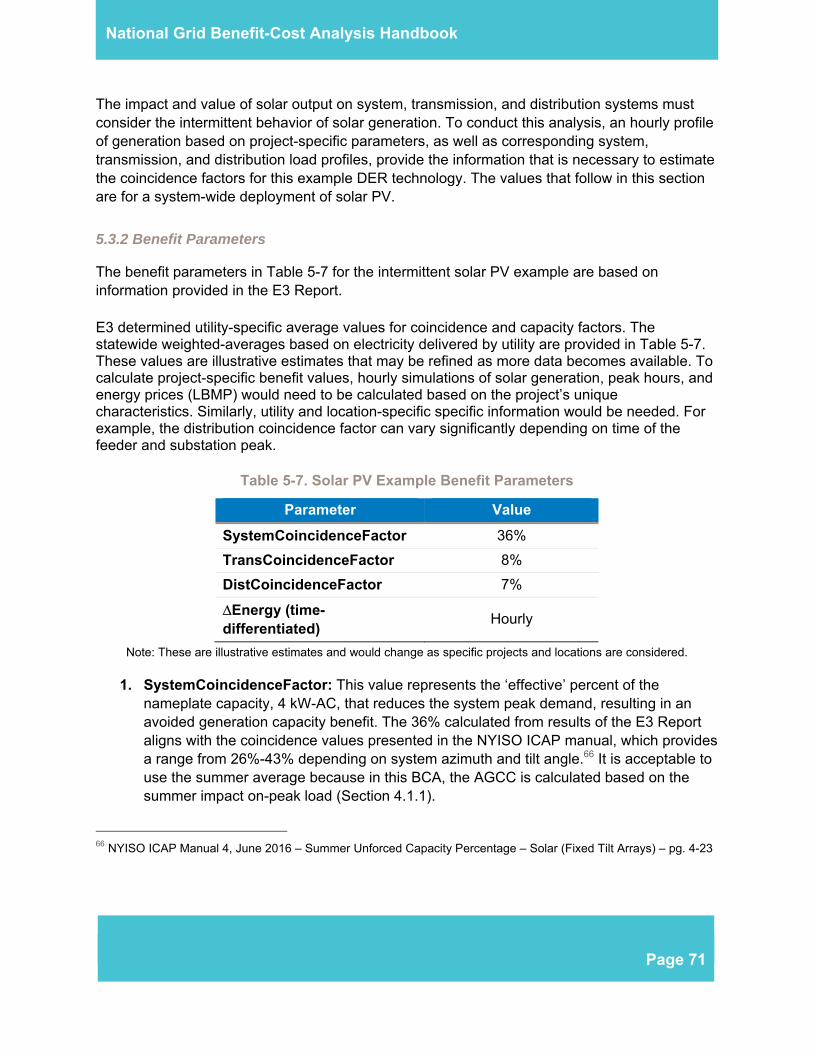
Page 71
National Grid Benefit-Cost Analysis Handbook
The impact and value of solar output on system, transmission, and distribution systems must consider the intermittent behavior of solar generation. To conduct this analysis, an hourly profile of generation based on project-specific parameters, as well as corresponding system, transmission, and distribution load profiles, provide the information that is necessary to estimate the coincidence factors for this example DER technology. The values that follow in this section are for a system-wide deployment of solar PV.
5.3.2 Benefit Parameters
The benefit parameters in Table 5-7 for the intermittent solar PV example are based on information provided in the E3 Report. E3 determined utility-specific average values for coincidence and capacity factors. The statewide weighted-averages based on electricity delivered by utility are provided in Table 5-7. These values are illustrative estimates that may be refined as more data becomes available. To calculate project-specific benefit values, hourly simulations of solar generation, peak hours, and energy prices (LBMP) would need to be calculated based on the project’s unique characteristics. Similarly, utility and location-specific specific information would be needed. For example, the distribution coincidence factor can vary significantly depending on time of the feeder and substation peak.
Table 5-7. Solar PV Example Benefit Parameters
Parameter Value
SystemCoincidenceFactor 36%
TransCoincidenceFactor 8%
DistCoincidenceFactor 7%
ΔEnergy (time-differentiated)
Hourly
Note: These are illustrative estimates and would change as specific projects and locations are considered.
1. SystemCoincidenceFactor: This value represents the ‘effective’ percent of the nameplate capacity, 4 kW-AC, that reduces the system peak demand, resulting in an avoided generation capacity benefit. The 36% calculated from results of the E3 Report aligns with the coincidence values presented in the NYISO ICAP manual, which provides a range from 26%-43% depending on system azimuth and tilt angle.66 It is acceptable to use the summer average because in this BCA, the AGCC is calculated based on the summer impact on-peak load (Section 4.1.1).
66 NYISO ICAP Manual 4, June 2016 – Summer Unforced Capacity Percentage – Solar (Fixed Tilt Arrays) – pg. 4-23

Page 72
National Grid Benefit-Cost Analysis Handbook
2. TransCoincidenceFactor: The transmission coincidence factor included is for the New York average sub-transmission coincidence factor. This value would be highly project-specific, as it depends on the generation profile of the system, and the load profile for the site-specific area on the sub-transmission system.
3. DistCoincidenceFactor: The distribution coincidence factor is lowest. Residential distribution feeders and substations often peak during early evening hours when solar output is low.67 This value would be highly project-specific, as it depends on the generation profile of the system, and the load profile for the site-specific area on the distribution system.
4. ΔEnergy (time-differentiated): As discussed above solar output would be higher during daylight hours and summer months. As hourly solar profiles are available from the National Renewable Energy Laboratory (NREL) System Advisor Model (SAM), it would be appropriate to compare the projected energy output with hourly LBMPs.
5.4 Combined Heat and Power Example
CHP is an example of a baseload DER which typically operates during system, transmission, and distribution peaks.
5.4.1 Example System Description
CHP depicts a baseload DER where the electricity is generated at all hours, except during maintenance. The CHP system used in this example is a 100 kW capacity natural gas-fired engine unit sized for commercial thermal load-following applications. In this simplified example, the 100 kW system is assumed to be small relative to the commercial building’s overall electric load and thus the system operates at full electrical generating capacity at all times, except when it is down for maintenance. The example is described in EPA’s Catalog of CHP Technologies (EPA CHP Report).68
5.4.2 Benefit Parameters
Benefit parameters for the baseload CHP example are a combination of assumptions on system use and system characteristics. 67 E3 Report, “Based on E3’s NEM Ratepayer Impacts Evaluation in California it was found (in a granular substation load analysis) that distribution peak loads are generally aligned with solar PV generation profiles in approximately 30% of the systems analyzed.” PDF pg. 49. 68 https://www.epa.gov/chp/catalog-chp-technologies

Page 73
National Grid Benefit-Cost Analysis Handbook
Coincidence and capacity factors are derived from the assumption that the CHP is used as a baseload DER whereby the CHP system would be running at full capacity all the time, with the exception of downtime for maintenance. Since it is not always possible to schedule downtimes, the CHP unit is assumed to provide 95% power output at all hours, assuming it is down for maintenance 5% of the year.69 The carbon and criteria pollutant intensity can be estimated using the U.S. EPA’s publically-available CHP Emissions Calculator.70 “CHP Technology,” “Fuel,” “Unit Capacity” and “Operation” are the four inputs required to estimate CO2, SO2, and NOx intensities (for this example, these inputs would be reciprocating engine technology, natural gas fuel, 100 kW capacity, operating at 95% of 8,760 hours per year). To complete a project-specific analysis, actual design parameters and generation profiles would be needed to assess the likelihood of coincidence, emissions, and capacity factors.
Table 5-8. CHP Example Benefit Parameters
Parameter Value
SystemCoincidenceFactor 0.95
TransCoincidenceFactor 0.95
DistCoincidenceFactor 0.95
CO2Intensity (metric ton CO2/MWh) 0.141
PollutantIntensity (metric ton NOX/MWh)
0.001
ΔEnergy (time-differentiated) Annual average
Note: These are illustrative estimates and would change as specific projects and locations are considered.
1. SystemCoincidenceFactor: The system coincidence factor is 0.95 under the assumption that the CHP system is always running apart from downtime for maintenance or during forced outages.
2. TransCoincidenceFactor: The transmission coincidence factor is 0.95 under the assumption that the CHP system is always running apart from downtime for maintenance or during forced outages.
69 EPA CHP Report. pg. 2-20. 70 EPA CHP Emissions Calculator, available at https://www.epa.gov/chp/chp-emissions-calculator.
Page 74
National Grid Benefit-Cost Analysis Handbook
3. DistCoincidenceFactor: The distribution coincidence factor is 0.95 under the assumption that the CHP system is always running apart from downtime for maintenance or during forced outages.
4. CO2Intensity: This value was the output of U.S. EPA’s calculator, provided in tons/year and then converted to metric ton/MWh as required for input into the BCA (Section 4.4.1).
5. PollutantIntensity: This value was the output of U.S. EPA’s calculator, provided in tons/year and then converted to metric ton/MWh as required for input into the BCA (Section 4.4.2). There are no SO2 emissions from burning natural gas.
6. ΔEnergy (time-differentiated): Assuming the CHP is used as a baseload resource, with the exception of downtime for maintenance, capacity factor is 95%. Because it is not possible to predict when the downtime may occur, using annual average LBMP would be appropriate.
5.5 Demand Response Example
DR depicts an example of a dispatchable DER where the resource can be called upon to respond to peak demand.
5.5.1 Example System Description
The system dispatchable DR technology described herein is a programmable and controllable thermostat in a residence with central air conditioning that is participating in a direct load control program. DR is a dispatchable DER because it is reduces demand on request from the system operator or utility.71 Each DR program has unique requirements for notification time, length of demand reduction, number of calls, and frequency of calls. A DR resource is typically available only for limited hours in a year (e.g., <100 hrs.) and limited hours per call. The major benefit from DR is ability to reduce peak demand. The particular use case or operational objective of the DR determines the value for its coincidence factors. The coincidence factors shown below are based on experience and metering in Con Edison’s Direct Load Control Program.72 This DR example is specifically for a DR event called for five
71 Some DR programs may be “dispatched” or scheduled by third-party aggregators. 72 Specifically from the July 15-19, 2013 heat wave. Con Edison’s direct load control program is used in this example as National Grid and other upstate utilities commenced direct load control programs on a pilot basis in the 2015 summer capability period with expanded offerings for the 2016 summer capability period and therefore there is limited experience to draw from to date.

Page 75
National Grid Benefit-Cost Analysis Handbook
hours between the hours of 5pm and 10pm. The coincidence factors can and will change based on when DR event is called, customer response (e.g., overrides), device availability, load availability, and other project and technology-specific factors. Care should be taken to consider all these factors when determining appropriate coincidence factors for projects and portfolios. The value of reduced energy use attributable to the DR asset can be calculated using the average LBMP of the top 50 hours of system peak. A more accurate energy calculation would consider the expected number of times that DR was called in a given year as well as the length of the calls beyond the peak hour itself (e.g., 2 hour events, 4 hour events). This calculation will differ if the DR asset is intended to defer another peak, or if the DR program has a substantially different frequency of calls. The number of hours averaged should be based on the frequency of DR calls and the selection of those hours should be based on when the DR calls will be made.
5.5.2 Benefit Parameters
The benefit parameters described here are assumed based on the example and considerations described above. Coincidence factors might differ based on the call windows of the DR resource being evaluated.
Table 5-9. DR Example Benefit Parameters
Parameter Value
SystemCoincidenceFactor 0.0
TransCoincidenceFactor 0.91
DistCoincidenceFactor 0.53
ΔEnergy (time-differentiated) Average of highest
100 hours
Note: These are illustrative estimates and would change as specific projects and locations are considered.
1. SystemCoincidenceFactor: The system coincidence factor is 0.0, based on Con Edison’s Direct Load Control Program, as illustrated in Figure 5-1. This factor will change based on the DR call window, customer response, device availability, load availability, as well as the timing of the system peak.
2. TransCoincidenceFactor: The transmission coincidence factor is 0.91, based on Con Edison’s Direct Load Control Program, as illustrated in Figure 5-1. This factor will change based on the DR call window, customer response, device availability, load availability, as well as the timing of the transmission peak.

Page 76
National Grid Benefit-Cost Analysis Handbook
3. DistCoincidenceFactor: The distribution coincidence factor is 0.53, based on Con Edison’s Direct Load Control Program, as illustrated in Figure 5-1. This factor will change based on the DR call window, customer response, device availability, load availability, as well as the timing of the distribution peak.
4. ΔEnergy (time-differentiated): DR would be dispatched a limited number of hours during the year. The NYISO may only call upon DR for approximately 50 hours in a year. The energy savings can be estimated based on the average demand savings (not peak) expected over the hours called, times the number of hours the DR resource is expected to be called. This average reduction would be multiplied by an appropriately time-differentiated LBMP.
5.6 Energy Efficiency Example
Energy efficient lighting depicts a load-reducing DER where the use of the technology decreases the customer’s energy consumption as compared to what it would be without the technology or with the assumed alternative technology.
5.6.1 Example System Description
The energy efficient lighting used in this example is indoor installation of linear fluorescent lighting in a commercial small business setting. The peak period for this example is assumed to occur in the summer during afternoon hours. EE, including lighting, is a load reducing modifier because it decreases the customers’ energy consumption and load shape, which in turn, reduces the system, transmission and distribution peak. This example of a small business setting lighting system assumes that the coincidence factor is calculated during operational hours when the load reduction due to this lighting technology is expected to occur at the time of the system peak, as well as the during the transmission and distribution peaks. The illustrative values presented below are based on a recent internal research by a downstate utility and will vary given project- and technology- specific parameters.
5.6.2 Benefit Parameters
The benefit parameters described here are based on a recent internal study of small commercial lighting projects by a downstate utility.

Page 77
National Grid Benefit-Cost Analysis Handbook
Table 5-10. EE Example Benefits Parameters
Parameter Value
SystemCoincidenceFactor 0.71
TransCoincidenceFactor 0.71
DistCoincidenceFactor 0.57
ΔEnergy (time-differentiated) ~9 am to ~10 pm
weekdays
Note: These are illustrative estimates and would change as specific projects and locations are considered.
1. SystemCoincidenceFactor: The system coincidence factor is 0.71 based on a recent downstate utility metering study as illustrated in Figure 5-10. The factor is highly dependent on the technology, customer type, as well as timing of the system peak.
2. TransCoincidenceFactor: The transmission coincidence factor is 0.71 based on a recent downstate utility metering study as illustrated in Figure 5-10. The factor is highly dependent on the technology, customer type, as well as timing of the transmission peak.
3. DistCoincidenceFactor: The distribution coincidence factor is 0.57 based on a recent downstate utility metering study as illustrated in Figure 5-10. The factor is highly dependent on the technology, customer type, as well as timing of the distribution peak.
ΔEnergy (time-differentiated): This value is calculated using the lighting hours per year, divided by the total hours in a year (8,760). This time period is subject to building operation, which, in this example is assumed between 9 am and 10 pm, 6 days a week, 50 weeks a year. This would define the corresponding period for determining an average LBMP that would be used to calculate the benefit.

Nation
APPEN
National for input the BCA The discowhich is
Variable Both fixetopograpaverage specific l
nal Grid Be
UNDIX A.
Grid utility-sassumptionsHandbook.
ount rate usprovided be
loss percend and variab
phy of the traloss percentoss study. T
enefit-Cost
UTILITY-S
specific datas used throu
ed to calculalow in Table
Table A-1.
SC1
P
t is used to able loss percansmission atages are sh
The average
t Analysis
SPECIFIC
is provided ughout the b
ate net presee A-1.
Utility Weig
Regulate
ource: State ofCommission Ca2-G-0202, Ord
Gas Rate PlaProposal, Issue
account for cent values mand/or distribhown in . Losloss percen
Handbook
C ASSUM
in this Appebenefit and c
ent value (N
ghted Avera
d Rate of R
6.85%
f New York Puases 12-E-0201der Approving Eans in Accord wd and Effective
2013.
losses occumay be affecbution systemss percentag
nt and peak l
k
MPTIONS
endix. Each cost methodo
NPV) is equa
age Cost of
Return
blic Service 1 and Case Electric and with Joint e March 15,
rring upstreacted by certams. Utility-spges come froloss percent
table below ologies desc
al to the utilit
Capital
am from theain projects pecific systeom a Nationt are assume
Page A
provides vacribed throug
ty cost of cap
load impactwhich alter t
em annual nal Grid utilityed to be equ
A-1
alues ghout
pital,
t. the
y-ual.

Page A-2
National Grid Benefit-Cost Analysis Handbook
Table A-2. Utility Loss Data
System Variable Loss Percent Fixed Loss Percent
Local Transmission 1.89% 0.07%
Sub Transmission 0.74% 0.12%
Transmission Total 2.63% 0.19%
Primary Distribution 1.22% 0.22%
Secondary Distribution 1.78% 1.63%
Distribution Total 3.00% 1.85%
Source: Six-Month Report of Niagara Mohawk Power Corporation d/b/a National Grid in Case 08-E-0751 – Proceeding on Motion of the Commission to Identify the Sources of Electric System Losses
and the Means of Reducing Them, December 23, 2008.
Estimated system average marginal costs of service by asset type for 2016-2035 are provided in Table A-3 below.

Page A-3
National Grid Benefit-Cost Analysis Handbook
Table A-3. Utility System Average Marginal Costs of Service ($/kW-yr)
Year Transmission Primary Distribution Secondary Distribution
2016 $ 22.55 $ 33.60 $ 93.22
2017 $ 23.00 $ 34.27 $ 95.08
2018 $ 23.46 $ 34.96 $ 96.99
2019 $ 23.93 $ 35.66 $ 98.92
2020 $ 24.41 $ 36.37 $ 100.90
2021 $ 24.90 $ 37.10 $ 102.92
2022 $ 25.39 $ 37.84 $ 104.98
2023 $ 25.90 $ 38.60 $ 107.08
2024 $ 26.42 $ 39.37 $ 109.22
2025 $ 26.95 $ 40.16 $ 111.41
2026 $ 27.49 $ 40.96 $ 113.63
2027 $ 28.04 $ 41.78 $ 115.91
2028 $ 28.60 $ 42.61 $ 118.22
2029 $ 29.17 $ 43.47 $ 120.59
2030 $ 29.75 $ 44.33 $ 123.00
2031 $ 30.35 $ 45.22 $ 125.46
2032 $ 30.96 $ 46.13 $ 127.97
2033 $ 31.58 $ 47.05 $ 130.53
2034 $ 32.21 $ 47.99 $ 133.14
2035 $ 32.85 $ 48.95 $ 135.80
Source: Niagara Mohawk Power Corporation d/b/a National Grid, Case 12-E-0201 - Proceeding on the Motion of the Commission as to the Rates, Charges, Rules, and Regulations of Niagara Mohawk Power Corporation for Electric Service, Testimony and Exhibits of Electric Rate Design Panel Exhibit (E-RDP-
9) through Exhibit (E-RDP-13) Book 23, April 2012.
Note: A weighted marginal cost by rate class was used to approximate secondary distribution, primary distribution, and transmission marginal costs based on the transmission non-coincident peak factor
provided in Schedule 1.

National Grid Distributed System Implementation Plan
Appendix 2: Evaluation of NWA Opportunities Page App. 2-1
Appendix 2: Evaluation of NWA Opportunities in theCurrent Capital Investment Plan

National Grid Distributed System Implementation Plan
Appendix 2: Evaluation of NWA Opportunities Page App. 2-2
Niagara Mohawk Power Corporation d/b/a National Grid (“National Grid” or the “Company”)reviewed all projects in the five-year plan developed from its recent rate case petition. TheCompany determined that the following types of non-wires alternative (“NWA”) projects in theplan were not suitable solutions:
Inspection and Maintenance; Minor Equipment Replacement (non-refurbishment, non-transformer); Distribution rebuilds (asset condition/reliability); Time sensitive solution, less than 30 months; Storm hardening and flood mitigation; Communications (RTU’s, sensors, telemetry, etc.); Potential safety issues for the public or employees (e.g., Arc Flash resolution,
addressing elevated voltage concerns, etc.); Reliability reviews (SAIFI); Creation of feeder tie points (SAIFI/CAIDI); and Programs:
o Deteriorated cable;o Station battery;o Relay;o Breaker;o Metal-clad switchgear;o Fusing;o Overloaded distribution transformer; ando Buffalo street light cable replacement.
In general, when a physical connection of the wires was required, asset condition projects wereexcluded. Upon completion of the review, projects were placed into one of three categories.
The first category identifies seven project areas where the Company wishes to solicit forpotential NWA solutions. Summaries of the potential opportunities are provided below anddetailed system-needs assessments will be developed in advance of distributed energyresource (“DER”) solicitations. It is anticipated that RFPs will be issued in late 2016 for theseprojects.
The second category identifies a list of projects where NWA solutions could potentially beutilized but there is a lower likelihood of fit. The Company is prioritizing its near-term NWAefforts on the category one projects and does not plan to actively solicit NWA projects forcategory two solutions at this time. However, if a DER developer is interested in offering asolution to a project on this list, the Company would evaluate the proposal. The Company looksto gain experience from these projects with third parties over the next few years to determinedata and format required for developers use, BCA analysis process, use of third-party vendorsin development and review, and the staffing necessary to manage these projects. TheCompany also looks forward to working with guidance that will be developed in thesupplemental DSIP submittal.

National Grid Distributed System Implementation Plan
Appendix 2: Evaluation of NWA Opportunities Page App. 2-3
The third category identifies projects where NWA solutions cannot be utilized and projects mustprogress as planned.
Category One – Highest Potential NWA Opportunities ProjectsProject C036054 Golah Avon 217 Line Reconductoring & Project C051583 Line 216Reconductoring
Golah-North Lakeville Lines 216 and 217 reconductoring projects are intended to improvecapacity and voltages on the 34.5kV system supplied by the Golah and North Lakeville Stations.These two circuits are parallel to a radial 115kV circuit to North Lakeville. By reconductoring thelines and/or utilizing DERs, the area loads would not need to be shed for outages of the 115kVcircuit or 115-34.5kV transformer outages at North Lakeville. The area in need is located in therural area south of Rochester along and to the east of Interstate 390 in Livingston County. Thecustomer base includes residences, small C&I, and farms. There are 4.8kV and 13.2kVdistribution station & circuits supplied from the 34.5kV system. No transfers to neighboringstations are possible due to geography and franchise boundaries. Approximately six MVA ofDER is required now in the area supplied by National Grid’s 34.5kV system including Richmond,Hemlock, Lima, Livonia, Lakeville, Avon, Conesus, Groveland and Livingston substations in thesouthern half of Livingston County and adjacent Ontario County. An additional 500KVA will berequired per year after that (eleven MVA total in ten years). There is approximately thirty-sixMVA of load in this area. If the amount of load growth varies from the forecast, the Companywould need to adjust the amount of DER required.
Project C046945 Buffalo Station 53 Rebuild - Substation
This project has both asset condition and capacity components. Buffalo Station 53 is located inthe northeast section of the City and is an indoor station with three 23-4.16kV 2.5/3.125MVAOA/FA transformers, induction regulators and six feeders. The indoor station itself hasdeteriorated components and is nearing overload for N-1 transformers in service. Existingplans rebuild and expand the substation to four transformers, with each being 3.75/4.687MVAOA/FA and nine to twelve feeders. The expansion will split the load between four 23kV cables,rather than three cables. Two of the three 23kV cables supplying the station are loaded at orabove their summer normal capacity. The neighboring substations cannot accept enough loadto eliminate Station 53. By utilizing DER, the asset condition project can be scaled back to onlythree transformers. The customer base is residential with Commercial and small-industrial in atypical urban area. Approximately 1MVA of DER on Station 21 or Station 53 feeders will delaythe need to expand the substation. An additional DER of 300kVA per year will be required tokeep pace with load growth. If large customer projects (500-1200kW each) come to fruition,then additional DER will be required. The total load on Stations 21 and 53 is approximately25MVA. If the amount of load growth varies from forecast, the amount of DER required wouldneed to be adjusted.

National Grid Distributed System Implementation Plan
Appendix 2: Evaluation of NWA Opportunities Page App. 2-4
Project C046563 Gilbert Mills Transformer Upgrade
This project is to replace the existing 113-13.8kV 7.5/9.4 MVA OA/FA transformer with a largertransformer such as a 15/20/25MVA transformer. The primary side protection for thetransformer would be replaced as well. The existing load on the station is very close to summernormal rating of the transformer. A properly sized DER project would decrease loading on thetransformer and negate the need for the traditional project. The station is located northwest ofSyracuse in Oswego County in a rural area. The transformer load has varied around itssummer normal rating the last several years. Approximately 700 KVA of DER would provide forsome load growth. If a larger customer project is developed in the next several years, theamount of DER would need to increase to maintain the station loading below the normal ratingof the transformer. If the amount of load growth varies from the forecast, the Company wouldneed to adjust the amount of DER required.
C050421 – Stoner 52 – Mohawk Drive Conversion
This project is to relieve an overloaded ratio bank (3-500kVA 13.2-4.8kV). The ratio bank isloaded to 1800 kVA. The traditional project involves the addition of a neutral conductor andrebuilding as necessary and conversion of approximately 3.5 miles of the existing feeder alongMohawk Drive into the Tribes Hill area of the Town of Mohawk. This will also improve thevoltage profile along the circuit. This is located in a rural area of Montgomery County west ofAmsterdam. Appropriately 700kVA of DER projects are required to relieve the existing ratiobank and defer/eliminate the need for rebuild and conversion beyond the planning horizon. Ifthe amount of load growth varies from forecast, the Company would need to adjust the amountof DER required.
C052226 CR-Convert 26554 Brooklea Drive
This project is to relieve the overloaded ratio bank (3-167kVA 13.2-4.8kV) on Brooklea Drivethat is a part of the Duguid 26554 feeder. There is no room for platform mounted ratio bank, sorebuild and conversion is required of approximately 2,800 feet of three-phase and 3,000 feet ofsingle phase circuit. This location is in a suburban area of Onondaga County that is southeastof Syracuse. An appropriately sized DER project would relieve the existing ratio bank anddefer/eliminate the need for rebuild and conversion beyond the planning horizon.
The ratio bank was loaded to 583kVA (116% of its rating) during the summer of 2015 and areforecasted to be at approximately 640kVA (127%) in 2018 which is when the project is in thebudget. The 640kVA is 140kVA over the ratio bank‘s nameplate rating. Approximately 400kVAof DER would be required to maintain the ratio bank below its nameplate rating through 2021. Ifthe amount of load growth varies from forecast, the Company would need to adjust the amountof DER required.
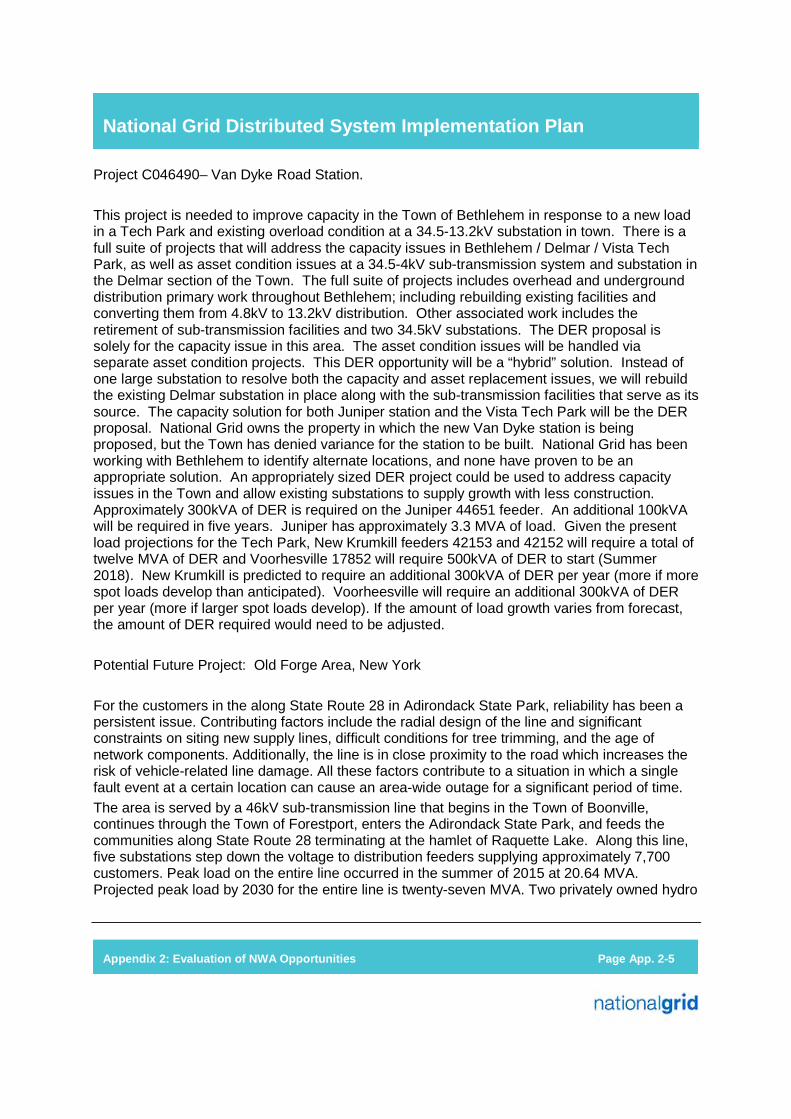
National Grid Distributed System Implementation Plan
Appendix 2: Evaluation of NWA Opportunities Page App. 2-5
Project C046490– Van Dyke Road Station.
This project is needed to improve capacity in the Town of Bethlehem in response to a new loadin a Tech Park and existing overload condition at a 34.5-13.2kV substation in town. There is afull suite of projects that will address the capacity issues in Bethlehem / Delmar / Vista TechPark, as well as asset condition issues at a 34.5-4kV sub-transmission system and substation inthe Delmar section of the Town. The full suite of projects includes overhead and undergrounddistribution primary work throughout Bethlehem; including rebuilding existing facilities andconverting them from 4.8kV to 13.2kV distribution. Other associated work includes theretirement of sub-transmission facilities and two 34.5kV substations. The DER proposal issolely for the capacity issue in this area. The asset condition issues will be handled viaseparate asset condition projects. This DER opportunity will be a “hybrid” solution. Instead ofone large substation to resolve both the capacity and asset replacement issues, we will rebuildthe existing Delmar substation in place along with the sub-transmission facilities that serve as itssource. The capacity solution for both Juniper station and the Vista Tech Park will be the DERproposal. National Grid owns the property in which the new Van Dyke station is beingproposed, but the Town has denied variance for the station to be built. National Grid has beenworking with Bethlehem to identify alternate locations, and none have proven to be anappropriate solution. An appropriately sized DER project could be used to address capacityissues in the Town and allow existing substations to supply growth with less construction.Approximately 300kVA of DER is required on the Juniper 44651 feeder. An additional 100kVAwill be required in five years. Juniper has approximately 3.3 MVA of load. Given the presentload projections for the Tech Park, New Krumkill feeders 42153 and 42152 will require a total oftwelve MVA of DER and Voorhesville 17852 will require 500kVA of DER to start (Summer2018). New Krumkill is predicted to require an additional 300kVA of DER per year (more if morespot loads develop than anticipated). Voorheesville will require an additional 300kVA of DERper year (more if larger spot loads develop). If the amount of load growth varies from forecast,the amount of DER required would need to be adjusted.
Potential Future Project: Old Forge Area, New York
For the customers in the along State Route 28 in Adirondack State Park, reliability has been apersistent issue. Contributing factors include the radial design of the line and significantconstraints on siting new supply lines, difficult conditions for tree trimming, and the age ofnetwork components. Additionally, the line is in close proximity to the road which increases therisk of vehicle-related line damage. All these factors contribute to a situation in which a singlefault event at a certain location can cause an area-wide outage for a significant period of time.
The area is served by a 46kV sub-transmission line that begins in the Town of Boonville,continues through the Town of Forestport, enters the Adirondack State Park, and feeds thecommunities along State Route 28 terminating at the hamlet of Raquette Lake. Along this line,five substations step down the voltage to distribution feeders supplying approximately 7,700customers. Peak load on the entire line occurred in the summer of 2015 at 20.64 MVA.Projected peak load by 2030 for the entire line is twenty-seven MVA. Two privately owned hydro
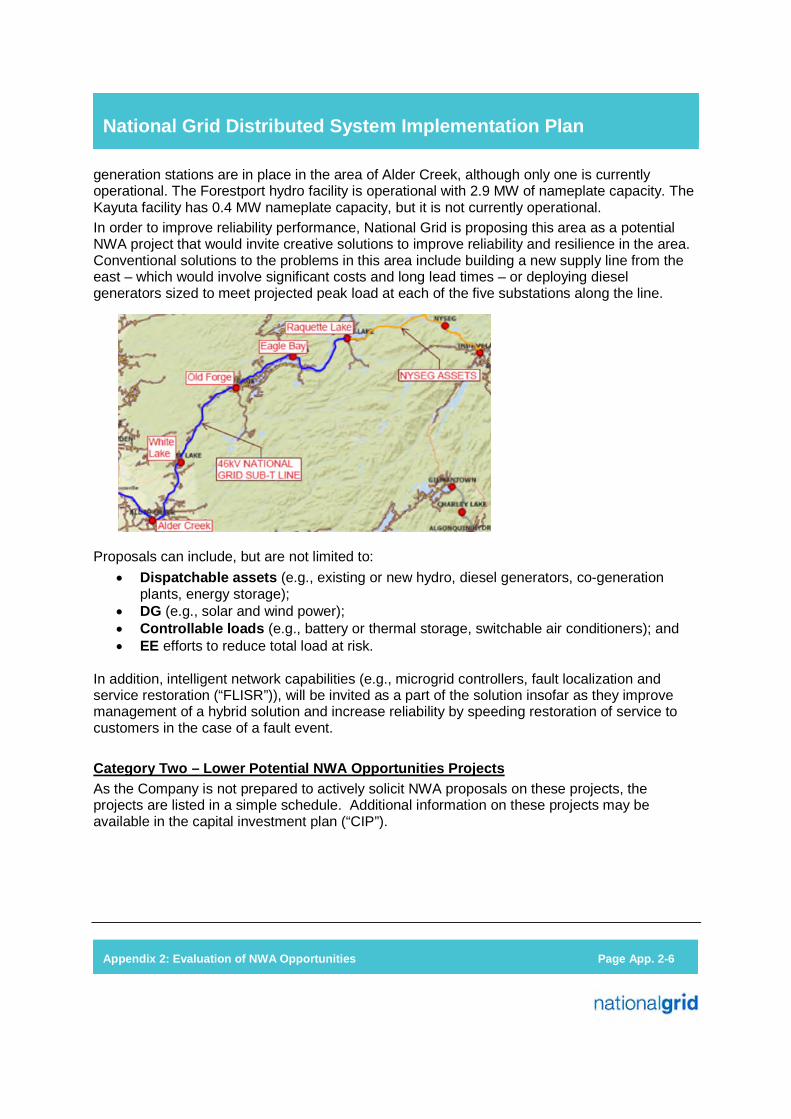
National Grid Distributed System Implementation Plan
Appendix 2: Evaluation of NWA Opportunities Page App. 2-6
generation stations are in place in the area of Alder Creek, although only one is currentlyoperational. The Forestport hydro facility is operational with 2.9 MW of nameplate capacity. TheKayuta facility has 0.4 MW nameplate capacity, but it is not currently operational.
In order to improve reliability performance, National Grid is proposing this area as a potentialNWA project that would invite creative solutions to improve reliability and resilience in the area.Conventional solutions to the problems in this area include building a new supply line from theeast – which would involve significant costs and long lead times – or deploying dieselgenerators sized to meet projected peak load at each of the five substations along the line.
Proposals can include, but are not limited to:
Dispatchable assets (e.g., existing or new hydro, diesel generators, co-generationplants, energy storage);
DG (e.g., solar and wind power); Controllable loads (e.g., battery or thermal storage, switchable air conditioners); and EE efforts to reduce total load at risk.
In addition, intelligent network capabilities (e.g., microgrid controllers, fault localization andservice restoration (“FLISR”)), will be invited as a part of the solution insofar as they improvemanagement of a hybrid solution and increase reliability by speeding restoration of service tocustomers in the case of a fault event.
Category Two – Lower Potential NWA Opportunities ProjectsAs the Company is not prepared to actively solicit NWA proposals on these projects, theprojects are listed in a simple schedule. Additional information on these projects may beavailable in the capital investment plan (“CIP”).

National Grid Distributed System Implementation Plan
Appendix 2: Evaluation of NWA Opportunities Page App. 2-7
NWA ConsiderationsProjectNumber Project Description Project Type
Tran Capex BudgetProgram Code/Dist
Budget Class Planning RegionKAPL is the sole customer on this tap - avoid cost of line build - by DER - this is for KAPL
backup service - they are a 115kV customer CD00898 W. MILTON TAP-34.5KV NEW LINE Sub-T Line Asset Replacement New York - East
The proposed project recommends building a new 2.6 mile long 34.5kV line extension
off of the line side of the 588 disconnect switches of the Selkirk Station 34.5kV bus.
The new conductor will be overbuilt above the existing Selkirk 14951 13.2kV distribution
feeder which is located along existing streets. By re-supplying Callanan Industries, Inc.
off of this new line extension, it allows for the removal of the existing 6.5 mile line. C046641 CALLANAN TAP - REBUILD EXIST 34.5LN Sub-T Line Asset Replacement Distribution - Ny East
Projects associated with Eden and Delameter are both Capacity and Reliability related.
DER could help alleviate the capacity portion of the concern C052023 EDEN SWITCH STRUCTURE -SUBT Sub-T Line Load Relief New York - West
HYBRID Solution - we are looking to retire Chrisler or Emmet St -- Asset condition issues
at both -- Loading issues on Sub-T lines are an issue at Emmet st -- we may be able to
complete DER and keep Emmet instead of rebuilding Chrisler C068290 Chrisler station rebuild Dist sub Asset Replacement Substation - NY East
HYBRID - If Sta. scope minimized may reduce distribution cable work C046929 BUFFALO STATION 53 REBUILD - LINE Dist Line Asset Replacement Distribution - NY West
Possible alternative would be targeted load relief on F8167 via DG or demand response C032751 BEECH AVE CONVERSION NIAGARA FALLS Dist Line Load Relief Distribution - NY West
Overloaded ratio C050085 *MCCLELLAN 51 - UNION ST CONVERSION Dist Line Reliability Distribution - Ny East
Proj relieves limited tie, possible alternative would be targeted load relief via DG or
demand response on all tie feeders (12472, 12475, 5768) C046558 BUFFALO STATION 129 - F12974 RECOND Dist Line Load Relief Distribution - NY West
HYBRID Solution - we are looking to retire Chrisler or Emmet St -- Asset condition issues
at both -- Loading issues on Sub-T lines are an issue at Emmet st -- we may be able to
complete DER and keep Emmet instead of rebuilding Chrisler C064766 CHRISLER REBUILT STATION - DIST GET Dist Line Reliability Distribution - Ny East
Pupose to address load issues at Station 217, possible alternative targeted DG or
demand response on all feeders form Station 217. C036566 MILITARY RD NEW FEEDER 21055 Dist Line Reliability Distribution - NY West
See Chrisler station rebuild C057132 CHRISLER AVE 25737 CONVERSION Dist Line Reliability Distribution - Ny East
See Chrisler station rebuild C057133 CHRISLER AVE 25735 CONVERSION Dist Line Reliability Distribution - Ny East
Projects associated with Eden and Delameter are both Capacity and Reliability related.
DER could help alleviate the capacity portion of the concern C048016 EDEN SWITCH STRUCTURE- NEW FDR 2 Dist Line Load Relief Distribution - NY West
Review options C046627 WATERTOWN NEW 115/13.2 KV SUBSTATIO Dist Sub Reliability Substation - NY Central
Overloaded ratio C051803 CR- 23553 CEDARVALE RATIO RELIEF Dist Line Load Relief Distribution - NY Central
Projects associated with Eden and Delameter are both Capacity and Reliability related.
DER could help alleviate the capacity portion of the concern C047886 DELAMETER F9352 RECONFIGURED LAYOUT Dist Line Reliability Distribution - NY West
Review options C051873 GENSEE ST. FEEDER CONVERSIONS Dist Line Load Relief
Overloaded ratio C052371 95554 HWY 11 - REBUILD Dist Line Load Relief Distribution - NY Central
Overloaded ratio C052106 DEKALB 98455 TOWN LINE RD - REBUILD Dist Line Load Relief Distribution - NY Central
Overloaded ratio C052335 81458 KRING POINT ROAD - REBUILD Dist Line Load Relief Distribution - NY Central
Load & MWh violations C046626 MALONE NEW 89554 FEEDER (LINE WORK Dist Line Load Relief Distribution - NY Central
Load & MWh violations C046610 WATERTOWN NEW 115/13.2 KV SUBSTATIO Dist Line Reliability Distribution - NY Central
HYBRID - If Sta. scope minimized may reduce SubT cable work C046928 BUFFALO STATION 53 REBUILD - 23 KV Sub-T Line Asset Replacement New York - West
Radial tap could consider DG or demand response alternatives C053243 701 LINE - KENSINGTON EXPWY UG Sub-T Line Asset Replacement New York - West
Asset condition issue C046671 ROCK CITY STATION 623 - TRANSFORMER Dist Sub Asset Replacement Substation - NY Central
HYBRID - minimize scope of rebuild with DER. Potential of 3 bays vs 4 bays - Significant
load increase expected at Gate Circle C046519 BUFFALO STATION 30 REBUILD - STA Dist Sub Asset Replacement Substation - NY West
Overloaded ratio C046632 BURDECK 26552 - BURNETT ST CONVERSI Dist Line Load Relief Distribution - Ny East
HYBRID - If Sta. scope minimized may reduce distribution cable work C015754 BUFFALO STATION 30 - REBUILD - FDRS Dist Line Asset Replacement Distribution - NY West
Required due to asset condition - part of overall NF South Plan C046584 WELCH 83 - SUB REFURB D-LINE Dist Line Asset Replacement Distribution - NY West
See Chrisler station rebuild C017952 EMMET ST - REPL TB1 AND MCLAD Dist Line Asset Replacement Distribution - Ny East
DER could help alleviate the capacity portion of the concern C047877 DELAMETER F9356-EXPRESS& REBUILD Dist Line Reliability Distribution - NY West
DER could help alleviate the capacity portion of the concern C046538 EDEN SWITCH STRUCTURE -INSTALL 2-10 Dist Sub Load Relief Substation - NY West
DER could help alleviate the capacity portion of the concern C048015 EDEN SWITCH STRUCTURE- NEW FDR 1 Dist Line Load Relief Distribution - NY West
Mostly MWHr vilotations. One feeder is just over 100% C046475 NEW CICERO SUBSTATION DSUB Dist Sub Reliability Substation - NY Central

National Grid Distributed System Implementation Plan
Appendix 2: Evaluation of NWA Opportunities Page App. 2-8
Category Three – Projects with Very Low NWA PotentialAs the Company is not prepared to actively solicit NWA proposals on these projects, theprojects are listed in a simple schedule. Additional information on these projects may beavailable in the CIP.
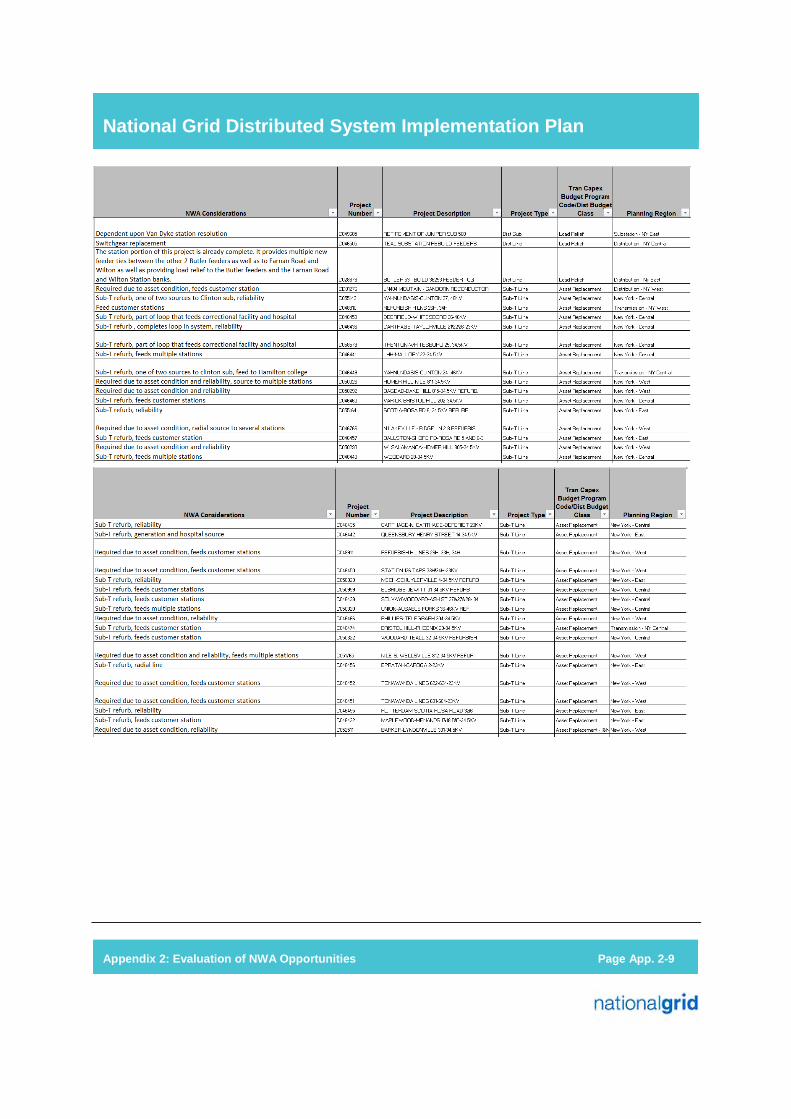
National Grid Distributed System Implementation Plan
Appendix 2: Evaluation of NWA Opportunities Page App. 2-9
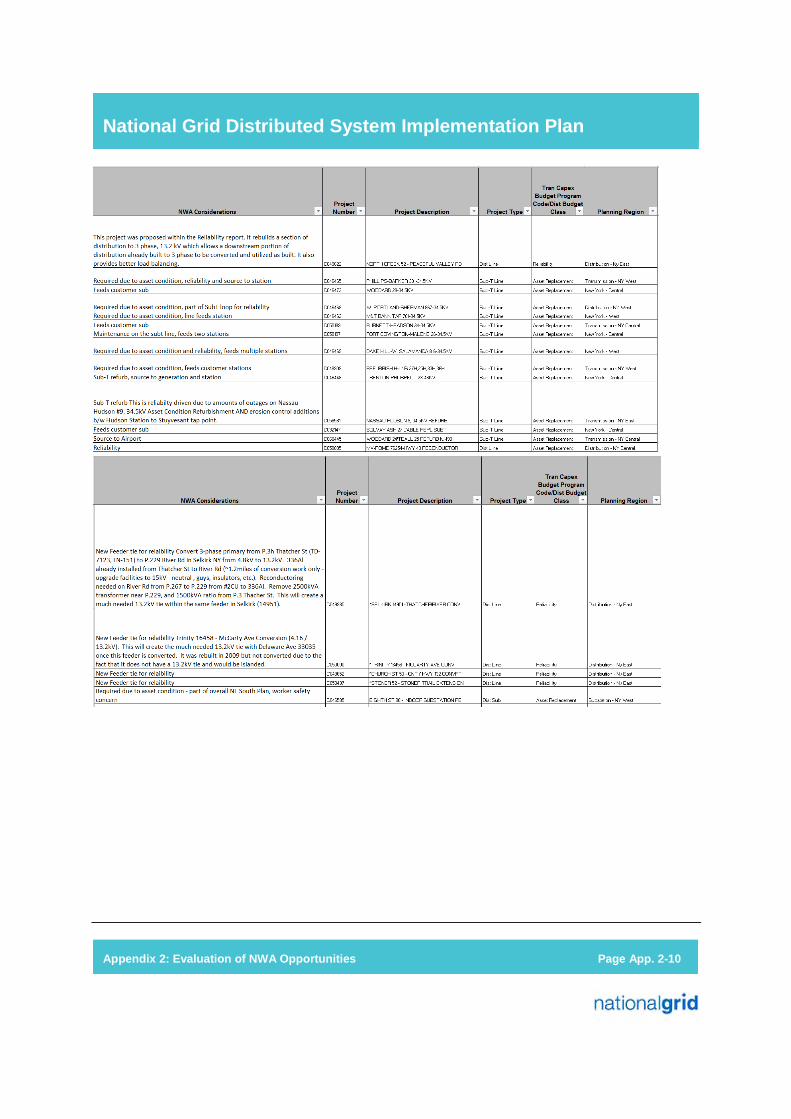
National Grid Distributed System Implementation Plan
Appendix 2: Evaluation of NWA Opportunities Page App. 2-10
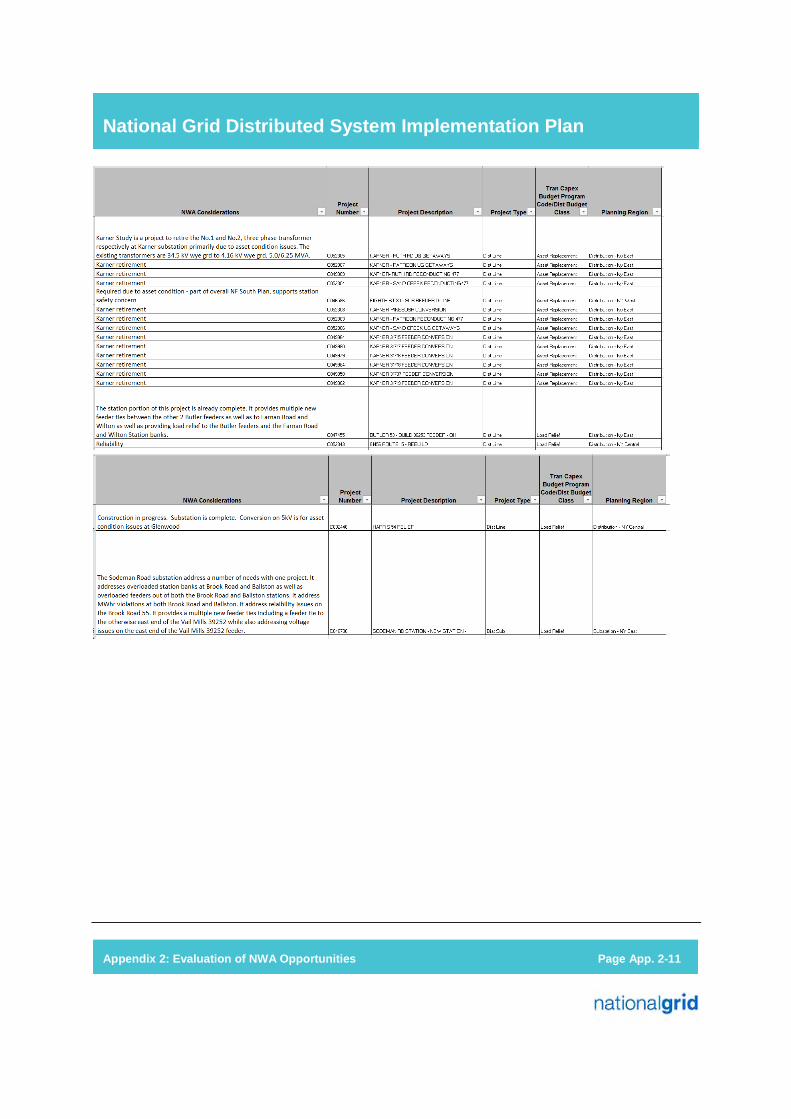
National Grid Distributed System Implementation Plan
Appendix 2: Evaluation of NWA Opportunities Page App. 2-11

National Grid Distributed System Implementation Plan
Appendix 3: AMF Business Case
Appendix 3: AMF Business Case

Electric and Gas
Advanced Metering Functionality
Business Case
for
Niagara Mohawk Power Corporation d/b/a National Grid
June 30, 2016

2
Table of Content 1 EXECUTIVE SUMMARY ........................................................................................................................................................... 4
1.1 The Potential of Advanced Meter Functionality .......................................................................................................... 4 1.2 AMF Deployment Options ............................................................................................................................................ 5 1.3 Common Systems and Functionalities across Deployment Options ........................................................................... 5 1.4 Key Input Assumptions and Sensitivity Analysis .......................................................................................................... 6 1.5 AMF Benefit-Cost Analysis............................................................................................................................................ 8 1.6 AMF Benefit and Cost Components ............................................................................................................................. 8 1.7 Proposed Direction ..................................................................................................................................................... 10 1.8 AMF Deployment Timeline and Investment Plan ...................................................................................................... 10
2 INTRODUCTION .................................................................................................................................................................... 12 2.1 New York REV Overview and DSIP Requirements ..................................................................................................... 12 2.2 Current State Characteristics ...................................................................................................................................... 14
2.2.1 Customer Characteristics ....................................................................................................................................... 14 2.2.2 Existing Metering, Communications and IT Systems in Service Area ................................................................... 15
2.3 Advanced Metering Infrastructure and Supporting Technology Overview .............................................................. 15 2.4 AMF Objectives ........................................................................................................................................................... 16 2.5 Review of Business Case Methodology ...................................................................................................................... 16 2.6 Cross-Jurisdictional Impacts ....................................................................................................................................... 18
3 END TO END ADVANCED METERING FUNCTIONALITY TECHNOLOGIES .............................................................................. 19 3.1 End Point Devices........................................................................................................................................................ 20
3.1.1 Smart Meters ......................................................................................................................................................... 20 3.1.2 DER, ADA, and HAN Devices .................................................................................................................................. 21
3.2 Field Area Network ..................................................................................................................................................... 22 3.2.1 Radio Frequency Mesh Network ............................................................................................................................ 22 3.2.2 Cellular Radios ....................................................................................................................................................... 22 3.2.3 Collectors/Relays/Routers ..................................................................................................................................... 22
3.3 Backhaul ...................................................................................................................................................................... 24 3.4 Systems and Integration – Core AMF/AMI ................................................................................................................ 24
3.4.1 AMI Head-End ........................................................................................................................................................ 24 3.4.2 Meter Data Management System ......................................................................................................................... 24 3.4.3 Data Warehouse .................................................................................................................................................... 25
3.5 Systems and Integration – Secondary AMF Functions ............................................................................................... 25 3.5.1 Platform to Enable Future Capabilities.................................................................................................................. 25 3.5.2 Advanced Distribution Management System ........................................................................................................ 26 3.5.3 Distributed Energy Resource Management Systems ............................................................................................ 28
3.6 Customer Systems ...................................................................................................................................................... 28 3.6.1 Web portal ............................................................................................................................................................. 28 3.6.2 Customer Service System ....................................................................................................................................... 29
3.7 Integrated Network Operations Center ..................................................................................................................... 30 3.7.1 Inventory Tracking System/Asset Management ................................................................................................... 31
3.8 Cyber Security ............................................................................................................................................................. 31 4 PROGRAM IMPLEMENTATION SUPPORT ............................................................................................................................ 32
4.1 Customer Engagement ............................................................................................................................................... 32 4.2 Systems Integration .................................................................................................................................................... 34 4.3 Process Design ............................................................................................................................................................ 34 4.4 Change Management .................................................................................................................................................. 35 4.5 Program Management ................................................................................................................................................ 36
5 SCOPE AND SCHEDULE ......................................................................................................................................................... 36 5.1 AMF Deployment Scenarios ....................................................................................................................................... 36 5.2 Approach to Implementation ..................................................................................................................................... 38
6 BENEFITS ............................................................................................................................................................................... 39 6.1 Customer Benefits ...................................................................................................................................................... 39
6.1.1 Enabling Programs through Third-Party Access to Data ...................................................................................... 39 6.1.2 Enablement of Time-Varying Rates ....................................................................................................................... 39

3
6.1.3 Enablement of Smart Home Devices ..................................................................................................................... 40 6.1.4 Enhanced Customer Energy Management and Reduced Consumption................................................................ 40 6.1.5 Demand Response Participation ............................................................................................................................ 40 6.1.6 Outage Management ............................................................................................................................................ 41 6.1.7 Enhancing Customer Service .................................................................................................................................. 41
6.2 Societal Benefits ......................................................................................................................................................... 42 6.2.1 Greenhouse Gas Emissions Reduction ................................................................................................................... 42 6.2.2 Reliability Improvement ........................................................................................................................................ 42
6.3 Operational Benefits ................................................................................................................................................... 43 6.3.1 Remote Connect Activities ..................................................................................................................................... 43 6.3.2 Remote Disconnect Activities ................................................................................................................................ 43 6.3.3 Remote Meter Configuration ................................................................................................................................. 43 6.3.4 Theft Detection ...................................................................................................................................................... 43 6.3.5 Enhanced Revenue Assurance ............................................................................................................................... 44 6.3.6 Workforce Management ....................................................................................................................................... 44 6.3.7 Grid Planning and Load Management .................................................................................................................. 44 6.3.8 Voltage Abnormality Reporting ............................................................................................................................ 45 6.3.9 Outage Reporting................................................................................................................................................... 45 6.3.10 Reduction in Call Center Volume ...................................................................................................................... 45 6.3.11 Reduction in Bad Debt Net Write Off ................................................................................................................ 45 6.3.12 Reduction in Inactive Use Costs ........................................................................................................................ 46
6.4 Additional Synergies/Coordination Benefits ............................................................................................................. 46 6.4.1 Water Utility/Municipality Revenue Opportunities with Joint Use ...................................................................... 46 6.4.2 AMI for Streetlights ................................................................................................................................................ 47
7 SCENARIO SUMMARY .......................................................................................................................................................... 47 7.1 AMF Benefits ............................................................................................................................................................... 48 7.2 AMF Costs ................................................................................................................................................................... 50 7.3 Potential Areas for Further Cost Reductions.............................................................................................................. 50
8 BCA ANALYSIS ....................................................................................................................................................................... 51 8.1 BCA Tests ..................................................................................................................................................................... 51 8.2 Sensitivity Analysis ..................................................................................................................................................... 52
8.2.1 Key Sensitivities Considered ................................................................................................................................... 52 8.3 Sensitivity Analysis Results ......................................................................................................................................... 53
9 CONCLUSION ........................................................................................................................................................................ 53

4
1 EXECUTIVE SUMMARY
This section summarizes the full business case report that is captured in the following sections of this document.
1.1 The Potential of Advanced Meter Functionality
In response to an evolving regulatory and market landscape in New York State, Niagara Mohawk Power Corporation d/b/a National Grid (“National Grid” or the “Company”) has developed an Advanced Meter Functionality Business Case (“AMF Business Case”). The AMF Business Case demonstrates the viability of a full electric and gas smart meter technology deployment, as well as supporting infrastructure and systems. Such deployment builds the foundation to support fundamental change in the energy future of the Company’s customers, the electric and gas distribution system and the State of New York. By investing in AMF, National Grid will be taking a key step toward achieving the “Reforming the Energy Vision” (“REV”) objectives as adopted in the Public Service Commission’s (“Commission”) Order Adopting Regulatory Policy Framework and Implementation Plan1 and to enabling the Company to assume the role of the Distributed System Platform Provider (“DSP”). These objectives include:
• Empowering greater customer control over energy usage through participation in demand response (“DR”), energy efficiency (“EE”) programs, and pricing programs;
• Allowing granular electric and gas consumption data to be available to customers and approved third-party vendors in a timely and efficient basis;
• Providing customers access to a marketplace, and the ability to choose new and innovative energy solutions from third-party vendors; and
• Increasing electric grid reliability and resiliency.
In the broader context of the REV framework, AMF is a key component for building a robust, dynamic electric distribution grid, well positioned to integrate distributed energy resources (“DERs”) as adoption accelerates. AMF provides the granular and spatial consumption and system information that supports and optimizes many of the planning, grid operations and market functions of the Distributed System Platform Provider (“DSP”). AMF can increase productivity and efficiency, allowing operations to restore outages faster and optimize grid performance, in combination with grid modernization investments. Further, AMF enables DSP planning functions such as demand modeling, load forecasting, and capital investment planning. Beyond the core data granularity and meter-reading-to-bill functions, AMF can act as a coordinated group of sensors stretching across National Grid’s service territory. Combined with other capabilities envisioned in the DSIP, but outside the scope of the AMF Business Case, this ability can enhance the functionality of various systems and business units. An Advanced 1 Case 14-M-0101 – Proceeding on Motion of the Commission in Regard to Reforming the Energy Vision (“REV Proceeding”), Order Adopting Regulatory Policy Framework and Implementation Plan (issued February 26, 2015).
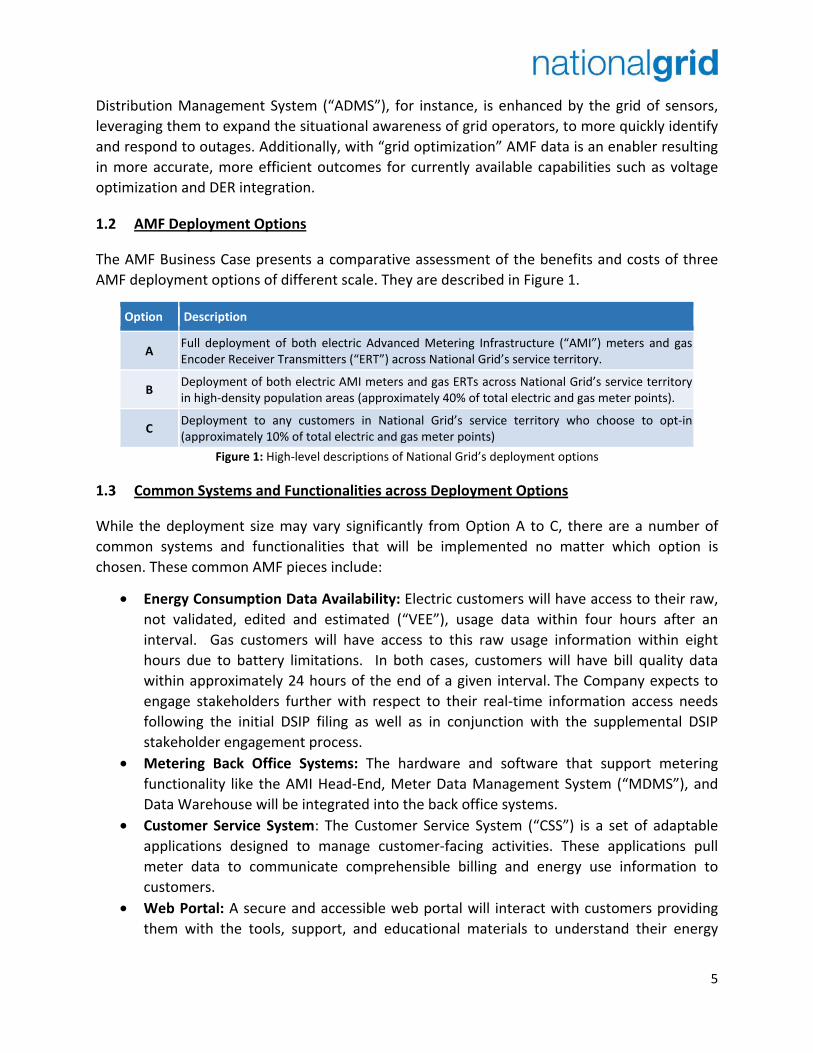
5
Distribution Management System (“ADMS”), for instance, is enhanced by the grid of sensors, leveraging them to expand the situational awareness of grid operators, to more quickly identify and respond to outages. Additionally, with “grid optimization” AMF data is an enabler resulting in more accurate, more efficient outcomes for currently available capabilities such as voltage optimization and DER integration.
1.2 AMF Deployment Options
The AMF Business Case presents a comparative assessment of the benefits and costs of three AMF deployment options of different scale. They are described in Figure 1.
Option Description
A Full deployment of both electric Advanced Metering Infrastructure (“AMI”) meters and gas Encoder Receiver Transmitters (“ERT”) across National Grid’s service territory.
B Deployment of both electric AMI meters and gas ERTs across National Grid’s service territory in high-density population areas (approximately 40% of total electric and gas meter points).
C Deployment to any customers in National Grid’s service territory who choose to opt-in (approximately 10% of total electric and gas meter points)
Figure 1: High-level descriptions of National Grid’s deployment options
1.3 Common Systems and Functionalities across Deployment Options
While the deployment size may vary significantly from Option A to C, there are a number of common systems and functionalities that will be implemented no matter which option is chosen. These common AMF pieces include:
• Energy Consumption Data Availability: Electric customers will have access to their raw, not validated, edited and estimated (“VEE”), usage data within four hours after an interval. Gas customers will have access to this raw usage information within eight hours due to battery limitations. In both cases, customers will have bill quality data within approximately 24 hours of the end of a given interval. The Company expects to engage stakeholders further with respect to their real-time information access needs following the initial DSIP filing as well as in conjunction with the supplemental DSIP stakeholder engagement process.
• Metering Back Office Systems: The hardware and software that support metering functionality like the AMI Head-End, Meter Data Management System (“MDMS”), and Data Warehouse will be integrated into the back office systems.
• Customer Service System: The Customer Service System (“CSS”) is a set of adaptable applications designed to manage customer-facing activities. These applications pull meter data to communicate comprehensible billing and energy use information to customers.
• Web Portal: A secure and accessible web portal will interact with customers providing them with the tools, support, and educational materials to understand their energy

6
consumption data and the insight to manage their energy usage effectively. This interface will empower customers to become active and informed energy consumers.
• Green Button Connect My Data: This system gives every utility customer the ability to securely authorize both National Grid and designated third parties to send and receive their energy usage data.
• Customer Education and Engagement: National Grid is prepared to pair the enabling technology of AMF with proactive customer engagement initiatives in order for the benefits of smart meter technology to be fully realized by the customer. National Grid’s three-stage program prepares customers to engage with the new technology and data streams as well as integrate with other energy modernization efforts.
• Integrated Network Operations: The Integrated Network Operations Center ("INOC”) oversees the day-to-day operations for the smart meter program. This function is a component of the broader INOC that is part of the grid modernization investment plan in the Company’s initial DSIP. The INOC will oversee the AMF rollout and respond to any meter related issues that occur during that phase. Once the rollout is complete, the INOC will mature into the central management hub to mitigate any meter related issues.
1.4 Key Input Assumptions and Sensitivity Analysis
There are a number of key business case input assumptions, both cost and benefit, that have a measurable impact on the results of the benefit-cost analysis. These assumptions are described below including their treatment, if any, in the sensitivity analysis that was performed as part of the AMF Business Case analysis.
• Status Quo AMR Replacement: National Grid currently has a fleet of automatic meter reading (“AMR”) meters covering its service territory that it expects to replace in the early 2020’s according to operational life expectancy documentation from the vendor. The AMF Business Case considers only the AMF costs above and beyond the baseline AMR replacement.
• New York/Massachusetts Back-Office IT/IS Cost Sharing: Back office IT/IS costs can be shared across National Grid’s operating companies. The AMF Business Case evaluates as a sensitivity the impact of shared costs between National Grid and National Grid’s Massachusetts affiliates, Massachusetts Electric and Nantucket Electric. AMF implementation is under consideration for both of these affiliate companies as part of the Massachusetts Grid Modernization proceeding. Hearings in this proceeding are currently scheduled to conclude late this year.
• AMF/Initial DSIP Cost Sharing: Certain cost components, such as IT/IS and Cybersecurity enable both AMF and the other grid modernization and DSP elements of the initial DSIP and thus are appropriately shared with the DSIP filing. If the AMF is approved and elements of the DSIP are not, these shared elements would need to be fully supported by the AMF effort.
7
• Meter Deployment Opt-Out: Meter deployment opt-out is an area with large potential variability due to the uncertainties associated with the public perception of smart meter technology. The experience of other U.S. utilities show opt-out rates as low as one percent while National Grid’s Massachusetts affiliate observed opt-out rates approaching six percent during the Worchester Grid Modernization pilot. National Grid experienced an AMR opt-out rate of approximately one percent. Under Deployment Options A and B the AMF Business Case assumes a two percent opt-out rate.
• Time-Varying Rates Pricing Program Opt-Out: The deployment of AMI meters will be accompanied by new rate structures. These programs do not mandate customer participation, and can be deployed as Opt-In (with approximately 20% participation anticipated) or Opt-Out (with approximately 80-100% participation anticipated, depending on the scenario analyzed). Benefits are significantly more impactful in an Opt-Out approach which is to be considered further as part of the REV Track 2 proceeding. This assumption is evaluated as part of the AMF Business Case sensitivity analysis.
An essential feature of the AMF Business Case analysis was the thorough examination of a range of variables that influence the economics of each deployment option. To articulate the range of likely outcomes for each deployment option two sensitivity scenarios are presented in the benefit-cost analysis. The key deployment option sensitivity scenarios are summarized as follows:
Sensitivity Scenario 1
• National Grid and National Grid’s Massachusetts affiliates share back-office IT/IS costs – Option A: 55%/45% (Upstate New York / Massachusetts), Option B: 42%/57%, and Option C: 15%/85%;
• Time-Varying Rates - Customer participation rates vary among scenarios under an Opt-Out pricing program model. – Option A: 80% participate, Option B: 90% participate, and Option C: 100% participate.
Sensitivity Scenario 2
• All back-office IT/IS costs, 100%, are attributed to the Upstate New York service territory for all deployment scenarios.
• Time-Varying Rates achieve 20% participation for all deployment scenarios under an Opt-In pricing program model.

8
1.5 AMF Benefit-Cost Analysis
The results of the AMF Business Case analysis are found below in Figure 2. The analysis was performed in alignment with the Commission’s recent Order Establishing the Benefit-Cost Analysis Framework (“BCA Order”)2 and the Company’s BCA Handbook.
20-Year NPV ($ in Millions) A: Full Deployment
B: Urban Deployment
C: Dispersed Deployment
Number of Electric Meters 1.7M 0.7M 0.17MNumber of Gas Meter ERTs 0.7M 0.3M 0.07MMA/NY Back-Office IT/IS Cost Sharing NY 55% NY 100% NY 42% NY 100% NY 15% NY 100%Pricing Program Participation Rates 80% 20% 90% 20% 100% 20%Scenario 1 2 1 2 1 2
Benefits SCT Benefits 603.22 451.46 248.09 193.56 143.77 84.69UCT / RIM Benefits 467.54 339.77 195.39 145.33 131.45 73.81
Costs
Capital – Full AMF 382.77 392.21 185.55 197.75 73.37 91.53Capital – AMR Replacement (110.15) (110.15) (43.89) (43.89) (15.67) (15.67)AMF Net Capital Expenditures 272.62 282.06 141.66 153.86 57.80 75.86Operating Expenditures 147.85 168.94 106.08 133.33 150.35 190.67SCT Costs 420.47 451.00 247.74 287.20 208.16 266.53UCT / RIM Costs 420.47 451.00 247.74 287.20 208.16 266.53
SCT Ratio 1.43 1.00 1.00 0.67 0.69 0.32UCT / RIM Ratio 1.11 0.75 0.79 0.51 0.63 0.28Est. Monthly Customer Impact (per meter)3 $ 2.37 $ 2.49 $ 3.04 $ 3.41 $ 9.25 $ 11.58
Figure 2: Benefit-Cost Analysis
1.6 AMF Benefit and Cost Components
The following charts shown in Figures 3 and 4 highlight the major benefit and cost components for Option A – Full Deployment across a 20-year time horizon.
2 REV Proceeding, Order Establishing the Benefit Cost Analysis Framework (issued January 21, 2016) (“BCA Order”). 3 The Estimated Monthly Customer Impact is a value calculated to provide an understanding of how the basic service fee of Upstate New York customers would reflect National Grid’s AMF investment. The dollar per meter value derived for each Option and corresponding Scenario does not reflect a customer class allocation. The value is calculated by (1) present valuing an estimated revenue requirement stream calculated for the 20 year business case timeline, (2) translating the NPV revenue requirement into a levelized annual payment, and (3) distributing the levelized revenue requirement to the in-scope electric and gas meter count on a monthly basis. The initial revenue requirement stream is calculated in accordance with PSC Case No. 12-G-0202 / E-0201, Rate Year Ending March 31, 2016 methodologies.

9
Figure 3: AMF Business Case Benefits Components for Option A
The AMF Business Case analyzed benefits within the BCA Order framework and identified the majority of AMF benefits to be a result of avoided operations and maintenance expenses where the amount of this benefit changes very little from Scenario 1 to Scenario 2. The Opt-Out vs. Opt-In assumption of Critical Peak Pricing (“CPP”) accounts for the major differences in the benefits realization between Scenario 1 and Scenario 2, affecting avoided generation capacity, avoided energy, and avoided greenhouse gases.
The remote metering and communication capabilities of AMI meters and ERTs provide a variety of opportunities for Avoided O&M benefits, the largest benefit category realized by the AMF Business Case. Avoided O&M savings are the direct result of data-driven decision-making by both the utility and the customer. Three subcategories, reduction of meter inspections, remote metering capabilities, and improvement in bad debt write-offs, make up approximately 90% of Avoided O&M savings. These savings come when labor and vehicle resources are reduced because on- premise visits are no longer required to investigate, connect, or disconnect a meter after the proper customer contact process has been performed. In addition, data granularity and remote disconnect capabilities together improve debt collections and reduce the Company’s net write-off expense.
Figure 4: AMF Business Case Cost Components for Option A

10
In both scenarios, meter and ERT equipment and installation together account for approximately half of the AMF cost. The software, labor, and hosting and analytics capabilities housed within the Information Technology and Systems Integration costs portion contribute over one-quarter of the total cost.
1.7 Proposed Direction
The BCA Order’s Societal Cost Test (“SCT”), Utility Cost Test (“UCT”) and Rate Impact Measure (“RIM”) support the pursuit of Option A, Full AMF Deployment across National Grid’s electric and gas service territory. The number and large expense for systems that allow meters and ERTs to be brought online falls marginally as the scope of deployment decreases from Option A to C. As such Option A, Full Deployment, spreads consistently large costs out over the largest group of customers, making it the most economical on a per meter basis. Beyond the economics, there are a number of intangible benefits associated with AMF, the most important being the ability to put National Grid on the path toward achieving REV goals and positioning National Grid to help usher in an energy future for the benefit of its customers and the State of New York.
1.8 AMF Deployment Timeline and Investment Plan
The proposed AMF implementation timeline is six years beginning in fiscal year 2019.
Figure 5: National Grid implementation schedule
The start date for the project reflects the time required to engage stakeholders following the initial DSIP filing to further develop and refine the plan, and to achieve regulatory approval either separately or as part of a general rate case. The anticipated timing of the filing of National Grid’s next electric and gas general rate case is within the first half of 2017. Year 1 of AMF implementation includes detailed technology design and the formal procurement process,

11
followed by the installation of back office systems and communication infrastructure. This will be followed by a five-year meter and ERT installation program.
Capital and O&M investments in the first five years are estimated at approximately $256M (in 2016 dollars) and an additional $316M (in 2016 dollars) is forecasted over the subsequent five year period. The annual spending is included Figure 6 below.
(Investments are estimated in 2006 dollars)
Figure 6: AMF high-level investment plan

12
2 INTRODUCTION
National Grid’s AMF Business Case was developed in response to an evolving regulatory and market landscape in New York State. The AMF Business Case assesses alternative AMF deployment options and demonstrates the viability of a full electric and gas smart meter technology deployment to all National Grid customers, as well as supporting infrastructure and systems. This program builds the foundation to support fundamental change in the energy future of our customers, the electric distribution system and the State of New York. New technologies, especially in the areas of communications and coordinated controls, can enable significant changes in customers’ experiences and empowerment, as well as in how the grid operates. These technologies, which have only become cost effective and more widely used recently, are central to the opportunities envisioned in the Public Service Commission’s (“PSC”) REV goals.
National Grid’s AMF Business Case evaluates the benefits and costs of the advanced metering functionalities and underlying enabling technologies to move operation of the distribution grid towards greater levels of efficiency and reliability. The AMF Business Case also enables new sources of innovation and a cleaner and more environmentally-friendly industry. Under an AMF-enabled future, customers will have more information and greater control over their energy usage and associated costs, access to an energy marketplace, and the ability to choose new and innovative energy solutions from vendors. Further, AMF enables the use of metering data to support other DSP planning functions such as demand modeling, load forecasting, and capital investment planning.
2.1 New York REV Overview and DSIP Requirements
REV and other REV-related proceedings are focused on transforming New York's retail electricity market and its energy efficiency and renewable energy programs. The vision of REV is a cleaner, more affordable, more modern, and more efficient energy system across the state of New York. For utilities, these gains are manifest through six objectives:
• Empowering New Yorker’s to make more informed energy choices and providing them the tools and insight to manage energy usage effectively;
• Animating a consumer energy market environment for third-party energy solution providers to attract and deploy capital and create new business opportunities;
• System-wide efficiency gains by operating more effectively across all aspects of the grid including generation, transmission, and distribution;
• Greater fuel and energy diversity by supporting a broad range of renewable and EE initiatives and reducing soft costs and other market barriers;
• System reliability and resiliency improvements through the integration of DERs into the grid during both ‘blue sky’ days and significant system events; and
• Cutting Greenhouse Gas Emission 80% by 2050.
By investing in AMF, National Grid will be taking a key step toward achieving these REV objectives as well as enabling the Company to assume the role of the DSP. In this role, utilities

13
will construct, operate, and maintain highly integrated technology platforms, allowing the incorporation of third-party owned DERs, which can include DR, EE, storage, and on-site generation. These technologies will be tightly integrated into the utilities’ distribution infrastructure. Ultimately, enhanced monitoring and control of these resources may support the establishment of a marketplace where commodities from these resources can be exchanged between Energy Service Companies (“ESCOs”), aggregators, customers, and other interested parties.
The Distributed System Implementation Plan Guidance (“DSIP Guidance”) found that “advanced metering functionality will be an important contribution to enabling utilities to assume the role of the DSP” (page 58 of DSIP order). The DSIP guidance called for utilities to include a summary of the most up-to-date AMI rollout plans over the next five years in their Initial DSIP filings. The DSIP Guidance also requires AMI proposals to be accompanied by a detailed business plan and specified minimum business plan requirements which are addressed herein.
The initial DSIP requirements are organized into three categories: Distribution System Planning, Distribution Grid Operations, and Market Operations. Each of the three categories have a number of requirements associated with it, which may be seen in Figure 7. The goals of AMF deployment most closely align with the objectives described in the Market Operations category. This is understandable given that the technology and systems associated with standing up smart meters build the foundation for market operations.
Distribution System Planning Distribution Grid Operations Market Operations
• Forecasting demand and energy growth;
• DER investment planning and programs;
• Capital Investment Planning; • DER deployment planning; • Grid infrastructure investment
planning; and • Probabilistic Modeling and Load
Flow Analyses.
• Systems operations;• Situational Awareness; • Volt/VAR optimization; and • Streamlining the interconnection
process.
• Greater data granularity; • Data accessibility for consumer
and market participants; • Greater transparency to market
participants of system and operations needs; and
• Ensuring privacy and security.
Figure 7: DSIP categories and objectives
The Initial DSIP is a comprehensive plan that considers numerous components working together in an integrated fashion. In performing this assessment, the full scope of the DSIP was considered with the central assumption that AMF will be deployed as part of this larger whole. Thus, if direction is given that AMF needs to exist independently, additional analysis will be required to determine the full standalone costs, as certain Initial DSIP costs are currently structured in a way where they are shared by the multiple enabling capabilities across the programs.

14
With this key assumption in mind, there are three AMF deployment options evaluated and presented as a part of the AMF Business Case. The three options may be seen in Figure 8 and are discussed in greater detail in the following sections of this report.
Option Description
A Full deployment of both electric AMI meters and gas ERTs across National Grid’s service territory.
B Deployment of both electric AMI meters and gas ERTs across National Grid’s service territory in high-density population areas (approximately 40% of total electric and gas meter points).
C Deployment to any customers in National Grid’s service territory who choose to opt-in (approximately 10% of total electric and gas meter points) Figure 8: High-level descriptions of National Grid’s deployment options
2.2 Current State Characteristics
2.2.1 Customer Characteristics
National Grid’s Upstate New York service territory spans more than 25,000 square miles and actively supports approximately 1.7 million electric and more than 680,000 gas metering points. Dual fuel customers total around 500,000. The service territory is not contiguous, and it spans from the eastern to western to northern borders of the state. Customer density also varies significantly throughout the service area from dense urban to very rural.
Figure 9: National Grid’s Upstate New York service territory

15
In addition, National Grid tracks approximately 170,000 electric and 90,000 gas meters which are inactive at any given point. Approximately one-third of these meters have been inactive for less than one year and are therefore considered temporarily inactive. Analysis for AMF deployment has considered all active and temporarily inactive meters.
2.2.2 Existing Metering, Communications and IT Systems in Service Area
The majority of electric and gas meters throughout the Upstate New York territory use AMR technology. The meters were originally deployed in a major program during the period 2002 through 2004. Approximately 99% of customers in the territory have electric and gas meters, where monthly reads are acquired through radio frequency collection. These collections are done by a fleet of company service vans which drive along routes to allow communication with each meter. The majority of these meters are scheduled for replacement in the early 2020’s based on their operational life expectancy.
In addition, a small number of larger wholesale C&I customers and retail customers have interval meters, which currently communicate through public cellular connections or through wireless TCP/IP communication modules.
2.3 Advanced Metering Infrastructure and Supporting Technology Overview
Figure 10: Illustration of smart meters and supporting technology
The AMF program is based on the concept of transitioning from the current fleet of AMR meters to an AMI for all options. The components of this upgraded metering architecture are illustrated in Figure 10. As shown, it is comprised of AMI meters for electric customers and ERTs

16
for gas customers, a wireless communications infrastructure, and various back-office systems which securely capture and store electricity and gas consumption data.
These technologies allow for greater granularity in measuring customer energy consumption for billing, remote meter reading, remote disconnect/reconnect, and enhanced diagnostic capabilities to assess outage for all customers who receive a smart meter. These meters and their associated infrastructure are assumed to be deployed across the upstate New York territory over a six-year timeframe.
2.4 AMF Objectives
As a key element of the PSC’s REV vision, AMF will be the enabling framework to engage customers and third party providers. The objectives include:
• Empowering greater customer control over energy usage through participation in DR, EE programs, and pricing programs;
• Allowing granular electric and gas consumption data to be available to customers and approved third party vendors in a timely and efficient basis;
• Providing customers access to a marketplace, and the ability to choose new and innovative energy solutions from vendors; and
• Increasing grid reliability and resiliency.
2.5 Review of Business Case Methodology
Figure 11: Depiction of the AMF Business Case methodology
The methodology to produce the AMF Business Case, as illustrated in Figure 11, was implemented over the course of 10 weeks and consisted of six steps.
1. The initial phase was the project kickoff where the team aligned expectation and scope, walked through the approach, set the project work plan, timeline, and deliverable due dates;

17
2. From there the team performed an in-depth review of the AMF functionalities and capabilities National Grid would like to include in the AMF Business Case model. The team detailed the technologies and systems considered in-scope, targeted customer populations and rate classes, implementation timeline, deployment length, and potential cross-jurisdictional benefits;
3. The team also defined the benefit and cost calculations expected as part of the filing and aligned them to the PSC’s Benefit-Cost Analysis (“BCA”) framework. The agreed upon calculations included in the model, along with several workshops, helped the team define the “as-is” system and infrastructure conditions. These workshops also helped align the core team and the wider group of stakeholders of expectations and data needs;
4. Once a sufficient amount of data was received the team started to build and customize the AMF Business Case model and conduct reviews with the core team and wider company stakeholders;
5. These reviews were pivotal in refining the scenarios, and defining and analyzing the associated risks;
6. Upon receiving general consensus that the inputs were in-line with expectations and the benefits and costs for each scenario aligned to publically available information on AMI deployment and other National Grid programs, sensitivities, and risk analysis were performed, which are all detailed later in this AMF Business Case.
The data flow of this model, which may be seen in Figure 12, processes various data inputs provided by National Grid (and augmented with estimates where necessary) to build high-level costs and associated benefits of AMF installation. These inputs, combined with deployment schedules, enable the team to build annualized costs and benefits for the electric smart meter deployment. This base case combined with the incremental costs and benefits of a simultaneous gas ERT deployment and the depreciation schedules drive the revenue requirements.

18
Figure 12: Depiction of the AMF Business Case tool
2.6 Cross-Jurisdictional Impacts
As part of the AMF Business Case scope, a high-level assessment of the AMF systems and functions was performed to ascertain the potential to leverage these components across operating companies. While many components by their nature are exclusively dedicated to the Upstate New York territory, there are others that have the potential to be scaled such that they can be utilized across jurisdictions. A number of assumptions were made in this area that will be reviewed and refined as the AMF Business Case is advanced into a filing for regulatory approval.
National Grid’s Massachusetts affiliates spent approximately 18-months developing a comprehensive plan for distribution grid modernization, which is materially similar to the platform envisioned for Upstate New York. This plan was filed with Massachusetts regulators in September 2015 and is still being evaluated. Many of the concepts, learnings, and directional cost estimates have been shared internally as part of this AMF Business Case to establish many parameters for the baseline AMF Business Case.
In reviewing the Massachusetts plan and developing the New York plan, there are numerous functional requirements in common for both jurisdictions that can fairly easily be scaled to minimize redundant costs and effort and maximize efficiencies across both territories. There are unique considerations in each of the territories to be accommodated, but the core overlapping assets and associated efforts will be similar, and include:
• Customer Service System (“CSS”) modifications – to handle more granular meter reading information for bill processing;

19
• Meter Data Management System (“MDMS”) – to handle more granular meter data which in turn enables customer analytics;
• Advanced Metering Infrastructure Head End (“AHE”) – to manage data collection and distribution between meters in the field and back-office systems;
• Systems Integration (“SI”) – various information technology services required to manage data interfaces between different systems; and
• Process Design – definition of new processes to be followed by field and office workers to maximize the effectiveness of the new system.
Ideally, the Massachusetts Grid Modernization program will be approved, and these efficiencies can be fully realized. However, various assumptions and risks should be acknowledged which may have a significant bearing on the economics of the AMF Business Case as articulated throughout. These include:
• Cost Sharing & Give Backs: Regulators in Massachusetts would likely require costs initially born by Massachusetts ratepayers to be reimbursed or shared by New York ratepayers; the team assumed that total back-office IT/IS costs will be pro-rated based on metering points count per jurisdiction and allocated between Massachusetts and New York accordingly.
• Massachusetts Grid Modernization Rejection: If Massachusetts regulators reject or require significant modifications to the Grid Modernization plan, but New York approves the Upstate New York AMF portion of the DSIP, all systems and integrations enabling the New York platform will need to be supported by New York customers, which in turn impacts the economics of the AMF Business Case.
• Enterprise Standardization: Many efficiencies can be realized where programs, capabilities, and data flows are identical between jurisdictions. Where operational considerations vary for unique market conditions or regulatory constraints; customizations will erode these efficiencies and impact the economics of the AMF Business Case.
3 END TO END ADVANCED METERING FUNCTIONALITY TECHNOLOGIES
The following descriptions of the end to end metering technologies are meant to provide a broad explanation of the capabilities of individual components that will be largely unchanged across the three options presented in this document. Based on numerous past engagements, the team has found these components and technologies necessary to implement and operate an effective and efficient AMF platform.
As the AMF Business Case is conceptual at this point, descriptions of components and capabilities defined herein do not constitute a complete list, nor are they linked to any particular vendor or vendors. Rather, it is intended to be directional in nature, establishing the order of magnitude of a comprehensive scope of deployment.

20
A full articulation of the scope and details on the capabilities will be defined following stakeholder input and considerations raised by PSC.
3.1 End Point Devices
3.1.1 Smart Meters
A smart meter is an electronic device used to measure electricity and/or gas consumption at residential, commercial, and industrial locations. This device then digitally communicates the interval data using two-way telecommunications infrastructure. These devices can be equipped to leverage either a cellular radio or a mesh network, to interface with a utility’s backhaul and back-office systems.
In all cases, it is expected that electric meters will have a full kit upgrade including meter, module, and communications device. With gas meters only the ERT module (a communication device that is capable of securely and efficiently sending information packets a short distance) is expected to be switched out. Gas regulators and meters were not included as part of the scope of this program and will continue to be replaced per current O&M schedules (understood to be approximately 20,000 meters per year).
A smart meter has a number of capabilities depending on the type of meter and whether it measures electricity or gas:
3.1.1.1 Capabilities of both gas and electric meters:
• Tamper detection; • Better, more reliable measurement; • Real-time data query: As initiated by customers through the web portal, customer
service agents, or control center operators, the meter can be pinged to report current readings which can then be used to determine power consumption, outage status, voltage status, and other characteristics;
• Interval granularity: Meters are typically configured to capture energy consumption at 15-minute intervals. As the concept of near real-time data takes hold, more frequent consumption checks, on the order of five minutes, may occur; and
• Reading frequency: Energy consumption data is typically transmitted back to the AMI Head-End three to four times a day. This data transmission may eventually be streamed in near real-time allowing customers to view their energy usage from moment to moment.
3.1.1.2 Capabilities of electric meters only:
• Ability to provide voltage monitoring and real-time notifications for voltage violations; • Power outage notifications (“PON”) where the meter automatically notifies the back-
office systems of a loss of power;

21
• Power restoration notifications (“PRN”) where meters proactively communicate that power has been restored;
• Remote connect, disconnect, and reconnect as allowed by state regulations; • ZigBee communications to interact with Home Area Network (“HAN”) devices as last
mile of DSP-initiated DR capabilities; • ZigBee communications enabled real-time monitoring: ZigBee can independently
interact with other customer procured monitoring equipment for real-time monitoring; • Dead-band settings to locally communicate load changes whenever consumption
patterns alter by more than 10 watts; • Remote firmware upgrades: Allows for enhanced capabilities to be deployed over time,
as well as timely updates to address security threats as identified, without the need for manual intervention; and
• Remote diagnostic: National Grid’s INOC will have a dedicated smart meter monitoring function that can ping individual meters to test communication pathways and responsiveness.
3.1.1.3 Capabilities of gas modules only:
• Remote disconnects (assuming meters are also replaced); • 20-year battery while supporting standard data collection patterns (e.g., 15-minute
intervals, collected three times daily, with approximately three firmware upgrades throughout its deployment lifespan); and
• Five-year expected battery life for any meters where customers have opted for advanced data collection patterns (e.g., 15-minute intervals, collected hourly, with approximately 3 firmware upgrades throughout its deployment lifespan).
3.1.2 DER, ADA, and HAN Devices
As National Grid’s AMF capability stabilizes and medium-term DSIP initiatives are considered, additional grid modernization technologies could potentially leverage the mesh network anticipated to be constructed as a part of AMF. These additional technologies include:
• Advanced distribution automation (“ADA”) devices typically include fault current indicators (“FCI”), capacitor banks, and voltage regulators;
• DERs vary from residential to utility scale and can include technologies such as energy storage, electric vehicles, solar generation, and fuel cells.
• ZigBee-based HAN devices like thermostats, water heaters, and pool pumps that may be enabled to communicate with the utility for DR initiatives.
These devices have the potential to increase the capability of the network by adding to the density of the mesh network, while performing their dedicated tasks on the grid.

22
3.2 Field Area Network
Embedded within each meter is a communications module that enables the meter to communicate with back office systems. These modules can either be outfitted with mesh or cellular radios, each of which is best suited to a different set of project economics. Circumstances like relatively populated densities, topography, seasonal conditions, and other strategic factors may influence the type of communication utilized. By understanding the economic and strategic considerations and combining these modules appropriately, an optimal deployment can be achieved.
3.2.1 Radio Frequency Mesh Network
The radio frequency mesh network is created by including a low-power, short-range radio in each meter. Each meter is able to transmit its own load profile as well as a finite collection of data from downstream meters. All meters with this technology dynamically communicate with each other to identify optimal communication pathways back to centralized data collection points. In doing so, these networks of devices can self-identify the most efficient paths on an ongoing basis and dynamically reconfigure to maintain optimal routing in varying operational situations.
For most urban/suburban areas where a sufficient population density exists, National Grid will utilize this radio frequency mesh network to facilitate meter communication with the backhaul system. The meters will utilize a relay/router system to transmit the meter data back to the back-office systems, as well as transmit data from the back office to the meters in the field in a bi-direction manner.
When possible, the electric meter will serve as the communications platform for the gas meter. The platform will enable communication between the gas meters and the back-office systems while efficiently optimizing impacts to the gas meter’s battery life.
3.2.2 Cellular Radios
In certain circumstances, a cellular radio will be used instead of the mesh network. The conditions for cellular radio use include economic or strategic reasons, lack of population density to support a mesh network, and C&I customers with a sufficient magnitude of energy usage to warrant closer observation.
For deployment Options A and B, it is assumed that approximately five percent of devices will be direct cellular. Under Option C, the opt-in scenario, our assumption is 100% of meters will be outfitted with cellular radios.
3.2.3 Collectors/Relays/Routers
Collectors, relays, and routers are the equipment that facilitates transmission of data from the mesh network linked smart meters to the back-office systems. It should be noted that there are

23
innumerable infrastructure configurations possible for the communications network. The transmission of data may utilize multiple types of devices from a variety of vendors, which pull in and transmit data to the next node in the communications pathway on the way to the back-office system.
The collectors, relays, and routers have a number of characteristics that enable communications efficiency and effectiveness. They are:
• The network is able to rearrange itself dynamically to maintain the most efficient communications pathways across seasons, varying weather conditions and vegetation cycles;
• In the event of a power outage, the FAN will stay up long enough to transmit a power-off notification to alert the outage management system (“OMS”) of the problem;
• Multiple types of devices that collect and transmit digital interval data: o Collectors: larger bandwidth devices for maximum throughput of data to manage
data collections; o Relays: smaller device that is used to extend the range of communications for
Spur; and o Meters: small short range device used to aggregate a small number of meters.
It should be noted that, depending on overall network design and configurations implemented in each device, data transmission can slow. While typically not problematic for standard meter data used exclusively for billing purposes, more advanced use cases could demonstrate sub-optimal performance if design thresholds are violated. As such, this means of communication should be a fit for purpose design. Discussions for this AMF implementation have explicitly anticipated that DER, reclosers, and certain DR capabilities would not be communicating through the AMF wireless communications network.
3.2.3.1 Real-Time Smart Meter Data Collection
As part of the AMF Business Case, various emerging capabilities were reviewed in the smart meter landscape. One feature on the horizon is the near real-time data collection from smart meters that allows bill quality data to be accessible for customer download within several hours of billing interval completion.
It should be noted that real-time data collection is conceptual at the time this report was finalized. While metering vendors in this space have given estimates of the achievability of “real-time” data collection, limited deployments with this level of data capture have been identified for benchmarking purposes.
However, for this capability to be implemented, it is reasonable to estimate that additional infrastructure is required to meet an enhanced service level. As such, approximately 10% more additional collectors, relays, and routers would be required in each scenario to support more frequent communication and to compensate for bottlenecks.
24
3.3 Backhaul
The backhaul network, which is typically a wide area network (“WAN”), is the high-speed, high-bandwidth communications structure between the collectors and the AMI Head-End. The network can either be public or private depending on several factors, including cost (both upfront and reoccurring), security, meter density in the area and distance from the existing fiber network.
A private system would have collectors daisy chained to centralized fiber optic or microwave communications infrastructure. A public system would utilize the network of a third party vendor, typically a wireless cellular carrier, to transmit the data from collectors to the AMI Head-End. Given National Grid’s extensive Upstate New York territory, its varied topography, and the expected financial impact of extending a private network across the region, for Options A and B of the AMF Business Case the backhaul will leverage a public cellular telecommunications network to transmit the aggregated data from the collectors and routers to the back-office systems. In consideration of Option C, the meters will directly connect to the public backhaul for data transmission.
3.4 Systems and Integration – Core AMF/AMI
3.4.1 AMI Head-End
The AMI Head-End is the communication, command, and control system that integrates the communications infrastructure in the field and the back office systems. The AMI Head-End communicates with the smart meters to collect meter data from reads and events. It also can ping individual meters as necessary and push firmware updates across the network. For electrical systems, it can remotely initiate the connection and disconnection of meters. This system serves as the main point of data collection and disbursement for data being transmitted in either direction, to/from meters.
3.4.2 Meter Data Management System
An effective AMF platform requires an MDMS. The MDMS provides smart meter data storage and archival capabilities for interval meter read information. The MDMS also processes the incoming meter data by VEE the interval data that is received by the program. Once the raw data has been processed, it can be utilized by back-office systems like billing, customer service, and data analytics. In addition, the data can be uploaded to the web portal for customer use and/or authorized market participants.
An important function of the MDMS is the VEE process. This is a method where the MDMS reviews all un-validated data from the smart meters in an effort to identify anomalies. This is data that fails validation because it falls outside an expected range and is flagged for review by metering agents. In addition to failed validations, incomplete or missing interval reads are also

25
highlighted. These flagged data intervals are estimated as the final step of the process and can be updated once additional data has been received or the original data has been validated.
3.4.2.1 Real-Time Smart Meter Data Collection
While the baseline capability proposed is to provide bill quality data within 24 hours of collection (after VEE processing), several possible scenarios have been evaluated as part of the AMF Business Case to expedite this process. Due to the increased processing requirement of the system, approximately 50% more server hardware will be necessary to process this information within several hours of the end of a specified interval.
At the time this report was finalized, real-time data collection was still conceptual, and therefore no specifications for system architecture could be defined. Vendors in this space have given estimates of the achievability of “real-time” data collection and processing. Limited deployments, with this level of data capture, have been performed. At this time, only estimates of additional processing infrastructure are available, and therefore have a lower degree of certainty.
3.4.3 Data Warehouse
The data warehouse is the back-office system that is the main archival database for the other systems. It is integrated across the back-office and provides archive support and retrieval functions. Due to the increase in the volume of information associated with AMF data granularity, the capacity to support data warehouse functionality will need to be augmented accordingly. A fully integrated data warehouse provides the following benefits:
• Central archive and data repository; • Links multiple systems and facilitates data communication; • Speeds up retrieval as it combines traditionally separate data archives; and • Enables analytic capabilities for insights.
3.5 Systems and Integration – Secondary AMF Functions
3.5.1 Platform to Enable Future Capabilities
While the back-office systems of the previous section enable the core meter reading-to-bill function, National Grid’s AMF vision transcends these historic boundaries to establish a foundation for emerging capabilities. The future state DSP will function in a way where meters perform double-duty by acting as a coordinated group of sensors throughout the territory. Combined with other capabilities envisioned in the DSIP, but outside the scope of the AMF Business Case, this enhanced metering data can be leveraged more holistically by various business units. These are units that have historically operated more independently; this is particularly true with real-time operations.

26
The primary mission of real-time operations has been to restore outages as efficiently as possible and coordinate planned outages for maintenance and construction. However, in the context of modern-day customer expectations, technological advancement, and REV objectives, a new mission of “grid optimization” is emerging as a parallel to these historical themes. In this sense, AMF data is an enabler resulting in more accurate, more efficient outcomes for currently available capabilities such as outage location, voltage optimization, and DER integration, which are articulated further below.
In a broader historical context, it is important to note that the trend toward AMI, and these currently identified AMF capabilities, are still relatively new. New market participants, vendors, consultants, and ESCOs have been focused on electrical distribution like never before, resulting from the innovations currently being seen throughout the industry and being considered for implementation at National Grid. All indicators point to this trend continuing, if not escalating. While some of these capabilities are not yet known or possible to yet define, it is certainly reasonable to expect that use cases will emerge and utilize the information available from AMF.
3.5.2 Advanced Distribution Management System
Advanced Distribution Management System (“ADMS”) is the emerging standard software suite used by distribution grid operators. It combines the traditional function of an OMS with newer functions captured by a distribution management system (“DMS”). While the functions of an ADMS are numerous, only a subset are covered in this report as applicable to AMF.
One of ADMS’s core capabilities is to consolidate pertinent data from, and exert real-time control over, a variety of ADA devices like reclosers, capacitor banks, load-tap changers, voltage regulators, and fault current indicators. These devices can be coordinated by the ADMS to provide greater capabilities than what would be achievable if each device were to operate independently. Two notable functions are fault location, isolation, and service restoration (“FLISR”) and Volt/VAR Optimization (“VVO”). AMF enhances each of these functions by providing additional data points for computation and algorithmic adjustment. ADMS will monitor distribution operations grid-wide and can provide indirect benefits to every customer even if they are located on circuits where no ADA and VVO devices were deployed and/or opted out of direct participation in the smart meter program.
ADMS significantly expands situational awareness for grid operators through a real-time view of system conditions. However, its critical function is to act as a coordination hub for the other systems and components, enhancing their effectiveness beyond the contribution of the individual components. An example of the synergies created by the systems communicating through a central hub is an outage event. During an outage event, AMI notifications can map the extent of the meters reporting a power outage. This data can then be used to coordinate ADA activities in the area of the outage to minimize its extent, and for circuits that can be reconnected, circuit voltages can be synchronized to restore power. These activities can all occur from the operations center.
27
Further, data collected from meters can be used to develop more accurate load profiles for individual circuits. These are used within the ADMS as the basis for various algorithms.
3.5.2.1 Volt/VAR Optimization
VVO represents a family of optimization algorithms that can be deployed during various situations to improve operational characteristics. By monitoring and controlling capacitor banks, voltage regulators, and load tap changers, VVO algorithms can in some cases reduce energy consumption for all customers on a circuit by two to three percent without negatively impacting the customer experience. The operation of this function can be highly automated or initiated by direct operator intervention.
The ability to monitor grid conditions and automatically regulate power flow is especially important today. DERs, especially rooftop solar, have become more economical and efficient in recent years. In certain areas they have experienced substantial grid penetration, and this trend is expected to continue if not increase. While DERs have many benefits, the distribution network was not initially designed with non-point power sources in mind. Even though there is a certain robustness to the systems, over time, especially with greater DER penetration, volatility of power flow will increase (i.e. solar photovoltaics supplying power only during the day) and will make optimization all the more important. VVO has several benefits:
• Higher level of operator visibility into system operating parameters; • Greater control over reliable and consistent energy delivery; and • Greater control over optimizing EE, thereby saving customers money and emitting fewer
greenhouse gasses.
Smart meters can enhance VVO further by designating a specific subset of meters as “Bellwether” meters. A bellwether meter is one that is configured to provide additional voltage data with greater frequency. They are particularly useful when placed at the end of a circuit where they perform the function of an end of line voltage monitor. This additional information can be leveraged in VVO calculations and to refine VVO adjustment algorithms further.
3.5.2.2 Fault Location, Isolation and Service Restoration
FLISR is a system comprised of substation equipment, circuit reclosers, and wireless communications infrastructure, along with software, meant to decrease the duration and the number of customers affected by isolation during outages. FLISR can compile data from various devices along the distribution network and compute the estimated location of a fault on a given circuit with ever-increasing accuracy. In response to this determination, it can coordinate the operation of specific field devices to connect un-impacted sections of distribution circuits to adjacent circuits. This has the effect of isolating an outage to as few customers as the infrastructure allows, or as the real-time operating conditions permit. FLISR can propose a series of actions for control center operators to adjust and authorize, or in high volume storm situations, can be configured to operate autonomously by isolating portions of the grid without
28
the need for manual intervention to initiate preliminary restorations. Field crews must ultimately be dispatched to repair any damaged sections of distribution circuit, but fewer customers are inconvenienced in the interim.
Metering data from AMF are particularly useful in this scenario as it can be utilized to validate the restoration of power to impacted customers. In certain circumstances, meter data is also helpful in identifying nested outages within distribution segments that have been restored but might have been overlooked while restoring the primary outage.
3.5.3 Distributed Energy Resource Management Systems
Distributed Energy Resource Management Systems (“DERMs”) are a suite of applications that integrate and manage DERs across the grid. DERMs rely on open protocols to leverage as much of the existing infrastructure as possible and integrates its applications with in-place systems such as AMI, and ADMS, along with DR devices and smart inverters to provide additional control and different types of control within the distribution network. As previously discussed, DERs can significantly affect the grid from a reliability standpoint and DERMs, through a suite of tools and dynamic pricing signals increase balance among inputs to maximize efficiency and reliability.
3.6 Customer Systems
3.6.1 Web portal
As part of the AMF deployment, National Grid will be building a web portal that will act as a hub for residential, commercial, and industrial customers to view their energy usage, including smart meter interval data. This platform will allow customers to view raw data representing their consumption within four hours of the end of a given billing interval and to view billing quality data within 24 hours. Access to this data will enable customers to make better-informed decisions about how they use energy. The portal will power customer choice, giving customers the option to enroll in programs that can leverage the more granular data provided by AMF. These include EE, DR, and other pricing programs. Customers’ can also access educational and safety information, material on energy efficient consumer products, and analysis on home energy usage. The platform will also be integrated with smartphone applications that allow customers to access their data on the go, in addition to being able to create customizable alerts notifying them of grid conditions (including outages, reductions or curtailments), unusual usage, and bill pay.
3.6.1.1 Green Button Connect My Data
Many utilities, including National Grid, have implemented Green Button Download My Data. This system gives every utility customer the ability to download their personal energy consumption data directly to their computer in a secure manner. Additionally, if customers are interested, they can upload their data to a third party application.

29
Green Button Connect My Data takes this process further by streamlining it to allow utility customers to automate the process. With Green Button Connect My Data customers can securely authorize both National Grid and designated third parties to send and receive data on the customer’s behalf as may be seen in Figure 13. Upon authorization, energy usage data can be transferred as required. National Grid will implement Green Button Connect My Data as part of the AMF deployment program.
Figure 13: Standard communications protocol for Green Button Connect My Data4
3.6.2 Customer Service System
The CSS is a set of applications utilized to manage customer-facing activities. The set of programs pulls meter data to administer orders, billing and payment processing, collections, rebates and discounts for EE and DR, and other pricing program rates and usage. As part of the AMF deployment CSS will be modified and configured to accept data formatted for more frequent intervals. The CSS will also be configured with parameters to interpret this interval data so that usage can be priced by programs such as Time-of-use (“TOU”) and CPP. Having such a prominent role in customer interaction with National Grid, an effective CSS with appropriate capabilities is critical to maintaining customer satisfaction. Moreover, as DER penetration increases throughout Upstate New York, CSS must be adaptable to changing with the dynamic energy environment.
4 “Developers” Green Button Alliance, copyright 2015, 2016. Viewed June 2, 2016. http://www.greenbuttondata.org/developers/

30
The customer service system also includes capabilities intended to foster a relationship with customers and assist in customer retention through personalized service. The system pulls from various back-office IT/IS sources to create personal profiles on customers to facilitate customer engagement. For instance, CSS can be linked with interactive voice response (“IVR”) to send an automated notification to customers when the system receives a power-off notification from smart meters. Additionally, the CSS will present customer history and real-time meter status to the call center operators when customers call in, giving National Grid employee’s greater insights to help customers. Service representatives will also have a new suite of tools at their fingertips to perform diagnostic services instantly on or ping meters when issues arise. They will also have the ability to restore power that has been disconnected whether it be for non-payment or seasonal usage.
3.7 Integrated Network Operations Center
The INOC is the central management hub overseeing the day-to-day operations of the smart meter network, along with its associated communications infrastructure. During the construction and deployment phase of the AMF rollout, the center will manage communications infrastructure, meter deployments, and coordinate the initial stabilizations. The INOC will also be responsible for troubleshooting any meter related issues that crop up during that phase. Once the rollout is complete, the INOC will evolve into the central management hub. Its responsibilities include:
• Proactively managing and monitoring the smart meter and field area network performance;
• Remotely investigate/remediate meter and communications infrastructure problems; • Dispatch technicians/vendors to remediate problems that cannot be done remotely; • Manages firmware deployments; • Manage meter swap-outs, repairs, maintenance and warranty issues; • Manage the Meter Inventory Tracking System; and • Manage the smart meter shop for the upstate New York service territory.
With large and complex grid modernization efforts, active monitoring of data flows between systems and overall security is essential. Given the comprehensive nature of the DSIP, this capability transcends the subset of functionality envisioned by AMF and is therefore captured outside of the AMF scope. However, given the importance of AMF’s data, the INOC is also responsible for AMF managing the roll-out and communications stabilization. In this particular case, a Smart Meter Operation Center (“SMOC”) mission is to be incorporated into the INOC, which has oversight of all IS-related items that support the grid. As such the INOC will be critical to a successful AMF program.

31
3.7.1 Inventory Tracking System/Asset Management
The inventory tracking system is the information warehouse for all endpoint devices including meters and ERTs, along with CGRs, range extenders, and radios for distribution devices like capacity banks, and FCIs. This system also stores the information on cellular radios for reclosers and large scale ERTs. The cache holds all relevant information necessary to track an end point device across its deployment lifecycle including, but not limited to, device manufacturer, manufacturer date, installation date and location, serial number, warranty information, GIS location of service, maintenance log, and any scanned records. The inventory tracking system also reconciles field crew readers with the back-office systems and has the capability to store records of field crews to scan during any service calls.
3.8 Cyber Security
The Company understands that in an evolving technology landscape, there are growing cybersecurity risks. National Grid and the Energy sector have also seen an increase in cyber related threats to its infrastructure and business operations. The cyber threat landscape has been continuously evolving over the years with an increased sophistication targeting utility operations causing disruption to the safe and reliable services we serve to our local communities. These threats could cause cyber effects such as loss of integrity and availability to the AMI system and range from increased peak usage up to widespread outages.
The National Grid Cybersecurity REV framework in support of the AMF efforts of the Company are to ensure we maintain a reliable and secure electricity and gas infrastructure and ensure the protection needed for the confidentiality and integrity of the digital overlay. The National Grid Cybersecurity REV Framework focuses on implementing a comprehensive cybersecurity plan to ensure adequate protection for both customers and the company. The Framework provides a common language for understanding and managing cybersecurity risk to help identify and prioritize actions for reducing cybersecurity risk. The Framework provides for National Grid to align its cybersecurity activities with its business requirements, risk tolerances, and resources. This framework is guided by and is aligned to the NYS Joint utility Cybersecurity and Privacy framework that has been established by the NY Joint Utility Cybersecurity Working Group.
As part of the framework, cybersecurity and privacy provisions in the form of multiple security services to support AMF deployment will be implemented. These security services will be the cornerstone for any cybersecurity or privacy related component of the overall solution. At a high level, these security services will ensure that proper end-to-end security controls are incorporated into all aspects of design, implementation, and deployment of smart meter technology. These security controls will ensure that all Smart Meter devices, communications infrastructure, and back office systems supporting them, along with user portals and other critical infrastructure are fully secured and monitored. Moreover, the plan will also ensure that

32
any data transmitted across this network is properly protected (e.g. encrypted) using industry recognized standards and protocols.
The service model is layered and the security controls that will be implemented to support a particular security service are based on the “NIST SP 800-53 Rev. 4: NIST Special Publication 800-53 Revision 4, Security and Privacy Controls for Federal Information Systems and Organizations”. This serves to assist in providing greater flexibility and agility to defend against an ever changing threat landscape, along with the ability to implement a structured approach to tailor any provisions required to specific missions/business functions, environments of operation, and/or technologies based on the level of risk that is acceptable. The Cybersecurity and privacy controls provide a comprehensive range of countermeasures to mitigate any risks that have been identified for the organization and its information systems due to threats impacting National Grid’s plan to meet NYS REV objectives. The controls are designed to be preventative, detective, or corrective and protect the confidentiality, integrity, and/or availability of information. They involve aspects of policy, oversight, supervision, manual processes, actions by individuals, or automated mechanisms implemented by information systems/devices. The security controls are focused on the fundamental countermeasures needed to protect organizational information during processing, storage, and transmission. The privacy controls ensure that privacy protections are incorporated into information security planning. The use of standardized privacy controls provide a more disciplined and structured approach for satisfying privacy requirements and demonstrating compliance with those requirements. The Company will leverage industry-leading best practices to meet the goals of a robust cyber security program. These practices include robust training, change control, configuration management security, access monitoring, incident management, end-to-end encryption, network segmentation, and firewalls, as well as other security controls mentioned above. The cyber security measures outlined will enable National Grid to maintain confidentiality and integrity to the best of its ability in both the short and long term future of AMF.
4 PROGRAM IMPLEMENTATION SUPPORT
4.1 Customer Engagement
AMF is an enabling technology allowing customers the ability to become engaged energy consumers. Particularly, the near real-time energy consumption data can be highly impactful as it allows customers to manage their bills and participate in DR, and EE, and pricing programs. However, in order for the benefits of smart meter technology to be fully realized by the customer, National Grid recognizes the importance of pairing this technology with proactive customer engagement initiatives. Core to a successful smart meter adoption and deployment, in addition to the success of subsequent pricing programs, is a robust and thorough customer centric engagement program. There are three distinct stages that National Grid plans to implement to elevate customer participation:
33
Stage 1 - Deployment: The purpose of the deployment stage is to initiate a fact based smart meter campaign to inform the public of the benefits associated with AMF and build the foundation to establish trust. This campaign will also articulate fact-based counter arguments to any opposition claims and attempt to decrease overt bias toward smart meter technology. Given the size of the territory and diverse customer base, it is safe to assume that there will be a wide range of smart meter knowledge, opinions, understandings, and interests represented. Pre-existing customer bias has the potential to increase costs and delays throughout the process of smart meter implementation. Therefore, National Grid will reduce these potential costs through dynamic and proactive customer engagement across various forums to set expectations and mitigate concerns.
Stage 2 - Steady State: This stage objective is to increase customer satisfaction through access to specific enhanced data provided by smart meter technologies. Further, this stage aims to reduce customer call volumes by transitioning toward a self-service model. In order to attain these goals, the approach will have to be proactive. Using the associated smart meter systems such as the web portal to provide a host of solutions to anticipate customer needs is an example of this proactive approach. Any reactive interactions with customers must utilize these same systems that provide higher quality and personalized service to drive impactful results. Overall increased accessibility to data and self-service portals will allow customers to become more autonomous and have greater levels of satisfaction. Having a robust interface that seamlessly allows customers to access their data and easily track down any questions they might have will make them less reliant on the call center.
Stage 3 - Program Education/Enrollment: The goal for this step is to educate customers on the opportunities and benefits associated with participation in utility or third-party services and programs. The increased knowledge of opportunities coupled with customer involvement aims to increase customer satisfaction by giving them options to reduce their energy costs.
The diverse customer audience of National Grid, combined with an array of stakeholders representing an assorted set of interests, makes creating dynamic outreach, engagement and education programs essential. This three-stage program will utilize a multi-channel, multimedia campaign that integrates social media to inform and educate energy consumers, ultimately creating a two-way conversation with customers about smart meter technology.
A well-structured plan will increase acceptance, ease implementation, and allow customers to make informed decisions, including participation in innovative pricing programs and other AMI-enabled programs. Ultimately, by readily placing information and data about smart meter into the hands of the customer, National Grid will be able to support customers in realizing the full complement of benefits associated with AMF.

34
4.2 Systems Integration
System integration is key to harnessing the full magnitude of smart meter benefits across National Grid infrastructure of devices, software, and systems. Only by enabling meters to exchange data with routers, routers with systems, and systems with other systems is it possible maximize the effectiveness of the overall platform. As such various IT / IS costs associated with system integration were included in the AMF Business Case model. A well-structured approach will include the following:
• Capability analysis and end-to-end definition of functionality at each step; • Systems Architecture to define data interfaces between systems and components; • Detailed requirements definition for all systems and interfaces; • Custom configuration and development of system APIs; • Detailed test case planning and definition; and • Careful test execution and defect documentation.
A platform such as AMF will have highly complex data exchanges. Throughout the industry, systems integration is supported by an enabling technology known as an Enterprise Service Bus (“ESB”), which helps facilitate the exchange of standardized data elements between all impacted systems.
In addition to a functional platform, other benefits of strong systems integration include:
• Improved system response time and performance; • Lower labor costs and increased operational efficiency; and • Compatibility across system devices and software.
4.3 Process Design
Process design is an extremely important component upon which program development and organizational change depends. Many utility employees will be impacted by the deployment of AMF including meter field technicians, meter shop technicians, customer service reps, control center operators, billing analysts, etc. Each role will be changed to some degree to accommodate the incorporation of this new technology. To aid in a smooth transition for both customers and employees, the definition of how people will use the technologies is just as important as defining what the technologies are capable of doing. A strong process includes:
• Detailed Definition of System Processes and Requirements: Conduct workshops with subject matter advisors, vendors, end-users, IS representatives, and other key stakeholders to gather, define, and document business processes for the new systems. These sessions, particularly the ones addressing integrations will uncover additional business, functional, non-functional, performance, technical, data, integration, and transitional requirements;

35
• Process Design and Organizational Impacts: Create process flow documents to ensure stakeholder agreement to key sequences, activities, and organizational divisions. Refine processes by documenting requirements, inputs/outputs, contemplated customizations, org/change impacts, KPIs, dependencies, business rules, data needs, data flows, automation touch points, reporting considerations, etc.;
• Tabletop Processes Simulation Testing: Leveraging key end-user and a variety of sunny-day and rainy-day scenarios, identify and mitigate pain-points of the newly proposed process; and
• Cross-Workstream Integration: The business process team will coordinate with downstream teams to ensure full understanding of documented intent for solution architecting, detailed design, and testing.
4.4 Change Management
Change management is an important suite of tools to deliver stakeholder understanding and behavioral changes to support specific business objectives associated with AMF. This methodology is based on the belief that people’s reactions and behaviors at different stages of a change process can be predicted, managed, and measured. The key components of National Grid smart meter change approach include the following:
• Readiness Assessment: Qualitatively identify key stakeholder groups and conduct workshops to assess their expectations, goals, and understanding of the benefits that a program like this would bring. Quantitatively measure readiness to determine if employees: 1) understand the expected changes, 2) have the right skills for the operational phase of the program, and 3) have any barriers to change. Gather information from training metrics, change network surveys, focus groups, and change tracking surveys to develop monthly dashboards which can help define any change management plan modifications;
• Business Engagement: Create a tailored plan of engagement for each user group. The change plan will define the sequence, mix, and pace of change activities to help reduce productivity dips and enhance buy-in across these groups;
• Business Readiness: Establish an advisory council to create the organizational readiness scorecards and confirm the appropriate metrics for critical functions impacted. Measure progress, identify issues and actions, and update activities in the change plans to incorporate feedback continually from end users;
• Organizational Design: Identify new roles, skill sets, and organizations required to operate the new smart meters, infrastructure, and associated systems and correctly size the balance of work between existing back-office functions; and
• Transition Plan: Creation of a knowledge transfer and sustainability plan to identify how various materials (job aids, process flows, etc.) will be transitioned and maintained post deployment.

36
4.5 Program Management
Program management is an important set of procedures and processes that help to add robust structure to any large infrastructure implementations. For smart meter deployments of this magnitude, a robust program management governance structure adds a number of valuable organizational tools and protocols to ensure program alignment and compliance with project expectations. Some of the benefits include:
• Delineate a clean authorized decision-making process that will define the project direction and allow the scope to be established and approved;
• Define the operational constraints (budget, time, and scope) as well as the procedural constraints (policies, processes, and standards);
• Respond to input from the projects’ Stakeholders typically in the form of responses to issues and risks. The Program will manage issues and change at the Program level, while Project Managers will do the same at the project level. The two will interact to coordinate on items, such as in the escalation of a project issue;
• Monitor activity to confirm the project is complying with the program-level constraints (e.g., milestones, budget, and scope) are on track. Where these activities are at risk of not meeting expectations, ensuring that mitigating actions are taken to address those risks / issues; and
• Ensure compliance with established program criteria and that all of the agreed-upon requirements have been met, de-scoped or deferred. Once acceptance is complete, the program’s final responsibility is to ensure that the administrative close of the projects and program are taken through to conclusion.
5 SCOPE AND SCHEDULE
National Grid considered a number of different scenarios that would make measurable progress towards the PSC’s AMF vision. In an effort to balance the benefits and costs, National Grid has weighed a number of different options. Each option is scaled to different target populations and examines a set of technologies that could be deployed, necessary supporting infrastructure, interdependencies of these components, public versus private backhaul and potential cross-jurisdictional benefits of splitting back-office systems, among other considerations.
5.1 AMF Deployment Scenarios
As seen in Figure 14, the team has proposed and analyzed three options for the AMF deployment. While the team evaluated a number of different permutations, each of following options represent a deployment philosophy and have a wide range of impacts and implications associated, as well as related benefits and costs that are discussed in greater detail in the following section. To articulate the range of likely outcomes for each deployment option, two

37
sensitivity scenarios are presented in the benefit-cost analysis. The key deployment option sensitivity scenarios are summarized as follows:
Sensitivity Scenario 1
• National Grid and National Grid’s Massachusetts operating companies share back-office IT/IS costs: Option A: 55%/45% (Upstate New York / Massachusetts), Option B: 42%/57%, and Option C: 15%/85%;
• Time-Varying Rates - Customer participation rates vary among scenarios under an Opt-Out pricing program model: Option A: 80% participate, Option B: 90% participate, and Option C: 100% participate.
Sensitivity Scenario 2
• All back-office IT/IS costs, 100%, are attributed to the Upstate New York service territory for all deployment scenarios.
• Time-Varying Rates achieve 20% participation for all deployment scenarios under an Opt-In pricing program model.
Option A B C
Description Full Deployment Urban Deployment Dispersed Deployment
Scenario 1 2 1 2 1 2
MA/NY Back-Office IT/IS Cost Sharing NY 55% NY 100% NY 42% NY 100% NY 15% NY 100%
Pricing Program Participation Rates 80% 20% 90% 20% 100% 20%
Number of Electric Meters* 1.7M 0.7M 0.17M**
Number of Gas ERTs* 0.7M 0.3M 0.07M**
Portal Data Presentment Raw Data viewable within 4 hours, Billing Data in 24 hours
Field Deployed Technologies Smart Meters, ERTs
Enabling Infrastructure Collectors/relays/routers Cellular radios on all smart meters
IT/OT Investments AMI Head End, MDMS, Data Warehouse, CSS, and other Back-Office Investments
Initiatives Web Portal, Green Button Connect, Marketing & Outreach*it should be noted that the number of electric and gas ERTs to be replaced includes both active and inactive meters **Approximately 10% of electric and gas customers is the steady-state maximum for the opt-in scenario
Figure 14: National Grid deployment scenarios
There are many characteristics of the smart meter deployment that are similar no matter which option is chosen. The largest of these infrastructure upgrades are the back-office systems. They include AMI Head End, MDMS, Data Warehouse, CSS, and upgrades to other back-office systems to integrate them with the new systems. Additional customer facing elements like the web portal, Green Button Connect My Data, and all the systems to support their functionality will be part of any deployment.

38
The primary differentiator between these options is the number of meters to be deployed with options ranging from approximately 10% of all National Grid Upstate New York customers to nearly 100% of metering points across Upstate New York. Remaining divergence between Options A and B and Option C is the enabling infrastructure investment necessary to support the contemplated scale of deployment. Where Options A and B will deploy the communications infrastructure to support a robust mesh network, Option C, with its inherent uncertainties regarding the number, location, density of customer’s who opt-in, cannot. All these unknown elements make it hard to justify the expense of building the foundational communication elements that make up the mesh network. To hedge against these uncertainties and efficiently use resources, Option C will utilize cellular radios and a public network to transmit data to the back office systems.
5.2 Approach to Implementation
The proposed AMF implementation timeline is six years beginning in the fiscal year 2019. While the AMF deployment is still being refined at the time of this writing, a broad timeline is as follows. The start date for the project reflects the time required to engage stakeholders following the initial DSIP filing to further develop and refine the plan, and to achieve regulatory approval either separately or as part of a general rate case. The anticipated timing of the filing of National Grid’s next electric and gas general rate case is mid-year 2017. Year 1 of AMF implementation includes detailed technology design and the formal procurement process, followed by the installation of back office systems and communication infrastructure. This will be followed by a five-year meter and ERT installation program.
Figure 15: National Grid implementation schedule
With the inherent uncertainties surrounding option C, the staging and deployment timeline is less clear. The number of people that sign up, the cadence of their authorizations, their locations across National Grid’s Upstate New York territory, will all have a measurable effect on

39
the timeline. Consequently, additional investigation and scenario analysis will need to be executed if this option is chosen.
6 BENEFITS
The deployment of smart meters, its associated infrastructure and systems is a key step toward achieving the REV objectives. The benefits associated with the AMF Business Case are grouped into three categories: Customer, Societal, and Operational. These benefits will translate into specific features, programs, and offerings, which will continue to evolve over time.
6.1 Customer Benefits
6.1.1 Enabling Programs through Third-Party Access to Data
Smart Meter technology and its associated digital and physical infrastructure form the backbone and foundation of a future energy marketplace. This secure infrastructure will facilitate both customers and approved third-party providers access to interval data. This access to detailed customer data will foster the spirit of innovation in new and creative ways and allow third parties to tailor new products and services to individual consumers. Having a multitude of choices in the energy marketplace will lead to a more informed populace, who is better able to manage their electricity consumption and ultimately leading to customer financial benefits and utility system savings driven by overall system efficiencies.
6.1.2 Enablement of Time-Varying Rates
Smart meter technology will allow National Grid to collect utility customers’ energy usage in greater detail than previous technologies would allow. This time-stamped data is the foundation by which any pricing program may be implemented. Time-of-use (“TOU”) pricing is when different prices are set at certain intervals during the day (e.g., the afternoon, evening, night, etc.). These price periods are set in advance and only change a few times a year. Critical Peak Pricing (“CPP”) is an additional aspect of this program where prices are dynamically adjusted higher during certain operational conditions.
The Business Case considered as a sensitivity an Opt-Out structure where, by default, a large percentage of customers will be enrolled in these pricing programs. Through educational initiatives and pricing signals designed to incent behavior, over time customers will proactively shift portions of their energy consumption to times of day where energy rates are lower thereby resulting in holistic savings.
In additional to incentivizing customers’ savings, consumers shifting their energy usage will flatten the overall load curve. This energy time shift, combined with other programs, will lower energy peak, thus reducing capital spend due to peak energy usage and means that higher cost electricity generators will be needed less.
.

40
6.1.3 Enablement of Smart Home Devices
The granular data generated and collected by smart meter technology also benefits customers by enabling smart home devices and giving those consumers greater insight into their energy usage. Eventually, the home energy management system will send and receive secure communications from the utility. Based on the system’s programming, it will automatically adjust energy usage with pricing signals and calls for curtailments.
A home energy device enables customers to self-manage their energy consumption. These technologies display consumption information for in-home appliances such as thermostats, water heaters, and HVAC systems, among other devices. Control of usage is remote and may be programmed by the customer to accept curtailment calls by the utility for DR events. The capability is based on smart devices/smart controllers within appliances that are connected via a Home Area Network (“HAN”) to a home energy management system.
6.1.4 Enhanced Customer Energy Management and Reduced Consumption
When smart meters have been fully deployed, and the associated back-office infrastructure is in place, customers will have access to their usage data in near real-time, and granularity at sub-hour reading intervals. The frequency of the readings combined with the granularity of the data will enable customers to take control of their energy usage through a number of energy management programs like EE, and DR, in addition to other pricing programs and through access to offerings by third party providers. AMF capabilities will also allow customers to monitor their consumption. This in conjunction with education programs and technical innovation will enable them to make more informed choices, which may lead to a reduction in consumption.
6.1.5 Demand Response Participation
Defining explicit characteristics of National Grid’s DR program was not part of this AMF assessment. However, these programs do have certain commonalities which can be contemplated in a generic sense to estimate benefits and costs. DR programs are dependent on customers participating at certain times when needed, with compensation dependent on levels of participation. For certain types of programs, AMF enables participation by allowing bi-directional messages to be sent from the utility to a premise requesting curtailment accompanied by an acknowledgment or confirmation once curtailment has occurred. In other programs, AMF may not include the curtailment notification. In either case, AMF captures interval data for both the DR event as well as corresponding reference intervals which are typically used to measure curtailment performance during events. By capturing this information, it is possible to present performance measures to customers more quickly for internal analysis and budgetary consideration.

41
6.1.6 Outage Management
Smart meter technology has the ability to report an outage in near real-time. This ability allows the operations center to understand the extent of the outage quickly without the need to rely on customer calls and substation monitoring. The functionality permits the operational system to reach an outage more quickly and dispatch an appropriate number of field personnel to restore power. Furthermore, once power has been restored, smart meters can be dynamically pinged to assess whether the entire outage has been restored or if additional work needs to be done to restore nested outages.
6.1.7 Enhancing Customer Service
AMF data can be used in numerous ways to revamp the customer experience across the spectrum of channels where National Grid and customers interact. Historically, operational information has been somewhat constrained by the limits of technology, but by embracing a philosophy of greater system integration and data presentment, customer satisfaction can be improved.
Call center interactions are the most traditional means of reactive customer interaction between the utility and the customer. Enabling Customer Service agents to have access to more real-time and historical information about the customer experience allows for more impactful information to be shared with customers as well as a more satisfying experience. Some of these capabilities include:
• Real-time pinging of meters to determine if an outage is distribution system related or behind the meter and attributable to customer infrastructure;
• Real-time pinging of meters to determine voltage levels being delivered; • Real-time reconnects of electric meters as appropriate (due to bill pay, move in, etc.); • Historical assessments of outage experience (Customers Experiencing Multiple Outages
(“CEMI”) and other metrics) to give customer representatives context; • Historical assessments of voltage delivered; and • Additional rate plans and options which customer service reps can present to customers
who are seeking greater flexibility for their energy management needs.
Proactive approaches such as outbound calls / emails, text messaging, and social media posting can also be used to notify customers of various events that will influence their energy consumption experience:
• Outage occurrence and/or restorations; • CPP events, corresponding characteristics, and price signals; • DR events and corresponding characteristics; and • Identification of abnormal usage patterns which could impact resulting bills.

42
Ultimately, web portal enhancements will put the greatest amount of general and educational information into the hands of customers. It will enable increased access for customers to understand the structure of new rates and provide the ability to change plans as suited to their individual circumstances. Using this channel, customers will be able to access more granular information about their consumption patterns and have the ability to download this data via the standard Green Button Download My Data framework. Customers can use this information directly or possibly in conjunction with third-party providers, to make more informed choices and proactively manage their bills. The portal will also allow customers to set preferences for how and when National Grid will proactively engage with them for the above-mentioned notifications. With these enhanced user systems, in combination with associated call center process design investments National Grid will likely see a small long-term decline in call volume from steady-state.
6.2 Societal Benefits
6.2.1 Greenhouse Gas Emissions Reduction
Smart meter technology will play a crucial role in reducing greenhouse gas emissions. The granular data collected by smart meters will enable a generation of consumers to make more informed decisions regarding their energy usage. By building a platform for customers to monitor their energy usage with a level of detail previously unavailable and making it easier for them to understand how their choices affect energy consumption. Smart meters, in conjunction with education, EE, DR, and pricing programs, will reduce consumption. The decrease in demand will have an associated decrease in greenhouse gas emissions.
Additionally, the granular energy data collected by smart meter technology may be used by third party providers to design innovative products and services. Many of these creative solutions will be designed to maximize EE thereby creating additional energy savings, thus, fewer greenhouse gas emissions.
6.2.2 Reliability Improvement
While smart meters by themselves do not have the same magnitude of reliability benefit as a system where it’s integrated with ADMS and FLISR, there is an incremental reliability benefit associated with smart meters as a standalone entity. As previously described, smart meters have the ability to report an outage in near real time. Without FLISR to automatically reroute power to portions of the grid that are not affected by the break, manual intervention by field personnel is still necessary to restore power. However, because of this ability to report an outage in near real time, the operations center quickly knows there an issue and can react appropriately, in essence, shortening the duration of the outage.

43
6.3 Operational Benefits
6.3.1 Remote Connect Activities
In circumstances where electrical power has been disconnected for any reason, within minutes of meeting the criteria for restoration, power may be remotely restored, and diagnostics run to confirm power is reestablished and the meter is functioning properly. With the current metering system, customers or potential customers would need to get a slot on the schedule, field personnel would need to be dispatched, and depending on where the meter is located, the affected person may need to be on the premises to let the field technician in.
Remote connect is not allowed for gas meters due to safety reasons.
6.3.2 Remote Disconnect Activities
When a customer requests that their electrical power and/or gas service be turned off (either because they are moving or because it’s a seasonal residence), smart meters can be remotely accessed by service center staff who can then disconnect the electricity or gas (if meters are replaced) without the need to dispatch field personnel.
The ability to remotely disconnect customer’s electric and/or gas service for non-payment also exists which can reduce certain disconnect costs that might otherwise be incurred without AMF. National Grid will use this functionality in full compliance with current New York Home Energy Fair Practices Act (“HEFPA”) regulations.
6.3.3 Remote Meter Configuration
The ability to remotely configure smart meters provides the utility with the capability to push out firmware and software updates, upgrading the meters’ functionality remotely from the utility’s operations center. Smart meters are initially programmed with software that calculates and stores a number of parameters including service status, usage and power quality, and firmware that defines the functionality. At the time of installation, the software and firmware in the meter are configured to perform a certain set of functions and calculations based on a specific set of services or mandated requirements. However, the functionality and parameters may change over the life of the meter. The remote update capability allows the operations center to update every meter grid in a short period of time without the need to dispatch field personnel.
6.3.4 Theft Detection
Smart meter technology combines greater frequency of readings with sophisticated algorithms to ensure that electric and gas consumption is accurate. These algorithms can detect usage that attempts to bypass the meter and will alert Company personnel. If the discrepancy is proven to be theft, the Company can take action to address the situation, thus minimizing a cost that would normally be socialized across the customer base, thereby saving other customers money.

44
6.3.5 Enhanced Revenue Assurance
In addition to theft detection smart meters have the ability to detect meter malfunctions. This feature is enabled through greater frequency of interval readings and back-office system algorithms. These malfunctions have in the past also been a source of revenue loss. By using a data-driven approach, National Grid will proactively mitigate these potential sources of power loss and their associated revenue losses, all while minimizing time intensive site inspections to try and detect any meter that might exist.
6.3.6 Workforce Management
Smart meter technology can be programmed to automatically send a power outage notification when power is lost. Where once the operations center personnel had to rely on monitoring substations and receiving customer calls to confirm a power outage, smart meters are able to broadcast, in near real time, their power status. This ability gives the operations center an estimate of the extent of any problem and allows them to better manage the magnitude and cadence of their response. Bi-directional communication with the smart meter also allows the National Grid personnel to ping meters to determine their status, which reduces the need to dispatch field personnel to perform the assessment.
6.3.7 Grid Planning and Load Management
The greater granularity and frequency of information sent back from the smart meters lends itself to a number of insights that were not previously possible due to data limits placed by the level of information available. With this new level of data, National Grid will be able to analyze customer usage to find patterns that will enable grid planning and load management.
From an infrastructure perspective, granular data will give National Grid a better understanding of customer consumption patterns at more frequent intervals. This load data, combined with an infrastructure database populated with detailed equipment profiles, will allow National Grid to evaluate equipment across the board. Transformers, for instance, could be evaluated for loading instances that would affect life expectancy. National Grid would be able to do this because they know its maximum load capacity and can ascertain through a data search whether peak loading conditions surpass those limits.
From a planning perspective, utilities have traditionally estimated load profiles along a circuit utilizing voltage curves and predictions based on feeder head readings. With actual load data from smart meters, National Grid will understand the potential impacts of their infrastructure decisions with a greater degree of certainty. This will allow National Grid to evaluate planning options for maximum impact when looking to connect new equipment. Smart meter data will also enable a fact-based analysis when evaluating the impact of new technology, like DERs, connecting to the grid.

45
6.3.8 Voltage Abnormality Reporting
Part of core smart meter technology is the ability to detect and notify abnormal voltage levels. When the voltage falls outside the allowable bounds of electrical service, the meter will report the situation to the real-time control center systems (e.g., ADMS), allowing the Company to proactively investigate and take steps to correct, thereby mitigating potentials problems that stem from power quality issues. With the current meters, customers tend to identify and report electrical power quality abnormalities, typically “dim lights” situations that they are experiencing.
6.3.9 Outage Reporting
An additional benefit of core smart meter technology is the ability to report an outage in near real time. Although individual smart meters are electrically powered, they have enough battery life to signal the network and operational systems of a power loss. This ability has several advantages over the current system of monitoring substations for very large power changes that would indicate an outage and rely on customer calls to pinpoint. Smart meters near real-time power outage notification allow the system operators to assess outage characteristics more quickly, have more extensive situational awareness, and take steps to restore power more efficiently. Furthermore, once power has been restored, smart meters can be dynamically pinged to assess whether the entire outage has been restored or if additional work needs to be done to restore nested outages.
6.3.10 Reduction in Call Center Volume
Smart meter technology and its associated back-office systems enable customers to access their energy consumption data through a secure web portal and applications for smartphones and other portable devices. This ability for customers to interact with their interval data in new and innovative ways, combined with additional customer support system investments, will ultimately impact call center call volumes. While National Grid expects to see a short-term uptick in calls, over a longer period as customers get used to the technology, there will a corresponding decrease in call center volumes. Additionally, improved back-office capabilities will have the ability to detect issues before a customer experiences problems and calls.
6.3.11 Reduction in Bad Debt Net Write Off
Bad debt is incurred when National Grid customers are unable or unwilling to pay their billing obligations. National Grid makes every reasonable attempt to collect those outstanding bills. Eventually, this unrealized revenue is classified as a loss and is written off and spread across all customers. Smart meter’s ability to remotely disconnect service, within the existing approved parameters, will reduce these socialized costs. Although the smart meters cannot entirely eliminate bad debt write-offs, the remote disconnect function can reduce the period between when an electric customer defaults on payment to when their meter is actually disconnected,

46
thus reducing the loss incurred. In time the impact of this functionality will prompt a change in customer behavior, resulting in a significant reduction in overall bad debt and operational expense. This will improve the customer experience due to fewer collection activities such as mailings, phone calls, and field visits.
6.3.12 Reduction in Inactive Use Costs
The ability of Smart Meters to remotely connect and disconnect drive benefits that result from costs associated with inactive meters or soft off unoccupied premises. National Grid estimates that there are regularly around 170,000 inactive electric meters. A soft off inactive meter with use occurs when electric services are used while the linked account is inactive. For instance, if a customer moves into a previously unoccupied property without notifying the company to change the account name, use on that account will not be billed until the meter is read and use is discovered. The company then investigates to start a new account. The interim period of time between inactive meter activity and confirming a new account name can rarely be billed as the actual consumer cannot be fully verified. The ability of smart meters to quickly sense usage and be remotely disconnected without an employee needing to enter the dwelling minimizes inactive meters usage on vacant property. Resultantly, National Grid can reduce these unbillable energy costs that were previously disseminated across the entire customer base.
6.4 Additional Synergies/Coordination Benefits
The components, capabilities, costs, and benefits articulated in earlier sections all align to the core vision of AMF for potential near-term implementation. Other capabilities and use cases were also contemplated but were determined to be out of scope. As such, no costs or benefits have been defined for these capabilities. However, as AMF deploys, stabilizes, and matures, the preliminary vision can be expanded upon in the following ways.
6.4.1 Water Utility/Municipality Revenue Opportunities with Joint Use
Electric utilities have pursued the concept of “Joint Use” for many years through the use of shared infrastructure like utility poles that support electric, telephone, and cable television lines. Applied to metering technology, the technical umbrella of National Grid’s proposed AMF infrastructure could be leveraged to support the metering efforts that overlap with water utilities. While water meters themselves could likely be procured and installed by the respective water agency, wireless radios, backhaul, and back-office validation systems could be owned by National Grid but provided as “Metering-As-A-Service” to interested jurisdictions. In this way, while REV is strictly applicable to energy, the concepts of greater customer information and empowered decision making can be expanded as a more holistic capability for customers located in Upstate New York.
47
6.4.2 AMI for Streetlights
Many metering technology vendors offer metering capabilities for streetlight infrastructure which complement other metering capabilities. Typically, streetlights have a standard receptacle for a photoelectric controller to turn the light on and off at night. This module can be replaced with a dedicated AMI streetlight meter. At a minimum, this module integrates with the legacy metering mesh and provides additional nodes for stronger data routing. Further, by virtue of the inherent elevation, the additional nodes can also reduce communication hop counts by increasing the number of direct communications to the nearest wireless router.
Streetlight AMI also has several benefits independent of the broader metering platform. These include:
• Identification of bulb outages to ensure that lights are providing sufficient illumination for safety;
• Identification of “day burners” to reduce bills and increase EE; • Possible new rates and services offered to municipalities for enhanced information and
customer choice; and • Combined with LED bulb deployments, lights can be dimmed to further optimize EE.
7 SCENARIO SUMMARY
The results of the AMF Business Case analysis are found below in Figure 16. The analysis was performed in alignment with the New York Public Service Commission’s recent Benefit-Cost Analysis (“BCA”) Order.

48
20-Year NPV ($ in Millions) A: Full Deployment
B: Urban Deployment
C: Dispersed Deployment
Number of Electric Meters 1.7M 0.7M 0.17MNumber of Gas Meter ERTs 0.7M 0.3M 0.07MMA/NY Back-Office IT/IS Cost Sharing NY 55% NY 100% NY 42% NY 100% NY 15% NY 100%Pricing Program Participation Rates 80% 20% 90% 20% 100% 20%Scenario 1 2 1 2 1 2
Benefits SCT Benefits 603.22 451.46 248.09 193.56 143.77 84.69UCT / RIM Benefits 467.54 339.77 195.39 145.33 131.45 73.81
Costs
Capital – Full AMF 382.77 392.21 185.55 197.75 73.37 91.53Capital – AMR Replacement (110.15) (110.15) (43.89) (43.89) (15.67) (15.67)AMF Net Capital Expenditures 272.62 282.06 141.66 153.86 57.80 75.86Operating Expenditures 147.85 168.94 106.08 133.33 150.35 190.67SCT Costs 420.47 451.00 247.74 287.20 208.16 266.53UCT / RIM Costs 420.47 451.00 247.74 287.20 208.16 266.53
SCT Ratio 1.43 1.00 1.00 0.67 0.69 0.32UCT / RIM Ratio 1.11 0.75 0.79 0.51 0.63 0.28Est. Monthly Customer Impact (per meter)5 $ 2.37 $ 2.49 $ 3.04 $ 3.41 $ 9.25 $ 11.58
Figure 16: Benefit-Cost Analysis
7.1 AMF Benefits
Figure 17 highlights the broad BCA benefit categories deemed relevant to AMF deployment in National Grid’s Upstate New York service territory. The Figure displays only Option A – Full Deployment benefit components, as it is the only deployment case evaluated that passes the BCA defined SCT, UCT, and RIM.
5 The Estimated Monthly Customer Impact is a value calculated to provide an understanding of how the basic service fee of Upstate New York customers would reflect National Grid’s AMF investment. The dollar per meter value derived for each Option and corresponding Scenario does not reflect a customer class allocation. The value is calculated by (1) present valuing an estimated revenue requirement stream calculated for the 20 year business case timeline, (2) translating the NPV revenue requirement into a levelized annual payment, and (3) distributing the levelized revenue requirement to the in-scope electric and gas meter count on a monthly basis. The initial revenue requirement stream is calculated in accordance with PSC Case No. 12-G-0202 / E-0201, Rate Year Ending March 31, 2016 methodologies.

49
Figure 17: AMF Business Case Benefits Components for Option A
The remote metering and communication capabilities of AMI meters and ERTs provide a variety of opportunities for Avoided O&M benefits, the largest benefit category realized by the AMF Business Case. Avoided O&M savings are the direct result of data-driven decision-making by both the utility and the customer. Three subcategories, reduction of meter inspections, remote metering capabilities, and improvement in bad debt write-offs, make up approximately 90% of Avoided O&M savings. These savings come when labor and vehicle resources are reduced because on-premise visits are no longer required to investigate, connect or disconnect a meter after the proper customer contact process has been performed. In addition, data granularity and remote disconnect capabilities together improve debt collections and reduce the Company’s net write off expense.
The AMF Business Case identified the majority of AMF benefits to be a result of Avoided O&M expenses, but it is important to note that the amount of Avoided O&M benefit changes very little from Scenario 1 to Scenario 2. Varying the Opt-Out vs. Opt-In customer participation in pricing programs accounts for the majority of the difference in benefits realization between Scenario 1 and Scenario 2, affecting Avoided Generation Capacity, Avoided Energy, and Avoided Greenhouse Gasses categories.
In Scenario 2 customers must choose to participate in a time varying rate program. Based on the experience of other U.S. utilities an Opt-In program will have a number of inherent restrictive factors that will ultimately limit customer participation rates despite the Company’s best efforts. This participation rate will thus define the opportunity for reducing electric peak load and energy consumption. The maximum adoption of for pricing programs over a 20 year period falls from 80% in Option A, Scenario 1 to 20% in Option A, Scenario 2. Option A, Scenario 1 in contrast assumes that an Opt-Out program will be employed and that by default far fewer customers will leave the pricing program. Especially if they are already educated to interpret price signals and bill statements through National Grid’s three-prong customer engagement strategy and investment.

50
7.2 AMF Costs
Figure 18 highlights the major cost components of the AMF Business Case. Again, only Option A – Full Deployment, across a 20-year time horizon, was considered because it passes all BCA tests.
Figure 18: AMF Business Case Cost Components for Option A
Each cost category takes into careful consideration the deployment and on-going expenses necessary to deploy smart meter and ERT technology, along with its associated infrastructure and systems across the Upstate New York territory. IT and Systems Integration costs, as well as Customer Engagement and Program Management costs, begin in advance of the meter equipment deployment to ensure that the system is up and running smoothly when AMI technology is being deployed and that customers understand and realize the benefits of AMI technology.
In both scenarios, electrical meter and ERT equipment and installation together account for over half of the AMF cost. The software, labor, hosting services and analytics capabilities included within the IT, and Systems Integration costs portion contribute over one-quarter to the total cost. It should be noted that the AMF Business Case considers only the AMF costs above and beyond the baseline AMR replacement.
7.3 Potential Areas for Further Cost Reductions
In order to recognize the dynamic nature of such a large scale AMF program and account for an appropriate degree of cost uncertainty, the following section outlines areas worthy of further review and enhancement as National Grid progresses AMF business plans.
• Meter Purchase Volume Discount: Costs per meter in this assessment have been calculated based on vendor-supplied estimates. These vendor costs were mostly in line with those of National Grid’s Massachusetts affiliate Grid Modernization efforts. However, in both jurisdictions, various options were under consideration; upon final regulatory guidance and clarity of scope, costs could potentially be further refined.

51
• MDMS License and Maintenance: Costs per meter in this assessment have been calculated based on vendor proposals in response to National Grid’s Massachusetts Grid Modernization efforts. These costs have been prorated as appropriate to the characteristics for Upstate New York. However, in both jurisdictions, various options were under consideration; upon final regulatory guidance and clarity of scope, costs could potentially be further refined.
• Workforce efficiency gains: As the AMI meter and ERT installation begins, there will be a learning curve for workers in the field. As service representatives get more accustomed to the tasks involved in electric meter and gas ERT installation, they will refine the process, building a portfolio of best practices and learnings that will eliminate many inefficiencies. If the sequencing allows and depending on factors like the nature of the workforce, the speed of the work, the supply chain, etc. it may be possible to reduce some capitalized labor costs and recognize benefits earlier based on an expedited deployment schedule.
8 BCA ANALYSIS
8.1 BCA Tests
To facilitate a comprehensive analysis of the benefits and costs of deploying AMF, the BCA6 Whitepaper outlines three distinct tests to be included in the BCA results: SCT, UCT, and RIM. These tests are recommended to help evaluate each potential deployment approach from a variety of standpoints. Each of the tests attempts to address the complexities involved in large scale investments with a unique understanding of how utility expense translates into tangible savings and improvement for all impacted parties. Figure 19 displays the results of the BCA evaluation based on the deployment options and scenarios analyzed.
Scenario 1 Scenario 2
Option SCT UCT RIM SCT UCT RIM
A 1.43 1.11 1.11 1.00 0.75 0.75
B 1.00 0.79 0.79 0.67 0.51 0.51
C 0.69 0.63 0.63 0.32 0.28 0.28 Figure 19: AMF Business Case BCA Tests
The primary purpose of the RIM test is to provide an indication of how AMF will affect customer rates. The primary purpose of the UTC is to test the net change in utility system costs and indicate the impact of AMF on average customer bills. The final, and most comprehensive test, is the SCT. The primary purpose of the SCT is whether there will be a net reduction in societal costs. The benefit and cost calculations for the three tests have many overlaps. In fact, as may
6 REV Proceeding, Order Establishing the Benefit Cost Analysis Framework (issued January 21, 2016) (“BCA Order”).

52
be seen in Figure 19, the RIM and UCT benefit calculations are the same and capture price reductions that result from load reduction as well as avoided distribution system costs. The costs of the RIM and UCT overlap with the exception of lost utility revenue factoring into RIM. The AMF case does not account for the impact of DERs and the lost revenues that would be a result. The SCT includes many of the same benefits as the RIM and UCT but is calculated considering benefits associated with greenhouse gases and dismissing theft and tampering distribution loss reduction as a pass through to society.
The BCA Whitepaper as approved by the BCA order further outlines that the utility weighted average cost of capital (“WACC”) should be used as the discount rate across all metrics. The reason for using a uniform discount rate is that the cost of a utility expenditure plan is absorbed by ratepayers. National Grid’s analysis used the after-tax WACC.
8.2 Sensitivity Analysis
The baseline implementation scenario was evaluated for the following sensitivities. This analysis serves to define the order of magnitude of potential change the Option A, Scenario 1 could experience pending regulatory outcomes and utility business and operations decisions.
8.2.1 Key Sensitivities Considered
The following topics were identified as areas where additional analysis could be pursued to potentially have greater confidence in the results articulated.
• New York/Massachusetts Cost Sharing: A foundational assumption for cost calculations is that IT and System Integration costs for AMF capabilities can be shared between New York and Massachusetts. However, if the Massachusetts Grid Modernization is not approved, New York customers will need to support all costs associated with the programs and their management.
• AMF/DSIP Cost Sharing: There are certain costs that are shared with the DSIP filing. These cost buckets, such as the cyber security, and certain IT and System Integration costs like the Enterprise Service Bus (“ESB”), Information Management & Advanced Analytics Capabilities, Cloud Hosting/ Computing/ Storage to support Data Lakes, Meter Data Management System and Head End system hosting capabilities are currently divided by the level of usage of these filing elements. If the AMF were approved and elements of the DSIP were not, these shared elements would need to be fully supported by AMF.
• Meter Deployment Opt-Out: Meter deployment opt-out is an area with large potential variability due to the uncertainties associated with the public perception of smart meter technology, among other factors. National Grid’s affiliate has seen opt-out rates approaching six percent during the Worchester, Massachusetts pilot; however, given the circumstances of the pilot and the relatively small sample size, it is unclear whether this percent should be included in the range or considered an outlier. The experience of

53
other U.S. utilities, including National Grid’s AMR deployment, show opt-out rates as low as one percent. The sensitivity of opt-out rates is applicable to Options A and B and is recorded at two percent AMI meter and ERT opt-out.
• Pricing Program Opt-Out Rates: The deployment of AMI meters will be accompanied by new rate structures. These programs do not mandate customer participation, and can be deployed as Opt-In (with approximately 20% participation anticipated) or Opt-Out (with approximately 80-100% participation anticipated). Benefits are significantly more impactful with an Opt-Out approach, but the approach has not been approved by the PSC. The option is to be evaluated further as part of the ongoing Track 2 component of the REV proceeding and utility-specific filings.
• Real-Time Communications: Baseline functionality assumes that data will be collected every four to six hours for electric meters, with the collected information available for customer review within four hours (as raw data only); meter data will be validated and transformed to billing quality data within 24 hours of the end of the interval. The metering / billing infrastructure can be enhanced to have partially validated billing quality data available within four hours of the end of the interval, where available, accompanied by billing quality in 24 hours. The faster turnaround would require additional communications and back-office data processing.
8.3 Sensitivity Analysis Results
Figure 20 displays the results of our sensitivity analysis. Note that this analysis is based on Option A, Scenario 1. In each analysis, a single variable is being isolated and varied from its parameters in Scenario 1 to the appropriate contrasting state.
Sensitivity BCA Impact Increase/ Decrease
Cost/Benefit Change
AMI Meter Deployment Opt-Out Benefit Decrease $19.3M
Cost Decrease $11.5M
Participation Methodology for Pricing Programs (Opt-In vs. Opt-Out) Benefit Decrease $151.8M
Back-Office Cost Sharing (NY & MA) Cost Increase $16.5M
Real-Time Communications Cost Increase $6.3M
AMF / DSIP Cost Sharing Cost Increase $85.4M Figure 20: AMF Business Case Sensitivity Analysis
9 CONCLUSION
The BCA Order’s SCT, UCT and RIM support the pursuit of Option A, Full AMF Deployment across National Grid’s electric and gas service territory. The cost for systems that allow smart meters and ERTs to be brought online declined marginally as the number of meters and scope of deployment decreases from Option A to C. As such Option A, Full Deployment spreads those consistently large costs out over the largest group of customers, making it the most economical

54
on a per metering point basis. Beyond the economics, there are a number of intangible benefits associated with AMF, the most important being the ability to put National Grid on the path toward achieving REV goals, positioning National Grid to help usher in an energy future for the benefit of its customers, the distribution system and the State of New York.