jain, pooja and hirst, j.d. (2009) exploring protein
TRANSCRIPT

Jain, Pooja and Hirst, J.D. (2009) Exploring protein structural dissimilarity to facilitate structure classification. BMC Structural Biology, 9 . p. 60. ISSN 1472-6807
Access from the University of Nottingham repository: http://eprints.nottingham.ac.uk/30484/1/1472-6807-9-60.pdf
Copyright and reuse:
The Nottingham ePrints service makes this work by researchers of the University of Nottingham available open access under the following conditions.
· Copyright and all moral rights to the version of the paper presented here belong to
the individual author(s) and/or other copyright owners.
· To the extent reasonable and practicable the material made available in Nottingham
ePrints has been checked for eligibility before being made available.
· Copies of full items can be used for personal research or study, educational, or not-
for-profit purposes without prior permission or charge provided that the authors, title and full bibliographic details are credited, a hyperlink and/or URL is given for the original metadata page and the content is not changed in any way.
· Quotations or similar reproductions must be sufficiently acknowledged.
Please see our full end user licence at: http://eprints.nottingham.ac.uk/end_user_agreement.pdf
A note on versions:
The version presented here may differ from the published version or from the version of record. If you wish to cite this item you are advised to consult the publisher’s version. Please see the repository url above for details on accessing the published version and note that access may require a subscription.
For more information, please contact [email protected]
brought to you by COREView metadata, citation and similar papers at core.ac.uk
provided by Nottingham ePrints

BioMed Central
Page 1 of 16
(page number not for citation purposes)
BMC Structural Biology
Open AccessResearch article
Exploring protein structural dissimilarity to facilitate structure classificationPooja Jain and Jonathan D Hirst*
Address: School of Chemistry, The University of Nottingham, University Park, Nottingham, NG7 2RD, UK
Email: Pooja Jain - [email protected]; Jonathan D Hirst* - [email protected]
* Corresponding author
Abstract
Background: Classification of newly resolved protein structures is important in understanding
their architectural, evolutionary and functional relatedness to known protein structures. Among
various efforts to improve the database of Structural Classification of Proteins (SCOP), automation
has received particular attention. Herein, we predict the deepest SCOP structural level that an
unclassified protein shares with classified proteins with an equal number of secondary structure
elements (SSEs).
Results: We compute a coefficient of dissimilarity () between proteins, based on structural and
sequence-based descriptors characterising the respective constituent SSEs. For a set of 1,661 pairs
of proteins with sequence identity up to 35%, the performance of in predicting shared Class, Fold
and Super-family levels is comparable to that of DaliLite Z score and shows a greater than four-fold
increase in the true positive rate (TPR) for proteins sharing the Family level. On a larger set of 600
domains representing 200 families, the performance of Z score improves in predicting a shared
Family, but still only achieves about half of the TPR of . The TPR for structures sharing a Super-
family is lower than in the first dataset, but performs slightly better than Z score. Overall, the
sensitivity of in predicting common Fold level is higher than that of the DaliLite Z score.
Conclusion: Classification to a deeper level in the hierarchy is specific and difficult. So the
efficiency of may be attractive to the curators and the end-users of SCOP. We suggest may
be a better measure for structure classification than the DaliLite Z score, with the caveat that
currently we are restricted to comparing structures with equal number of SSEs.
BackgroundThe increased pace of protein structure determination,due to high-throughput, synchrotron-based X-ray crystal-lography and multi-dimensional NMR, promises rapidgrowth in the number of known protein structures [1-3].Comparison and classification of newly resolved struc-tures contributes to our understanding of the structuralarchitecture, evolution and function of proteins, espe-cially those with low sequence identity to well character-
ised proteins [4,5]. This information is important for theidentification of new protein folds, drug discovery, andphylogenetic analysis of the proteome.
Classification schemes, such as SCOP (Structural Classifi-cation Of Proteins) [6] and CATH [7], are well estab-lished. SCOP is a curated database and probably theleading classification scheme, providing a comprehensivedescription of the structural and evolutionary relation-
Published: 19 September 2009
BMC Structural Biology 2009, 9:60 doi:10.1186/1472-6807-9-60
Received: 27 February 2009Accepted: 19 September 2009
This article is available from: http://www.biomedcentral.com/1472-6807/9/60
© 2009 Jain and Hirst; licensee BioMed Central Ltd. This is an Open Access article distributed under the terms of the Creative Commons Attribution License (http://creativecommons.org/licenses/by/2.0), which permits unrestricted use, distribution, and reproduction in any medium, provided the original work is properly cited.
BMC Structural Biology 2009, 9:60 http://www.biomedcentral.com/1472-6807/9/60
Page 2 of 16
(page number not for citation purposes)
ships among all protein structures [6]. It classifies about34,500 structurally resolved proteins into seven majorstructural levels according to the constituent domains.The highest level being Class is followed by Fold, Super-family, Family, Protein and Species in a hierarchical manner,maintaining one-to-many inter-level relationships. Ele-ments describing the higher levels are based on coarsestructural similarity and are limited in number [8]. As wemove down the hierarchy, levels become more populatedwith many specific elements to cater for the increasingevolutionary, structural and functional similarities. Thebiologically meaningful structural similarities crucial forclassification [6] can be detected using constituent sec-ondary structure elements (SSEs), e.g., -helix and -strand, which are the major determinants of proteintopology [9,10]. For example, SCOP classification gener-ally depends on the presence of common types of SSEs (atthe Class level), their topological arrangements and con-nectivity (at the Fold level), structural and functional sim-ilarity inferred from a common evolutionary origin (at theSuper-Family level) and sequential relatedness leading toconserved structural signatures important for proteinfunction (at the Family level) [11]. The inclusion of infor-mation about SSEs can improve the prediction of proteinstructural class and fold [12-14].
Specifically, the use of secondary structure content, theproportion of different SSE types and relative arrangementof SSEs has been shown to encode information crucial forpredicting protein structural class and fold. Chen et al.[15,16] reported an accuracy of up to 68% for protein foldclassification on a set of the 27 most populated folds fromSCOP 1.71.
Hierarchical classification of protein structures involvesvarious challenges. The correct assignment of a newlyresolved structure to a lower level in the hierarchy is muchmore difficult than assignment to a higher level [17]. Rear-rangement in the classification scheme, especially at thelower levels in the hierarchy, is common [11]. Proteinsconsisting of multiple structurally independent regions,called domains, pose another challenge. Multipledomains might impart structural and functional variabil-ity to the parent protein. Therefore, classification of suchproteins may span multiple sub-trees in the hierarchy. Aclassification scheme that takes into account sequenceand structural similarity at the level of constituentdomain(s) would be advantageous, especially in the caseof convergent evolution, where a domain can be found inevolutionarily unrelated proteins, leading to high struc-tural similarity, despite low sequence similarity [18]. Thismay help to identify functional analogy, if it exists, amongproteins possessing the same domain. Therefore, domainsare important to consider for the classification. However,structure classification tends to lag behind structure deter-
mination due to the need for personal expertise andexpert knowledge leading to the manual and semi-auto-matic maintenance of the classification schemes.
Recently [11], attention has focused on the automation ofSCOP, using established structure and sequence compari-son methods, independently or in combination. In gen-eral, such efforts towards automation are computationallyexpensive, algorithmically complex, require optimisationand are prone to errors carried forward from the methodsused. Hence, a computationally inexpensive and robustapproach that minimises the use of secondary algorithmswould be welcome.
State-of-the-art structure comparison and alignmentmethods, such as Dali [4], have been proposed to classifypairs of proteins to appropriate SCOP structural levels[19]. Dali is used to maintain the Dali database [19], adatabase of pair-wise comparisons of protein structuresdeposited in the protein data bank (PDB) [20]. Dali usesthe experimentally derived 3D atomic co-ordinates for apair of proteins to calculate a Z score (discussed later) toreflect the extent of similarity between the pair. In thiswork, the stand-alone version of Dali, DaliLite version2.4.4 is used.
Our work aims to assign one of the top four SCOP struc-tural levels to an unclassified (newly determined) proteinstructure. We determine the dissimilarity of the unclassi-fied structure, in terms of a coefficient of dissimilarity (),to those proteins in SCOP with an equal number of SSEs.As a case study, we consider proteins with three SSEs. Fora given pair of proteins, takes into account the differ-ence in structural and sequence-based descriptors charac-terising the constituent SSEs. The structural descriptors arethe separation and relative orientation of every pair ofSSEs and their types (-helix or -strand), whereas thesequence-based descriptors include the length and theaverage solvent accessibility of the constituent SSEs. Addi-tional sequence-based descriptors defining the lengths ofthe paired proteins and sequence identity assigned byDaliLite were also considered, and improve the prelimi-nary results we reported earlier [21]. We compare theaccuracy of in predicting the deepest common structurallevel for a pair of proteins to that of DaliLite Z score usingempirically determined, independent thresholds for thetwo scores. Building on this initial assessment, we thencompare and Z score on a set of 600 domains contain-ing three to six SSEs, representing 200 families from SCOPversion 1.73.
ResultsFor the 1,661 pairs of proteins, the correlation between Zscore and was calculated. DaliLite Z score measures theextent of similarity, whereas measures the extent of dis-

BMC Structural Biology 2009, 9:60 http://www.biomedcentral.com/1472-6807/9/60
Page 3 of 16
(page number not for citation purposes)
similarity. Therefore, a negative correlation was observed;the squared Pearson's correlation coefficient, r2, was 0.44(Figure 1). The correlation between Z score and wasstudied independently for the protein pairs sharing any ofthe top four structural levels. The highest inverse correla-tion was observed for the protein pairs sharing a Family (r2
= 0.42). Surprisingly, for the pairs sharing the Class, Foldor Super-family level the two scores showed negligible cor-relation (r2 = 0.03, 0.01 and 0.08, respectively). In the fol-lowing we try to rationalise this and evaluate which of thetwo scores is more appropriate for structural classification.
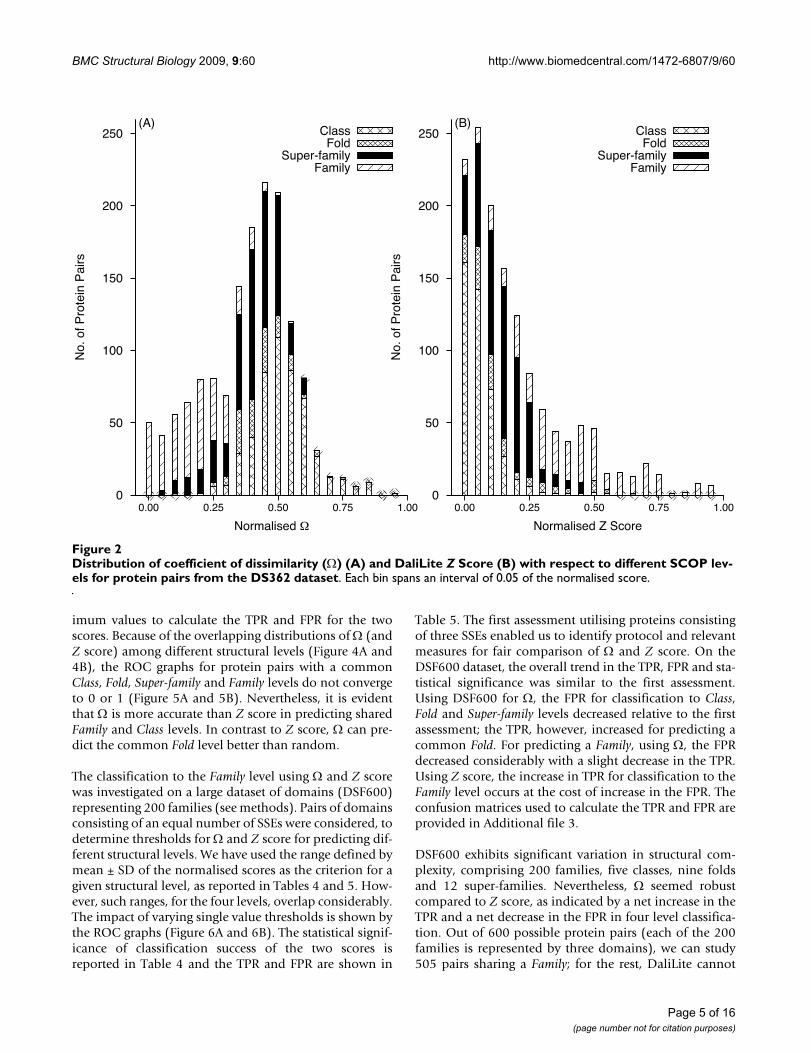
The relationship of Z score and to the SCOP structuralclassification was studied through the frequency distribu-tion of protein pairs sharing a structural level (Figure 2).Based on either (Figure 2A) or Z (Figure 2B) score, theprotein pairs were not distributed discretely between dif-ferent structural levels. However, protein pairs sharing theSuper-family and Family levels in the hierarchy congregatedtowards the lower range of , whereas those from thehigher level of the hierarchy tended to cluster at the upperrange. The reverse was observed in the Z score distribu-tion. The number of protein pairs sharing a Familyincreased with , up to a threshold and then decreased.Similarly, the number of protein pairs sharing a Classincreased slowly at lower values of and then increasedsharply when the number of protein pairs sharing a Familydeclined with the further increase in . In contrast, there
were some pairs with a common Family, which have a verylow Z score (Table 1). The Z score misses structural simi-larity between some proteins where it is clearly evident byvisual inspection and fails to identify for them a commonFold, Super-family or Family. Figure 3 shows some illustra-tive examples. It appears that Z score may not classify cor-rectly when sequence identity is low.
The overlap among the distributions of protein pairs shar-ing a given structural level was studied (Figure 4). Theoverlap of Z score distributions was greater than those of (Figure 4B). The Z score distribution for pairs sharing aSuper-family completely overlaps the distribution of thosesharing a Fold and partially overlaps those sharing a Fam-ily. The Z score distribution for pairs sharing a Class con-siderably overlaps the distribution of those sharing a Fold.The overlap in the distributions for pairs sharing a givenstructural level is less extensive, especially among the topthree levels. In particular, less overlap was observed forpairs sharing a Family (Figure 4A).
These observations suggest that is correlated to theDaliLite Z score for the pairs with high sequence identityand is possibly a better measure for the purpose of struc-ture classification. Next, we identify thresholds for thatcan be used to assign a common structural level for a givenpair. To compare the accuracy of for structural classifi-cation with that of Z score, the two scores were normal-
Correlation of DaliLite Z score and coefficient of dissimilarity () for protein pairs from the DS362 datasetFigure 1Correlation of DaliLite Z score and coefficient of dissimilarity () for protein pairs from the DS362 dataset.
0.0 0.5 1.0 1.5 2.0
5
10
Z S
co
re

BMC Structural Biology 2009, 9:60 http://www.biomedcentral.com/1472-6807/9/60
Page 4 of 16
(page number not for citation purposes)
ised (see Additional file 1, Eqn. S.1; other establishedstatistical and mathematical manipulations that we useare also listed there, for completeness). Hereon, referencesto and Z score are to the normalised scores. The nullhypothesis that no difference exists between the mean normal-ised value for the two scores for the different structural levelswas tested by the Student's two-sided t-test at a 95% con-fidence interval, as implemented in the statistical softwarepackage R [22]. Very small p-values for the t-test (Table 2)suggest that we can reject the null hypothesis and acceptthe alternative hypothesis, i.e., there is a significant differ-ence in the mean values of the two scores for pairs sharinga common structural level. Therefore, to predict if a pairshares a given structural level, the mean ± standard devia-tion (SD) of a normalised score for that level can be sug-gested as a criterion (Tables 2 and 3). For example, a pairwould share a Class, if lies within 0.55 ± 0.12 or a Fam-ily, if lies within 0.20 ± 0.11. Because Class and Familylevels are at the top and at the bottom of the four levelsconsidered, we only require a single threshold for them
i.e., 0.55 and 0.31, respectively. Considering theoverlap between the Fold and Super-family levels, a singlevalue threshold will not work 100% of the time, but arange may provide some useful predictions. For example,for those pairs where = 0.42 ± 0.10 a common Super-family level can be predicted and for pairs where = 0.44± 0.09 a common Fold level can be predicted. Those pairsfor which lies within the overlapping range of super-family and fold thresholds are discussed in the next sec-tion. Nevertheless, using these thresholds we have tried tomimic real-world structure classification using the twoscores independently in terms of true positive rates (TPR)and false positive rates (FPR) (Table 3). We observe com-parable performance of and Z score for the top threelevels (Class, Fold, Super-family) and a better performancefor in classification to the Family level. The confusionmatrices used to calculate TPR and FPR are provided inAdditional file 2. The FPR for classification to the Foldlevel using Z score is 38% higher than for . Although theFPR for assigning a common Family level using Z score iszero, is better, as it has a 75% higher TPR. Correctassignment to the lower levels in the hierarchy is moreimportant than to the higher levels, because assignmentto the lower level automatically assigns a pair to all higherlevels in the same classification sub-tree.
The error in the prediction of a common structural levelfor a pair of protein was assessed in terms of the varianceto mean ratio (VMR) (Additional file 1, Eqn. S.2) and thecoefficient of error (CE) (Additional file 1, Eqn. S.3). Theformer reflects the randomness of a given statistic. VMRclose to zero indicates a more even distribution and VMRapproaching unity indicates a random distribution. TheVMR for DaliLite Z score and for (Table 3) shows thatthe distribution of with respect to different structuralclasses in SCOP is more uniform than the distribution ofZ score. This indicates that for another set of proteins, thethresholds suggested for are likely to remain the same,whereas those for Z score would vary more. CE is a usefulmeasure to evaluate the precision of the quantitative esti-mate (thresholds) used for classification. A high value ofCE reflects poor precision.
Whilst the above definition of the classification thresh-olds seems intuitive, we have also investigated the sensi-tivity of TPR and FPR to the thresholds, using ReceiverOperating Characteristic (ROC) graphs [23]. Figure 5presents the ROC graphs for and Z score. For a givenstructural level, the TPR and FPR were calculated byincreasing the thresholds in intervals of 0.01 from thelowest to the highest normalised scores. For the Class andthe Family level a single threshold was used for the calcu-lation of TPR and FPR. For the Fold and the Super-familylevel the interval of 0.01 was used to define maximum andminimum value within the observed maximum and min-
Table 1: Selected protein pairs from the DS362 dataset where
performs better than Z score in predicting the common
structural level.
Shared Level Protein 1 Protein 2 Z
Fold 1ef4 1iv6 0.57 0.00
1ef4 1ity 0.52 0.00
1faf 1r73 0.64 0.02
1aj3 1rrz 0.64 0.05
1bby 1hdp 0.57 0.05
1iv6 1ku3 0.55 0.06
1ba5 1ku3 0.53 0.08
1bby 1uhs 0.55 0.09
Super-family 1m36 1yuj 0.36 0.00
1g2h 1ity 0.43 0.00
1irz 1res 0.33 0.02
1bf0 1tap 0.44 0.02
1lfb 1umq 0.40 0.03
1ig7 1res 0.43 0.03
1g2h 1iv6 0.43 0.04
1hcr 1vnd 0.38 0.04
1bw5 1hcr 0.43 0.06
1g2h 1jko 0.44 0.07
Family 1srk 1yuj 0.14 0.03
1la4 1oaw 0.25 0.05
1f43 1hdp 0.08 0.13
1cix 1oma 0.22 0.02
1cix 1kqh 0.23 0.07
1kbe 1tbn 0.22 0.00
1lqc 1uxc 0.20 0.04
1hd6 2erl 0.09 0.17
Selected protein pairs where performs better than Z score in predicting the common structural level. Normalised scores are listed. Z score equal to zero indicates no structural similarity, whereas close to 1 indicates high dissimilarity.
BMC Structural Biology 2009, 9:60 http://www.biomedcentral.com/1472-6807/9/60
Page 5 of 16
(page number not for citation purposes)
imum values to calculate the TPR and FPR for the twoscores. Because of the overlapping distributions of (andZ score) among different structural levels (Figure 4A and4B), the ROC graphs for protein pairs with a commonClass, Fold, Super-family and Family levels do not convergeto 0 or 1 (Figure 5A and 5B). Nevertheless, it is evidentthat is more accurate than Z score in predicting sharedFamily and Class levels. In contrast to Z score, can pre-dict the common Fold level better than random.
The classification to the Family level using and Z scorewas investigated on a large dataset of domains (DSF600)representing 200 families (see methods). Pairs of domainsconsisting of an equal number of SSEs were considered, todetermine thresholds for and Z score for predicting dif-ferent structural levels. We have used the range defined bymean ± SD of the normalised scores as the criterion for agiven structural level, as reported in Tables 4 and 5. How-ever, such ranges, for the four levels, overlap considerably.The impact of varying single value thresholds is shown bythe ROC graphs (Figure 6A and 6B). The statistical signif-icance of classification success of the two scores isreported in Table 4 and the TPR and FPR are shown in
Table 5. The first assessment utilising proteins consistingof three SSEs enabled us to identify protocol and relevantmeasures for fair comparison of and Z score. On theDSF600 dataset, the overall trend in the TPR, FPR and sta-tistical significance was similar to the first assessment.Using DSF600 for , the FPR for classification to Class,Fold and Super-family levels decreased relative to the firstassessment; the TPR, however, increased for predicting acommon Fold. For predicting a Family, using , the FPRdecreased considerably with a slight decrease in the TPR.Using Z score, the increase in TPR for classification to theFamily level occurs at the cost of increase in the FPR. Theconfusion matrices used to calculate the TPR and FPR areprovided in Additional file 3.
DSF600 exhibits significant variation in structural com-plexity, comprising 200 families, five classes, nine foldsand 12 super-families. Nevertheless, seemed robustcompared to Z score, as indicated by a net increase in theTPR and a net decrease in the FPR in four level classifica-tion. Out of 600 possible protein pairs (each of the 200families is represented by three domains), we can study505 pairs sharing a Family; for the rest, DaliLite cannot
Distribution of coefficient of dissimilarity () (A) and DaliLite Z Score (B) with respect to different SCOP levels for protein pairs from the DS362 datasetFigure 2Distribution of coefficient of dissimilarity () (A) and DaliLite Z Score (B) with respect to different SCOP lev-els for protein pairs from the DS362 dataset. Each bin spans an interval of 0.05 of the normalised score.
0
50
100
150
200
250
0.00 0.25 0.50 0.75 1.00
No
. o
f P
rote
in P
airs
Normalised
(A)ClassFold
Super-familyFamily
0
50
100
150
200
250
0.00 0.25 0.50 0.75 1.00
No
. o
f P
rote
in P
airs
Normalised Z Score
(B)ClassFold
Super-familyFamily

BMC Structural Biology 2009, 9:60 http://www.biomedcentral.com/1472-6807/9/60
Page 6 of 16
(page number not for citation purposes)
Proteins from the DS362 dataset with a common (a) Fold 1faf and 1r73, sequence identity = 8%, (b) Super-family 1bw5 and 1hcr, sequence identity = 11% and (c) Family 1cix and 1kqh, sequence identity = 21%, for which Z score does not identify structural similarity but doesFigure 3Proteins from the DS362 dataset with a common (a) Fold 1faf and 1r73, sequence identity = 8%, (b) Super-fam-ily 1bw5 and 1hcr, sequence identity = 11% and (c) Family 1cix and 1kqh, sequence identity = 21%, for which Z score does not identify structural similarity but does.

BMC Structural Biology 2009, 9:60 http://www.biomedcentral.com/1472-6807/9/60
Page 7 of 16
(page number not for citation purposes)
detect significant structural similarity. A few of thedomain pairs, despite a common Family, were not deemedsignificantly similar by DaliLite (Additional file 4, Table3), but were correctly predicted by . Figure 7 gives a fewillustrative domain pairs. In addition, a single poly-pep-tide chain can have multiple domains. Such domainshave a different classification, if they impart independentfunctional or structural features, e.g., antibiotic resistantprotein domains (d1bl0a1 and d1bl0a2), biotin repressorprotein domains (d1biaa1 and d1biaa2) and the hypo-thetical transporter protein domains (d1v43a1 andd1v43a1). DaliLite cannot handle such domains and failsto detect any structural similarity among them. Clearly, is more suited for the purpose of classification, where itwould at least detect a common level from the top of theclassification hierarchy.
DiscussionWe have described a computationally inexpensivemethod for structure classification. For a protein pair withan equal number of SSEs, the method compares structuresin terms of structural and sequence-based descriptorscharacterising the constituent SSEs. The extent of dissimi-larity, computed from these descriptors, is used to predictthe structural levels from the SCOP hierarchy that the pairshares. Protein pairs sharing a Class and Family are distin-guished by high and low values, respectively, of a dissim-ilarity coefficient, . However, pairs sharing theintermediate levels, i.e., Fold and Super-family are notclearly segregated. This can be explained by the Russiandoll effect inherent in SCOP and other structure classifica-tion schemes [7], where the same sub-structure that con-stitutes a protein fold exists in the super-family nestedwithin that fold [24].
Mean (A) and Z score (B) for the different SCOP levels and standard deviations (error bars) for the DS362 datasetFigure 4Mean (A) and Z score (B) for the different SCOP levels and standard deviations (error bars) for the DS362 dataset.
0
0.2
0.4
0.6
0.8
1
ClassFold Super-family
Family
Ave
rag
e N
orm
alis
ed
SCOP Structural Level
(A)
0
0.2
0.4
0.6
0.8
1
ClassFold Super-family
Family
Ave
rag
e N
orm
alis
ed
Z S
co
re
SCOP Structural Level
(B)
Table 2: Statistical Significance of DaliLite Z score and in identifying different SCOP structural levels for the DS362 dataset
SCOP Level Mean MeanNorm t-test F-test Max Min
Z Z p-value95% p-value95% Z Z
Class 2.68 0.91 0.07 0.55 10-16 10-1 7.50 1.60 2.00 0.44
Fold 3.72 0.77 0.17 0.46 10-16 10-8 8.50 1.22 2.00 0.27
Super-family 3.63 0.72 0.16 0.42 10-16 10-1 0.23 6.90 1.06 2.00
Family 6.28 0.39 0.43 0.20 10-7 0.31 11.90 0.95 2.00 0.08
The statistical significance of difference in the mean of the normalized coefficient of dissimilarity () and DaliLite Z score in terms of Student's two-sided t-test at 95% confidence interval. The small p-values from the t-test indicate a significant difference in the mean value of the two scores for the respective shared SCOP level. The p-values for the F-test reported at 95% confidence interval indicate that the two-sided t-test is valid based on the assumption of equality of the two sample variances. MeanNorm = normalised mean.

BMC Structural Biology 2009, 9:60 http://www.biomedcentral.com/1472-6807/9/60
Page 8 of 16
(page number not for citation purposes)
An inverse correlation was observed between and thesimilarity score Z assigned by DaliLite. We show, how-ever, that is more useful for structure classification thanZ score. The latter varies more for the protein pairs sharinga SCOP structural level, making it less reliable for struc-ture classification, especially for the Fold and Super-familylevels. A two-sided t-test shows that the mean values for and Z score for the protein pairs sharing a common struc-tural level are significantly different. If is used, ratherthan Z score, for assigning a common SCOP level, one cananticipate a six- to eight-fold reduction in the variability of
assignment and a 4% to 10% reduction in the chance ofmaking an error (CE). It has also been shown that, for agiven set of proteins, the threshold range defined aroundthe mean value of more often yields correct structurelevel assignment compared to the Z score (TPR and FPR inTable 3). However, if is used, (instead of Z score) 10%more of the predictions for a common Family from theexisting SCOP families may be incorrect.
The overlapping threshold range of and Z score for theFold and Super-family levels can be attributed, in part, to
Table 3: Descriptive statistics for and Z scores for the DS362 dataset
SCOP Level SD SDNorm VMR CE TPR FPR
Z Z Z Z Z Z
Class 0.75 0.17 0.07 0.12 0.21 0.03 0.27 0.19 0.88 0.87 0.31 0.35
Fold 1.62 0.14 0.16 0.09 0.70 0.03 0.43 0.18 0.75 0.69 0.74 0.46
Super-family 0.93 0.16 0.10 0.10 0.24 0.04 0.26 0.22 0.74 0.70 0.35 0.34
Family 2.21 0.18 0.22 0.11 0.78 0.09 0.35 0.46 0.17 0.81 0.00 0.07
Statistics for and Z scores for the protein pairs sharing a common SCOP level. The true positive rates (TPR) and false positive rates (FPR) are calculated based on the threshold range derived from the respective normalised Mean ± SD. Variance to Mean Ratio (VMR) and Coefficient of Error (CE) statistics give an estimate of how general the thresholds could be and how accurate the suggested thresholds are, respectively. Bold-face type indicates where performs better than Z score in assigning pairs to a common Fold and Family. SDNorm = normalised standard deviation.
Sensitivity analysis of TPR and FPR of (A) and Z score (B) for the DS362 datasetFigure 5Sensitivity analysis of TPR and FPR of (A) and Z score (B) for the DS362 dataset.
0
0.2
0.4
0.6
0.8
1
0 0.2 0.4 0.6 0.8 1
Tru
e p
ositiv
e r
ate
False positive rate
(A)
ClassFold
Super-familyFamily
0
0.2
0.4
0.6
0.8
1
0 0.2 0.4 0.6 0.8 1
Tru
e p
ositiv
e r
ate
Z S
co
re
False positive rate Z Score
(B)
ClassFold
Super-familyFamily

BMC Structural Biology 2009, 9:60 http://www.biomedcentral.com/1472-6807/9/60
Page 9 of 16
(page number not for citation purposes)
the inherent classification caveats that exist in SCOP.Whilst remote homologies exist between the super-fami-lies of distinct folds, distant relationships may exist at theFold level. In addition, significant structural variationswithin the super-family and uncharacterised proteinsmake it difficult to classify a protein within the currentSCOP hierarchy. Often such issues lead to singleton folds,super-families and families. In this context, a recent studydiscussed improvements to the existing SCOP schema[11] and proposed a redefinition of the Fold level andorganisation of the Super-family level, but did not suggest
specific criteria. We have observed that more than 60% ofthe proteins populating the overlapping threshold rangeare from the Homeodomain-like super-family (SCOPunique identifiers (sunid) = 46689) and the second larg-est of the folds DNA/RNA-binding 3-helical bundle (sunid =46688). The Homeodomain-like super-family has seven sin-gleton families out of 17, whereas the parent fold has ninesingleton super-families out of 14. Partners from most ofthe pairs belong to one of these singleton super-familiesor folds. Therefore, for classification of pairs in the over-lapping regions, redefined thresholds augmented with the
Sensitivity analysis of TPR and FPR of (A) and Z score (B) for the DSF600 datasetFigure 6Sensitivity analysis of TPR and FPR of (A) and Z score (B) for the DSF600 dataset.
0
0.2
0.4
0.6
0.8
1
0 0.2 0.4 0.6 0.8 1
Tru
e p
ositiv
e r
ate
False positive rate
(A)
ClassFold
Super-familyFamily
0
0.2
0.4
0.6
0.8
1
0 0.2 0.4 0.6 0.8 1
Tru
e p
ositiv
e r
ate
Z S
co
re
False positive rate Z Score
(B)
ClassFold
Super-familyFamily
Table 4: Statistical Significance of DaliLite Z score and in identifying different SCOP structural levels for the DSF600 dataset
SCOP Level Mean MeanNorm t-test F-test Max Min
Z Z p-value95% p-value95% Z Z
Class 2.96 1.11 0.12 0.64 10-16 10-16 9.80 1.65 2.00 0.16
Fold 5.01 1.03 0.39 0.30 10-10 10-5 9.60 1.57 2.00 0.80
Super-family 4.79 1.05 0.24 0.54 10-11 10-2 13.00 1.33 2.20 0.72
Family 13.10 0.40 0.40 0.30 10-16 10-1 29.60 1.32 2.00 0.00
The statistical significance of difference in the mean of the normalised coefficient of dissimilarity () and DaliLite Z score in terms of Student's two-sided t-test at 95% confidence interval. The small p-values from the t-test indicate a significant difference in the mean value of the two scores for the respective shared SCOP level. The p-values for the F-test reported at 95% confidence interval indicate that the two-sided t-test is valid based on the assumption of equality of the two sample variances. MeanNorm = normalised mean.

BMC Structural Biology 2009, 9:60 http://www.biomedcentral.com/1472-6807/9/60
Page 10 of 16
(page number not for citation purposes)
sequence identity may be used. A common fold may bepredicted for those pairs with sequence identity less than10% and 0.45 < 0.55 and for those with sequenceidentity of 10% or above and 0.31 < 0.45 a commonsuper-family may be predicted. Those pairs for whichredefined thresholds are not applicable, alone may beused for the prediction. It would be possible to check theusefulness of these redefined thresholds upon a majorrearrangement of singleton elements in the SCOP hierar-chy.
Nevertheless, would still reduce classification space fora given protein and reduce the workload for manual clas-sification.
There are a few outliers (49 pairs) outside the suggestedthresholds ( = 0.31) for classification to the Family level(see Additional file 5, which lists selected PDB codes andnames). The classification sub-tree for these pairs revealsthat most of them belong to the singleton family of thesingleton super-family from the parent fold. For example,the pair 1hry-1l8y, = 0.52, is from the HMG-Box family.The pair 1iur-1faf, = 0.57, is from the super-familyChaperone J-domain, a singleton super-family containingonly family of the same name. This applies to other pairsin which one partner is 1l8y (pairs with 1i11, 1j46, 1j3c,1hme, 1l8y, 1k99, 1xbl and 1hry) or 1iur or 1faf. Someother outlier pairs include the protein 1tc3 or 1res (pairswith 1hcr, 1jko, 1jj6, 1ijw), from the family RecombinaseDNA-binding domain that represents mainly the fragmentsof a whole DNA-binding protein. The structural data forthese proteins are in the form of synthetic DNA-proteincomplexes, which would be different depending on thecomplexed DNA sequence, structure determinationmethod, and the experimental conditions. Therefore, wepresume that for the classification of such fragments con-siderable expert knowledge would have been taken intoaccount by the SCOP curators. Using , to improve thestructure classification of such proteins, informationabout the structure determination method and nature ofthe ligand (e.g., DNA, metal ion, etc) should be taken intoaccount. Nevertheless, although these proteins have a
DNA-binding domain, they exhibit distinct functions fol-lowing binding to a specific sequence of DNA, e.g., open-ing a double helix, relaxing the twist in the DNA duringreplication, participation in the transposition and recom-bination. Future rearrangement of the sub-tree of theHomeodomain-like super-family is conceivable. Therefore, may potentially help curators in manual assignment.Analysis of the outliers would probably help curators indeciding specific elements to describe the lower levels ofthe hierarchy.
For classification of the DSF600 dataset, we observedsome outliers, arising from the factors discussed above. Inaddition, however, we also observed a few pairs whereone of the domains is either a mutant, or a domain forwhich structural data is derived independently of theentire protein using a different experimental technique ora domain which was resolve structurally in an unboundstate or bound to a ligand. returns very low structuraldissimilarity among such variations of the same domain,whereas the Z score fails to detect any structural similarity,despite sequence identity above 90%. Figure 8 showssome of the examples of such domain pairs. In compari-son to the twilight zone proteins used in the first assess-ment, the DSF600 dataset contained some homologousproteins. This was advantageous to both and Z score,giving a lower FPR. However, at the Super-family levelthere is a decrease in TPR, presumably due to the existenceof super-families with high structural similarity [25]. Inaddition, to the structure of the SCOP hierarchy, thehigher homology within the DSF600 dataset might haveincreased the overlap between the threshold range for and Z score to predict the Fold and Super-family levels.These observations suggest that compared to Z score, isrobust to the structural diversity as well as to the evolu-tionary relatedness of the DSF600 domains.
A few possibilities arise from our results. The most impor-tant is the identification of various levels in the structuralhierarchy based on a set of descriptors without a strictrequirement for high sequence identity. This makes themethod applicable to twilight zone proteins. Since multi-
Table 5: Descriptive statistics for and Z scores for the DSF600 dataset
SCOP Level SD SDNorm VMR CE TPR FPR
Z Z Z Z Z Z
Class 1.11 0.16 0.14 0.10 0.41 0.02 0.37 0.14 0.89 0.86 0.32 0.18
Fold 1.75 0.11 0.23 0.15 0.61 0.01 0.34 0.11 0.59 0.87 0.17 0.20
Super-family 2.64 0.15 0.24 0.25 1.45 0.02 0.55 0.14 0.28 0.37 0.19 0.16
Family 5.61 0.34 0.20 0.26 2.39 0.29 0.42 0.85 0.45 0.79 0.13 0.39
Statistics for the classification performance of and Z scores for the protein pairs sharing a common SCOP level in the DSF600 dataset. Columns have the same meaning as those in Table 3.

BMC Structural Biology 2009, 9:60 http://www.biomedcentral.com/1472-6807/9/60
Page 11 of 16
(page number not for citation purposes)
ple algorithms and heuristics are not involved, ourmethod does not inherit errors. Presuming that proteinfolds and families evolve from a common ancestor, ourapproach may also be useful in studying the emergence ofprotein fold families [26]. could be used to assessmodel quality for structure prediction by homology andfold recognition. In addition, facilitates classification ofnewly determined protein structures, by reducing the clas-sification space to only those structure levels to which the
other paired proteins belong. Therefore, the presentedmethodology can contribute to the existing classificationschemes by minimising the need for expert knowledgeand manual efforts. A significant correlation is observedbetween and DaliLite Z score. , which is not based onany expert knowledge and is purely dependent on thequality of the descriptors used, is found to be more usefulthan DaliLite for structure classification. As structural sim-ilarity may imply functional similarity, our methodology
Domain pairs from the DSF600 dataset with a common familyFigure 7Domain pairs from the DSF600 dataset with a common family. DaliLite did not detect any significant structural simi-larity among the pairs, whereas not only detects the structural similarity but also predicts correctly that the pairs share a family level.(a) d1grja2 and d2eula2, (b) d1cbha_-d2cbha_, (c) d1gl0i_-d1wo9a_ and (d) d1cfwa_, d1dcda_ and d1dfxa_.

BMC Structural Biology 2009, 9:60 http://www.biomedcentral.com/1472-6807/9/60
Page 12 of 16
(page number not for citation purposes)
may find utility in structural class recognition and func-tion prediction [6,27,28].
In its current state, the proposed approach works withstructures consisting of an equal number of SSEs. How-ever, on the DSF600 dataset, we have shown its applicabil-ity to larger domains and with multi-domain proteins.
The SCOP classification is based on the classification ofdomains and multiple classification sub-trees are possiblefor a multi-domain protein. can potentially identifysuch sub-trees. Nevertheless, our approach could beextended to include a combinatorial algorithm guided bythe structural descriptors to identify a common core fortwo domains consisting of a different number of SSEs. It
Pairs of structural variants of the same domain from the DSF600 datasetFigure 8Pairs of structural variants of the same domain from the DSF600 dataset. No Z-score was assigned to such pairs. (a) d1f4sp_(red) and d2alca_(cyan) (sequence identity = 86%, = 0.30) are the DNA-binding domain of an ethanol regulon tran-scription factor. The former is DNA bound and the latter is in an unbound state. (b) d1deca_(red) and d1hrti_(blue) (sequence identity = 20%, = 0.21) are the anti-coagulants domains. The structure of the former is derived as an independent domain through solution NMR, while the latter is the part of a complex structure, which was determined through X-ray diffraction. (c) Two variants (d1vgha_ and d2vgha_) of an anti-coagulant heparin binding domain possess high sequence identity.

BMC Structural Biology 2009, 9:60 http://www.biomedcentral.com/1472-6807/9/60
Page 13 of 16
(page number not for citation purposes)
would then be possible to apply our approach to classifylarge proteins for which the domain boundaries are stillunknown. Also, this would help to group proteins with acommon core at the Super-family or Fold level, therebyminimising the thinning of classification hierarchy [29].
ConclusionThe automation of hierarchical structure classification isimportant, due to the increasing number of structurallyresolved, but unclassified, protein structures. Hierarchicalstructural classification is prone to inconsistencies, evenwithin the same classification scheme, due to the differ-ence in the amount of information available to define var-ious levels and the limited availability of expertknowledge. Also, over time, the classification changes toaccommodate new information, either at the level ofstructure, evolution or function, e.g., classification of amulti-domain protein under different classification sub-trees, and identification of new relationships with differ-ent proteins. In order to cope with the growth in the struc-tural data, automated classification of newly resolvedstructures to the SCOP hierarchy has been recognised asimportant. Yet the implemented automated protocol cur-rently within SCOP works at the sequence level and thefinal, structure-based classification still relies on experthuman knowledge, possibly because structural compari-son is not as reliable as methods for sequence compari-son. In addition, structure comparison is, in general,computationally expensive, involves heuristics and possi-bly accumulates errors inherited from various secondaryalgorithms. Hence, a simple approach is needed that cancomplement the sequence-only automation of classifica-tion within SCOP. In this work, we have reported a steptowards such an approach.
MethodsThe Datasets
A set of 362 proteins (DS362, Additional file 6) compris-ing three SSEs, either helices or strands or both, wasderived from the SCOP database [20] version 1.69. Themajority of these proteins were single domain proteins. Inthe case of multi-chain proteins, the first chain was used.The domain boundaries used within a chain were thosedefined by SCOP. Proteins with invalid DSSP (Definitionof Secondary Structure of Proteins) secondary structureassignments [30] or for which DaliLite could not generatea distance matrix were removed. Proteins for whichDaliLite did not detect similarity (Z score <2.0) with anyother protein in the dataset were also removed. To avoidbias arising from using sequence similar protein pairs,those detected by DaliLite to have sequence identity above35% were removed. This generated 1,661 pairs of proteins(205 unique proteins), spanning to four Classes (496pairs), seven Folds (133 pairs), ten Super-families (472pairs) and 23 Families (368 pairs) from SCOP. A pair is
assigned to one of these four structural levels based on thedeepest common structural level between them. Forexample, proteins in each of the 472 pairs share classifica-tion up to the super-family level, but have been assignedto different families.
There were 192 pairs in the dataset with no common level.Analysis of these pairs revealed 67 unique proteins, ofwhich five proteins (1bha, 1m8l, 1m5i, 1lq7 and 2a3d)were classed in SCOP under the Not a true Class structurallevel and one protein (1ijp) to Membrane and Cell SurfaceProteins and Peptide, a loosely defined SCOP class. Thesesix proteins occurred in about 95% of pairs with no com-mon level. Exclusion of all the pairs having one of thesesix proteins as one of the partner did not affect the distri-bution of pairs sharing a given structural level (as above).Therefore, the 192 pairs with no common level were notconsidered further.
An additional dataset of 600 domains (DSF600, Addi-tional file 7) classified in the SCOP database version 1.73was derived from the complete set of SCOP domain map-pings available from the ASTRAL compendium [31]. Wedid not use the ASTRAL SCOP domain mappings up to40% sequence identity, because not enough families wereleft with at least three domains from different proteins.Using ASTRAL mappings up to 95% sequence identity didnot affect the classification results. No intermediatesequence identities were tried. However, to avoid redun-dant domains, we considered only a single chain of ahomomeric protein. To evaluate the proposed methodol-ogy on larger domains consisting of more than three SSEs,we include domains comprising up to six SSEs. Threedomains were chosen randomly from each of the 50 arbi-trarily selected families represented exclusively ofdomains comprising three, four, five or six SSEs. In thismanner, the dataset represents 200 families, enabling usto focus on classification at the Family level. We took careto select domains only from true SCOP structural classes.The selected domains represent both single and multi-domain proteins.
Structural Descriptors
Structural and sequence-based one-dimensional represen-
tations of three-dimensional (3D) protein structure have
been used for a wide variety of purposes [27,32-35]. Here
we use descriptors, which, instead of characterising a pro-
tein as a whole, characterise the backbone geometry of the
constituent SSEs. The secondary structure assignments
were obtained from DSSP. Descriptors were calculated
using the C co-ordinates of the residues constituting a
SSE. These descriptors were grouped into two categories:
pair-wise descriptors and individual descriptors. For any
two SSEs i and j in a protein "a", two real-valued pair-wise

BMC Structural Biology 2009, 9:60 http://www.biomedcentral.com/1472-6807/9/60
Page 14 of 16
(page number not for citation purposes)
descriptors were the separation, between the centres
of mass (Additional file 1, Eqn. S.4), and the relative ori-
entation, , in terms of the angle between the axes pass-
ing through the terminal C atoms of the two SSEs
(Additional file 1, Eqn. S.5), represented as vectors and
.
Three individual descriptors for each SSE are calculated.The average solvent accessibility, , is the arithmetic meanof the solvent accessibilities assigned by DSSP to each ofthe residues. The total number of residues constituting aSSE is the length descriptor, , and the SSE type is a binarydescriptor, : 0 if -helix, 1 otherwise. Figure 9 illustratesthese descriptors with reference to a 3D structure. Thesequence identity values were assigned by Dali's pair-wisecomparison algorithm.
Coefficient of Dissimilarity
For a pair of proteins a and b, ab is defined as the Eucli-
dean distance between the structural and sequence-based
descriptors of the two proteins. The root mean square dif-
ferences (RMSD) with respect to the structural and
sequence-based descriptors are derived. For example, for a
pair of proteins a and b, with three SSEs each namely, 1, 2,
and 3, the RMSD of every pair-wise SSE distance ( )
is calculated (Additional file 1, Eqn. S.6) and normalised
(Additional file 1, Eqn. S.7). Similarly, the normalised
RMSD values for other descriptors are used to compute
ab (Eqn. 1). A higher value of indicates greater dissim-
ilarity. Classification to a level in the SCOP hierarchy
based on is evaluated.
The coefficient of dissimilarity ab for two proteins a andb is defined as the Euclidean distance between a and b interms of RMSDs of different structural and sequence-based descriptors calculated for the constituent pairs ofSSEs.
Z Score
The Dali Z score is an optimised similarity score definedas the sum of equivalent residue-wise C-C distancesamong two proteins [4]. Consecutive equivalent residuesdefine so called equivalent structural patterns, generallyoverlapping hexa-peptides. For the two proteins the larg-est value of Z score corresponds to the optimal set of resi-due equivalence obtained by permuting the equivalentstructural patterns by Monte Carlo optimisation. A higher
value of Z score indicates greater similarity. A Z scorebelow 2.0 is considered as spurious similarity and can bedis-regarded.
Authors' contributionsJDH proposed the structural descriptors and PJ conceivedtheir use for structural classification. PJ drafted the manu-script and JDH provided advice on presenting results andassisted in drafting the manuscript. Both the authors haveread and approved the final version of the manuscript.
Additional material
ija
ija
Vi
V j
abrmsd
Ωab abnrmsd
abnrmsd
abnrmsd
abnrmsd
abnrmsd
abnrmSS Len= + + + + + ssd
Additional file 1Equations and statistics. This file contains the equations and the defini-
tions of statistics used in the study.
Click here for file
[http://www.biomedcentral.com/content/supplementary/1472-
6807-9-60-S1.pdf]
Additional file 2Confusion metrices - the DS362 dataset. This file contains the confusion
matrices used to calculate the True Positive Rate (TPR) and False Positive
Rate (FPR) reported for the DS362 dataset.
Click here for file
[http://www.biomedcentral.com/content/supplementary/1472-
6807-9-60-S2.pdf]
Pictorial representation of the structural descriptors: separa-tion (), orientation (), solvent accessibility () and length () of the constituent SSEsFigure 9Pictorial representation of the structural descriptors: separation (), orientation (), solvent accessibility () and length () of the constituent SSEs.

BMC Structural Biology 2009, 9:60 http://www.biomedcentral.com/1472-6807/9/60
Page 15 of 16
(page number not for citation purposes)
AcknowledgementsThis work was supported by BIOPTRAIN project from the Marie Curie
Action MEST-CT-2004-007597 under the Sixth framework program of the
European Community.
References1. Heinemann U, Illing G, Oschkinat H: High-throughput three-
dimensional protein structure determination. Curr Opin Bio-technol 2001, 12:348-354.
2. Liu J, Montelione GT, Rost B: Novel leverage of structuralgenomics. Nat Biotech 2007, 25:849-851.
3. Service RF: Protein structure initiative: phase 3 or phase out.Science 2008, 319:1610-1613.
4. Holm L, Sander C: Protein structure comparison by alignmentof distance matrices. J Mol Biol 1993, 233:123-138.
5. Holm L, Park J: DaliLite workbench for protein structure com-parison. Bioinformatics 2000, 16:566-567.
6. Murzin AG, Brenner SE, Hubbard T, Chothia C: SCOP: a structuralclassification of proteins database for the investigation ofsequences and structures. J Mol Biol 1995, 247:536-340.
7. Orengo CA, Michie AD, Jones S, Jones DT, Swindells MB, ThorntonJM: CATH - A hierarchic classification of protein domainstructures. Structure 1997, 5:1093-1108.
8. Govindarajan S, Recabarren R, Goldstein RA: Estimating the totalnumber of protein folds. Proteins: Struct Func Bioinform 1999,35:408-414.
9. Russell RB, Copley RR, Barton GJ: Protein fold recognition fromsecondary structure assignments. Proceedings of Hawaii Interna-tional Conference on System Sciences, IEEE 1995:302-311.
10. Fleming PJ, Gong H, Rose GD: Secondary structure determinesprotein topology. Protein Sci. 2006, 15(8):1829-1834.
11. Andreeva A, Howorth D, Chandonia JM, Brenner SE, Hubbard TJ,Chothia C, Murzin AG: Data growth and its impact on theSCOP database: new developments. Nucl Acids Res 2008,36:D419-D425.
12. Ding CH, Dubchak I: Multi-class protein fold recognition usingsupport vector machines and neural networks. Bioinformatics2001, 17:349-358.
13. Shen H, Chou K: Ensemble classifier for protein fold patternrecognition. Bioinformatics 2006, 22:1717-1722.
14. Cheng J, Baldi P: A machine learning information retrievalapproach to protein fold recognition. Bioinformatics 2006,22:1456-1463.
15. Chen K, Kurgan L: PFRES: protein fold classification by usingevolutionary information and predicted secondary struc-ture. Bioinformatics 2007, 23:2843-2850.
16. Chen K, Kurgan L, Ruan J: Prediction of protein structural classusing novel evolutionary collocation-based sequence repre-sentation. J Comput Chem 2008, 29:1596-1604.
17. Lund O, Hansen J, Brunak S, Bohr J: Relationship between proteinstructure and geometrical constraints. Protein Sci 1996,5:2217-2225.
18. Ouzounis CA, Coulson RMR, Enright AJ, Kunin V, Pereira-Leal JB:Classification schemes for protein structure and function.Nat Rev Genet 2003, 4:508-519.
19. Holm L, Kaariainen S, Rosenstrom P, Schenkel A: Searching pro-tein structure databases with DaliLite v.3. Bioinformatics 2008,24:2780-2781.
20. Berman HM, Westbrook J, Feng Z, Gilliland G, Bhat TN, Weissig H,Shindyalov IN, Bourne PE: The protein data bank. Nucl Acids Res2000, 28:235-242.
21. Jain P, Hirst JD: Study of protein structural descriptors:towards similarity and classification. Proceedings of Computa-tional Biophysics to Systems Biology 2007:165-167.
22. The R Project for statistical computing [http://www.r-project.org/]
23. Fawcett T: An introduction to ROC analysis. Pattern Recognit Lett2006, 27:861-874.
24. Krishna SS, Grishin NV: Structural drift: a possible path to pro-tein fold change. Bioinformatics 2005, 21:1308-1310.
25. Chothia C, Gouch J, Vogel C, Teichmann S: Evolution of the Pro-tein repertoire. Science 2003, 300:1701-1703.
26. Ding F, Dokholyan NV: Emergence of protein fold familiesthrough rational design. PLoS Comput Biol 2006, 2:e85.
27. Gewehr JE, Hintermair V, Zimmer R: AutoSCOP: automatedprediction of SCOP classifications using unique pattern-classmappings. Bioinformatics 2007, 23:1203-1210.
28. Klein P, Delisi C: Prediction of protein structural class fromthe amino acid sequence. Biopolymers 2004, 25:1659-1672.
29. Dessailly B, Redfern O, Cuff A, Orengo C: Exploiting structuralclassifications for function prediction: towards a domaingrammar for protein function. Curr Opin Struct Biol 2009,19:349-56.
30. Kabsch W, Sander C: Dictionary of protein secondary struc-ture: Pattern recognition of hydrogen-bonded and geomet-rical features. Biopolymers 1983, 22:2577-2637.
31. Brenner SE, Koehl P, Levitt M: The ASTRAL compendium forprotein structure and sequence analysis. Nucl Acids Res 2000,28:254-256.
32. Dubchak I, Muchnik I, Mayor C, Dralyuk I, Kim SH: Recognition ofa protein fold in the context of the SCOP classification. Pro-teins. 1999, 35(4):401-407.
Additional file 3Confusion metrices - the DSF600 dataset. This file contains the confu-
sion matrices used to calculate the True Positive Rate (TPR) and False
Positive Rate (FPR) reported for the DSF600 dataset.
Click here for file
[http://www.biomedcentral.com/content/supplementary/1472-
6807-9-60-S3.pdf]
Additional file 4Classification performance of and Z score on proteins comprising
three to six SSEs. The pairs of domains from DSF600 data were analysed
separately based on the number of comprising SSEs. This file contains the
descriptive statistics, statistical significance and ROC graphs for and Z
score when used to classify domain pairs comprising three to six SSEs, to
various structural levels. Selected domain pairs for which the structure
similarity was detected by but not by Z score are also listed.
Click here for file
[http://www.biomedcentral.com/content/supplementary/1472-
6807-9-60-S4.pdf]
Additional file 5Selected outliers of the pairs sharing a Family. This file lists selected
outlier protein pairs from the DS362 dataset belonging to a common
SCOP Family.
Click here for file
[http://www.biomedcentral.com/content/supplementary/1472-
6807-9-60-S5.pdf]
Additional file 6List of domains in the DS362 dataset. This file lists PDB identifiers for
single and multi-domain proteins from the DS362 dataset. In the case of
multi-domain proteins the PDB identifier refers to the first chain.
Click here for file
[http://www.biomedcentral.com/content/supplementary/1472-
6807-9-60-S6.pdf]
Additional file 7List of domains in the DSF600 dataset. This file lists the SCOP identi-
fiers for domains consisting of three, four, five and six SSEs from the
DSF600 dataset.
Click here for file
[http://www.biomedcentral.com/content/supplementary/1472-
6807-9-60-S7.pdf]

Publish with BioMed Central and every scientist can read your work free of charge
"BioMed Central will be the most significant development for
disseminating the results of biomedical research in our lifetime."
Sir Paul Nurse, Cancer Research UK
Your research papers will be:
available free of charge to the entire biomedical community
peer reviewed and published immediately upon acceptance
cited in PubMed and archived on PubMed Central
yours — you keep the copyright
Submit your manuscript here:
http://www.biomedcentral.com/info/publishing_adv.asp
BioMedcentral
BMC Structural Biology 2009, 9:60 http://www.biomedcentral.com/1472-6807/9/60
Page 16 of 16
(page number not for citation purposes)
33. Çamo@lu O, Kahveci T, Singh AK: Towards index-based similar-ity search for protein structure databases. Proceedings of Com-putational Systems Bioinformatics, IEEE 2003:148-158.
34. Tsai H, Tsai C, Ma B, Nussinov R: In silico protein design by com-binatorial assembly of protein building blocks. Protein Sci 2004,13:2753-2765.
35. Chen S, Chen T: Retrieval of 3D protein structures. Proceedingsof International Conference on Image Processing, Volume 3, IEEE2002:933-936.