j (/) ..j >- c
TRANSCRIPT

/ftXANT 1--z LLJ , -- C\J a.o QC\J
(/) ..J >-LLJ LLJ C ..J>:J
LLJ 1-(1) 0 (/)

Table of Contents
Executive Summary
Respondent Profile and Data
Concept 1: The Technological Landscape - CRM, social prospecting, and the hottest tech tools
- Tech attainment continues to grow—reporting and SMS in the lead.
- Lead response data
Concept 2: Team Construct - Outbound sales team makes more dials and send more emails.
- Inbound sales teams have the highest AE/SDR ratio description.
- AE to SDR ratio by team type
- A majority of sales development teams are reporting to sales.
- SDRs who report to sales are 15.2% more likely to hit their quota than SDRs who reportto marketing.
- A combination of account-based and high-velocity is the most common SDR accountmodel.
- Pipeline sourced by functional group compared to SDR
Concept 3: Overall Attainment - SDR quota attainment dropped in 2020.
- Mean variable and monthly quota attainment
- Lead/contact-based marketing leads in quota attainment
- The average on-target earnings for SDRs over the past two years
- What is the optimal ramp time?
- Deal size and mean turnover
Concept 4: How Playbooks Can Help

Executive Summary Sales development plays an essential role in any sales team and a pivotal function in a sales process. Sales development reps (SDRs) streamline the sales cycle by qualifying inbound leads and prospects, connecting sales and marketing, and are often the first contact or interaction with potential customers. Simply put—without them, deals wouldn’t get closed. But what does a high-performing sales development team look like? Which structure is most effective? How should you structure your tech-stacks, define your stages, or compensate SDRs? Find answers to these questions and more in this report.
Sales development plays an essential role in any sales team and a pivotal function in a sales process. Sales development reps (SDRs) streamline the sales cycle by qualifying inbound leads and prospects, connecting sales and marketing, and are often the first contact or interaction with potential customers. Simply put—without them, deals wouldn’t get closed. But what does a high-performing sales development team look like? Which structure is most effective? How should you structure your tech-stacks, define your stages, or compensate SDRs? Find answers to these questions and more in this report.
Three of the more significant takeaways from this study are:
1) Sales teams are becoming more focused on SD and AE collaborations and support.
2) The use of technology during the pandemic changed such that reps are emphasizing socialmedia prospecting, calling, and the use of data services to find the correct targets and the bestinformation.
3) Sales teams are rediscovering the need for rapid lead follow-up, but are also increasing theirefforts on lead quality, which means appropriate application of automation, robust salesprocesses, and improved reporting are crucial for the success of remote teams.
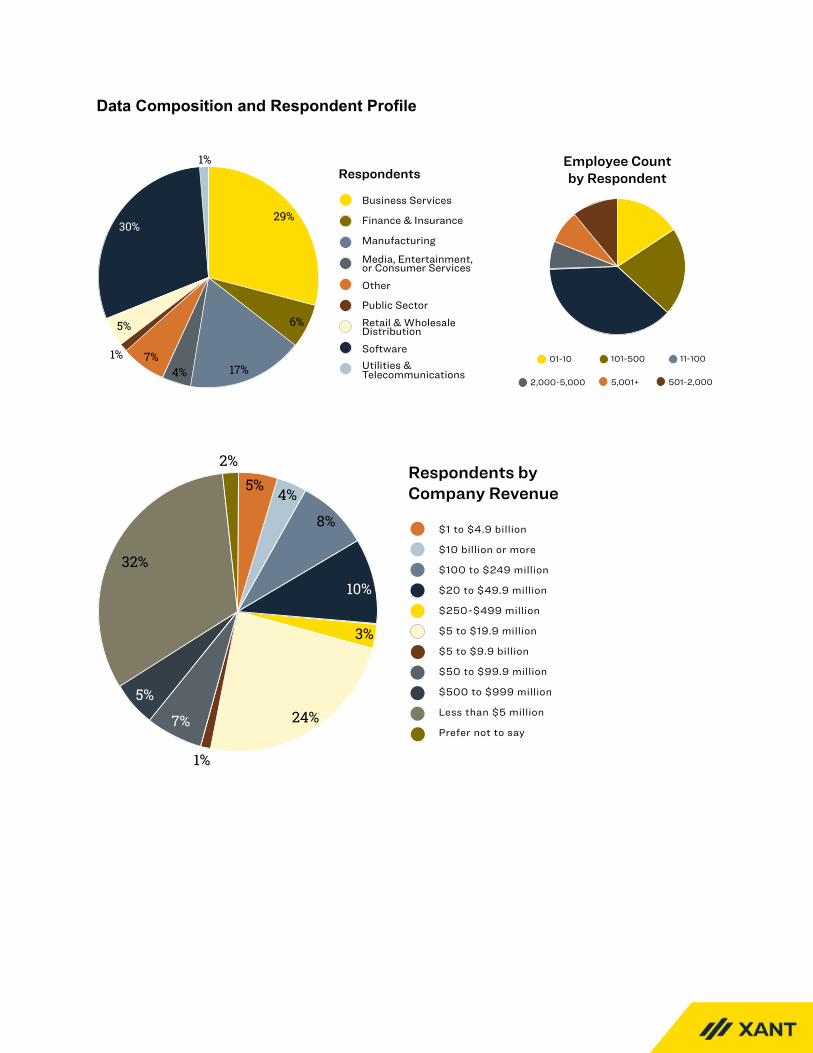
Data Composition and Respondent Profile
29%
6%
17%4%1%
5%
7%
30%
1%
Business Services
Finance & Insurance
ManufacturingMedia, Entertainment,or Consumer ServicesOther
Public SectorRetail & WholesaleDistributionSoftwareUtilities &Telecommunications
Respondents
01-10 101-500 11-100
2,000-5,000 5,001+ 501-2,000
Employee Countby Respondent
2%5%
4%
8%
10%
1%
3%
24%7%
5%
32%
$1 to $4.9 billion
$10 billion or more
$100 to $249 million
$20 to $49.9 million
$250-$499 million
$5 to $19.9 million
$5 to $9.9 billion
$50 to $99.9 million
$500 to $999 million
Less than $5 million
Prefer not to say
Respondents byCompany Revenue

Concept 1: The Technological Landscape In the last year, the digital landscape of the sales industry aged ten years in one. Remote work teams were required to not only embrace but lean on technology as a means to complete their daily tasks. Not only were workers remote, but prospects were too. No more in person meetings, no more office visits. In this concept, we address how the tech landscape has changed and how reps have adapted to meet the digital needs of 2021.
CRM, social prospecting, and data rank as the hottest tech tools. In order to determine which technologies were being considered, developed, or potentially replaced by the available tech, we pulled our survey results from 2017, 2018, and 2020. Our findings appear to align with the general trends that others are seeing in the market.1
We evaluated the “top technical tool” categories reported by our response group and discovered that a major shift toward formal CRM adoption has solidified since 2017 where we had predicted that CRM would eventually increase in adoption by 38%. But, as per our current research, all respondents reported CRM utilization.
Sales leaders may see this fact as trivial given that CRM acts as a source of truth for reporting tools, marketing data, and measuring the productivity of the sales team. But without it, a modern sales process is challenging to implement in a cost-effective manner.
In addition to CRM, social prospecting technology has also remained pivotal for successful sales teams—particularly during current market conditions due to COVID-19. The increase shown in phone and dialing likely reflects the need to prioritize high-value touches over low-value ones.
1 https://www.saleshacker.com/sales-tools/

Our research in 2017-2018 has shown that sales cadence tools were associated with the greatest quota attainment at just over 78%. We have seen greater dispersion in these numbers as more technology comes to market. In 2020, prioritization and targeting tools reported the highest attainment hovering at about 80%.
Prioritization is a vital element of social prospecting tools. Without prioritization, increased productivity just increases unwanted and untargeted outreach—which does not lead to a lasting impact on revenue. Playbooks™ by XANT ensures reps are always directed to the highest priority customers and tasks based on collective data from over 27 billion revenue interactions and outcomes.
Tech attainment continues to grow—reporting and SMS in the lead. The sales engagement space has had several different technologies emerge to fix niche problems. There is tech for reporting, for chat, for video engagement, CRM, cadences, etc. Most organizations have taken to Frankenstein several techs together to get everything done. But the simpler solution is to find an all-encompassing platform. Playbooks began as a sales cadence and power dial tool, but now offers so much more—including reporting, SMS, video engagement, prioritization, and other top tech abilities listed below. All this integrates seamlessly with your CRM for one go-to tool.
Above, we saw that data/list services is ranked as a top tool (at number 3), however it is not scoring high in attainment, as seen below (only 2%). This may indicate an attempt from sales dev teams to get more done—but this does not necessarily mean more or better results. Our data shows that a focus on a strategic multi-channel engagement of leads impacts results more effectively and consistently.

Lead Response Data After examining 5.7M marketing leads and 55M sales activities across 400+ companies, we found four major takeaways that prove a quick lead response still matters. 2
INSIGHT: Reps who hit the phones and followed up on marketing leads on Mondays and Thursdays had 15% higher conversation rates, and 19.7% higher conversation rates on Tuesdays.
INSIGHT: Contact rates for marketing lead follow-up were 28.4% from 9:00-10:00 AM (local time) than the full-day average. Contact rates between 6:00-11:00 AM were 27.2% than between 12:00-6:00 PM. Focusing on the hour between 9:00-10:00 AM, we saw the highest conversation rates and a difference of 44.5% than the average between 12:00-6:00 PM.
2 https://www.xant.ai/response-time-matters/
Conversion RatesTUESDAY VS. WEEKLY AVERAGE
Average Tuesday
19.7%DIFFERENCE
Best Days toMake ContactBest Days to Call Inbound Leads
BY SUCCESS PERCENTAGE
Monday
Tuesday
Wednesday
Thursday
Friday15%
20%
25%
Best Times to Call Inbound LeadsBY CONTACT RATE
6am 8am 10am 12pm 2pm 4pm 6pm
Best Times toMake Contact
9-10AM VS. 12-6PM AVERAGE
9 - 10am 12 - 6pmAvg.
44.5%DIFFERENCE
Conversion Rates

INSIGHT: Our data found that conversation rates are 8x higher within the first 5 minutes vs 6+ minutes. We also found that less than15% of attempts occur within the first day, let alone the first 5 minutes.
INSIGHT: Contact attempts are going down. 81% of sellers make 5 or fewer follow-up attempts, but data shows that 7 or more contact attempts yield 15% more connections.

Concept 2: Team Construct Building a high-performing sales development team and strategy may look different in 2021 than previous years. A successful sales development team is a well-oiled machine pumping a consistent flow of pipeline. But to create this productive and predictable team, what do you need? How many SDRs? What ratio of AE to SDR should you have? Who should your SDRs report to? In this concept, we will break down what SDR teams looked like in 2020, trends we’ve seen, and what they mean.
Outbound sales teams make more dials and send more emails. Outbound teams engage in a 25% more dials over hybrid teams, and a 59% increase in email activities. Because outbound teams must manage a significant amount of uncertainty in prospecting, emails are usually used more often than social media outreach or even SMS messaging. In addition to activity over-use, the marginal value of email activities declines rapidly based on various dimensions like when is the best time to contact, what personalization should be used for a given persona, and how often you should use the same activity given any particular prospect. The requirements facing an outbound sales team necessitates creating more engagements to drive demand. These teams must often coordinate long lists of suspects or prospect accounts to work in addition to a taxing queue of tasks—it’s important that sales leaders focus on ensuring the proper capabilities and resources are available to these teams to help support those needs.
INSIGHT: Outbound sales teams need to be able to drive engagement across all channels in a strategic manner to effectively penetrate new accounts. Focus should be on things that will produce better results instead of just doing more.
The ratio of sales reps to sales development reps is down 16.7% since 2018. Since our landmark State of Sales Development study in 2017, this ratio has steadily declined from 3.0 to 2.5 to 2.0. In 2020, there was an average ratio of 2.0 account executives for every 1 supporting SDR. Sales development has been expected to contribute more pipeline for their teams. This high-performing trend requires fewer account executives per SDR. We expect this number to continue to decline as a focus toward lead quality and account-focused strategies dominate.
The number of AEs per SDR deceasing allows both AE and SDR teams to become more strategic in their approach. It can be difficult for an SDR to learn how to operate efficiently and strategize with multiple AEs.

INSIGHT: Lower AE/SDR ratios means more time together, better mentorship, and better productivity.
Inbound sales teams have the highest AE/SDR ratio description. In our 2017 and 2018 study, we noted that there seemed to have been a general movement toward an account-based sales motion, where SDRs are supporting AEs more directly. This appears to be maintained. However, with a focus on ABM and other demand-gen heavy marketing efforts, inbound teams have increased the number of AE to SDRs. Inbound teams are likely dealing with more leads that have a higher interest level; hence, inbound teams can more easily push leads down funnel compared to outbound teams.
INSIGHT: Inbound teams can leverage less personalized support across the accounts or leads managed.

AE to SDR Ratio by Team Type Remains Consistent. The ratio of AE to SDR has remained consistent since our prior study in 2018. No one team type displayed any statistically significant change. So, to help dive into the data, we performed a study on over 25,000 accounts where we evaluated, by industry, the number of SDRs and AEs. We discovered that the deviation from the mean, across all industries, is only 2.1.
INSIGHT: Industries with greater product diversity and higher variance in sales cycle tend to have a higher ratio of AE to SDR. There are other factors (sales cycles, business to business, or business to consumer) that affect how teams are composed by industry.
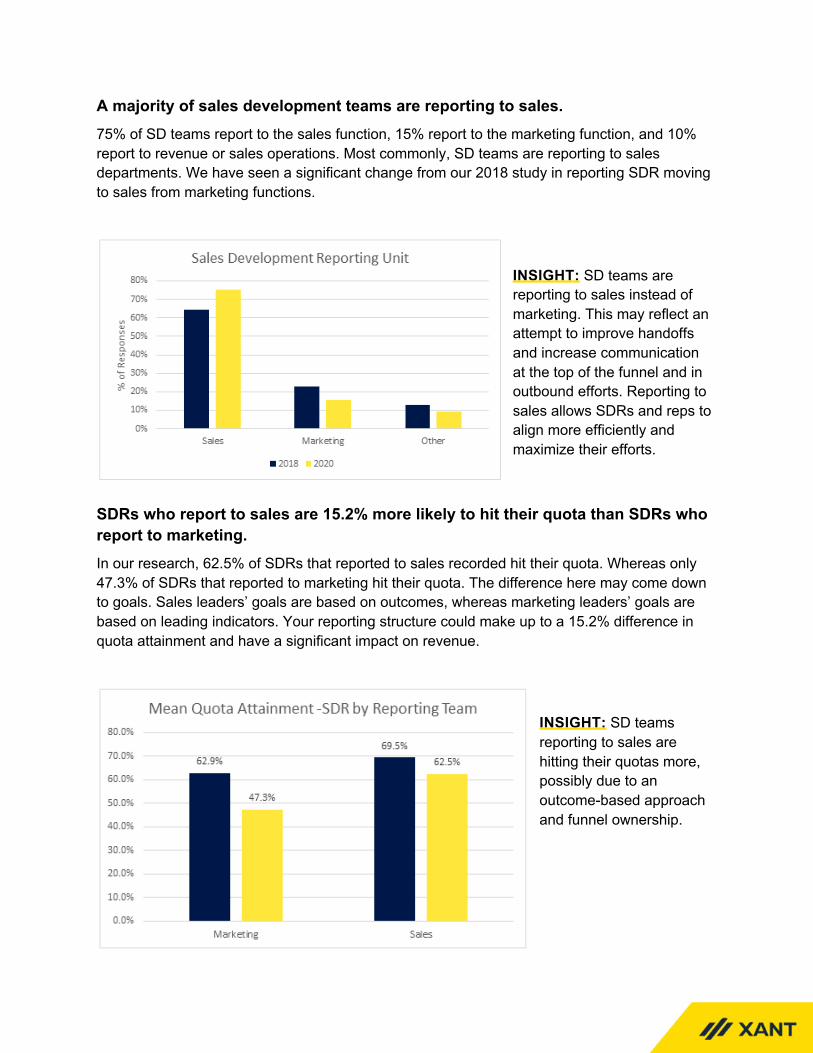
A majority of sales development teams are reporting to sales. 75% of SD teams report to the sales function, 15% report to the marketing function, and 10% report to revenue or sales operations. Most commonly, SD teams are reporting to sales departments. We have seen a significant change from our 2018 study in reporting SDR moving to sales from marketing functions.
INSIGHT: SD teams are reporting to sales instead of marketing. This may reflect an attempt to improve handoffs and increase communication at the top of the funnel and in outbound efforts. Reporting to sales allows SDRs and reps to align more efficiently and maximize their efforts.
SDRs who report to sales are 15.2% more likely to hit their quota than SDRs who report to marketing. In our research, 62.5% of SDRs that reported to sales recorded hit their quota. Whereas only 47.3% of SDRs that reported to marketing hit their quota. The difference here may come down to goals. Sales leaders’ goals are based on outcomes, whereas marketing leaders’ goals are based on leading indicators. Your reporting structure could make up to a 15.2% difference in quota attainment and have a significant impact on revenue.
INSIGHT: SD teams reporting to sales are hitting their quotas more, possibly due to an outcome-based approach and funnel ownership.
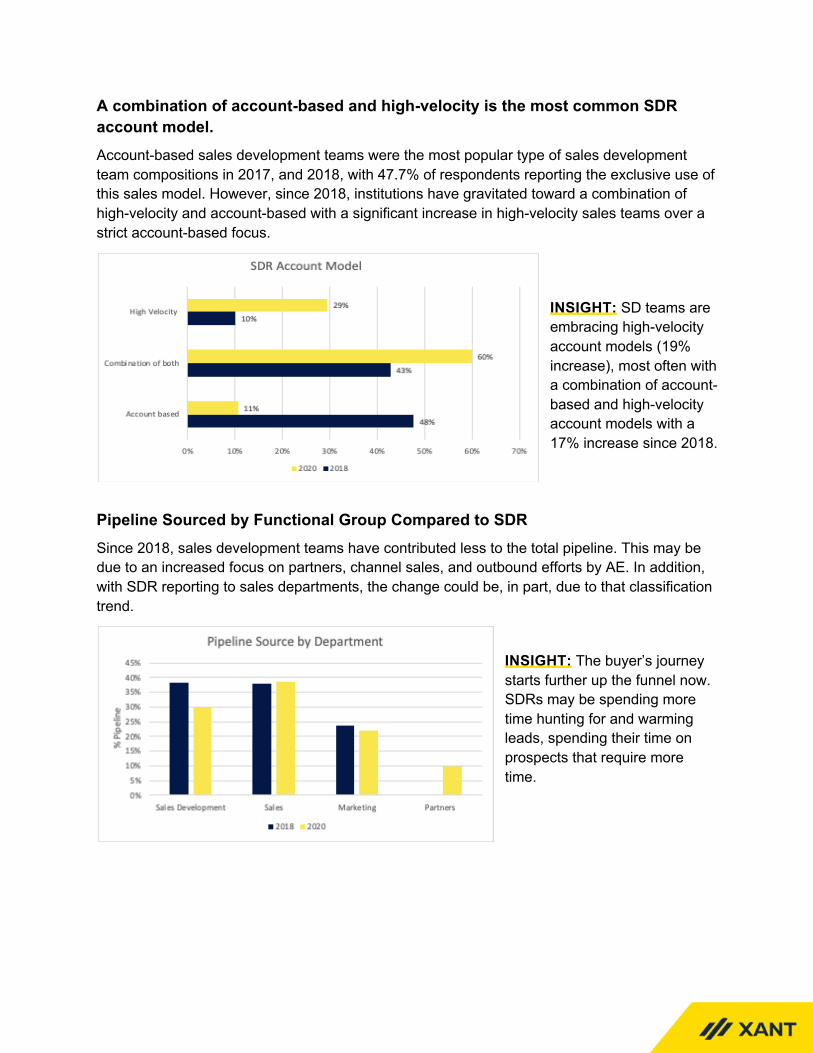
A combination of account-based and high-velocity is the most common SDR account model. Account-based sales development teams were the most popular type of sales development team compositions in 2017, and 2018, with 47.7% of respondents reporting the exclusive use of this sales model. However, since 2018, institutions have gravitated toward a combination of high-velocity and account-based with a significant increase in high-velocity sales teams over a strict account-based focus.
INSIGHT: SD teams are embracing high-velocity account models (19% increase), most often with a combination of account-based and high-velocity account models with a 17% increase since 2018.
Pipeline Sourced by Functional Group Compared to SDR Since 2018, sales development teams have contributed less to the total pipeline. This may be due to an increased focus on partners, channel sales, and outbound efforts by AE. In addition, with SDR reporting to sales departments, the change could be, in part, due to that classification trend.
INSIGHT: The buyer’s journey starts further up the funnel now. SDRs may be spending more time hunting for and warming leads, spending their time on prospects that require more time.

Velocity models have seen base salaries increase while variable salaries dipped. It’s a different story for account-based models. Since 2018, we’ve tracked various SDR models and how firms are adjusting on-target earnings. The growth in high velocity sales teams (a sales team that is quickly moving leads through the pipeline and impacting revenue), has fueled an increase of an incredible 82% in base salary. However, the variable portion has taken a reduction of -29.4%. Account-based models have remained consistent with respect to base salaries but have increase by an average of 36% overall.
INSIGHT: Sales engagement tools that increase output and attainment potential for SDRs with an account-based motion may be driving salary growth.
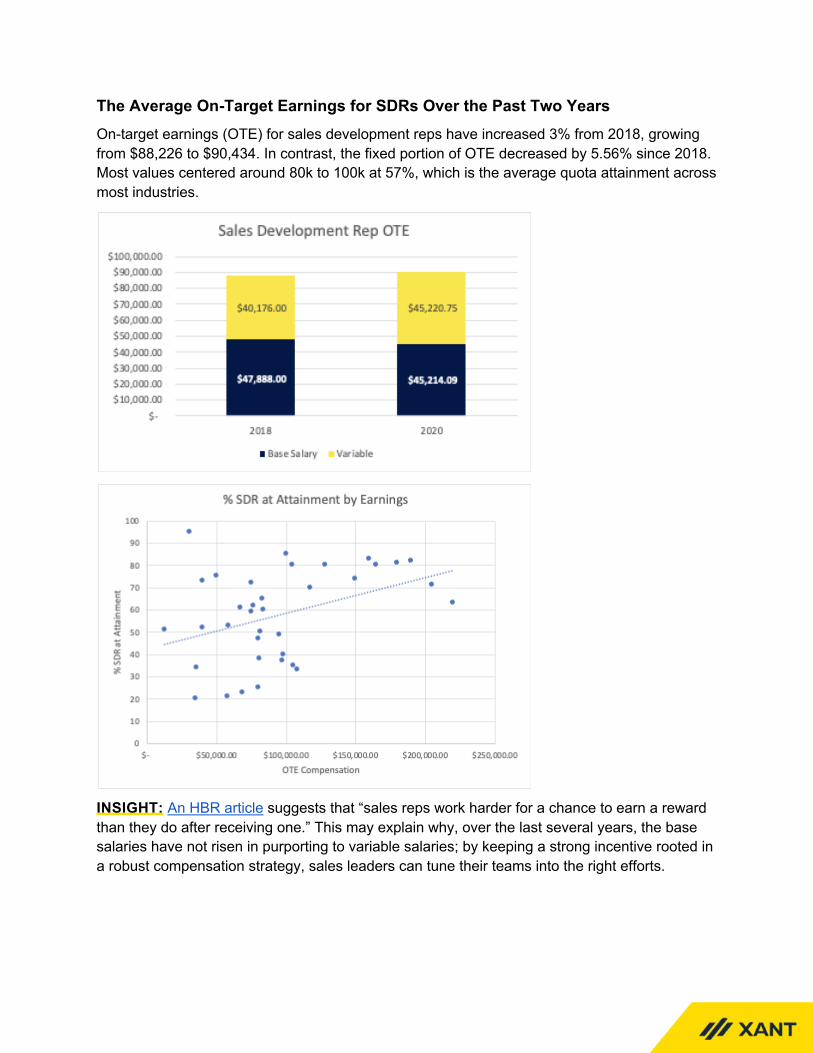
The Average On-Target Earnings for SDRs Over the Past Two Years On-target earnings (OTE) for sales development reps have increased 3% from 2018, growing from $88,226 to $90,434. In contrast, the fixed portion of OTE decreased by 5.56% since 2018. Most values centered around 80k to 100k at 57%, which is the average quota attainment across most industries.
INSIGHT: An HBR article suggests that “sales reps work harder for a chance to earn a reward than they do after receiving one.” This may explain why, over the last several years, the base salaries have not risen in purporting to variable salaries; by keeping a strong incentive rooted in a robust compensation strategy, sales leaders can tune their teams into the right efforts.
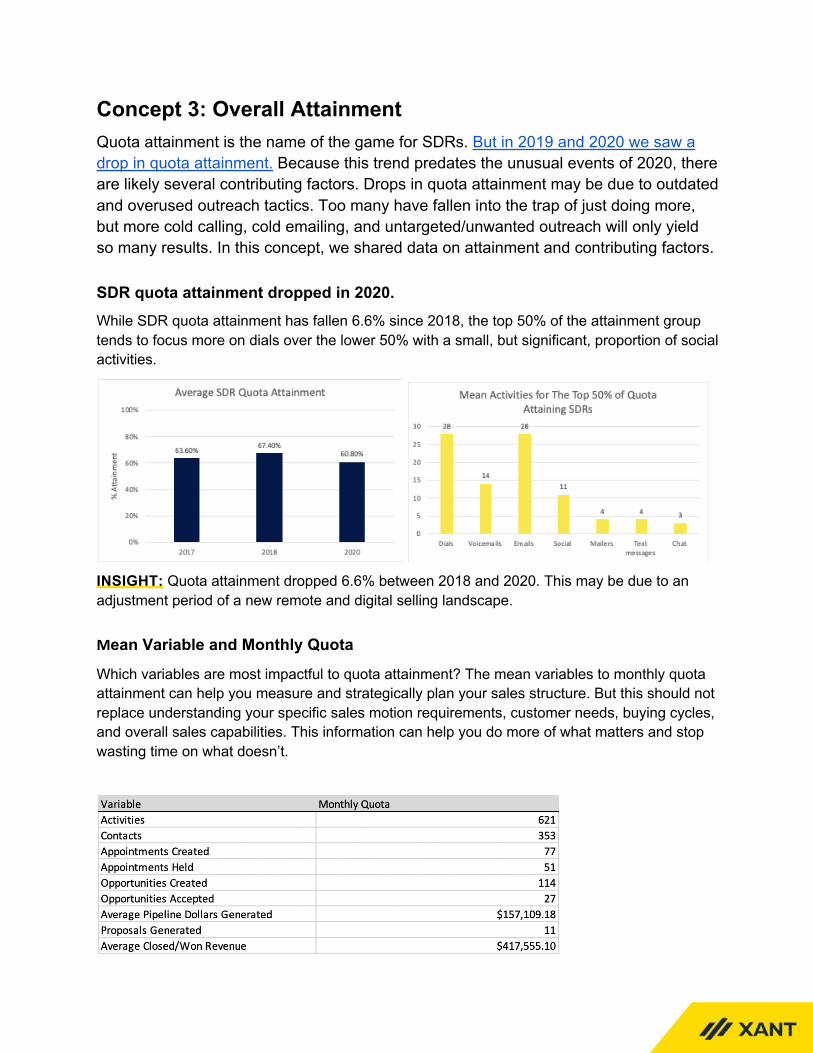
Concept 3: Overall Attainment Quota attainment is the name of the game for SDRs. But in 2019 and 2020 we saw a drop in quota attainment. Because this trend predates the unusual events of 2020, there are likely several contributing factors. Drops in quota attainment may be due to outdated and overused outreach tactics. Too many have fallen into the trap of just doing more, but more cold calling, cold emailing, and untargeted/unwanted outreach will only yield so many results. In this concept, we shared data on attainment and contributing factors.
SDR quota attainment dropped in 2020. While SDR quota attainment has fallen 6.6% since 2018, the top 50% of the attainment group tends to focus more on dials over the lower 50% with a small, but significant, proportion of social activities.
INSIGHT: Quota attainment dropped 6.6% between 2018 and 2020. This may be due to an adjustment period of a new remote and digital selling landscape.
Mean Variable and Monthly Quota
Which variables are most impactful to quota attainment? The mean variables to monthly quota attainment can help you measure and strategically plan your sales structure. But this should not replace understanding your specific sales motion requirements, customer needs, buying cycles, and overall sales capabilities. This information can help you do more of what matters and stop wasting time on what doesn’t.

Lead/Contact-Based Marketing Leads in Quota Attainment When breaking down the type of team focus under each function, our research has shown that quota attainment is largely consistent across sales types, yet marketing SDR teams tend to be highly effective only in the lead/contact-based teams. This may reflect either speed to lead, or information proximity (closeness to marketing campaigns and efforts).
INSIGHT: SDRs convert more prospects when they focus on interested people and don’t waste time hunting and generating interest—marketing should be focused on hunting.

Closed/won revenue remains the top compensation factor but drops significantly. Closed/won revenue was reported to be the most-used component in variable compensation packages. This number has decreased from over 60% in 2018 to 44.9% in 2020. This may be due to multi-metric compensation packages becoming more common.
INSIGHT: Several factors are being taken into account for compensation outside of closed/won rates.

SDR Compensation Factors Determining factors for SDR compensation have leveled-out over the past few years. Additional factors have been taken into consideration such as revenue realization and other top-of-funnel measures.
INSIGHT: Multiple factor compensation plans are becoming more common.
SDR Compensation and Attainment Rate Attainment and the number of factors is not statistically significant. There is likely not an association with the number of factors and the ability to hit quota.
INSIGHT: Research points to a multi-variable compensation plan or, at least, periodic bonus structures as among the most motivational.
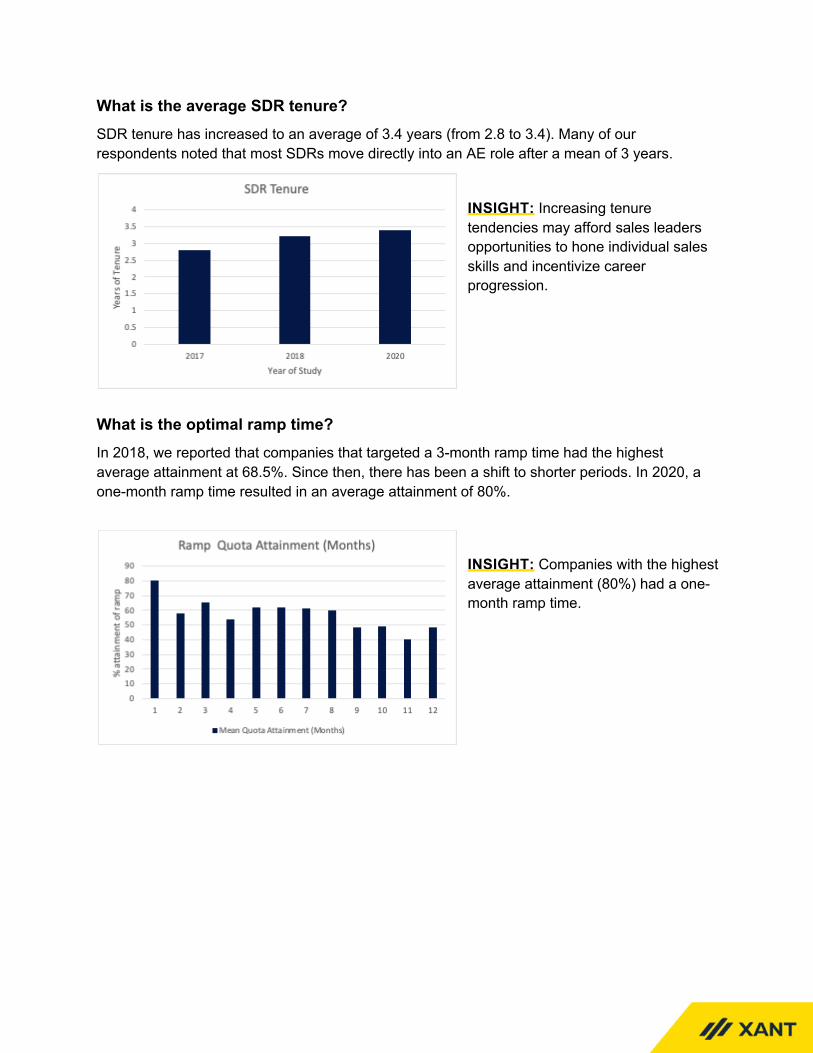
What is the average SDR tenure? SDR tenure has increased to an average of 3.4 years (from 2.8 to 3.4). Many of our respondents noted that most SDRs move directly into an AE role after a mean of 3 years.
INSIGHT: Increasing tenure tendencies may afford sales leaders opportunities to hone individual sales skills and incentivize career progression.
What is the optimal ramp time? In 2018, we reported that companies that targeted a 3-month ramp time had the highest average attainment at 68.5%. Since then, there has been a shift to shorter periods. In 2020, a one-month ramp time resulted in an average attainment of 80%.
INSIGHT: Companies with the highest average attainment (80%) had a one-month ramp time.

Deal Size and Mean Turnover Deal size tends to correlate with increased sales cycles. SDRs that are compensated on value realization in the form of ACV may obtain delayed rewards for their past efforts which can contribute to increased attrition. Our results do not provide evidence of a distinct difference between “medium” and “small” deal sizes.
Deal Size Mean % Turnover
Large 22.5
Medium 31.95
Small 28.944
INSIGHT: SDRs who had small and medium deal sizes saw the highest turnover during 2020, possibly due to increased attrition.

Concept 4: How Playbooks Can Help
The sales development function, much like all revenue functions—and basically the rest of the world—changed in 2020. We saw the effects of digital disruption accelerate, exposing a lot of black holes in processes and strategy. There are new hurdles and a growing number of unknowns teams have to deal with, and it’s creating a surge in guessing that is unsustainable.
Guessing in sales means random acts of selling, which gets you random results. The key to surviving through, and thriving in, this new disrupted dynamic is to embrace a shift from guessing to guided experiences, from unstructured to controlled and channeled, from random to consistent, and from siloed to aligned.
That’s why we made Playbooks and how we plan to continue innovating—replace guessing with guided sales engagement.
The Playbooks Formula of Values
Simply put: to win more, you need to close more deals. This happens when you have a better pipeline. Meaning you need to work the right deals, engage the right people, and have more meaningful conversations.
Here’s how you do that:
Visibility. You can’t plan, coach, or enforce what you can’t see. We put data where it belongs: in the CRM. We guide actions where data will be used: with reps.
Prioritization. We tie data to actions so reps don’t have to think about it. Managers can easily enforce a process and an order that guides reps to do the right things in the right order with the right customers. Not more, at first, but better.
Productivity. Once you know what works, do more of that. We take the technical stuff you need—automation, process, data—and make it work for you behind the scenes so you can focus on selling.
The Components That Make It Work
Automation. Automation should not be a tool for email spamming but a means for making reps more effective. In Playbooks, we automate tasks and processes, including dynamically enrolling and moving records between cadences, updating CRM fields, alerting reps to activity and triggering actions, eliminating time-consuming tasks, and, yes, engaging via email. The system uses robots to constantly monitor your CRM in order to prompt the best action or most relevant automation rule.
Shared Records. Playbooks can automatically designate records for either shared or personal ownership. For records designated as Shared, urgent tasks will automatically round-robin until someone on the team takes action.
Structure. Structure your reps’ activities within a process that you can enforce, and through which reps can be guided. Processes in Playbooks provide give reps a proven formula for how to spend their time for the best results.
Prioritization. It is easy to do more but doing more of the wrong things won’t help anyone. If you have 100 tasks to do, but only time to do 50—which 50 do you do? Prioritization will draw on XANT intelligence to tell you which activities are the highest priority and are most likely to lead to more closed deals.
Reporting. Playbooks uses bi-directional sync to capture all activity and outcome data in CRM and maintain it there for all to access. You can also automatically update 25+ additional CRM fields and populate custom performance reports for richer insights.
Data. Playbooks is unique in the data insights it can provide for two reasons: 1) we capture and anonymize all activity and outcome data from across our platform, and 2) we train ML models on that data and publish insights directly into your workflows. This allows us to answer questions like who’s in the buying committee, what is their influence, what are their preferences, who else to engage, and how.