iuwm alexandria 2030 final2 pgs v3 - switchurbanwater.eu · all the drainage systems of alexandria...
TRANSCRIPT


Contributors
Team Leader: Prof. Dr. Khaled M. Abu-Zeid, CEDARE
International Coordinator: Dr. Peter Van Der Steen, UNESCO-IHE
Authors:
Prof. Dr. Khaled M. Abu-Zeid, CEDARE
Prof. Alaa Yasseen, Alexandria University
Dr. Peter Van Der Steen, UNESCO-IHE, the Netherlands
Eng. Philip Sharp, Battus Associates, United Kingdom
Eng. Mohamed Elrawady, CEDARE
CEDARE Coordinator: Eng. Mohamed Elrawady, CEDARE Version September 2011

Table of content 1. INTRODUCTION: .............................................................................................................................................1
A. TOPOGRAPHY .................................................................................................................................................3B. CLIMATIC CONDITIONS ......................................................................................................................................4C. LAND USE ......................................................................................................................................................4
2. BACKGROUND TO STRATEGIC PLANNING:.......................................................................................................6
A. THE SWITCH PROJECT: ....................................................................................................................................6B. THE LEARNING ALLIANCE: ..................................................................................................................................7
THE CURRENT SITUATION:....................................................................................................................................10
A. WATER RESOURCES AND USES: ......................................................................................................................... 10B. WATER SUPPLY : ...........................................................................................................................................11C. SANITATION: ................................................................................................................................................15
3. FUTURE THREATS AND UNCERTAINTIES: ....................................................................................................... 19
A. NILEWATER AVAILABILITY:.............................................................................................................................. 19B. CLIMATE CHANGE:.........................................................................................................................................19C. POPULATION: ...............................................................................................................................................20
4. THE 2030 ALEXANDRIA WATER VISION ......................................................................................................... 23
A. WORST CASE SCENARIO (PESSIMISTIC) ................................................................................................................ 23B. BEST CASE SCENARIO (OPTIMISTIC) .................................................................................................................... 23C. BUSINESS AS USUAL (REALISTIC) ........................................................................................................................ 24NOTE*. THE INITIAL LA VISIONING WORKSHOP INCLUDED FOR THE PLANNING HORIZON OF 2037 IN ORDER
TO MATCH THE THEN, CURRENT, ALEXANDRIA MASTER PLAN. .......................................................................24
5. IUWM STRATEGIES TO MEET FUTURE WATER DEMAND:...............................................................................25
A. GROUNDWATER POTENTIAL: ............................................................................................................................ 25B. STORMWATER POTENTIAL: ............................................................................................................................. 26C. WATER DEMANDMANAGEMENT POTENTIAL: ...................................................................................................... 28D. WASTEWATER REUSE POTENTIAL: .................................................................................................................... 28E. AGRICULTURAL DRAINAGE REUSE POTENTIAL ....................................................................................................... 31F. SEAWATER DESALINATION POTENTIAL: .............................................................................................................. 32G. URBANWATER REUSE: ....................................................................................................................................34H. ANALYSIS OF STRATEGIC OPTIONS: ..................................................................................................................... 35
6. MEETING MULTIPLE OBJECTIVES & STRATEGY RANKING ...............................................................................39
FIG 16 SUPPLY CURVE FOR ALL STRATEGIC OPTIONS CONSIDERED ...................................................................41
7. SUSTAINABLE IUWM INDICATORS: ............................................................................................................... 44
A. ECONOMIC INDICATORS: .................................................................................................................................44

B. SOCIAL INCLUSION INDICATORS: ........................................................................................................................ 46C. ENVIRONMENTAL INDICATORS: ......................................................................................................................... 47D. TECHNICAL INDICATORS: .................................................................................................................................48E. ENERGY INDICATORS: .....................................................................................................................................50F. THE INTEGRATION INDICATOR:.......................................................................................................................... 51G. OVERALL SCORING: ........................................................................................................................................52
8. INSTITUTIONAL MAPPING:............................................................................................................................ 53
A. CURRENT INSTITUTIONAL MAP: ......................................................................................................................... 53B. ABILITY TO ACHIEVE PROPOSED STRATEGIES:.........................................................................................................53C. SUGGESTED INSTITUTIONAL ARRANGEMENT: ........................................................................................................ 53
9. IMPLEMENTATION PLAN: ............................................................................................................................. 55
A. TIMELINE FOR IMPLEMENTATION: ...................................................................................................................... 55B. CONSTRAINTS & RISK ASSESSMENT:................................................................................................................... 55C. M&E PLAN AND KEY FACTORS: ......................................................................................................................... 56
REFERENCES.........................................................................................................................................................58

P a g e | 1
Alexandria2030
IntegratedUrban
WaterM
anagement(IU
WM)Strategic
Plan1. Introduction:
Alexandria with 4.0 million inhabitants on the northern coast of Egypt is one of the
major cities on the Mediterranean Sea and Egypt�’s second largest metropolitan.
Alexandria accounts for about 5.5% of Egypt�’s Population and for almost 8% of the
country�’s GDP. It embraces a coast line of 70 kilometers and is home to 40% of
Egypt�’s industrial establishments.
Alexandria is the most downstream city on the longest river in the world, the Nile
River, with Egypt being its most downstream country. The Nile River represents the
main renewable source of water, supplying over 95% of Alexandria�’s water demand.
As it resides on the Mediterranean coast, Alexandria is a summer destination,
increasing its population in the summer to 6 million people, putting more pressure
on the city's water demand. The city receives rainfall of less than 200 mm/year.
Storm water either finds its way into sewage systems or drains into the
Mediterranean Sea without use, or seeps into the coastal groundwater aquifer
through the little-left infiltration areas of the city. Most of the city is covered with
potable water supply networks, but many peri-urban and informal settlements lack
sewage/sanitation coverage. Most of the city sewage is at least primary or secondary
treated; however, potential uses of this treated wastewater are yet to be explored in
line with the country's National Water Resources Plan.
Alexandria lays north-west of the Nile delta and stretches along a narrow land strip
between the Mediterranean Sea and Lake Maryut (Mareotis). The city extends
southwards from the coast to a depth of 2-5Km. in the area of Abu Qir to El
Dekhiela, to about 30 Km. near El Ameriya and Burg El Arab. It is linked to Cairo
by two major highways and a railroad line. It is one of the most notable summer
resorts in the Middle East, for, in addition to its temperate winters, its beaches, with
white sands and magnificent scenery, stretch for 140 km along the Mediterranean
Sea, from Abu Qir, in the east to Sidi Kerer, in the west.

P a g e | 2
Alexandria2030
IntegratedUrban
WaterM
anagement(IU
WM)Strategic
PlanIn the city of Alexandria there are nine low-income, peri-urban areas that remain
under or even un-provided with water and sanitation services. Though there are City
and Governorate level plans for extending or upgrading services to these areas, the
involvement of residents/users from these marginalized areas of the city has,
hitherto been very limited.
Population in Alexandria has increased ten times in the last 100 years with pressing
demand for new land development including the area around Lake Maryut which is
now surrounded by urban and industrial development and drains in the �“hot spot�”
known as El-Mex bay.
The Governorate of Alexandria consists of three individual cities: Alexandria, Borg
El Arab City Centre and New Borg El Arab. The city of Alexandria itself is divided
into six districts which are shown in fig. 1, three local village units and five sub-
village units. The six districts of the urban area are:
Montazah District, which include five villages in the Abiss region, with a total
area of 81 square kilometer.
Eastern District, which includes two sub-district; namely; El-Raml and Sidi
Gaber, with a total area of 49 square kilometer.
Middle District, which includes three, sub-districts; namely; Bab Sharq, El-
Attareen, and Moharrem Beik, with a total area of 36 square kilometer.
Western District, which includes two sub-districts; namely; Karmoz and Mina
El-Basal, with a total area of 30 square kilometer.
Customs District which has the highest population density and is the smallest
Alexandria district with a total area of about 4 square kilometer and includes
four sub-districts, namely; El-Mansheya, El-Gomrok, El-Lebban and El-
Meenaa El-Sharqee.
El-Ameriah District, which includes three sub-district; namely; El-Dekheelah,
El-Agamee, and El-Ameriah, with total area of 2295 square kilometer for the
district.

P a g e | 3
Alexandria2030
IntegratedUrban
WaterM
anagement(IU
WM)Strategic
Plan
Fig.1 The six districts of the urban area in Alexandria
a. TopographyFig.2 Location and Topographic Map of Alexandria Governorate

P a g e | 4
Alexandria2030
IntegratedUrban
WaterM
anagement(IU
WM)Strategic
PlanThe area is characterized by irregular hills in the southern parts with an elevation
from 0 to more than 40 meters above Mean Sea Level and generally slopes towards
the Mediterranean Sea in the north. All the drainage systems of Alexandria flow into
the Mediterranean Sea.
b. Climatic conditions
The climate of the Alexandria region is one of the mildest of the Mediterranean Sea.
It varies from a moderate climate in the north to arid-semi arid climate in the south.
The average annual rain is 169 mm. Most of rain falls along the coastal area and it
decreases suddenly moving southwards. The humidity in Alexandria is very high;
however sea breeze keeps the moisture down to a comfortable level.
c. Land use
Fig.3 presents the land use map of Alexandria governorate. The total surface area of
Alexandria Governorate is about 2680 square kilometer with different land uses
which are:
Desert land which represents about 53% of the governorate area which is
about 1430 square kilometers and mainly lies in the west and western south
of the city.
Agricultural uses of total area of about 730 square kilometer represent about
27% of the total area of the governorate which mainly lies in the south and
south east. . The cultivated areas are based mainly on Nile water and
groundwater is used as a supplementary source in some areas.
Surface water area which represents about 8% of the total area of the
governorate and includes lakes, canals, drains and fishery farms with a total
area of about 210 square kilometer.
Municipality and Urban area which represents the remaining part of the
governorate area (about 12% and 310 square kilometer) including the
following uses:
1. Housing buildings of about 46 %

P a g e | 5
Alexandria2030
IntegratedUrban
WaterM
anagement(IU
WM)Strategic
Plan2. Industrial buildings of about 19 %
3. Roads, railway, and marine uses of about 29%
4. Public and recreation areas of about 3%
5. Military buildings of about 3 %
Fig. 3 Land use map of Alexandria governorate.

P a g e | 6
Alexandria2030
IntegratedUrban
WaterM
anagement(IU
WM)Strategic
Plan2. Background to Strategic Planning:
a. The SWITCH Project:
The SWITCH Project (Sustainable Water Management Improves Tomorrow�’s Cities�’
Health�”) is a research partnership funded by the European Commission (EC)
undertaking innovation in the area of Integrated Urban Water Management
(IUWM). SWITCH is an international consortium of 32 partners from 13 countries,
led by UNESCO-IHE Institute for Water Education. The main goal of the
SWITCH Project is to develop and implement scientific, technological and
socioeconomic solutions that foster sustainable development and integrated urban
water management. SWITCH assisted in preparing a strategic planning document in
5 of its demonstration cities around the world. Alexandria City was chosen to
represent North Africa and the Arab Region. The project was set for the period
between 2006 and 2011.
The Centre for Environment & Development for the Arab Region & Europe
(CEDARE) is the organization which followed up the activities of the project and
made the required coordination between the different related institutions and sectors
in Alexandria.
Since the beginning of the SWITCH project in 2006, many activities were achieved ,
including forming the Learning Alliance group (LA) which consists of a group of
representatives from different sectors such as Alexandria Governorate, the Holding
company for water and wastewater, Alexandria water company (AWCO), Alexandria
wastewater company, CEDARE, Alexandria University, the Alexandria health
institution, the Ministry of environmental affairs, and the NGO for Environment ,
Development, and Culture in Alexandria .
Fifteen LA meeting were held, several workshops and trainings were organized in
the field of water demand management, water resources assessment and modeling,
visioning and scenario building. In addition the LA has determined a demonstration

P a g e | 7
Alexandria2030
IntegratedUrban
WaterM
anagement(IU
WM)Strategic
Plansite in the City of Alexandria to apply and execute some of the new innovations of
the SWITCH Project as a model.
To develop an IUWM strategic plan for Alexandria, ten studies were prepared
representing the base for the strategic planning team to develop a strategic plan for
Alexandria for the year 2030. These studies covered Water Demand Management,
Wastewater Management and Re-use, Urban Water Modeling, Storm Water
Management, Ground Water Management, Desalination potential, Nile Water
Availability, Financial Sustainability, Social Inclusion and Institutional Mapping.
Available data have been collected for the city water resources covering the historic
development of the water system in Alexandria, description and assessment of the
current and future Water Demand Management, as well as the activities and
responsibilities of different stakeholders including Ministry of Water Resources and
Irrigation (MWRI), Alexandria Water Company (AWCO), Alexandria sanitary
drainage company (ASDCO), and other institutions involved in water management.
b. The Learning Alliance:
The Learning Alliance was established with representatives from all the Water
Sector groups in Alexandria. The Terms of References for these representatives
included highlighting the challenges faced in Alexandria with respect to water-related
issues, as well as ensuring dissemination of this information between the different
LA stakeholders in Alexandria. It was seen to be important to focus on Integrated
Urban Water Management (IUWM) and coordinate between the researchers to
gather information from all sectors in Alexandria on such matters as resources,
infrastructure, stakeholders, and demands of the people. It was also considered
important to put in place guidelines for an IUWM plan which had the potential to be
developed and implemented in Alexandria and which would substantially address the
future water needs of the Governorate. The development of such rules and
procedures that governed the functioning of the LA groups needed time and effort
to reach widely accepted and clear agreements on the commitments to be made by
the SWITCH project partners and the LA Stakeholders. In terms of facilitation of
the Learning Alliance, an LA facilitator and co-facilitator were appointed for the city

P a g e | 8
Alexandria2030
IntegratedUrban
WaterM
anagement(IU
WM)Strategic
Planof Alexandria, as well as several other members of the CEDARE team who provided
support in the LA facilitation processes.
Entities Involvement in LA process included:
1. Ministry of Water Resources and Irrigation,
2. Ministry of Housing, Utilities & Urban Development,
3. Ministry of Agriculture and Land Reclamation,
4. Ministry of Health and Population,
5. Egyptian Environmental Affairs Agency,
6. Alexandria Governorate,
7. The Holding Company for Water and Sanitation Services,
8. Holding Company for Drinking Water in Alexandria,
9. Holding Company for Sanitation Services in Alexandria,
10. Professors in Universities and Research Centers,
11. NGOs.
Stakeholders were categorized in two main groups; �“Primary�” and �“Secondary�” LA
members. Primary stakeholders were the intended beneficiaries of the SWITCH
project in Alexandria, whereas Secondary stakeholders were those who were seen to
act in the role of intermediaries within the water sector in the Governorate. These
two levels assisted in conducting the analysis pertaining to the management of water
resources in Alexandria, and the analysis of the stakeholders�’ involvement in the
SWITCH Project.
This was carried out as a series of parallel investigations each one examining the
potentials for utilizing other water resources that were both available and feasible to
use such as rainwater, groundwater, and desalination in addition to reuse and recycled
water resource options.
The principal objective was to reduce dependency on the River Nile water, and to
look at integrating one or more of these other potential resources where feasible into
the Alexandria raw water supply network. This was being looked at as a central
element in the "Integrated Urban Water Management plan" for the city of Alexandria

P a g e | 9
Alexandria2030
IntegratedUrban
WaterM
anagement(IU
WM)Strategic
Planwhich was to be the main output for the SWITCH project in Alexandria in an effort
to overcome the rapid increase in water demand in the city by the year 2030.
To develop an IUWM Strategic Plan for Alexandria the following steps
were carried out:
1. Preparation ten individual studies providing data, testing strategic options in
order to feed into the work of the Strategic Planning Team who were
developing a Master Plan for Alexandria for Integrated Urban Water
Management (IUWM) for the year 2030.
2. Collection of data for the city water resources covering the historic
development of the water system in Alexandria, description and assessment of
the current and future water demands, the activities, responsibilities and the
role played by the different stakeholders in the City, including Ministry of
Water Resources and Irrigation (MWRI), Alexandria Water Company
(AWCO), Alexandria sanitary drainage company (ASDCO), and other
institutions involved in water demand management.
3. Developing a vision for water management in the City of Alexandria in the
future taking into consideration the �‘city vision�’ which was formulated
previously by the LA in a series of workshops.
4. Reviewing possible scenarios for the future water system in Alexandria City
and describing these in quantitative detail. The most promising potential
strategies to achieve the overall city vision for water management were
determined.
5. Studying the potential for applying these strategies.
6. Evaluating the strategies formulated in to a holistic or integrated plan.
P a g e | 10
Alexandria2030
IntegratedUrban
WaterM
anagement(IU
WM)Strategic
PlanThe Current Situation:
a. Water Resources and uses:
At present Alexandria receives an annual average rainfall of less than 200 mm/year
and some of the resulting stormwater finds its way into the sewage systems, or drains
through stormwater channels into the Mediterranean Sea without use whereas most
of the stormwater seeps into the coastal groundwater aquifer through the infiltration
areas of the city. Rainfall in Alexandria is clearly limited and its potential likely cost
of harvesting these small amounts of water. .
Nile water is the main water supply to Alexandria (and indeed the whole of Egypt) to
meet agricultural, industrial, municipal and navigation water demands. Currently, the
Governorate of Alexandria is allocated some 12 Million Cubic Meters (MCM)/day
of Nile Water as shown in Table.1.
As for groundwater sources, the present total groundwater extraction from within
the Alexandria Governorate is only 31Million m3/year this being abstracted from
some 1315production wells in total. The Total Dissolved Solids (TDS) ranges
between 794 �– 3808 ppm.
Regarding desalination, at present there are no desalination plants in Alexandria And
it is thought that the future use of such desalinated water resource for different
purposes will largely depend on the rate of improvement in the technologies used for
desalination and the cost of the necessary power. The current water tariffs make
desalination an extremely expensive option for municipal water supplies but certain
industrial or leisure uses may well prove to be an entry points for desalinated water
in the governorate.

P a g e | 11
Alexandria2030
IntegratedUrban
WaterM
anagement(IU
WM)Strategic
PlanTable 1 shows the water allocations from MWRI to meet all water sectors of
Alexandria (Saad, 2010)
Table1. Water allocations to Alexandria (MWRI, 2010)
b. Water Supply :
Alexandria Water Company (AWCO) provides potable water for about 4 million
people. This number increases to 6 million in the summer season due to tourist
influx from other parts of Egypt. Drinking water service covers more than 95 % of
the service area in the city, except for some small parts of the so-called �‘slum areas�’
in which according to the current planning law, the citizens in these areas should
submit their building licenses in order to be supplied with drinking water. Because
the majority of these dwelling have been built without planning permission the
building licenses are generally not available in most cases.

P a g e | 12
Alexandria2030
IntegratedUrban
WaterM
anagement(IU
WM)Strategic
PlanAWCO's drinking water production is maintained through the operation of the
existing eight Water Treatment Plants (WTP�’s) which have a total design capacity of
3.5 million m3 / day.
AWCO is also responsible for the operation and management of the supply network
and distributes the drinking water through its distribution system (34 Booster Pump
stations and a total pipeline network of about 8,600 km length) covering the whole
served area.
Unaccounted For Water (UFW) reached a comparatively high value of 36% and
reducing this value is obviously of great importance when attempting to achieve
water savings thereby minimizing the direct impact of leakage/loses on the
infrastructure and addressing the excessive cost and low profits that the water
company endures. AWCO has already started plans to minimize UFW by
implementing District Metering Areas.
Currently AWCO is serving an area along the Mediterranean coast extending from
Abu Qir in the Eastern side of the city to El Hammam City located 63 Km west of
Alexandria. Also AWCO supplies water to a southern area along the desert highway
in Behira Governorate beyond the New Nubaria City, in addition to assisting in
supplying Matrouh Governorate with drinking water through five dedicated
transmission pipelines. In effect Alexandria sits at the most westerly part of the Nile
Water fed system.
AWCO is committed to supply drinking water to the customers with suitable
pressure in the network sufficient to reach the third floor of the buildings as is
required by the Holding Company. For higher floors in taller buildings customers are
required to use pumps to feed reservoirs on the buildings roofs in order to supply
water to these dwellings.
Nevertheless AWCO is following a policy aiming at installing a water meter in every
household in order to measure (and to reduce the water consumption) accurately in
every housing unit and this will also help in estimating UFW across the various
DMA�’s.

P a g e | 13
Alexandria2030
IntegratedUrban
WaterM
anagement(IU
WM)Strategic
PlanSince 2004, AWCO started to apply Supervisory Control And Data Acquisition
(SCADA) Systems in the water treatment plants in order to monitor and control the
process of water treatment.
The Annual production during the past four years is given in Fig.4, along with water
sales volumes. Meanwhile, Fig.5 shows the water consumption by sectors.
Fig.4 AWCO�’s annual production
Fig.5 Alexandria�’s water consumption by sector

P a g e | 14
Alexandria2030
IntegratedUrban
WaterM
anagement(IU
WM)Strategic
Plan
It is clear that the water tariffs are low and this is one of the main reasons which lead
to the consumers to be careless about minimizing their uses and consumption of
drinking water. This very much brings to the fore the importance of the following
points to be considered:
* Public awareness
* Enforcement of the laws
* Increasing the tariff gradually
* Using saving devices inside all kind of buildings
Furthermore, the company adopts the �‘increasing block�’ pricing system, for
residential users in an effort to allow for some degree of equity between users.
However, the problem with the current system is that the company set a minimum
charge of L.E. 3.00 monthly, which is the value of 10 m3, even if there is no
consumption at all. Such an arrangement does not provide an incentive for water
Water Tariffs (per cubic meter)
A-Domestic
Tariff/m3
Category 1: from (0-10) m3 0.23 L.E
Category 2: from (11-20) m3 0.23 L.E
Category 3: from (21-30) m3 0.25 L.E
Category 4: more than >30 m3 0.35 L.E
B-Governmental
One category 0.80 L.E
C-Commercial
Category 1: 0.70 LE
Category 2: 0.80 LE
D-Investment �– Tourism
One category 1.15 L.E
E-Harbor
Category 1: 12 L.E
Category 2: 24 L.E
Category 3: 28 L.E
Discounted Tariff
Applied for mosques, churches, youth centers, and syndicates
Category 1 0.21 L.E
Category 2 0.42 L.E
Category 3 0.48 L.E

P a g e | 15
Alexandria2030
IntegratedUrban
WaterM
anagement(IU
WM)Strategic
Plansavings as reducing the amount consumed below this 10 m3 does not result in
financial savings on the customers bill.
c. Sanitation:
Alexandria Sanitary Drainage Company (ASDCO) is responsible for all sanitation
services of Alexandria. Most of the urban areas and about half of the rural area in
Alexandria have sewerage systems terminating at a treatment plant. Many rural areas
in Alexandria Governorate have no sewerage networks and rely on �‘on-site�’
sanitation. There are also sewerage projects currently under construction in certain of
the rural areas and some of the non-served urban areas. The total length of the
sewerage systems is about 750 km of various diameters ranging from 200 mm to
2750 mm.
Furthermore, there are two main Waste-water Treatment Plants (WwTP�’s); the
eastern and the western treatment plants respectively. These existing wastewater
treatment plants receive the collected wastewater through 80 off-site pumping
stations and represent more than 95 % of the wastewater treatment capacity in
Alexandria. The existing capacity of the Eastern Wastewater Treatment Plant is
about 610,000 cubic meters per day while the capacity of the Western Wastewater
Treatment Plant is about 470,000 cubic meters per day. There are in addition a
further two treatment plants with smaller capacities which are called, Hanovil
Wastewater Treatment Plant -30,000 cubic meters per day and Mubarak Wastewater
Treatment Plant of 15,000 cubic meters per day. There are also smaller localized
wastewater treatment plants for some rural areas with a total capacity of less than
5,000 cubic meters per day.
Fig.6 below gives the number of population served by water and wastewater facilities
as of 1/1/2007.

P a g e | 16
Alexandria2030
IntegratedUrban
WaterM
anagement(IU
WM)Strategic
Plan
Fig. 6 Served population in Alexandria

P a g e | 17
Alexandria2030
IntegratedUrban
WaterM
anagement(IU
WM)Strategic
Plan Table 2 shows the number of the rural areas in each district of Alexandria and their
corresponding population.
District Main VillageNo ofBelongs
Population
Montazah
Khorsheed ElMohagreen El TabiahEl kobaniah El
Emerawy El Kobra �–Mohsen El Kobra �– ElTawfiqiah �– Hood 10
62 203820
EasternAbis 2 �– Khoseed ElKebliah
10 21650
MiddleAbis 7 �– Abis 8 �– Abis10
26 36334
El AmeriahElmeseery �– Deebah �–Ahmed Oraby �– ElGazaer
41 151403
Borg El ArabBahig �– Abo SeerElghrobaniat
N A* 21805
Total 435012
* N A = Not Available
Table 2 Rural areas and their existing population in Alexandria Governorate
About 50 % of the population of the villages given in table.2 has no sewerage system
and depend entirely on these �‘on-site�’ sanitation or similar systems for the provision
of some degree of treatment before discharging to local agricultural drains...
However, many of these rural areas have projects currently defined for executing
sewerage systems ending with treatment plant.
Generally in rural areas where there is no sewerage network, the raw sewage has on-
site treatment (septic tanks) or is disposed into the nearest agricultural drain or
surface water body. Every household has in effect has to act on its own and provide

P a g e | 18
Alexandria2030
IntegratedUrban
WaterM
anagement(IU
WM)Strategic
Plansome form of sanitation; unsealed latrine pits and cesspools facilities are rarely
adopted. They depend on disposing their sewage using leaching pits situated adjacent
to their houses or on direct discharge of raw sewage to drains using vacuum trucks.
The new projects include for the provision by ASDCO of treatment plants and
sewerage systems to these areas. The new wastewater treatment plants include six
plants in addition to the extension of the Eastern and Western treatment plans. The
new treatment plants projects will add a further capacity of about 500,000 cubic
meters per day to the existing capacities. Table.3 shows the new, planned wastewater
treatment plant projects. Some of these projects have almost been completed and are
undergoing testing and are expected to be in service very soon.
No. Name Capacity m3/day Area Served Remarks1 Hanouvil 2 Plant 30,000 El Dekheelah �– El Max �– Om
Zeghboo Rd. �– Part of ElAgamy
mostly completed
2 El Zawaidah Plant 15,000 Villages of Khoursheed �– Elzawaidah �– El Tawfiqiah �–Shaker
3 El Syouf West Plant 10,000 Villages of El Syouf West �– ElBakatoush �– Galal Ibrahim
4 El Mallahah Plant 10,000 Villages of West El Mallahah�– Masood El Brins �– Serkis �–el Tarouti
5 El Agamy Plant 145,000 Bitash �– El Agamy El AgamyBeach
6 Old El AameriahPlant
50,000 Old El Aameriah �– MerghemAbdel Kader Villages
7 Extension ofEastern Plant
200,000
8 Extension ofWestern Plant 100,000
Table 3 Wastewater treatment plant projects under construction.
There are also several sewerage projects currently under construction in rural areas
and some of the non-served urban areas. After completion of these projects about
80% of the presently un-served rural areas will have sewerage systems for collection
of wastewater and final pumping to appropriate treatments plants before disposal to
the nearby drainage channels.

P a g e | 19
Alexandria2030
IntegratedUrban
WaterM
anagement(IU
WM)Strategic
Plan3. Future threats and uncertainties:
a. Nile Water Availability:
The available Nile Water for Alexandria Governorate reaches it through three main
canals which are:
�• Nobaria canal
�• El Nasr canal
�• El Mahmoudia canal.
These canals supply Nile Water to the Governorate which is required to meet
agricultureal industrial, municipal and also navigation water demands.
A study was performed to check if there were any future plans to increase
Alexandria�’s allocation of Egypt�’s Nile Water through canal expansion programs.
The previously expected findings of this study ensured the need for finding
alternative water resources by 2030. The study showed that there are some limited
canal expansion plans that would only affect their conveyance in terms of restoring
these back their original design discharge. This will not significantly enhance the Nile
Water availability in Alexandria.
b. Climate Change:
According to the Intergovernmental Panel on Climate Change (IPCC) third
assessment report, Alexandria is among the most vulnerable cities to sea level rise
and has a very limited capacity in terms of undertaking any of the three common
strategies which are: adapt, retreat, or defend. A scenario involving a sea level rise
between 0.5 and 1 meter over the current century may lead to an inundation of about
30% of the governorate if no proper action is taken. (IPCC, 2001).
The IPCC fourth assessment report has now pointed out that temperature increases
have been observed in Alexandria from 1979 to 2005; however, the report did not

P a g e | 20
Alexandria2030
IntegratedUrban
WaterM
anagement(IU
WM)Strategic
Planrecord a change in precipitation during the same period due apparently to
insufficiency in data. (IPCC, 2007).
In order to try and throw more light on this phenomenon CEDARE has performed
a detailed climatic analysis using temperature and precipitation data from 1957 to
2009. The results, however, appear to show no particular evidence of a fixed trend as
is illustrated in section 6. b.
c. Population:
The results of the last census for Alexandria population are given in table.4. The
average rate of increase in the whole governorate was 1.36 %. The population
increases in summer is by some 35%.
District PopulationRate ofincrease
Totalarea(feddan)
Buildingarea(feddan*)
Density(Capita/feddan)
Montazah 1,217,535 1.37 19300 8697 116
Eastern 1,003,965 1.26 11600 1697 578
Middle 613,925 0.94 8300 1711 337
Customs 196,402 1.17 642 642 305
Western 514,506 1.54 7100 1849 278
El Ameriah 697,450 2.23 515700 56558 9
Borg El Arab 81,977 2.77 75100 2238 25
Total 4,325,760 637742 73392
*Note Feddan = 4200 m2.
Table 4 the last Census population (2006) and its distribution in Alexandria

P a g e | 21
Alexandria2030
IntegratedUrban
WaterM
anagement(IU
WM)Strategic
Plan As for the future Alexandria population, tables.5 and 6 give the estimated population
given by the Master Plan 2030 carried out for the Alexandria Water Company.
Service Area Estimates of number of inhabitants by year, (in thousands)
2006 2012 2017 2022 2027 2032 2037
Alexandria 5,110 5,608 6,089 6,548 7,073 7,637 8,246
North Coast 338 408 478 560 447 768 899
Beheira 132 154 175 199 226 257 292
Total 5,580 6,170 6,742 7,307 7,746 8,662 9,437
Table 5 Estimated Populations in the Service Area in the Future Years
Table 6 Estimated Populations in the Service Area (Peak Summer Period)
The inhabited area of the Governorate covers an area of about 307 km2, representing
about 11% of the total area of the Governorate itself.. The total population of
Alexandria in 2006 was about 4.11 million people, giving an average population
density of about 11,132 persons/km2. The spatial variations in population density
between different districts are quite evident with the central old section of the city;
the Wassat district having an average of 133,460 persons/km2.
Service Area Estimates of number of inhabitants by year, ( in thousands)
2006 2012 2017 2022 2027 2032 2037
Alexandria 3,885 4,262 4,605 4,973 5,371 5,800 6,264
North Coast 218 263 308 361 423 495 579
Beheira 132 154 175 199 226 257 292
Total 4,235 4,679 5,088 5,533 6,020 6,552 7,135

P a g e | 22
Alexandria2030
IntegratedUrban
WaterM
anagement(IU
WM)Strategic
PlanThe Governorate has been experiencing rapid rates of population increase over the
past three decades. For instance, the total population reached in 2006 was about
4.110 million people compared with 3.339, 2.927 and 2.318 millions in 1996, 1986
and 1976, respectively as shown in fig. 7 below.
Fig. 7 Population of Alexandria from 1976 to 2006
This means an absolute increase of about 1.972 millions, or 77%, over the past three
decades. The spatial distribution of the population was found to be rather uneven
between different the districts of Alexandria, with the inner district, Wassat, reaching
its saturation level. This may reflect the need for a future expansion of the city in to
currently uninhibited areas of Alexandria which maybe much further away from Nile
Waters but possibly closer to groundwater or even seawater resources. Figure 8
shows the future increase in production that AWCO needs to service in the future.
Fig.8 AWCO�’s future required summer production

P a g e | 23
Alexandria2030
IntegratedUrban
WaterM
anagement(IU
WM)Strategic
Plan4. The 2030 Alexandria Water Vision
A vision was developed for water resources management in the City of Alexandria in
the future taking into consideration the City Vision that was formulated previously
by the LA stakeholders. This vision expresses the hopes in achieving a sustainable
urban water supply system by the year 2030. Possible scenarios for the future water
system in Alexandria City have been described. The potential strategies to achieve
the vision for water demand management have been determined.
The vision states:
�‘We envisage a city where available water resources are managed in an integrated manner, with the
participation of all citizens, and are used effectively for development within a framework of
environmental sustainability, where all citizens have access to high quality (according to national
norms), reliable, sustainable, and affordable water and sanitation services and benefit from a clean
and healthy environment.�’
The LA also identified three possible future scenarios for the year 2037 which was
initially intended to be the target year for strategic planning. The scenarios are as
follows:
a. Worst case scenario (pessimistic)
�“In 2037*, Alexandria is a city characterized by continued explosive population growth (summer
population 12 million), a weak and stagnant economy, low availability of Nile water which is 40%
less than in 2007 (due to poor international cooperation and climate change), increased risk of
flooding (due to sea level rise), and poor availability of financial resources�”.
b. Best case scenario (Optimistic)
�“In 2037*, Alexandria is a city whose population has largely stabilized (at million), is benefiting
from a dynamic and fast growing economy, has a guaranteed share of Nile water similar to that of
2007, and where climate change has tended to the most positive of scenarios (with sea level rise
minimum, and increased rainfall). The new vitality of the Egyptian economy means that financial
resources are readily available�”.

P a g e | 24
Alexandria2030
IntegratedUrban
WaterM
anagement(IU
WM)Strategic
Planc. Business as usual (Realistic)
�“In 2037*, Alexandria continues to be city dealing with considerable uncertainty. Population is
10 million, and continues to grow. Share of Nile water is 20% less than in 2007, while economic
growth has been steady but unspectacular. Rising sea levels are starting to threaten some parts of the
city�”.
Note*. The initial LA Visioning Workshop included for the planning horizon of 2037 in order to match the then, current, Alexandria Master Plan.

P a g e | 25
Alexandria2030
IntegratedUrban
WaterM
anagement(IU
WM)Strategic
Plan5. IUWM Strategies to meet Future Water Demand:
a. Groundwater Potential:
One of the clear objectives of the Alexandria Strategic Planning process was to
assess the groundwater potential in the Alexandria Governorate in order to see the
potential for increasing its contribution in the overall water resources policy of the
Governorate.
A well inventory for all production wells in the Alexandria Governorate was carried
out during the period June �– August 2009. The results of this study indicate that the
existing production wells are distributed all across the 9 areas as shown in fig.9.
These are in summary:
Total number of production wells is some 1315 in all.
The normal drilled depth of these wells varies between 6-45 m.
The depth to groundwater ranges between 1.5 -18 m.
The rate of groundwater abstraction for each well varies from 2-60 m3/hour.
Fig. 9 Location of the production wells in Alexandria Governorate.

P a g e | 26
Alexandria2030
IntegratedUrban
WaterM
anagement(IU
WM)Strategic
PlanThe present total quantity of groundwater abstracted in the Alexandria Governorate
is around 31 MCM/year and is mainly used for agriculture. The number of active
production wells and related abstraction points were distributed among the existing
aquifers as presented in table.7 below.
No. Aquifer No. of Wells Present Extraction m3/year
1 Coastal Aquifer 373 1,573,590
2 Nile Delta Aquifer 190 2,702,830
3 Ralat aquifer 752 26,808,830
Total 1315 31,085,250
Table.7 Groundwater Abstraction (m3/year).
It was, therefore, concluded that ground water could contribute some additional 33
MCM annually to the overall Water Resources Budget for Alexandria.
b. StormWater Potential:
There are six rainfall stations in Alexandria.
Rainfall data for Nozha Station for the period from 1957 to 2009 were obtained. The
data covers series for daily, monthly and annual rainfall.
The analysis of annual rainfall for Nozha station reveals that the average annual
value for the available data is 169 mm. Fig.10 below shows a plot of the annual
rainfall for the available data from 1957 till 2009. Another weather station at
Alexandria Port shows that the average annual rainfall for the period from 1868 and
1973 is 197.4 mm.

P a g e | 27
Alexandria2030
IntegratedUrban
WaterM
anagement(IU
WM)Strategic
Plan
Fig. 10 Annual Rainfall for Alexandria - from 1957 �– 2009.
To examine the potential for rainfall to positively contribute towards the Alexandria
Water Resources Budget, these daily rainfall series were studied. The average
monthly rainfall for the �‘rainy months�’ was, therefore, considered and months which
gave similar average monthly rainfalls were been identified.
It became clear that rainfall in Alexandria is very limited and its potential, therefore, to
provide such a positive contribution to the overall water budget is low and not
promising in order to promote the use of cost effective, sophisticated Best
Management Practices (BMP�’s); such as rainwater harvesting, porous pavements and
infiltration devices. However, it may never the less be useful to apply some simple
BMPs which could help to alleviate the sometime heavy, short duration winter rains
that can lead sometimes to localized urban flooding. These would need to be
identified in a separate initiative.

P a g e | 28
Alexandria2030
IntegratedUrban
WaterM
anagement(IU
WM)Strategic
Planc. Water Demand Management Potential:
The main purpose of the various Demand Management options was considered by
the DM Study Team according to the different future scenarios above. These
options were considered in terms of potential amounts of water saved and the
relevant cost savings derived.
Three important strategic options that are likely to make significant contributions to
the amount of water that could become available by 2030* were suggested.
The first strategic option involved minimizing physical and commercial losses from
pipe distribution network; it was demonstrated that some 20 MCM could be made
available annually by applying this strategic option.
The second strategic option was to look at increasing the drinking water tariff,
gradually in a manner that could save potentially 60 MCM annually commencing from
2030; this amount equatess to the value of monetary savings resulting from an average
tariff increase of 5%.
The third strategic option focused on maximizing household water use and
promoting water efficiency and it was estimated to potentially result in savings of
some 44 MCM annually.
Note*: The new Alexandria Master Plan Horizon.
d. Waste Water Reuse Potential:
At present the wastewater treatment plants provide only Primary treatment and
treated water is conveyed to Lake Maryut form where it is pumped for final disposal
to the Mediterranean Sea.
Strategic options for wastewater management and reuse in Alexandria were
formulated with the objective of achieving Sustainable Integrated Urban Water
Management system in Alexandria by the year 2030. These strategic options took into
account a number of different scenarios, in terms of population growth, wastewater
flows, wastewater composition, expansion of the sewer system, demand for treated
effluent in industry, urban landscaping and agricultural uses, climate change, salt water

P a g e | 29
Alexandria2030
IntegratedUrban
WaterM
anagement(IU
WM)Strategic
Planintrusion/sea level changes, regulations and effluent standards to be achieved. It
was shown that if treated wastewater was used to satisfy the above demands it could
potentially contribute about 900 MCM yearly to the overall water budget for the
Governorate and in particular for use in agriculture in order to supplement the
irrigation water currently provided far as part of the Nile water allocation. Fig.11
shows the two most favored** options in reusing treated wastewater in agriculture,
which are the proposed Hammam agricultural site and the so-called ASDCO
irrigation site.
Note ** these sites being selected by discussion with the Ministry for Water Resources and Irrigation, ASDCO
and the Master Planning Department

P a g e | 30
Alexandria2030
IntegratedUrban
WaterM
anagement(IU
WM)Strategic
Plan
East WWTP
West WWTP
Fig 11 a - Options for using treated wastewater in Agriculture at Hammama.
Fig.11
Fig 11 b - Options for using treated wastewater in Agriculture (ASDCO)

P a g e | 31
Alexandria2030
IntegratedUrban
WaterM
anagement(IU
WM)Strategic
Plane. Agricultural Drainage Reuse Potential
In this strategic option (Fig. 12), brackish, agricultural drainage water would be
extracted from the major agricultural drains and be treated in an appropriately
designed desalination plant so that it is suitable for use in industrial facilities and as a
non-potable supply source for use in coastal resorts as well as potentially in
agriculture. The concept for this option is illustrated in Fig.12 below where the red
dot marks the proposed potential location of a desalination plant and the red lines
represent the routes of major trunk mains for the supply network.
For this option, it has been assumed that the treated water would be delivered in a
separate network and used essentially as a non-potable supply source. However, the
resulting water is likely to be of a very high quality following pre-treatment and
desalination, so it is possible that this water could be added to the existing water
supplies (Nile Water) in the Noubariya canal. However this particular potential sub-
option would need to be examined and determined by the Water Resources and
Irrigation Authorities. The �‘brine�’ and any back-wash water resulting from this
treatment process would require careful consideration as to the selected method of
its disposal.
In this study it has been assumed that a separate pipeline would be used to discharge
the brine into the sea, however, the impacts of this would need to be studied more
carefully to ensure there will be no adverse impacts on the local coastal environment
as a result (White, et al, 2011).

P a g e | 32
Alexandria2030
IntegratedUrban
WaterM
anagement(IU
WM)Strategic
Plan
Fig.12 Agricultural Drainage Reuse Option (White, et al, 2011)
f. Sea Water Desalination Potential:
Desalination plants operate in approximately 125 countries, with seawater
desalination plants contributing 59 percent of the total worldwide desalination
capacity. For Alexandria, it has been concluded that seawater desalination, as a
conventional water resource would most probably only be considered as a measure
aimed at essential water security. The future use of such resource technology in the
Governorate for other more common demands will largely depend on the rate of
improvement in the technologies used for desalination and the costs associated with
these processes, such as energy and membranes, etc. (White. et al, 2011). At present
there it is understood that there are no planned, large scale, desalination plants in
Alexandria.
A critical issue in water desalination is the high energy demand and, more
specifically, electricity for Reverse Osmosis (RO) desalination units. However, it has
nevertheless been shown that RO is the preferred desalination process (with the
lowest overall energy requirement) and therefore, it was anticipated that significant
efforts would be taken to further develop what is currently quite widely available and

P a g e | 33
Alexandria2030
IntegratedUrban
WaterM
anagement(IU
WM)Strategic
Planenvironmentally compatible energy sources for the purposes of water desalination
facilities in the Governorate.
It has also been demonstrated that if sufficient funds were made available, the
maximum amount of desalinated water could potentially reach up to some 777 MCM
annually starting from 2030, and this is estimated based on the needs of some
particular coastal areas where future development and expansions are anticipated.
This would also have the potential effect of reducing the demand on the current
AWCO supply system to governorates lying to the west of the city. The most
suitable locations considered in this study for such desalinated water would be used
have also been determined. Moreover, a desalinated water system that could produce
up to 2.13 MCM of desalinated water daily has been proposed, with between 5 �– 6
1020 MCM/annum facilities of would be required to produce the above mentioned
daily amount. Fig. 13, below shows the location of such a potential desalination
plant.
Fig.13 Location of a potential desalination plant (White et.al, 2011)

P a g e | 34
Alexandria2030
IntegratedUrban
WaterM
anagement(IU
WM)Strategic
Plan
g. Urban water reuse:
One of the most important objectives of Strategic Planning Study was promoting the
concept of planned urban water management through computer based modeling
which would allow a common practice collaborative platform between the planners
and the water companies now and in the future in Alexandria.
Hence, some strategic options were assessed using the computer based
�“AQUACYCLE�” modeling software.
Although merely being able to establish a basic numerical urban water model to the
different districts of Alexandria would have been a great success in itself, the
application of the model to the assessment of three strategic alternatives re-use,
those of �‘grey�’ water, roof run-of water and road surface water run-off reuse, the
model has showed that these options, or combinations of them, could potentially
introduce some 23, 14 or 25 MCM annually to the overall Alexandria water budget
respectively.

P a g e | 35
Alexandria2030
IntegratedUrban
WaterM
anagement(IU
WM)Strategic
Planh. Analysis of strategic options:
The next step in the process was to investigate all strategic options collectively and to
test which of them appear to lend themselves to being combined into Integrated
Strategic Options and to explore the practicality and feasibility of providing the
theoretical additional amounts of water resources indicated for every strategic option.
It is worth mentioning that currently all of Alexandria�’s water is produced through the
Alexandria Water Company�’s treatment facilities which means in effect that all sectors
(Industrial, irrigation, domestic, etc.) receive the same quality of water, which is the
quality required for potable consumption. This is certainly something that needs to be
addressed in the future where the provision of variable qualities of water may be more
appropriate.
It should be recognized that the different potential saving/additional amounts that
were estimated for every strategic option cannot be necessarily added altogether to
produce an overall potential resource as some of the options are mutually exclusive.
However it is reasonable to assume that the amount of available water to the city of
Alexandria in 2030 could exceed the actual extrapolated demand needs if the
strategies suggested in this study are substantially adopted. This basically means that
the current Nile Water resources combined with the �‘additional potential resources�’
identified in this study could be sufficient to satisfy the projected demand at the 2030
planning horizon.
The storm water management options were examined by the urban water modeling
package AQUACYCLE have in effect been eliminated from further assessment due
to the low potential and high costs of recovering rainwater from utilizing these
options. Similarly with grey-water reuse, the likely costs of widespread retrofitting
grey-water collection, treatment and distribution would be very high relative to the
low cost of raw (Nile) water in the country. Whereas it was accepted that in certain
new developments introduction of grey-water recycling (for landscape irrigation, etc.)
that more expansive systems would not be cost effective or manageable in the normal
urban context.

P a g e | 36
Alexandria2030
IntegratedUrban
WaterM
anagement(IU
WM)Strategic
PlanGroundwater promises to be a main option for Alexandria in the future given the fact
that such water resources relatively close to the potential demands.
Desalination is yet another promising future resource for Alexandria, given its
location adjacent to the Mediterranean Sea and Lake Maryut although it was
considered that based upon costs then desalination would provide specific localized
demand options such as industry and tourism.
The Water Demand Management options are all currently within the planning process
of AWCO and the first option of minimizing physical and commercial losses has
been included in accordance with an actual plan made by the AWCO to implement
DMA�’s throughout their networks over the next ten years starting from 2011, which
aims towards saving some 198 MCM in 10 years.
Other Water Demand Management options that were proposed in a joint research
effort between CEDARE and The Institute of Sustainable Futures at the Technical
University of Sydney (ISF-UTS) are considered in the overall assessment later in this
report owing to their high level of feasibility and practicality of application within the
Alexandrian context.
Arguably the strategic options that provide the next level of �‘fit�’ are those that involve
the use of treated wastewater in agriculture and in particular to the locations identified
in and highlighted in Table 9, which are referred to as Hammam Extension and the
ASDCO Site as show in Fig.11a & b respectively.
It should be noted that the two major wastewater treatment plants are also shown in
the same figures (referred to as East TP and West TP) and that both of these options
for re-use of final effluent vulnerable as the current laws stand in Egypt. Law 48-
1982 specifically forbids the discharge of treated waste water into irrigation canals and
hence, regardless of the technical feasibility of both options, the actual
implementation of these would require some very fundamental changes in the current
institutional arrangement in Alexandria and indeed to Egypt.
When examining the Agricultural Drainage Water reuse option is also considered to
be a very important and available strategic option as the amount entering Alexandria

P a g e | 37
Alexandria2030
IntegratedUrban
WaterM
anagement(IU
WM)Strategic
Planreaches some 7.5 MCM daily and studies are currently in progress to assess the
possible future reliability of that particular resource and the costs and efficiency of
treatment methods associated with this.
In order to commence the process of an overall or combined options assessment, Fig.
14 shows an overall layout of Alexandria that reflects the current situation with
respect to the total potential water budgets and current demands. The current total
annual demand is 3,492 MCM and it is recognized that a significant proportion of this
amount is not used effectively, especially for example in agricultural drainage water as
well as the large amounts of irrigation water lost at both the national and farm levels.
It can be seen from Fig 8 that the estimated Water Demand in 2030 is 3.671 MCM
daily, which corresponds to 1,339 MCM annually and this has been set as the target
amount required in order to satisfy the overall expected demand using the previously
discussed strategic options or combinations of these.
Similarly, it can be seen from Table. 6, that the estimated population of the
Governorate at 2030 horizon is expected to be some 6.28 Million. Table 8 shows that
the recorded demand in 2010, when compared to the projected demand of the year
2030, under the exact same general constraints as in 2010 (i.e. known as the �‘business
as usual�’ model) would give an annual demand of some 1,322 MCM.

P a g e | 38
Alexandria2030
IntegratedUrban
WaterM
anagement(IU
WM)Strategic
Plan
947343750606300000
4670000Volume
% L/C/D % L/C/D m.m3/year`
Domestic 61.16 218 61.16 218 589Industrial 11.2 40 11.2 40 108Commercial 11.71 42 11.71 42 113Investment 6.51 23 6.51 23 63Govermental 6.73 24 6.73 24 65Harbour 0.03 0 0.03 0.1 0Discounted Units 0.86 3 0.86 3 8.4Exported (Behira) 1.8 6 1.8 6 17Sum W/O losses 100 356 100 356 963UFW , % 36 36UFW 200 200.08 542
Sum ALL INCL UFW 556 556 1322
2030
Total Water Sold 963Population 6285000
CategoryConsumption Consumption
CURRENT SITUATIONYear 2010 Buisness As Usual
Total Water Produced 1505
Table 8 Current and future water demand
Fig. 14 Alexandria Overall Water Budget

P a g e | 39
Alexandria2030
IntegratedUrban
WaterM
anagement(IU
WM)Strategic
Plan
6. Meeting Multiple Objectives & Strategy Ranking
The institute of Sustainable Futures at the Technical University of Sydney (ISF-UTS)
and CEDARE have modeled different supply and demand options reflecting all of
the above Strategic Options. The results from this modeling exercise gives the
relevant water savings and associated costs of each option and these are shown in
Table. 9.
The Demand Management options tended to be the most cost-effective with options
DM7 and DM8 standing out for their cost-effectiveness and high potential in terms
of water savings. Unsurprisingly seawater desalination was found to be the least cost-
effective of the 16 options modeled as at US$ 1.15 /m3 it almost double the second
most expensive option, which was agricultural drainage desalination at US$ 0.63 /m3.
Figure 15 shows the contribution of each of these strategic options towards fulfilling
the 2030 Water Demand whilst Figure 16 shows the final ranking of all strategic
options considered in a way that reflects the suggested order of strategic
implementation. Total water savings of some 603 MCM/year are therefore projected
for 2030.

P a g e | 40
Alexandria2030
IntegratedUrban
WaterM
anagement(IU
WM)Strategic
Plan
Table 9 �– Water Savings and Associated Costs.

P a g e | 41
Alexandria2030
IntegratedUrban
WaterM
anagement(IU
WM)Strategic
Plan
Fig 15: Projected Water Demand in Alexandria to 2030
Fig 16 Supply curve for all Strategic Options considered

P a g e | 42
Alexandria2030
IntegratedUrban
WaterM
anagement(IU
WM)Strategic
PlanOn the assumption that the uptake of both Sea Water Desalination and Agricultural
Drainage treatment and reuse will increase in the near future and the regulatory
problems associated with the reuse of waste water will be resolved, some 603
MCM/annum of raw water could potentially be saved. This would significantly relieve
the pressure on the demand for Nile Water, which is currently between 900-1400
MCM annually.
With this level of potential raw water saving at the 2030 planning horizon then with
from non-surface water options, theoretically only 736 MCM would in fact need to be
allocated from the Nile River to Alexandria, which if implemented would be an
outstanding success for the Governorate.
Table 9, below shows the potential final water allocations and the total associated
costs for each of the options selected for Alexandria in 2030. It is clear that the total
anticipated annual cost needed to implement all these options in the table amounts to
around some 200 Million US$ at current rates, which is probably unaffordable at this
point in time. However, this amount, although large is probably much more
affordable when compared to the likely cost of, for example, providing the same
volume of �‘new water�’ (603 MCM) by desalination only when the equivalent cost
would be in the region of some 700 Million US$.
It is also worth noting that this Strategic Plan, if appropriately adopted and
implemented, would contribute greatly to the national effort to reduce Egypt�’s
reliance on Nile Water and to adopt sustainable water management practices which
will also benefit other cities/ governorates by acting as an exemplar of good
management practice.
The potential amounts of water that could be saved from the Nile Water allocation
ranges from 164 to 664 MCM, depending upon which option or combination of
options are adopted, could be also be redirected to other inland governorates with no
desalination potential and lying outside any significant ground water zones.

P a g e | 43
Alexandria2030
IntegratedUrban
WaterM
anagement(IU
WM)Strategic
Plan
Table 9 Water Volumes and Costs for 2030

P a g e | 44
Alexandria2030
IntegratedUrban
WaterM
anagement(IU
WM)Strategic
Plan7. Sustainable IUWM Indicators:
It has been proposed that different indicators will be used in order to assess the
relative strengths and weaknesses of each Strategic Option considered.
The purpose of this assessment is to provide indicative numerical values for use by
the specific governmental entities that would be expected to implement this plan.
All of the options would be evaluated on a scale of 1 to 5, where a negative sign will
indicate either a negative effect or expenditure where appropriate. Hence for
example zero would indicate a neutral effect of an option with respect to a particular
indicator. In this particular instance these indicator scores have been assembled by
one sustainability expert in the team whereas it is expected that in practice the
implementing authorities would take the views of a much larger body of key experts
in order to best establish appropriate indicators based on the situation �‘on the
ground�’ at the time. This could be achieved by using a participatory workshop or
other similar exercise in the future.
a. Economic Indicators:
I. GDP and economic return:
Strategy ImpactIncrease in tariff (5% per year for 5 years) 2Minimization of physical and commercial losses from distribution network 2Improving household water use efficiency ( a reduction of 25% realized over a 5 year period) 2Reuse of treated wastewater in urban green areas 0Agricultural reuse of treated wastewater at ASDCO site (new agriculture) 2Reuse of treated wastewater in green areas along highways and in the cities green belt 0Grey Water Reuse for irrigation 1Agricultural reuse of treated wastewater at Hamam site (new agriculture) 3Irrigation of urban green areas with groundwater 2Artificial recharge 3Brackish water desalination 2Sea water desalination 1Rainwater harvesting for irrigation of urban green 2Agricultural reuse of treated wastewater within the governorate (existing agriculture, SWAP) 3Agricultural Drainage Reuse 3

P a g e | 45
Alexandria2030
IntegratedUrban
WaterM
anagement(IU
WM)Strategic
Plan
The above table shows that some options have a relatively high economic return
especially those that involve re-use of either treated waste water or agricultural
drainage water.
II. Cost per unit volume:
Strategy ImpactIncrease in tariff (5% per year for 5 years) 5Minimization of physical and commercial losses from distribution network 1Improving household water use efficiency ( a reduction of 25% realized over a 5 year period) 1Reuse of treated wastewater in urban green areas 2Agricultural reuse of treated wastewater at ASDCO site (new agriculture) 2Reuse of treated wastewater in green areas along highways and in the cities green belt 2Grey Water Reuse for irrigation 2Agricultural reuse of treated wastewater at Hamam site (new agriculture) 4Irrigation of urban green areas with groundwater 3Artificial recharge 4Brackish water desalination 3Sea water desalination 4Rainwater harvesting for irrigation of urban green 3Agricultural reuse of treated wastewater within the governorate (existing agriculture, SWAP) 2Agricultural Drainage Reuse 4
From the table above, it is shown that the �“Increase in tariff�” strategy has the
lowest cost per unit volume as it will not trigger any significant capital investments.

P a g e | 46
Alexandria2030
IntegratedUrban
WaterM
anagement(IU
WM)Strategic
Plan
b. Social Inclusion Indicators:
I. Affordability:
Strategy ImpactIncrease in tariff (5% per year for 5 years) 1Minimization of physical and commercial losses from distribution network 1Improving household water use efficiency ( a reduction of 25% realized over a 5 year period) 1Reuse of treated wastewater in urban green areas 1Agricultural reuse of treated wastewater at ASDCO site (new agriculture) 1Reuse of treated wastewater in green areas along highways and in the cities green belt 1Grey Water Reuse for irrigation 1Agricultural reuse of treated wastewater at Hamam site (new agriculture) 1Irrigation of urban green areas with groundwater 1Artificial recharge 0Brackish water desalination 1Sea water desalination 1Rainwater harvesting for irrigation of urban green 1Agricultural reuse of treated wastewater within the governorate (existing agriculture, SWAP) 1Agricultural Drainage Reuse 1
II. Meeting MDGs for water
Strategy ImpactIncrease in tariff (5% per year for 5 years) 4Minimization of physical and commercial losses from distribution network 4Improving household water use efficiency ( a reduction of 25% realized over a 5 year period) 4Reuse of treated wastewater in urban green areas 1Agricultural reuse of treated wastewater at ASDCO site (new agriculture) 1Reuse of treated wastewater in green areas along highways and in the cities green belt 1Grey Water Reuse for irrigation 1Agricultural reuse of treated wastewater at Hamam site (new agriculture) 1Irrigation of urban green areas with groundwater 1Artificial recharge 1Brackish water desalination 1Sea water desalination 1Rainwater harvesting for irrigation of urban green 1Agricultural reuse of treated wastewater within the governorate (existing agriculture, SWAP) 1Agricultural Drainage Reuse 1

P a g e | 47
Alexandria2030
IntegratedUrban
WaterM
anagement(IU
WM)Strategic
Plan
c. Environmental Indicators:
I. Water Quality of Lake Mariout
Strategy ImpactIncrease in tariff (5% per year for 5 years) 0Minimization of physical and commercial losses from distribution network 0Improving household water use efficiency ( a reduction of 25% realized over a 5 year period) 0Reuse of treated wastewater in urban green areas 1Agricultural reuse of treated wastewater at ASDCO site (new agriculture) 2Reuse of treated wastewater in green areas along highways and in the cities green belt 2Grey Water Reuse for irrigation 2Agricultural reuse of treated wastewater at Hamam site (new agriculture) 3Irrigation of urban green areas with groundwater 0Artificial recharge 0Brackish water desalination 0Sea water desalination 0Rainwater harvesting for irrigation of urban green 0Agricultural reuse of treated wastewater within the governorate (existing agriculture, SWAP) 0Agricultural Drainage Reuse 0
II. CO2 Emissions:
Strategy ImpactIncrease in tariff (5% per year for 5 years) 0Minimization of physical and commercial losses from distribution network 0Improving household water use efficiency ( a reduction of 25% realized over a 5 year period) 0Reuse of treated wastewater in urban green areas 1Agricultural reuse of treated wastewater at ASDCO site (new agriculture) 1Reuse of treated wastewater in green areas along highways and in the cities green belt 1Grey Water Reuse for irrigation 1Agricultural reuse of treated wastewater at Hamam site (new agriculture) 1Irrigation of urban green areas with groundwater 1Artificial recharge 2Brackish water desalination 2Sea water desalination 2Rainwater harvesting for irrigation of urban green 1

P a g e | 48
Alexandria2030
IntegratedUrban
WaterM
anagement(IU
WM)Strategic
PlanAgricultural reuse of treated wastewater within the governorate (existing agriculture, SWAP) 1Agricultural Drainage Reuse 1
d. Technical Indicators:
I. Volumes produced/saved:
Strategy ImpactIncrease in tariff (5% per year for 5 years) 2Minimization of physical and commercial losses from distribution network 2Improving household water use efficiency ( a reduction of 25% realized over a 5 year period) 2Reuse of treated wastewater in urban green areas 1Agricultural reuse of treated wastewater at ASDCO site (new agriculture) 3Reuse of treated wastewater in green areas along highways and in the cities green belt 1Grey Water Reuse for irrigation 1Agricultural reuse of treated wastewater at Hamam site (new agriculture) 3Irrigation of urban green areas with groundwater 1Artificial recharge 1Brackish water desalination 2Sea water desalination 5Rainwater harvesting for irrigation of urban green 1Agricultural reuse of treated wastewater within the governorate (existing agriculture, SWAP) 3Agricultural Drainage Reuse 4
The values assigned to the options in the table above are linked to the potential
amounts discussed earlier in this report. The only negative sign in the above table is
assigned to the artificial recharge option as the water recharged will not be
completely recovered.
II. Narrowing the gap in household per capita consumption:
Strategy ImpactIncrease in tariff (5% per year for 5 years) 5Minimization of physical and commercial losses from distribution network 1Improving household water use efficiency ( a reduction of 25% realized over a 5 year period) 4Reuse of treated wastewater in urban green areas 0Agricultural reuse of treated wastewater at ASDCO site (new agriculture) 0Reuse of treated wastewater in green areas along highways and in the cities green belt 0Grey Water Reuse for irrigation 0

P a g e | 49
Alexandria2030
IntegratedUrban
WaterM
anagement(IU
WM)Strategic
PlanAgricultural reuse of treated wastewater at Hamam site (new agriculture) 0Irrigation of urban green areas with groundwater 0Artificial recharge 0Brackish water desalination 0Sea water desalination 0Rainwater harvesting for irrigation of urban green 0Agricultural reuse of treated wastewater within the governorate (existing agriculture, SWAP) 0Agricultural Drainage Reuse 0
III. Recycle factor :
The �“Recycle factor�” is defined here as �“the ratio of the amount of water abstracted
from a source to the amount of recovery for re-use�”.
Strategy ImpactIncrease in tariff (5% per year for 5 years) 0Minimization of physical and commercial losses from distribution network 0Improving household water use efficiency ( a reduction of 25% realized over a 5 year period) 0Reuse of treated wastewater in urban green areas 3Agricultural reuse of treated wastewater at ASDCO site (new agriculture) 3Reuse of treated wastewater in green areas along highways and in the cities green belt 3Grey Water Reuse for irrigation 3Agricultural reuse of treated wastewater at Hamam site (new agriculture) 3Irrigation of urban green areas with groundwater 4Artificial recharge 1Brackish water desalination 3Sea water desalination 4Rainwater harvesting for irrigation of urban green 4Agricultural reuse of treated wastewater within the governorate (existing agriculture, SWAP) 3Agricultural Drainage Reuse 4
IV. Non-revenue Water:
Non Revenue WaterStrategy ImpactIncrease in tariff (5% per year for 5 years) 0Minimization of physical and commercial losses from distribution network 5Improving household water use efficiency ( a reduction of 25% realized over a 5 year period) 5Reuse of treated wastewater in urban green areas 0Agricultural reuse of treated wastewater at ASDCO site (new agriculture) 0
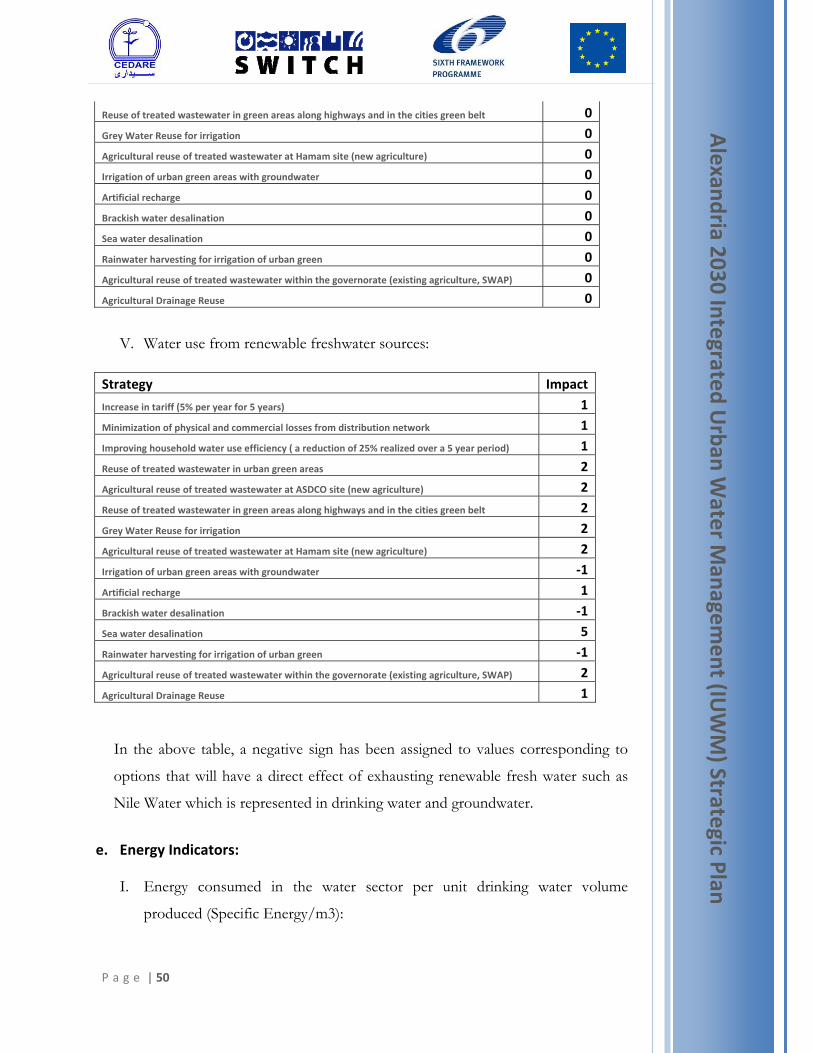
P a g e | 50
Alexandria2030
IntegratedUrban
WaterM
anagement(IU
WM)Strategic
PlanReuse of treated wastewater in green areas along highways and in the cities green belt 0Grey Water Reuse for irrigation 0Agricultural reuse of treated wastewater at Hamam site (new agriculture) 0Irrigation of urban green areas with groundwater 0Artificial recharge 0Brackish water desalination 0Sea water desalination 0Rainwater harvesting for irrigation of urban green 0Agricultural reuse of treated wastewater within the governorate (existing agriculture, SWAP) 0Agricultural Drainage Reuse 0
V. Water use from renewable freshwater sources:
Strategy ImpactIncrease in tariff (5% per year for 5 years) 1Minimization of physical and commercial losses from distribution network 1Improving household water use efficiency ( a reduction of 25% realized over a 5 year period) 1Reuse of treated wastewater in urban green areas 2Agricultural reuse of treated wastewater at ASDCO site (new agriculture) 2Reuse of treated wastewater in green areas along highways and in the cities green belt 2Grey Water Reuse for irrigation 2Agricultural reuse of treated wastewater at Hamam site (new agriculture) 2Irrigation of urban green areas with groundwater 1Artificial recharge 1Brackish water desalination 1Sea water desalination 5Rainwater harvesting for irrigation of urban green 1Agricultural reuse of treated wastewater within the governorate (existing agriculture, SWAP) 2Agricultural Drainage Reuse 1
In the above table, a negative sign has been assigned to values corresponding to
options that will have a direct effect of exhausting renewable fresh water such as
Nile Water which is represented in drinking water and groundwater.
e. Energy Indicators:
I. Energy consumed in the water sector per unit drinking water volume
produced (Specific Energy/m3):

P a g e | 51
Alexandria2030
IntegratedUrban
WaterM
anagement(IU
WM)Strategic
PlanStrategy ImpactIncrease in tariff (5% per year for 5 years) 0Minimization of physical and commercial losses from distribution network 0Improving household water use efficiency ( a reduction of 25% realized over a 5 year period) 0Reuse of treated wastewater in urban green areas 1Agricultural reuse of treated wastewater at ASDCO site (new agriculture) 1Reuse of treated wastewater in green areas along highways and in the cities green belt 1Grey Water Reuse for irrigation 1Agricultural reuse of treated wastewater at Hamam site (new agriculture) 1Irrigation of urban green areas with groundwater 1Artificial recharge 2Brackish water desalination 2Sea water desalination 4Rainwater harvesting for irrigation of urban green 1Agricultural reuse of treated wastewater within the governorate (existing agriculture, SWAP) 1Agricultural Drainage Reuse 2
f. The Integration Indicator:
This indicator reflects the potential of each option in its ability to integrate with
other options and indicator values assigned to all options will have either a positive
sign, which reflects the degree of integration foreseen for each particular strategy, or
zero, which indicates that integration is likely to be less feasible.
Strategy ImpactIncrease in tariff (5% per year for 5 years) 1Minimization of physical and commercial losses from distribution network 1Improving household water use efficiency ( a reduction of 25% realized over a 5 year period) 1Reuse of treated wastewater in urban green areas 2Agricultural reuse of treated wastewater at ASDCO site (new agriculture) 2Reuse of treated wastewater in green areas along highways and in the cities green belt 2Grey Water Reuse for irrigation 1Agricultural reuse of treated wastewater at Hamam site (new agriculture) 1Irrigation of urban green areas with groundwater 1Artificial recharge 1Brackish water desalination 1Sea water desalination 2Rainwater harvesting for irrigation of urban green 1Agricultural reuse of treated wastewater within the governorate (existing agriculture, SWAP) 2

P a g e | 52
Alexandria2030
IntegratedUrban
WaterM
anagement(IU
WM)Strategic
PlanAgricultural Drainage Reuse 2
g. Overall scoring:
Table 10 shows the average value that each strategic option scored with respect to the individual indicators identified.
Strategy AverageIncrease in tariff (5% per year for 5 years) 1.461538Improving household water use efficiency ( a reduction of 25% realized over a 5 yearperiod) 1.461538Minimization of physical and commercial losses from distribution network 1.076923Agricultural reuse of treated wastewater at ASDCO site (new agriculture) 0.923077Agricultural reuse of treated wastewater at Hamam site (new agriculture) 0.846154Agricultural reuse of treated wastewater within the governorate (existing agriculture,SWAP) 0.692308Reuse of treated wastewater in green areas along highways and in the cities green belt 0.615385Reuse of treated wastewater in urban green areas 0.538462Sea water desalination 0.538462Agricultural Drainage Reuse 0.538462Grey Water Reuse for irrigation 0.461538Irrigation of urban green areas with groundwater 0Rainwater harvesting for irrigation of urban green 0.15385Brackish water desalination 0.30769Artificial recharge 0.76923
Table.10 Average scores with respect to all indicators
These are shown in descending order and therefore the most appropriate strategic options
are the ones that yield the higher average scores.

P a g e | 53
Alexandria2030
IntegratedUrban
WaterM
anagement(IU
WM)Strategic
Plan
8. Institutional Mapping:
a. Current Institutional map:
The Governorate of Alexandria is the leading executive and administrative body of
Alexandria.
The Ministry of Housing is responsible for all water supply and sanitation services
in Alexandria.
The Holding Company for Waste Water, which lies under the Ministry of Housing,
is the National Organization for Potable Water & Sanitary Drainage which covers
water supply and sanitation to all the governorates in Egypt. It is the umbrella under
which all local governorate drinking water and sanitation companies carry out their
operations.
b. Ability to achieve proposed Strategies:
Although, the current institutional structure shares a reasonable degree of fit with
that envisaged as part of this current Strategic IUWM plan, more flexibility in the
legislation process would doubtlessly help towards making more of the potential
strategic options feasible, particularly those related to the re-use of treated waste
water in irrigation for example.
c. Suggested Institutional Arrangement:
Whilst it is well recognized that the existing institutional arrangement is well organized,
there are a number of refinements to this that would greatly benefit the transition to a best
practice, sustainable management structure. The fact, for example that ASDCO currently
receives its revenues through AWCO could restrict ASDCO�’s decision making process
compared to those of AWCO�’s. ASDCO could potentially benefit from greater future
financial independency which would assist them to be in a position to fund more
wastewater treatment plants in a manner that could enhance the potential to re-use by
distributing treated waste water to agriculture to supplement Nile Water currently used in

P a g e | 54
Alexandria2030
IntegratedUrban
WaterM
anagement(IU
WM)Strategic
Planirrigation, as discussed in this report and hence provide a further level of income either by
direct or indirect payment for this service.
An additional process that is seen to have a potentially significantly boost the
implementation of this Strategic Plan is the establishment of a Governorate level Inter-
ministerial Committee to act as a link between national and local decision makers. This
approach has proved successful in four other Egyptian governorates including the
neighboring Behira Governorate.
One other process that could potentially benefit the implementation of this plan, is to in
some form maintain the current success achieved by the LA by establishing an Advisory
Committee or Group from former LA members as this would be considered an important
catalyst in achieving a Sustainable Integrated Water Management process in the
Governorate.

P a g e | 55
Alexandria2030
IntegratedUrban
WaterM
anagement(IU
WM)Strategic
Plan9. Implementation Plan:
a. Timeline for Implementation:
Table 11 shows the proposed timeline for implementation of the Strategic Plan.
Table.11. proposed timeline for implementation
b. Constraints & Risk Assessment:
One of the most significant strengths of this Strategic Plan is thought to be the fact that it
has been researched under the close supervision of all of the decision makers (Key
Stakeholders) in the Alexandria Water Sector who were part of the SWITCH
Learning Alliance; therefore any significant institutional changes could affect the
activities that this plan suggests. However, it is considered that the strategic options
and the validity of the research will prove to be a starting point for any new
Action 2011 2013 2015 2017 2019 2021 2023 2025 2027 2029 2030Launching andpromoting plan
x
Advisory Group(LA) Evolution
x x
Establishmentof agovernoratelevel Interministerialcommittee
x x x x x x
Resolving legalproblemsrelated to usingtreated wastewater inirrigation
x x x x x x
Increasing tariff x x x x xReducingphysical lossesand increasinghouseholdefficiency
x x x x x x
Expansion inAgriculturaldrainage reuse
x
Expansion insea waterdesalination
x

P a g e | 56
Alexandria2030
IntegratedUrban
WaterM
anagement(IU
WM)Strategic
Plangovernment structures that may evolve and an early start would undoubtedly prove to
be useful in getting the key decision makers committed to the activities proposed by
this study
c. M&E Plan and key factors:
It is proposed that the M&E plan will focus on particular criteria which are
envisaged to be among the principle benefits derived by adopting the strategic
options selected for this plan. These criteria are:
I. Economic Criteria:
1. Full Cost Recovery.
2. Better Water Supply-Wastewater Budget balance; as currently the
Waste Water Company only receives a portion of the gross income
made by the Water Company.
II. Social Inclusion Criteria:
1. Security of service; especially to new communities and informal
settlements.
2. Governance:
a. Information made availability for Local Communities
b. Shared Data Systems between AWCO and ASDCO
c. Measuring Governance using internal metrics according to
�“Best Management Practice Benchmarking �– Egypt�”
d. Measuring Governance using external metrics according to
�“Best Management Practice Benchmarking - Mediterranean
Region (Or better still this could be against the Water and
Sanitation International Benchmarking Network (IBNET)
sponsored by the World Bank (WB))
e. Promoting Consultative and Participatory approaches to water
related problem solving.
III. Environmental Criteria:

P a g e | 57
Alexandria2030
IntegratedUrban
WaterM
anagement(IU
WM)Strategic
Plan1. Environmental Impact: the quality of water in Lake Maryut will be
assessed as the progress in waste water treatment continues, also
carbon emissions resulting from every strategic option will be
calculated.
IV. Technical Criteria:
1. System-wide improvements
a. Leakage reduction
b. Infiltration; which relates to the overall water quality of
treated effluent and particularly saline water infiltration.
c. Recovery rate: This is the rate of sewage collected from the
total amount of water put into supply.
V. Energy Criteria:
1. Specific Energy Consumed: one of the aims of the monitoring plan
will be tracking the energy consumption associated with different
strategic options in a and provide best cost options.

P a g e | 58
Alexandria2030
IntegratedUrban
WaterM
anagement(IU
WM)Strategic
PlanReferences
AbuZeid, K.M., Smout, I., Taha, H., Sabry, N., Elrawady, M. 2010, Alexandria Water Demand Management Study, CEDARE and Alexandria Water Company (AWCO), March 2010.
AbuZeid, K.M, El Arabi, N., Fekry, A., Meneum, M.A., Taha, K. and El Karamany, S., Elrawady, M. 2009. Assessment of Groundwater Potential in Alexandria Governorate, CEDARE and Research Institute for Groundwater, November 2009.
AbuZeid, K.M., Assimacopoulos, D., Manoli, E., Donia, N., Sabry, N., Ramadan, A., Elrawady, M. 2010a, Alexandria Urban Water System Modeling, CEDARE and National Technical University of Athens, Alexandria Water Company, March 2010.
AbuZeid, K.M., Van Der Steen, P., Hellaly, H., Kassem, A., Elrawady, M. 2010b, Alexandria wastewater treatment and reuse study, CEDARE and Alexandria Sanitary Drainage Company (ASDCO), UNESCO-IHE, March 2010.
AbuZeid, K.M., Shoutes,B., Yaseen, A., Alshafie, A., Elrawady, M. 2010, Alexandria storm water management Study, CEDARE and Alexandria University (AWCO), March 2010.
AbuZeid, K., Elrawady, M. 2010, Institutional Mapping and Water Governance Analysis in the City of Alexandria, CEDARE, March 2010.
Chemonics Egypt, 2010, Affordability Assessment to Support the Integrated Urban Water Management in Alexandria �– January 2011.
GTZ, 2004, New practice of participatory local development in Egypt's urban areas, Policy paper, GTZ, Cairo

P a g e | 59
Alexandria2030
IntegratedUrban
WaterM
anagement(IU
WM)Strategic
PlanIntergovernmental Panel on Climate Change ( IPCC). (2007). Working Group I: The Physical Science Basis, Technical Summary: The Fourth Assessment Report of the Intergovernmental Panel on Climate Change pp. 21-87.
Intergovernmental Panel on Climate Change (IPCC). (2001). Working Group II: Impacts, Adaptation and Vulnerability African region: The third Assessment Report of the Intergovernmental Panel on Climate Change pp. 489-525.
Saad, M. , Future water availability in Alexandria, Ministry of Water Resources and Irrigation (MWRI), August 2010.
Retamal, M.L & White, S. 2010, Integrated Supply-Demand Planning for Alexandria, Egypt, Water efficiency study &business case analysis for water demand management, CEDARE and ISF-UTS, March 2011.