itp glass: glass industry of the future: energy and environmental
TRANSCRIPT

Energy and
Environmental Profile of the
U.S. Glass Industry
April 2002
Prepared by
IncorporatedColumbia, Maryland
Prepared for
U.S. Department of EnergyOffice of Industrial Technologies
ACKNOWLEDGEMENTS
This report was written by Joan L. Pellegrino of Energetics, Inc. in Columbia, MD. Itwas prepared under the general direction of Lou Sousa, Industrial Technologies (IT) ProgramOffice, U.S. Department of Energy, in cooperation with Elliott Levine, IT’s Glass Team Leader. Technical guidance and review of the report were provided by the following individuals:
Michael GreenmanGlass Manufacturing Industry Council
C. Philip RossGlass Industry Consultants
Jim ShellTechneglas
Marv GridleySaint-Gobain Containers, Inc.
Dan WishnickCombustion Tec
Derek J. McCrackenAmerican Minerals, Inc.
i
Table of ContentsFOREWORD . . . . . . . . . . . . . . . . . . . . . . . . . . . . . . . . . . . . . . . . . . . . . . . . . . . . . . . . . . . . . . . . . . . . . . ii
Chapter 1: Overview . . . . . . . . . . . . . . . . . . . . . . . . . . . . . . . . . . . . . . . . . . . . . . . . . . . . . . . . . . . . . . . 11.1 The Glass Industry: Keystone of the U.S. Economy . . . . . . . . . . . . . . . . . . . . . . . . . . . . . . . 11.2 Industry Performance and Market Trends . . . . . . . . . . . . . . . . . . . . . . . . . . . . . . . . . . . . . . . 31.3 Energy Overview . . . . . . . . . . . . . . . . . . . . . . . . . . . . . . . . . . . . . . . . . . . . . . . . . . . . . . . . . 111.4 Environmental Overview . . . . . . . . . . . . . . . . . . . . . . . . . . . . . . . . . . . . . . . . . . . . . . . . . . . 17
Chapter 2: Glass Manufacturing Processes . . . . . . . . . . . . . . . . . . . . . . . . . . . . . . . . . . . . . . . . . . . . 252.1 Overview of Glass Manufacturing Processes . . . . . . . . . . . . . . . . . . . . . . . . . . . . . . . . . . . 252.2 Process Energy Overview . . . . . . . . . . . . . . . . . . . . . . . . . . . . . . . . . . . . . . . . . . . . . . . . . . 272.3 Environmental Overview . . . . . . . . . . . . . . . . . . . . . . . . . . . . . . . . . . . . . . . . . . . . . . . . . . . 32
Chapter 3: Batch Preparation . . . . . . . . . . . . . . . . . . . . . . . . . . . . . . . . . . . . . . . . . . . . . . . . . . . . . . . 353.1 Process Overview . . . . . . . . . . . . . . . . . . . . . . . . . . . . . . . . . . . . . . . . . . . . . . . . . . . . . . . . . 353.2 Summary of Inputs and Outputs . . . . . . . . . . . . . . . . . . . . . . . . . . . . . . . . . . . . . . . . . . . . . 393.3 Energy Requirements . . . . . . . . . . . . . . . . . . . . . . . . . . . . . . . . . . . . . . . . . . . . . . . . . . . . . . 393.4 Emissions . . . . . . . . . . . . . . . . . . . . . . . . . . . . . . . . . . . . . . . . . . . . . . . . . . . . . . . . . . . . . . . 403.5 Byproducts and Wastes . . . . . . . . . . . . . . . . . . . . . . . . . . . . . . . . . . . . . . . . . . . . . . . . . . . . 40
Chapter 4: Melting and Refining . . . . . . . . . . . . . . . . . . . . . . . . . . . . . . . . . . . . . . . . . . . . . . . . . . . . 414.1 Process Overview . . . . . . . . . . . . . . . . . . . . . . . . . . . . . . . . . . . . . . . . . . . . . . . . . . . . . . . . . 414.2 Summary of Inputs and Outputs for Melting . . . . . . . . . . . . . . . . . . . . . . . . . . . . . . . . . . . . 554.3 Energy Requirements . . . . . . . . . . . . . . . . . . . . . . . . . . . . . . . . . . . . . . . . . . . . . . . . . . . . . . 554.4 Emissions . . . . . . . . . . . . . . . . . . . . . . . . . . . . . . . . . . . . . . . . . . . . . . . . . . . . . . . . . . . . . . . 584.5 Byproducts and Wastes . . . . . . . . . . . . . . . . . . . . . . . . . . . . . . . . . . . . . . . . . . . . . . . . . . . . 63
Chapter 5: Glass Forming . . . . . . . . . . . . . . . . . . . . . . . . . . . . . . . . . . . . . . . . . . . . . . . . . . . . . . . . . . 655.1 Process Overview . . . . . . . . . . . . . . . . . . . . . . . . . . . . . . . . . . . . . . . . . . . . . . . . . . . . . . . . . 655.2 Summary of Inputs and Outputs for Glass Forming . . . . . . . . . . . . . . . . . . . . . . . . . . . . . . 775.3 Energy Requirements . . . . . . . . . . . . . . . . . . . . . . . . . . . . . . . . . . . . . . . . . . . . . . . . . . . . . . 785.4 Emissions . . . . . . . . . . . . . . . . . . . . . . . . . . . . . . . . . . . . . . . . . . . . . . . . . . . . . . . . . . . . . . . 805.5 Effluents . . . . . . . . . . . . . . . . . . . . . . . . . . . . . . . . . . . . . . . . . . . . . . . . . . . . . . . . . . . . . . . . 805.6 Byproducts and Wastes . . . . . . . . . . . . . . . . . . . . . . . . . . . . . . . . . . . . . . . . . . . . . . . . . . . . 83
Chapter 6: Post-Forming and Finishing Operations . . . . . . . . . . . . . . . . . . . . . . . . . . . . . . . . . . . . . 856.1 Process Overview . . . . . . . . . . . . . . . . . . . . . . . . . . . . . . . . . . . . . . . . . . . . . . . . . . . . . . . . . 856.2 Summary of Inputs and Outputs for Post Forming . . . . . . . . . . . . . . . . . . . . . . . . . . . . . . . 906.3 Energy Requirements . . . . . . . . . . . . . . . . . . . . . . . . . . . . . . . . . . . . . . . . . . . . . . . . . . . . . . 916.4 Emissions . . . . . . . . . . . . . . . . . . . . . . . . . . . . . . . . . . . . . . . . . . . . . . . . . . . . . . . . . . . . . . . 916.5 Effluents . . . . . . . . . . . . . . . . . . . . . . . . . . . . . . . . . . . . . . . . . . . . . . . . . . . . . . . . . . . . . . . . 916.6 Byproducts and Wastes . . . . . . . . . . . . . . . . . . . . . . . . . . . . . . . . . . . . . . . . . . . . . . . . . . . . 94
References . . . . . . . . . . . . . . . . . . . . . . . . . . . . . . . . . . . . . . . . . . . . . . . . . . . . . . . . . . . . . . . . . . . . . . . . 95
ii
FOREWORD
In 1996, the U.S. Department of Energy’s Office of Industrial Technologies (DOE/OIT) beganwork o n a series o f reports in s uppor t of DO E/OIT ’s Indus tries of the F uture strate gy. Un der thisindustry-led strategy , DOE/O IT works w ith U.S. industry to develop tech nology p artnerships and su pportcollaborative RD&D projects that enhance energy efficiency, competitiveness and environmentalperformance.
Though the profiles are intended primarily to better inform collaborative industry-DOE R&Dplannin g, they p rovide a v aluable re source th at can be w idely use d by m any oth ers who are not dire ctlyinvolved in these efforts. Through these profiles, research managers, policymakers, industry analysts andothers can gain a general perspective of energy use and environmental characteristics of the industry. Theprofiles do not attempt to recreate sources that already exist; rather, they provide a “snap-shot” of theindustry and an excellent source of references on the topic.
The profiles synthesize into a single document information that is available in many differentforms and sources. Aggregated data for the entire industry as well as data at the process level is presentedaccordin g to the m ajor unit o peration s of each in dustry. D ata is obtain ed from the mos t currentlyavailable publish ed sources, indu stry experts, and g overnme nt reports. Prior to pu blication, profiles arereviewed by those working in the industry, trade associations, and experts in government and the nationallaboratories.
To date , energy and env ironme ntal profile s have b een pub lished for th e alumin um, steel,metalcasting, petroleum refining, chemical, and glass industries. Development of profiles for the miningand forest products industries is currently underway.

1
1 Overview
1.1 The Glass Industry:Keystone of the U.S. Economy
Glass is an Integral Part of Daily Life
Glass has been produced for thousands of years,dating from as early as 7000 B.C. The earliestmakers of glass, the Egyptians, considered it tobe a precious material, like gemstones. Todayglass is so commonly used that its presenceoften goes unnoticed. In its many forms, glasshas become an integral part of the Americanlifestyle and a keystone of the U.S. economy.
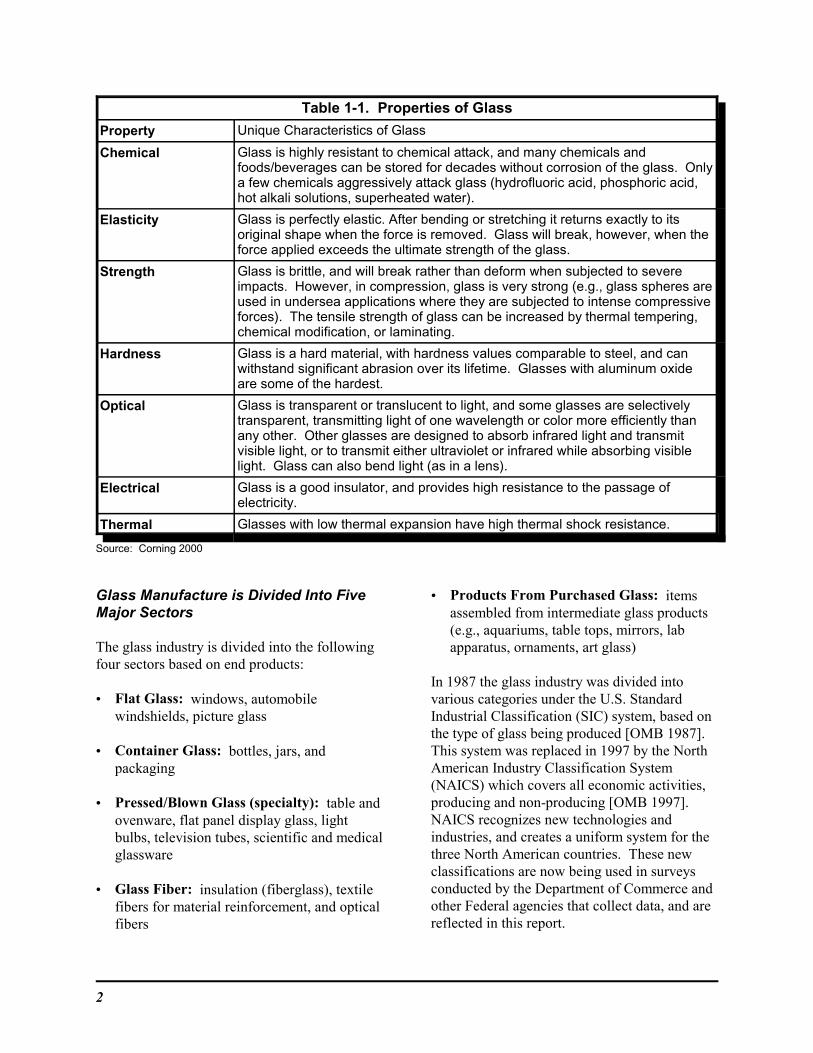
Glass is used in a myriad of products, primarilybecause it is inexpensive and has many desirableproperties (see Table 1-1). Glass properties areunique to the chemical make-up of the glass, andcan be varied and regulated by changingcomposition and/or production techniques. However, changing one glass property usuallyaffects the other properties. When selecting aparticular glass for a product, it is thecombination of mechanical, chemical, thermal,optical and other properties that are important. At the core of the science of glassmaking isselecting the best combination of properties tosuit the application.
The unique properties and cost-effectiveness ofglass have helped establish and maintain itsprominent use in buildings, transportation,containers, and scientific products. Glass hasalso found new uses in the communications andelectronics industries and many experts believethat the potential for creating diverse materialsand products from glass has hardly beenrealized.
The U.S. Department of Energy and theGlass Industry of the Future
The U.S. Department of Energy’s (DOE’s)Office of Industrial Technologies has formed apartnership with the U.S. glass industry toaccelerate the development of technologiesand processes that will improve the industry’senergy efficiency and environmentalperformance. This report is intended to supportthe DOE/Glass Industry Partnership.
2
Table 1-1. Properties of Glass
Property Unique Characteristics of Glass
Chemical Glass is highly resistant to chemical attack, and many chemicals andfoods/beverages can be stored for decades without corrosion of the glass. Onlya few chemicals aggressively attack glass (hydrofluoric acid, phosphoric acid,hot alkali solutions, superheated water).
Elasticity Glass is perfectly elastic. After bending or stretching it returns exactly to itsoriginal shape when the force is removed. Glass will break, however, when theforce applied exceeds the ultimate strength of the glass.
Strength Glass is brittle, and will break rather than deform when subjected to severeimpacts. However, in compression, glass is very strong (e.g., glass spheres areused in undersea applications where they are subjected to intense compressiveforces). The tensile strength of glass can be increased by thermal tempering,chemical modification, or laminating.
Hardness Glass is a hard material, with hardness values comparable to steel, and canwithstand significant abrasion over its lifetime. Glasses with aluminum oxideare some of the hardest.
Optical Glass is transparent or translucent to light, and some glasses are selectivelytransparent, transmitting light of one wavelength or color more efficiently thanany other. Other glasses are designed to absorb infrared light and transmitvisible light, or to transmit either ultraviolet or infrared while absorbing visiblelight. Glass can also bend light (as in a lens).
Electrical Glass is a good insulator, and provides high resistance to the passage ofelectricity.
Thermal Glasses with low thermal expansion have high thermal shock resistance.
Source: Corning 2000
Glass Manufacture is Divided Into FiveMajor Sectors
The glass industry is divided into the followingfour sectors based on end products:
• Flat Glass: windows, automobilewindshields, picture glass
• Container Glass: bottles, jars, andpackaging
• Pressed/Blown Glass (specialty): table andovenware, flat panel display glass, lightbulbs, television tubes, scientific and medicalglassware
• Glass Fiber: insulation (fiberglass), textilefibers for material reinforcement, and opticalfibers
• Products From Purchased Glass: itemsassembled from intermediate glass products(e.g., aquariums, table tops, mirrors, labapparatus, ornaments, art glass)
In 1987 the glass industry was divided intovarious categories under the U.S. StandardIndustrial Classification (SIC) system, based onthe type of glass being produced [OMB 1987]. This system was replaced in 1997 by the NorthAmerican Industry Classification System(NAICS) which covers all economic activities,producing and non-producing [OMB 1997]. NAICS recognizes new technologies andindustries, and creates a uniform system for thethree North American countries. These newclassifications are now being used in surveysconducted by the Department of Commerce andother Federal agencies that collect data, and arereflected in this report.
3
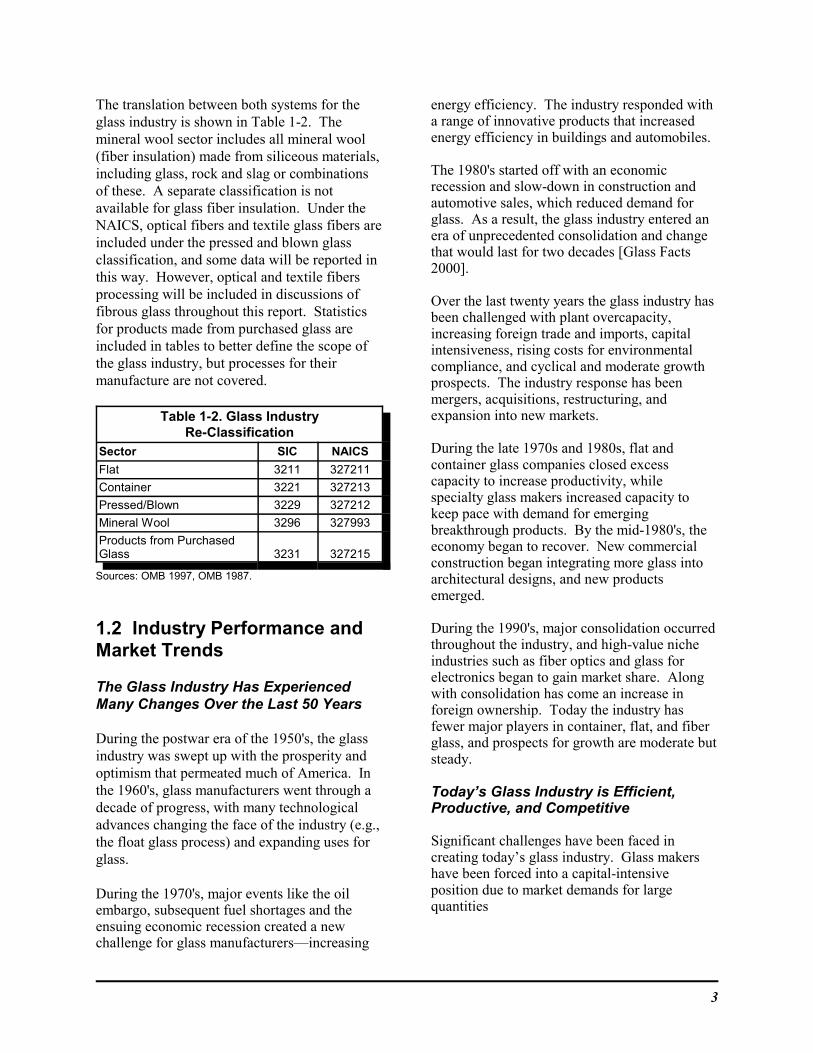
The translation between both systems for theglass industry is shown in Table 1-2. Themineral wool sector includes all mineral wool(fiber insulation) made from siliceous materials,including glass, rock and slag or combinationsof these. A separate classification is notavailable for glass fiber insulation. Under theNAICS, optical fibers and textile glass fibers areincluded under the pressed and blown glassclassification, and some data will be reported inthis way. However, optical and textile fibersprocessing will be included in discussions offibrous glass throughout this report. Statisticsfor products made from purchased glass areincluded in tables to better define the scope ofthe glass industry, but processes for theirmanufacture are not covered.
Table 1-2. Glass IndustryRe-Classification
Sector SIC NAICS
Flat 3211 327211
Container 3221 327213
Pressed/Blown 3229 327212
Mineral Wool 3296 327993
Products from PurchasedGlass 3231 327215
Sources: OMB 1997, OMB 1987.
1.2 Industry Performance andMarket Trends
The Glass Industry Has ExperiencedMany Changes Over the Last 50 Years
During the postwar era of the 1950's, the glassindustry was swept up with the prosperity andoptimism that permeated much of America. Inthe 1960's, glass manufacturers went through adecade of progress, with many technologicaladvances changing the face of the industry (e.g.,the float glass process) and expanding uses forglass.
During the 1970's, major events like the oilembargo, subsequent fuel shortages and theensuing economic recession created a newchallenge for glass manufacturers—increasing
energy efficiency. The industry responded witha range of innovative products that increasedenergy efficiency in buildings and automobiles.
The 1980's started off with an economicrecession and slow-down in construction andautomotive sales, which reduced demand forglass. As a result, the glass industry entered anera of unprecedented consolidation and changethat would last for two decades [Glass Facts2000].
Over the last twenty years the glass industry hasbeen challenged with plant overcapacity,increasing foreign trade and imports, capitalintensiveness, rising costs for environmentalcompliance, and cyclical and moderate growthprospects. The industry response has beenmergers, acquisitions, restructuring, andexpansion into new markets.
During the late 1970s and 1980s, flat andcontainer glass companies closed excesscapacity to increase productivity, whilespecialty glass makers increased capacity tokeep pace with demand for emergingbreakthrough products. By the mid-1980's, theeconomy began to recover. New commercialconstruction began integrating more glass intoarchitectural designs, and new productsemerged.
During the 1990's, major consolidation occurredthroughout the industry, and high-value nicheindustries such as fiber optics and glass forelectronics began to gain market share. Alongwith consolidation has come an increase inforeign ownership. Today the industry hasfewer major players in container, flat, and fiberglass, and prospects for growth are moderate butsteady.
Today’s Glass Industry is Efficient,Productive, and Competitive
Significant challenges have been faced increating today’s glass industry. Glass makershave been forced into a capital-intensiveposition due to market demands for largequantities
4
0
2
4
6
8
10
12
19
77
19
78
19
79
19
80
19
81
19
82
19
83
19
84
19
85
19
86
19
87
19
88
19
89
19
90
19
91
19
92
19
93
19
94
19
95
19
96
19
97
19
98
19
99
F ib e rg lass
F lat
Co n tain e r
Sp e cialty
G lass Pro d u cts
Billions of Dollars
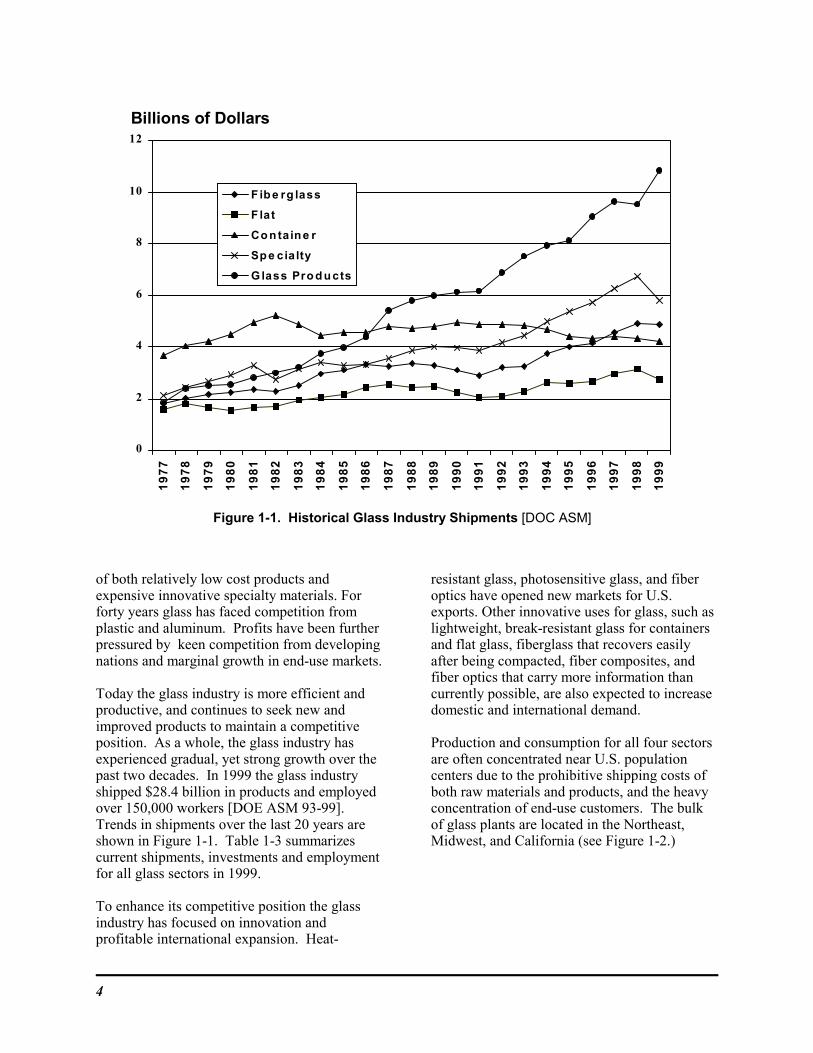
Figure 1-1. Historical Glass Industry Shipments [DOC ASM]
of both relatively low cost products andexpensive innovative specialty materials. Forforty years glass has faced competition fromplastic and aluminum. Profits have been furtherpressured by keen competition from developingnations and marginal growth in end-use markets.
Today the glass industry is more efficient andproductive, and continues to seek new andimproved products to maintain a competitiveposition. As a whole, the glass industry hasexperienced gradual, yet strong growth over thepast two decades. In 1999 the glass industryshipped $28.4 billion in products and employedover 150,000 workers [DOE ASM 93-99].Trends in shipments over the last 20 years are shown in Figure 1-1. Table 1-3 summarizescurrent shipments, investments and employmentfor all glass sectors in 1999.
To enhance its competitive position the glassindustry has focused on innovation andprofitable international expansion. Heat-
resistant glass, photosensitive glass, and fiberoptics have opened new markets for U.S.exports. Other innovative uses for glass, such aslightweight, break-resistant glass for containersand flat glass, fiberglass that recovers easilyafter being compacted, fiber composites, andfiber optics that carry more information thancurrently possible, are also expected to increasedomestic and international demand.
Production and consumption for all four sectorsare often concentrated near U.S. populationcenters due to the prohibitive shipping costs ofboth raw materials and products, and the heavyconcentration of end-use customers. The bulkof glass plants are located in the Northeast,Midwest, and California (see Figure 1-2.)

5
Figure 1-2. Distribution of Glass Plants in the United States[DOC ASM 93-98, DOC 1997]
Table 1-3. Summary of 1999 Industry Statistics
SectorShipments($million)
Production(short tons)
Exportsd
($million)Importsd
($million)Establish-
mentscEmployees
(1000)
ProductionWages($/hr)
CapitalExpenses($million)
Flat 2,746 5,000,521 788 576 36 11,053 21.76 322.7
Container 4,215 9,586,500 174 586 61 19,220 20.05 349.3
Pressed/ Blown a 5,787 2,484,182e 1,298 2,038 515 35,013 15.74 636.8
Mineral Wool b 4,844 3,040,000 360 251 298 22,823 17.12 285.8
Purchased GlassProducts 10,847 na 1,157 1,047 1,657 62,405 12.79 na
INDUSTRY TOTAL 28,439 20,111,203 3,777 4,498 2,567 150,514 17.49 1,594.6
a Textile and optical fibers are included in pressed/blown glass under the NAICS codes.b Includes wool made from siliceous materials such as glass, rock, slag, or combinations of these. Data for glass wool is not
categorized separately.c 1997 data, latest available.d 2000 data.e Estimated based on 92 Census Data dn 2% annual growth between 1992 and 1997.na not availableSources: DOC ASM 93-99, DOC MP 93-00, USITC 2001
6
Automotive25%
Construction56%
Other25%
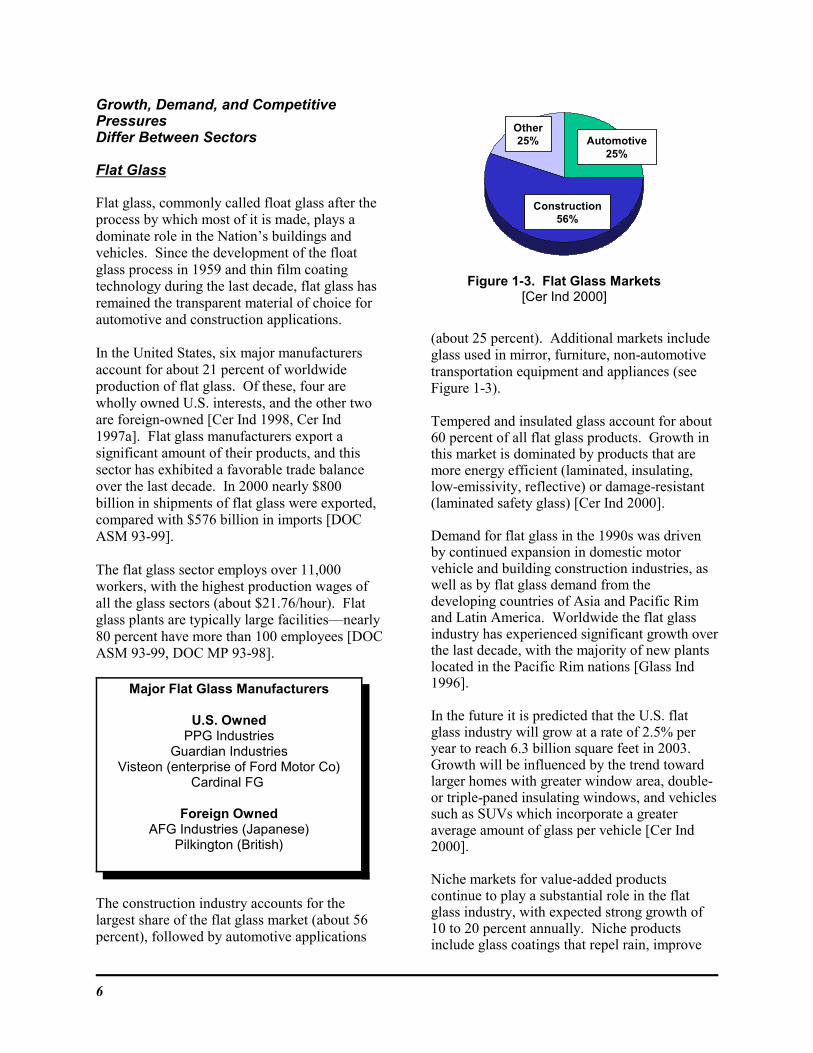
Figure 1-3. Flat Glass Markets[Cer Ind 2000]
Growth, Demand, and CompetitivePressuresDiffer Between Sectors
Flat Glass
Flat glass, commonly called float glass after theprocess by which most of it is made, plays adominate role in the Nation’s buildings andvehicles. Since the development of the floatglass process in 1959 and thin film coatingtechnology during the last decade, flat glass hasremained the transparent material of choice forautomotive and construction applications.
In the United States, six major manufacturersaccount for about 21 percent of worldwideproduction of flat glass. Of these, four arewholly owned U.S. interests, and the other twoare foreign-owned [Cer Ind 1998, Cer Ind1997a]. Flat glass manufacturers export asignificant amount of their products, and thissector has exhibited a favorable trade balanceover the last decade. In 2000 nearly $800billion in shipments of flat glass were exported,compared with $576 billion in imports [DOCASM 93-99].
The flat glass sector employs over 11,000workers, with the highest production wages ofall the glass sectors (about $21.76/hour). Flatglass plants are typically large facilities—nearly80 percent have more than 100 employees [DOCASM 93-99, DOC MP 93-98].
The construction industry accounts for thelargest share of the flat glass market (about 56percent), followed by automotive applications
(about 25 percent). Additional markets includeglass used in mirror, furniture, non-automotivetransportation equipment and appliances (seeFigure 1-3).
Tempered and insulated glass account for about60 percent of all flat glass products. Growth inthis market is dominated by products that aremore energy efficient (laminated, insulating,low-emissivity, reflective) or damage-resistant(laminated safety glass) [Cer Ind 2000].
Demand for flat glass in the 1990s was drivenby continued expansion in domestic motorvehicle and building construction industries, aswell as by flat glass demand from thedeveloping countries of Asia and Pacific Rimand Latin America. Worldwide the flat glassindustry has experienced significant growth overthe last decade, with the majority of new plantslocated in the Pacific Rim nations [Glass Ind1996].
In the future it is predicted that the U.S. flatglass industry will grow at a rate of 2.5% peryear to reach 6.3 billion square feet in 2003. Growth will be influenced by the trend towardlarger homes with greater window area, double-or triple-paned insulating windows, and vehiclessuch as SUVs which incorporate a greateraverage amount of glass per vehicle [Cer Ind2000].
Niche markets for value-added productscontinue to play a substantial role in the flatglass industry, with expected strong growth of10 to 20 percent annually. Niche productsinclude glass coatings that repel rain, improve
Major Flat Glass Manufacturers
U.S. OwnedPPG Industries
Guardian IndustriesVisteon (enterprise of Ford Motor Co)
Cardinal FG
Foreign OwnedAFG Industries (Japanese)
Pilkington (British)
7
Food 24%Beverage, Other 14%
Wine, Liquor 10%
Beer 52%
Food 24%Beverage, Other 14%
Wine, Liquor 10%
Beer 52%
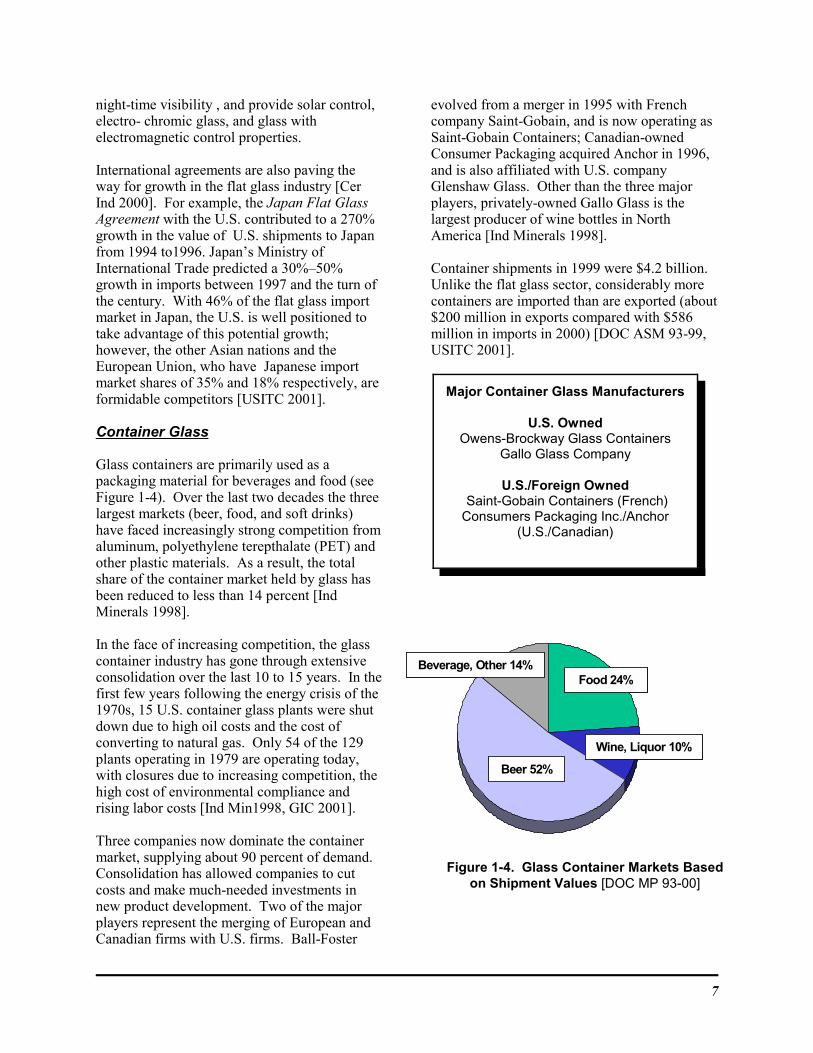
Figure 1-4. Glass Container Markets Basedon Shipment Values [DOC MP 93-00]
night-time visibility , and provide solar control,electro- chromic glass, and glass withelectromagnetic control properties.
International agreements are also paving theway for growth in the flat glass industry [Cer Ind 2000]. For example, the Japan Flat GlassAgreement with the U.S. contributed to a 270%growth in the value of U.S. shipments to Japanfrom 1994 to1996. Japan’s Ministry ofInternational Trade predicted a 30%–50%growth in imports between 1997 and the turn ofthe century. With 46% of the flat glass importmarket in Japan, the U.S. is well positioned totake advantage of this potential growth;however, the other Asian nations and theEuropean Union, who have Japanese importmarket shares of 35% and 18% respectively, areformidable competitors [USITC 2001].
Container Glass
Glass containers are primarily used as a packaging material for beverages and food (seeFigure 1-4). Over the last two decades the threelargest markets (beer, food, and soft drinks)have faced increasingly strong competition fromaluminum, polyethylene terepthalate (PET) andother plastic materials. As a result, the totalshare of the container market held by glass hasbeen reduced to less than 14 percent [IndMinerals 1998].
In the face of increasing competition, the glasscontainer industry has gone through extensiveconsolidation over the last 10 to 15 years. In thefirst few years following the energy crisis of the1970s, 15 U.S. container glass plants were shutdown due to high oil costs and the cost ofconverting to natural gas. Only 54 of the 129plants operating in 1979 are operating today,with closures due to increasing competition, thehigh cost of environmental compliance andrising labor costs [Ind Min1998, GIC 2001].
Three companies now dominate the containermarket, supplying about 90 percent of demand.Consolidation has allowed companies to cutcosts and make much-needed investments innew product development. Two of the majorplayers represent the merging of European andCanadian firms with U.S. firms. Ball-Foster
evolved from a merger in 1995 with Frenchcompany Saint-Gobain, and is now operating asSaint-Gobain Containers; Canadian-ownedConsumer Packaging acquired Anchor in 1996,and is also affiliated with U.S. companyGlenshaw Glass. Other than the three majorplayers, privately-owned Gallo Glass is thelargest producer of wine bottles in NorthAmerica [Ind Minerals 1998].
Container shipments in 1999 were $4.2 billion. Unlike the flat glass sector, considerably morecontainers are imported than are exported (about$200 million in exports compared with $586million in imports in 2000) [DOC ASM 93-99,USITC 2001].
Major Container Glass Manufacturers
U.S. OwnedOwens-Brockway Glass Containers
Gallo Glass Company
U.S./Foreign Owned Saint-Gobain Containers (French)Consumers Packaging Inc./Anchor
(U.S./Canadian)
8
Table, ArtCookware 17%
Lighting,Automotive,
Electronics 30%
ScientificGlassware, Lens
Blanks 16%
Handblown 4%
Textile Fiber33%
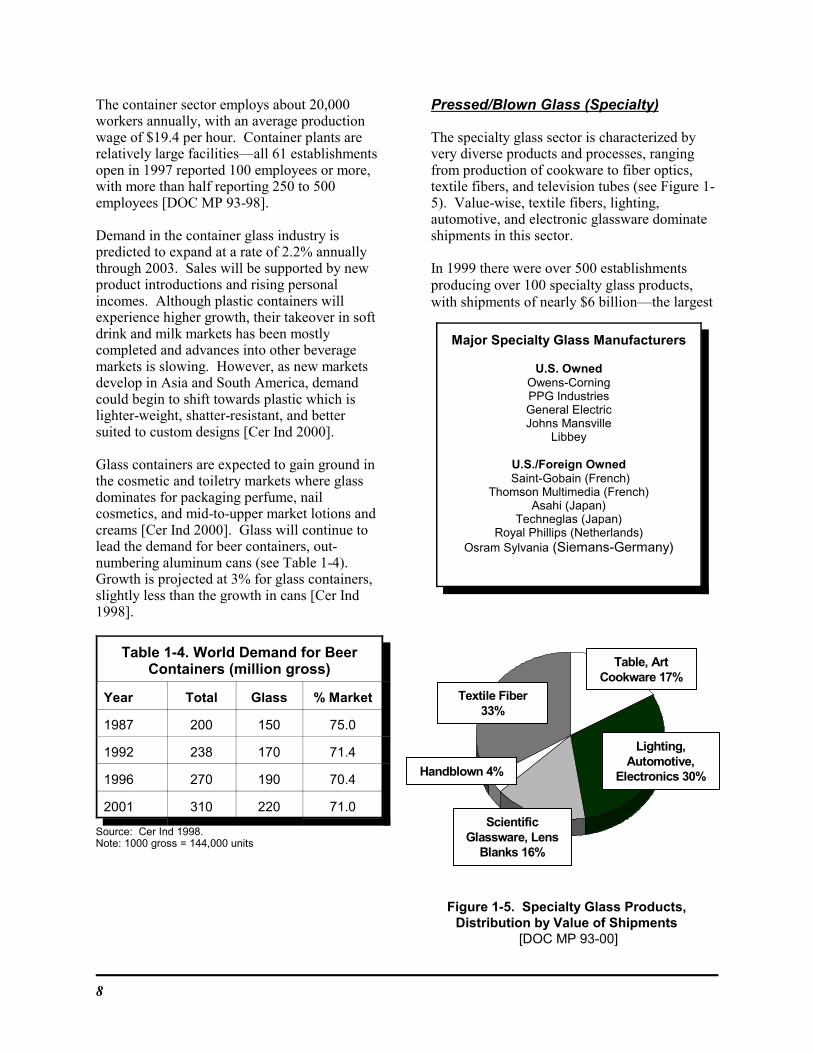
Figure 1-5. Specialty Glass Products,Distribution by Value of Shipments
[DOC MP 93-00]
The container sector employs about 20,000workers annually, with an average productionwage of $19.4 per hour. Container plants arerelatively large facilities—all 61 establishmentsopen in 1997 reported 100 employees or more,with more than half reporting 250 to 500employees [DOC MP 93-98].
Demand in the container glass industry ispredicted to expand at a rate of 2.2% annuallythrough 2003. Sales will be supported by newproduct introductions and rising personalincomes. Although plastic containers willexperience higher growth, their takeover in softdrink and milk markets has been mostlycompleted and advances into other beveragemarkets is slowing. However, as new marketsdevelop in Asia and South America, demandcould begin to shift towards plastic which islighter-weight, shatter-resistant, and bettersuited to custom designs [Cer Ind 2000].
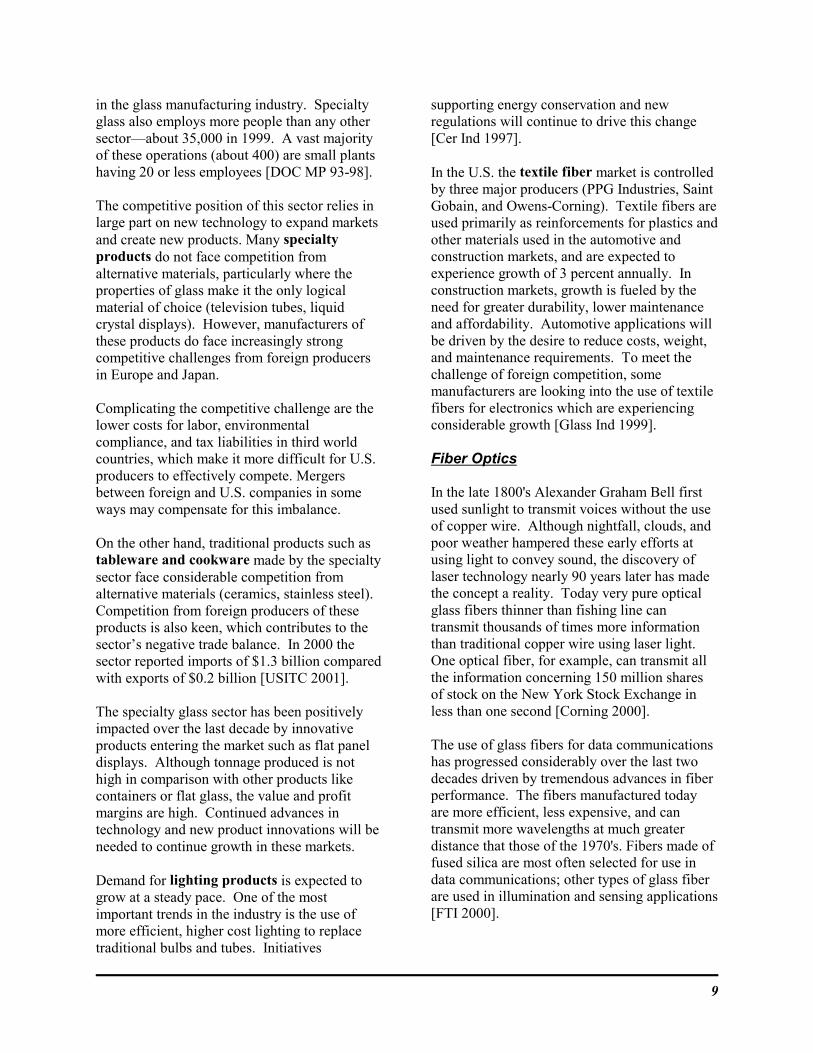
Glass containers are expected to gain ground inthe cosmetic and toiletry markets where glassdominates for packaging perfume, nailcosmetics, and mid-to-upper market lotions andcreams [Cer Ind 2000]. Glass will continue tolead the demand for beer containers, out-numbering aluminum cans (see Table 1-4).Growth is projected at 3% for glass containers,slightly less than the growth in cans [Cer Ind1998].
Table 1-4. World Demand for BeerContainers (million gross)
Year Total Glass % Market
1987 200 150 75.0
1992 238 170 71.4
1996 270 190 70.4
2001 310 220 71.0
Source: Cer Ind 1998.Note: 1000 gross = 144,000 units
Pressed/Blown Glass (Specialty)
The specialty glass sector is characterized byvery diverse products and processes, rangingfrom production of cookware to fiber optics,textile fibers, and television tubes (see Figure 1-5). Value-wise, textile fibers, lighting,automotive, and electronic glassware dominateshipments in this sector.
In 1999 there were over 500 establishmentsproducing over 100 specialty glass products,with shipments of nearly $6 billion—the largest
Major Specialty Glass Manufacturers
U.S. OwnedOwens-CorningPPG IndustriesGeneral ElectricJohns Mansville
Libbey
U.S./Foreign Owned Saint-Gobain (French)
Thomson Multimedia (French)Asahi (Japan)
Techneglas (Japan)Royal Phillips (Netherlands)
Osram Sylvania (Siemans-Germany)
9
in the glass manufacturing industry. Specialtyglass also employs more people than any othersector—about 35,000 in 1999. A vast majorityof these operations (about 400) are small plantshaving 20 or less employees [DOC MP 93-98].
The competitive position of this sector relies inlarge part on new technology to expand marketsand create new products. Many specialtyproducts do not face competition fromalternative materials, particularly where theproperties of glass make it the only logicalmaterial of choice (television tubes, liquidcrystal displays). However, manufacturers ofthese products do face increasingly strongcompetitive challenges from foreign producersin Europe and Japan.
Complicating the competitive challenge are thelower costs for labor, environmentalcompliance, and tax liabilities in third worldcountries, which make it more difficult for U.S.producers to effectively compete. Mergersbetween foreign and U.S. companies in someways may compensate for this imbalance.
On the other hand, traditional products such astableware and cookware made by the specialtysector face considerable competition fromalternative materials (ceramics, stainless steel). Competition from foreign producers of theseproducts is also keen, which contributes to thesector’s negative trade balance. In 2000 thesector reported imports of $1.3 billion comparedwith exports of $0.2 billion [USITC 2001].
The specialty glass sector has been positivelyimpacted over the last decade by innovativeproducts entering the market such as flat paneldisplays. Although tonnage produced is nothigh in comparison with other products likecontainers or flat glass, the value and profitmargins are high. Continued advances intechnology and new product innovations will beneeded to continue growth in these markets.
Demand for lighting products is expected togrow at a steady pace. One of the mostimportant trends in the industry is the use ofmore efficient, higher cost lighting to replacetraditional bulbs and tubes. Initiatives
supporting energy conservation and newregulations will continue to drive this change[Cer Ind 1997].
In the U.S. the textile fiber market is controlledby three major producers (PPG Industries, SaintGobain, and Owens-Corning). Textile fibers areused primarily as reinforcements for plastics andother materials used in the automotive andconstruction markets, and are expected toexperience growth of 3 percent annually. Inconstruction markets, growth is fueled by theneed for greater durability, lower maintenanceand affordability. Automotive applications willbe driven by the desire to reduce costs, weight,and maintenance requirements. To meet thechallenge of foreign competition, somemanufacturers are looking into the use of textilefibers for electronics which are experiencingconsiderable growth [Glass Ind 1999].
Fiber Optics
In the late 1800's Alexander Graham Bell firstused sunlight to transmit voices without the useof copper wire. Although nightfall, clouds, andpoor weather hampered these early efforts atusing light to convey sound, the discovery oflaser technology nearly 90 years later has madethe concept a reality. Today very pure opticalglass fibers thinner than fishing line cantransmit thousands of times more informationthan traditional copper wire using laser light. One optical fiber, for example, can transmit allthe information concerning 150 million sharesof stock on the New York Stock Exchange inless than one second [Corning 2000].
The use of glass fibers for data communicationshas progressed considerably over the last twodecades driven by tremendous advances in fiberperformance. The fibers manufactured todayare more efficient, less expensive, and cantransmit more wavelengths at much greaterdistance that those of the 1970's. Fibers made offused silica are most often selected for use indata communications; other types of glass fiberare used in illumination and sensing applications[FTI 2000].
10
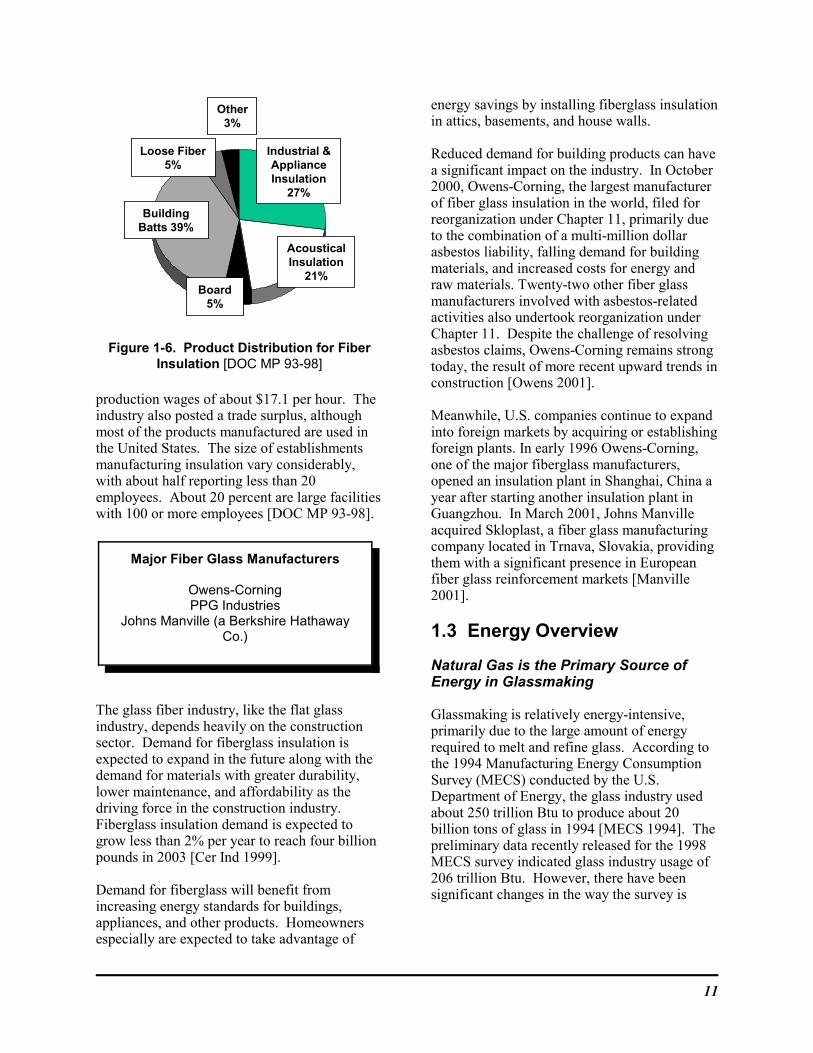
Shipments of fiber optic cable and optical fibershave been steadily increasing (see Table 1-5).Currently about 25 companies are involved inthe production of optical fiber, and 37 areproducing insulated optical fiber cables. Untilrecently the industry was centered in the UnitedStates and led by Corning, Alcatel and Lucent. As restrictive patents that gave exclusive rightsto these companies have started to expire, theindustry has entered a new era of competition.Although Corning remains one of the largestproducers, many other companies are nowentering the market (Pirelli, Sumitomo, Alcoa-Fujikura, and Furukawa). The industryincreasingly faces considerable challenges fromforeign producers entering the market withgovernment subsidies behind them [Glass Ind1999, DOC MP 93-00, Vision 1996].
Table 1-5. Fiber Optic Shipments ($ million)
Product 1997 1996 Change
Optical fiber fordata and non-datatransmission 1,210 1,031 17%
Insulated fiberoptic cable 1,852 1,728 7%
Source: DOC MP 93-00.
Demand for optical fibers is expected tocontinue to grow as European, North Americanand Latin American countries expand theircommunications networks. Advances intechnology will be a major factor in capturingmarket demand, as the performance of the fiber(amount of data it can carry) dictates itspopularity. Based on the success of the LEAFfiber, in early 2000 Corning announced plans toinvest $750 million in new optical fiberproduction capacity [Corning 2001, Glass Ind1999]. More recently, while investment planshave slowed, the company remains committed toexpansion.
The need for greater bandwidth and updatednetwork systems is expected to continue to drivegrowth in this industry. Fiber performance is,however, limited by the inherent nature of theglass fiber, and not the technology used totransmit data. In future, advances incommunications technology could ultimatelyoutpace the ability of glass fiber to transmit data[Glass Ind 1999].
Glass Wool Insulation (Fiber Glass)
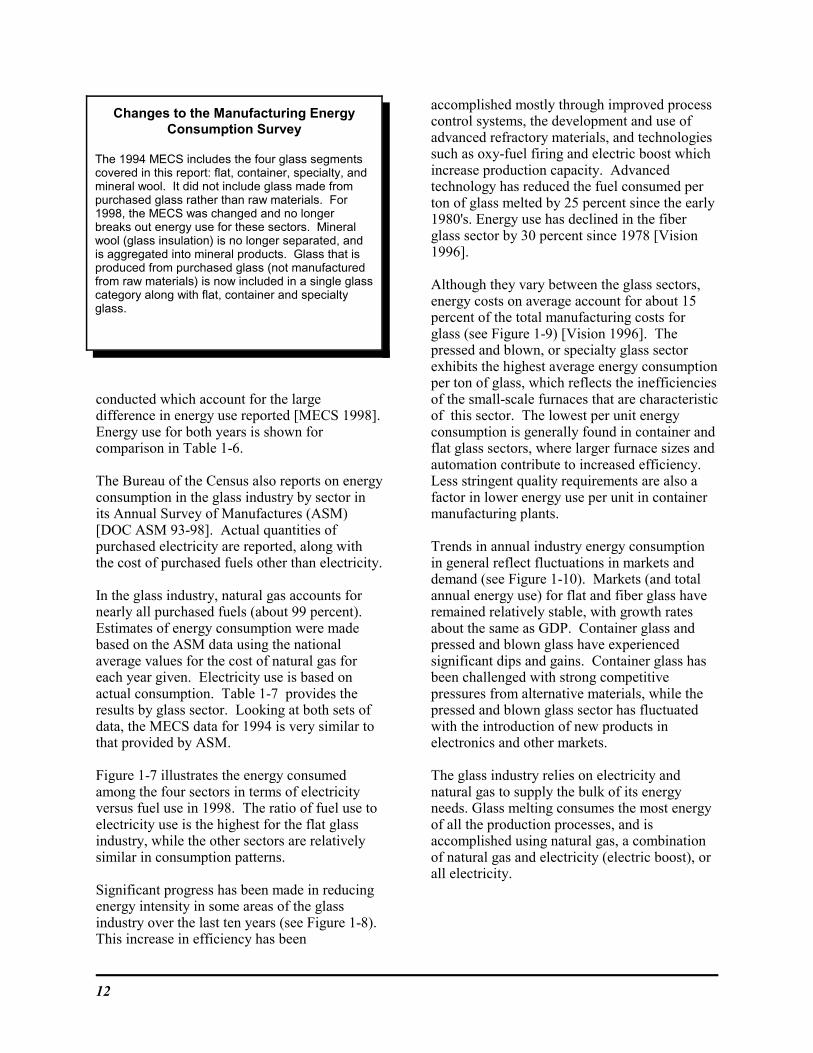
The major products from fibrous glass(excluding textile and optical fibers) includeunbonded and bonded glass wool, mats, staplefiber, and cut strands, and molded products, pipeinsulation, ceiling tile and specialty items (seeFigure 1-6). Insulation is also made from othersiliceous materials such as rock and slag, or canbe a combination of these and glass fibers. Forthis reason, most of the available data oninsulation includes all these materials and doesnot include glass wool as a separate category.
Four major companies dominate glass insulationproduction, accounting for about 93 percent ofthe U.S. insulation market. The industry hasexperienced slow growth, partly because of thepublic perception of the health risks associatedwith insulation products. Owens-Corning andJohns Manville are still being impacted bylitigation on previous production of asbestosproducts [Glass Ind 1999, Glass Ind 1999a].
1999 the industry shipped $4.8 billion inproducts and employed about 23,000 people,with
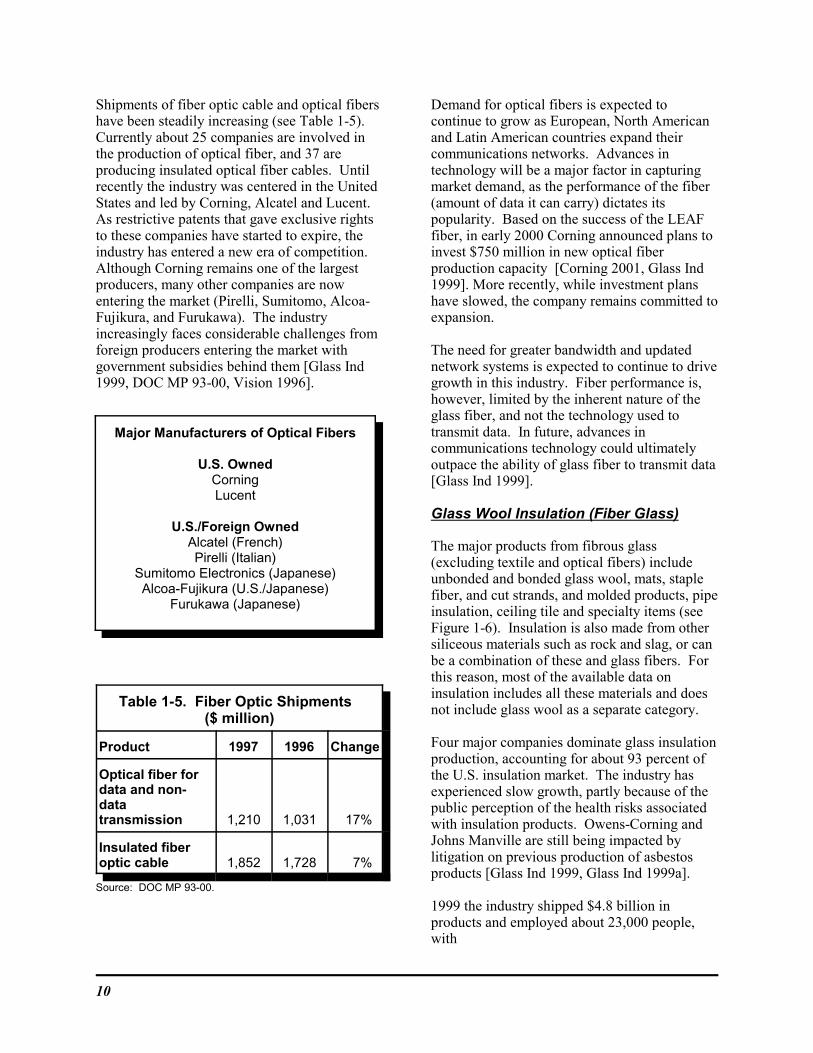
Major Manufacturers of Optical Fibers
U.S. OwnedCorningLucent
U.S./Foreign OwnedAlcatel (French)Pirelli (Italian)
Sumitomo Electronics (Japanese)Alcoa-Fujikura (U.S./Japanese)
Furukawa (Japanese)
11
AcousticalInsulation
21%Board
5%
Loose Fiber5%
BuildingBatts 39%
Industrial &ApplianceInsulation
27%
Other3%
Figure 1-6. Product Distribution for FiberInsulation [DOC MP 93-98]
production wages of about $17.1 per hour. Theindustry also posted a trade surplus, althoughmost of the products manufactured are used inthe United States. The size of establishmentsmanufacturing insulation vary considerably,with about half reporting less than 20employees. About 20 percent are large facilitieswith 100 or more employees [DOC MP 93-98].
The glass fiber industry, like the flat glassindustry, depends heavily on the constructionsector. Demand for fiberglass insulation isexpected to expand in the future along with thedemand for materials with greater durability,lower maintenance, and affordability as thedriving force in the construction industry. Fiberglass insulation demand is expected togrow less than 2% per year to reach four billionpounds in 2003 [Cer Ind 1999].
Demand for fiberglass will benefit fromincreasing energy standards for buildings,appliances, and other products. Homeownersespecially are expected to take advantage of
energy savings by installing fiberglass insulationin attics, basements, and house walls.
Reduced demand for building products can havea significant impact on the industry. In October2000, Owens-Corning, the largest manufacturerof fiber glass insulation in the world, filed forreorganization under Chapter 11, primarily dueto the combination of a multi-million dollarasbestos liability, falling demand for buildingmaterials, and increased costs for energy andraw materials. Twenty-two other fiber glassmanufacturers involved with asbestos-relatedactivities also undertook reorganization underChapter 11. Despite the challenge of resolvingasbestos claims, Owens-Corning remains strongtoday, the result of more recent upward trends inconstruction [Owens 2001].
Meanwhile, U.S. companies continue to expandinto foreign markets by acquiring or establishingforeign plants. In early 1996 Owens-Corning,one of the major fiberglass manufacturers,opened an insulation plant in Shanghai, China ayear after starting another insulation plant inGuangzhou. In March 2001, Johns Manvilleacquired Skloplast, a fiber glass manufacturingcompany located in Trnava, Slovakia, providingthem with a significant presence in Europeanfiber glass reinforcement markets [Manville2001].
1.3 Energy Overview
Natural Gas is the Primary Source ofEnergy in Glassmaking
Glassmaking is relatively energy-intensive,primarily due to the large amount of energyrequired to melt and refine glass. According tothe 1994 Manufacturing Energy ConsumptionSurvey (MECS) conducted by the U.S.Department of Energy, the glass industry usedabout 250 trillion Btu to produce about 20billion tons of glass in 1994 [MECS 1994]. Thepreliminary data recently released for the 1998MECS survey indicated glass industry usage of206 trillion Btu. However, there have beensignificant changes in the way the survey is
Major Fiber Glass Manufacturers
Owens-CorningPPG Industries
Johns Manville (a Berkshire HathawayCo.)
12
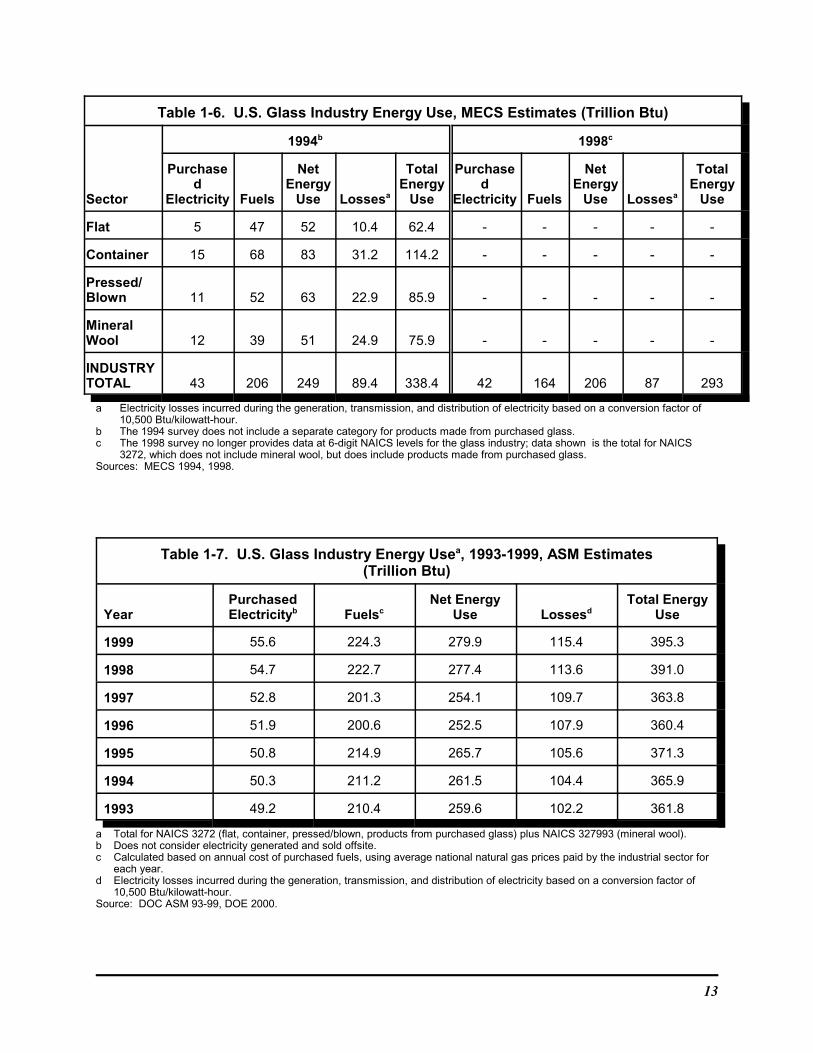
conducted which account for the largedifference in energy use reported [MECS 1998]. Energy use for both years is shown forcomparison in Table 1-6.
The Bureau of the Census also reports on energyconsumption in the glass industry by sector inits Annual Survey of Manufactures (ASM)[DOC ASM 93-98]. Actual quantities ofpurchased electricity are reported, along withthe cost of purchased fuels other than electricity.
In the glass industry, natural gas accounts fornearly all purchased fuels (about 99 percent). Estimates of energy consumption were madebased on the ASM data using the nationalaverage values for the cost of natural gas foreach year given. Electricity use is based onactual consumption. Table 1-7 provides theresults by glass sector. Looking at both sets ofdata, the MECS data for 1994 is very similar tothat provided by ASM.
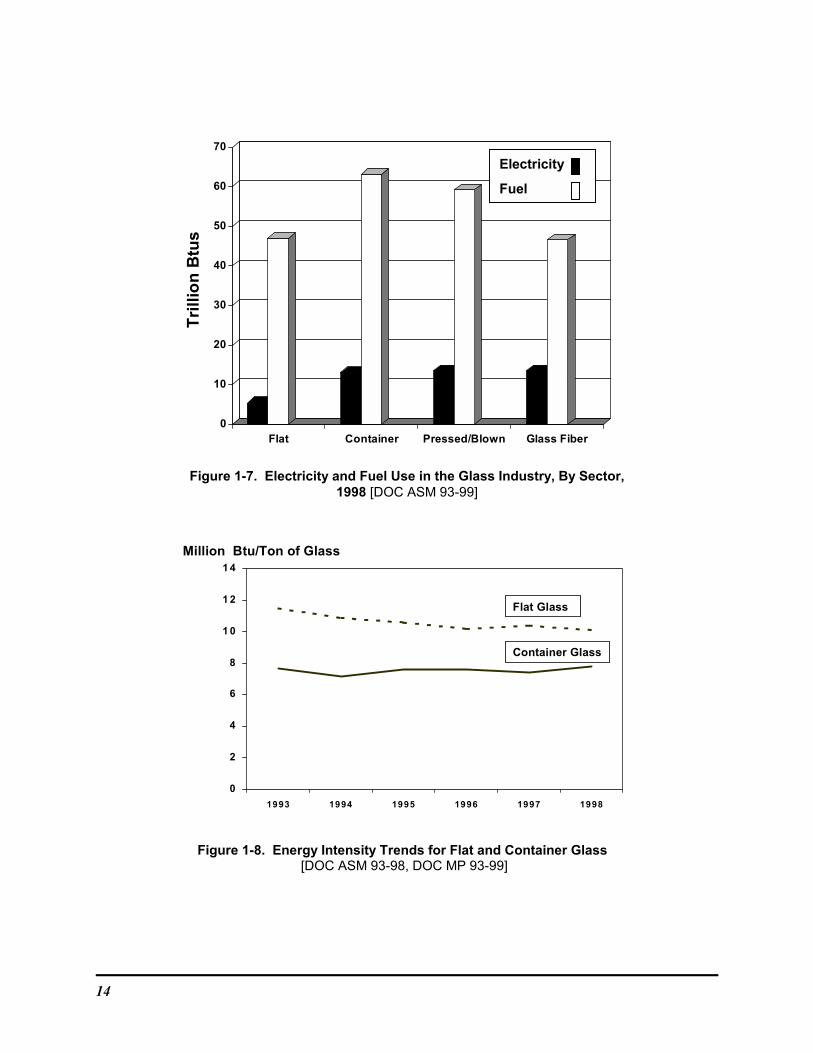
Figure 1-7 illustrates the energy consumedamong the four sectors in terms of electricityversus fuel use in 1998. The ratio of fuel use toelectricity use is the highest for the flat glassindustry, while the other sectors are relativelysimilar in consumption patterns.
Significant progress has been made in reducingenergy intensity in some areas of the glassindustry over the last ten years (see Figure 1-8). This increase in efficiency has been
accomplished mostly through improved processcontrol systems, the development and use ofadvanced refractory materials, and technologiessuch as oxy-fuel firing and electric boost whichincrease production capacity. Advancedtechnology has reduced the fuel consumed perton of glass melted by 25 percent since the early1980's. Energy use has declined in the fiberglass sector by 30 percent since 1978 [Vision1996].
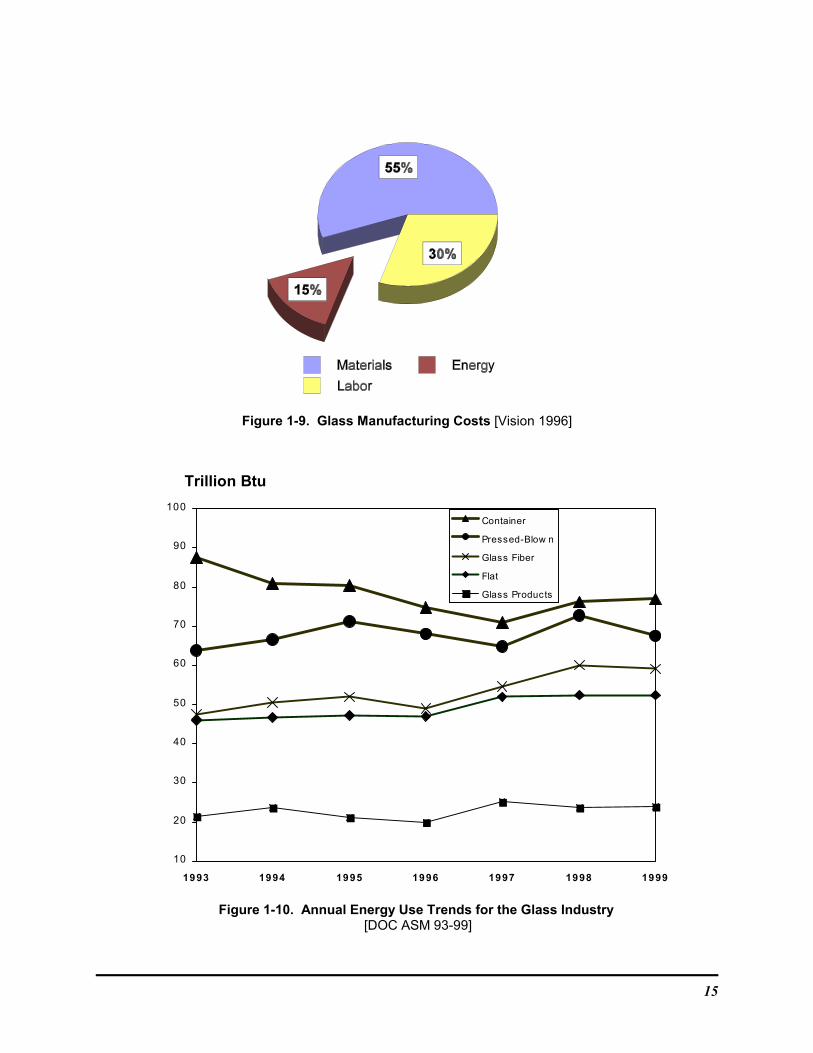
Although they vary between the glass sectors,energy costs on average account for about 15percent of the total manufacturing costs forglass (see Figure 1-9) [Vision 1996]. Thepressed and blown, or specialty glass sectorexhibits the highest average energy consumptionper ton of glass, which reflects the inefficienciesof the small-scale furnaces that are characteristicof this sector. The lowest per unit energyconsumption is generally found in container andflat glass sectors, where larger furnace sizes andautomation contribute to increased efficiency. Less stringent quality requirements are also afactor in lower energy use per unit in containermanufacturing plants.
Trends in annual industry energy consumptionin general reflect fluctuations in markets anddemand (see Figure 1-10). Markets (and totalannual energy use) for flat and fiber glass haveremained relatively stable, with growth ratesabout the same as GDP. Container glass andpressed and blown glass have experiencedsignificant dips and gains. Container glass hasbeen challenged with strong competitivepressures from alternative materials, while thepressed and blown glass sector has fluctuatedwith the introduction of new products inelectronics and other markets.
The glass industry relies on electricity andnatural gas to supply the bulk of its energyneeds. Glass melting consumes the most energyof all the production processes, and isaccomplished using natural gas, a combinationof natural gas and electricity (electric boost), orall electricity.
Changes to the Manufacturing EnergyConsumption Survey
The 1994 MECS includes the four glass segmentscovered in this report: flat, container, specialty, andmineral wool. It did not include glass made frompurchased glass rather than raw materials. For1998, the MECS was changed and no longerbreaks out energy use for these sectors. Mineralwool (glass insulation) is no longer separated, andis aggregated into mineral products. Glass that isproduced from purchased glass (not manufacturedfrom raw materials) is now included in a single glasscategory along with flat, container and specialtyglass.
13
Table 1-6. U.S. Glass Industry Energy Use, MECS Estimates (Trillion Btu)
Sector
1994b 1998c
Purchased
Electricity Fuels
NetEnergy
Use Lossesa
TotalEnergy
Use
Purchased
Electricity Fuels
NetEnergy
Use Lossesa
TotalEnergy
Use
Flat 5 47 52 10.4 62.4 - - - - -
Container 15 68 83 31.2 114.2 - - - - -
Pressed/Blown 11 52 63 22.9 85.9 - - - - -
MineralWool 12 39 51 24.9 75.9 - - - - -
INDUSTRYTOTAL 43 206 249 89.4 338.4 42 164 206 87 293
a Electricity losses incurred during the generation, transmission, and distribution of electricity based on a conversion factor of10,500 Btu/kilowatt-hour.
b The 1994 survey does not include a separate category for products made from purchased glass.c The 1998 survey no longer provides data at 6-digit NAICS levels for the glass industry; data shown is the total for NAICS
3272, which does not include mineral wool, but does include products made from purchased glass. Sources: MECS 1994, 1998.
Table 1-7. U.S. Glass Industry Energy Usea, 1993-1999, ASM Estimates(Trillion Btu)
YearPurchasedElectricityb Fuelsc
Net EnergyUse Lossesd
Total EnergyUse
1999 55.6 224.3 279.9 115.4 395.3
1998 54.7 222.7 277.4 113.6 391.0
1997 52.8 201.3 254.1 109.7 363.8
1996 51.9 200.6 252.5 107.9 360.4
1995 50.8 214.9 265.7 105.6 371.3
1994 50.3 211.2 261.5 104.4 365.9
1993 49.2 210.4 259.6 102.2 361.8
a Total for NAICS 3272 (flat, container, pressed/blown, products from purchased glass) plus NAICS 327993 (mineral wool).b Does not consider electricity generated and sold offsite.c Calculated based on annual cost of purchased fuels, using average national natural gas prices paid by the industrial sector for
each year.d Electricity losses incurred during the generation, transmission, and distribution of electricity based on a conversion factor of
10,500 Btu/kilowatt-hour.Source: DOC ASM 93-99, DOE 2000.
14
0
10
20
30
40
50
60
70
Flat Container Pressed/Blown Glass Fiber
Tri
llio
n B
tus
Electricity
Fuel
Figure 1-7. Electricity and Fuel Use in the Glass Industry, By Sector,1998 [DOC ASM 93-99]
0
2
4
6
8
1 0
1 2
1 4
1993 1994 1995 1996 1997 1998
Million Btu/Ton of Glass
Container Glass
Flat Glass
Figure 1-8. Energy Intensity Trends for Flat and Container Glass [DOC ASM 93-98, DOC MP 93-99]
15
Figure 1-9. Glass Manufacturing Costs [Vision 1996]
10
20
30
40
50
60
70
80
90
100
1993 1994 1995 1996 1997 1998 1999
Container
Pressed-Blow n
Glass Fiber
Flat
Glass Products
Trillion Btu
Figure 1-10. Annual Energy Use Trends for the Glass Industry [DOC ASM 93-99]
16
Table 1-8. Unit Energy Consumption by Process Area, 1994
Process Area Net Electricity Residual Fuel Oil Natural Gas Other
Total Inputs 17.3% 1.6% 79.5% 0.8%
Indirect Uses -Boiler Fuel 0.0% W 1.6% –
Direct Uses - TotalProcess 14.9% 1.6% 74.7% –
Process Heating 7.2% 1.6% 59.4% –
Process Coolingand Refrigeration 0.4% 0.0% 0.0% –
Machine Drive 7.6% 0.0% 0.8% –
Direct Uses - TotalNonprocess 1.6% 0.0% 2.8%
–
Facility Heating, Ventilation, andAir Conditioning 0.4% 0.0% 2.8%
–
Facility Lighting 0.8% – – –
Facility Support 0 0 0 –
Source: MECS 1994W = data withheld to avoid disclosing individual company information.
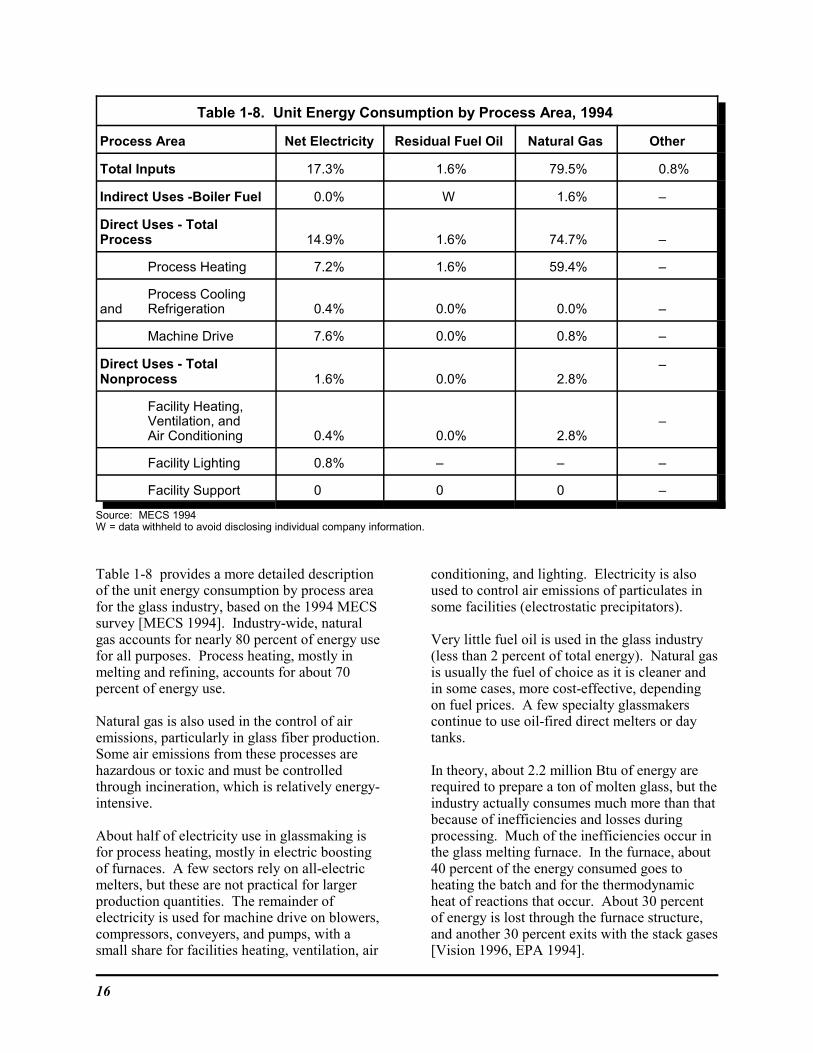
Table 1-8 provides a more detailed descriptionof the unit energy consumption by process areafor the glass industry, based on the 1994 MECSsurvey [MECS 1994]. Industry-wide, naturalgas accounts for nearly 80 percent of energy usefor all purposes. Process heating, mostly inmelting and refining, accounts for about 70percent of energy use.
Natural gas is also used in the control of airemissions, particularly in glass fiber production. Some air emissions from these processes arehazardous or toxic and must be controlledthrough incineration, which is relatively energy-intensive.
About half of electricity use in glassmaking isfor process heating, mostly in electric boostingof furnaces. A few sectors rely on all-electricmelters, but these are not practical for largerproduction quantities. The remainder ofelectricity is used for machine drive on blowers,compressors, conveyers, and pumps, with asmall share for facilities heating, ventilation, air
conditioning, and lighting. Electricity is alsoused to control air emissions of particulates insome facilities (electrostatic precipitators).
Very little fuel oil is used in the glass industry(less than 2 percent of total energy). Natural gasis usually the fuel of choice as it is cleaner andin some cases, more cost-effective, dependingon fuel prices. A few specialty glassmakerscontinue to use oil-fired direct melters or daytanks.
In theory, about 2.2 million Btu of energy arerequired to prepare a ton of molten glass, but theindustry actually consumes much more than thatbecause of inefficiencies and losses duringprocessing. Much of the inefficiencies occur inthe glass melting furnace. In the furnace, about40 percent of the energy consumed goes toheating the batch and for the thermodynamicheat of reactions that occur. About 30 percentof energy is lost through the furnace structure,and another 30 percent exits with the stack gases[Vision 1996, EPA 1994].
17
Regenerative gas furnaces exhibit much higherefficiencies than pot furnaces, day tanks, ordirect melters. All-electric melters are the mostefficient, but the high cost of electricity limitstheir use in larger production applications.
Instead, larger producers often use electricboosting on furnaces to increase efficiency andyields. Cullet preheating and oxy-fuel firing canalso reduce energy requirements and increaseefficiency (see Chapter 4 for more detail onfurnace technologies).
1.4 Environmental Overview
The Glass Industry is Working to ReducePollution and Improve EnvironmentalPerformance
Over the last decade the glass industry has madesignificant advances in protecting theenvironment as well as the health and safety ofits workers. The industry participates innumerous voluntary pollution prevention effortsincluding the 33/50 program, Green Lights andEnergy Star programs. EPA’s 33/50 programaims to reduce toxic chemical releases andtransfers of 17 chemicals by 50% from 1995levels. According to EPA, nearly a third of thecompanies in SIC code 32 (includes stone, clayand glass) participate in this program. Manyspecialty glass manufacturers participate inEPA’s Green Lights and Energy Star Programsas ‘Allies’ or providers of energy-efficientproducts.
In light of the problems arising from asbestosinsulating products, the fiber glass industry hascommitted tens of millions of dollars to humanhealth and safety research on fiber glass. Over60 years of studies by the industry have shownthat exposures are low during manufacture,installation, use and removal, and thatmanufacturing workers are not at risk [NAIMA1998]. In 1999 the major trade association ofthe industry (North American InsulationManufacturers Association—NAIMA) joinedwith OSHA and key insulation contractororganizations to announce the creation of theHealth and Safety Partnership Program (HSPP)for fiber glass, rock wool and slag wool. Theprogram promotes work practices and trainingendorsed by OSHA [NAIMA 2000].
The industry has also begun to participate in therulemaking process with EPA. An example isthe recently promulgated NESHAP (NationalEmission Standards for Hazardous AirPollutants) ruling for the glass insulationindustry, which is based on the participation often fiber glass plants in emissions tests.
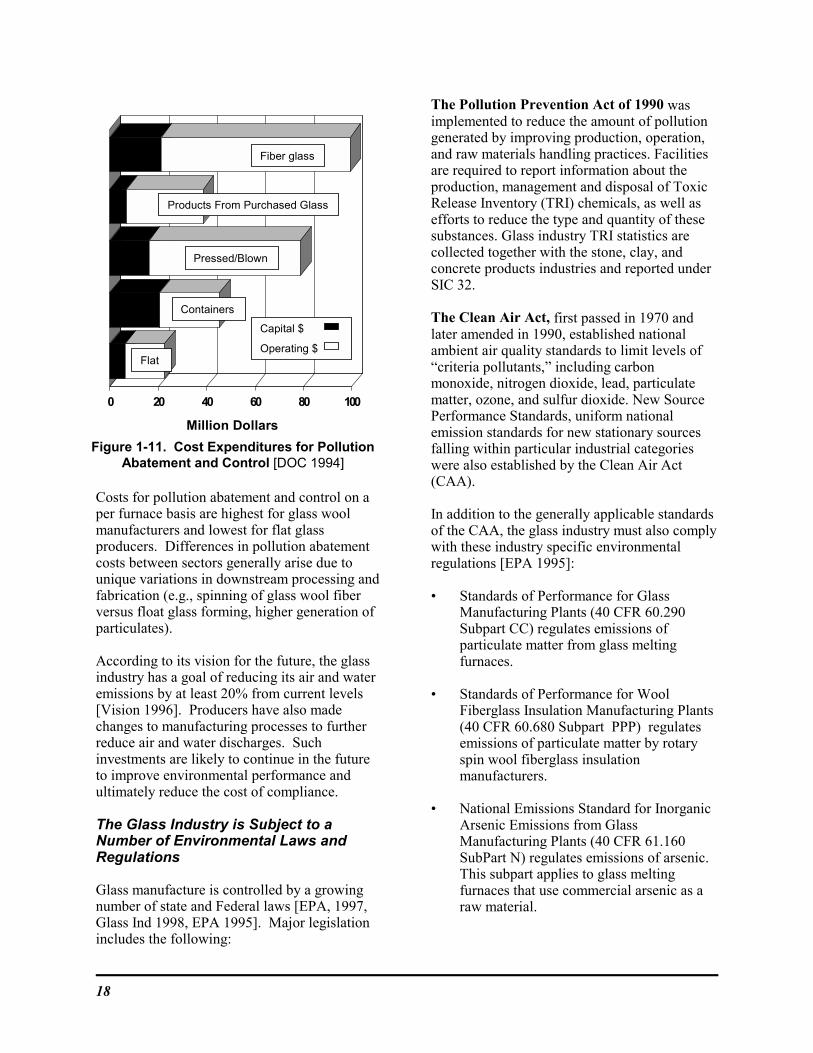
In 1994, the most recent year for which data isavailable, the glass industry spent approximately$250 million on pollution abatement and control[DOC 1994]. These expenditures include thecost of capital equipment as well as annualoperating costs for labor, material, energy, andsupplies (see Figure 1-11). Capital equipmentfor control of air emissions accounts for the bulkof pollution abatement capital expenditures inmost glass sectors. Operating costs account forabout 74 percent of pollution abatement andcontrol expenditures. In most sectors of theglass industry, notably container glass, glasswool, and specialty glass, fuel and electricitycosts account for a significant portion ofpollution controls costs (from 19 to 40 percent). Energy is primarily expended for control ofparticulates as well as volatile emissions ofhazardous or toxic components, which must bedestroyed in incinerators.
Theoretical Energy Requirements for Glass
Stoichiometric 0.6 106 Btu/tonChemical Requirements
Sensible Heat - 1.6 106 Btu/tonBringing Batch to 2800EF
TOTAL 2.2 106 Btu/ton
18
0 20 40 60 80 100
Fiber glass
Capital $
Operating $
Million Dollars
Pressed/Blown
Products From Purchased Glass
Containers
Flat
Figure 1-11. Cost Expenditures for PollutionAbatement and Control [DOC 1994]
Costs for pollution abatement and control on aper furnace basis are highest for glass woolmanufacturers and lowest for flat glassproducers. Differences in pollution abatementcosts between sectors generally arise due tounique variations in downstream processing andfabrication (e.g., spinning of glass wool fiberversus float glass forming, higher generation ofparticulates).
According to its vision for the future, the glassindustry has a goal of reducing its air and wateremissions by at least 20% from current levels[Vision 1996]. Producers have also madechanges to manufacturing processes to furtherreduce air and water discharges. Suchinvestments are likely to continue in the futureto improve environmental performance andultimately reduce the cost of compliance.
The Glass Industry is Subject to aNumber of Environmental Laws andRegulations
Glass manufacture is controlled by a growingnumber of state and Federal laws [EPA, 1997,Glass Ind 1998, EPA 1995]. Major legislationincludes the following:
The Pollution Prevention Act of 1990 wasimplemented to reduce the amount of pollutiongenerated by improving production, operation,and raw materials handling practices. Facilitiesare required to report information about theproduction, management and disposal of ToxicRelease Inventory (TRI) chemicals, as well asefforts to reduce the type and quantity of thesesubstances. Glass industry TRI statistics arecollected together with the stone, clay, andconcrete products industries and reported underSIC 32.
The Clean Air Act, first passed in 1970 andlater amended in 1990, established nationalambient air quality standards to limit levels of“criteria pollutants,” including carbonmonoxide, nitrogen dioxide, lead, particulatematter, ozone, and sulfur dioxide. New SourcePerformance Standards, uniform nationalemission standards for new stationary sourcesfalling within particular industrial categorieswere also established by the Clean Air Act(CAA).
In addition to the generally applicable standardsof the CAA, the glass industry must also complywith these industry specific environmentalregulations [EPA 1995]:
• Standards of Performance for GlassManufacturing Plants (40 CFR 60.290Subpart CC) regulates emissions ofparticulate matter from glass meltingfurnaces.
• Standards of Performance for WoolFiberglass Insulation Manufacturing Plants(40 CFR 60.680 Subpart PPP) regulatesemissions of particulate matter by rotaryspin wool fiberglass insulationmanufacturers.
• National Emissions Standard for InorganicArsenic Emissions from GlassManufacturing Plants (40 CFR 61.160SubPart N) regulates emissions of arsenic.This subpart applies to glass meltingfurnaces that use commercial arsenic as araw material.
19
• National Emissions Standards forHazardous Air Pollutants (NESHAP) forSource Categories for Wool FiberglassManufacturing (40 CFR, Part 63) regulatesemissions of three metals (arsenic,chromium and lead) and three organichazardous air pollutants (formaldehyde,phenol, and methanol).
The Clean Water Act (CWA) regulates theamount of chemicals and toxins released byindustries via direct and indirectwastewater/effluent discharges. Pollutants areclassified as “priority” pollutants which includevarious toxic substances; “conventional”pollutants, such as biochemical oxygen demand,total suspended solids, fecal coliform, oil andgrease, and pH; and “non-conventional”pollutants which are substances that do not fallunder the “priority” or “conventional”classifications. Direct (point source) andindirect discharges are regulated by the NationalPollutant Discharge Elimination System(NDPES) program.
The Toxic Substances Control Act (TSCA) of1976 supplements the Clean Air Act and theToxic Release Inventory, giving the EPA theability to track chemicals produced or importedinto the United States. Also included in EPA’schemical tracking are chemicals underdevelopment. EPA has the authority to requiretesting of all chemicals (at any point during achemical’s life cycle) that pose anenvironmental or human risk, and ban those thatare deemed unreasonably risky.
The Resource Conservation and RecoveryAct (RCRA) was passed in 1976 as anamendment to the Solid Waste Disposal Act tocontrol hazardous waste from the “cradle-to-grave.” Management includes generation,transportation, treatment, storage, and disposalof hazardous waste. Although RCRA is a federalstandard, the requirements are not industryspecific, and enforcement is typically handledby the state.
The RCRA standards which are of most concernto the glass industry include:
• Land Disposal Restrictions (LDR) whichrequire treatment of solvents, heavy metalsand acids prior to land disposal (40 CFR268).
• Used Oil Management Standards whichimpose requirements affecting the storage,transportation, burning, processing, andrefining of used oil (40 CFR Part 279).
• Provisions requiring VOC generators totest, inspect, and monitor the waste storedin containers to ensure that they meetemission standards (40 CFR Part 264-265,SubPart CC).
• Restrictions, performance standards andemissions monitoring on companies thatuse boilers or furnaces to burn hazardouswaste (e.g., incinerators) (40 CFR Part 266,SubPart H).
Air Emissions Are Generated in Meltingand Finishing Processes
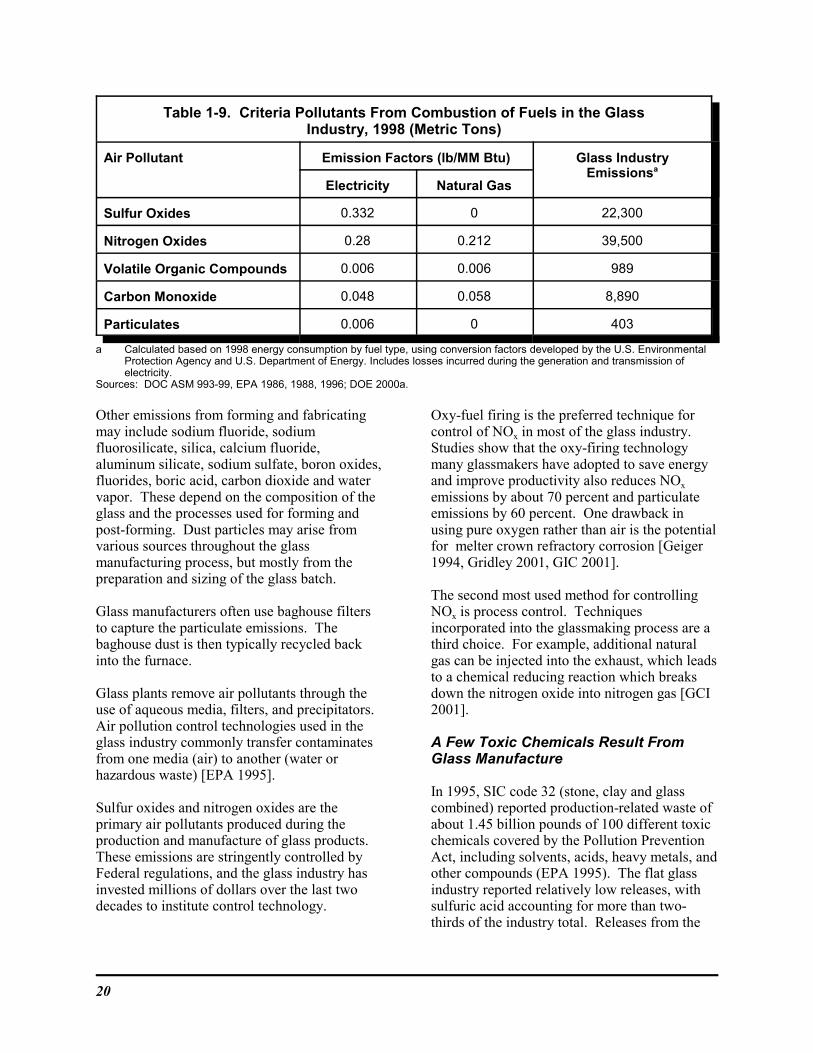
Melting raw materials and combustion productscreated by producing glass generate airemissions consisting of particulates, nitrogenoxides, and sulfur oxides. Emissions are alsogenerated during the forming and finishing ofglass products as a result of thermaldecomposition of lubricants, binders andcoatings. Table 1-9 summarizes the combustionair emissions from glass manufacturing, alongwith the emission factors used for estimatingemissions.
Major Environmental Legislation Affectingthe Glass Industry
• Clean Air Act and Amendments (CAA)• Clean Water Act (CWA)• Toxic Substances Control Act (TSCA)• Resource Conservation and Recovery Act
(RCRA)
20
Table 1-9. Criteria Pollutants From Combustion of Fuels in the GlassIndustry, 1998 (Metric Tons)
Air Pollutant Emission Factors (lb/MM Btu) Glass IndustryEmissionsa
Electricity Natural Gas
Sulfur Oxides 0.332 0 22,300
Nitrogen Oxides 0.28 0.212 39,500
Volatile Organic Compounds 0.006 0.006 989
Carbon Monoxide 0.048 0.058 8,890
Particulates 0.006 0 403
a Calculated based on 1998 energy consumption by fuel type, using conversion factors developed by the U.S. EnvironmentalProtection Agency and U.S. Department of Energy. Includes losses incurred during the generation and transmission ofelectricity.
Sources: DOC ASM 993-99, EPA 1986, 1988, 1996; DOE 2000a.
Other emissions from forming and fabricatingmay include sodium fluoride, sodiumfluorosilicate, silica, calcium fluoride,aluminum silicate, sodium sulfate, boron oxides,fluorides, boric acid, carbon dioxide and watervapor. These depend on the composition of theglass and the processes used for forming andpost-forming. Dust particles may arise fromvarious sources throughout the glassmanufacturing process, but mostly from thepreparation and sizing of the glass batch.
Glass manufacturers often use baghouse filtersto capture the particulate emissions. Thebaghouse dust is then typically recycled backinto the furnace.
Glass plants remove air pollutants through theuse of aqueous media, filters, and precipitators. Air pollution control technologies used in theglass industry commonly transfer contaminatesfrom one media (air) to another (water orhazardous waste) [EPA 1995].
Sulfur oxides and nitrogen oxides are theprimary air pollutants produced during theproduction and manufacture of glass products.These emissions are stringently controlled byFederal regulations, and the glass industry hasinvested millions of dollars over the last twodecades to institute control technology.
Oxy-fuel firing is the preferred technique forcontrol of NOx in most of the glass industry.Studies show that the oxy-firing technologymany glassmakers have adopted to save energyand improve productivity also reduces NOx
emissions by about 70 percent and particulateemissions by 60 percent. One drawback inusing pure oxygen rather than air is the potentialfor melter crown refractory corrosion [Geiger1994, Gridley 2001, GIC 2001].
The second most used method for controllingNOx is process control. Techniquesincorporated into the glassmaking process are athird choice. For example, additional naturalgas can be injected into the exhaust, which leadsto a chemical reducing reaction which breaksdown the nitrogen oxide into nitrogen gas [GCI2001].
A Few Toxic Chemicals Result FromGlass Manufacture
In 1995, SIC code 32 (stone, clay and glasscombined) reported production-related waste ofabout 1.45 billion pounds of 100 different toxicchemicals covered by the Pollution PreventionAct, including solvents, acids, heavy metals, andother compounds (EPA 1995). The flat glassindustry reported relatively low releases, withsulfuric acid accounting for more than two-thirds of the industry total. Releases from the
21
fiberglass industry included significant amountsof acids, heavy metals, and solvents.
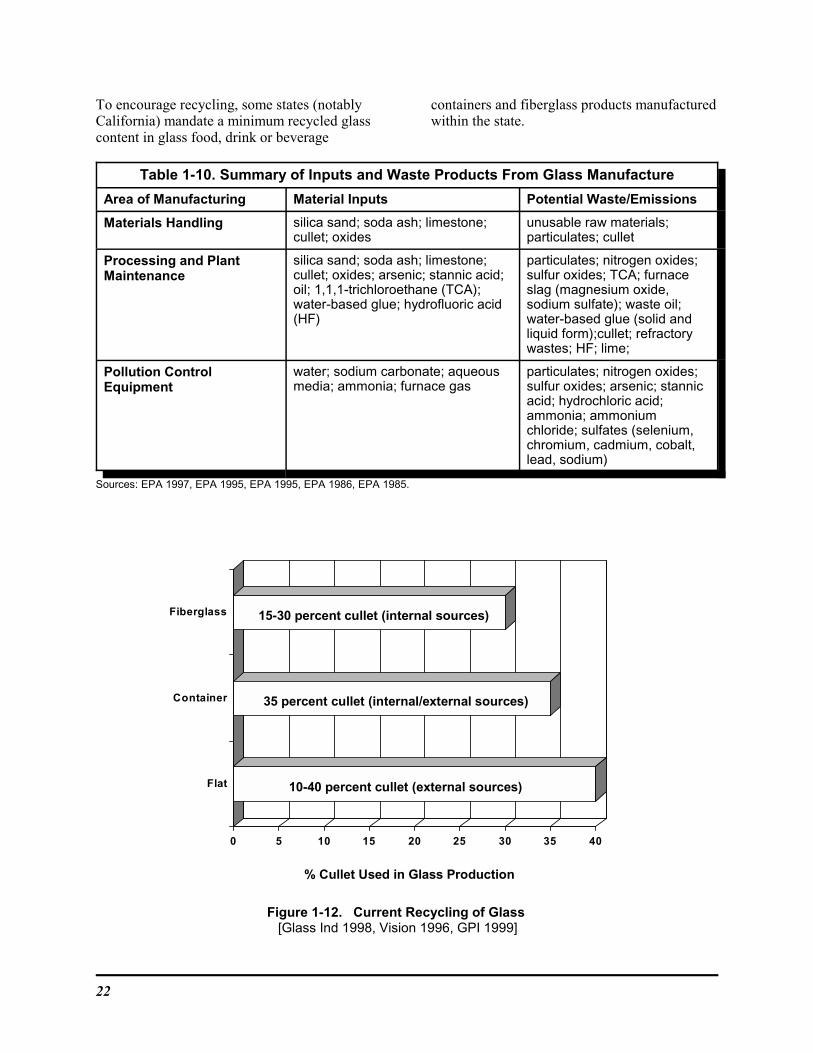
Solid and Liquid Wastes Result FromProcessing and Maintenance
Waste generated in the glass industry can becategorized into the following three groups:
• materials handling waste• pollution control equipment waste• plant maintenance waste.
Materials handling waste includes the wastegenerated during the receiving and transfer ofraw materials at the facility for storage orprocessing, including raw materials that arerendered unusable when spilled during receivingand transfer.
Emissions control equipment at glassmanufacturing plants generates waste residuesfrom pollutants produced or captured during themelting, forming, and finishing steps. Thesemay be hazardous or non-hazardous, dependingon the process and type of glass.
Glass plant maintenance wastes include wasteoil and solvents generated in the formingprocess, furnace slag, and refractory wastes.
Furnace dust, grinding and polishing sludge, andrefractory rubble from the demolition of glassfurnaces may contain metals and other unsafematerials [Geiger 1993]. During the formingprocess, oil is used in the forming machines andoften contaminates the water that keeps themachines cool. Water-based glue for packagingis another example. Table 1-10 depicts specificpollutants for each of the key areas mentioned. Most of the industry’s waste is managed on sitevia recycling, energy recovery, or treatment.
The remaining waste is treated and released tothe environment through direct discharges to air,land, and water, underground injection or off-site disposal.
Increasingly, companies are recycling dust andother materials back into the furnaces. Particle-size distribution, chemical composition, andcompaction behavior must be known for proper
handling of these wastes. One company hasdeveloped an economic and environmentallysound system to turn the fine powder into pelletsto be returned to the furnaces [Geiger 1994].
Glass Recycling is on the Rise
One of the most important properties of glass isthat it can, in theory, be recycled an indefiniteamount of times without any loss of quality. Mixing recycled glass (commonly referred to ascullet) with the glass batch has a number ofbenefits, including reduced costs for processingand raw materials, lower energy use, and areduction in waste going to landfills. In 1998,one study estimated that glass recycling saved$60 million in energy costs and $100 million indisposal costs [EPA 1998]. However, toeffectively recycle glass waste products, theymust consist only of glass and be separated fromcontaminants such as ceramics and metals whichcan reduce the quality of new glass products.
Volumes of post-consumer glass cullet arerising, and manufacturers are steadily increasingthe amount of cullet used. Recyclers are alsomoving increasingly toward mixed recyclingsystems. Commingling of waste makes it moredifficult to cleanly separate glass from otherrecycled materials and minimize contamination. To increase recycling rates, glass producersneed better color sorting and ceramic detectiontechnology for post-consumer glass [Glass Ind2000, GPI 1999, Ind Min 1998].
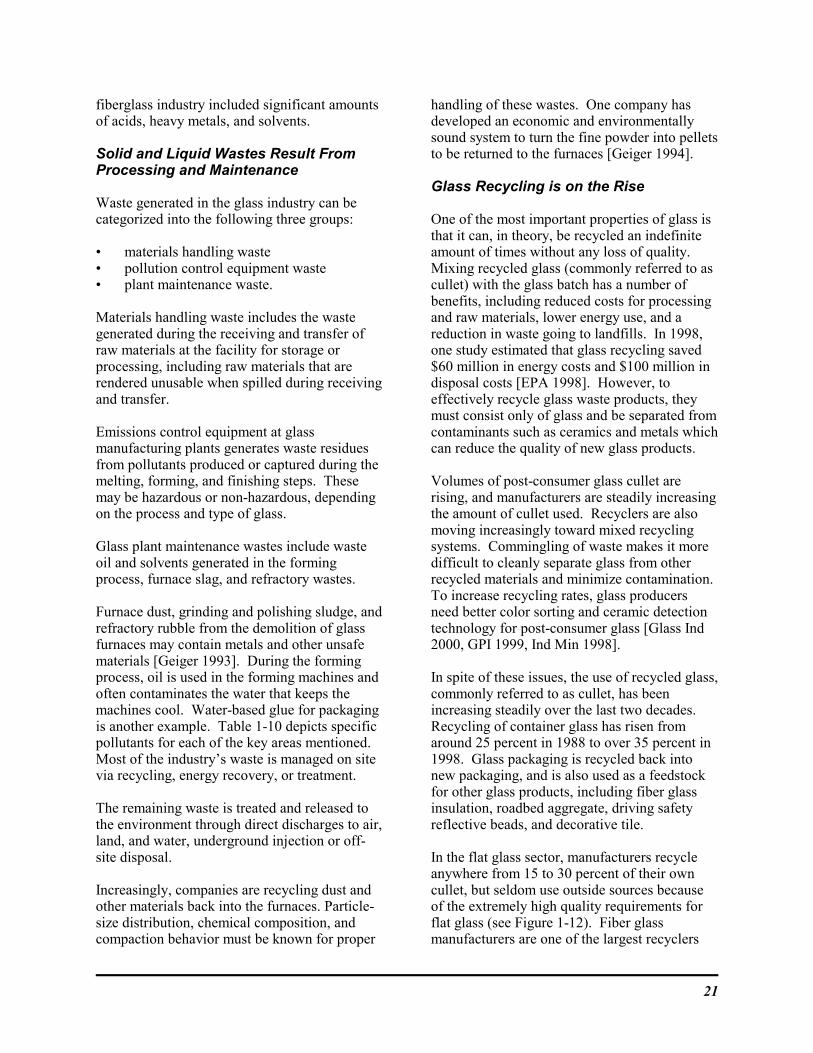
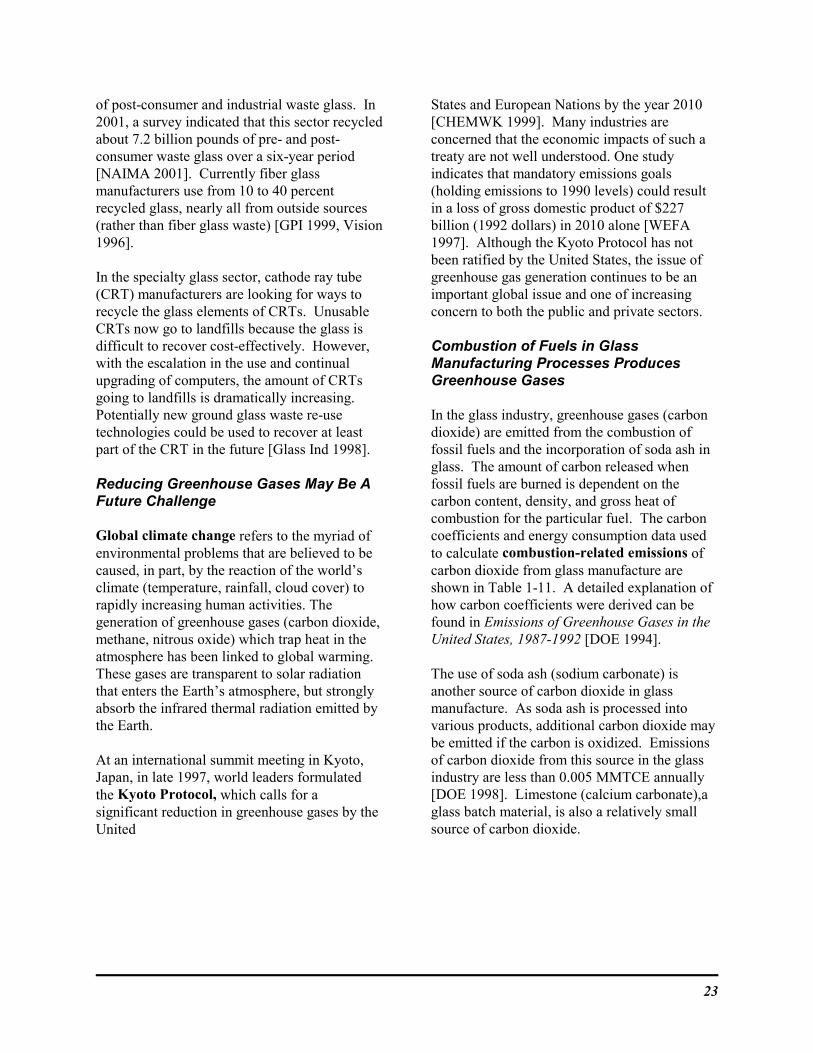
In spite of these issues, the use of recycled glass,commonly referred to as cullet, has beenincreasing steadily over the last two decades. Recycling of container glass has risen fromaround 25 percent in 1988 to over 35 percent in1998. Glass packaging is recycled back intonew packaging, and is also used as a feedstockfor other glass products, including fiber glassinsulation, roadbed aggregate, driving safetyreflective beads, and decorative tile.
In the flat glass sector, manufacturers recycleanywhere from 15 to 30 percent of their owncullet, but seldom use outside sources becauseof the extremely high quality requirements forflat glass (see Figure 1-12). Fiber glassmanufacturers are one of the largest recyclers
22
0 5 10 15 20 25 30 35 40
Flat
Container
Fiberglass
10-40 percent cullet (external sources)
35 percent cullet (internal/external sources)
15-30 percent cullet (internal sources)
% Cullet Used in Glass Production
Figure 1-12. Current Recycling of Glass [Glass Ind 1998, Vision 1996, GPI 1999]
To encourage recycling, some states (notablyCalifornia) mandate a minimum recycled glasscontent in glass food, drink or beverage
containers and fiberglass products manufacturedwithin the state.
Table 1-10. Summary of Inputs and Waste Products From Glass Manufacture
Area of Manufacturing Material Inputs Potential Waste/Emissions
Materials Handling silica sand; soda ash; limestone;cullet; oxides
unusable raw materials;particulates; cullet
Processing and PlantMaintenance
silica sand; soda ash; limestone;cullet; oxides; arsenic; stannic acid;oil; 1,1,1-trichloroethane (TCA);water-based glue; hydrofluoric acid(HF)
particulates; nitrogen oxides;sulfur oxides; TCA; furnaceslag (magnesium oxide,sodium sulfate); waste oil;water-based glue (solid andliquid form);cullet; refractorywastes; HF; lime;
Pollution ControlEquipment
water; sodium carbonate; aqueousmedia; ammonia; furnace gas
particulates; nitrogen oxides;sulfur oxides; arsenic; stannicacid; hydrochloric acid;ammonia; ammoniumchloride; sulfates (selenium,chromium, cadmium, cobalt,lead, sodium)
Sources: EPA 1997, EPA 1995, EPA 1995, EPA 1986, EPA 1985.
23
of post-consumer and industrial waste glass. In2001, a survey indicated that this sector recycledabout 7.2 billion pounds of pre- and post-consumer waste glass over a six-year period[NAIMA 2001]. Currently fiber glassmanufacturers use from 10 to 40 percentrecycled glass, nearly all from outside sources(rather than fiber glass waste) [GPI 1999, Vision1996].
In the specialty glass sector, cathode ray tube(CRT) manufacturers are looking for ways torecycle the glass elements of CRTs. UnusableCRTs now go to landfills because the glass isdifficult to recover cost-effectively. However,with the escalation in the use and continualupgrading of computers, the amount of CRTsgoing to landfills is dramatically increasing. Potentially new ground glass waste re-usetechnologies could be used to recover at leastpart of the CRT in the future [Glass Ind 1998].
Reducing Greenhouse Gases May Be AFuture Challenge
Global climate change refers to the myriad ofenvironmental problems that are believed to becaused, in part, by the reaction of the world’sclimate (temperature, rainfall, cloud cover) torapidly increasing human activities. Thegeneration of greenhouse gases (carbon dioxide,methane, nitrous oxide) which trap heat in theatmosphere has been linked to global warming. These gases are transparent to solar radiationthat enters the Earth’s atmosphere, but stronglyabsorb the infrared thermal radiation emitted bythe Earth.
At an international summit meeting in Kyoto,Japan, in late 1997, world leaders formulatedthe Kyoto Protocol, which calls for asignificant reduction in greenhouse gases by theUnited
States and European Nations by the year 2010[CHEMWK 1999]. Many industries areconcerned that the economic impacts of such atreaty are not well understood. One studyindicates that mandatory emissions goals(holding emissions to 1990 levels) could resultin a loss of gross domestic product of $227billion (1992 dollars) in 2010 alone [WEFA1997]. Although the Kyoto Protocol has notbeen ratified by the United States, the issue ofgreenhouse gas generation continues to be animportant global issue and one of increasingconcern to both the public and private sectors.
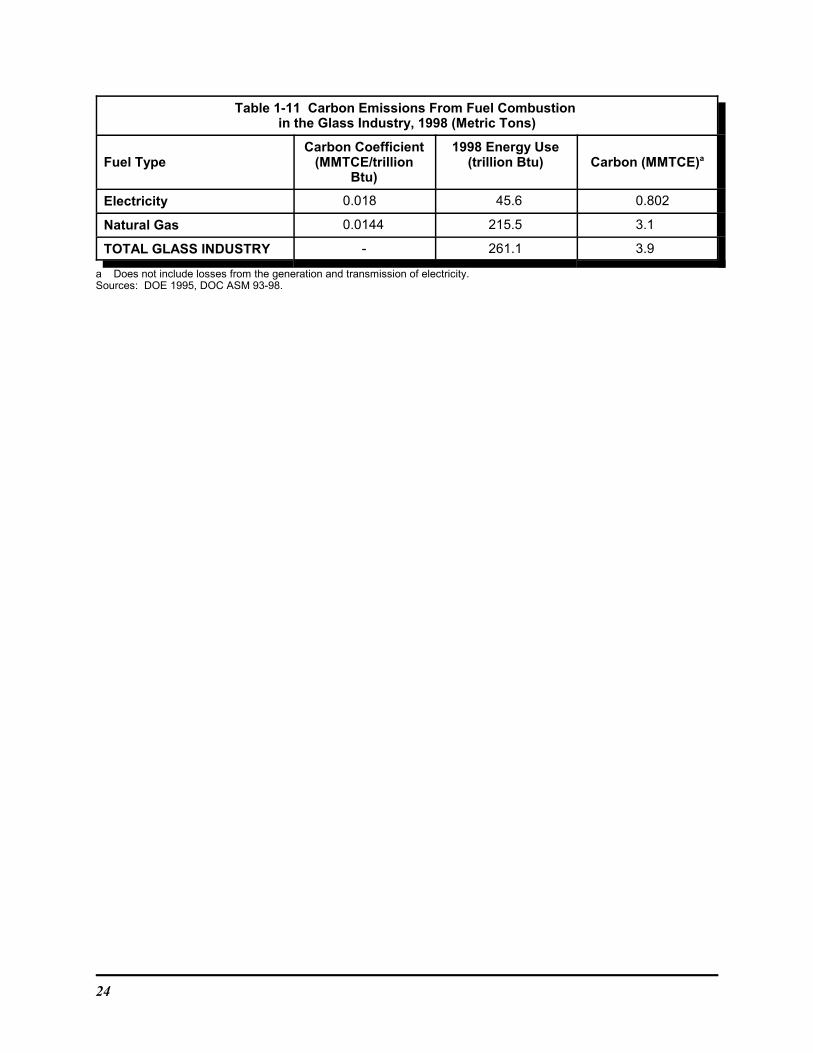
Combustion of Fuels in GlassManufacturing Processes ProducesGreenhouse Gases
In the glass industry, greenhouse gases (carbondioxide) are emitted from the combustion offossil fuels and the incorporation of soda ash inglass. The amount of carbon released whenfossil fuels are burned is dependent on thecarbon content, density, and gross heat ofcombustion for the particular fuel. The carboncoefficients and energy consumption data usedto calculate combustion-related emissions ofcarbon dioxide from glass manufacture areshown in Table 1-11. A detailed explanation ofhow carbon coefficients were derived can befound in Emissions of Greenhouse Gases in theUnited States, 1987-1992 [DOE 1994].
The use of soda ash (sodium carbonate) isanother source of carbon dioxide in glassmanufacture. As soda ash is processed intovarious products, additional carbon dioxide maybe emitted if the carbon is oxidized. Emissionsof carbon dioxide from this source in the glassindustry are less than 0.005 MMTCE annually[DOE 1998]. Limestone (calcium carbonate),aglass batch material, is also a relatively smallsource of carbon dioxide.
24
Table 1-11 Carbon Emissions From Fuel Combustion in the Glass Industry, 1998 (Metric Tons)
Fuel TypeCarbon Coefficient
(MMTCE/trillionBtu)
1998 Energy Use(trillion Btu) Carbon (MMTCE)a
Electricity 0.018 45.6 0.802
Natural Gas 0.0144 215.5 3.1
TOTAL GLASS INDUSTRY - 261.1 3.9
a Does not include losses from the generation and transmission of electricity. Sources: DOE 1995, DOC ASM 93-98.
25
2 GlassManufacturing
Processes
2.1 Overview of GlassManufacturing Processes
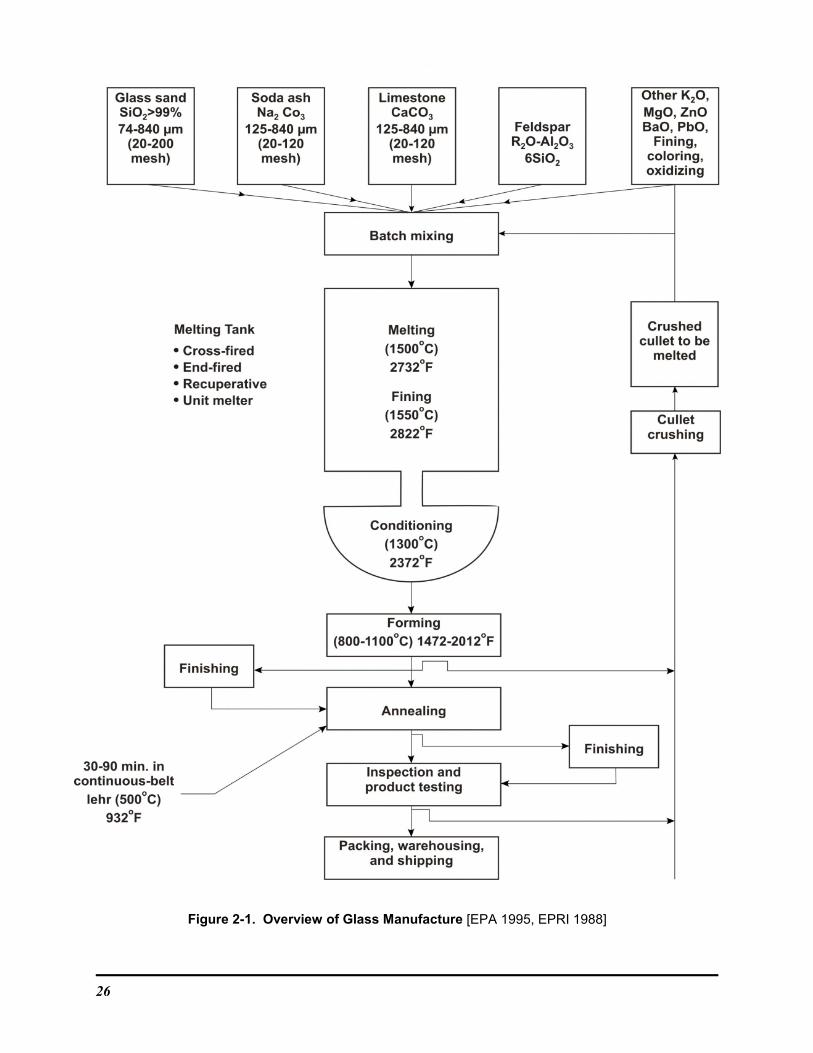
Major Processes Include BatchPreparation, Melting and Refining,Forming and Post-Forming
Glass manufacture, regardless of the finalproduct, requires four major processing steps:batch preparation, melting and refining,forming, and post forming. An overview of thegeneral flow of glass manufacture is illustratedin Figure 2-1.
Batch preparation is the step where the rawmaterials for glass are blended to achieve thedesired final glass product. While the maincomponents in glass are high-quality sand(silica), limestone, and soda ash, there are manyother components that can be added (seeChapter 3 for a full description of batchpreparation).
Once mixed the batch is charged to a meltingfurnace. Melting of the batch may beaccomplished in many different types and sizesof furnaces, depending upon the quantity andtype of glass to be produced. The melting step
is complete once the glass is free of anycrystalline materials.
Refining (often referred to as fining) is thecombined physical and chemical processoccurring in the melting chamber during whichthe batch and molten glass are freed of bubbles,homogenized, and heat conditioned. Meltingand refining are discussed in detail in Chapter 4.
After refining, the molten glass is sent toforming operations. Forming is the step inwhich the final product begins to take shape,and may involve casting, blow forming, sheetforming, fiberization, or other processes. Forming processes vary widely, depending onthe type of glass being manufactured. Detailson common forming processes are provided inChapter 5.
Some products require post-formingprocedures, and these vary widely dependingupon the product. These may include processeswhich alter the properties of the glass, such asannealing, tempering, laminating and coating. Chapter 6 provides details on both post-formingand product handling operations.
26
Figure 2-1. Overview of Glass Manufacture [EPA 1995, EPRI 1988]
27
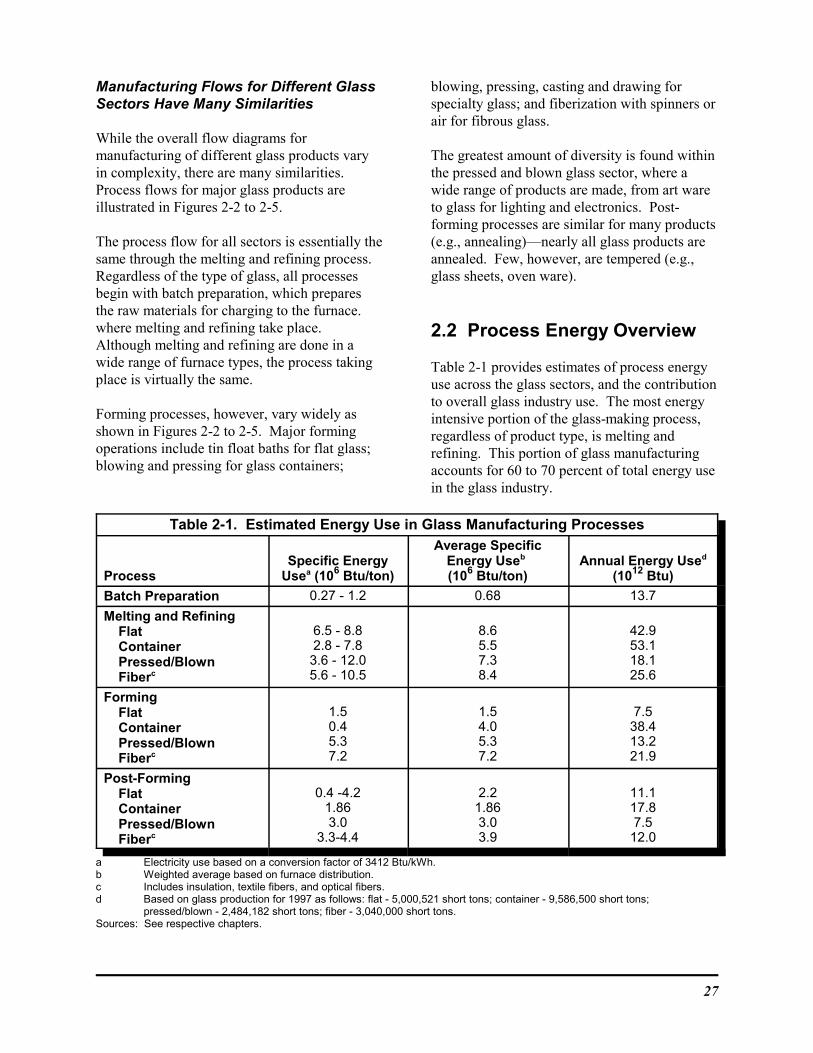
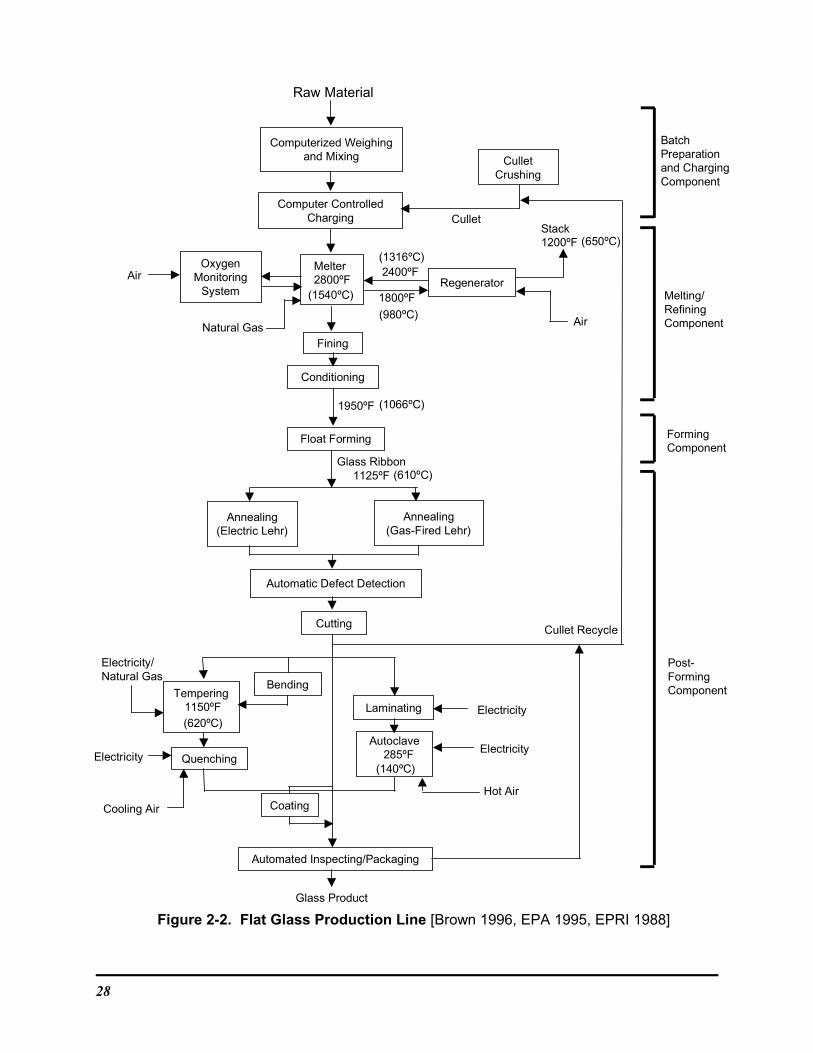
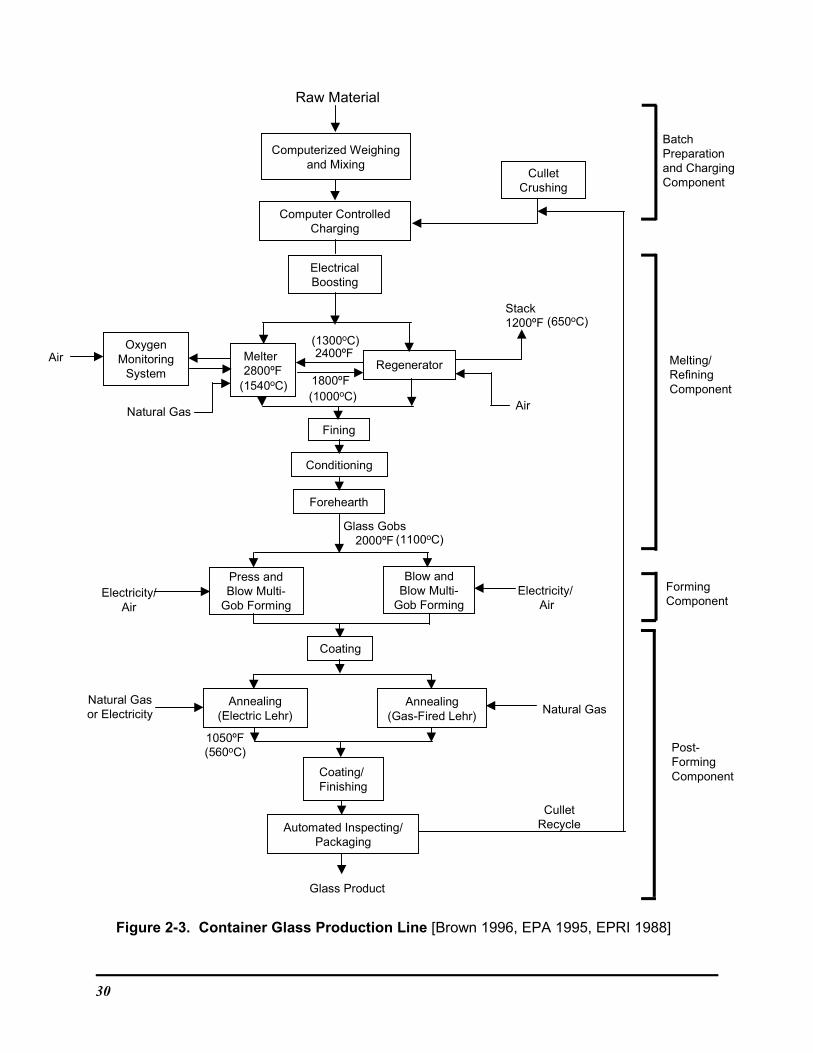
Manufacturing Flows for Different GlassSectors Have Many Similarities
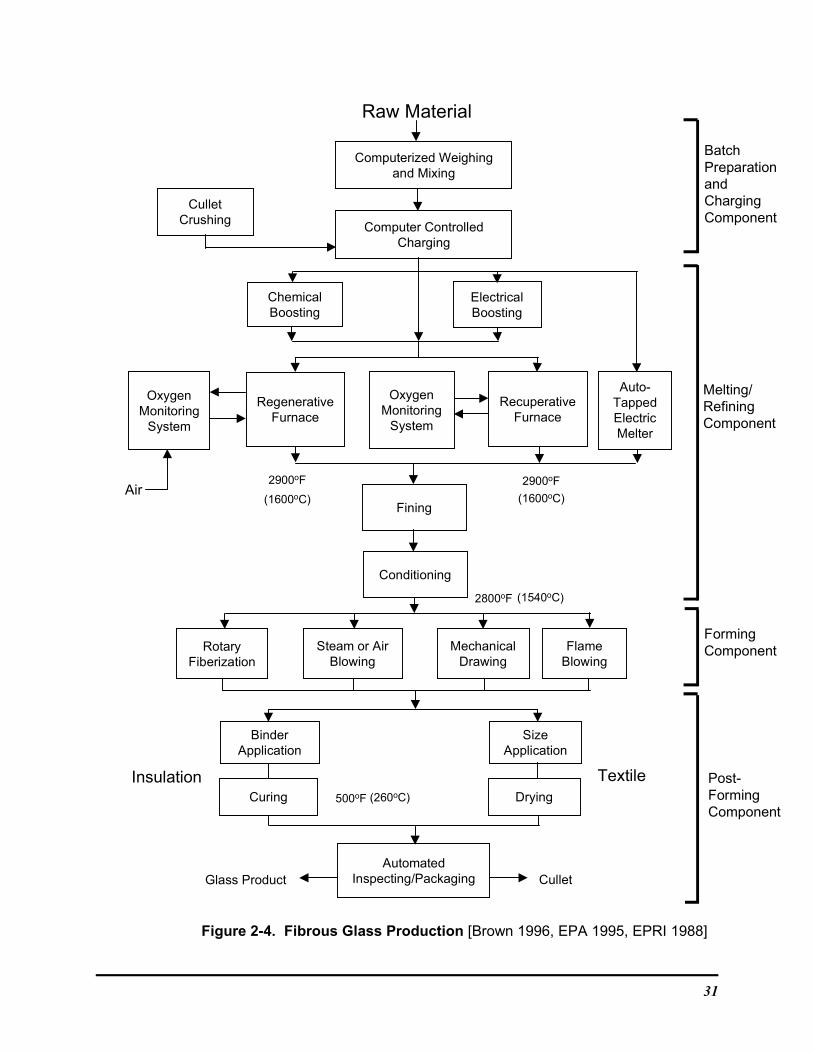
While the overall flow diagrams formanufacturing of different glass products varyin complexity, there are many similarities. Process flows for major glass products areillustrated in Figures 2-2 to 2-5.
The process flow for all sectors is essentially thesame through the melting and refining process. Regardless of the type of glass, all processesbegin with batch preparation, which preparesthe raw materials for charging to the furnace.where melting and refining take place. Although melting and refining are done in awide range of furnace types, the process takingplace is virtually the same.
Forming processes, however, vary widely asshown in Figures 2-2 to 2-5. Major formingoperations include tin float baths for flat glass;blowing and pressing for glass containers;
blowing, pressing, casting and drawing forspecialty glass; and fiberization with spinners orair for fibrous glass.
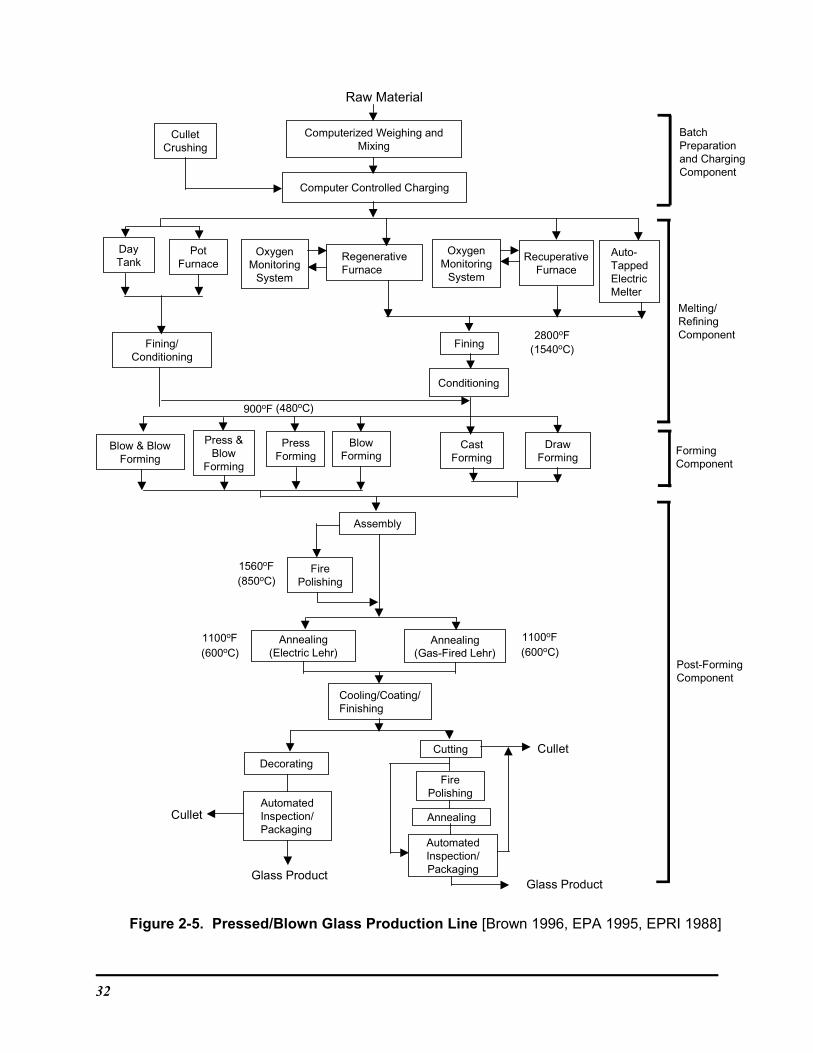
The greatest amount of diversity is found withinthe pressed and blown glass sector, where awide range of products are made, from art wareto glass for lighting and electronics. Post-forming processes are similar for many products(e.g., annealing)—nearly all glass products areannealed. Few, however, are tempered (e.g.,glass sheets, oven ware).
2.2 Process Energy Overview
Table 2-1 provides estimates of process energyuse across the glass sectors, and the contributionto overall glass industry use. The most energyintensive portion of the glass-making process,regardless of product type, is melting andrefining. This portion of glass manufacturingaccounts for 60 to 70 percent of total energy usein the glass industry.
Table 2-1. Estimated Energy Use in Glass Manufacturing Processes
ProcessSpecific Energy
Usea (106 Btu/ton)
Average SpecificEnergy Useb (106 Btu/ton)
Annual Energy Used
(1012 Btu)
Batch Preparation 0.27 - 1.2 0.68 13.7
Melting and Refining Flat Container Pressed/Blown Fiberc
6.5 - 8.82.8 - 7.83.6 - 12.05.6 - 10.5
8.65.57.38.4
42.953.118.125.6
Forming Flat Container Pressed/Blown Fiberc
1.50.45.37.2
1.54.05.37.2
7.538.413.221.9
Post-Forming Flat Container Pressed/Blown Fiberc
0.4 -4.21.863.0
3.3-4.4
2.21.863.03.9
11.117.87.5
12.0
a Electricity use based on a conversion factor of 3412 Btu/kWh.b Weighted average based on furnace distribution. c Includes insulation, textile fibers, and optical fibers.d Based on glass production for 1997 as follows: flat - 5,000,521 short tons; container - 9,586,500 short tons;
pressed/blown - 2,484,182 short tons; fiber - 3,040,000 short tons. Sources: See respective chapters.
28
Computerized Weighingand Mixing
Raw Material
CulletCrushing
Computer ControlledCharging
OxygenMonitoring
System
Melter2800ºF
Natural Gas
AirRegenerator
Stack1200ºF
Air
Fining
Conditioning
Annealing(Electric Lehr)
Annealing(Gas-Fired Lehr)
Float Forming
Glass Ribbon1125ºF
Automatic Defect Detection
Cullet
1800ºF
2400ºF
1950ºF
Cutting
Automated Inspecting/Packaging
Glass Product
Cullet Recycle
BendingTempering
1150ºF Laminating
Quenching
Autoclave285ºF
Coating
Electricity/Natural Gas
Electricity
Cooling Air
Electricity
Electricity
Hot Air
BatchPreparationand ChargingComponent
Melting/RefiningComponent
FormingComponent
Post-FormingComponent
(1316ºC)
(980ºC)
(650ºC)
(1540ºC)
(1066ºC)
(610ºC)
(620ºC)
(140ºC)
Figure 2-2. Flat Glass Production Line [Brown 1996, EPA 1995, EPRI 1988]

29
30
Computerized Weighingand Mixing
Raw Material
CulletCrushing
Computer ControlledCharging
ElectricalBoosting
OxygenMonitoring
System
Melter2800ºF
Natural Gas
AirRegenerator
Stack1200ºF
Air
Fining
Conditioning
Press andBlow Multi-
Gob Forming
Blow andBlow Multi-
Gob FormingElectricity/
Air
Electricity/ Air
Forehearth
Glass Gobs2000ºF
Coating
Annealing(Electric Lehr)
Annealing(Gas-Fired Lehr)
Natural Gasor Electricity Natural Gas
Coating/Finishing
Automated Inspecting/Packaging
Glass Product
CulletRecycle
1800ºF
2400ºF
BatchPreparationand ChargingComponent
Melting/RefiningComponent
FormingComponent
Post-FormingComponent
1050ºF
(1000oC)
(1300oC)
(1540oC)
(650oC)
(560oC)
(1100oC)
Figure 2-3. Container Glass Production Line [Brown 1996, EPA 1995, EPRI 1988]
31
Computerized Weighingand Mixing
Fining
MechanicalDrawing
BinderApplication
RecuperativeFurnace
Steam or AirBlowing
RegenerativeFurnace
ElectricalBoosting
OxygenMonitoring
System
OxygenMonitoring
System
ChemicalBoosting
CulletCrushing
Auto-TappedElectricMelter
Computer ControlledCharging
Conditioning
SizeApplication
Curing
FlameBlowing
RotaryFiberization
AutomatedInspecting/Packaging
Drying
Raw Material
BatchPreparationandChargingComponent
Melting/RefiningComponent
FormingComponent
Air
Post-FormingComponent
TextileInsulation
Glass Product Cullet
2900oF
(1600oC)
2900oF
(1600oC)
2800oF (1540oC)
500oF (260oC)
Figure 2-4. Fibrous Glass Production [Brown 1996, EPA 1995, EPRI 1988]
32
Raw Material
Computerized Weighing andMixing
Computer Controlled Charging
CulletCrushing
DayTank
PotFurnace
OxygenMonitoring
System
RegenerativeFurnace
OxygenMonitoring
System
RecuperativeFurnace
Auto-TappedElectricMelter
Fining/Conditioning
Fining
Conditioning
Blow & BlowForming
Press &Blow
Forming
PressForming
BlowForming
CastForming
DrawForming
Assembly
FirePolishing
Annealing(Electric Lehr)
Annealing(Gas-Fired Lehr)
Cooling/Coating/Finishing
Decorating
AutomatedInspection/Packaging
Cutting
FirePolishing
Annealing
AutomatedInspection/Packaging
Glass Product
Cullet
Glass Product
Cullet
BatchPreparationand ChargingComponent
Melting/RefiningComponent
FormingComponent
Post-FormingComponent
2800oF(1540oC)
900oF (480oC)
1560oF(850oC)
1100oF(600oC)
1100oF(600oC)
Figure 2-5. Pressed/Blown Glass Production Line [Brown 1996, EPA 1995, EPRI 1988]
33
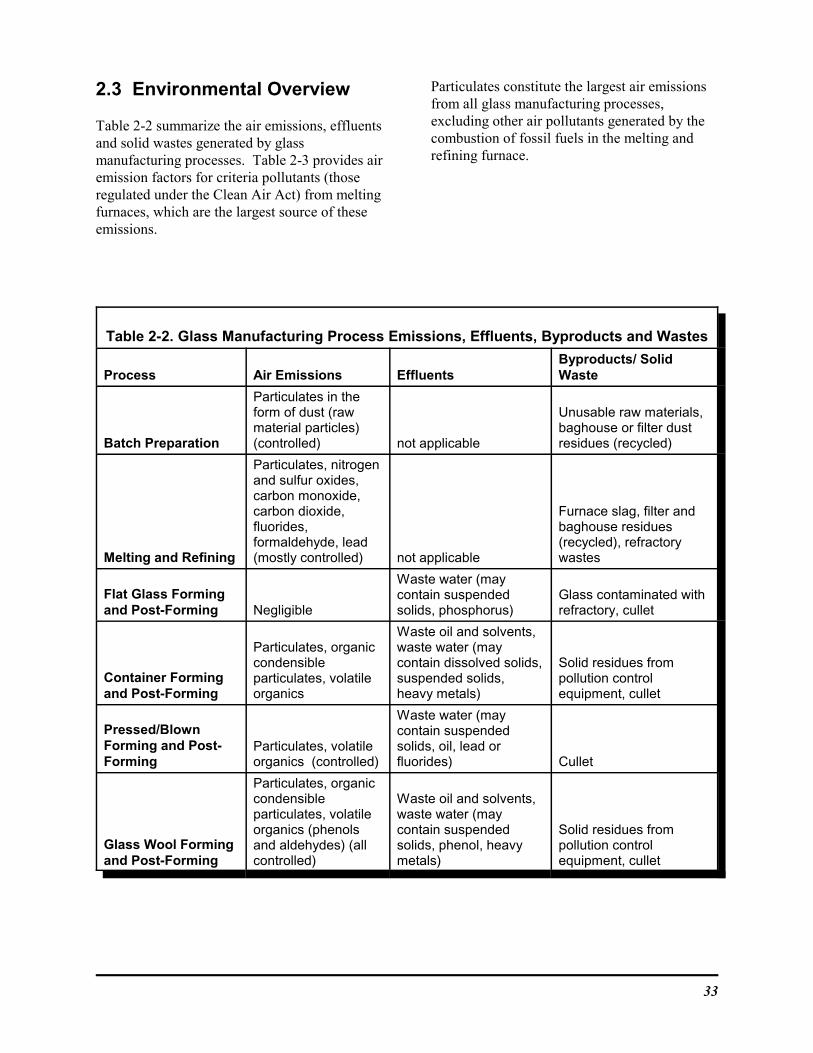
2.3 Environmental Overview
Table 2-2 summarize the air emissions, effluentsand solid wastes generated by glassmanufacturing processes. Table 2-3 provides airemission factors for criteria pollutants (thoseregulated under the Clean Air Act) from meltingfurnaces, which are the largest source of theseemissions.
Particulates constitute the largest air emissionsfrom all glass manufacturing processes,excluding other air pollutants generated by thecombustion of fossil fuels in the melting andrefining furnace.
Table 2-2. Glass Manufacturing Process Emissions, Effluents, Byproducts and Wastes
Process Air Emissions EffluentsByproducts/ SolidWaste
Batch Preparation
Particulates in theform of dust (rawmaterial particles)(controlled) not applicable
Unusable raw materials,baghouse or filter dustresidues (recycled)
Melting and Refining
Particulates, nitrogenand sulfur oxides,carbon monoxide,carbon dioxide, fluorides,formaldehyde, lead(mostly controlled) not applicable
Furnace slag, filter andbaghouse residues(recycled), refractorywastes
Flat Glass Formingand Post-Forming Negligible
Waste water (maycontain suspendedsolids, phosphorus)
Glass contaminated withrefractory, cullet
Container Formingand Post-Forming
Particulates, organiccondensibleparticulates, volatileorganics
Waste oil and solvents,waste water (maycontain dissolved solids,suspended solids,heavy metals)
Solid residues frompollution controlequipment, cullet
Pressed/BlownForming and Post-Forming
Particulates, volatileorganics (controlled)
Waste water (maycontain suspendedsolids, oil, lead orfluorides) Cullet
Glass Wool Formingand Post-Forming
Particulates, organiccondensibleparticulates, volatileorganics (phenolsand aldehydes) (allcontrolled)
Waste oil and solvents,waste water (maycontain suspendedsolids, phenol, heavymetals)
Solid residues frompollution controlequipment, cullet
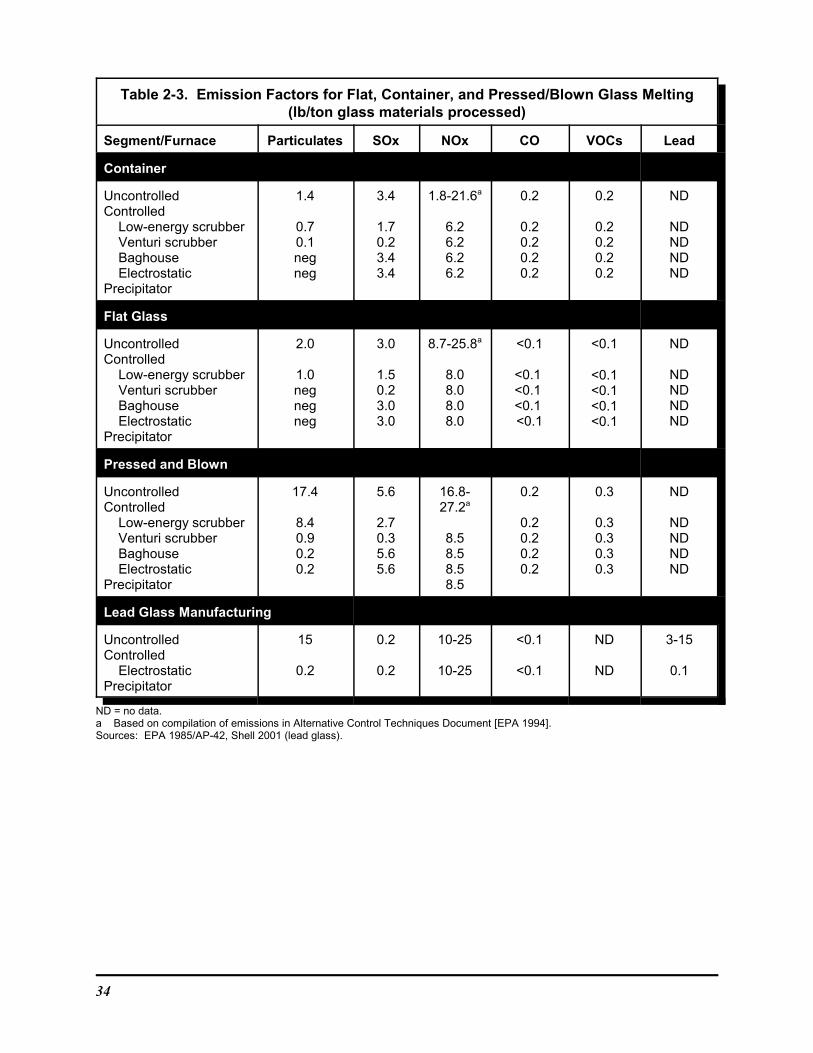
34
Table 2-3. Emission Factors for Flat, Container, and Pressed/Blown Glass Melting(lb/ton glass materials processed)
Segment/Furnace Particulates SOx NOx CO VOCs Lead
Container
UncontrolledControlled Low-energy scrubber Venturi scrubber Baghouse ElectrostaticPrecipitator
1.4
0.70.1negneg
3.4
1.70.23.43.4
1.8-21.6a
6.26.26.26.2
0.2
0.20.20.20.2
0.2
0.20.20.20.2
ND
NDNDNDND
Flat Glass
UncontrolledControlled Low-energy scrubber Venturi scrubber Baghouse ElectrostaticPrecipitator
2.0
1.0negnegneg
3.0
1.50.23.03.0
8.7-25.8a
8.08.08.08.0
<0.1
<0.1 <0.1 <0.1 <0.1
<0.1
<0.1<0.1<0.1<0.1
ND
NDNDNDND
Pressed and Blown
UncontrolledControlled Low-energy scrubber Venturi scrubber Baghouse ElectrostaticPrecipitator
17.4
8.40.90.20.2
5.6
2.70.35.65.6
16.8-27.2a
8.58.58.58.5
0.2
0.20.20.20.2
0.3
0.30.30.30.3
ND
NDNDNDND
Lead Glass Manufacturing
UncontrolledControlled ElectrostaticPrecipitator
15
0.2
0.2
0.2
10-25
10-25
<0.1
<0.1
ND
ND
3-15
0.1
ND = no data.a Based on compilation of emissions in Alternative Control Techniques Document [EPA 1994].Sources: EPA 1985/AP-42, Shell 2001 (lead glass).
35
3 BatchPreparation
3.1 Process Overview
A Variety of Raw Materials are MixedDuring Batch Preparation
Although there are many differences in glassproducts, all glass manufacture begins with theweighing and mixing of dry ingredients to createa “batch” or charge for the melting furnace. Many different chemical compositions can beused to create glass, and each formula affectsthe mechanical, electrical, chemical, optical andthermal properties of the final glass product. There are many thousands of glass compositionsavailable today, and new ones are continuouslyemerging. Table 3-1 illustrates the chemicalcomposition of some of the more commonly-used glasses.
The glass batch contains formers, fluxes,stabilizers, and sometimes colorants (see Table3-2). The basic ingredients in glass are calledformers. The main former in all types of glassis silica (SiO2) in the form of high-quality sand. More than 90 percent of the high-quality sandproduced in the United States is used for glassmanufacture.
A number of factors are considered whenselecting sand for glass production. The cost totransport sand is 4 to 5 times the cost of the
sand, and finer sands are more costly thancoarse sand. Using the incorrect size sand cancreate melting and product quality problems. To minimize raw material costs, glass producerswill often locate plants near the source of sand,and select a sand to balance cost and meltingefficiency. For example, container glassproducers will use a relatively coarse sand witha particle size ranging from 30-100 mesh tokeep costs as low as possible but still achievethe desired melting efficiency. Fiberglassmanufacturers must use a much finer sand,usually smaller than 200 mesh.1
Other major formers in glass are feldspar andborax or boric acid. Borax or boric acid, as wellas ores such as colemanite, rasorite or ulexite,are used to provide a source of boron for themanufacture of high temperature glass, pyrex, orfiberglass. Feldspar provides a source ofalumina. Fiber glass, for example, containsmostly sand, but also quantities of feldspar,sodium sulfate, anhydrous borax, boric acid, and other materials.
While silica alone can be used to make glass, ithas a very high melting point (3133oF) and is
1 Mesh size refers to the size of particles thatpass through a screen, and is usually expressed as thenumber of squares per inch.
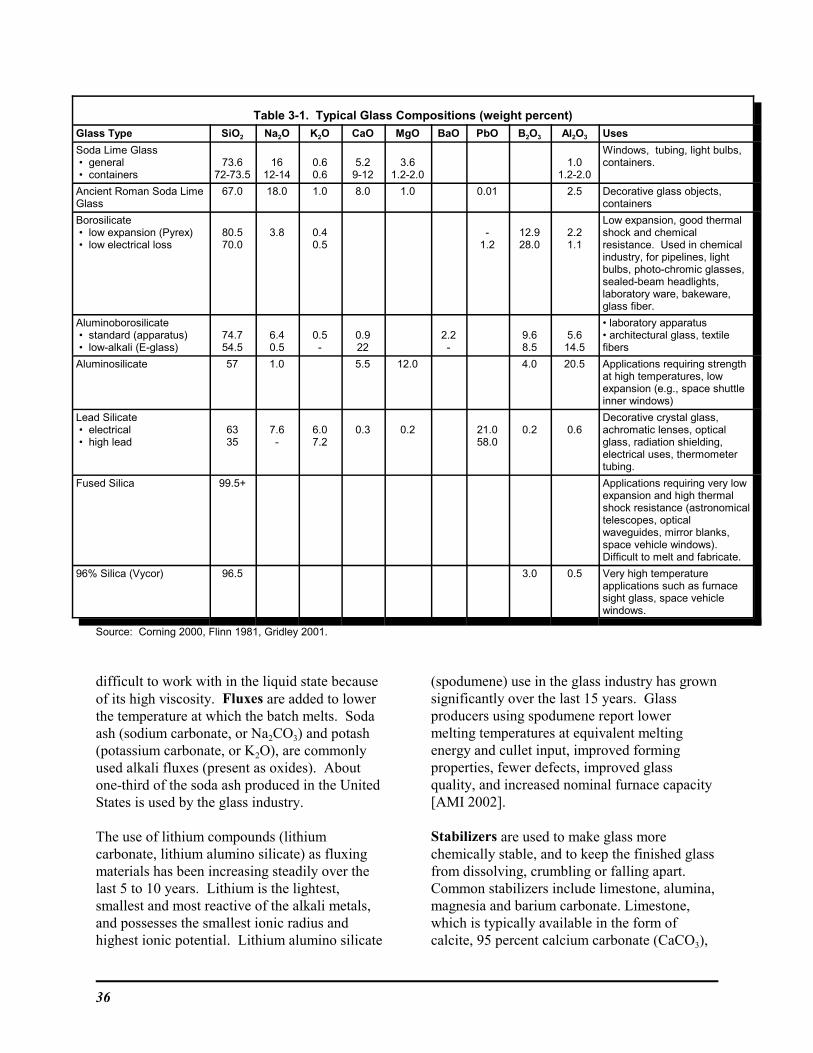
36
Table 3-1. Typical Glass Compositions (weight percent)
Glass Type SiO2 Na2O K2O CaO MgO BaO PbO B2O3 Al2O3 Uses
Soda Lime Glass • general • containers
73.672-73.5
1612-14
0.60.6
5.29-12
3.61.2-2.0
1.01.2-2.0
Windows, tubing, light bulbs,containers.
Ancient Roman Soda LimeGlass
67.0 18.0 1.0 8.0 1.0 0.01 2.5 Decorative glass objects,containers
Borosilicate • low expansion (Pyrex) • low electrical loss
80.570.0
3.8 0.40.5
-1.2
12.928.0
2.21.1
Low expansion, good thermalshock and chemicalresistance. Used in chemicalindustry, for pipelines, lightbulbs, photo-chromic glasses,sealed-beam headlights,laboratory ware, bakeware,glass fiber.
Aluminoborosilicate • standard (apparatus) • low-alkali (E-glass)
74.754.5
6.40.5
0.5-
0.922
2.2-
9.68.5
5.614.5
• laboratory apparatus• architectural glass, textilefibers
Aluminosilicate 57 1.0 5.5 12.0 4.0 20.5 Applications requiring strengthat high temperatures, lowexpansion (e.g., space shuttleinner windows)
Lead Silicate • electrical • high lead
6335
7.6-
6.07.2
0.3 0.2 21.058.0
0.2 0.6Decorative crystal glass,achromatic lenses, opticalglass, radiation shielding,electrical uses, thermometertubing.
Fused Silica 99.5+ Applications requiring very lowexpansion and high thermalshock resistance (astronomicaltelescopes, opticalwaveguides, mirror blanks,space vehicle windows).Difficult to melt and fabricate.
96% Silica (Vycor) 96.5 3.0 0.5 Very high temperatureapplications such as furnacesight glass, space vehiclewindows.
Source: Corning 2000, Flinn 1981, Gridley 2001.
difficult to work with in the liquid state becauseof its high viscosity. Fluxes are added to lowerthe temperature at which the batch melts. Sodaash (sodium carbonate, or Na2CO3) and potash(potassium carbonate, or K2O), are commonlyused alkali fluxes (present as oxides). Aboutone-third of the soda ash produced in the UnitedStates is used by the glass industry.
The use of lithium compounds (lithiumcarbonate, lithium alumino silicate) as fluxingmaterials has been increasing steadily over thelast 5 to 10 years. Lithium is the lightest,smallest and most reactive of the alkali metals,and possesses the smallest ionic radius andhighest ionic potential. Lithium alumino silicate
(spodumene) use in the glass industry has grownsignificantly over the last 15 years. Glassproducers using spodumene report lowermelting temperatures at equivalent meltingenergy and cullet input, improved formingproperties, fewer defects, improved glassquality, and increased nominal furnace capacity[AMI 2002].
Stabilizers are used to make glass morechemically stable, and to keep the finished glassfrom dissolving, crumbling or falling apart. Common stabilizers include limestone, alumina,magnesia and barium carbonate. Limestone,which is typically available in the form ofcalcite, 95 percent calcium carbonate (CaCO3),
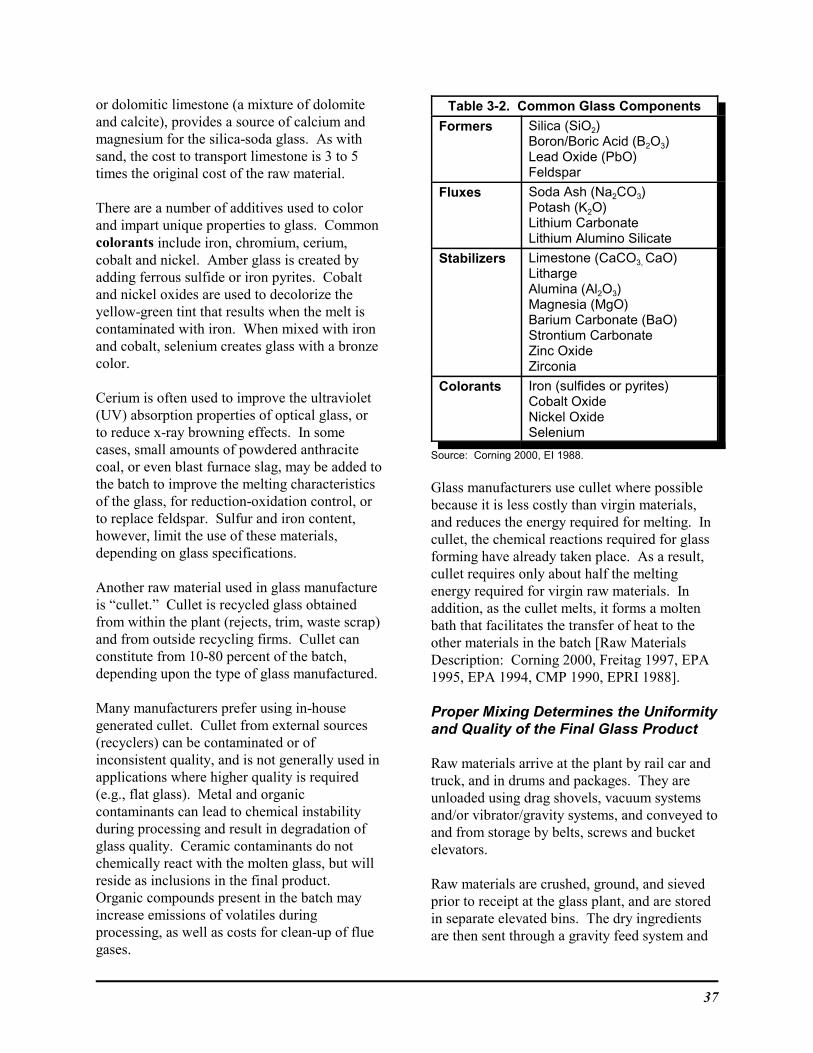
37
or dolomitic limestone (a mixture of dolomiteand calcite), provides a source of calcium andmagnesium for the silica-soda glass. As withsand, the cost to transport limestone is 3 to 5times the original cost of the raw material.
There are a number of additives used to colorand impart unique properties to glass. Commoncolorants include iron, chromium, cerium,cobalt and nickel. Amber glass is created byadding ferrous sulfide or iron pyrites. Cobaltand nickel oxides are used to decolorize theyellow-green tint that results when the melt iscontaminated with iron. When mixed with ironand cobalt, selenium creates glass with a bronzecolor.
Cerium is often used to improve the ultraviolet(UV) absorption properties of optical glass, orto reduce x-ray browning effects. In somecases, small amounts of powdered anthracitecoal, or even blast furnace slag, may be added tothe batch to improve the melting characteristicsof the glass, for reduction-oxidation control, orto replace feldspar. Sulfur and iron content,however, limit the use of these materials,depending on glass specifications.
Another raw material used in glass manufactureis “cullet.” Cullet is recycled glass obtainedfrom within the plant (rejects, trim, waste scrap)and from outside recycling firms. Cullet canconstitute from 10-80 percent of the batch,depending upon the type of glass manufactured.
Many manufacturers prefer using in-housegenerated cullet. Cullet from external sources(recyclers) can be contaminated or ofinconsistent quality, and is not generally used inapplications where higher quality is required(e.g., flat glass). Metal and organiccontaminants can lead to chemical instabilityduring processing and result in degradation ofglass quality. Ceramic contaminants do notchemically react with the molten glass, but willreside as inclusions in the final product. Organic compounds present in the batch mayincrease emissions of volatiles duringprocessing, as well as costs for clean-up of fluegases.
Table 3-2. Common Glass Components
Formers Silica (SiO2)Boron/Boric Acid (B2O3)Lead Oxide (PbO)Feldspar
Fluxes Soda Ash (Na2CO3)Potash (K2O)Lithium CarbonateLithium Alumino Silicate
Stabilizers Limestone (CaCO3, CaO)LithargeAlumina (Al2O3)Magnesia (MgO)Barium Carbonate (BaO)Strontium CarbonateZinc OxideZirconia
Colorants Iron (sulfides or pyrites)Cobalt OxideNickel OxideSelenium
Source: Corning 2000, EI 1988.
Glass manufacturers use cullet where possiblebecause it is less costly than virgin materials,and reduces the energy required for melting. Incullet, the chemical reactions required for glassforming have already taken place. As a result,cullet requires only about half the meltingenergy required for virgin raw materials. Inaddition, as the cullet melts, it forms a moltenbath that facilitates the transfer of heat to theother materials in the batch [Raw MaterialsDescription: Corning 2000, Freitag 1997, EPA1995, EPA 1994, CMP 1990, EPRI 1988].
Proper Mixing Determines the Uniformityand Quality of the Final Glass Product
Raw materials arrive at the plant by rail car andtruck, and in drums and packages. They areunloaded using drag shovels, vacuum systemsand/or vibrator/gravity systems, and conveyed toand from storage by belts, screws and bucketelevators.
Raw materials are crushed, ground, and sievedprior to receipt at the glass plant, and are storedin separate elevated bins. The dry ingredientsare then sent through a gravity feed system and
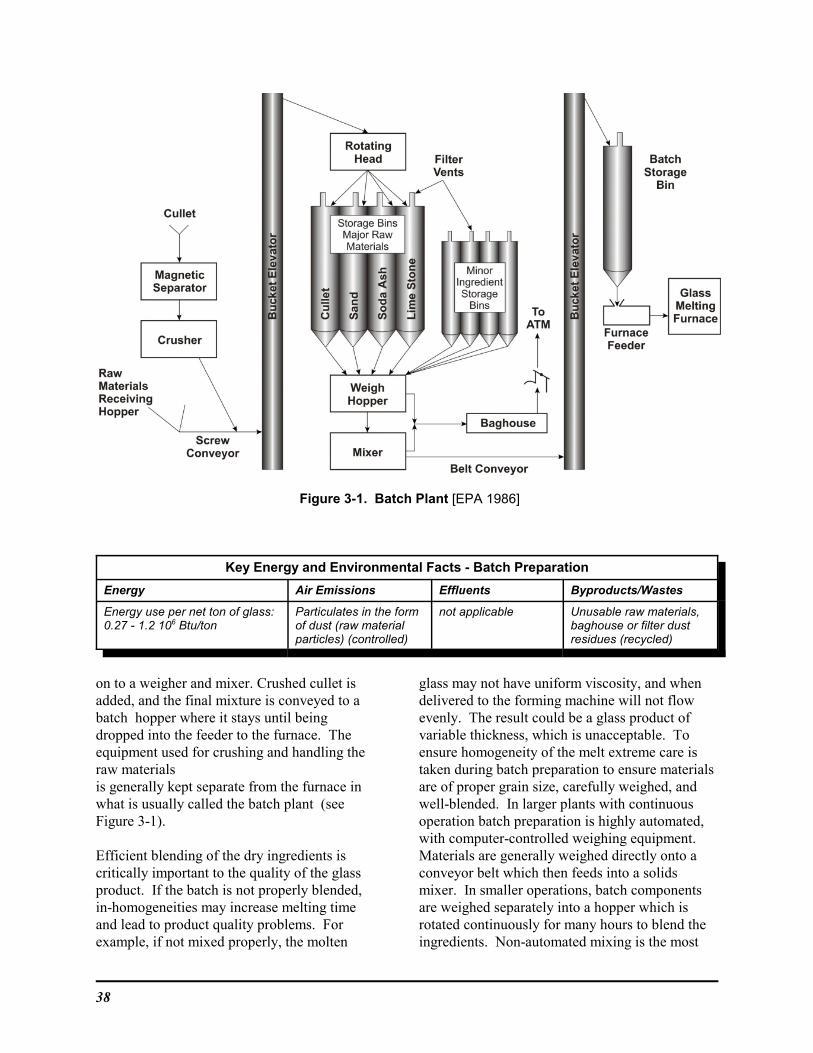
38
Figure 3-1. Batch Plant [EPA 1986]
Key Energy and Environmental Facts - Batch Preparation
Energy Air Emissions Effluents Byproducts/Wastes
Energy use per net ton of glass:0.27 - 1.2 106 Btu/ton
Particulates in the formof dust (raw materialparticles) (controlled)
not applicable Unusable raw materials,baghouse or filter dustresidues (recycled)
on to a weigher and mixer. Crushed cullet isadded, and the final mixture is conveyed to abatch hopper where it stays until beingdropped into the feeder to the furnace. Theequipment used for crushing and handling theraw materialsis generally kept separate from the furnace inwhat is usually called the batch plant (seeFigure 3-1).
Efficient blending of the dry ingredients iscritically important to the quality of the glassproduct. If the batch is not properly blended,in-homogeneities may increase melting timeand lead to product quality problems. Forexample, if not mixed properly, the molten
glass may not have uniform viscosity, and whendelivered to the forming machine will not flowevenly. The result could be a glass product ofvariable thickness, which is unacceptable. Toensure homogeneity of the melt extreme care istaken during batch preparation to ensure materialsare of proper grain size, carefully weighed, andwell-blended. In larger plants with continuousoperation batch preparation is highly automated,with computer-controlled weighing equipment. Materials are generally weighed directly onto aconveyor belt which then feeds into a solidsmixer. In smaller operations, batch componentsare weighed separately into a hopper which isrotated continuously for many hours to blend theingredients. Non-automated mixing is the most
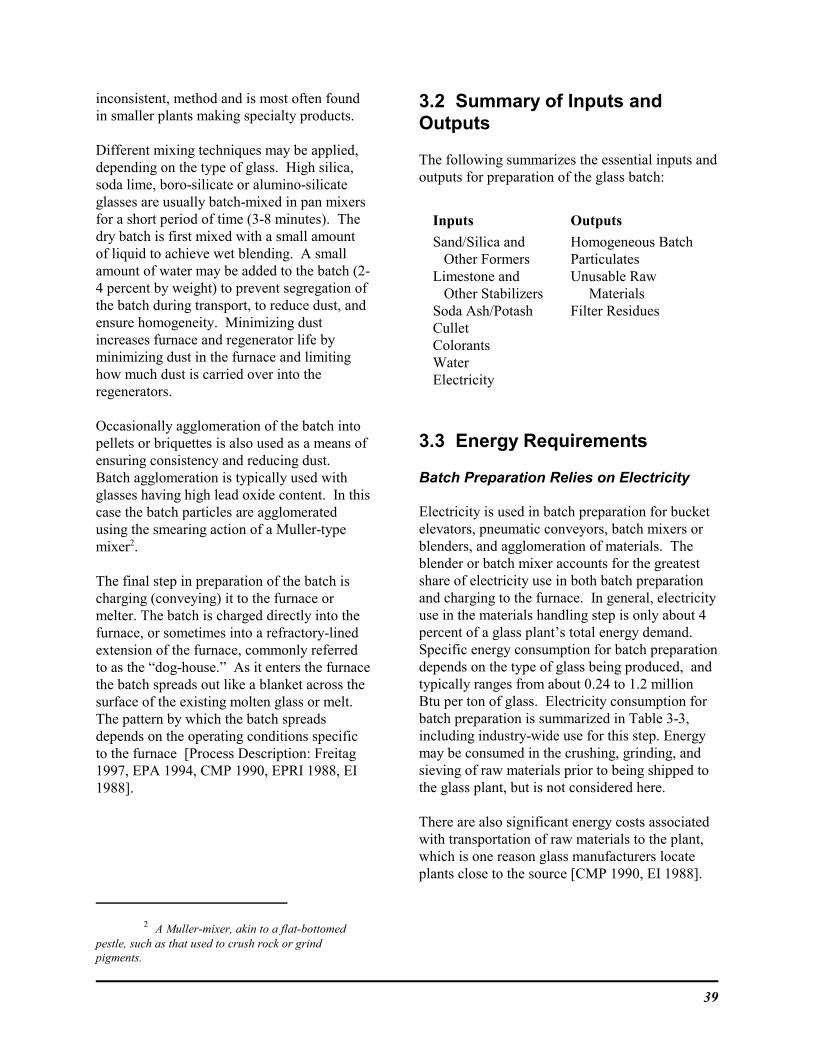
39
inconsistent, method and is most often foundin smaller plants making specialty products.
Different mixing techniques may be applied,depending on the type of glass. High silica,soda lime, boro-silicate or alumino-silicateglasses are usually batch-mixed in pan mixersfor a short period of time (3-8 minutes). Thedry batch is first mixed with a small amountof liquid to achieve wet blending. A smallamount of water may be added to the batch (2-4 percent by weight) to prevent segregation ofthe batch during transport, to reduce dust, andensure homogeneity. Minimizing dustincreases furnace and regenerator life byminimizing dust in the furnace and limitinghow much dust is carried over into theregenerators.
Occasionally agglomeration of the batch intopellets or briquettes is also used as a means ofensuring consistency and reducing dust. Batch agglomeration is typically used withglasses having high lead oxide content. In thiscase the batch particles are agglomeratedusing the smearing action of a Muller-typemixer2.
The final step in preparation of the batch ischarging (conveying) it to the furnace ormelter. The batch is charged directly into thefurnace, or sometimes into a refractory-linedextension of the furnace, commonly referredto as the “dog-house.” As it enters the furnacethe batch spreads out like a blanket across thesurface of the existing molten glass or melt. The pattern by which the batch spreadsdepends on the operating conditions specificto the furnace [Process Description: Freitag1997, EPA 1994, CMP 1990, EPRI 1988, EI1988].
3.2 Summary of Inputs andOutputs
The following summarizes the essential inputs andoutputs for preparation of the glass batch:
Inputs Outputs
Sand/Silica and Other FormersLimestone and Other StabilizersSoda Ash/PotashCulletColorantsWaterElectricity
Homogeneous BatchParticulatesUnusable Raw MaterialsFilter Residues
3.3 Energy Requirements
Batch Preparation Relies on Electricity
Electricity is used in batch preparation for bucketelevators, pneumatic conveyors, batch mixers orblenders, and agglomeration of materials. Theblender or batch mixer accounts for the greatestshare of electricity use in both batch preparationand charging to the furnace. In general, electricityuse in the materials handling step is only about 4percent of a glass plant’s total energy demand. Specific energy consumption for batch preparationdepends on the type of glass being produced, andtypically ranges from about 0.24 to 1.2 millionBtu per ton of glass. Electricity consumption forbatch preparation is summarized in Table 3-3,including industry-wide use for this step. Energymay be consumed in the crushing, grinding, andsieving of raw materials prior to being shipped tothe glass plant, but is not considered here.
There are also significant energy costs associatedwith transportation of raw materials to the plant,which is one reason glass manufacturers locateplants close to the source [CMP 1990, EI 1988].
2 A Muller-mixer, akin to a flat-bottomedpestle, such as that used to crush rock or grindpigments.
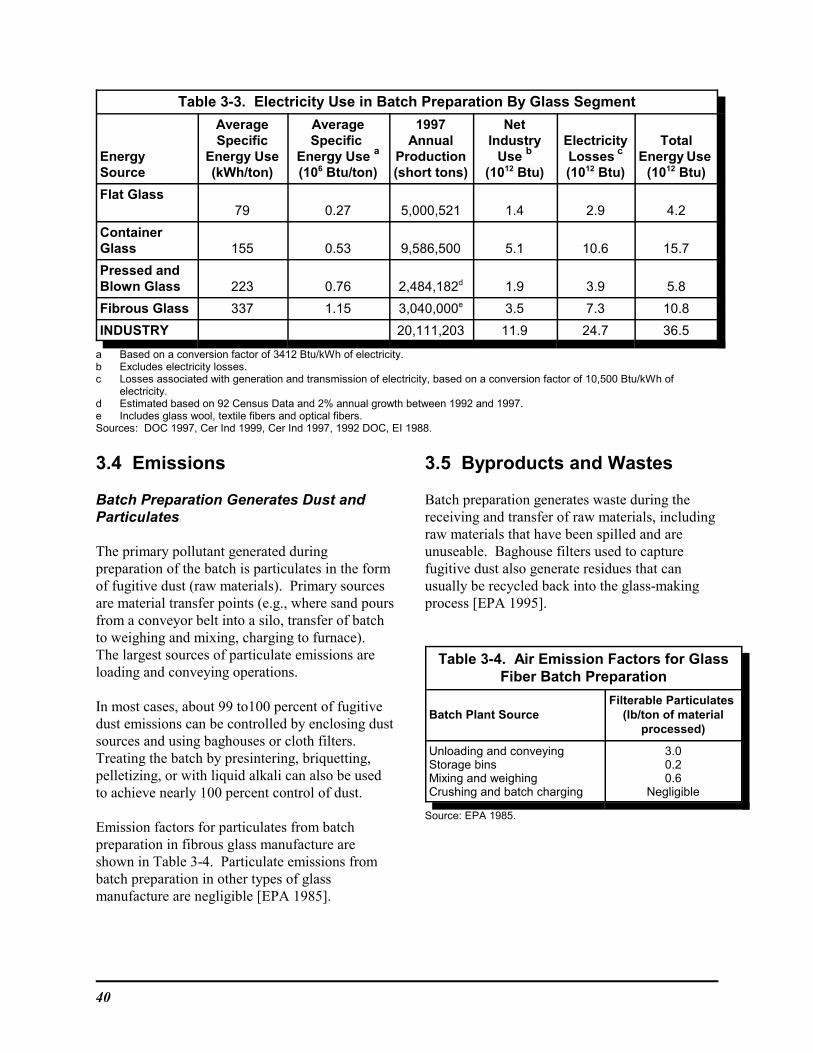
40
Table 3-3. Electricity Use in Batch Preparation By Glass Segment
EnergySource
AverageSpecific
Energy Use(kWh/ton)
AverageSpecific
Energy Use a
(106 Btu/ton)
1997Annual
Production(short tons)
NetIndustry
Use b
(1012 Btu)
ElectricityLosses c
(1012 Btu)
TotalEnergy Use
(1012 Btu)
Flat Glass79 0.27 5,000,521 1.4 2.9 4.2
ContainerGlass 155 0.53 9,586,500 5.1 10.6 15.7
Pressed andBlown Glass 223 0.76 2,484,182d 1.9 3.9 5.8
Fibrous Glass 337 1.15 3,040,000e 3.5 7.3 10.8
INDUSTRY 20,111,203 11.9 24.7 36.5
a Based on a conversion factor of 3412 Btu/kWh of electricity.b Excludes electricity losses.c Losses associated with generation and transmission of electricity, based on a conversion factor of 10,500 Btu/kWh of
electricity.d Estimated based on 92 Census Data and 2% annual growth between 1992 and 1997.e Includes glass wool, textile fibers and optical fibers.Sources: DOC 1997, Cer Ind 1999, Cer Ind 1997, 1992 DOC, EI 1988.
3.4 Emissions
Batch Preparation Generates Dust andParticulates
The primary pollutant generated duringpreparation of the batch is particulates in the formof fugitive dust (raw materials). Primary sourcesare material transfer points (e.g., where sand poursfrom a conveyor belt into a silo, transfer of batchto weighing and mixing, charging to furnace). The largest sources of particulate emissions areloading and conveying operations.
In most cases, about 99 to100 percent of fugitivedust emissions can be controlled by enclosing dustsources and using baghouses or cloth filters. Treating the batch by presintering, briquetting,pelletizing, or with liquid alkali can also be usedto achieve nearly 100 percent control of dust.
Emission factors for particulates from batchpreparation in fibrous glass manufacture areshown in Table 3-4. Particulate emissions frombatch preparation in other types of glassmanufacture are negligible [EPA 1985].
3.5 Byproducts and Wastes
Batch preparation generates waste during thereceiving and transfer of raw materials, includingraw materials that have been spilled and areunuseable. Baghouse filters used to capturefugitive dust also generate residues that canusually be recycled back into the glass-makingprocess [EPA 1995].
Table 3-4. Air Emission Factors for GlassFiber Batch Preparation
Batch Plant SourceFilterable Particulates
(lb/ton of materialprocessed)
Unloading and conveyingStorage binsMixing and weighingCrushing and batch charging
3.00.20.6
Negligible
Source: EPA 1985.
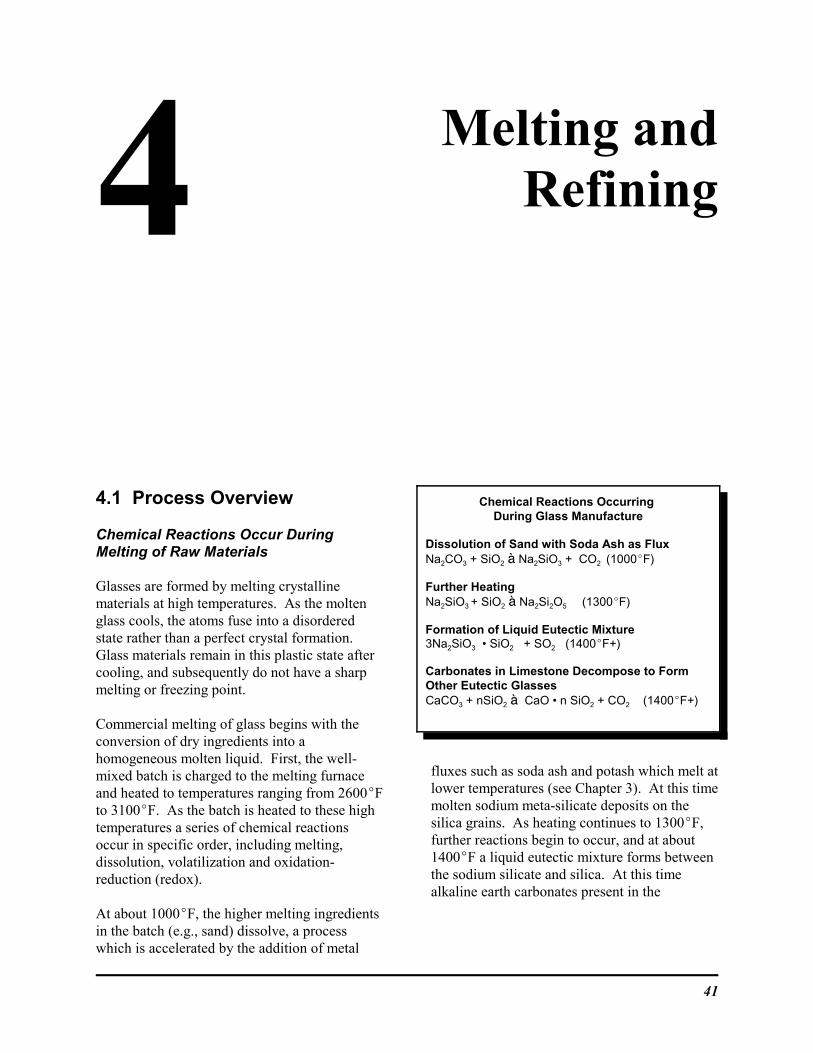
41
4 Melting andRefining
4.1 Process Overview
Chemical Reactions Occur DuringMelting of Raw Materials
Glasses are formed by melting crystallinematerials at high temperatures. As the moltenglass cools, the atoms fuse into a disorderedstate rather than a perfect crystal formation. Glass materials remain in this plastic state aftercooling, and subsequently do not have a sharpmelting or freezing point.
Commercial melting of glass begins with theconversion of dry ingredients into ahomogeneous molten liquid. First, the well-mixed batch is charged to the melting furnaceand heated to temperatures ranging from 2600EFto 3100EF. As the batch is heated to these hightemperatures a series of chemical reactionsoccur in specific order, including melting,dissolution, volatilization and oxidation-reduction (redox).
At about 1000EF, the higher melting ingredientsin the batch (e.g., sand) dissolve, a processwhich is accelerated by the addition of metal
fluxes such as soda ash and potash which melt atlower temperatures (see Chapter 3). At this timemolten sodium meta-silicate deposits on thesilica grains. As heating continues to 1300EF,further reactions begin to occur, and at about1400EF a liquid eutectic mixture forms betweenthe sodium silicate and silica. At this timealkaline earth carbonates present in the
Chemical Reactions Occurring During Glass Manufacture
Dissolution of Sand with Soda Ash as FluxNa2CO3 + SiO2 B Na2SiO3 + CO2 (1000EF)
Further Heating Na2SiO3 + SiO2 B Na2Si2O5 (1300EF)
Formation of Liquid Eutectic Mixture3Na2SiO3 • SiO2 + SO2 (1400EF+)
Carbonates in Limestone Decompose to FormOther Eutectic GlassesCaCO3 + nSiO2 B CaO • n SiO2 + CO2 (1400EF+)
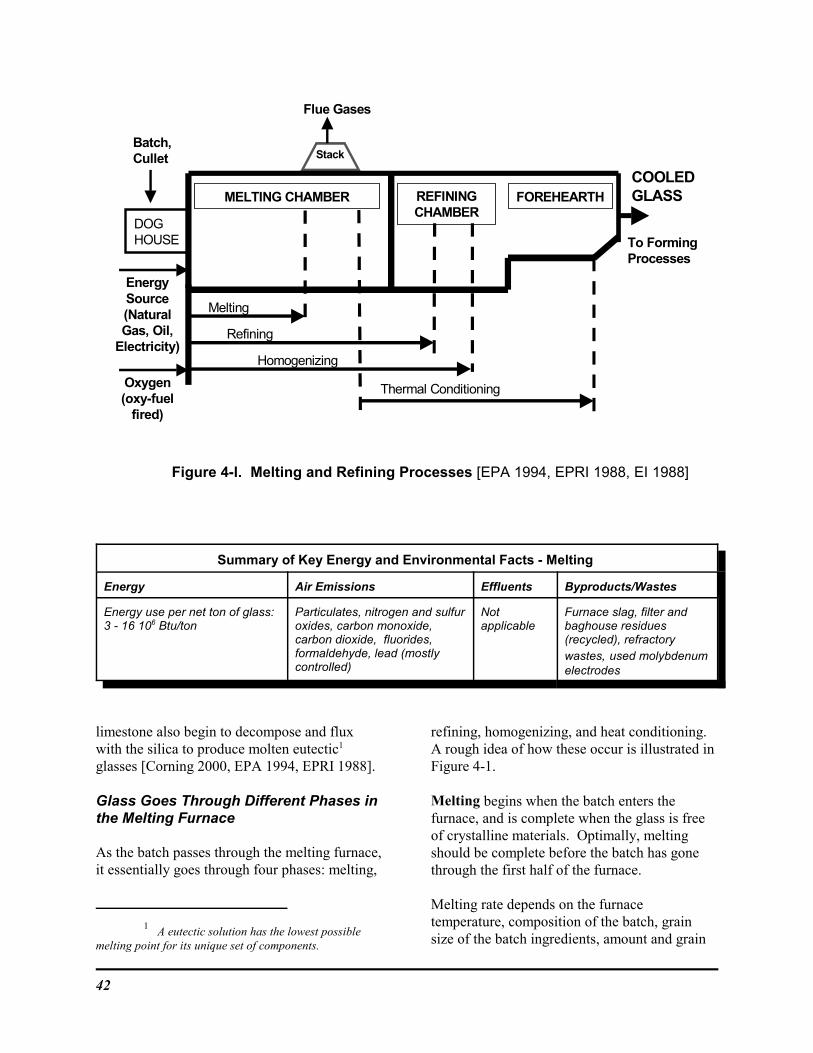
42
COOLEDGLASSMELTING CHAMBER REFINING
CHAMBERFOREHEARTH
Melting
Refining
Homogenizing
Thermal Conditioning
To FormingProcesses
DOGHOUSE
Batch,Cullet
EnergySource(NaturalGas, Oil,
Electricity)
Oxygen(oxy-fuel
fired)
Stack
Flue Gases
Figure 4-l. Melting and Refining Processes [EPA 1994, EPRI 1988, EI 1988]
Summary of Key Energy and Environmental Facts - Melting
Energy Air Emissions Effluents Byproducts/Wastes
Energy use per net ton of glass:3 - 16 106 Btu/ton
Particulates, nitrogen and sulfuroxides, carbon monoxide,carbon dioxide, fluorides,formaldehyde, lead (mostlycontrolled)
Notapplicable
Furnace slag, filter andbaghouse residues(recycled), refractorywastes, used molybdenumelectrodes
limestone also begin to decompose and fluxwith the silica to produce molten eutectic1
glasses [Corning 2000, EPA 1994, EPRI 1988].
Glass Goes Through Different Phases inthe Melting Furnace
As the batch passes through the melting furnace,it essentially goes through four phases: melting,
refining, homogenizing, and heat conditioning. A rough idea of how these occur is illustrated inFigure 4-1.
Melting begins when the batch enters thefurnace, and is complete when the glass is freeof crystalline materials. Optimally, meltingshould be complete before the batch has gonethrough the first half of the furnace.
Melting rate depends on the furnacetemperature, composition of the batch, grainsize of the batch ingredients, amount and grain
1 A eutectic solution has the lowest possiblemelting point for its unique set of components.
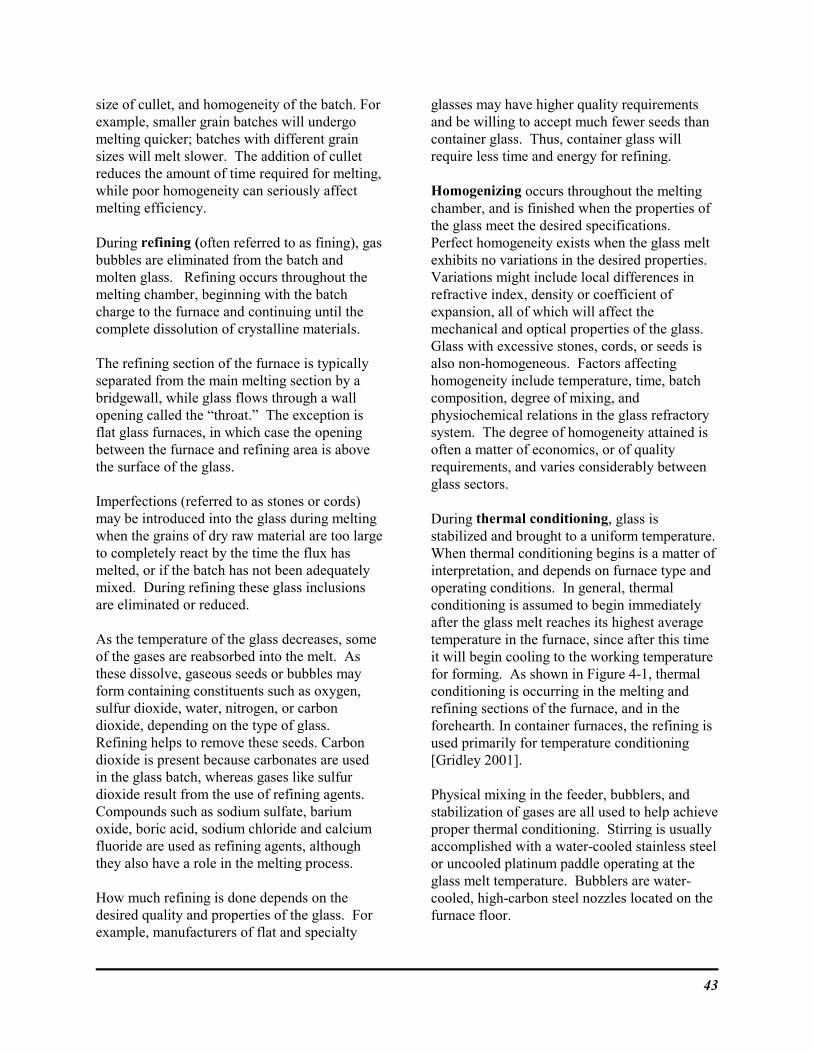
43
size of cullet, and homogeneity of the batch. Forexample, smaller grain batches will undergomelting quicker; batches with different grainsizes will melt slower. The addition of culletreduces the amount of time required for melting,while poor homogeneity can seriously affectmelting efficiency.
During refining (often referred to as fining), gasbubbles are eliminated from the batch andmolten glass. Refining occurs throughout themelting chamber, beginning with the batchcharge to the furnace and continuing until thecomplete dissolution of crystalline materials.
The refining section of the furnace is typicallyseparated from the main melting section by abridgewall, while glass flows through a wallopening called the “throat.” The exception isflat glass furnaces, in which case the openingbetween the furnace and refining area is abovethe surface of the glass.
Imperfections (referred to as stones or cords)may be introduced into the glass during meltingwhen the grains of dry raw material are too largeto completely react by the time the flux hasmelted, or if the batch has not been adequatelymixed. During refining these glass inclusionsare eliminated or reduced.
As the temperature of the glass decreases, someof the gases are reabsorbed into the melt. Asthese dissolve, gaseous seeds or bubbles mayform containing constituents such as oxygen,sulfur dioxide, water, nitrogen, or carbondioxide, depending on the type of glass. Refining helps to remove these seeds. Carbondioxide is present because carbonates are usedin the glass batch, whereas gases like sulfurdioxide result from the use of refining agents. Compounds such as sodium sulfate, bariumoxide, boric acid, sodium chloride and calciumfluoride are used as refining agents, althoughthey also have a role in the melting process.
How much refining is done depends on thedesired quality and properties of the glass. Forexample, manufacturers of flat and specialty
glasses may have higher quality requirementsand be willing to accept much fewer seeds thancontainer glass. Thus, container glass willrequire less time and energy for refining.
Homogenizing occurs throughout the meltingchamber, and is finished when the properties ofthe glass meet the desired specifications. Perfect homogeneity exists when the glass meltexhibits no variations in the desired properties. Variations might include local differences inrefractive index, density or coefficient ofexpansion, all of which will affect themechanical and optical properties of the glass. Glass with excessive stones, cords, or seeds isalso non-homogeneous. Factors affectinghomogeneity include temperature, time, batchcomposition, degree of mixing, andphysiochemical relations in the glass refractorysystem. The degree of homogeneity attained isoften a matter of economics, or of qualityrequirements, and varies considerably betweenglass sectors.
During thermal conditioning, glass isstabilized and brought to a uniform temperature. When thermal conditioning begins is a matter ofinterpretation, and depends on furnace type andoperating conditions. In general, thermalconditioning is assumed to begin immediatelyafter the glass melt reaches its highest averagetemperature in the furnace, since after this timeit will begin cooling to the working temperaturefor forming. As shown in Figure 4-1, thermalconditioning is occurring in the melting andrefining sections of the furnace, and in theforehearth. In container furnaces, the refining isused primarily for temperature conditioning[Gridley 2001].
Physical mixing in the feeder, bubblers, andstabilization of gases are all used to help achieveproper thermal conditioning. Stirring is usuallyaccomplished with a water-cooled stainless steelor uncooled platinum paddle operating at theglass melt temperature. Bubblers are water-cooled, high-carbon steel nozzles located on thefurnace floor.
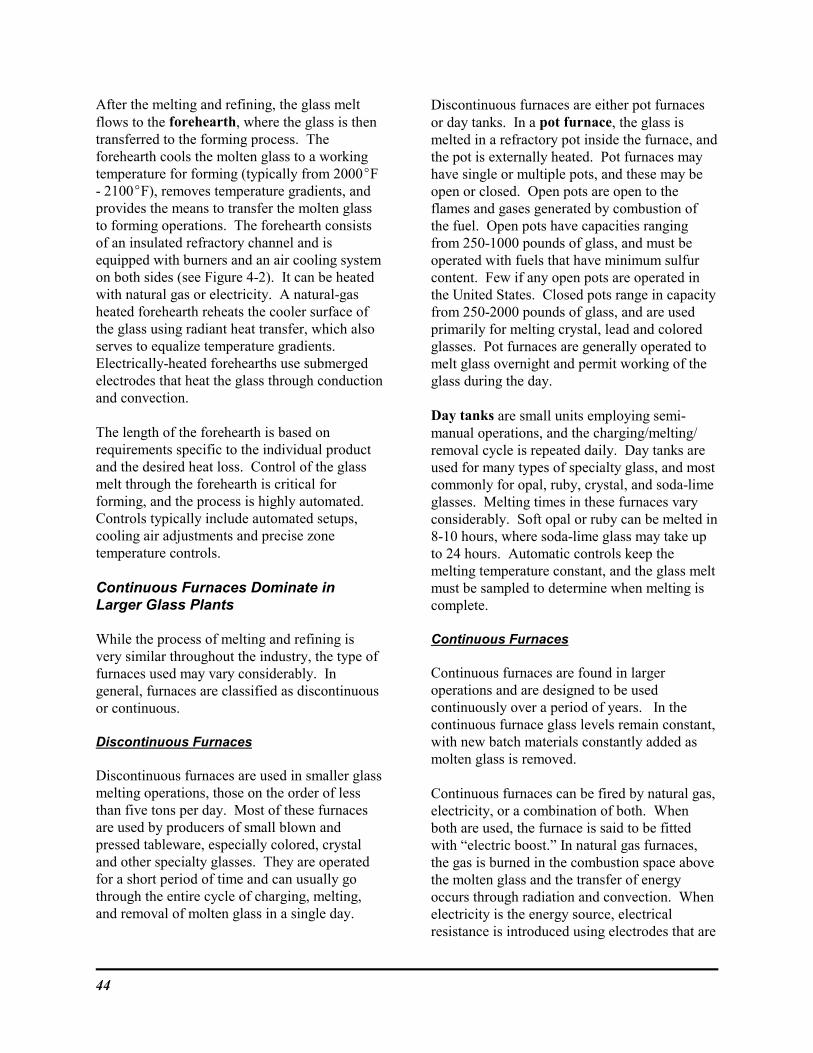
44
After the melting and refining, the glass meltflows to the forehearth, where the glass is thentransferred to the forming process. Theforehearth cools the molten glass to a workingtemperature for forming (typically from 2000EF- 2100EF), removes temperature gradients, andprovides the means to transfer the molten glassto forming operations. The forehearth consistsof an insulated refractory channel and isequipped with burners and an air cooling systemon both sides (see Figure 4-2). It can be heatedwith natural gas or electricity. A natural-gasheated forehearth reheats the cooler surface ofthe glass using radiant heat transfer, which alsoserves to equalize temperature gradients. Electrically-heated forehearths use submergedelectrodes that heat the glass through conductionand convection.
The length of the forehearth is based onrequirements specific to the individual productand the desired heat loss. Control of the glassmelt through the forehearth is critical forforming, and the process is highly automated. Controls typically include automated setups,cooling air adjustments and precise zonetemperature controls.
Continuous Furnaces Dominate inLarger Glass Plants
While the process of melting and refining isvery similar throughout the industry, the type offurnaces used may vary considerably. Ingeneral, furnaces are classified as discontinuousor continuous.
Discontinuous Furnaces
Discontinuous furnaces are used in smaller glassmelting operations, those on the order of lessthan five tons per day. Most of these furnacesare used by producers of small blown andpressed tableware, especially colored, crystaland other specialty glasses. They are operatedfor a short period of time and can usually gothrough the entire cycle of charging, melting,and removal of molten glass in a single day.
Discontinuous furnaces are either pot furnacesor day tanks. In a pot furnace, the glass ismelted in a refractory pot inside the furnace, andthe pot is externally heated. Pot furnaces mayhave single or multiple pots, and these may beopen or closed. Open pots are open to theflames and gases generated by combustion ofthe fuel. Open pots have capacities rangingfrom 250-1000 pounds of glass, and must beoperated with fuels that have minimum sulfurcontent. Few if any open pots are operated inthe United States. Closed pots range in capacityfrom 250-2000 pounds of glass, and are usedprimarily for melting crystal, lead and coloredglasses. Pot furnaces are generally operated tomelt glass overnight and permit working of theglass during the day.
Day tanks are small units employing semi-manual operations, and the charging/melting/removal cycle is repeated daily. Day tanks areused for many types of specialty glass, and mostcommonly for opal, ruby, crystal, and soda-limeglasses. Melting times in these furnaces varyconsiderably. Soft opal or ruby can be melted in8-10 hours, where soda-lime glass may take upto 24 hours. Automatic controls keep themelting temperature constant, and the glass meltmust be sampled to determine when melting iscomplete.
Continuous Furnaces
Continuous furnaces are found in largeroperations and are designed to be usedcontinuously over a period of years. In thecontinuous furnace glass levels remain constant,with new batch materials constantly added asmolten glass is removed.
Continuous furnaces can be fired by natural gas,electricity, or a combination of both. Whenboth are used, the furnace is said to be fittedwith “electric boost.” In natural gas furnaces,the gas is burned in the combustion space abovethe molten glass and the transfer of energyoccurs through radiation and convection. Whenelectricity is the energy source, electricalresistance is introduced using electrodes that are
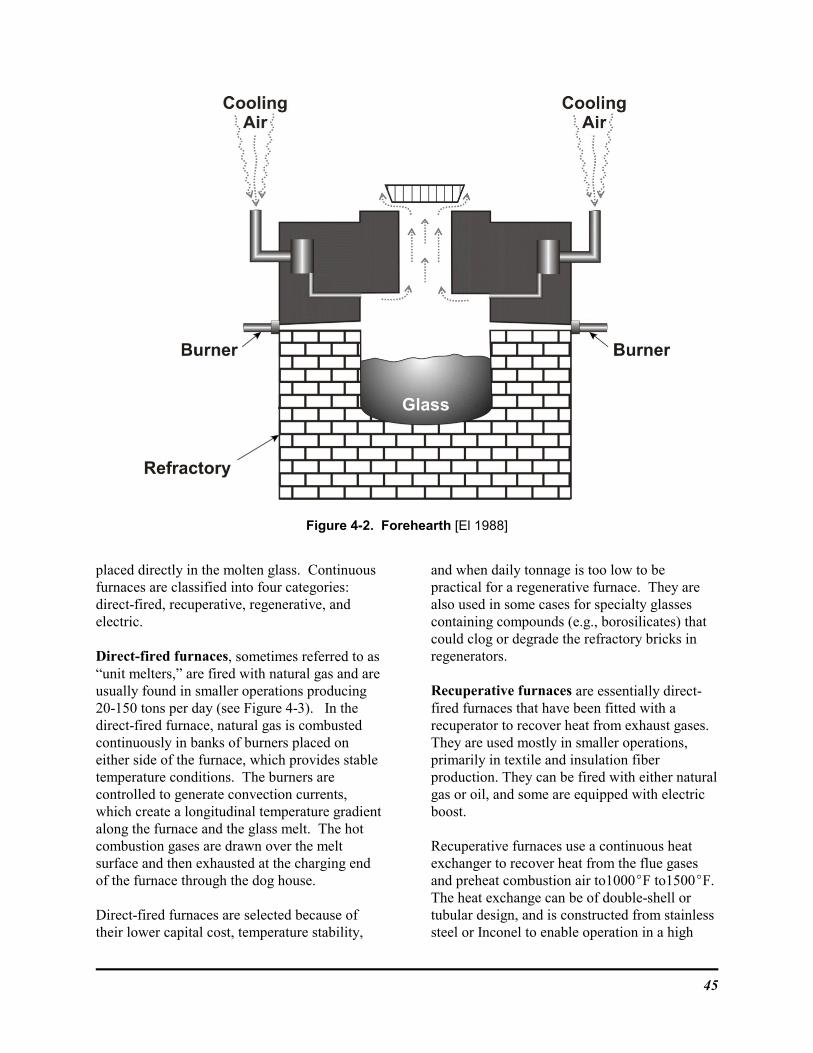
45
Figure 4-2. Forehearth [El 1988]
placed directly in the molten glass. Continuousfurnaces are classified into four categories:direct-fired, recuperative, regenerative, andelectric.
Direct-fired furnaces, sometimes referred to as“unit melters,” are fired with natural gas and areusually found in smaller operations producing20-150 tons per day (see Figure 4-3). In thedirect-fired furnace, natural gas is combustedcontinuously in banks of burners placed oneither side of the furnace, which provides stabletemperature conditions. The burners arecontrolled to generate convection currents,which create a longitudinal temperature gradientalong the furnace and the glass melt. The hotcombustion gases are drawn over the meltsurface and then exhausted at the charging endof the furnace through the dog house.
Direct-fired furnaces are selected because oftheir lower capital cost, temperature stability,
and when daily tonnage is too low to bepractical for a regenerative furnace. They arealso used in some cases for specialty glassescontaining compounds (e.g., borosilicates) thatcould clog or degrade the refractory bricks inregenerators.
Recuperative furnaces are essentially direct-fired furnaces that have been fitted with arecuperator to recover heat from exhaust gases.They are used mostly in smaller operations,primarily in textile and insulation fiberproduction. They can be fired with either naturalgas or oil, and some are equipped with electricboost.
Recuperative furnaces use a continuous heatexchanger to recover heat from the flue gasesand preheat combustion air to1000EF to1500EF. The heat exchange can be of double-shell ortubular design, and is constructed from stainlesssteel or Inconel to enable operation in a high
46
Figure 4-3. Direct-Fired Furnace [CMP 1990, El 1998]
temperature corrosive environment. Recoveringheat nearly doubles the thermal efficiency of thefurnace to as much as 25-40 percent.
Regenerative furnaces are the most commonlyused in the glass industry, accounting for about42 percent of furnace population. Capacities inthese furnaces are high (100-1000 tons per day),and they are relatively efficient (up to 65percent thermal efficiency) when compared withdirect-fired or recuperative furnaces. They canbe fired with either natural gas or with gas andelectric boost.
Much like the recuperative furnace, the latentheat in the furnace is collected in a regeneratorand then used to preheat combustion air andachieve higher efficiency. Combustion airpreheat temperatures can reach as high as2300EF.
Checker bricks are placed within themelting/combustion chamber. During operation,incoming combustion air is heated as it passes
through the first hot checker system, and is thenjoined with the fuel in the burner port. Theflame burns above the surface of the glass insidethe space under the top of the melter(combustion space). Combustion gases exit themelting area through opposite burner ports andexhausting regenerator chamber, heating thechecker bricks. The flow is reversed after ashort period of time (usually 15-20 minutes),which alternates the inlet and exhaust ports. Average furnace exhaust temperatures rangefrom 1000EF to 1200EF. Direct-fired airrecuperative furnaces may utilize hightemperature metallic alloy heat exchangers thatavoid the need to periodically reverse air flow.
Regenerative furnaces typically use alumina-zirconia-silica as the refractory of the sidewall,with zirconia content ranging from 33-41percent. Chrome-containing refractories areused in the fiberglass industry because theyresist erosion, but their use is decreasing due toenvironmental concerns about chrome. Refractories containing chrome are not used in

47
the flat, container or pressed/blown glassindustries because chrome impurities candiscolor the glass. Silica is commonly used forthe crown of the furnace, or sometimes mulliteif oxy-fuel firing is employed. Due to chemicalincompatibilities, a layer of alumina-zirconia-silica is often used as a buffer between thecrown and sidewall (see Figure 4-4) [Freitag1997].
Melting in the furnace is usually monitored withthermocouples above and below the melt, andthough visual observation of burner nozzleperformance. Thermocouples are sheathed withalumina, mullite, or platinum-coated alumina,and must be replaced every 2-3 months due tothermal shock or impact damage. Fiber opticprobes are also being developed to enablemonitoring of glass temperatures throughout themelt.
Regenerative furnaces can be end-port or side-port, depending on the placement of burner andexhaust ports. End-port regenerative furnacesuse side-by-side ports located in the back wall ofthe furnace (see Figure 4-5). The flame entersthrough one port, and exhaust gases exit throughthe other. Thus, the flames travel in a u-shapeover the melt from one side. Regeneratorchambers are located next to each other againstthe back wall of the furnace.
In a side-port regenerative furnace, exhaustports and burners are placed on opposing sidesof the furnace along with two regenerators, oneon each side (see Figure 4-6). Flames travelfrom one side of the furnace to the other. Thesefurnaces are used mostly for very high through-put operations.
All-electric melters take advantage of theconductivity of molten glass. Molybdenumelectrodes are embedded in the bottom or sidesof the furnace, and pass electrical currentthrough the refractory chamber, melting the rawmaterials. The furnace must first be heated withfossil fuel and the temperature of the batchraised prior to electrical melting.
During the melting process the batch layer actsas an insulator on top of the melt which virtuallyeliminates energy losses from the molten glassdue to radiation or convection. While thetemperature of the melt is about 2600EF, thetemperature at the top of the insulating 6-9 inchbatch layer will be only about 200EF. Thisinsulating effect, referred to as a “cold top,” increases thermal efficiency up to 60 to 90percent. Some electric melters use natural gasfor auxiliary heating—these are referred to as“hot-top” melters. Bubblers are commonly usedto improve the homogeneity of the melt and toensure that bubbles are eliminated.
Many advantages have been cited for electricmelters, including reduced air pollution, higherefficiency, reduced emission of volatiles such asfluoride and lead oxide, improved glassuniformity, faster furnace rebuilds, and smallspace requirements. However, if the efficiencyof electricity generation at the power plant isconsidered (30-35 percent efficient), the overallefficiency of electric melting is much lower (21percent), and energy costs are high. For thisreason, electric melters are not cost-competitivefor many applications. The size limits ofelectric furnaces and the electrical conductivityof some batches at high temperatures also limitthe use of all-electric melters.
Another issue is reduced refractory life inelectric melters, which leads to more frequentfurnace rebuilds. Typical rebuild time for anelectric furnace is about 2 years, with 2 weeksof downtime [Gridley 2001].
Electric melters are commonly used for batchescontaining borosilicates or fluorides (e.g., fiberglass) to minimize volatilization of binders andresins. In a gas-fired furnace as much as 40percent volatilization can occur, compared withless than 2 percent in electric melters. A typicalelectric melter configuration for producing fiberglass is illustrated in Figure 4-7.
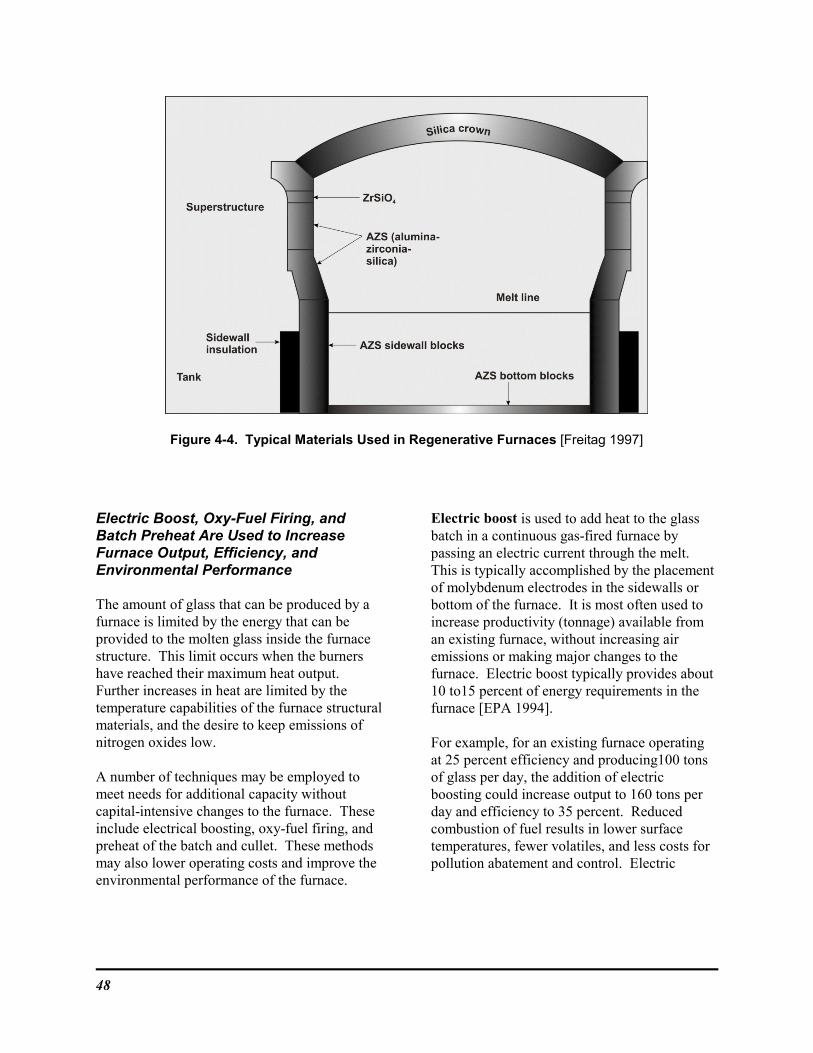
48
Figure 4-4. Typical Materials Used in Regenerative Furnaces [Freitag 1997]
Electric Boost, Oxy-Fuel Firing, andBatch Preheat Are Used to IncreaseFurnace Output, Efficiency, andEnvironmental Performance
The amount of glass that can be produced by afurnace is limited by the energy that can beprovided to the molten glass inside the furnacestructure. This limit occurs when the burnershave reached their maximum heat output. Further increases in heat are limited by thetemperature capabilities of the furnace structuralmaterials, and the desire to keep emissions ofnitrogen oxides low.
A number of techniques may be employed tomeet needs for additional capacity withoutcapital-intensive changes to the furnace. Theseinclude electrical boosting, oxy-fuel firing, andpreheat of the batch and cullet. These methodsmay also lower operating costs and improve theenvironmental performance of the furnace.
Electric boost is used to add heat to the glassbatch in a continuous gas-fired furnace by passing an electric current through the melt. This is typically accomplished by the placementof molybdenum electrodes in the sidewalls orbottom of the furnace. It is most often used toincrease productivity (tonnage) available froman existing furnace, without increasing airemissions or making major changes to thefurnace. Electric boost typically provides about10 to15 percent of energy requirements in thefurnace [EPA 1994].
For example, for an existing furnace operatingat 25 percent efficiency and producing100 tonsof glass per day, the addition of electricboosting could increase output to 160 tons perday and efficiency to 35 percent. Reducedcombustion of fuel results in lower surfacetemperatures, fewer volatiles, and less costs forpollution abatement and control. Electric

49
Top View of Furnace
Figure 4-5. End-Port Furnace [EPA 1986, EPA 1995, EPA 1994, EI 1998]
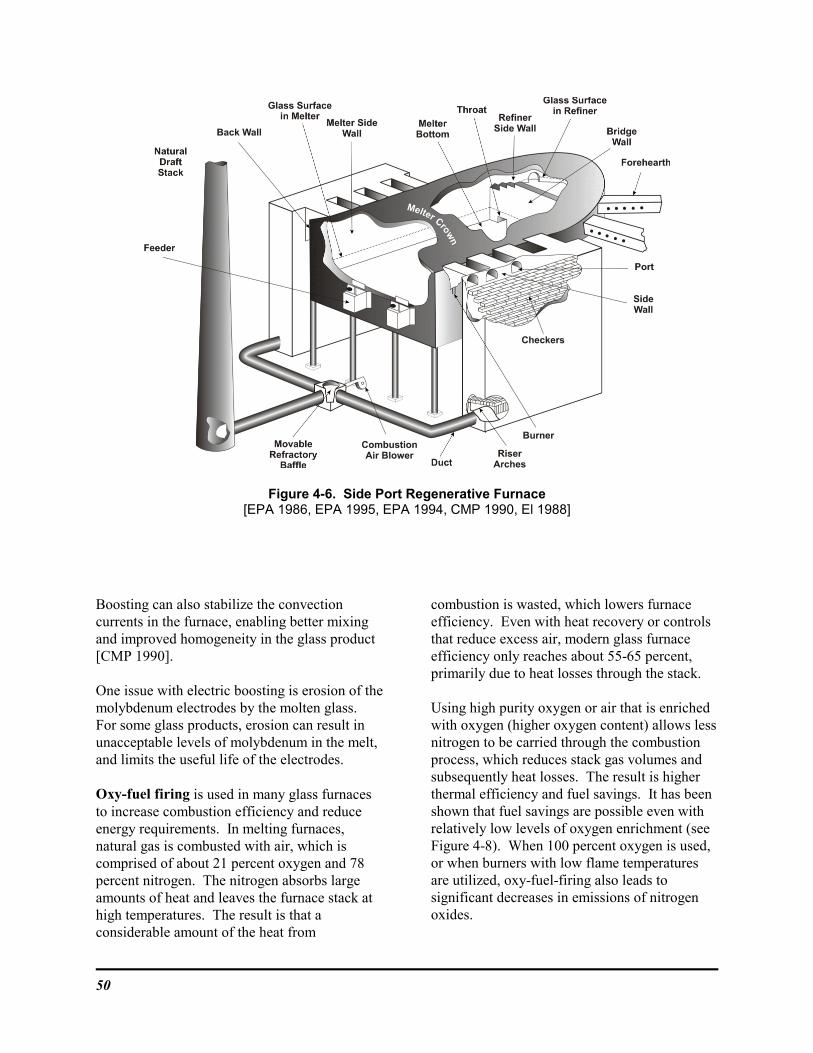
50
Figure 4-6. Side Port Regenerative Furnace[EPA 1986, EPA 1995, EPA 1994, CMP 1990, El 1988]
Boosting can also stabilize the convectioncurrents in the furnace, enabling better mixingand improved homogeneity in the glass product[CMP 1990].
One issue with electric boosting is erosion of themolybdenum electrodes by the molten glass. For some glass products, erosion can result inunacceptable levels of molybdenum in the melt,and limits the useful life of the electrodes.
Oxy-fuel firing is used in many glass furnacesto increase combustion efficiency and reduceenergy requirements. In melting furnaces,natural gas is combusted with air, which iscomprised of about 21 percent oxygen and 78percent nitrogen. The nitrogen absorbs largeamounts of heat and leaves the furnace stack athigh temperatures. The result is that aconsiderable amount of the heat from
combustion is wasted, which lowers furnaceefficiency. Even with heat recovery or controlsthat reduce excess air, modern glass furnaceefficiency only reaches about 55-65 percent,primarily due to heat losses through the stack.
Using high purity oxygen or air that is enrichedwith oxygen (higher oxygen content) allows less nitrogen to be carried through the combustionprocess, which reduces stack gas volumes and subsequently heat losses. The result is higherthermal efficiency and fuel savings. It has beenshown that fuel savings are possible even withrelatively low levels of oxygen enrichment (seeFigure 4-8). When 100 percent oxygen is used,or when burners with low flame temperaturesare utilized, oxy-fuel-firing also leads tosignificant decreases in emissions of nitrogenoxides.
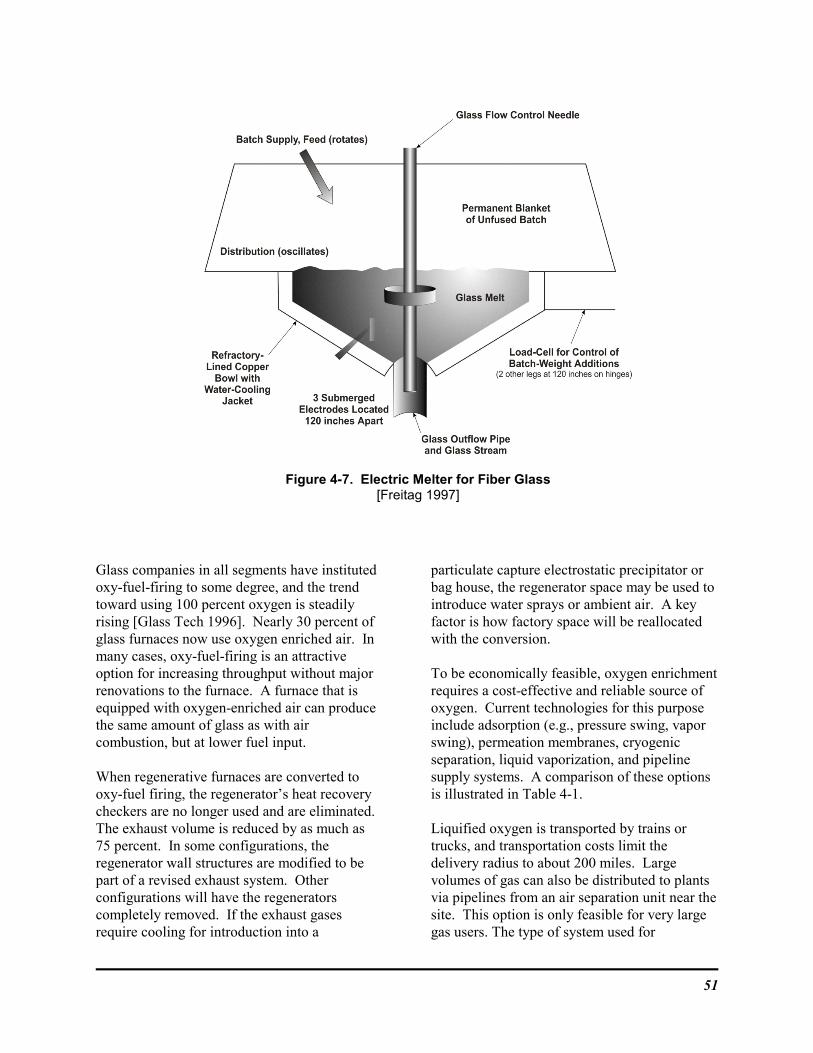
51
Figure 4-7. Electric Melter for Fiber Glass[Freitag 1997]
Glass companies in all segments have institutedoxy-fuel-firing to some degree, and the trendtoward using 100 percent oxygen is steadilyrising [Glass Tech 1996]. Nearly 30 percent ofglass furnaces now use oxygen enriched air. Inmany cases, oxy-fuel-firing is an attractiveoption for increasing throughput without majorrenovations to the furnace. A furnace that isequipped with oxygen-enriched air can producethe same amount of glass as with aircombustion, but at lower fuel input.
When regenerative furnaces are converted tooxy-fuel firing, the regenerator’s heat recoverycheckers are no longer used and are eliminated. The exhaust volume is reduced by as much as75 percent. In some configurations, theregenerator wall structures are modified to bepart of a revised exhaust system. Otherconfigurations will have the regeneratorscompletely removed. If the exhaust gasesrequire cooling for introduction into a
particulate capture electrostatic precipitator orbag house, the regenerator space may be used tointroduce water sprays or ambient air. A keyfactor is how factory space will be reallocatedwith the conversion.
To be economically feasible, oxygen enrichmentrequires a cost-effective and reliable source ofoxygen. Current technologies for this purposeinclude adsorption (e.g., pressure swing, vapor swing), permeation membranes, cryogenicseparation, liquid vaporization, and pipelinesupply systems. A comparison of these optionsis illustrated in Table 4-1.
Liquified oxygen is transported by trains ortrucks, and transportation costs limit thedelivery radius to about 200 miles. Largevolumes of gas can also be distributed to plantsvia pipelines from an air separation unit near thesite. This option is only feasible for very largegas users. The type of system used for
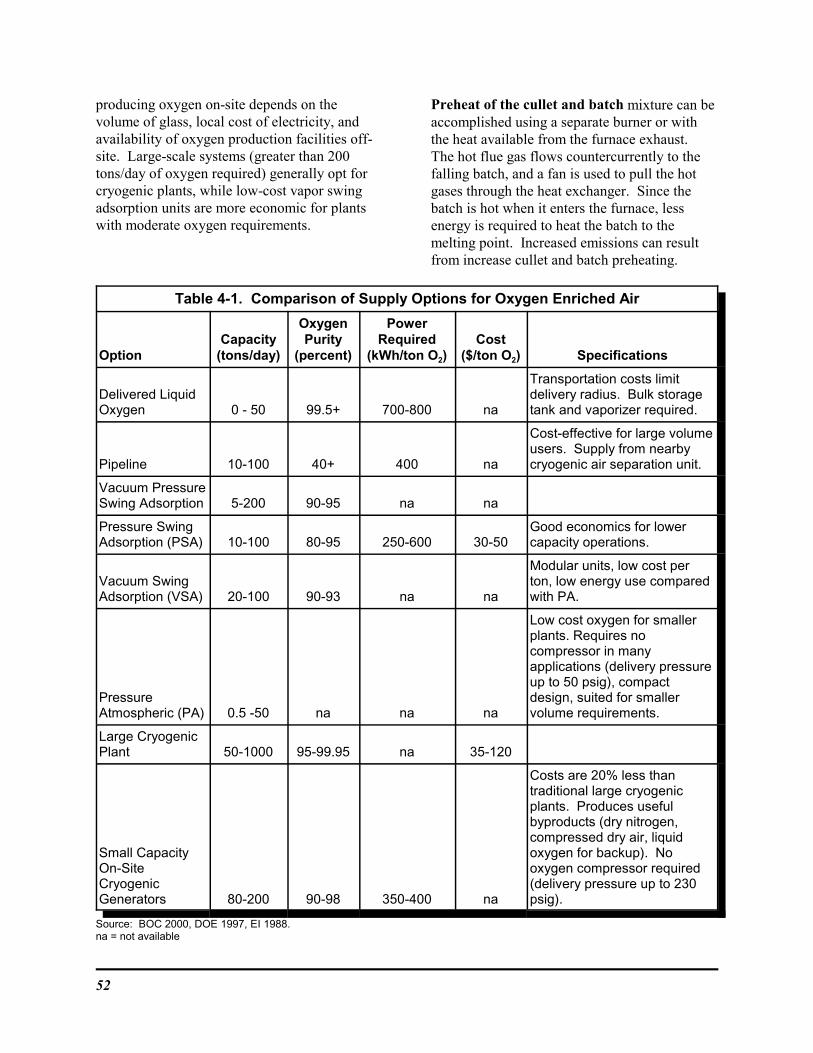
52
producing oxygen on-site depends on thevolume of glass, local cost of electricity, andavailability of oxygen production facilities off-site. Large-scale systems (greater than 200tons/day of oxygen required) generally opt forcryogenic plants, while low-cost vapor swingadsorption units are more economic for plantswith moderate oxygen requirements.
Preheat of the cullet and batch mixture can beaccomplished using a separate burner or withthe heat available from the furnace exhaust. The hot flue gas flows countercurrently to thefalling batch, and a fan is used to pull the hotgases through the heat exchanger. Since thebatch is hot when it enters the furnace, lessenergy is required to heat the batch to themelting point. Increased emissions can resultfrom increase cullet and batch preheating.
Table 4-1. Comparison of Supply Options for Oxygen Enriched Air
OptionCapacity
(tons/day)
OxygenPurity
(percent)
PowerRequired
(kWh/ton O2)Cost
($/ton O2) Specifications
Delivered LiquidOxygen 0 - 50 99.5+ 700-800 na
Transportation costs limitdelivery radius. Bulk storagetank and vaporizer required.
Pipeline 10-100 40+ 400 na
Cost-effective for large volumeusers. Supply from nearbycryogenic air separation unit.
Vacuum PressureSwing Adsorption 5-200 90-95 na na
Pressure SwingAdsorption (PSA) 10-100 80-95 250-600 30-50
Good economics for lowercapacity operations.
Vacuum SwingAdsorption (VSA) 20-100 90-93 na na
Modular units, low cost perton, low energy use comparedwith PA.
PressureAtmospheric (PA) 0.5 -50 na na na
Low cost oxygen for smallerplants. Requires nocompressor in manyapplications (delivery pressureup to 50 psig), compactdesign, suited for smallervolume requirements.
Large CryogenicPlant 50-1000 95-99.95 na 35-120
Small CapacityOn-SiteCryogenicGenerators 80-200 90-98 350-400 na
Costs are 20% less thantraditional large cryogenicplants. Produces usefulbyproducts (dry nitrogen,compressed dry air, liquidoxygen for backup). Nooxygen compressor required(delivery pressure up to 230psig).
Source: BOC 2000, DOE 1997, EI 1988.na = not available
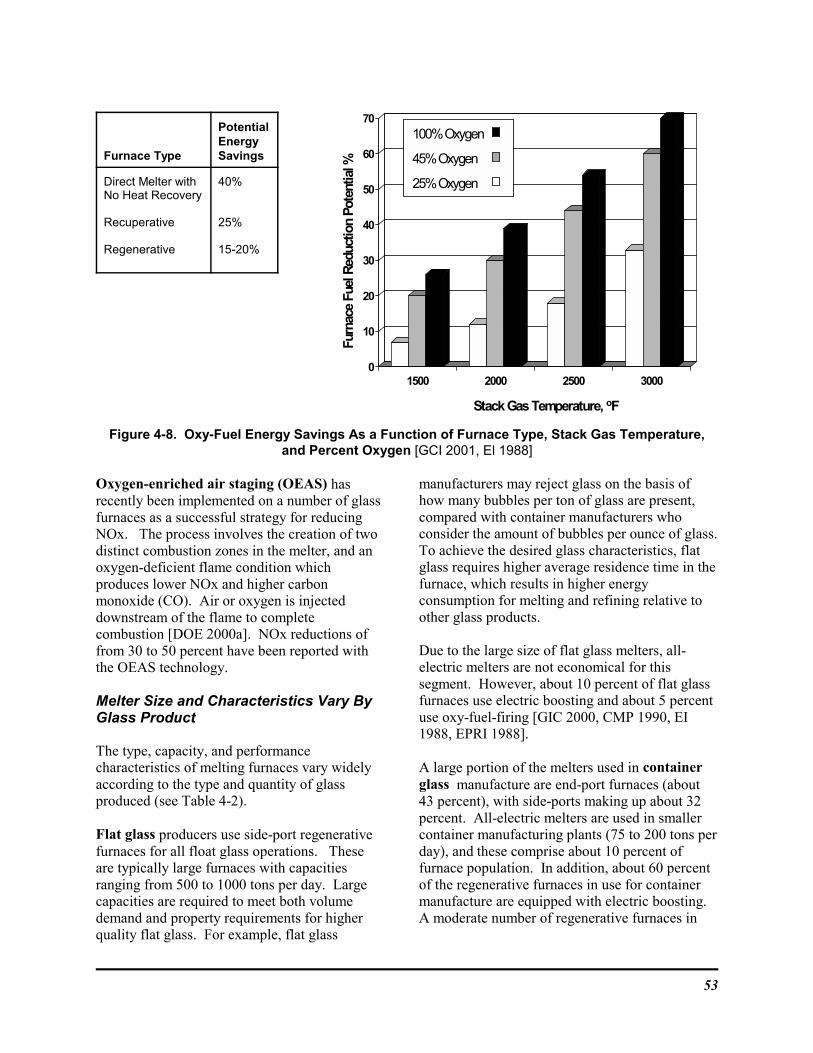
53
0
10
20
30
40
50
60
70
1500 2000 2500 3000
Furn
ace
Fuel
Red
uctio
n Po
tent
ial %
Stack Gas Temperature, oF
100% Oxygen
45% Oxygen
25% Oxygen
Furnace Type
PotentialEnergySavings
Direct Melter withNo Heat Recovery
Recuperative
Regenerative
40%
25%
15-20%
Figure 4-8. Oxy-Fuel Energy Savings As a Function of Furnace Type, Stack Gas Temperature,and Percent Oxygen [GCI 2001, El 1988]
Oxygen-enriched air staging (OEAS) hasrecently been implemented on a number of glassfurnaces as a successful strategy for reducingNOx. The process involves the creation of twodistinct combustion zones in the melter, and anoxygen-deficient flame condition whichproduces lower NOx and higher carbonmonoxide (CO). Air or oxygen is injecteddownstream of the flame to completecombustion [DOE 2000a]. NOx reductions offrom 30 to 50 percent have been reported withthe OEAS technology.
Melter Size and Characteristics Vary ByGlass Product
The type, capacity, and performancecharacteristics of melting furnaces vary widelyaccording to the type and quantity of glassproduced (see Table 4-2).
Flat glass producers use side-port regenerativefurnaces for all float glass operations. Theseare typically large furnaces with capacitiesranging from 500 to 1000 tons per day. Largecapacities are required to meet both volumedemand and property requirements for higherquality flat glass. For example, flat glass
manufacturers may reject glass on the basis ofhow many bubbles per ton of glass are present,compared with container manufacturers whoconsider the amount of bubbles per ounce of glass. To achieve the desired glass characteristics, flatglass requires higher average residence time in thefurnace, which results in higher energyconsumption for melting and refining relative toother glass products.
Due to the large size of flat glass melters, all-electric melters are not economical for thissegment. However, about 10 percent of flat glassfurnaces use electric boosting and about 5 percentuse oxy-fuel-firing [GIC 2000, CMP 1990, EI1988, EPRI 1988].
A large portion of the melters used in containerglass manufacture are end-port furnaces (about43 percent), with side-ports making up about 32percent. All-electric melters are used in smallercontainer manufacturing plants (75 to 200 tons perday), and these comprise about 10 percent offurnace population. In addition, about 60 percentof the regenerative furnaces in use for containermanufacture are equipped with electric boosting. A moderate number of regenerative furnaces in
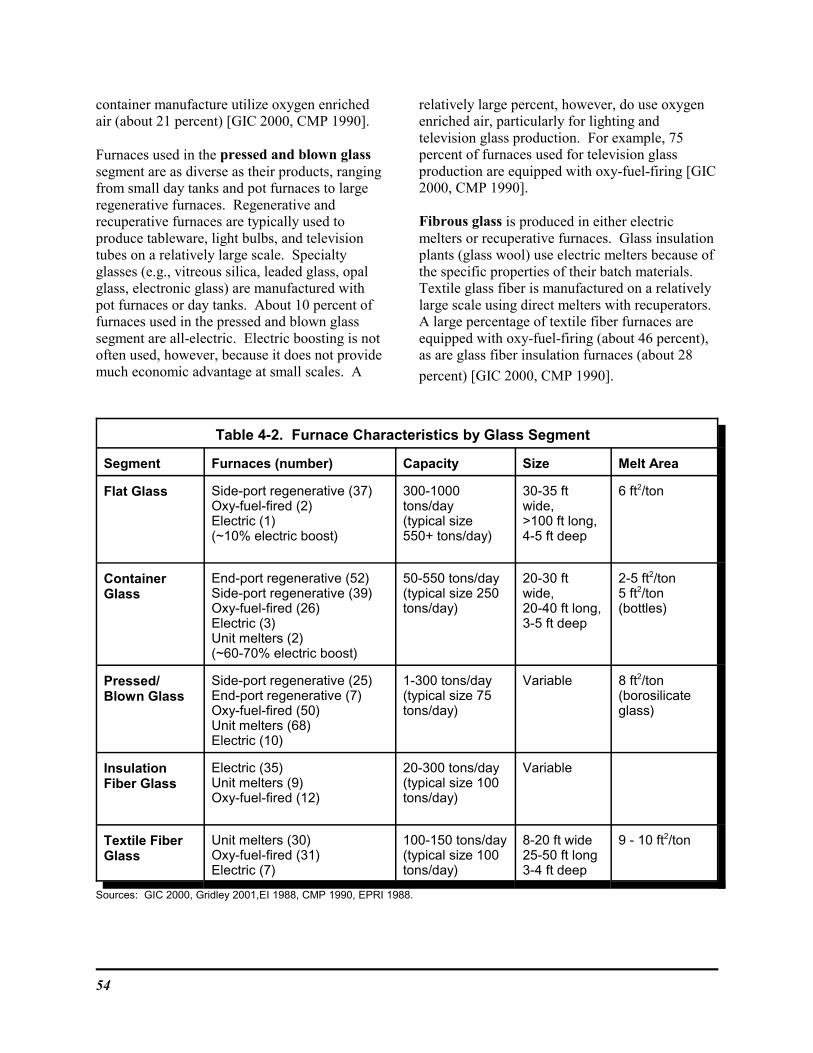
54
container manufacture utilize oxygen enrichedair (about 21 percent) [GIC 2000, CMP 1990].
Furnaces used in the pressed and blown glasssegment are as diverse as their products, rangingfrom small day tanks and pot furnaces to largeregenerative furnaces. Regenerative andrecuperative furnaces are typically used toproduce tableware, light bulbs, and televisiontubes on a relatively large scale. Specialtyglasses (e.g., vitreous silica, leaded glass, opalglass, electronic glass) are manufactured withpot furnaces or day tanks. About 10 percent offurnaces used in the pressed and blown glasssegment are all-electric. Electric boosting is notoften used, however, because it does not providemuch economic advantage at small scales. A
relatively large percent, however, do use oxygenenriched air, particularly for lighting andtelevision glass production. For example, 75percent of furnaces used for television glassproduction are equipped with oxy-fuel-firing [GIC2000, CMP 1990].
Fibrous glass is produced in either electricmelters or recuperative furnaces. Glass insulationplants (glass wool) use electric melters because ofthe specific properties of their batch materials. Textile glass fiber is manufactured on a relativelylarge scale using direct melters with recuperators. A large percentage of textile fiber furnaces areequipped with oxy-fuel-firing (about 46 percent),as are glass fiber insulation furnaces (about 28
percent) [GIC 2000, CMP 1990].
Table 4-2. Furnace Characteristics by Glass Segment
Segment Furnaces (number) Capacity Size Melt Area
Flat Glass Side-port regenerative (37)Oxy-fuel-fired (2)Electric (1)(~10% electric boost)
300-1000tons/day(typical size550+ tons/day)
30-35 ftwide, >100 ft long,4-5 ft deep
6 ft2/ton
ContainerGlass
End-port regenerative (52)Side-port regenerative (39)Oxy-fuel-fired (26)Electric (3)Unit melters (2)(~60-70% electric boost)
50-550 tons/day(typical size 250tons/day)
20-30 ftwide, 20-40 ft long,3-5 ft deep
2-5 ft2/ton5 ft2/ton(bottles)
Pressed/Blown Glass
Side-port regenerative (25)End-port regenerative (7)Oxy-fuel-fired (50)Unit melters (68)Electric (10)
1-300 tons/day(typical size 75tons/day)
Variable 8 ft2/ton(borosilicateglass)
InsulationFiber Glass
Electric (35)Unit melters (9)Oxy-fuel-fired (12)
20-300 tons/day(typical size 100tons/day)
Variable
Textile FiberGlass
Unit melters (30)Oxy-fuel-fired (31)Electric (7)
100-150 tons/day(typical size 100tons/day)
8-20 ft wide25-50 ft long3-4 ft deep
9 - 10 ft2/ton
Sources: GIC 2000, Gridley 2001,EI 1988, CMP 1990, EPRI 1988.
55
4.2 Summary of Inputs andOutputs for Melting
Inputs Outputs
Crushed CulletGlass BatchRefining AgentsNatural GasFuel OilElectricityAir/Oxygen
Molten GlassFlue GasParticulates/DustFurnace SlagRefractory Wastes
4.3 Energy Requirements
Melting and Refining Accounts for Mostof the Energy Consumed in GlassManufacture
Melting and refining of the glass batch is themost energy-intensive part of glass manufacturebecause of the high temperature chemistryinvolved in glass formation. Melting of rawmaterials consumes 60-70 percent of the totalenergy used to produce glass. In general, about40 percent of the energy consumed in meltinggoes toward heating the batch and for thechemical conversion of the batch constituents.
As much as 30 percent of energy can be lostthrough the structure, and about 30 percent is lostthrough flue gas exiting the stack. The energylosses through structure and flue gases areproportional to the size of the melter. In general,smaller fossil-fuel fired melters will exhibitproportionately higher losses than larger furnaces [EPA 1994, EI 1988].
Theoretically, energy requirements for melting aton of glass batch can be calculated from the heatcapacity and heats of fusion of major components(silicon oxide, sodium carbonate, calciumcarbonate, calcium fluoride, feldspar). Inpractice, energy requirements for glass furnacesvary considerably depending upon furnace typeand operating conditions as well as glasscomposition.
Melting furnaces are fired with fossil fuels(mostly natural gas) or by electricity (electricalresistance heating). In some cases a combinationof both is used. Most large continuous furnacesare fueled with natural gas. Many of these meltersalso use electrical boosting, where the melt is“boosted” by being resistively heated rather thanby adding a resistive heater.
Electric boost and other techniques such asoxygen-enriched combustion air, culletpreheating, better combustion control, orincreased insulation, can lower fuel requirementsor increase glass production given the same fuelload. The Process Overview, Section 4.1 providesdetails on some of these technologies.
Small discontinuous furnaces can be fired withnatural gas or electricity, and thermal efficienciesare very low (20 percent or less). Efficiencies inregenerative furnaces are typically much higher(60-65 percent). All-electric furnaces can be from70-90 percent efficient (not considering the lowefficiency of electricity generation off-site, whichranges from 25-30 percent). Electric melters aremore efficient because there are no heat losses inthe stack or regenerator. [EPA 1994, EPRI 1988]
The fuel chosen depends upon the type of glassproduced, the capacity of the melter, and fuelcosts. For example, large furnaces such as thoseused in flat glass production are fired with naturalgas rather than electricity due to the higher cost ofelectricity. A comparison of fuel requirements fordifferent furnaces is shown in Table 4-3. Actualfuel requirements can vary significantly betweenfurnaces due to differences in furnace size,composition of the glass being melted, and thedesired final product.
Average energy consumption for melting, giventhe current distribution of glass furnaces, is shownin Table 4-4, separated by glass segment. Thelarger specific energy requirements for pressedand blown glass are indicative of the relativelyinefficient furnaces commonly in use in thissegment (e.g., day tanks, pot furnaces, unitmelters).
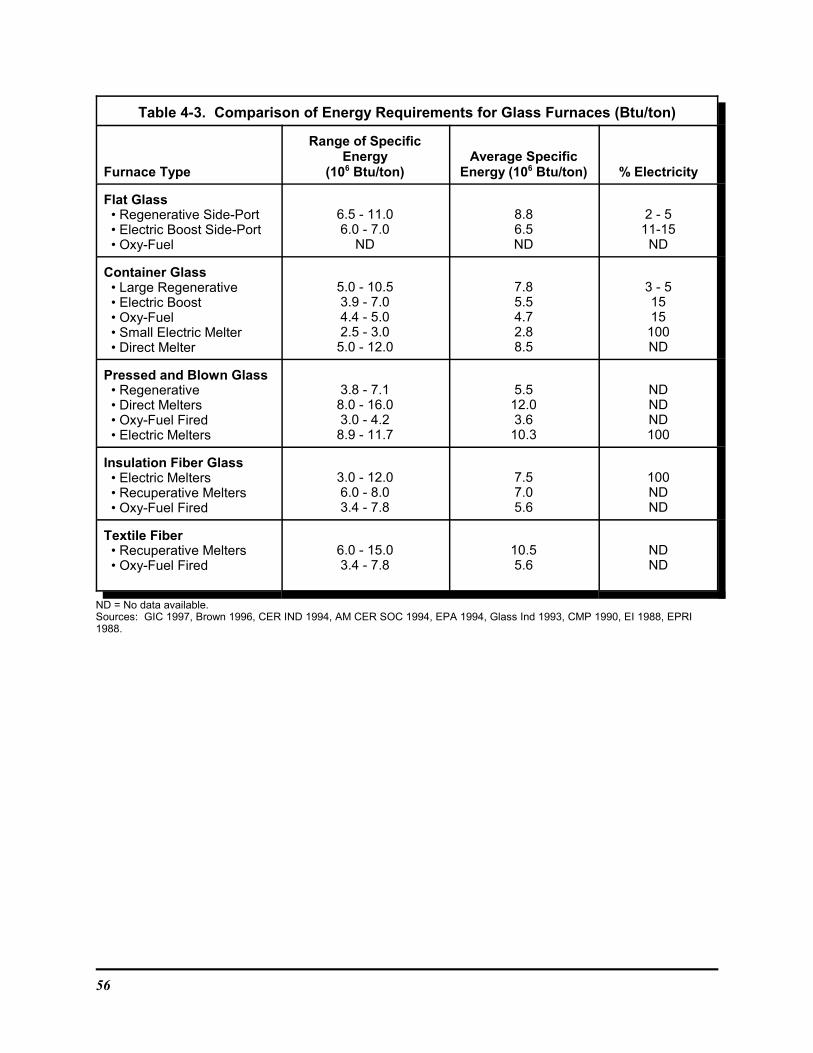
56
Table 4-3. Comparison of Energy Requirements for Glass Furnaces (Btu/ton)
Furnace Type
Range of SpecificEnergy
(106 Btu/ton)Average Specific
Energy (106 Btu/ton) % Electricity
Flat Glass • Regenerative Side-Port • Electric Boost Side-Port • Oxy-Fuel
6.5 - 11.06.0 - 7.0
ND
8.86.5ND
2 - 511-15
ND
Container Glass • Large Regenerative • Electric Boost • Oxy-Fuel • Small Electric Melter • Direct Melter
5.0 - 10.53.9 - 7.04.4 - 5.02.5 - 3.05.0 - 12.0
7.85.54.72.88.5
3 - 51515100ND
Pressed and Blown Glass • Regenerative • Direct Melters • Oxy-Fuel Fired • Electric Melters
3.8 - 7.18.0 - 16.03.0 - 4.28.9 - 11.7
5.512.03.6
10.3
NDNDND100
Insulation Fiber Glass • Electric Melters • Recuperative Melters • Oxy-Fuel Fired
3.0 - 12.06.0 - 8.03.4 - 7.8
7.57.05.6
100NDND
Textile Fiber • Recuperative Melters • Oxy-Fuel Fired
6.0 - 15.03.4 - 7.8
10.55.6
NDND
ND = No data available.Sources: GIC 1997, Brown 1996, CER IND 1994, AM CER SOC 1994, EPA 1994, Glass Ind 1993, CMP 1990, EI 1988, EPRI1988.
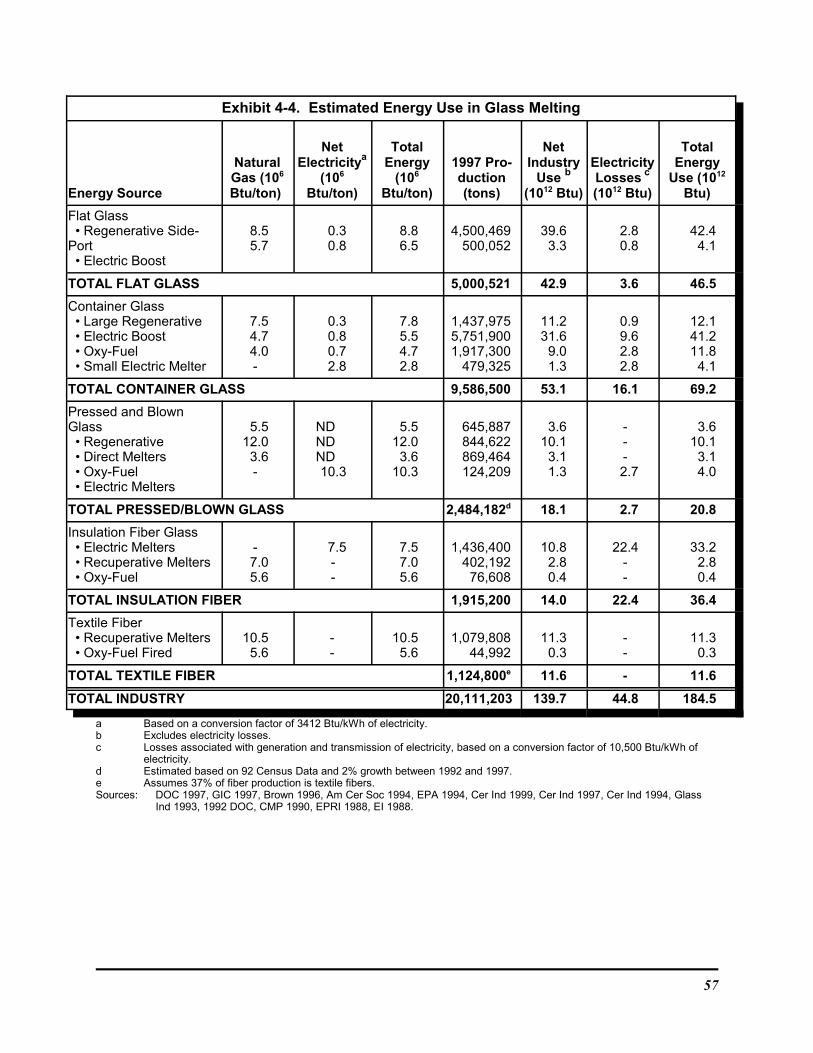
57
Exhibit 4-4. Estimated Energy Use in Glass Melting
Energy Source
NaturalGas (106
Btu/ton)
NetElectricitya
(106
Btu/ton)
TotalEnergy
(106
Btu/ton)
1997 Pro-duction(tons)
NetIndustry
Use b
(1012 Btu)
ElectricityLosses c
(1012 Btu)
TotalEnergy
Use (1012
Btu)
Flat Glass • Regenerative Side-Port • Electric Boost
8.55.7
0.30.8
8.86.5
4,500,469500,052
39.63.3
2.80.8
42.44.1
TOTAL FLAT GLASS 5,000,521 42.9 3.6 46.5
Container Glass • Large Regenerative • Electric Boost • Oxy-Fuel • Small Electric Melter
7.54.74.0-
0.30.80.72.8
7.85.54.72.8
1,437,9755,751,9001,917,300
479,325
11.231.6
9.01.3
0.99.62.82.8
12.141.211.8
4.1
TOTAL CONTAINER GLASS 9,586,500 53.1 16.1 69.2
Pressed and BlownGlass • Regenerative • Direct Melters • Oxy-Fuel • Electric Melters
5.512.0
3.6-
NDNDND10.3
5.512.0
3.610.3
645,887844,622869,464124,209
3.610.1
3.11.3
---2.7
3.610.1
3.14.0
TOTAL PRESSED/BLOWN GLASS 2,484,182d 18.1 2.7 20.8
Insulation Fiber Glass • Electric Melters • Recuperative Melters • Oxy-Fuel
-7.05.6
7.5--
7.57.05.6
1,436,400402,192
76,608
10.82.80.4
22.4--
33.22.80.4
TOTAL INSULATION FIBER 1,915,200 14.0 22.4 36.4
Textile Fiber • Recuperative Melters • Oxy-Fuel Fired
10.55.6
--
10.55.6
1,079,80844,992
11.30.3
--
11.30.3
TOTAL TEXTILE FIBER 1,124,800e 11.6 - 11.6
TOTAL INDUSTRY 20,111,203 139.7 44.8 184.5
a Based on a conversion factor of 3412 Btu/kWh of electricity.b Excludes electricity losses.c Losses associated with generation and transmission of electricity, based on a conversion factor of 10,500 Btu/kWh of
electricity.d Estimated based on 92 Census Data and 2% growth between 1992 and 1997.e Assumes 37% of fiber production is textile fibers.Sources: DOC 1997, GIC 1997, Brown 1996, Am Cer Soc 1994, EPA 1994, Cer Ind 1999, Cer Ind 1997, Cer Ind 1994, Glass
Ind 1993, 1992 DOC, CMP 1990, EPRI 1988, EI 1988.
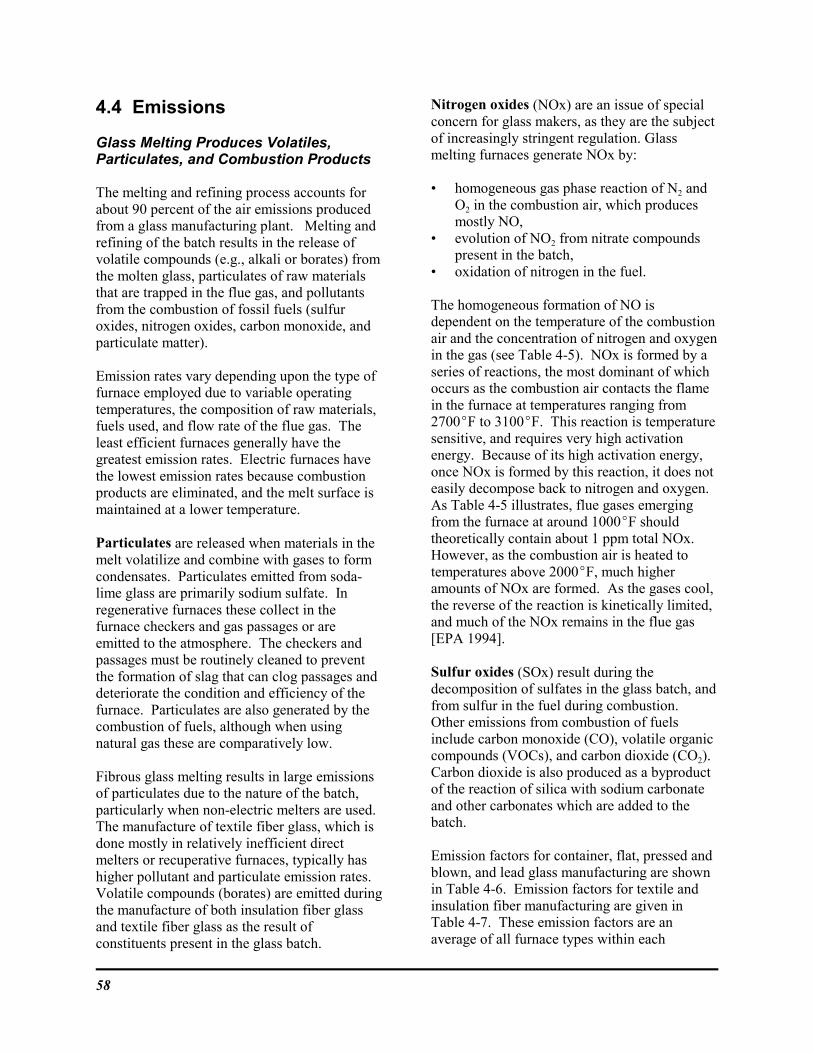
58
4.4 Emissions
Glass Melting Produces Volatiles,Particulates, and Combustion Products
The melting and refining process accounts forabout 90 percent of the air emissions producedfrom a glass manufacturing plant. Melting andrefining of the batch results in the release ofvolatile compounds (e.g., alkali or borates) fromthe molten glass, particulates of raw materialsthat are trapped in the flue gas, and pollutantsfrom the combustion of fossil fuels (sulfuroxides, nitrogen oxides, carbon monoxide, andparticulate matter).
Emission rates vary depending upon the type offurnace employed due to variable operatingtemperatures, the composition of raw materials,fuels used, and flow rate of the flue gas. Theleast efficient furnaces generally have thegreatest emission rates. Electric furnaces havethe lowest emission rates because combustionproducts are eliminated, and the melt surface ismaintained at a lower temperature.
Particulates are released when materials in themelt volatilize and combine with gases to formcondensates. Particulates emitted from soda-lime glass are primarily sodium sulfate. Inregenerative furnaces these collect in thefurnace checkers and gas passages or areemitted to the atmosphere. The checkers andpassages must be routinely cleaned to preventthe formation of slag that can clog passages anddeteriorate the condition and efficiency of thefurnace. Particulates are also generated by thecombustion of fuels, although when usingnatural gas these are comparatively low.
Fibrous glass melting results in large emissionsof particulates due to the nature of the batch,particularly when non-electric melters are used. The manufacture of textile fiber glass, which isdone mostly in relatively inefficient directmelters or recuperative furnaces, typically hashigher pollutant and particulate emission rates. Volatile compounds (borates) are emitted duringthe manufacture of both insulation fiber glassand textile fiber glass as the result ofconstituents present in the glass batch.
Nitrogen oxides (NOx) are an issue of specialconcern for glass makers, as they are the subjectof increasingly stringent regulation. Glassmelting furnaces generate NOx by:
• homogeneous gas phase reaction of N2 andO2 in the combustion air, which producesmostly NO,
• evolution of NO2 from nitrate compoundspresent in the batch,
• oxidation of nitrogen in the fuel.
The homogeneous formation of NO isdependent on the temperature of the combustionair and the concentration of nitrogen and oxygenin the gas (see Table 4-5). NOx is formed by aseries of reactions, the most dominant of whichoccurs as the combustion air contacts the flamein the furnace at temperatures ranging from2700EF to 3100EF. This reaction is temperaturesensitive, and requires very high activationenergy. Because of its high activation energy,once NOx is formed by this reaction, it does noteasily decompose back to nitrogen and oxygen. As Table 4-5 illustrates, flue gases emergingfrom the furnace at around 1000EF shouldtheoretically contain about 1 ppm total NOx. However, as the combustion air is heated totemperatures above 2000EF, much higheramounts of NOx are formed. As the gases cool,the reverse of the reaction is kinetically limited,and much of the NOx remains in the flue gas[EPA 1994].
Sulfur oxides (SOx) result during thedecomposition of sulfates in the glass batch, andfrom sulfur in the fuel during combustion. Other emissions from combustion of fuelsinclude carbon monoxide (CO), volatile organiccompounds (VOCs), and carbon dioxide (CO2). Carbon dioxide is also produced as a byproductof the reaction of silica with sodium carbonateand other carbonates which are added to thebatch.
Emission factors for container, flat, pressed andblown, and lead glass manufacturing are shownin Table 4-6. Emission factors for textile andinsulation fiber manufacturing are given inTable 4-7. These emission factors are anaverage of all furnace types within each
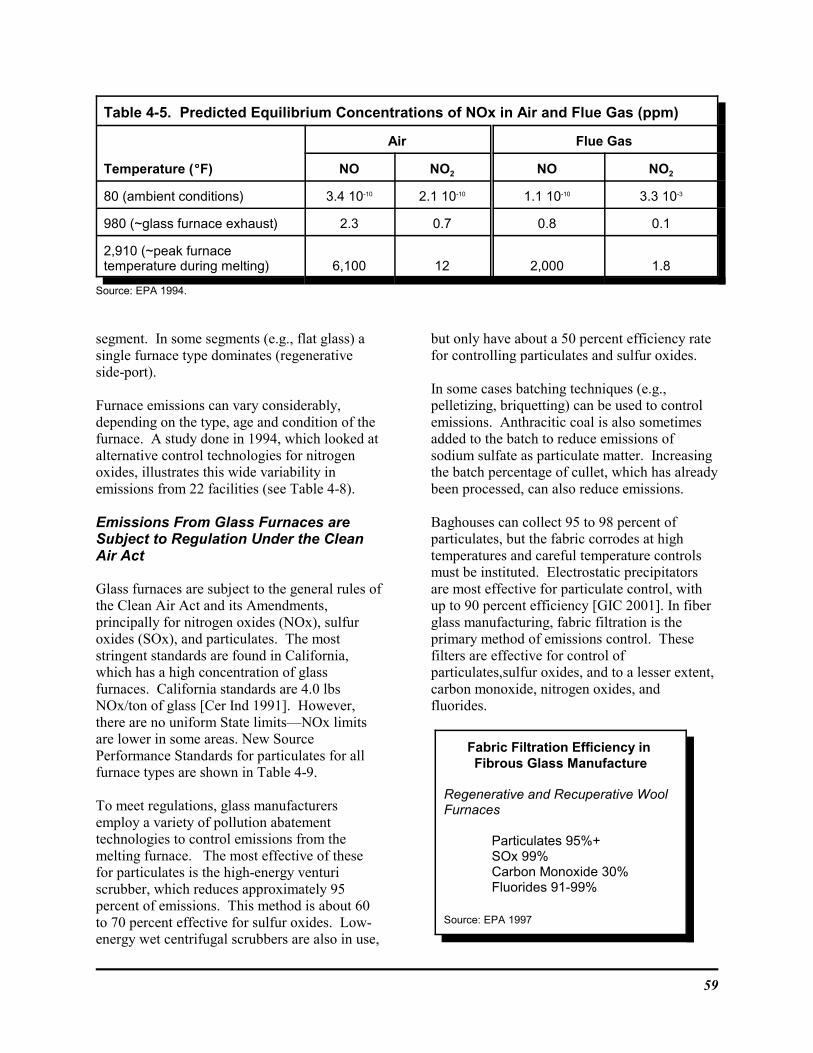
59
Table 4-5. Predicted Equilibrium Concentrations of NOx in Air and Flue Gas (ppm)
Temperature (EEEEF)
Air Flue Gas
NO NO2 NO NO2
80 (ambient conditions) 3.4 10-10 2.1 10-10 1.1 10-10 3.3 10-3
980 (~glass furnace exhaust) 2.3 0.7 0.8 0.1
2,910 (~peak furnacetemperature during melting) 6,100 12 2,000 1.8
Source: EPA 1994.
segment. In some segments (e.g., flat glass) asingle furnace type dominates (regenerativeside-port).
Furnace emissions can vary considerably,depending on the type, age and condition of thefurnace. A study done in 1994, which looked atalternative control technologies for nitrogenoxides, illustrates this wide variability inemissions from 22 facilities (see Table 4-8).
Emissions From Glass Furnaces areSubject to Regulation Under the CleanAir Act
Glass furnaces are subject to the general rules ofthe Clean Air Act and its Amendments,principally for nitrogen oxides (NOx), sulfuroxides (SOx), and particulates. The moststringent standards are found in California,which has a high concentration of glassfurnaces. California standards are 4.0 lbsNOx/ton of glass [Cer Ind 1991]. However,there are no uniform State limits—NOx limitsare lower in some areas. New SourcePerformance Standards for particulates for allfurnace types are shown in Table 4-9.
To meet regulations, glass manufacturersemploy a variety of pollution abatementtechnologies to control emissions from themelting furnace. The most effective of thesefor particulates is the high-energy venturiscrubber, which reduces approximately 95percent of emissions. This method is about 60to 70 percent effective for sulfur oxides. Low-energy wet centrifugal scrubbers are also in use,
but only have about a 50 percent efficiency ratefor controlling particulates and sulfur oxides.
In some cases batching techniques (e.g.,pelletizing, briquetting) can be used to controlemissions. Anthracitic coal is also sometimesadded to the batch to reduce emissions ofsodium sulfate as particulate matter. Increasingthe batch percentage of cullet, which has alreadybeen processed, can also reduce emissions.
Baghouses can collect 95 to 98 percent ofparticulates, but the fabric corrodes at hightemperatures and careful temperature controlsmust be instituted. Electrostatic precipitatorsare most effective for particulate control, withup to 90 percent efficiency [GIC 2001]. In fiberglass manufacturing, fabric filtration is theprimary method of emissions control. Thesefilters are effective for control ofparticulates,sulfur oxides, and to a lesser extent,carbon monoxide, nitrogen oxides, andfluorides.
Fabric Filtration Efficiency in Fibrous Glass Manufacture
Regenerative and Recuperative WoolFurnaces
Particulates 95%+SOx 99%Carbon Monoxide 30%Fluorides 91-99%
Source: EPA 1997
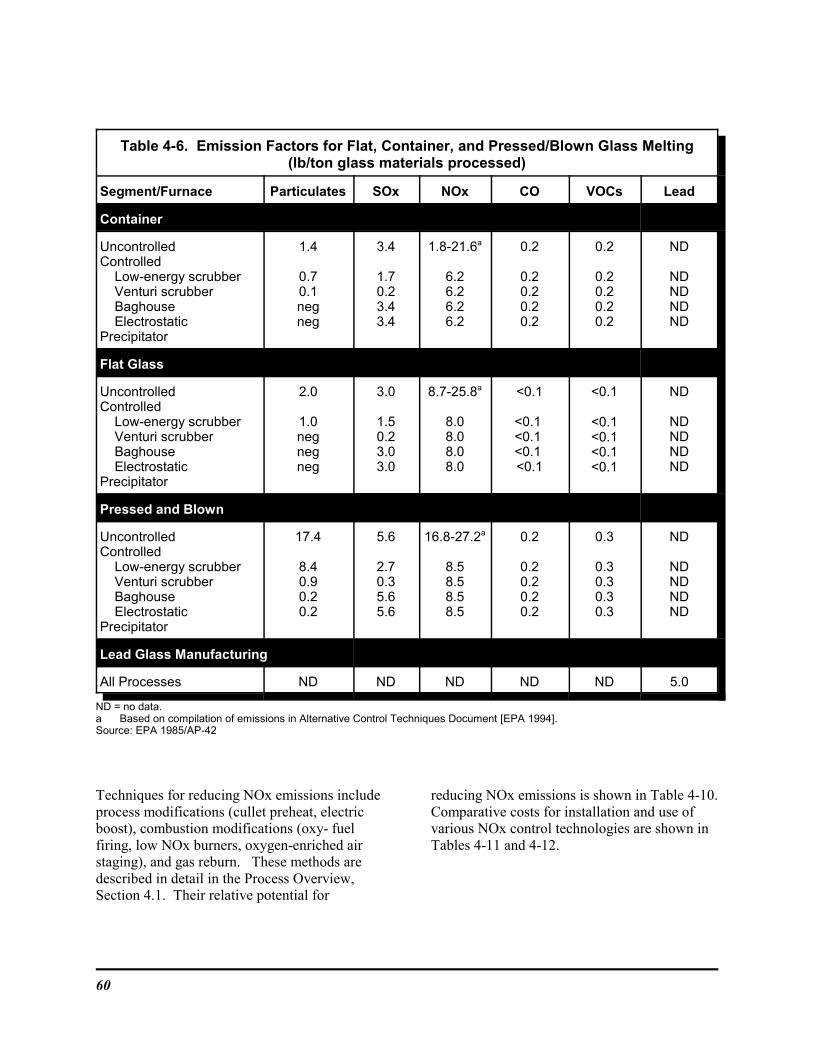
60
Table 4-6. Emission Factors for Flat, Container, and Pressed/Blown Glass Melting(lb/ton glass materials processed)
Segment/Furnace Particulates SOx NOx CO VOCs Lead
Container
UncontrolledControlled Low-energy scrubber Venturi scrubber Baghouse ElectrostaticPrecipitator
1.4
0.70.1negneg
3.4
1.70.23.43.4
1.8-21.6a
6.26.26.26.2
0.2
0.20.20.20.2
0.2
0.20.20.20.2
ND
NDNDNDND
Flat Glass
UncontrolledControlled Low-energy scrubber Venturi scrubber Baghouse ElectrostaticPrecipitator
2.0
1.0negnegneg
3.0
1.50.23.03.0
8.7-25.8a
8.08.08.08.0
<0.1
<0.1 <0.1 <0.1 <0.1
<0.1
<0.1<0.1<0.1<0.1
ND
NDNDNDND
Pressed and Blown
UncontrolledControlled Low-energy scrubber Venturi scrubber Baghouse ElectrostaticPrecipitator
17.4
8.40.90.20.2
5.6
2.70.35.65.6
16.8-27.2a
8.58.58.58.5
0.2
0.20.20.20.2
0.3
0.30.30.30.3
ND
NDNDNDND
Lead Glass Manufacturing
All Processes ND ND ND ND ND 5.0
ND = no data.a Based on compilation of emissions in Alternative Control Techniques Document [EPA 1994].Source: EPA 1985/AP-42
Techniques for reducing NOx emissions includeprocess modifications (cullet preheat, electricboost), combustion modifications (oxy- fuelfiring, low NOx burners, oxygen-enriched airstaging), and gas reburn. These methods aredescribed in detail in the Process Overview,Section 4.1. Their relative potential for
reducing NOx emissions is shown in Table 4-10. Comparative costs for installation and use ofvarious NOx control technologies are shown inTables 4-11 and 4-12.
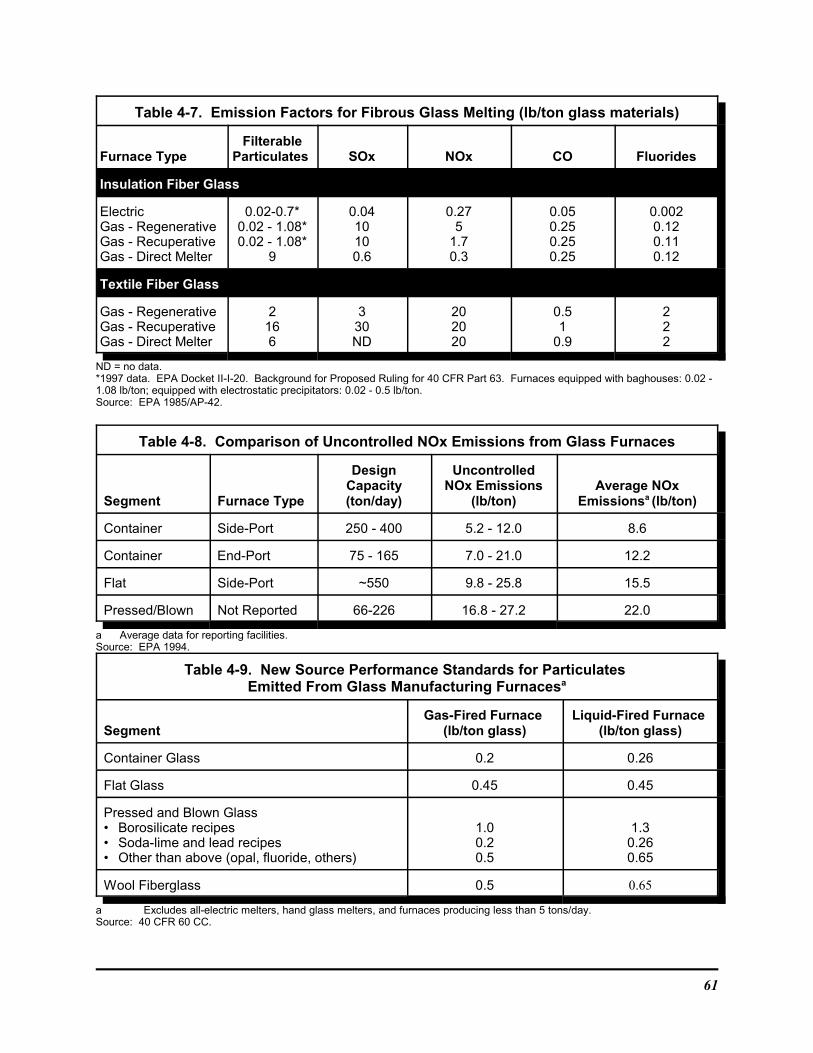
61
Table 4-7. Emission Factors for Fibrous Glass Melting (lb/ton glass materials)
Furnace TypeFilterable
Particulates SOx NOx CO Fluorides
Insulation Fiber Glass
ElectricGas - RegenerativeGas - RecuperativeGas - Direct Melter
0.02-0.7*0.02 - 1.08*0.02 - 1.08*
9
0.0410100.6
0.275
1.70.3
0.050.250.250.25
0.0020.120.110.12
Textile Fiber Glass
Gas - RegenerativeGas - RecuperativeGas - Direct Melter
2166
330ND
202020
0.51
0.9
222
ND = no data.*1997 data. EPA Docket II-I-20. Background for Proposed Ruling for 40 CFR Part 63. Furnaces equipped with baghouses: 0.02 -1.08 lb/ton; equipped with electrostatic precipitators: 0.02 - 0.5 lb/ton.Source: EPA 1985/AP-42.
Table 4-8. Comparison of Uncontrolled NOx Emissions from Glass Furnaces
Segment Furnace Type
DesignCapacity(ton/day)
UncontrolledNOx Emissions
(lb/ton)Average NOx
Emissionsa (lb/ton)
Container Side-Port 250 - 400 5.2 - 12.0 8.6
Container End-Port 75 - 165 7.0 - 21.0 12.2
Flat Side-Port ~550 9.8 - 25.8 15.5
Pressed/Blown Not Reported 66-226 16.8 - 27.2 22.0
a Average data for reporting facilities. Source: EPA 1994.
Table 4-9. New Source Performance Standards for Particulates Emitted From Glass Manufacturing Furnacesa
SegmentGas-Fired Furnace
(lb/ton glass)Liquid-Fired Furnace
(lb/ton glass)
Container Glass 0.2 0.26
Flat Glass 0.45 0.45
Pressed and Blown Glass• Borosilicate recipes• Soda-lime and lead recipes• Other than above (opal, fluoride, others)
1.00.20.5
1.30.260.65
Wool Fiberglass 0.5 0.65
a Excludes all-electric melters, hand glass melters, and furnaces producing less than 5 tons/day.Source: 40 CFR 60 CC.
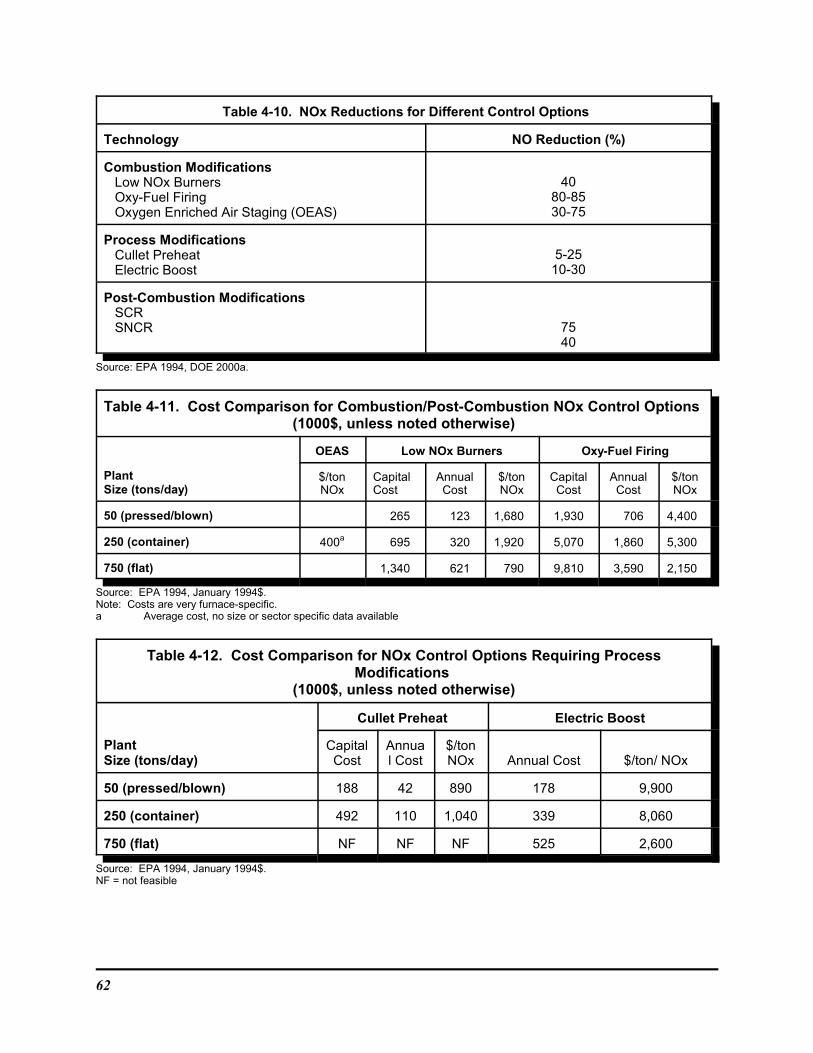
62
Table 4-10. NOx Reductions for Different Control Options
Technology NO Reduction (%)
Combustion Modifications Low NOx Burners Oxy-Fuel Firing Oxygen Enriched Air Staging (OEAS)
4080-8530-75
Process Modifications Cullet Preheat Electric Boost
5-2510-30
Post-Combustion Modifications SCR SNCR 75
40
Source: EPA 1994, DOE 2000a.
Table 4-11. Cost Comparison for Combustion/Post-Combustion NOx Control Options (1000$, unless noted otherwise)
Plant Size (tons/day)
OEAS Low NOx Burners Oxy-Fuel Firing
$/tonNOx
CapitalCost
AnnualCost
$/tonNOx
CapitalCost
AnnualCost
$/tonNOx
50 (pressed/blown) 265 123 1,680 1,930 706 4,400
250 (container) 400a 695 320 1,920 5,070 1,860 5,300
750 (flat) 1,340 621 790 9,810 3,590 2,150
Source: EPA 1994, January 1994$.Note: Costs are very furnace-specific.a Average cost, no size or sector specific data available
Table 4-12. Cost Comparison for NOx Control Options Requiring ProcessModifications
(1000$, unless noted otherwise)
Plant Size (tons/day)
Cullet Preheat Electric Boost
CapitalCost
Annual Cost
$/tonNOx Annual Cost $/ton/ NOx
50 (pressed/blown) 188 42 890 178 9,900
250 (container) 492 110 1,040 339 8,060
750 (flat) NF NF NF 525 2,600
Source: EPA 1994, January 1994$.NF = not feasible
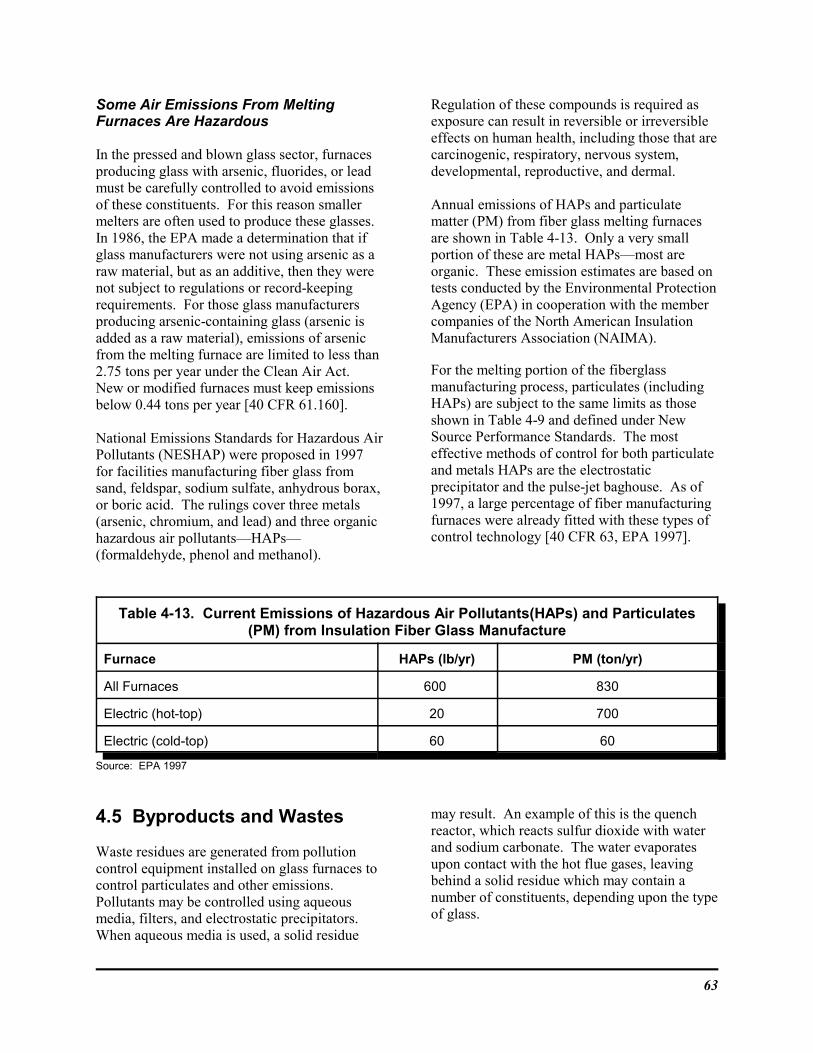
63
Some Air Emissions From MeltingFurnaces Are Hazardous
In the pressed and blown glass sector, furnacesproducing glass with arsenic, fluorides, or leadmust be carefully controlled to avoid emissionsof these constituents. For this reason smallermelters are often used to produce these glasses. In 1986, the EPA made a determination that ifglass manufacturers were not using arsenic as araw material, but as an additive, then they werenot subject to regulations or record-keepingrequirements. For those glass manufacturersproducing arsenic-containing glass (arsenic isadded as a raw material), emissions of arsenicfrom the melting furnace are limited to less than2.75 tons per year under the Clean Air Act. New or modified furnaces must keep emissionsbelow 0.44 tons per year [40 CFR 61.160].
National Emissions Standards for Hazardous AirPollutants (NESHAP) were proposed in 1997for facilities manufacturing fiber glass fromsand, feldspar, sodium sulfate, anhydrous borax,or boric acid. The rulings cover three metals(arsenic, chromium, and lead) and three organichazardous air pollutants—HAPs—(formaldehyde, phenol and methanol).
Regulation of these compounds is required asexposure can result in reversible or irreversibleeffects on human health, including those that arecarcinogenic, respiratory, nervous system,developmental, reproductive, and dermal.
Annual emissions of HAPs and particulatematter (PM) from fiber glass melting furnacesare shown in Table 4-13. Only a very smallportion of these are metal HAPs—most areorganic. These emission estimates are based ontests conducted by the Environmental ProtectionAgency (EPA) in cooperation with the membercompanies of the North American InsulationManufacturers Association (NAIMA).
For the melting portion of the fiberglassmanufacturing process, particulates (includingHAPs) are subject to the same limits as thoseshown in Table 4-9 and defined under NewSource Performance Standards. The mosteffective methods of control for both particulateand metals HAPs are the electrostaticprecipitator and the pulse-jet baghouse. As of1997, a large percentage of fiber manufacturingfurnaces were already fitted with these types ofcontrol technology [40 CFR 63, EPA 1997].
Table 4-13. Current Emissions of Hazardous Air Pollutants(HAPs) and Particulates(PM) from Insulation Fiber Glass Manufacture
Furnace HAPs (lb/yr) PM (ton/yr)
All Furnaces 600 830
Electric (hot-top) 20 700
Electric (cold-top) 60 60
Source: EPA 1997
4.5 Byproducts and Wastes
Waste residues are generated from pollutioncontrol equipment installed on glass furnaces tocontrol particulates and other emissions.Pollutants may be controlled using aqueousmedia, filters, and electrostatic precipitators.When aqueous media is used, a solid residue
may result. An example of this is the quenchreactor, which reacts sulfur dioxide with waterand sodium carbonate. The water evaporatesupon contact with the hot flue gases, leavingbehind a solid residue which may contain anumber of constituents, depending upon the typeof glass.
64
Constituents in the residue may includeselenium, chromium, cadmium, cobalt, lead,sodium sulfate and other compounds, some ofwhich are hazardous compounds. In fibermanufacturing, trapped emissions may includecalcium carbonate, sodium fluoride, sodiumfluorosilicate, silica, calcium fluoride,aluminum silicate, sodium sulfate, and boronoxides. Particulates are also trapped inbaghouses or filters, and in most cases the dustresidue from these can be recycled back to theprocess.
Another byproduct of the melting process isfurnace slag. The slag is formed from smallquantities of raw batch materials entrained bythe fires and carried into the checkers of theregenerators where it forms a partially glassymaterial. It is composed mostly of the oxides ofsilica, sodium and calcium in the upper checkersand some sodium sulfate in the lower checkerpack. Some of this material is eventuallydeposited in the bottom of the regenerators andis periodically removed as “checker rakings” or“flue slag.” Maintenance of the furnace alsoproduces refractory wastes [EPA 1995].
65
5 Glass Forming
5.1 Process Overview
The Transformation Into Finished GlassProducts Begins With Forming
Forming is the stage where the molten glassbegins its transformation into a final shape. As itmoves from the melting tank to the formingmachine, the molten glass looks like a thick,red-orange syrup. Forming processes must moldthe molten glass quickly, because it becomesrigid as it cools.
There are a wide range of forming processes,even within some glass segments. Molten glasscan be molded, drawn, rolled, cast, blown,pressed, or spun into fibers. Regardless of theprocess, forming begins with the flow of moltenglass from the forehearth, where it has beencooled to a temperature suitable for working theglass. From that stage on, forming processesdepend on the shape of the finished product.
Flat Glass is Formed Using the FloatGlass Process
Nearly all flat glass in the United States isproduced by the float glass process. Thisprocess, developed in the 1950s by PilkingtonBrothers of England and licensed in the UnitedStates in1962, revolutionized flat glassmanufacture and has since replaced the energy-and waste-intensive plate glass process. Floatglass processing uses much less energy than itspredecessors (plate or sheet glass forming) dueto the use of larger, more efficient furnaces andthe elimination of the need for surface finishing(polishing and grinding), which can consume asmuch as 3 million Btu per ton of glass. Theprocess produces a fire-polished glass that isclose to the quality of ground and polished plateglass. Since the float process is used to producevirtually all flat glass, the terms float glass andflat glass are now used interchangeably.
In the float glass process, molten glass (at about1950EF) flows horizontally from the forehearthunder a tweel and over a lip (or spout) into a
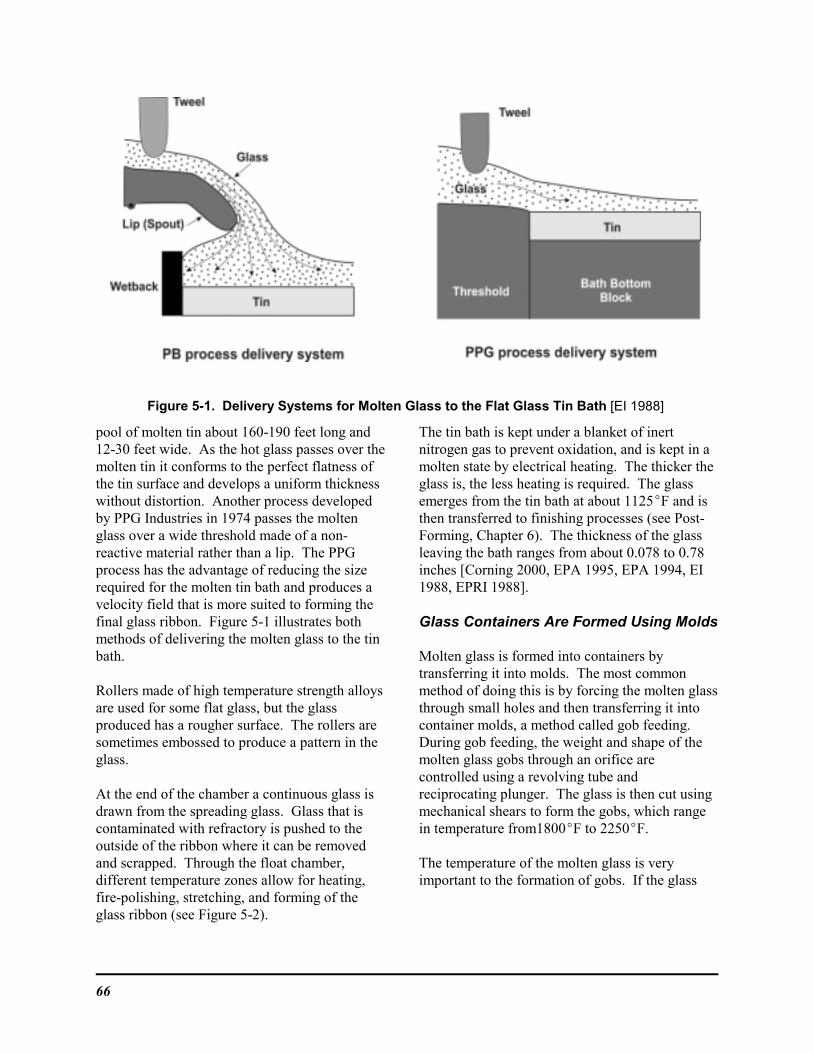
66
Figure 5-1. Delivery Systems for Molten Glass to the Flat Glass Tin Bath [EI 1988]
pool of molten tin about 160-190 feet long and12-30 feet wide. As the hot glass passes over themolten tin it conforms to the perfect flatness ofthe tin surface and develops a uniform thicknesswithout distortion. Another process developedby PPG Industries in 1974 passes the moltenglass over a wide threshold made of a non-reactive material rather than a lip. The PPGprocess has the advantage of reducing the sizerequired for the molten tin bath and produces avelocity field that is more suited to forming thefinal glass ribbon. Figure 5-1 illustrates bothmethods of delivering the molten glass to the tinbath.
Rollers made of high temperature strength alloysare used for some flat glass, but the glassproduced has a rougher surface. The rollers aresometimes embossed to produce a pattern in theglass.
At the end of the chamber a continuous glass isdrawn from the spreading glass. Glass that iscontaminated with refractory is pushed to theoutside of the ribbon where it can be removedand scrapped. Through the float chamber,different temperature zones allow for heating,fire-polishing, stretching, and forming of theglass ribbon (see Figure 5-2).
The tin bath is kept under a blanket of inertnitrogen gas to prevent oxidation, and is kept in amolten state by electrical heating. The thicker theglass is, the less heating is required. The glassemerges from the tin bath at about 1125EF and isthen transferred to finishing processes (see Post-Forming, Chapter 6). The thickness of the glassleaving the bath ranges from about 0.078 to 0.78inches [Corning 2000, EPA 1995, EPA 1994, EI1988, EPRI 1988].
Glass Containers Are Formed Using Molds
Molten glass is formed into containers bytransferring it into molds. The most commonmethod of doing this is by forcing the molten glassthrough small holes and then transferring it intocontainer molds, a method called gob feeding. During gob feeding, the weight and shape of themolten glass gobs through an orifice arecontrolled using a revolving tube andreciprocating plunger. The glass is then cut usingmechanical shears to form the gobs, which rangein temperature from1800EF to 2250EF.
The temperature of the molten glass is veryimportant to the formation of gobs. If the glass
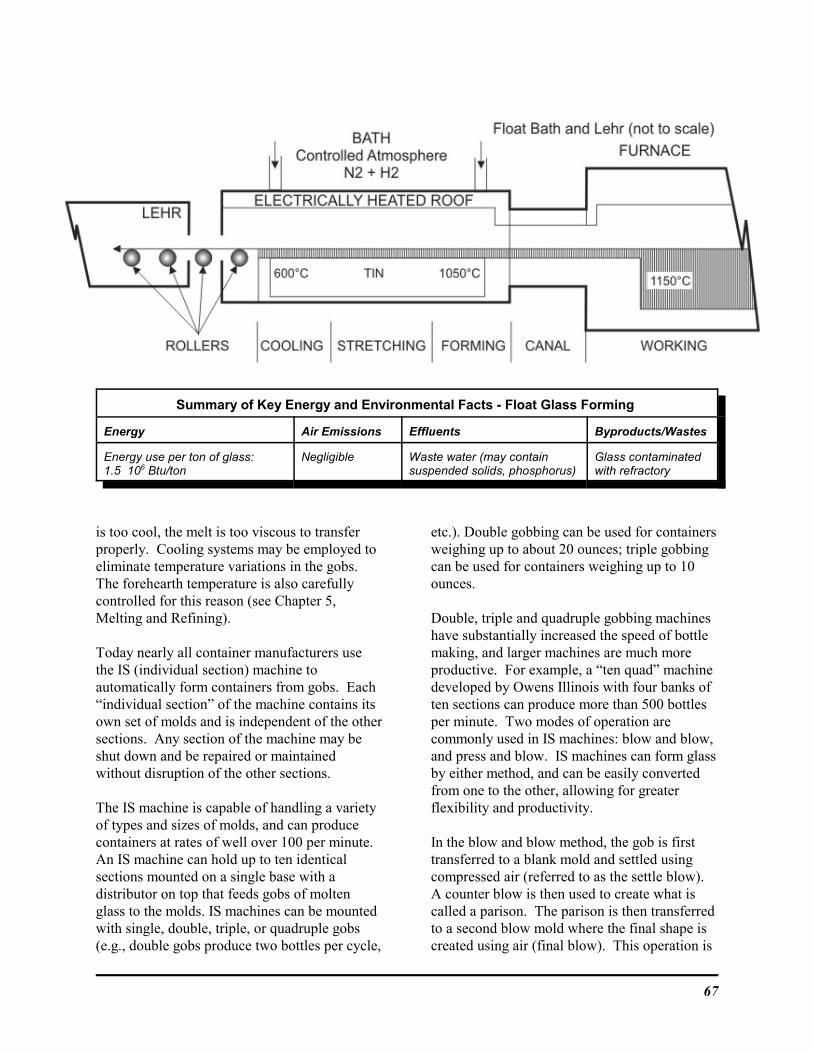
67
Summary of Key Energy and Environmental Facts - Float Glass Forming
Energy Air Emissions Effluents Byproducts/Wastes
Energy use per ton of glass: 1.5 106 Btu/ton
Negligible Waste water (may containsuspended solids, phosphorus)
Glass contaminatedwith refractory
is too cool, the melt is too viscous to transferproperly. Cooling systems may be employed toeliminate temperature variations in the gobs. The forehearth temperature is also carefullycontrolled for this reason (see Chapter 5,Melting and Refining).
Today nearly all container manufacturers usethe IS (individual section) machine toautomatically form containers from gobs. Each“individual section” of the machine contains itsown set of molds and is independent of the othersections. Any section of the machine may beshut down and be repaired or maintainedwithout disruption of the other sections.
The IS machine is capable of handling a varietyof types and sizes of molds, and can producecontainers at rates of well over 100 per minute. An IS machine can hold up to ten identicalsections mounted on a single base with adistributor on top that feeds gobs of moltenglass to the molds. IS machines can be mountedwith single, double, triple, or quadruple gobs(e.g., double gobs produce two bottles per cycle,
etc.). Double gobbing can be used for containersweighing up to about 20 ounces; triple gobbingcan be used for containers weighing up to 10ounces.
Double, triple and quadruple gobbing machineshave substantially increased the speed of bottlemaking, and larger machines are much moreproductive. For example, a “ten quad” machinedeveloped by Owens Illinois with four banks often sections can produce more than 500 bottlesper minute. Two modes of operation arecommonly used in IS machines: blow and blow,and press and blow. IS machines can form glassby either method, and can be easily convertedfrom one to the other, allowing for greaterflexibility and productivity.
In the blow and blow method, the gob is firsttransferred to a blank mold and settled usingcompressed air (referred to as the settle blow). A counter blow is then used to create what iscalled a parison. The parison is then transferredto a second blow mold where the final shape iscreated using air (final blow). This operation is
68
illustrated in Figure 5-3. Control of containerdimension is moderately good with this method,and a high quality surface finish is more easilyobtained than with pressed methods.
The press and blow method uses a plunger toform the initial parison in a blank mold (seeFigure 5-4). The parison is inverted andtransferred to a blow mold, where it undergoesfinal shaping with vacuum or air pressure in themold. In either case, the blank mold is a thick-walled but smaller version of the final container. Pressing provide greater control of dimensionsthan blowing, and permits molding of thickercross-sections. All molds must be maintained ata constant temperature to ensure that the productquality is consistent [Corning 2000, EPRI 1988,EI 1988].
Forming Operations for Pressed andBlown Glass Differ Widely
Pressed and blown glass products are verydiverse, as are the operations used for forming. Products include hand-made and machine madetable, kitchen and art ware, lighting, electronicglassware, television tubes, and scientific andindustrial glass.
Table, Kitchen and Art Ware
The largest portion of products from the blownand press glass segment includes table, kitchen,and art ware. Most all of these (about 85percent) are machine-made using the automatedpress and blow described in the previous sectionunder container manufacture.
Some table and kitchen ware are manufacturedusing press-forming machines. Press-formingutilizes a mold, plunger and ring to form thefinish area (see Figure 5-5). Press-formingmolds are mostly made of cast iron, and in somecases, stainless steels or other materials. Simpleglassware (bowls, plates) is often made usingpress-forming.
Machine pressing is done using a round, singletable machine in a one-step process where thesame plunger can be used on several molds.
Tables may be driven by air or motor, andpressing mechanisms may work via air cylindersor mechanical toggles. Production speeds forpressed ware are variable, ranging from 10-60pieces per minutes. Production speeds aredependent on the time required for cooling theglass and allowing it to set up in the press. Formed pieces are removed either manually orautomatically. Methods include removal by airjets or vacuum lift, by automated tongs, byturning the mold over, or hand removal.
When hot molds are used in press-forming themold temperatures must be carefully controlledto prevent overheating and sticking of theproduct to the mold. This is accomplished usingfans or compressed air. Plungers are cooledusing water that is circulated internally. Themold may also be sprayed with lubricants oreven water to reduce the potential for sticking.
The spinning process is sometimes used toproduce circular articles such as plates andshallow bowls (see Figure 5-6). A hot glass gobis dropped into the mold, and is then rotated toform the article by centrifugal force [EC 2000]. Paste molds are often used to produce bothmedium- and high-grade tumblers. The parisonin this case is created by using a plunger and acast iron mold. As the cast iron mold pulls away, a two-section water-cooled paste moldfolds into place around the parison. The pastemold is then rotated during final air blowing toattain a smooth, high-luster finish [Corning2000, EPRI 1988, EI 1988].

69
Figure 5-3. Container Glass Forming Blow & Blow[Corning 2000, EPRI 1988]
Figure 5-4. Container Glass Forming Press & Blow[Corning 2000, EPRI 1998]
Summary of Key Energy and Environmental Facts - Container Glass Forming
Energy Air Emissions Effluents Byproducts/Wastes
Energy use per ton of glass:0.4 106 Btu/ton
Particulates, organiccondensible particulates,volatile organics, resin andbinder droplets,formaldehyde (all controlled)
Waste oil andsolvents, waste water(may containdissolved solids,suspended solids,heavy metals)
Solid residues frompollution controlequipment
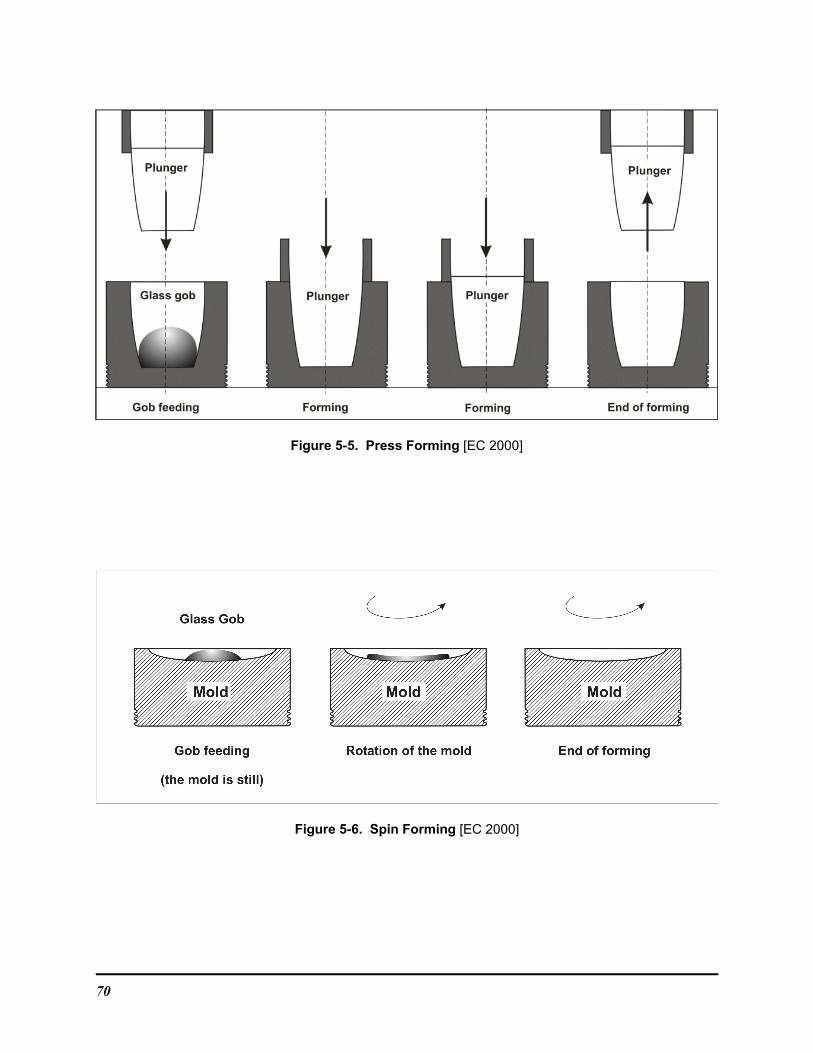
70
Figure 5-5. Press Forming [EC 2000]
Figure 5-6. Spin Forming [EC 2000]
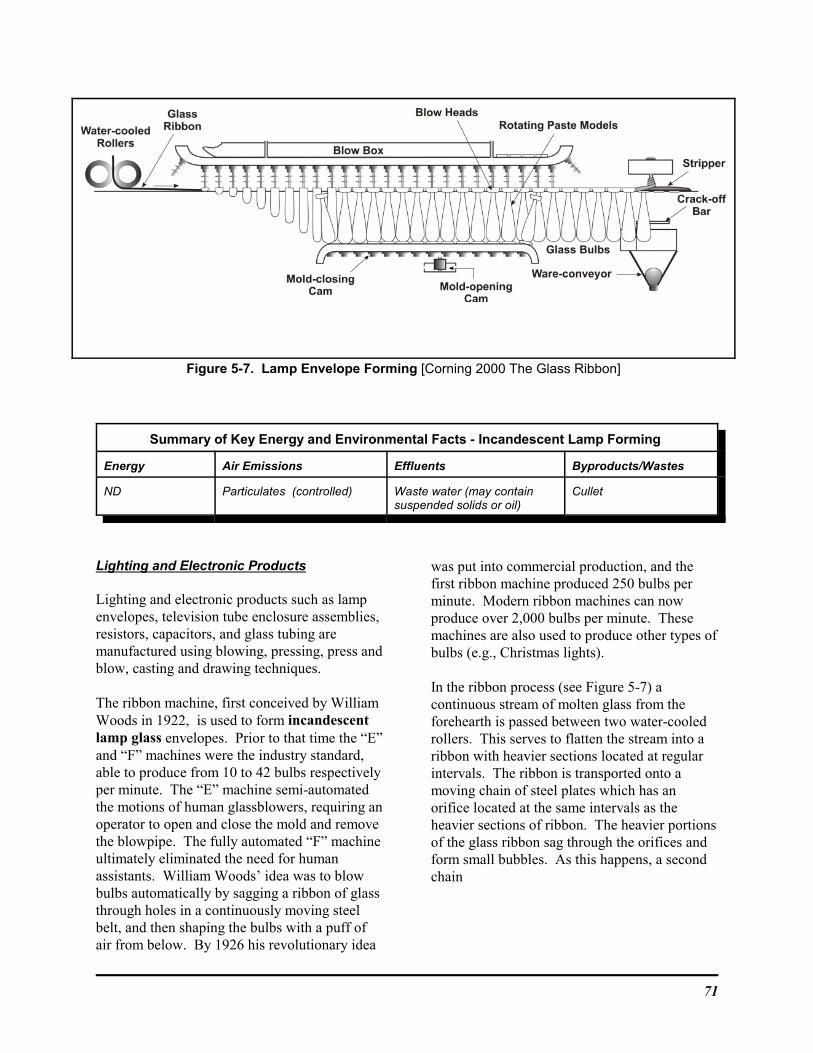
71
Figure 5-7. Lamp Envelope Forming [Corning 2000 The Glass Ribbon]
Summary of Key Energy and Environmental Facts - Incandescent Lamp Forming
Energy Air Emissions Effluents Byproducts/Wastes
ND Particulates (controlled) Waste water (may containsuspended solids or oil)
Cullet
Lighting and Electronic Products
Lighting and electronic products such as lampenvelopes, television tube enclosure assemblies,resistors, capacitors, and glass tubing aremanufactured using blowing, pressing, press andblow, casting and drawing techniques.
The ribbon machine, first conceived by WilliamWoods in 1922, is used to form incandescentlamp glass envelopes. Prior to that time the “E”and “F” machines were the industry standard,able to produce from 10 to 42 bulbs respectivelyper minute. The “E” machine semi-automatedthe motions of human glassblowers, requiring anoperator to open and close the mold and removethe blowpipe. The fully automated “F” machineultimately eliminated the need for humanassistants. William Woods’ idea was to blowbulbs automatically by sagging a ribbon of glassthrough holes in a continuously moving steelbelt, and then shaping the bulbs with a puff ofair from below. By 1926 his revolutionary idea
was put into commercial production, and thefirst ribbon machine produced 250 bulbs perminute. Modern ribbon machines can nowproduce over 2,000 bulbs per minute. Thesemachines are also used to produce other types ofbulbs (e.g., Christmas lights).
In the ribbon process (see Figure 5-7) acontinuous stream of molten glass from theforehearth is passed between two water-cooledrollers. This serves to flatten the stream into aribbon with heavier sections located at regularintervals. The ribbon is transported onto amoving chain of steel plates which has anorifice located at the same intervals as theheavier sections of ribbon. The heavier portionsof the glass ribbon sag through the orifices andform small bubbles. As this happens, a secondchain
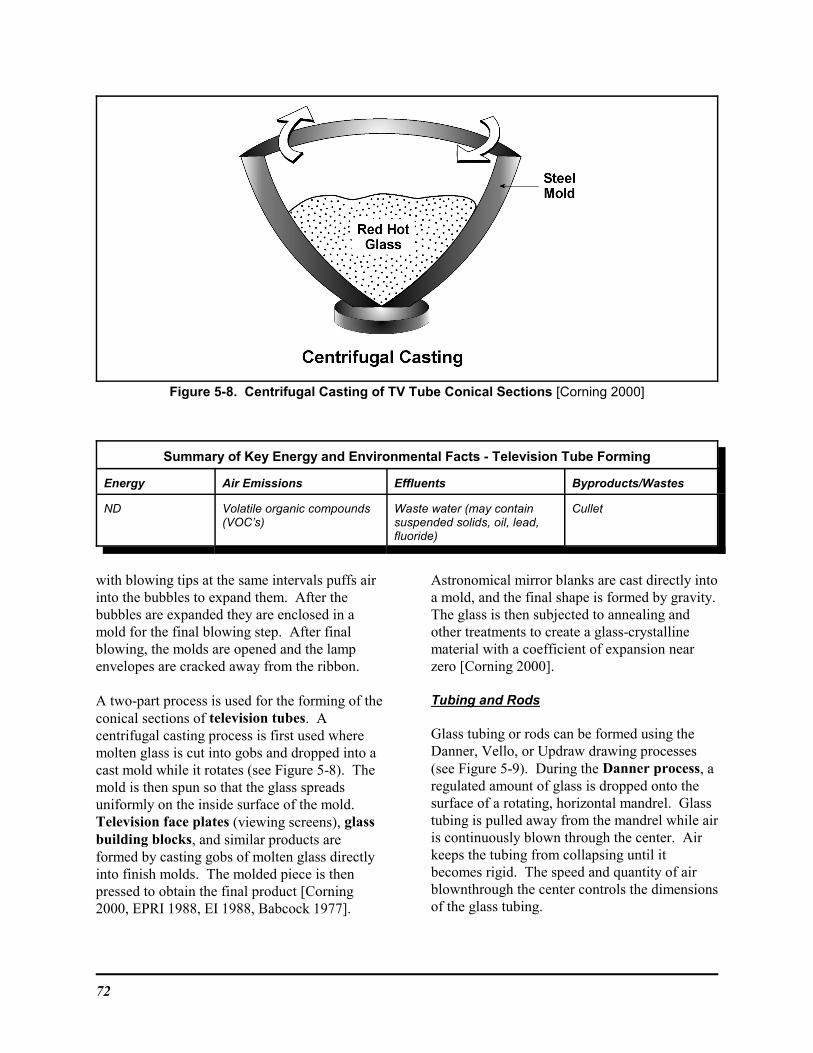
72
Figure 5-8. Centrifugal Casting of TV Tube Conical Sections [Corning 2000]
Summary of Key Energy and Environmental Facts - Television Tube Forming
Energy Air Emissions Effluents Byproducts/Wastes
ND Volatile organic compounds(VOC’s)
Waste water (may containsuspended solids, oil, lead,fluoride)
Cullet
with blowing tips at the same intervals puffs airinto the bubbles to expand them. After thebubbles are expanded they are enclosed in amold for the final blowing step. After finalblowing, the molds are opened and the lampenvelopes are cracked away from the ribbon.
A two-part process is used for the forming of theconical sections of television tubes. Acentrifugal casting process is first used wheremolten glass is cut into gobs and dropped into acast mold while it rotates (see Figure 5-8). Themold is then spun so that the glass spreadsuniformly on the inside surface of the mold. Television face plates (viewing screens), glassbuilding blocks, and similar products areformed by casting gobs of molten glass directlyinto finish molds. The molded piece is thenpressed to obtain the final product [Corning2000, EPRI 1988, EI 1988, Babcock 1977].
Astronomical mirror blanks are cast directly intoa mold, and the final shape is formed by gravity. The glass is then subjected to annealing andother treatments to create a glass-crystallinematerial with a coefficient of expansion nearzero [Corning 2000].
Tubing and Rods
Glass tubing or rods can be formed using theDanner, Vello, or Updraw drawing processes(see Figure 5-9). During the Danner process, aregulated amount of glass is dropped onto thesurface of a rotating, horizontal mandrel. Glasstubing is pulled away from the mandrel while air is continuously blown through the center. Airkeeps the tubing from collapsing until itbecomes rigid. The speed and quantity of airblownthrough the center controls the dimensionsof the glass tubing.
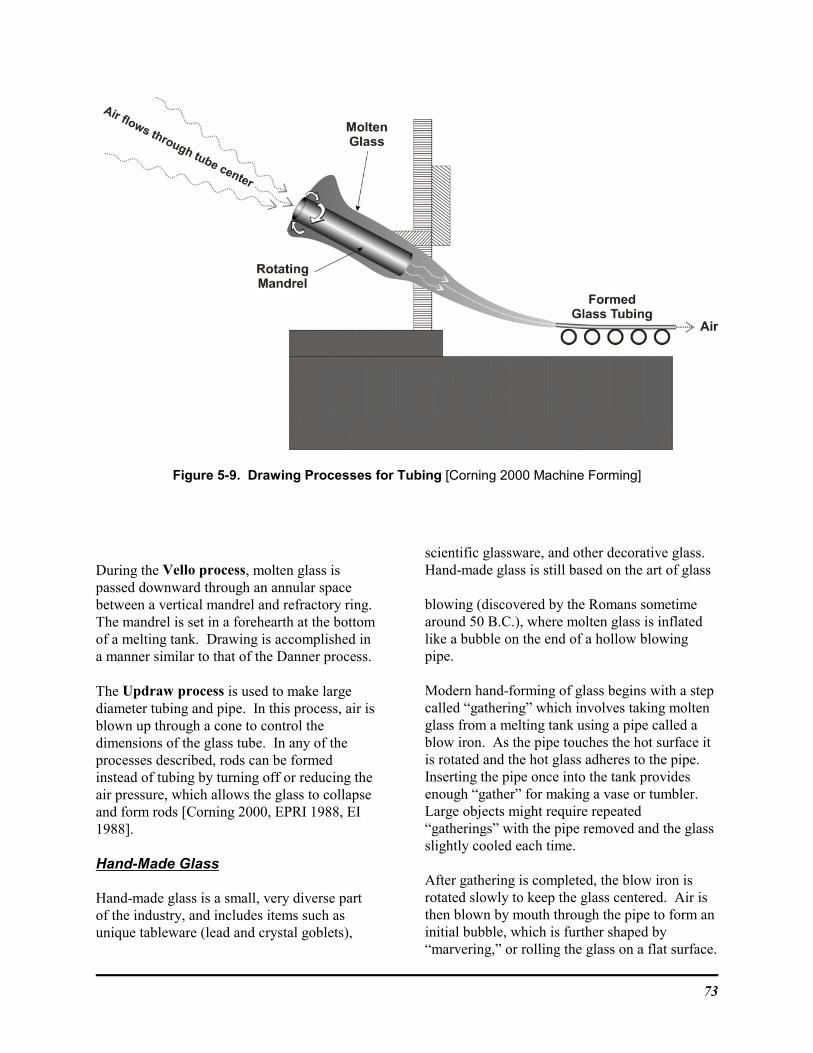
73
Figure 5-9. Drawing Processes for Tubing [Corning 2000 Machine Forming]
During the Vello process, molten glass ispassed downward through an annular spacebetween a vertical mandrel and refractory ring. The mandrel is set in a forehearth at the bottomof a melting tank. Drawing is accomplished ina manner similar to that of the Danner process.
The Updraw process is used to make largediameter tubing and pipe. In this process, air isblown up through a cone to control thedimensions of the glass tube. In any of theprocesses described, rods can be formedinstead of tubing by turning off or reducing theair pressure, which allows the glass to collapseand form rods [Corning 2000, EPRI 1988, EI1988].
Hand-Made Glass
Hand-made glass is a small, very diverse partof the industry, and includes items such asunique tableware (lead and crystal goblets),
scientific glassware, and other decorative glass. Hand-made glass is still based on the art of glass
blowing (discovered by the Romans sometimearound 50 B.C.), where molten glass is inflatedlike a bubble on the end of a hollow blowing pipe.
Modern hand-forming of glass begins with a stepcalled “gathering” which involves taking moltenglass from a melting tank using a pipe called ablow iron. As the pipe touches the hot surface itis rotated and the hot glass adheres to the pipe. Inserting the pipe once into the tank providesenough “gather” for making a vase or tumbler. Large objects might require repeated“gatherings” with the pipe removed and the glassslightly cooled each time.
After gathering is completed, the blow iron isrotated slowly to keep the glass centered. Air isthen blown by mouth through the pipe to form aninitial bubble, which is further shaped by“marvering,” or rolling the glass on a flat surface.
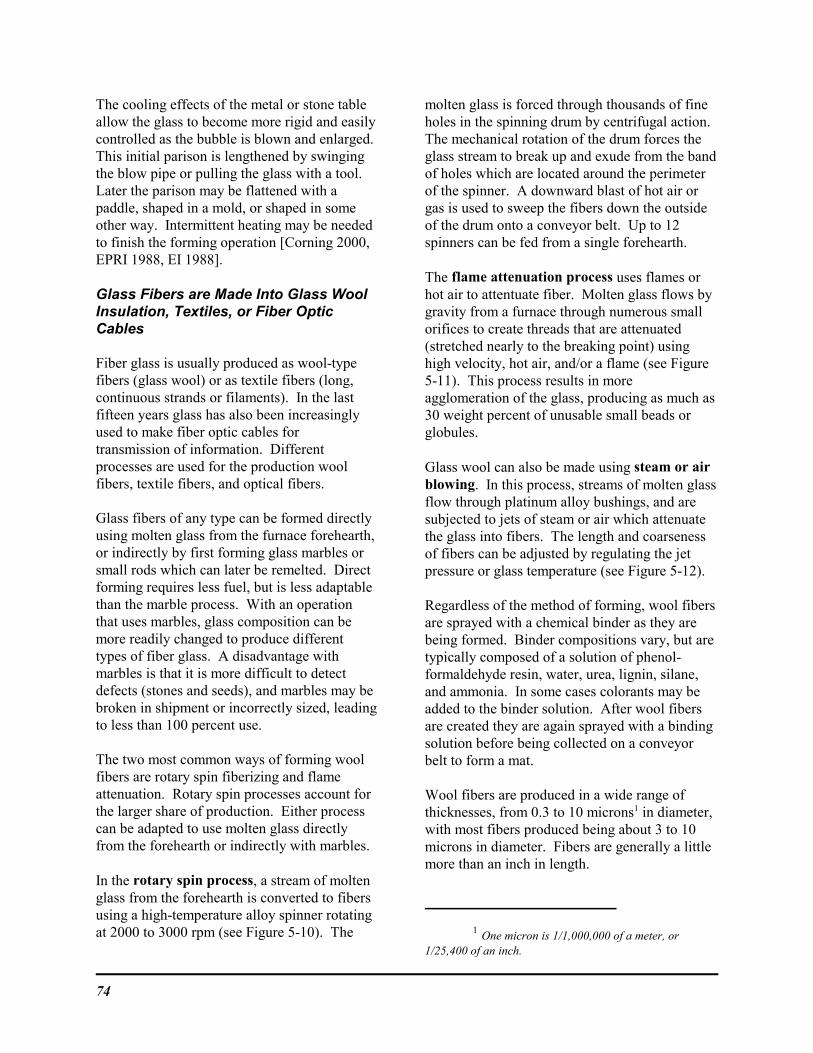
74
The cooling effects of the metal or stone tableallow the glass to become more rigid and easilycontrolled as the bubble is blown and enlarged. This initial parison is lengthened by swingingthe blow pipe or pulling the glass with a tool. Later the parison may be flattened with apaddle, shaped in a mold, or shaped in someother way. Intermittent heating may be neededto finish the forming operation [Corning 2000,EPRI 1988, EI 1988].
Glass Fibers are Made Into Glass WoolInsulation, Textiles, or Fiber OpticCables
Fiber glass is usually produced as wool-typefibers (glass wool) or as textile fibers (long,continuous strands or filaments). In the lastfifteen years glass has also been increasinglyused to make fiber optic cables fortransmission of information. Differentprocesses are used for the production woolfibers, textile fibers, and optical fibers.
Glass fibers of any type can be formed directlyusing molten glass from the furnace forehearth,or indirectly by first forming glass marbles orsmall rods which can later be remelted. Directforming requires less fuel, but is less adaptablethan the marble process. With an operationthat uses marbles, glass composition can bemore readily changed to produce differenttypes of fiber glass. A disadvantage withmarbles is that it is more difficult to detectdefects (stones and seeds), and marbles may bebroken in shipment or incorrectly sized, leadingto less than 100 percent use.
The two most common ways of forming woolfibers are rotary spin fiberizing and flameattenuation. Rotary spin processes account forthe larger share of production. Either processcan be adapted to use molten glass directlyfrom the forehearth or indirectly with marbles.
In the rotary spin process, a stream of moltenglass from the forehearth is converted to fibersusing a high-temperature alloy spinner rotatingat 2000 to 3000 rpm (see Figure 5-10). The
molten glass is forced through thousands of fineholes in the spinning drum by centrifugal action. The mechanical rotation of the drum forces theglass stream to break up and exude from the bandof holes which are located around the perimeterof the spinner. A downward blast of hot air orgas is used to sweep the fibers down the outsideof the drum onto a conveyor belt. Up to 12spinners can be fed from a single forehearth.
The flame attenuation process uses flames orhot air to attentuate fiber. Molten glass flows bygravity from a furnace through numerous smallorifices to create threads that are attenuated(stretched nearly to the breaking point) usinghigh velocity, hot air, and/or a flame (see Figure5-11). This process results in moreagglomeration of the glass, producing as much as30 weight percent of unusable small beads orglobules.
Glass wool can also be made using steam or airblowing. In this process, streams of molten glassflow through platinum alloy bushings, and aresubjected to jets of steam or air which attenuatethe glass into fibers. The length and coarsenessof fibers can be adjusted by regulating the jetpressure or glass temperature (see Figure 5-12).
Regardless of the method of forming, wool fibersare sprayed with a chemical binder as they arebeing formed. Binder compositions vary, but aretypically composed of a solution of phenol-formaldehyde resin, water, urea, lignin, silane,and ammonia. In some cases colorants may beadded to the binder solution. After wool fibersare created they are again sprayed with a bindingsolution before being collected on a conveyorbelt to form a mat.
Wool fibers are produced in a wide range ofthicknesses, from 0.3 to 10 microns1 in diameter,with most fibers produced being about 3 to 10microns in diameter. Fibers are generally a littlemore than an inch in length.
1 One micron is 1/1,000,000 of a meter, or1/25,400 of an inch.
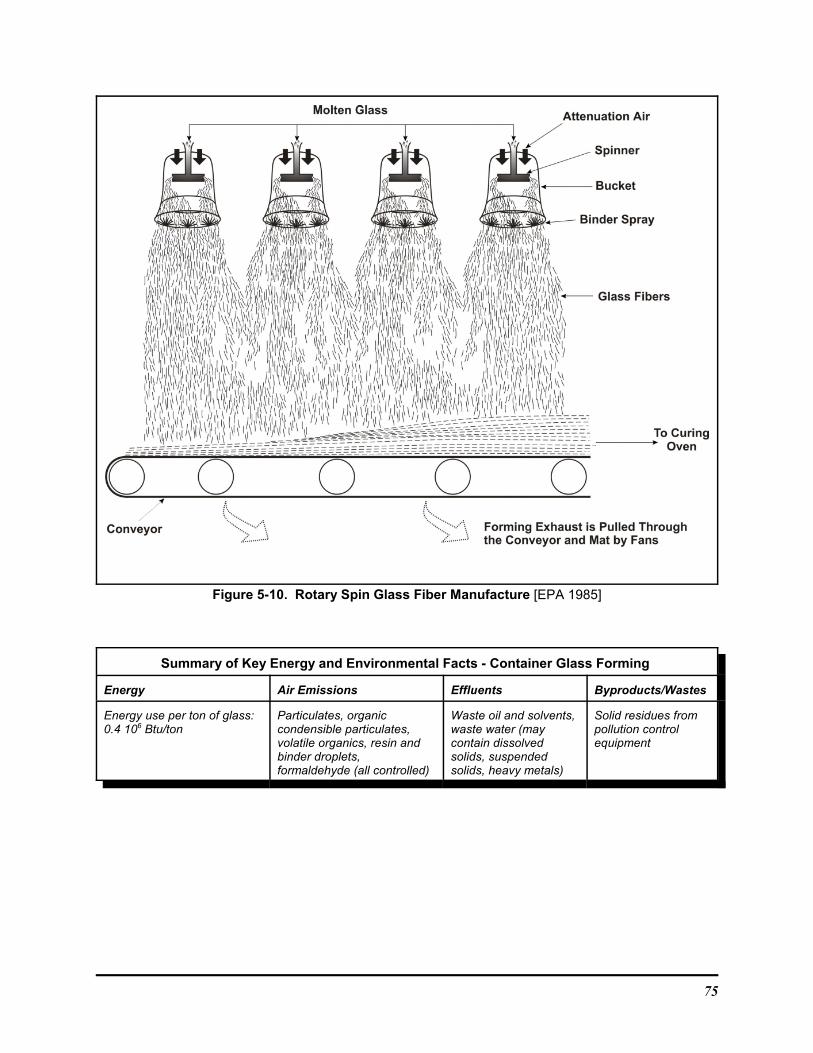
75
Figure 5-10. Rotary Spin Glass Fiber Manufacture [EPA 1985]
Summary of Key Energy and Environmental Facts - Container Glass Forming
Energy Air Emissions Effluents Byproducts/Wastes
Energy use per ton of glass:0.4 106 Btu/ton
Particulates, organiccondensible particulates,volatile organics, resin andbinder droplets,formaldehyde (all controlled)
Waste oil and solvents,waste water (maycontain dissolvedsolids, suspendedsolids, heavy metals)
Solid residues frompollution controlequipment
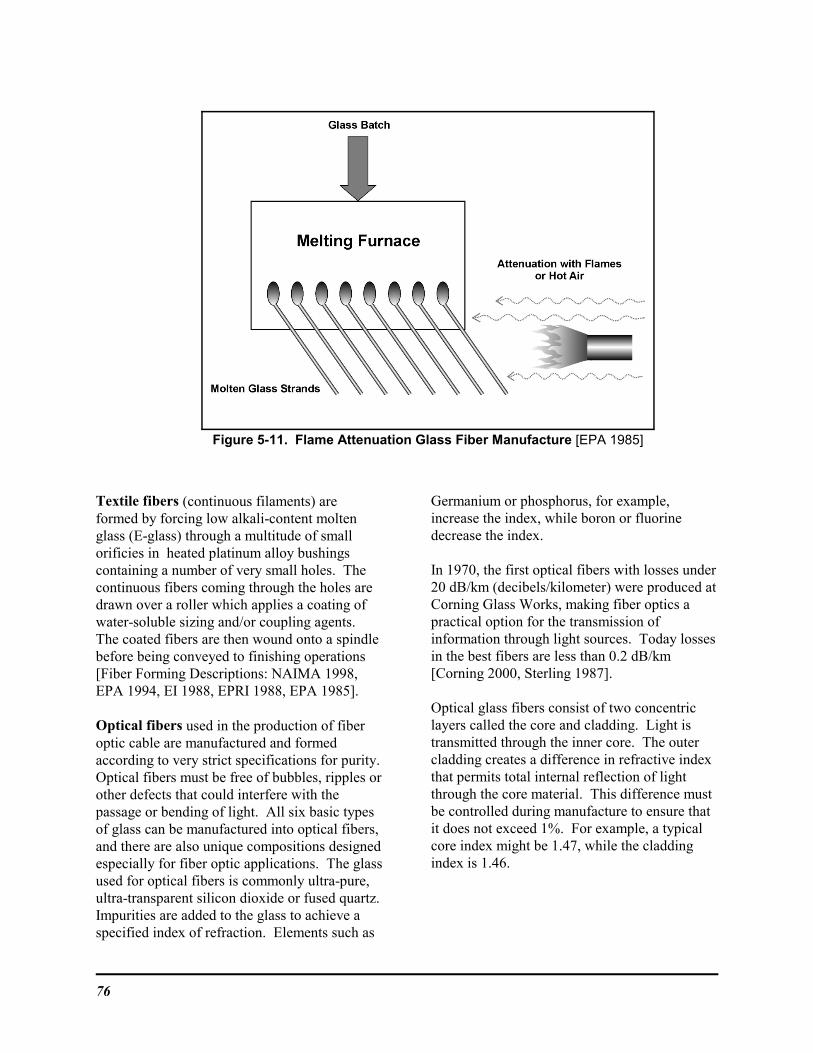
76
Figure 5-11. Flame Attenuation Glass Fiber Manufacture [EPA 1985]
Textile fibers (continuous filaments) areformed by forcing low alkali-content moltenglass (E-glass) through a multitude of smallorificies in heated platinum alloy bushingscontaining a number of very small holes. Thecontinuous fibers coming through the holes aredrawn over a roller which applies a coating ofwater-soluble sizing and/or coupling agents. The coated fibers are then wound onto a spindlebefore being conveyed to finishing operations[Fiber Forming Descriptions: NAIMA 1998,EPA 1994, EI 1988, EPRI 1988, EPA 1985].
Optical fibers used in the production of fiberoptic cable are manufactured and formedaccording to very strict specifications for purity. Optical fibers must be free of bubbles, ripples orother defects that could interfere with thepassage or bending of light. All six basic typesof glass can be manufactured into optical fibers,and there are also unique compositions designedespecially for fiber optic applications. The glassused for optical fibers is commonly ultra-pure,ultra-transparent silicon dioxide or fused quartz. Impurities are added to the glass to achieve aspecified index of refraction. Elements such as
Germanium or phosphorus, for example,increase the index, while boron or fluorinedecrease the index.
In 1970, the first optical fibers with losses under20 dB/km (decibels/kilometer) were produced atCorning Glass Works, making fiber optics apractical option for the transmission ofinformation through light sources. Today lossesin the best fibers are less than 0.2 dB/km[Corning 2000, Sterling 1987].
Optical glass fibers consist of two concentriclayers called the core and cladding. Light istransmitted through the inner core. The outercladding creates a difference in refractive indexthat permits total internal reflection of lightthrough the core material. This difference mustbe controlled during manufacture to ensure thatit does not exceed 1%. For example, a typicalcore index might be 1.47, while the claddingindex is 1.46.

77
Figure 5-12. Steam or Air Injection Process for Glass Wool Manufacture [El 1988]
Most optical fibers also have a polymer coatingaround the cladding to protect both cladding andcore materials from shocks that could affectoptical properties (see Figure 5-13). Thepolymer serves as abuffer or shock absorber andhas no optical properties. Fibers are producedin very small diameters, which means that theforming process must be exceedingly exact tomaintain proper tolerances (see Table 5-1). Tounderstand how small these diameters are, bycomparison a human hair is about 100Fm [Sterling 1987].
5.2 Summary of Inputs andOutputs for Glass Forming
Inputs Outputs
Molten GlassGlass MarblesElectricityTin (float glass)LubricantsAirCooling WaterNitrogen
Formed GlassCulletContaminated GlassSpent Cooling WaterParticulatesOrganic Condensable ParticulatesVolatile Organics(VOCs)
78
Figure 5-13. Optical Fibers [Sterling 1987]
5.3 Energy Requirements
Forming operations are very diverse among theglass segments, and can use anywhere from 12percent (e.g., flat glass) to 34 percent (fiberforming) of total energy (considering electricitylosses) [EI 1988]. The energy consumed informing operations across the industry is shownin Table 5-2.
In most cases forming processes do not requiremuch heat. Most of the energy used iselectricity for machinery operation, fans,blowers, compressors, conveyors, and otherequipment. In flat glass production, electricityis used for heating tin [CMP 1990].
In container glass production, energyconsumption depends on the weight of thecontainer being produced and the efficiency ofthe forming operation. Lighter containersgenerally require less energy to produce percontainer.
Production efficiency (referred to as the pack-to-melt ratio), which is actually the ratio ofsaleable product to gross production volume,also has an impact on energy use. The greaterthe pack-to-melt ratio, the lower the energyrequired to produce that product.
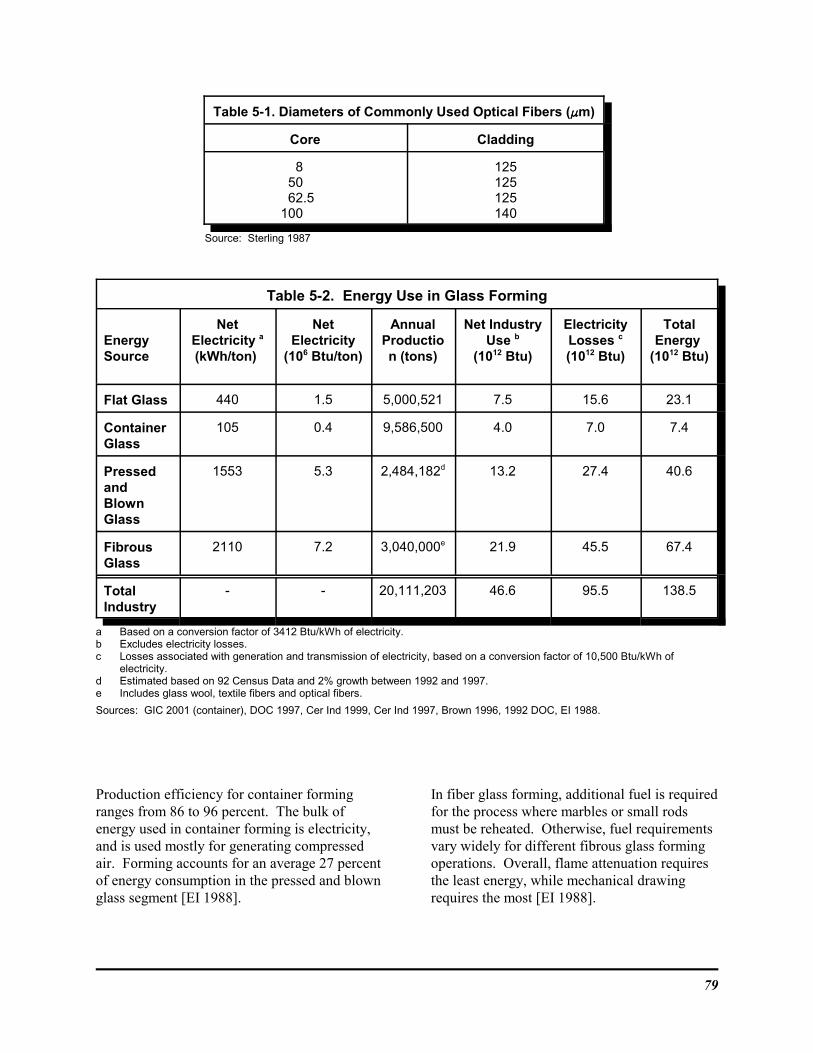
79
Table 5-1. Diameters of Commonly Used Optical Fibers (FFFFm)
Core Cladding
85062.5
100
125125125140
Source: Sterling 1987
Table 5-2. Energy Use in Glass Forming
EnergySource
NetElectricity a
(kWh/ton)
NetElectricity
(106 Btu/ton)
AnnualProduction (tons)
Net IndustryUse b
(1012 Btu)
ElectricityLosses c
(1012 Btu)
TotalEnergy
(1012 Btu)
Flat Glass 440 1.5 5,000,521 7.5 15.6 23.1
ContainerGlass
105 0.4 9,586,500 4.0 7.0 7.4
PressedandBlownGlass
1553 5.3 2,484,182d 13.2 27.4 40.6
FibrousGlass
2110 7.2 3,040,000e 21.9 45.5 67.4
TotalIndustry
- - 20,111,203 46.6 95.5 138.5
a Based on a conversion factor of 3412 Btu/kWh of electricity.b Excludes electricity losses.c Losses associated with generation and transmission of electricity, based on a conversion factor of 10,500 Btu/kWh of
electricity.d Estimated based on 92 Census Data and 2% growth between 1992 and 1997.e Includes glass wool, textile fibers and optical fibers.
Sources: GIC 2001 (container), DOC 1997, Cer Ind 1999, Cer Ind 1997, Brown 1996, 1992 DOC, EI 1988.
Production efficiency for container formingranges from 86 to 96 percent. The bulk ofenergy used in container forming is electricity,and is used mostly for generating compressedair. Forming accounts for an average 27 percentof energy consumption in the pressed and blownglass segment [EI 1988].
In fiber glass forming, additional fuel is requiredfor the process where marbles or small rodsmust be reheated. Otherwise, fuel requirementsvary widely for different fibrous glass formingoperations. Overall, flame attenuation requiresthe least energy, while mechanical drawingrequires the most [EI 1988].
80
5.4 Emissions
Forming Can Generate Emissions ofParticulates, Volatile Organics, andSome Hazardous Air Pollutants
The primary emissions from the forming of container and pressed and blown glass resultfrom the gob coming into contact with moldlubricants, which may result in flashvaporization of hydrocarbon greases. In manycases these lubricants have been replaced bysilicone emulsions and water soluble oils (oil-graphite, water-graphite), which eliminateemissions of volatile organics (VOCs)(emissions are particulates). Emissions fromforming of flat glass are virtually non-existent.Table 5-3 provides emission factors for glassforming processes by segment [Gridley 2001,EPA 1995, EPA 1986].
The primary emissions from forming of woolfibers are solid particles of glass and binderresin, droplets of binder, and components of thebinder that have volatilized. Glass particles maybe entrained in the exhaust gas stream fromforming, curing, or cooling, but 99 percent comefrom forming. Droplets of organic binder mayalso result from condensation of gaseouspollutants as the gas stream is cooled. Uncontrolled emissions from fibrous glassmanufacturing are shown in Table 5-4.
Particulate matter is the major pollutant that hasbeen identified and measured at insulationmanufacturing facilities, primarily from rotaryspin operations. Building insulation (R-11 andR-19), ductboard, and heavy-density insulationaccount for about 90 percent of the output fromrotary spin processes. Ductboard manufactureexhibits the highest emission rate ofparticulates. Particulate standards for rotaryspin manufacturing are 11.0 pounds per ton ofglass pulled [40 CFR 60 PPP, EPA 1997, EPA1985].
A variety of methods are used to controlemissions in glass wool manufacture, andemissions from forming, curing and cooling may
be controlled separately or in combination. Control technologies include wet electrostaticprecipitators, wet scrubbers, thermalincinerators, high velocity air filters, andprocess modifications. Process modificationsare usually proprietary and information onspecifics is not available, although they are usedto control both particulates and volatile organics(phenols, formaldehyde). The most effectiveadd-on control technology is the wetelectrostatic precipitator.
Controlled emissions of formaldehyde fromrotary spin and flame attenuation fibermanufacture are shown in Tables 5-5 and 5-6. Emissions of formaldehyde from all fibrousglass manufacture are regulated under NationalEmissions Standards for Hazardous AirPollutants. Current limits, which were set in1999, are shown in Table 5-7.
Emissions from textile fiber manufacturinginclude particles of glass fiber, resin, andhydrocarbons (phenols and aldehydes). Textilefiber manufacture usually creates less emissionsthan the manufacture of glass wool, primarilydue to less turbulence in the forming step, andthe user of rollers for adding coatings [EPA1997, EPA 1995, EPA 1985].
5.5 Effluents
Oil used in forming machines may contaminatethe water used to keep the machines cool,creating a waste oil stream that must bedisposed of [EPA 1995]. The amount ofcontaminants in waste water from glassoperations is subject to limitations under theClean Water Act. Effluent guidelinesspecifically geared toward glass manufacturingare shown in Table 5-8 [40 CFR 426]. Inaddition to waste solvents and lubricants, theseregulations limit the amount of suspended solid,heavy metals, and biological entities that may bepresent in effluents.
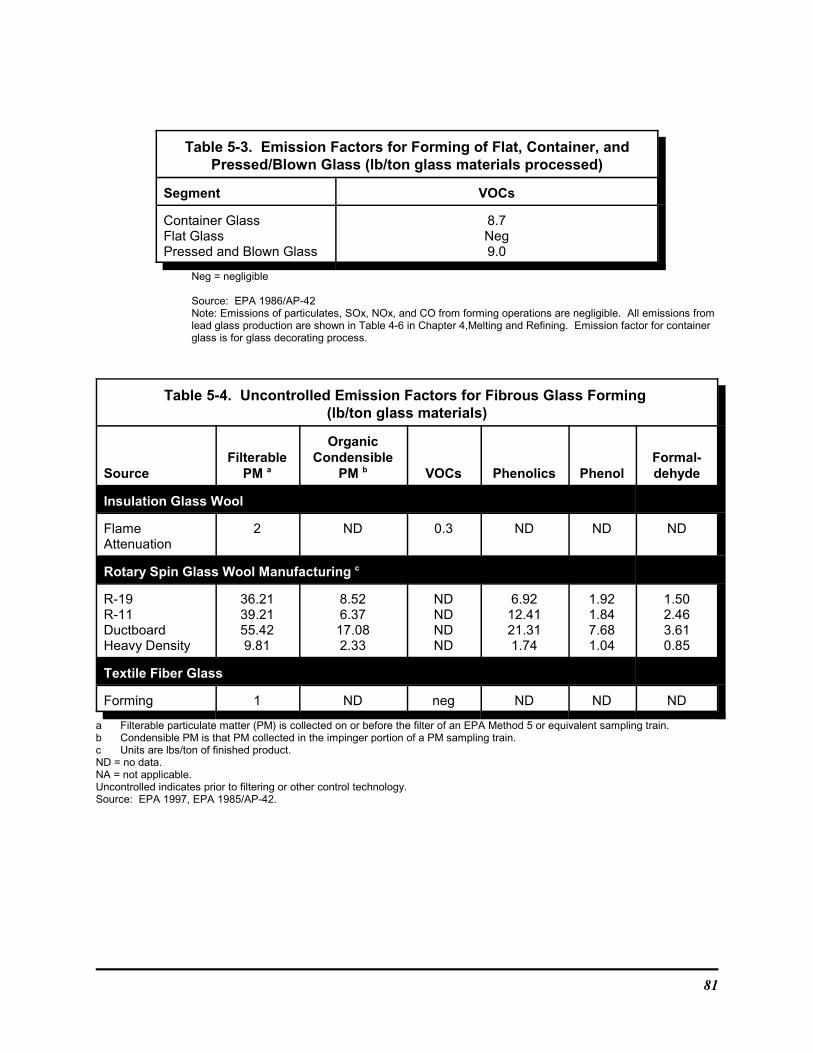
81
Table 5-3. Emission Factors for Forming of Flat, Container, andPressed/Blown Glass (lb/ton glass materials processed)
Segment VOCs
Container GlassFlat GlassPressed and Blown Glass
8.7Neg9.0
Neg = negligible
Source: EPA 1986/AP-42Note: Emissions of particulates, SOx, NOx, and CO from forming operations are negligible. All emissions fromlead glass production are shown in Table 4-6 in Chapter 4,Melting and Refining. Emission factor for containerglass is for glass decorating process.
Table 5-4. Uncontrolled Emission Factors for Fibrous Glass Forming (lb/ton glass materials)
SourceFilterable
PM a
OrganicCondensible
PM b VOCs Phenolics PhenolFormal-dehyde
Insulation Glass Wool
FlameAttenuation
2 ND 0.3 ND ND ND
Rotary Spin Glass Wool Manufacturing c
R-19R-11DuctboardHeavy Density
36.2139.2155.429.81
8.526.3717.082.33
NDNDNDND
6.9212.4121.311.74
1.921.847.681.04
1.502.463.610.85
Textile Fiber Glass
Forming 1 ND neg ND ND ND
a Filterable particulate matter (PM) is collected on or before the filter of an EPA Method 5 or equivalent sampling train.b Condensible PM is that PM collected in the impinger portion of a PM sampling train.c Units are lbs/ton of finished product.ND = no data.NA = not applicable.Uncontrolled indicates prior to filtering or other control technology.Source: EPA 1997, EPA 1985/AP-42.

82
Table 5-5 Controlled Formaldehyde Emissions from Forming Operations inRotary Spin Fiber Glass Manufacturing
Operation Control Technology lb/ton
Forming Process Modificationsa 0.3 - 1.2
a process modifications include resin and binder chemistry, fiberization technology, binder application, and forming conditions. b temperatures ranging from 1300-1500oF; residence times from 0.5-2.5 seconds.Source: EPA 1997.
Table 5-6. Average Formaldehyde Emissions from Flame Attenuation(FA) Fiber Glass Manufacturing
Forming Operation Control Technology lb/ton
Heavy Density Products Process Modificationsa 4.6 - 7.8
Pipe Insulation Process Modificationsa 3.4 - 6.8
a Includes forming and curing. Curing is not controlled.Source: EPA 1997
Table 5-7. National Emission Standards for FormaldehydeEmissions From Fiber Glass Manufacturing
Processlb formaldehyde/
ton glass
Rotary Spin Existing Lines New Lines
1.20a
0.80
Flame Attenuation Pipe Insulation Heavy Density
6.8b
7.8c
a Based on combined emissions from forming, curing and cooling. Process modifications are the MACT technology for forming;incinerators are the MACT technology for curing.
b For new and existing manufacturing lines. Process modifications are used as the MACT control technology for forming andcuring.
c New lines only.Sources: 40 CFR 63 NNN, EPA 1997.
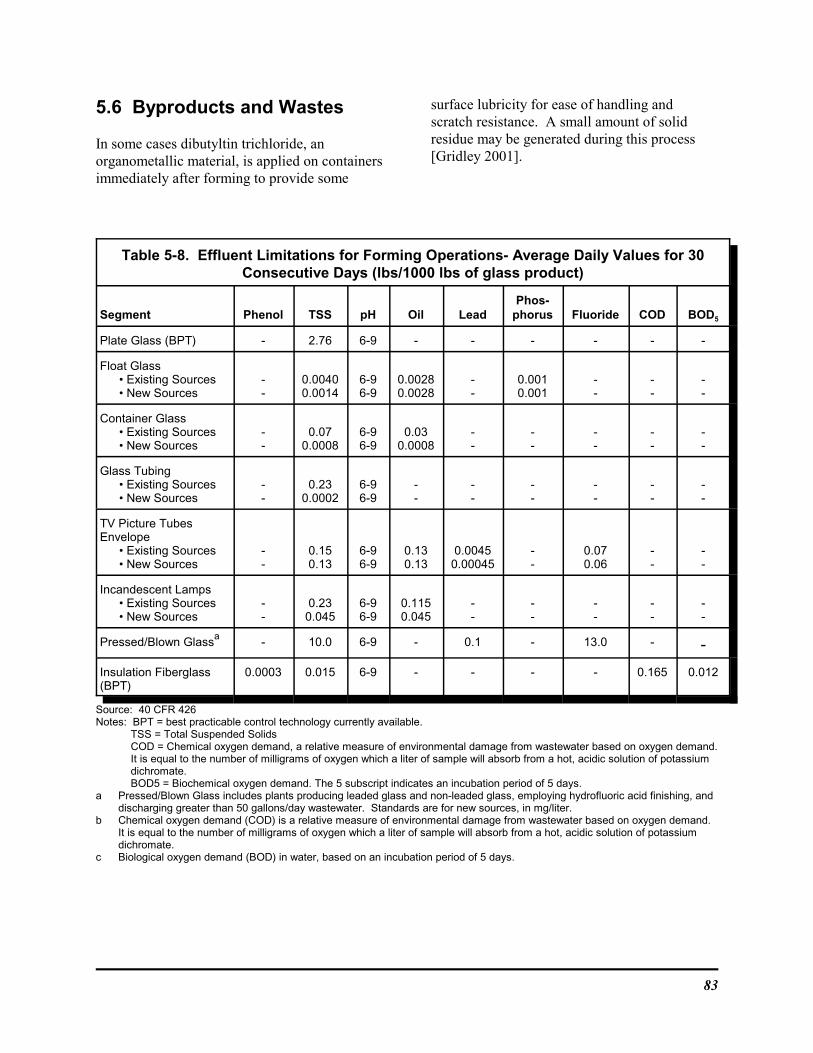
83
5.6 Byproducts and Wastes
In some cases dibutyltin trichloride, anorganometallic material, is applied on containersimmediately after forming to provide some
surface lubricity for ease of handling andscratch resistance. A small amount of solidresidue may be generated during this process[Gridley 2001].
Table 5-8. Effluent Limitations for Forming Operations- Average Daily Values for 30Consecutive Days (lbs/1000 lbs of glass product)
Segment Phenol TSS pH Oil LeadPhos-
phorus Fluoride COD BOD5
Plate Glass (BPT) - 2.76 6-9 - - - - - -
Float Glass• Existing Sources• New Sources
--
0.00400.0014
6-96-9
0.00280.0028
--
0.0010.001
--
--
--
Container Glass• Existing Sources• New Sources
--
0.070.0008
6-96-9
0.030.0008
--
--
--
--
--
Glass Tubing• Existing Sources• New Sources
--
0.230.0002
6-96-9
--
--
--
--
--
--
TV Picture Tubes Envelope
• Existing Sources• New Sources
--
0.150.13
6-96-9
0.130.13
0.00450.00045
--
0.070.06
--
--
Incandescent Lamps• Existing Sources• New Sources
--
0.230.045
6-96-9
0.1150.045
--
--
--
--
--
Pressed/Blown Glassa
- 10.0 6-9 - 0.1 - 13.0 - -
Insulation Fiberglass(BPT)
0.0003 0.015 6-9 - - - - 0.165 0.012
Source: 40 CFR 426Notes: BPT = best practicable control technology currently available.
TSS = Total Suspended SolidsCOD = Chemical oxygen demand, a relative measure of environmental damage from wastewater based on oxygen demand. It is equal to the number of milligrams of oxygen which a liter of sample will absorb from a hot, acidic solution of potassiumdichromate.BOD5 = Biochemical oxygen demand. The 5 subscript indicates an incubation period of 5 days.
a Pressed/Blown Glass includes plants producing leaded glass and non-leaded glass, employing hydrofluoric acid finishing, anddischarging greater than 50 gallons/day wastewater. Standards are for new sources, in mg/liter.
b Chemical oxygen demand (COD) is a relative measure of environmental damage from wastewater based on oxygen demand. It is equal to the number of milligrams of oxygen which a liter of sample will absorb from a hot, acidic solution of potassiumdichromate.
c Biological oxygen demand (BOD) in water, based on an incubation period of 5 days.

84
85
6 Post-Forming and Finishing
Operations
6.1 Process Overview
Post-Forming Operations IncludeFinishing, Curing and Annealing
After being formed into its final shape, the glassproduct may be subjected to curing/drying,tempering, annealing, laminating, coating,polishing, decorating, cutting or drilling.
• Curing or drying in ovens may benecessary to heat-set resins or othercompounds that have been added to theglass.
• Annealing is the process of slowly coolingthe glass so that it will not be highlystrained by the time it reaches roomtemperature. If a hot glass object cools tooquickly, it may break easily at roomtemperature. For small, thin-walled shapesthis effect is not significant, but for larger,thicker shapes the strain can be verydetrimental. Strain is dependent on howquickly glass passes through a criticaltemperature range, usually around 840EF. Cooling the glass slowly through that range
to maintain consistent temperatures throughthe product reduces the amount of strain.Annealing is done for all types of glassexcept fibers and very thin-walled productssuch as light bulbs.
• Tempering is used to impart strength toglass sheets and oven ware. It isaccomplished by first heating annealed glassto just below its softening temperature, andthen rapidly quenching it with ambient air. The rapid cooling allows the glass surface toshrink in relation to internal regions whichcontinue to flow and remain stress-free. Continued cooling in this manner creates auniform temperature profile throughout theglass, and distributes stresses. The result isincreased resistance to bending failure.
• Laminating is the process of placing anorganic plastic film between two or morelayers of glass. If the glass is broken, thepieces are held in place by the plastic.
• Coatings are applied to impart specificproperties, such as heat reflection or scratchresistance.
• Other finishing processes, such as polishingor decorating may be done to enhanceappearance, or to achieve optical properties.
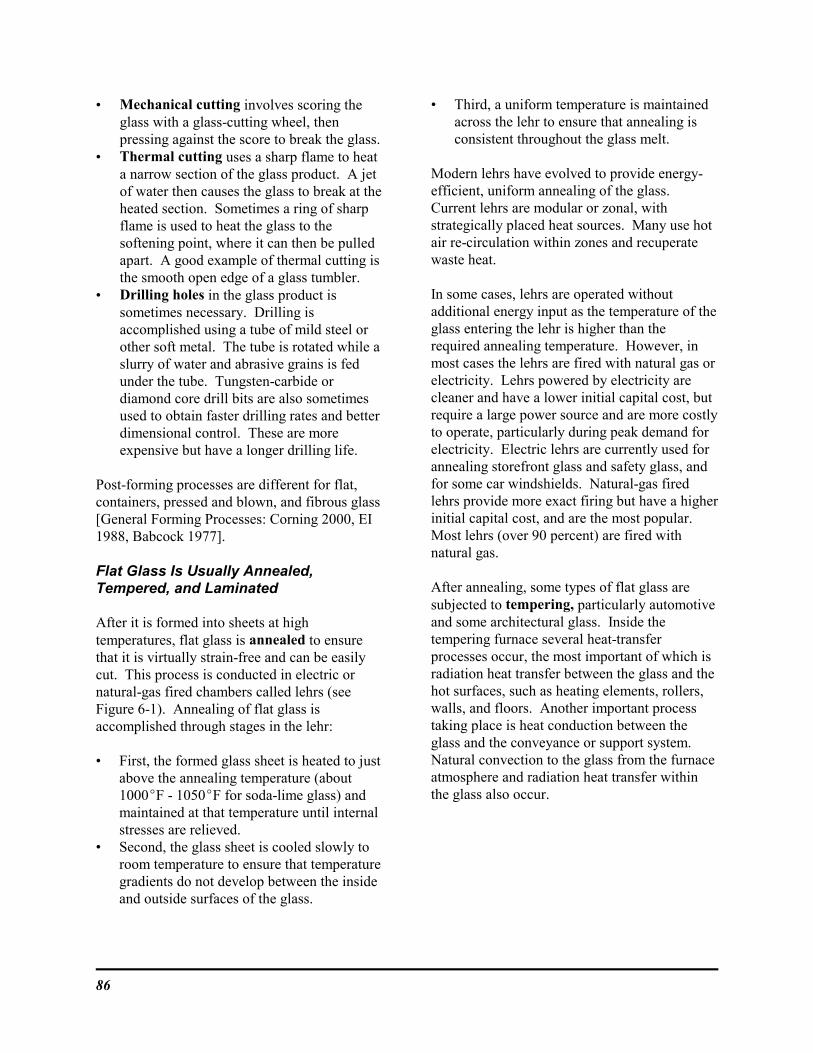
86
• Mechanical cutting involves scoring theglass with a glass-cutting wheel, thenpressing against the score to break the glass.
• Thermal cutting uses a sharp flame to heata narrow section of the glass product. A jetof water then causes the glass to break at theheated section. Sometimes a ring of sharpflame is used to heat the glass to thesoftening point, where it can then be pulledapart. A good example of thermal cutting isthe smooth open edge of a glass tumbler.
• Drilling holes in the glass product issometimes necessary. Drilling isaccomplished using a tube of mild steel orother soft metal. The tube is rotated while aslurry of water and abrasive grains is fedunder the tube. Tungsten-carbide ordiamond core drill bits are also sometimesused to obtain faster drilling rates and betterdimensional control. These are moreexpensive but have a longer drilling life.
Post-forming processes are different for flat,containers, pressed and blown, and fibrous glass[General Forming Processes: Corning 2000, EI1988, Babcock 1977].
Flat Glass Is Usually Annealed, Tempered, and Laminated
After it is formed into sheets at hightemperatures, flat glass is annealed to ensurethat it is virtually strain-free and can be easilycut. This process is conducted in electric ornatural-gas fired chambers called lehrs (seeFigure 6-1). Annealing of flat glass isaccomplished through stages in the lehr:
• First, the formed glass sheet is heated to justabove the annealing temperature (about1000EF - 1050EF for soda-lime glass) andmaintained at that temperature until internalstresses are relieved.
• Second, the glass sheet is cooled slowly toroom temperature to ensure that temperaturegradients do not develop between the insideand outside surfaces of the glass.
• Third, a uniform temperature is maintainedacross the lehr to ensure that annealing isconsistent throughout the glass melt.
Modern lehrs have evolved to provide energy-efficient, uniform annealing of the glass. Current lehrs are modular or zonal, withstrategically placed heat sources. Many use hotair re-circulation within zones and recuperatewaste heat.
In some cases, lehrs are operated withoutadditional energy input as the temperature of theglass entering the lehr is higher than therequired annealing temperature. However, inmost cases the lehrs are fired with natural gas orelectricity. Lehrs powered by electricity arecleaner and have a lower initial capital cost, butrequire a large power source and are more costlyto operate, particularly during peak demand forelectricity. Electric lehrs are currently used forannealing storefront glass and safety glass, andfor some car windshields. Natural-gas firedlehrs provide more exact firing but have a higherinitial capital cost, and are the most popular. Most lehrs (over 90 percent) are fired withnatural gas.
After annealing, some types of flat glass aresubjected to tempering, particularly automotiveand some architectural glass. Inside thetempering furnace several heat-transferprocesses occur, the most important of which isradiation heat transfer between the glass and thehot surfaces, such as heating elements, rollers,walls, and floors. Another important processtaking place is heat conduction between theglass and the conveyance or support system. Natural convection to the glass from the furnaceatmosphere and radiation heat transfer withinthe glass also occur.
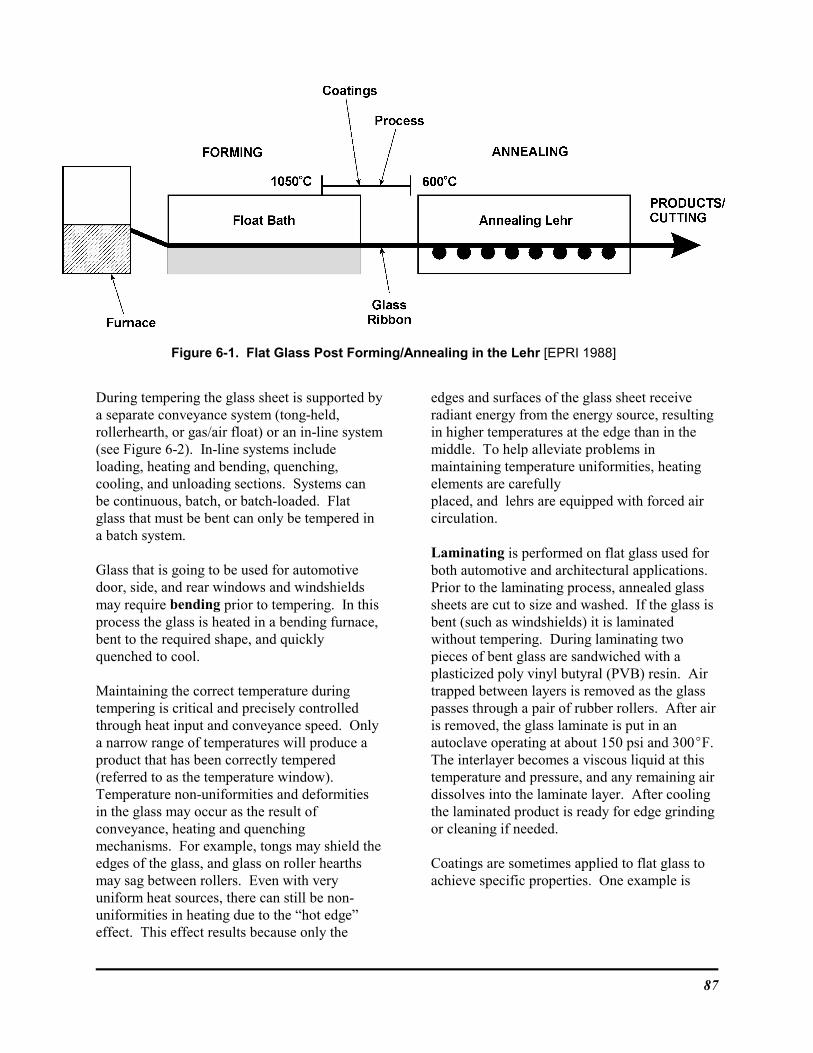
87
Figure 6-1. Flat Glass Post Forming/Annealing in the Lehr [EPRI 1988]
During tempering the glass sheet is supported bya separate conveyance system (tong-held,rollerhearth, or gas/air float) or an in-line system(see Figure 6-2). In-line systems includeloading, heating and bending, quenching,cooling, and unloading sections. Systems canbe continuous, batch, or batch-loaded. Flatglass that must be bent can only be tempered ina batch system.
Glass that is going to be used for automotivedoor, side, and rear windows and windshieldsmay require bending prior to tempering. In thisprocess the glass is heated in a bending furnace, bent to the required shape, and quicklyquenched to cool.
Maintaining the correct temperature duringtempering is critical and precisely controlledthrough heat input and conveyance speed. Onlya narrow range of temperatures will produce aproduct that has been correctly tempered(referred to as the temperature window). Temperature non-uniformities and deformitiesin the glass may occur as the result ofconveyance, heating and quenchingmechanisms. For example, tongs may shield theedges of the glass, and glass on roller hearthsmay sag between rollers. Even with veryuniform heat sources, there can still be non-uniformities in heating due to the “hot edge”effect. This effect results because only the
edges and surfaces of the glass sheet receiveradiant energy from the energy source, resultingin higher temperatures at the edge than in themiddle. To help alleviate problems inmaintaining temperature uniformities, heatingelements are carefully placed, and lehrs are equipped with forced aircirculation.
Laminating is performed on flat glass used forboth automotive and architectural applications. Prior to the laminating process, annealed glasssheets are cut to size and washed. If the glass isbent (such as windshields) it is laminatedwithout tempering. During laminating twopieces of bent glass are sandwiched with aplasticized poly vinyl butyral (PVB) resin. Airtrapped between layers is removed as the glasspasses through a pair of rubber rollers. After airis removed, the glass laminate is put in anautoclave operating at about 150 psi and 300EF. The interlayer becomes a viscous liquid at thistemperature and pressure, and any remaining airdissolves into the laminate layer. After cooling the laminated product is ready for edge grindingor cleaning if needed.
Coatings are sometimes applied to flat glass toachieve specific properties. One example is
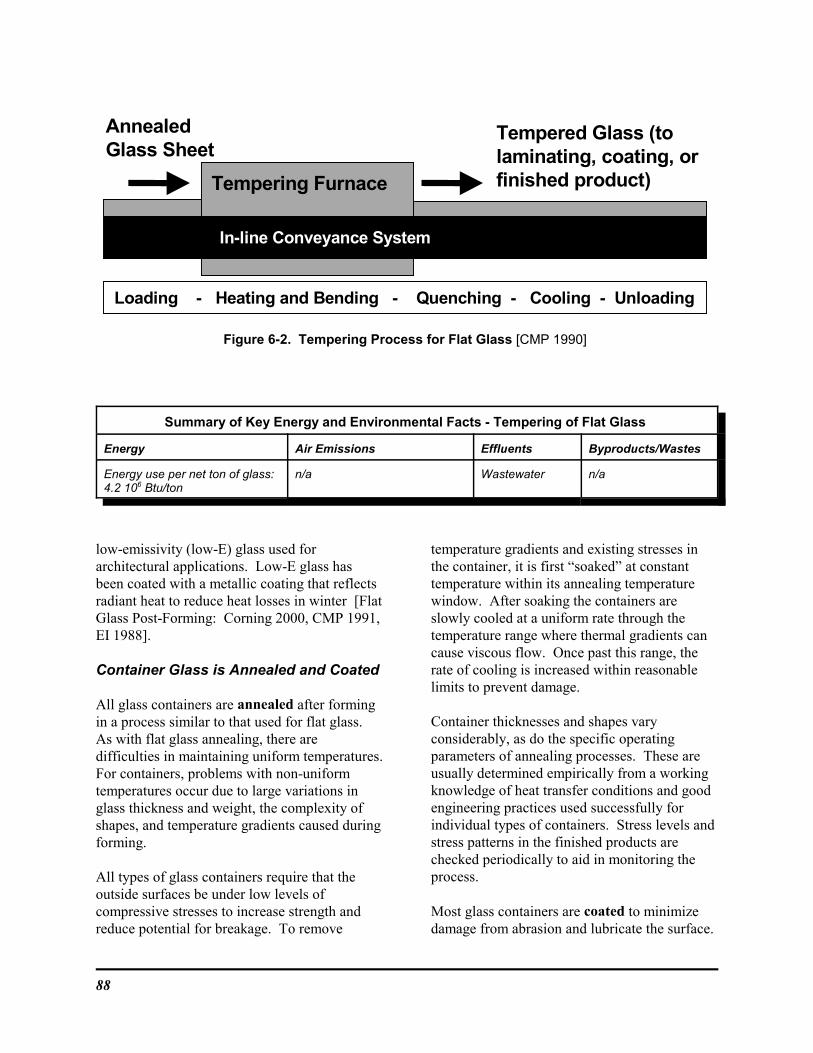
88
AnnealedGlass Sheet
Tempering Furnace
Loading - Heating and Bending - Quenching - Cooling - Unloading
In-line Conveyance System
Tempered Glass (tolaminating, coating, orfinished product)
Figure 6-2. Tempering Process for Flat Glass [CMP 1990]
Summary of Key Energy and Environmental Facts - Tempering of Flat Glass
Energy Air Emissions Effluents Byproducts/Wastes
Energy use per net ton of glass: 4.2 106 Btu/ton
n/a Wastewater n/a
low-emissivity (low-E) glass used forarchitectural applications. Low-E glass hasbeen coated with a metallic coating that reflectsradiant heat to reduce heat losses in winter [FlatGlass Post-Forming: Corning 2000, CMP 1991,EI 1988].
Container Glass is Annealed and Coated
All glass containers are annealed after formingin a process similar to that used for flat glass. As with flat glass annealing, there aredifficulties in maintaining uniform temperatures. For containers, problems with non-uniformtemperatures occur due to large variations inglass thickness and weight, the complexity ofshapes, and temperature gradients caused duringforming.
All types of glass containers require that theoutside surfaces be under low levels ofcompressive stresses to increase strength andreduce potential for breakage. To remove
temperature gradients and existing stresses inthe container, it is first “soaked” at constanttemperature within its annealing temperaturewindow. After soaking the containers areslowly cooled at a uniform rate through thetemperature range where thermal gradients cancause viscous flow. Once past this range, therate of cooling is increased within reasonablelimits to prevent damage.
Container thicknesses and shapes varyconsiderably, as do the specific operatingparameters of annealing processes. These areusually determined empirically from a workingknowledge of heat transfer conditions and goodengineering practices used successfully forindividual types of containers. Stress levels andstress patterns in the finished products arechecked periodically to aid in monitoring theprocess.
Most glass containers are coated to minimizedamage from abrasion and lubricate the surface.
89
Scratch-resistant coatings consist of a thin,nearly colorless coating of tin or titanium oxidewhich bonds to the glass surface. The tin ortitanium oxide layer is then coated with alubricant such as polyethylene. The coatings arenot affected by external processes (e.g.,pasteurization) and impart scratch resistance andlubricity to both wet and dry container surfaces.
The first coating is applied to the container justbefore annealing using a vapor of dibutyltintrichloride, an organometallic material. Afterannealing the lubricant is applied using anaqueous spray or under a vapor hood while thecontainers are still hot (about 200EF). The two-step process is very inefficient, with a great dealof material consumed in over-spraying of thecontainers. Tin coatings are also veryexpensive. New coatings are now emerging thatare much more efficient, environmentally soundand less expensive.
Dome-style nozzles are the most commonlyused type of airless flat spray nozzle. They areideal for applying thin, easy-to-atomizematerials. Atomization quality and patternuniformity can be affected by variations in thegeometry of the inner dome cavity and surfacefinish. Cross-cut nozzles are available in a widevariety of designs. These have severaladvantages over dome-style nozzles, includinglonger life, wider fan patterns, lower flow rates,improved atomization at lower pressures, andgreater resistance to plugging [Nordson 2000,CMP 1991, EI 1988].
Most Pressed and Blown Glass IsAnnealed
Most pressed and blown glass is annealed in afashion similar to container glass, althoughspecific operating conditions vary widely. Tempering of pressed and blown glass is usuallydone only on soda-lime oven ware, and for somespecialty glasses (e.g., optical lenses).
Annealing of optical glass, thermometers, andother specialty glass products is done by veryprecise processes. After annealing, further heat
treating may be done to achieve the desiredperformance characteristics. In the case ofoptical glass, for example, final annealing isdone to ensure the uniformity of the refractiveindex [EI 1988, Babcock 1977].
Fibrous Glass Goes Through Curing andDrying Processes
At the end of the forming process, glass woolfibers are sprayed with an aqueous phenolicbinder solution, then collected on a conveyorbelt in the form of a mat. The mat is carriedthrough a large oven or series of ovens wherethe thermosetting binder is cured. Curingtemperatures range from 350EF to 900EF(average about 600EF) for wool insulation,depending upon the thickness of the mat. Phenolic gases are produced during curing andare incinerated. After curing the mat passesthrough a cooling section where ambient airflows down through the mat (see Figure 6-3). Uneven edges are trimmed from the mat while itsits on the conveyor. In some cases a backingmay be applied to the mat using an adhesive. Once the mat is trimmed and finished, it is cutinto batts and packaged.
Textile fibers, once formed, are drawn over aroller which applies a coating of water-solublesizing and/or coating agent. The coated fibersare then wound onto spindles, which areconveyed to a drying oven. In the drying ovenmoisture is removed from the sizing and coatingagents. After drying, the spindles are conveyedto a curing oven to cure the coatings. In thefinal finishing step the fibers may be twisted,chopped, or woven into the desired product, andthen packaged.
Packaging and Product Handling AreUnique to the Glass Product
After post-forming processes are completed, theproduct is visually, optically or mechanicallyinspected for variations in dimension and
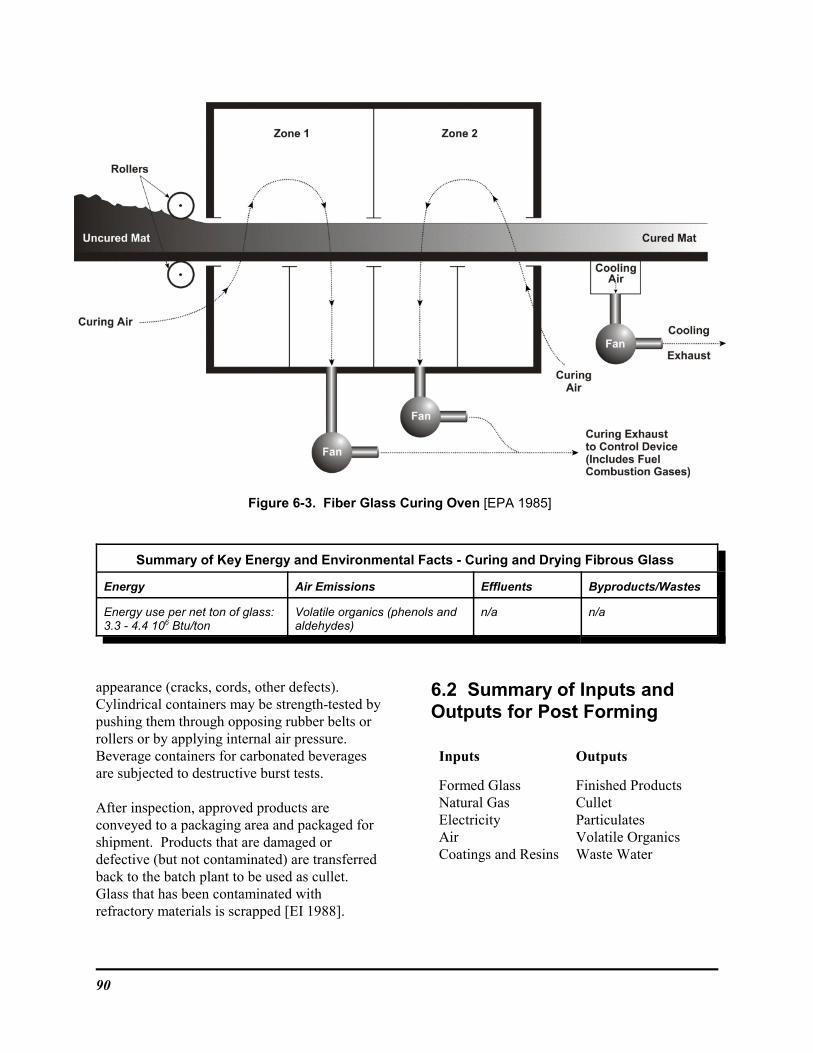
90
Figure 6-3. Fiber Glass Curing Oven [EPA 1985]
Summary of Key Energy and Environmental Facts - Curing and Drying Fibrous Glass
Energy Air Emissions Effluents Byproducts/Wastes
Energy use per net ton of glass:3.3 - 4.4 106 Btu/ton
Volatile organics (phenols andaldehydes)
n/a n/a
appearance (cracks, cords, other defects). Cylindrical containers may be strength-tested bypushing them through opposing rubber belts orrollers or by applying internal air pressure. Beverage containers for carbonated beveragesare subjected to destructive burst tests.
After inspection, approved products areconveyed to a packaging area and packaged forshipment. Products that are damaged ordefective (but not contaminated) are transferredback to the batch plant to be used as cullet. Glass that has been contaminated withrefractory materials is scrapped [EI 1988].
6.2 Summary of Inputs andOutputs for Post Forming
Inputs Outputs
Formed GlassNatural GasElectricityAirCoatings and Resins
Finished ProductsCulletParticulatesVolatile OrganicsWaste Water
91
6.3 Energy Requirements
The amount of energy consumed in post-forming operations generally ranges from 13-17percent [EI 1988]. Post-forming of containerglass requires the least energy consumption,while post-forming of flat glass is at the higherend of energy consumption. Table 6-1 providesestimated energy use in post-forming operationsamong the different segments.
Annealing of flat glass typically consumesbetween 500 and 1000 Btu/ft2 of flat glass, withan average specific energy consumption of 0.42million Btu per ton of glass. Autoclaving of flatglass during the laminating process requiresabout 0.68 million Btu per ton of glass, and ismostly powered with electricity.
About 10 percent of plant energy consumptiongoes to curing and drying of textile fibers, andabout 12 percent in glass wool production. Fiber glass wool curing consumes about 470 to588 Btu/lb of glass; incineration of phenolicfumes consumes about 588 Btu/lb [EI 1988].
6.4 Emissions
Post-Forming Produces Hazardous AirPollutants and Particulates
Air emissions from finishing of flat glassproducts is virtually non-existent. Some gasesare emitted during finishing of container andpressed and blown glass, particularly duringsurface treatment and decorating processes. Emission factors for these are shown in Table 6-2. These gaseous emissions are controlled usingincineration, absorption or condensationprocesses.
In glass wool manufacture, air emissions resultfrom combustion of fuels volatilization of liquid binder in the curing ovens. Some of thevaporized binder will condense as the gasstream cools in the emission control device, orin ductwork. In textile fiber manufacturing,combustion products from dryers and ovens may
be emitted, along with some hydrocarbons(phenols and aldehydes). Emission factors forglass wool and textile fiber manufacturing areshown in Table 6-3. Particulate emissions fromfiber manufacture are covered under NESHAPregulations (see Table 5-7), and limits areprovided for combined curing and formingoperations.
Rotary spin manufacturing of glass wool alsoproduces emissions of formaldehyde as thefibers go through curing ovens. These aretypically controlled with an end-of-the-lineincinerator to acceptable limits (see Table 6-4).
6.5 Effluents
Machine lubricants and solvents used duringfinishing may create a source of contaminatedeffluents. Sources are automotive glassfinishing where the glass is cut and passedthrough processes that grind and polish theedges, bent, and then tempered to produce sideand back windows. Other automotive processesthat produce effluents include cutting, bending,and washing to produce auto windshields, andthe process where plastic sheet is laminatedbetween two layers of glass. The production ofincandescent lamp envelopes may also createeffluents during the process where they areetched with hydrofluoric acid to produce frostedenvelopes.
The amount of contaminants in waste waterfrom glass operations is subject to limitationsunder the Clean Water Act. Effluent guidelinesspecifically geared toward glass manufacturingare shown in Table 6-5 [40 CFR 426].
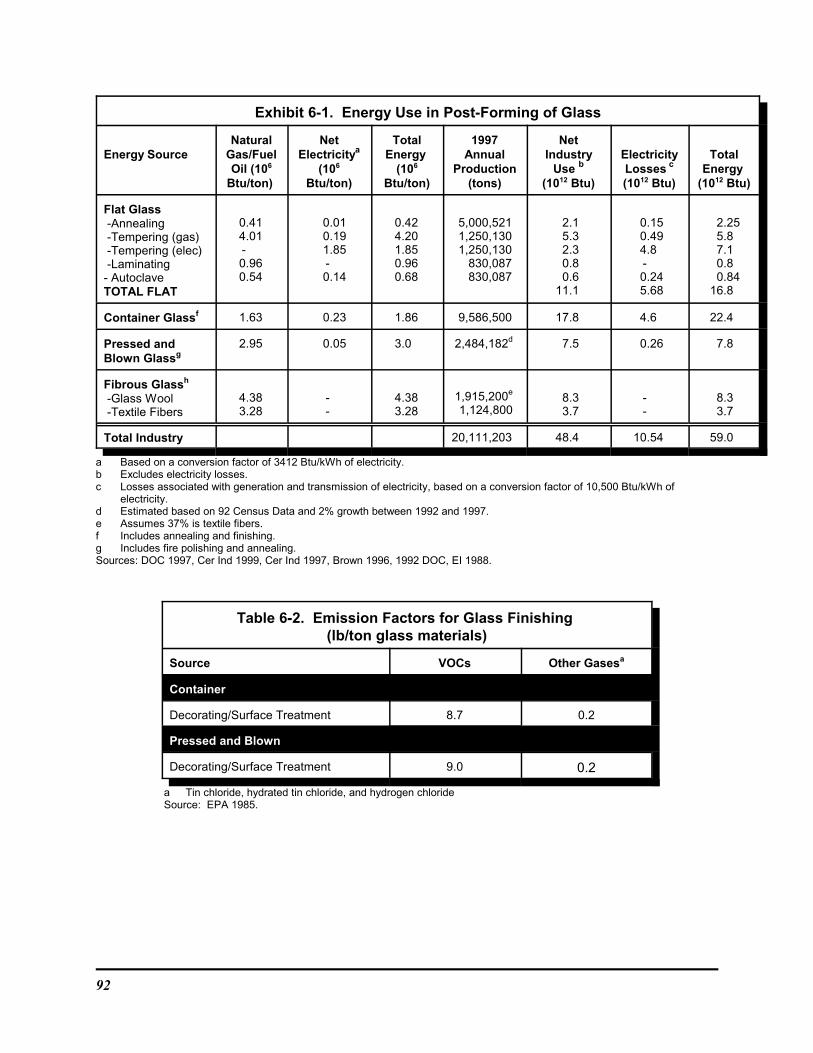
92
Exhibit 6-1. Energy Use in Post-Forming of Glass
Energy SourceNatural
Gas/FuelOil (106
Btu/ton)
NetElectricitya
(106
Btu/ton)
TotalEnergy
(106
Btu/ton)
1997Annual
Production(tons)
NetIndustry
Use b
(1012 Btu)
ElectricityLosses c
(1012 Btu)
TotalEnergy
(1012 Btu)
Flat Glass -Annealing -Tempering (gas) -Tempering (elec) -Laminating- AutoclaveTOTAL FLAT
0.414.01-0.960.54
0.010.191.85-0.14
0.424.201.850.960.68
5,000,5211,250,1301,250,130
830,087830,087
2.15.32.30.80.6
11.1
0.150.494.8-0.245.68
2.255.87.10.80.84
16.8
Container Glassf 1.63 0.23 1.86 9,586,500 17.8 4.6 22.4
Pressed andBlown Glassg
2.95 0.05 3.0 2,484,182d 7.5 0.26 7.8
Fibrous Glassh
-Glass Wool -Textile Fibers
4.383.28
--
4.383.28
1,915,200e
1,124,8008.33.7
--
8.33.7
Total Industry 20,111,203 48.4 10.54 59.0
a Based on a conversion factor of 3412 Btu/kWh of electricity.b Excludes electricity losses.c Losses associated with generation and transmission of electricity, based on a conversion factor of 10,500 Btu/kWh of
electricity.d Estimated based on 92 Census Data and 2% growth between 1992 and 1997.e Assumes 37% is textile fibers.f Includes annealing and finishing.g Includes fire polishing and annealing.Sources: DOC 1997, Cer Ind 1999, Cer Ind 1997, Brown 1996, 1992 DOC, EI 1988.
Table 6-2. Emission Factors for Glass Finishing (lb/ton glass materials)
Source VOCs Other Gasesa
Container
Decorating/Surface Treatment 8.7 0.2
Pressed and Blown
Decorating/Surface Treatment 9.0 0.2
a Tin chloride, hydrated tin chloride, and hydrogen chlorideSource: EPA 1985.
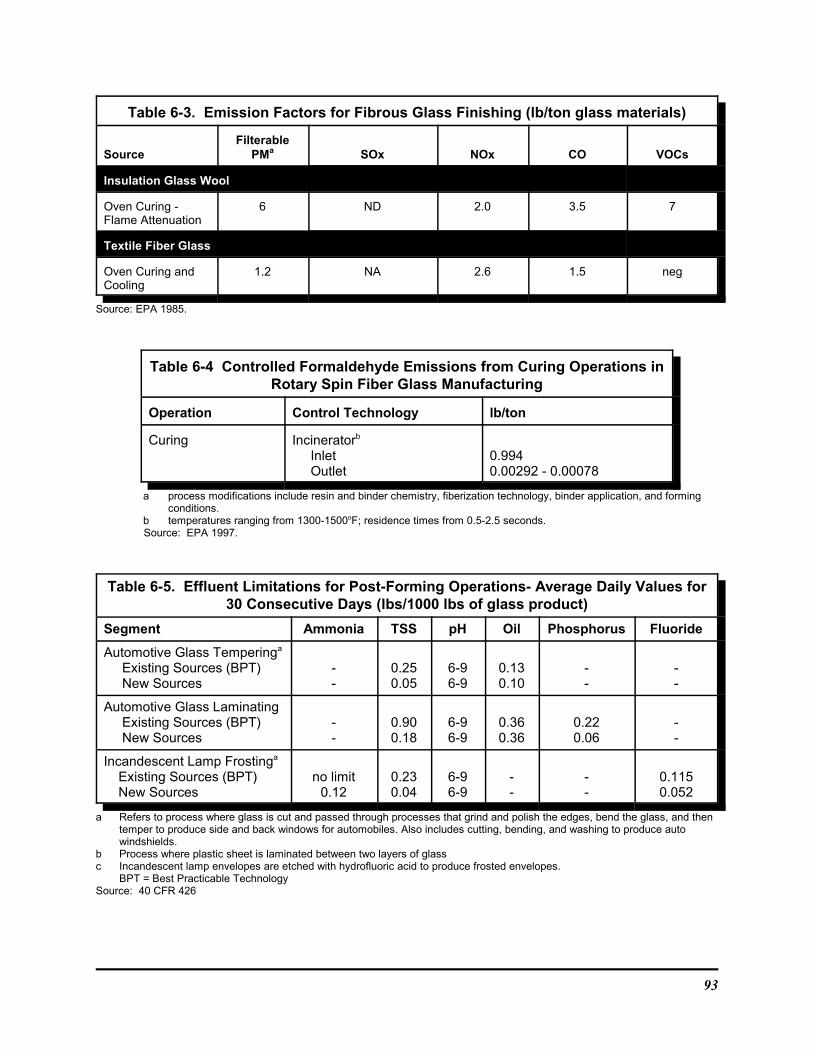
93
Table 6-3. Emission Factors for Fibrous Glass Finishing (lb/ton glass materials)
SourceFilterable
PMa SOx NOx CO VOCs
Insulation Glass Wool
Oven Curing - Flame Attenuation
6 ND 2.0 3.5 7
Textile Fiber Glass
Oven Curing andCooling
1.2 NA 2.6 1.5 neg
Source: EPA 1985.
Table 6-4 Controlled Formaldehyde Emissions from Curing Operations inRotary Spin Fiber Glass Manufacturing
Operation Control Technology lb/ton
Curing Incineratorb
Inlet Outlet
0.9940.00292 - 0.00078
a process modifications include resin and binder chemistry, fiberization technology, binder application, and formingconditions.
b temperatures ranging from 1300-1500oF; residence times from 0.5-2.5 seconds.Source: EPA 1997.
Table 6-5. Effluent Limitations for Post-Forming Operations- Average Daily Values for30 Consecutive Days (lbs/1000 lbs of glass product)
Segment Ammonia TSS pH Oil Phosphorus Fluoride
Automotive Glass Temperinga
Existing Sources (BPT) New Sources
--
0.250.05
6-96-9
0.130.10
--
--
Automotive Glass Laminating Existing Sources (BPT) New Sources
--
0.900.18
6-96-9
0.360.36
0.220.06
--
Incandescent Lamp Frostinga
Existing Sources (BPT) New Sources
no limit0.12
0.230.04
6-96-9
--
--
0.1150.052
a Refers to process where glass is cut and passed through processes that grind and polish the edges, bend the glass, and thentemper to produce side and back windows for automobiles. Also includes cutting, bending, and washing to produce autowindshields.
b Process where plastic sheet is laminated between two layers of glassc Incandescent lamp envelopes are etched with hydrofluoric acid to produce frosted envelopes.
BPT = Best Practicable TechnologySource: 40 CFR 426
94
6.6 Byproducts and Wastes
Cullet, or unusable glass product, is the majorbyproduct generated during finishing operations. Cullet is generated as products are cut intoshape (fiber mats), if the product is defective(shape, performance, quality), or broken. Culletis almost always returned to the batch plant forrecycling (except in fiberglass manufacturing).
Effluent from acid polishing of some glassesusually contains hydrofluoric acid and highlevels of lead and fluorides. This waste must beslaked
with lime, dewatered, and disposed of. Somemanufacturers are developing recycling systemsthat clean the waste and then recover theconstituents for reuse in the process [Glass Ind1998].
Packaging glue can sometimes be a source ofwaste. Solidified glue is typically sent to themunicipal landfill.
95
References40 CFR 60 CC 40 CFR 60, Subpart CC, National Performance Standards for Glass
Manufacturing Plants. 1980, amended 1984, 1989, 1999. 40 CFR 1999 Edition.
40 CFR 60 PPP 40 CFR 60, Subpart PPP, National Performance Standards for Wool FiberglassInsulation Plants. 1985, amended 1989. 40 CFR 1999 Edition.
40 CFR 61 N 40 CFR 61, Subpart N, National Emission Standard for Inorganic ArsenicEmissions from Glass Manufacturing Plants. 1986, amended 1990, 1999. 40CFR 1999 Edition.
40 CFR 63 NNN 40 CFR 63, Subpart NNN, National Emission Standards for Hazardous AirPollutants for Wool Fiberglass Manufacturing. 1999. 40 CFR 1999 Edition.
40 CFR 426 40 CFR 426, Glass Manufacturing Point Source Category. 1986, amended 1995.40 CFR 1999 Edition.
Am Cer Soc 1994 E.R. Bazarian, P.B. Eleazer, and A.G. Slavejkov, “Economics drive theconversion of glass tanks to oxy-fuel,” American Ceramic Society Bulletin,Vol. 73, No. 2, February 1994.
AMI 2002 Personal communication with Derek J. McCracken, American Minerals, Inc,April 2002.
Babcock 1977 Clarence L. Babcock, Silicate Glass Technology Methods, John Wiley & Sons,Inc., 1977.
BOC 2000 “BOC Gases: Glass Industry; Products, Delivery Process, Air Separation, ” BOCGases, 11/2000, www.boc.com/gases/solution/glass
Brown 1996 H.L. Brown, B.B. Hamel, B.A. Hedman, Energy Analysis of 108 IndustrialProcesses, Fairmont Press, Liburn, GA 1996.
Cer Ind 2000 “Flat Glass Markets Remain Strong; Container Markets Dominated By Plastics,”Ceramic Industry August 2000.
Cer Ind 1999 “Fiberglass, Glass Containers Threatened by Plastics,” Ceramic Industry,August 1999.
Cer Ind 1998 “Flat Glass Shipments to Increase by 2002,” Ceramic Industry, August 1998.
Cer Ind 1997 “Other Glass Markets Issue Mixed Signals,” Ceramic Industry, August 1997.
Cer Ind 1997a “New Products Will Maintain Demand for Flat Glass,” Ceramic Industry,August 1997.
96
Cer Ind 1994 G. Brown, S. DeSanctis, and B. Eleazer, “New Oxy-Fuel Burner ProvidesBenefits to Glass Melters,” Ceramic Industry, February 1994.
Cer Ind 1991 G.L. Ridderbusch, “Advances in Glassmelting Furnace Technology,” CeramicIndustry, March 1991.
CHEMWK 1999 “Forecast 99' Lkd. Chemical Week, January 9, 1999. Www.chemweek.com(April 9, 1999).
CMP 1990 “Techcommentary: Electricity in Glassmaking,” EPRI Center for MaterialsProduction (CMP), CMP-047, 1990.
Corning 2001 “Corning Announces Funding for Newest Optical Fiber Manufacturing Facilityin Oklahoma City,” Press Release, February 7, 2001, Yahoo Business Wire,http://biz.yahoo.com/bw/010207/ny_corning_2.html
Corning 2000. “Chemistry of Glass,” “The Glass State - in Brief,” “The Glass Ribbons,”“Glassblowing Discovered,” “Modern Machine Forming,” “Annealing,”“Properties of Glass,” “Chemistry of Glass,” “Running Glass/Glass Flow,”“Glass and the Space Orbitor,” “Laser Communication Through Glass,” “Typesof Glass,” Corning Museum of Glass, Education Resources,www.cmog.org/Education/index.htm 12/2000.
DOC ASM 93-99 Annual Survey of Manufactures, 1993 - 1999, U.S. Department of Commerce,Bureau of the Census.
DOC MP 93-00 Manufacturing Profiles, Current Industry Series, 1993-2000, U.S. Department ofCommerce, Bureau of the Census.
DOC 1997 1997 Census of Manufactures, U.S. Department of Commerce, Bureau of theCensus.
DOC 1994 Current Industrial Reports: Pollution Abatement Costs and Expenditures: 1994,U.S. Department of Commerce, Bureau of the Census, MA200 (94)-1.
DOC 1992 1992 Census of Manufactures, U.S. Department of Commerce, Bureau of theCensus.
DOE 2000 Monthly Energy Review December 2000, Table 9.11, Natural Gas Prices, EnergyInformation Administration, U.S. Department of Energy.
DOE 2000a “Oxygen Enriched Air Staging,” Briefing, 3/6/2000, E. Levine, U.S. Departmentof Energy, Office of Industrial Technologies.
DOE 1998 Emissions of Greenhouse Gases in the United States, 1997, U.S. Department ofEnergy, Energy Information Administration, October 1998. DOE/EIA-0573(97).
DOE 1997 Oxy-Fuel Issues for Glassmaking in the 90's: Workshop Proceedings, U.S.Department of Energy, Office of Industrial Technologies, DOE/Conf-970292,February 1997.
97
DOE 1995 Emissions of Greenhouse Gases in the United States 1987-1994. U.S.Department of Energy, Energy Information Administration, DOE/EIA -0573 (87-94). 1995.
DOE 1994 Emissions of Greenhouse Gases in the United States 1987-1992. U.S.Department of Energy, Energy Information Administration, DOE/EIA -0573 (87-92). 1994.
EC 2000 Integrated Pollution Prevention and Control: Reference Document on BestAvailable Techniques in the Glass Manufacturing Industry, EuropeanCommission, Institute for Prospective Technological Studies, Sevill, SpainOctober 2000.
EI 1988 E. Babcock, A. Elaahi, and H.E. Lowitt, The U.S. Glass Industry: An EnergyPerspective, Energetics, Incorporated for the U.S. Department of Energy,DOE/RL/01830-T60, September 1988.
EPA 1998 Macroeconomic Importance of Recycling and Remanufacturing, U.S.Environmental Protection Agency, Office of Solid Waste, October 28, 1998.
EPA 1997 40 CFR Part 63 [IL-64-2-5807; FRL-5695-8] Proposed National EmissionStandards for Hazardous Air Pollutants for Source Categories; Wool FiberglassManufacturing. February 21, 1997.
EPA 1997a Sector Notebook Refresh, U.S. Environmental Protection Agency (EPA), Officeof Compliance Sector Notebook Project, September 1997.
EPA 1995 Profile of the Stone, Clay, Glass and Concrete Products Industry, U.S.Environmental Protection Agency (EPA), Office of Compliance Sector NotebookProject, September 1995.
EPA 1994 Alternative Control Techniques Document - Nox Emissions From GlassManufacturing, U.S. Environmental Protection Agency, Emission StandardsDivision, Office of Air and Radiation, Research Triangle Park, NC, June 1994.
EPA 1986 AP-42. Chapter 11.15, Glass Manufacture, U.S. Environmental ProtectionAgency (EPA), October 1986, Reformatted January 1995.
EPA 1985 AP-42. Chapter 11.13, Glass Fiber Manufacture, U.S. Environmental ProtectionAgency (EPA), September 1985, Reformatted January 1995.
EPRI 1988 Glass Industry Scoping Study, Electric Power Research Institute, EPRI EM5912S, 1988.
Flinn 1981 Richard A. Flinn and Paul K. Trojan, Engineering Materials and TheirApplications, 2nd Edition, Houghton Mifflin Company, 1981.
Freitag 1997 D.W. Freitag, “Opportunities for Application of Advanced Ceramics: GlassIndustry,” 1997.
98
FTI 2000 “Optical Fiber Principles and Construction,” Fiberoptics TechnologyIncorporated, 1999, www.fti.thomasregister.com 11/15/2000
Geiger 1994 Geiger, G., “Advances in Glass Processing.” American Ceramic SocietyBulletin 72(2): 27–33, 1993.
Geiger 1993 Geiger, G., “Environmental and Energy Issues in the Glass Industry.” AmericanCeramic Society Bulletin 73(2): 32–37, 1994.
GIC 2001 Personal Communication, Glass Industry Consulting, 2001.
GIC 1997 Personal Communication, Glass Industry Consulting, 1997.
Glass Facts 2000 Glass Past, Glass Facts.com, www.glassfacts.com/glaspast/glaspast.html,11/16/00.
Glass Ind 2000 P. Mayer, “Technology meets the challenge of cullet processing,” GlassIndustry, February 2000.
Glass Ind 1999 “Mixed Prospects for Fiber,” Glass Industry, July 1999.
Glass Ind 1999a “How the Glass Industry Fared in 1998,” Glass Industry, August 1999.
Glass Ind 1998 “In Search of Zero Emissions,” Glass Industry, August 1998.
Glass Ind 1996 R. Deal and P.C. Johnson, “Float Glass Manufacturing Advances NewOpportunities,” Glass Industry, December 1996.
Glass Ind 1993 D.E. Shamp, Al.G. Slavejkov, and G. Neff, Jr., “Oxy-Fuel Firing forEmissions Control on a Fiberglass Melter,” Glass Industry, October1993.
Glass Tech 1996 M.J. Damsell, M.L. Joshi, J.R. Latter, and D.B. Wishnick, “100% Oxy-FuelFiring: The Real Story,” Glass Technology, Vol. 37, No. 4, August 1996, pgs114-117.
GPI 1999 “Americans Continue to Recycle More Than One in Three Glass Containers,”Press Release, October 27, 1999, Glass Packaging Institute,www.gpi.org/98rate.htm
Gridley 2001 Personal communication with M. Gridley, Saint-Gobain Containers, Inc., May2001.
Ind Min 1998 T. Kendall, “Food for Thought,” Industrial Minerals, June 1998.
Manville 2001 ‘Johns Manville Completes Purchase of Skloplast A.S.,” Press Release March 12,2001, Yahoo Business Wire, http://biz.yahoo.com/prnews/010312/lam016.html
MECS 1998 1998 Manufacturing Energy Consumption Survey, Energy InformationAdministration, U.S. Department of Energy, March 2001.
99
MECS 1994 1994 Manufacturing Energy Consumption Survey, Energy InformationAdministration, U.S. Department of Energy, January 1996.
NAIMA 2001 “Industry Use of Recycled Materials Exceed 14 Billion Pounds,” Press Release,North American Insulation Manufacturers Association, Alexandria, VA.,www.naima.org/releases/recycled.html, March 6, 2001.
NAIMA 2000 “NAIMA’s Health and Safety Partnership Program,” North American InsulationManufacturers Association, Alexandria, VA., www.naima.org/hspp/hspp.html,11/16/2000.
NAIMA 1998 “The Facts on Fiber Glass,” North American Insulation ManufacturersAssociation, Alexandria, VA. 1998.
Nordson 2000 Product information, Nordson Corporation Container Systems, October 2000,www.nordson.com September 1999.
OMB 1997 North American Industry Classification System United States 1997. ExecutiveOffice of the President, Office of Management and Budget.
OMB 1987 Standard Industrial Classifications Manual 1987. Executive Office of thePresident, Office of Management and Budget.
Owens 2001 “Owens-Corning Financial Reorganization,” Owens-Corning,www.owenscorning.com/finre/faqs.html May 2001.
Shell 2001 Personal communication with J. Shell, Techneglas, April 2001.
Sterling 1987 D. J. Sterling, Technician’s Guide to Fiber Optics, Delmar Publishers, Albany,NY 1987.
USITC 2001 Import and Export Commodities, Annual Data, 1992-2001, U.S. InternationalTrade Commission, www.dataweb.usitc.gov September 2001.
USITC 1998 Interview. James Lukes, Analyst, U.S. Dept. of Commerce, International TradeCommission 1998.
Vision 1996 Glass: A Clear Vision for a Bright Future, (Technology Vision and ResearchAgenda for the Glass Industry.) 1996, U.S. Government Printing Office.
WEFA 1997 Global Warming: The Economic Cost of Early Action, WEFA, Inc. 1997.