itp forest products: energy and environmental profile of the u.s
TRANSCRIPT

ENERGY AND ENVIRONMENTAL PROFILE OF THE
U.S. PULP AND PAPER INDUSTRY
Industrial Technologies Program
Wood chips from pulp and paper mills
Willow tree research plots, Tully, New York
Wood gasifier demonstration, Burlington, Vermont
Paper drying steam cans, awaiting shipment
December 2005


Energy and Environmental Profile
of the U.S. Pulp and Paper Industry
December 2005
Prepared by Energetics Incorporated Columbia, Maryland
for the
U.S. Department of Energy Office of Energy Efficiency and Renewable Energy
Industrial Technologies Program

Acknowledgments
This report was written by Energetics Incorporated in Columbia, Maryland. It was prepared under the general direction of the U.S. Department of Energy’s Industrial Technologies Program with oversight by Isaac Chan and Drew Ronneberg. The principal authors of the report are Melanie Miller, Mauricio Justiniano, and Shawna McQueen, with technical and editorial contributions made by Joan Pellegrino and Tracy Carole, of Energetics Incorporated. External technical reviews of the report were provided by the following individuals associated with the U.S. forest products industry: Elmer H. Fleischman Idaho National Laboratory Irene A. Kowalczyk MeadWestvaco Corporation Michael A. Roberts Roberts Group LLC Benjamin A. Thorp, III Industry Consultant Paul M. Tucker International Paper

Energy and Environmental Profile of the U.S. Pulp and Paper Industry i
Table of Contents
Foreword...............................................................................................................................v
1. Overview ...................................................................................................................1 2. Pulp and Paper Mills ...............................................................................................15 3. Wood Preparation....................................................................................................23
4. Pulping ......................................................................................................................27
5. Kraft Chemical Recovery........................................................................................41
6. Bleaching...................................................................................................................51
7. Papermaking ............................................................................................................63
8. Supporting Systems .................................................................................................73
9. The Forest Biorefinery ............................................................................................79
Bibliography ...................................................................................................................83

Energy and Environmental Profile of the U.S. Pulp and Paper Industry ii
Tables and Figures 1 Overview
Snapshot of the Paper and Allied Products Sector (2003) ............................................................. 2 Production of Paper and Paperboard Products (2003).................................................................... 2 Total Paper and Paperboard Production by Region........................................................................ 2 The Cyclical Nature of the Paper and Allied Products Sector in Relation to GDP,
Total Shipments, Capital Expenditures, and Capital Intensity ............................................. 3 Paper and Allied Products Ratio of R&D Expenditures to Net Revenues ..................................... 4 Energy Use by Sector ..................................................................................................................... 5 2000 Energy Use by Fuel for Paper Manufacturing....................................................................... 6 Energy Intensity Trends for Paper Manufacturing ......................................................................... 6 Use of Fuel and Energy by U.S. Pulp, Paper, and Paperboard (1972 and 2000) ........................... 7 Federal Regulations Affecting Paper Manufacturing..................................................................... 9 National Ambient Air Quality Standards ..................................................................................... 10 Most-Emitted Hazardous Air Pollutants from Pulp and Paper Mills ........................................... 10 Summary of Clean Water Act Requirements (as of 1998)........................................................... 11 Anticipated Reduction in Pollutants from Pulp and Paper Mills under EPA's
Cluster Rules....................................................................................................................... 12 Projected Cost of Compliance for Selected Regulations.............................................................. 13 Recovered Paper Utilization in Paper/Paperboard Production..................................................... 13 Carbon Emissions from Combustion of Fuels in Pulp and Paper ................................................ 14
2 Pulp and Paper Mills
Major Paper Manufacturing Processes ......................................................................................... 15 Integrated Pulp and Paper Making Process .................................................................................. 16 Estimated Energy Use by Process ................................................................................................ 17 Heating Value of Selected Wood and Waste Fuels ...................................................................... 18 Summary of Environmental Aspects of Wood Preparation Processes ......................................... 18 Summary of Environmental Aspects of Pulping Processes.......................................................... 19 Summary of Environmental Aspects of Kraft Chemical Recovery.............................................. 20 Summary of Environmental Aspects of Pulp Bleaching .............................................................. 20 Summary of Environmental Aspects of the Papermaking Process .............................................. 21 Summary of Environmental Aspects of Wastewater Treatment .................................................. 21
3 Wood Preparation
Wood Consumption by Pulping Process and Species ................................................................. 23 Flow Diagram for Wood Preparation ........................................................................................... 24 Average Energy Intensities of Wood Preparation Processes........................................................ 25 Effluent Analysis for Wet Drum and Hydraulic Debarkers ......................................................... 26
4 Pulping
Typical Compositions of North American Woods ....................................................................... 27 General Classification of Pulping Processes ................................................................................ 28 Comparative Characteristics of Kraft vs. Sulfite Pulping Processes............................................ 29 Sample of Pulp Mills by Geographical Region ............................................................................ 29 Kraft Pulping Process ................................................................................................................... 30 Sulfite Pulping Process................................................................................................................. 32 General Characteristics of Major Mechanical Pulping Processes ................................................ 33

Energy and Environmental Profile of the U.S. Pulp and Paper Industry iii
Semichemical Pulping Process..................................................................................................... 34 Two Loop Deinking System for High-Grade Writing and Printing Paper Grades....................... 36 Average Energy Intensities of Pulping Processes ........................................................................ 37
5 Kraft Chemical Recovery
Kraft Chemical Recovery Flow Diagram..................................................................................... 42 Evaporation of Black Liquor ........................................................................................................ 43 Green Liquor Preparation ............................................................................................................. 45 Causticization of Green Liquor to Prepare White Liquor (Recovered Chemicals)...................... 45 Lime Reburning and Recovery (Calcining).................................................................................. 46 Average Energy Intensities of Kraft Chemical Recovery Processes............................................ 48 Air Emission Factors for Kraft Chemical Recovery .................................................................... 49
6 Bleaching
ISO Brightness Levels of Unbleached Pulps................................................................................ 51 Two-Stage Pulp Brightening Process........................................................................................... 52 Chemical Pulp Bleaching Conditions........................................................................................... 53 Chlorine Dioxide (D) Stage.......................................................................................................... 54 Alkaline Extraction (E) Stage....................................................................................................... 55 Oxygen (O) Stage......................................................................................................................... 55 Hypochlorite (H) Stage ................................................................................................................ 56 Ozone (Z) Stage............................................................................................................................ 57 Oxygen-Reinforced Alkaline Extraction (EOP) Stage................................................................. 57 Hydrogen Peroxide (P) Stage ....................................................................................................... 58 ECF Four Stage [OD(EOP)D] Bleaching Sequence .................................................................... 59 Average Energy Intensities of Bleaching Processes..................................................................... 61 BOD of Softwood Kraft Pulp Bleaching Effluent........................................................................ 62 Color of Softwood Kraft Pulp Bleaching Effluent ....................................................................... 62 Typical AOX Values for Kraft Pulp Bleaching Effluent ............................................................. 62
7 Papermaking
Typical Papermaking Flow Diagram............................................................................................ 63 Wet-End Chemicals and Mineral Additives................................................................................. 64 Papermaking Machines in the United States by Type (2000) ...................................................... 65 Fourdrinier Machine..................................................................................................................... 65 Diagrams of Several Types of Twin Wire Formers ..................................................................... 66 Energy Consumption in Papermaking ......................................................................................... 70
8 Supporting Systems
Fuel Distribution in Paper Manufacture ....................................................................................... 73 Boiler Fuel Efficiency .................................................................................................................. 73 Major Types and Sources of Air Pollutants in Pulp and Paper Manufacture ............................... 75 Air Pollution Control Equipment ................................................................................................. 76 Regulated Effluent Characteristics ............................................................................................... 77 Common Water Pollutants from Pulp and Paper Processes ......................................................... 77
9 The Forest Biorefinery
Components of the Forest Biorefinery ......................................................................................... 79 Potential Products from Residuals and Spent Pulping Liquors .................................................... 80

Energy and Environmental Profile of the U.S. Pulp and Paper Industry iv

Energy and Environmental Profile of the U.S. Pulp and Paper Industry v
Foreword
The U.S. Department of Energy’s Industrial Technologies Program (DOE/ITP) works with U.S. industry to develop technology partnerships and support collaborative R&D projects that enhance energy efficiency, competitiveness, and environmental performance. In 1996, DOE/ITP began work on a series of energy and environmental profiles on a number of basic industries that are vital to the U.S. economy but also very energy-intensive. Though the profiles are intended primarily to better inform collaborative industry-DOE R&D planning, they also provide a valuable resource that can be widely used by many others who are not directly involved in these efforts. Through these profiles, research managers, policy makers, industry analysts and others can gain a general perspective of industrial energy use and environmental impacts. The profiles do not attempt to recreate sources that already exist; rather, they provide a “snap shot” of the industry and a source of references on the topic. The primary advantage of the profiles is that they synthesize into a single document information that is available in many different forms and sources. Aggregated data for the entire industry as well as data at the process level is presented according to major unit operations. Data is obtained from the most currently available public sources, industry experts, and governmental reports. Prior to publication, profiles are reviewed by those working in the industry, trade associations, and experts in government and the national laboratories. To date, energy and environmental profiles have been published for the aluminum, steel, chemicals, petroleum refining, metal casting, glass, pulp and paper, and supporting industries (e.g., welding, heat treating, powder metallurgy).

Energy and Environmental Profile of the U.S. Pulp and Paper Industry vi

Energy and Environmental Profile of the U.S. Pulp and Paper Industry 1
The U.S. Forest Products Industry is comprised of Paper Manufacturing (NAICS* 322) and Wood Product Manufacturing (NAICS 321). This report, Energy and Environmental Profile of the Pulp and Paper Industry, addresses the largest and most energy intensive of the two – the Paper Manufacturing sector. Paper manufacturing includes pulp mills, papermaking plants, and integrated mills (pulp and papermaking at same facility). *North American Industrial Classification System
1 Overview 1.1 The U.S. Paper Manufacturing Sector The United States is the world’s leading producer, consumer, and exporter of pulp, paper, and paperboard products. The nation as a whole produces 28% of the world’s pulp and 25% of its paper, with three of the world’s five largest paper and forest products companies based here (Paperloop 2003). The United States also has the highest per-capita consumption of paper worldwide at 714 pounds per capita in 2001, compared to less than 244 pounds in Europe and 101 pounds in Asia (Paperloop 2003). Paper Industries are Integral to the Economy U.S. paper manufacturing includes the processing of wood, recovered paper and paperboard, and other cellulose fibers into thousands of end-use products (MGH 1999). It is comprised of pulp mills, dedicated paper production facilities, and integrated mills that include both pulp processing and paper manufacture. The paper manufacturing sector is an integral part of the economy, shipping nearly $160 billion in products every year and employing more than 500,000 workers. Paper manufacturing represents some of the world’s largest installed production capacity, and is the most capital-intensive industry in the U.S. manufacturing sector. The sector is very diverse, with seventeen different industries using a variety of pulping processes and hundreds of different grades of paper to manufacture a myriad of products. In 2000, 499 paper and/or paperboard mills and 176 pulp mills operated in the United States, including integrated pulp and paper mills. Integrated mills share common systems for generating energy and treating wastewater, and eliminate transportation costs for acquiring pulp. Less cost-effective, non-integrated mills must obtain pulp from another source but are typically smaller and can be sited in urban locations (MGH 1999; AF&PA 1998a; Paperloop 2003; Saltman 1998). In the early 1980s, 40% of paper mills and 33% of paperboard mills were integrated with pulp mills (EI 1988). By 1992, these numbers had fallen slightly to 38% and 29%, respectively (DOC 1994). However, more recently the industry has begun to move toward integrated mills.
Table 1-1 provides summary data for the U.S. paper manufacturing industry. The United States produced 90 million tons of paper and paperboard and 58 million tons of wood pulp in 2003 (AF&PA 2004a). The industry exports and imports both pulp and paper products, with the value of exports reaching about $14 billion in 2003, or about 9% of the value of shipments that year. Overall the industry shipped nearly $160 billion in products in 2003, which represents about 4% of the total value of shipments produced by the U.S. manufacturing sector (ASM 2003). The industry has steadily increased the use of recycled paper in its products over the last two decades. In 2003, the industry recovered and reused about 34 million tons of post-consumer paper products.
Products of the Paper Manufacturing Sector
Newsprint
Writing and Printing/Copy Paper Construction Paper and Board
Parchment Magazine
Specialty Packaging and Industrial Papers
Tissue Paper Box and Container Board
Food Board Cellulose Derivatives (Rayon,
cellophane, etc.) Tall Oil
Turpentine

Energy and Environmental Profile of the U.S. Pulp and Paper Industry 2
The capacity for paper and paperboard in the industry is over 100 million tons annually, with pulp capacity at about 68 million tons. Historically, the industry has operated at 89-94% of capacity, but utilization has dipped in recent years to 86% and 84% for paper and paperboard, and pulping, respectively (Paperloop 2003). Nearly 72% of the capacity for domestic wood pulp is located in the southern United States, where tree farms are abundant. Regional data on the distribution of production capacity and the total annual production of paper and allied products demonstrates that the South also dominates in the manufacture of these products (Figure 1-1) (AF&PA 2002a). The industry creates a diversity of products which can be categorized as paper or paperboard (see Table 1-2), with each accounting for roughly half of production. The manufacture of printing and writing papers dominates industry production of paper in terms of tonnage, at 24 million tons in 2003. Products in this category include computer and copy paper, publishing medium (magazines, books), and other printing papers. Paperboard represents 56% of production, and is comprised of container (liner) board, box board, corrugated medium, wet machine board, and construction board. Productivity in the industry has been steadily rising over the last decade. The output per employee-hour at pulp, paper, and paperboard mills increased by 6.3% between 1990 and 2000. Production workers in the industry are relatively well-paid, and earned an average hourly wage of $18.90 in 2003, about 14% greater than the average of $16.57 per hour for all manufacturing (ASM 2003, NAICS 322 only).
Table 1-1. Snapshot of the Paper and Allied Products Sector (2003)
Number of pulp, paper, board mills (2001) 675Employment 519,000Value of shipments ($ billion) $159.6Paper/paperboard capacity (million tons) 100.1Paper/paperboard production (million tons) 89.8Paper/paperboard exports (million tons) 11.9Paper/paperboard imports (million tons) 20.1Pulp capacity (million tons) 68.2Pulp production (million tons) 57.7Pulp exports (million tons) 5.9Pulp imports (million tons) 6.7Value of exports ($ billion) $14.0Energy consumption (2002) (quadrillion BTUs) 2.4Recovered paper consumption (million tons) 33.7Recovered paper recovery rate 50.3%
Sources: AF&PA 2004a; ITA/DOC 2002; MECS 2002.
0
10000
20000
30000
40000
50000
60000
Northeast North Central South West
Thousand Tons
Figure 1-1. Total Paper and Paperboard Production by Region
Table 1-2. Production of Paper and Paperboard Products (2003)
Product Million Tons/Year
% of Production
Newsprint 5.7 6% Tissue Paper 7.1 8% Printing/Writing Paper 23.7 26% Packaging/Industrial Papers 3.9 4%
Total Paper 40.4 44% Total Paperboard 49.4 56%
TOTAL Paper/Paperboard 89.8 100%
Source: AF&PA 2004a.

Energy and Environmental Profile of the U.S. Pulp and Paper Industry 3
1.2 Market Trends Paper Manufacturing is a Cyclical Industry The paper manufacturing sector has traditionally been dependent on consumer demand and the overall health of the U.S. economy. A growing gross domestic product (GDP) has typically been tied to an expansion in shipments in this industry. Other cyclical activities, however, influence paper manufacturing, notably capital spending (especially capital intensity), which generally rises following profitable years and falls during economic downturns (MGH 1999). Table 1-3 provides economic data that illustrates the cyclical nature of paper manufacturing. The last fifteen years have been particularly turbulent for the industry. Paper manufacturers substantially expanded capacity during the economic upswing of the late 1980s, then experienced an extensive down cycle during the recession of the early 1990s. As a result, capital expenditures began to decline and by 1991 were 28% lower. The decline began to reverse in mid-1994, and the industry enjoyed one of its most profitable years in 1995, allowing it to retire some of its debt. In 1996 domestic sales stagnated once again, and profits fell 46%. Further declines in 1997 forced companies to reduce capital spending by more than 14%. Corporate restructuring, mergers and acquisitions to improve profits were characteristic of the industry from late 1996 through 1998. Late in the decade, economic growth pushed the demand for paper shipments higher, and the industry emerged from “the most volatile business cycle in history.” The collapse of Asian economies slowed growth in the paper industry somewhat during 1998 (MFI 1998), as did the 2001 recession and strong value of the U.S. dollar (Paperloop 2003).
Table 1-3. The Cyclical Nature of the Paper and Allied Products Sector in Relation to GDP, Total Shipments, Capital Expenditures, and Capital Intensity
Year Paper and
Paperboard Shipments ($ billion)
Total Shipments (thousands of tons)
Capital Expenditures on New Plants and
Equipment ($ million)
Capital Intensity (capital
expenditures/ shipments)
1993 127.0 84,959 7,370 5.8%
1994 136.9 89,080 7,731 5.7%
1995 166.1 89,416 8,369 5.0
1996 152.9 90,417 9,302 6.1%
1997 150.3 95,044 8,595 5.7%
1998 155.0 94,554 8,547 5.5%
1999 156.9 97,020 7,081 4.5%
2000 165.3 94,491 7,384 4.5%
2001R 155.9 88,913 6,797 4.4%
2002R 151.5 89,687 N/A N/A
2003P 159.6 88,388 N/A N/A
P – preliminary; N/A – not available; R – revised
Source: AF&PA 2004a.

Energy and Environmental Profile of the U.S. Pulp and Paper Industry 4
At present, Canada is the industry’s largest trading partner; 21.9 million tons of pulp, paper, and paperboard flowed between the two countries in 2001. Canada leads in shipping newsprint to this country while the United States predominates in wood pulp exports to Canada (MFI 1998). The industry has also increased exports beyond its traditional trade with Canada. Exports of pulp and paper products have been steadily increasing to China, Japan, Europe, South America and Mexico. Exports of pulp to China, Japan and Korea were valued at more than $700 million in 2004 (DOC 2004). From 1993 to 2003, exports as a proportion of total shipments of paper and allied products increased from 7.4% to 9% (from $9.6 billion to $14.0 billion), and represent 2.1% of total U.S. merchandise exports (AF&PA 2004a). Growth in the near future will depend on increased exports to key foreign markets. In addition, a more open and fair marketplace is expected as trade barriers are removed in the next century (MGH 1999). However, U.S. producers face competition from less-developed countries with lower costs for labor, energy, and environmental protection, as well as fast-growing tree species. The United States exported about 31.8 million tons of pulp, paperboard, recovered wastepaper, and converted products in 2003, and imported 27.2 million tons of products (AF&PA 2004a; Paperloop 2003). 1.3 Research and Development The U.S. paper and allied products sector is a well-established yet dynamic industry. It has a strong interest in developing new products, technologies, processes, and distribution and handling methods, and in reducing energy use and protecting the environment (MGH 1999). Research and development (R&D) is underway to address these issues, with particular emphasis on technologies for meeting new environmental regulations. The paper and allied products sector has historically directed about 1% of sales annually toward R&D to improve the quality of paper products and to develop new products and applications (MFI 1998, AF&PA 2002a). The paper industry works with the U.S. Department of Energy and the U.S. Department of Agriculture’s Forest Service on cost-shared research, as well as private research institutes and U.S. universities teaching paper science and engineering curriculums1. R&D is also conducted by suppliers of chemicals and equipment to the industry. Figure 1-2 shows the trend in R&D funding for paper-related R&D in the United States between 1966 and 1998 (AF&PA 2002a). More recent trends show that R&D expenditures were curtailed between 2000 and 2004 with the closure of several R&D centers at major paper producers (Thorp 2005).
1Auburn University, Georgia Institute of Technology, Institute of Paper Science & Technology, Miami University, North Carolina State University, State University of New York, University of Maine, University of Minnesota, University of Washington, University of Wisconsin – Stevens Point, Western Michigan University.
0.0%0.2%0.4%0.6%0.8%1.0%1.2%
1970
19741978
19821986
19901994
1998
Figure 1-2. Paper and Allied Products Ratio of R&D Expenditures to Net Revenues

Energy and Environmental Profile of the U.S. Pulp and Paper Industry 5
Consumer Demand for Products and U.S. Environmental Regulations Drive R&D The need for new consumer products is one of the driving forces for research and development activities in the paper and allied products industries. As stated earlier, the United States has the highest per-capita consumption of paper worldwide, about 700 pounds in 2001 (Paperloop 2003). Furthermore, domestic consumption has increased about 1.7% annually since 1960, due in part to the increased use of computer printers and office copying machines.
Another driver for R&D is the need to cost-effectively meet environmental regulations. R&D funds for technology to increase production and sales must compete with the need to respond to environmental standards. For example, a significant portion of R&D is directed toward meeting regulations for minimizing water discharges and air emissions of certain toxic and hazardous pollutants from pulp and paper operations. In 2000, 23% of the industry’s capital expenditures were used for environmental protection (AF&PA 2004a). 1.4 Energy Requirements Paper Manufacture is Energy-Intensive Paper manufacturing is a highly energy-intensive process. In 2002, the paper manufacturing industry consumed over 2.4 quads (quadrillion or 1015 Btu) of energy according to the Manufacturing Energy Consumption Survey (MECS), and represented over 15% of U.S. manufacturing energy use (DOE 2005). On average, fuels comprise 93% of the industry’s primary energy use; about 7% is electricity purchased from offsite utilities. While electricity purchases comprise a much lower share of energy inputs, they account for a large share of energy costs. In 2001, electricity accounted for about 40% of the industry’s energy expenses (ASM 2001). Large electricity losses are incurred at offsite utilities during generation and transmission of electricity; if these losses are included, the total energy associated with paper manufacturing reaches 2.8 quads (based on an electricity loss conversion factor of 10,500 Btu/kWh). The industry creates a diversity of products with many different production processes, so energy use patterns vary across sectors and product lines. Figure 1-3 illustrates 2002 use of fuels and purchased electricity among the major sectors of the industry. Within the industry, paper mills accounted for the largest component of energy consumption (1,004 trillion Btu), followed by paperboard mills (904 trillion Btu), pulp mills (224 trillion Btu), and newsprint mills (94 trillion Btu) (DOE 2005). It should be noted that the data reported in Figure 1-3 may be somewhat misleading due to the way industry sectors are categorized by NAICS. Under the NAICS definition Paper and Paperboard Mills include operations where pulping is also done at the same facility (integrated pulp/paper mills). Subsequently, in those cases, energy reported includes energy used for pulping as well as papermaking. Conversely, the NAICS Pulp Mills category includes only mills that just have pulping operations. The result is that energy used for pulping is spread across two different categories.
Figure 1-3. Energy Use by Sector
Trillion Btu
0
200
400
600
800
1000
1200
Pulp Mills Paper Mills* NewsprintMills
PaperboardMills*
Purchased ElectricityFuels
*Includes integrated mills (pulp/paper, pulp/paperboard)
Trillion Btu
0
200
400
600
800
1000
1200
Pulp Mills Paper Mills* NewsprintMills
PaperboardMills*
Purchased ElectricityFuels
*Includes integrated mills (pulp/paper, pulp/paperboard)

Energy and Environmental Profile of the U.S. Pulp and Paper Industry 6
Within the same industry sector processes can also vary depending upon the technology used. For example, pulp can be made by chemical pulping, mechanical pulping, or a combination of the two pulping processes. Energy demand among these pulping processes can be quite different. Gross energy consumption by process is provided in Chapters 2-7. Nearly 55% of energy demand is met by the use of biomass-based waste and byproduct fuels (e.g., wood, spent pulping liquors, chips, sawdust, bark). Despite its large use of biomass-based fuels, the paper manufacturing industry is the fourth largest consumer of fossil energy, after chemicals, petroleum refining and steel. Figure 1-4 shows energy use by fuel type for the paper manufacturing industry, based on statistics from the American Forest and Paper Association (AF&PA 2002a). Between 1985 and 1998, energy intensity (energy per value of shipments) remained steady in the industry despite cyclical changes (DOE 2003). Figure 1-5 shows how energy costs have impacted paper manufacturing over the last decade (ASM 1992-2001; AF&PA 2002a). Table 1-4 lists statistics on fuel and energy use by the paper manufacturing sector in 1972 and 2000, based on data compiled by the industry trade organization (AF&PA 2002a). The energy mix has changed somewhat since 1972, particularly in the use of petroleum products, a trend precipitated by the oil crises of 1973. The use of byproduct fuels has also continued to increase. In 2000, the energy mix was dominated by the use of self-generated and renewable energy (56%), natural gas (18%), and coal (12%). Self-Generated Fuels Meet More Than 50% of Energy Needs
To supplement the use of fossil fuels, the industry self-generates power and heat using renewable fuels that are byproducts of wood processing. In 1972, the paper and allied products sector was self-generating 40.3% of total energy needs with renewable byproducts such as hogged fuel, bark, and spent pulping liquor, and in some locations, hydroelectric power. By 2001, self-generated energy had increased to 56.1% of energy requirements (AF&PA 2002a). While the industry’s overall energy use increased by 4% between 1972 and 2000, its self-generated capacity increased by almost 40%; production grew by nearly 70% during the same period. With new equipment coming online that is more electricity intensive than steam intensive, mills are producing condensing power in addition to extracted power (commonly called cogeneration or combined heat and power (CHP)) to meet additional needs.
The paper manufacturing sector currently generates more electricity than any other industry. In 2002, the pulp and paper industry generated 51,208 million kilowatt hours, which represents 38% of total U.S. industry onsite generation (DOE 2005).
Figure 1-5. Energy Intensity Trends for Paper Manufacturing
0
10
20
30
40
50
60
70
80
90
1992 1993 1994 1995 1996 1997 1998 1999 2000 2001P
($/to
n)
Energy Cost/Ton of Paper and Paperboard
P – preliminary data.
0
10
20
30
40
50
60
70
80
90
1992 1993 1994 1995 1996 1997 1998 1999 2000 2001P
($/to
n)
Energy Cost/Ton of Paper and Paperboard
P – preliminary data.
Figure 1-4. 2000 Energy Use by Fuel for Paper Manufacturing
Purchased Electricity 7%
Fuel Oil 5%
Natural Gas 18%
Self Generated & Renewable Energy (Spent
Pulping Liquors, Bark,
Wood, Hydropower)
56%
Total Energy Use: 2.2 Quads
Coal 12%
Other 2%
Purchased Electricity 7%
Fuel Oil 5%
Natural Gas 18%
Self Generated & Renewable Energy (Spent
Pulping Liquors, Bark,
Wood, Hydropower)
56%
Total Energy Use: 2.2 Quads
Coal 12%
Other 2%

Energy and Environmental Profile of the U.S. Pulp and Paper Industry 7
New technologies promise reductions in expenditures on electricity for the industry. Researchers are currently demonstrating gasification technologies that convert biomass and black liquor wastes into a synthesis (syn) gas. The syngas can be combusted in a gas turbine to generate electricity. In combined-cycle gasification, the gas turbine exhaust is then used to produce steam. The steam is sent through a steam turbine to generate additional electricity before it is used for process heating applications. Gasification combined-cycle systems could be a source of cost-effective electricity for the pulp and paper sector (AF&PA 1998b). A recent study estimates that black liquor gasification has a potential generating capacity of as much as 8 gigawatts (billion watts) of electricity by 2020. Similarly, the combination of black liquor and wood residual gasification has a potential 2020 power generating capacity of 18 gigawatts or more (Larson 2003). Gasification could also be part of a profitable forestry biorefinery configuration (see Chapter 10).
Table 1-4. Use of Fuel and Energy by U.S. Pulp, Paper, and Paperboard (1972 and 2000)
1972 2000 Fuel Source
Billion Btu Consumed % of Total Billion Btu Consumed % of Total
PURCHASED
Electricity 93,698.4 4.4 155,319.8 7.0
Steam 22,613.0 1.1 33,882.9 1.5
Coal 224,737.1 10.7 265,800.0 12.0
Petroleum Products 469,402.4 22.2 102,184.2 4.6
Natural Gas 443,916.3 21.1 395,611.0 17.7
Othera 4,262.9 0.2 24,052.6 1.1
Excess Energy Sold (13,125.0) (44,836.0)
Total Purchased 1,245,505.1 59.7 932,014.5 43.9
SELF-GENERATED
Hogged Fuel 42,103.2 2.0 327,359.0 14.7
Bark 94,428.9 4.5 (Included in hogged fuel)
Spent Liquor (solids) 698,393.4 33.3 894,985.9 40.3
Hydroelectric Power 9,171.3 0.4 4,989.7 0.2
Other 2,977.4 0.1 19,866.5 0.9
Total Self-Generated 847,074.2 40.3 1,247,201.1 56.1
GROSS ENERGY USEb 2,105,704.3 100 2,224,051.6 100
a Includes liquid propane gas and other purchased energy. b Includes electricity and steam exported/sold to offsite users. Source: AF&PA 2002a.

Energy and Environmental Profile of the U.S. Pulp and Paper Industry 8
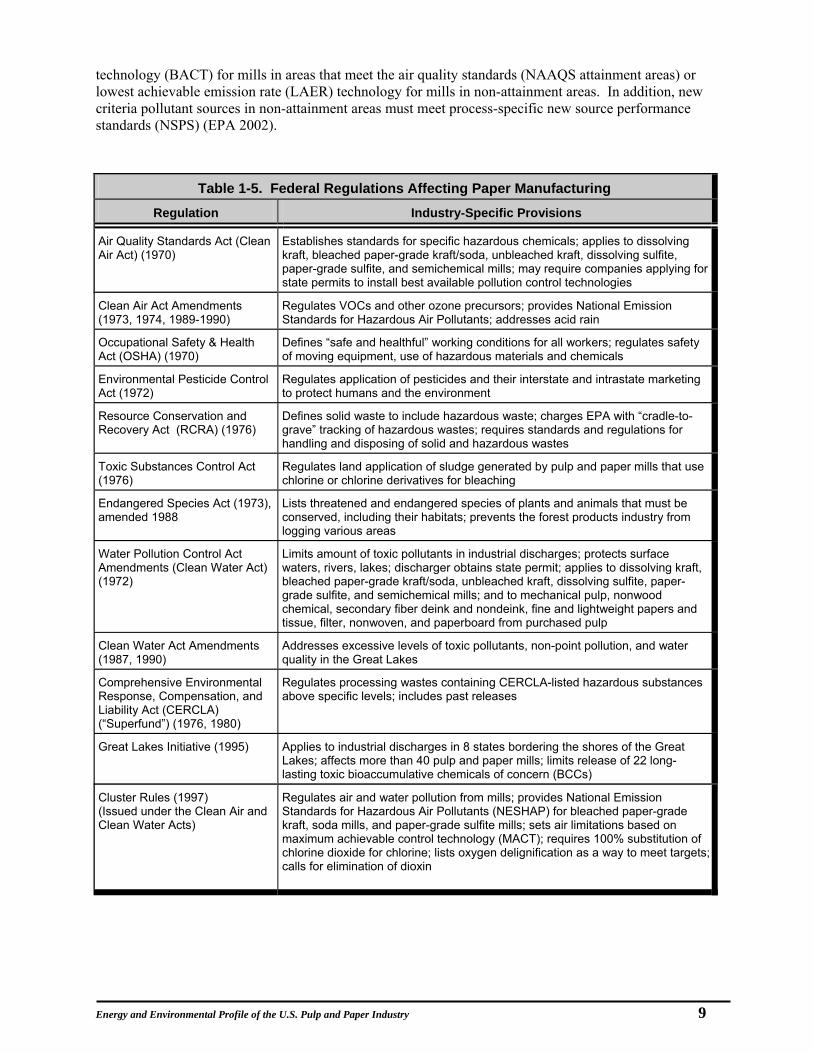
1.5 Environmental Overview Pulp and papermaking requires large inputs of water, energy, chemicals, and wood resources, and produces various wastes and emissions that must be controlled or treated. Impacts on the environment can potentially come from toxic and hazardous chemicals in air and water emissions, thermal loading to natural waterways, odor-causing chemicals, air pollutants from combustion, and solid wastes. The industry is taking steps to minimize environmental impacts by increasing the use of recycled paper, improving energy efficiency, and making capital investments for effective compliance with regulations. Pulp and papermaking processes have traditionally consumed large amounts of water, generating wastewater that can contain chlorinated compounds, volatile organics, sulfur compounds, and other chemicals. Mills are implementing technologies that reduce process water requirements, and must ensure that effluents released to waterways or to publicly-owned treatment works (POTWs) meet the guidelines established by the U.S. Environmental Protection Agency (EPA). The pulp and paper industry also generates more than 12 million tons per year of solid waste, consisting primarily of de-watered sludges. The standard treatment for these wastes in the past was to deposit them in landfills. Today they are more often being handled by incineration, conversion to useful products, and land application. Most solid waste from mills, such as sludge from deinking plants, is non-hazardous and requires no special handling (Paperloop 2003). In 1994, the American Forest and Paper Association (AF&PA) created the Sustainable Forestry Initiative (SFI) Program to improve the industrial practices of its members and report the results. Participation in the SFI Program is mandatory for AF&PA members and in 1998, the SFI Program was opened to organizations and landowners outside of AF&PA. The SFI program integrates the reforestation, nurturing, and harvesting of trees with the conservation of soil, air, water resources, wildlife and fish habitat, and forest aesthetics. Since its inception, the SFI Program has trained over 83,000 loggers and foresters in the principles of sustainable forestry (AF&PA 2002b). Participants in the SFI are reaping the benefits of sustainable forestry practices with more wood growing on their lands now than a century ago. In addition to the increased productivity, companies and individuals involved in the management of forest lands are more aware of best management practices for the protection of water and land resources and animal habitats. Industrial Discharges and Emissions are Federally Regulated The primary Federal regulations affecting the pulp and paper industry are the Clean Air Act, Clean Water Act, Resource Conservation and Recovery Act, Toxic Substances Control Act, and the Cluster Rules. The regulations affecting a specific facility depend on several factors, including location, products manufactured, processes used, and the date a facility or process was built or modified. Individual states may also impose further restrictions on emissions and effluents. Table 1-5 summarizes the Federal regulations that affect paper manufacturing. The Clean Air Act (CAA) and Clean Air Act Amendments (CAAA) limit emissions of criteria pollutants, hazardous air pollutants, and other airborne compounds. Criteria pollutants—ozone, carbon monoxide, particulate matter, nitrogen dioxide, sulfur dioxide, lead—are governed by the National Ambient Air Quality Standards (NAAQS). The NAAQS consist of primary standards to protect public health and secondary standards to protect against decreased visibility, and damage to animals, crops, vegetation, and buildings (Table 1-6) (EPA 2004). Mills that are modifying existing major sources of criteria pollutants or are constructing a new major source are subject to the prevention of significant deterioration (PSD) or new source review (NSR) permit programs, respectively. These programs mandate the implementation of best available control
Energy and Environmental Profile of the U.S. Pulp and Paper Industry 9
technology (BACT) for mills in areas that meet the air quality standards (NAAQS attainment areas) or lowest achievable emission rate (LAER) technology for mills in non-attainment areas. In addition, new criteria pollutant sources in non-attainment areas must meet process-specific new source performance standards (NSPS) (EPA 2002).
Table 1-5. Federal Regulations Affecting Paper Manufacturing
Regulation Industry-Specific Provisions
Air Quality Standards Act (Clean Air Act) (1970)
Establishes standards for specific hazardous chemicals; applies to dissolving kraft, bleached paper-grade kraft/soda, unbleached kraft, dissolving sulfite, paper-grade sulfite, and semichemical mills; may require companies applying for state permits to install best available pollution control technologies
Clean Air Act Amendments (1973, 1974, 1989-1990)
Regulates VOCs and other ozone precursors; provides National Emission Standards for Hazardous Air Pollutants; addresses acid rain
Occupational Safety & Health Act (OSHA) (1970)
Defines “safe and healthful” working conditions for all workers; regulates safety of moving equipment, use of hazardous materials and chemicals
Environmental Pesticide Control Act (1972)
Regulates application of pesticides and their interstate and intrastate marketing to protect humans and the environment
Resource Conservation and Recovery Act (RCRA) (1976)
Defines solid waste to include hazardous waste; charges EPA with “cradle-to-grave” tracking of hazardous wastes; requires standards and regulations for handling and disposing of solid and hazardous wastes
Toxic Substances Control Act (1976)
Regulates land application of sludge generated by pulp and paper mills that use chlorine or chlorine derivatives for bleaching
Endangered Species Act (1973), amended 1988
Lists threatened and endangered species of plants and animals that must be conserved, including their habitats; prevents the forest products industry from logging various areas
Water Pollution Control Act Amendments (Clean Water Act) (1972)
Limits amount of toxic pollutants in industrial discharges; protects surface waters, rivers, lakes; discharger obtains state permit; applies to dissolving kraft, bleached paper-grade kraft/soda, unbleached kraft, dissolving sulfite, paper-grade sulfite, and semichemical mills; and to mechanical pulp, nonwood chemical, secondary fiber deink and nondeink, fine and lightweight papers and tissue, filter, nonwoven, and paperboard from purchased pulp
Clean Water Act Amendments (1987, 1990)
Addresses excessive levels of toxic pollutants, non-point pollution, and water quality in the Great Lakes
Comprehensive Environmental Response, Compensation, and Liability Act (CERCLA) (“Superfund”) (1976, 1980)
Regulates processing wastes containing CERCLA-listed hazardous substances above specific levels; includes past releases
Great Lakes Initiative (1995) Applies to industrial discharges in 8 states bordering the shores of the Great Lakes; affects more than 40 pulp and paper mills; limits release of 22 long-lasting toxic bioaccumulative chemicals of concern (BCCs)
Cluster Rules (1997) (Issued under the Clean Air and Clean Water Acts)
Regulates air and water pollution from mills; provides National Emission Standards for Hazardous Air Pollutants (NESHAP) for bleached paper-grade kraft, soda mills, and paper-grade sulfite mills; sets air limitations based on maximum achievable control technology (MACT); requires 100% substitution of chlorine dioxide for chlorine; lists oxygen delignification as a way to meet targets; calls for elimination of dioxin

Energy and Environmental Profile of the U.S. Pulp and Paper Industry 10
U.S. pulp and paper mills release approximately 245,000 metric tons of toxic air pollutants each year, including hazardous air pollutants (HAPS), volatile organic compounds (VOCs), and total reduced sulfur (TRS) compounds (see Table 1-7) (EPA 1997b, TRI 2000). The National Emission Standards for Hazardous Air Pollutants (NESHAP) regulate substances that are known or suspected to cause cancer or have other serious adverse health or environmental effects. EPA has developed NESHAP for two processes specific to the pulp and paper industry: pulping and chemical recovery. The emission standards, also known as maximum achievable control technologies (MACT) standards, are based on emission levels already being achieved by the better-controlled and lower-emitting sources in the industry. Other NESHAP that apply to the industry include those for asbestos (facility demolition/renovation) and mercury (sludge dryers and incinerators) (EPA 2002). MACT I and III standards control HAP emissions from the pulp and paper production areas of mills using chemical pulping processes (kraft, sulfite, semichemical, and soda) and non-chemical pulping processes (mechanical, secondary fiber, non-wood pulping), respectively. Papermaking systems are included in MACT III. HAP emissions from chemical recovery processes are covered by MACT II (EPA 2002). Pulp and paper industry effluents are primarily regulated by the National Pollution Discharge Elimination System (NPDES) permitting and pretreatment programs that are part of the Clean Water Act (CWA). The programs provide guidelines for controlling conventional pollutants (biological oxygen
Table 1-7. Most-Emitted Hazardous Air Pollutants from Pulp and Paper Mills
Acrolein Methanol Acetaldehyde Methylene Chloride o-Cresol Methyl Ethyl Ketone Carbon Tetrachloride Phenol Chloroform Propionaldehyde Cumene 1,2,4-Trichlorobenzene Formaldehyde o-Xylene Source: FR 1998.
Table 1-6. National Ambient Air Quality Standards Pollutant Primary Standard Averaging Time Secondary Standard
9 ppm (10 mg/m3) 8-houra None Carbon Monoxide 35 ppm (40 mg/m3) 1-houra None
Lead 1.5 µg/m3 Quarterly Average Same as Primary Nitrogen Dioxide 0.053 ppm (100 µg/m3) Annual (Arithmetic Mean) Same as Primary
50 µg/m3 Annualb (Arithmetic Mean) Same as Primary Particulate Matter (PM10)c 150 µg/m3 24-houra --
15.0 µg/m3 Annuale (Arithmetic Mean) Same as Primary Particulate Matter (PM2.5)d 65 µg/m3 24-hourf --
0.08 ppm 8-hourg Same as Primary Ozone 0.12 ppm 1-hourh Same as Primary 0.03 ppm Annual (Arithmetic Mean) --
0.14 ppm 24-houra -- Sulfur Oxides
-- 3-houra 0.5 ppm (1300 µg/m3) a Not to be exceeded more than once per year. b To attain this standard, the expected annual arithmetic mean PM10 concentration at each monitor within an area must not exceed 50 µg/m3. c PM10 refers to particulate matter that is less than or equal to 10 µm in diameter. d PM2.5 refers to particulate matter that is less than or equal to 2.5 µm in diameter. e To attain this standard, the 3-year average of the annual arithmetic mean PM2.5 concentrations from single or multiple community-oriented monitors must not exceed 15.0 µg/m3. f To attain this standard, the 3-year average of the 98th percentile of 24-hour concentrations at each population-oriented monitor within an area must not exceed 65 µg/m3. g To attain this standard, the 3-year average of the fourth-highest daily maximum 8-hour average ozone concentrations measured at each monitor with an area over each year must not exceed 0.08 ppm (parts per million). h (a) The standard is attained when the expected number of days per calendar year with maximum hourly average concentrations above 0.12 ppm is #1, as determined by appendix H. (b) The1-hour NAAQS will no longer apply to an area one year after the effective date of the designation of that area for the 8-hour ozone NAAQS. The effective date for most areas is June 15, 2004. (40 CFR 50.9; see Federal Register of April 30, 2004 (69 FR 23996)). -- no data Source: EPA 2004.

Energy and Environmental Profile of the U.S. Pulp and Paper Industry 11
demand, total suspended solids, chemical oxygen demand, pH), and nonconventional and toxic pollutants (see Table 1-8).
Table 1-8. Summary of Clean Water Act Requirements (as of 1998) Applicable Regulationsa Revised
Subpart of 40 CFR 430
Revised Subcategory Previous Subcategory BAT, PSES,
PSNS BPT, BCT,
NSPS BMPb
A Dissolving Kraft Dissolving Kraft √ √
B Bleached Papergrade Kraft and Soda
Market Bleached Kraft BCT Bleached Kraft Fine Bleached Kraft Soda
√ √ √
C Unbleached Kraft
Unbleached Kraft Linerboard Bag and Other Products
Unbleached Kraft and Semichemical
√ √
D Dissolving Sulfite
Dissolving Sulfite Nitration Viscose Cellophane Acetate
√ √
E Papergrade Sulfite
Papergrade Sulfite Blow Pit Wash Drum Wash
√ √ √
F Semichemical Semichemical
Ammonia Sodium
√ √
G Mechanical Pulp
Groundwood-Thermo-Mechanical Groundwood-Coarse, Molded, News Groundwood-Fine Papers Groundwood-Chemi-Mechanical
√
H Non-Wood Chemical Pulp
Miscellaneous mills not covered by a specific subpart √
I Secondary Fiber Deink
Deink Secondary Fiber Fine Papers Tissue Papers Newsprint
√
J Secondary Fiber Non-Deink
Tissue from Wastepaper Paperboard from Wastepaper
Corrugating Medium Non-Corrugating Medium
Wastepaper-Molded Products Builders’ Paper and Roofing Felt
K
Fine and Lightweight Papers from Purchased Pulp
Nonintegrated Fine Papers Wood Fiber Furnish Cotton Fiber Furnish
Nonintegrated Light Papers Lightweight Papers Lightweight Electrical Papers
√
L
Tissue, Filter, Non-Woven, Paperboard from Purchased Pulp
Nonintegrated Tissue Papers Filter and Non-Woven Paperboard
√
a Best practicable control technology (BPT) and best conventional control technology (BCT) for conventional pollutants at existing facilities; best available technology economically achievable (BAT) for non-conventional and toxic pollutants at existing facilities; new source performance standards (NSPS) for controlling conventional, nonconventional, and toxic pollutants from new facilities; pretreatment standards for existing sources (PSES) and pretreatment standards for new sources (PSNS) discharging to a POTW; best management practices (BMP). Source: EPA 2002.

Energy and Environmental Profile of the U.S. Pulp and Paper Industry 12
Details on requirements for specific processes, as well as general CWA guidelines addressing wetlands and storm water, are available in the Code of Federal Regulations, Title 40, Part 430. In 1997, EPA issued a new, integrated set of air and water regulations—the Cluster Rules—for individual mills in particular segments of the pulp and paper industry such as the bleached papergrade kraft and soda and papergrade sulfite subcategories (EPA 1997a). These joint air and water standards are intended to reduce the burden on industry by allowing it to focus on one set of regulations, and to select the best combination of technologies for preventing/controlling environmental pollutants. The Cluster Rules regulate air pollutants in 115 pulp, paper, and paperboard mills, and water discharges of toxins from 96 mills (EPA 1997a). Under these rules the industry is required to:
• capture and treat toxic air emissions from the cooking, washing, and bleaching stages of pulping; • limit toxic pollutants in the discharge from the bleaching process and the final plant discharge by
substituting chlorine dioxide for chlorine in bleaching; • follow Best Management Practices by preventing spills of black liquor into wastewater sewers; and • measure 12-chlorinated phenolics and adsorbable organic halides (AOXs) in air emissions and
water discharges.
The technology standards outlined in the Cluster Rules regulation are expected to reduce toxic air emissions to almost 60% of current levels (see Table 1-9). They should also essentially eliminate all dioxin discharges from mills into surface waters (EPA 1997a). As part of the Cluster Rules, mills in the bleached papergrade kraft and soda subcategory have the choice of participating in the Voluntary Advanced Technology Incentives Program. This program sets more rigorous wastewater regulations, but allows mills more time to achieve the standards (EPA 1997c).
Solid wastes are regulated under the Resource Conservation and Recovery Act (RCRA) and the Toxic Substances Control Act (TSCA). Prior to the use of elemental chlorine free bleaching and totally chlorine-free bleaching techniques, dewatered sludge could potentially contain constituents such as chlorinated organic compounds (byproducts of elemental chlorine bleaching process) in trace amounts and would need to be handled and disposed of following the TSCA and RCRA. The adoption of elemental chlorine-free (ECF) and totally chlorine-free (TCF) bleaching methods has significantly reduced this environmental hazard. However, the high pH (>12.5) of some solid wastes continues to be an issue and these may meet the RCRA definition of a corrosive hazardous waste (EPA 2002). Industry Makes a Substantial Investment in Environmental Compliance As the industry has come under more stringent environmental regulations, capital expenditures have increased to ensure air and water quality, recover waste products, use recycled feedstocks, and reduce energy use. The average company today spends 10 to 20% of capital expenditures to comply with environmental regulations, with large firms setting aside multi-million dollar budgets for capital and operating expenses for pollution abatement and control.
Table 1-9. Anticipated Reduction in Pollutants from Pulp and Paper Mills under EPA’s Cluster
Rules
Pollutant Anticipated Reduction
All toxic air pollutants 59%
Reduced sulfur 47%
VOCs 49%
Particulate matter 37%
Chloroform discharged to water 99%
Dioxin discharged to water 96%
Furan discharged to water 96%
Dioxan and furan loading to sludges 96%
Source: EPA 1997c.
Energy and Environmental Profile of the U.S. Pulp and Paper Industry 13
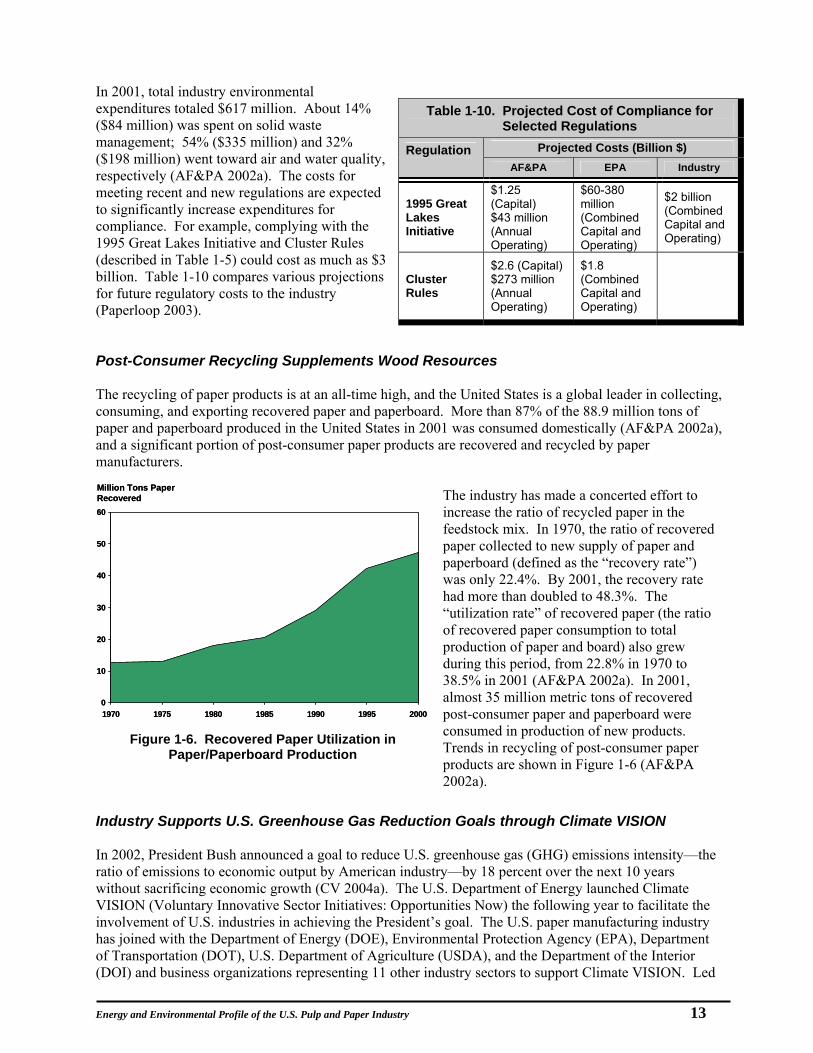
In 2001, total industry environmental expenditures totaled $617 million. About 14% ($84 million) was spent on solid waste management; 54% ($335 million) and 32% ($198 million) went toward air and water quality, respectively (AF&PA 2002a). The costs for meeting recent and new regulations are expected to significantly increase expenditures for compliance. For example, complying with the 1995 Great Lakes Initiative and Cluster Rules (described in Table 1-5) could cost as much as $3 billion. Table 1-10 compares various projections for future regulatory costs to the industry (Paperloop 2003). Post-Consumer Recycling Supplements Wood Resources The recycling of paper products is at an all-time high, and the United States is a global leader in collecting, consuming, and exporting recovered paper and paperboard. More than 87% of the 88.9 million tons of paper and paperboard produced in the United States in 2001 was consumed domestically (AF&PA 2002a), and a significant portion of post-consumer paper products are recovered and recycled by paper manufacturers.
The industry has made a concerted effort to increase the ratio of recycled paper in the feedstock mix. In 1970, the ratio of recovered paper collected to new supply of paper and paperboard (defined as the “recovery rate”) was only 22.4%. By 2001, the recovery rate had more than doubled to 48.3%. The “utilization rate” of recovered paper (the ratio of recovered paper consumption to total production of paper and board) also grew during this period, from 22.8% in 1970 to 38.5% in 2001 (AF&PA 2002a). In 2001, almost 35 million metric tons of recovered post-consumer paper and paperboard were consumed in production of new products. Trends in recycling of post-consumer paper products are shown in Figure 1-6 (AF&PA 2002a).
Industry Supports U.S. Greenhouse Gas Reduction Goals through Climate VISION In 2002, President Bush announced a goal to reduce U.S. greenhouse gas (GHG) emissions intensity—the ratio of emissions to economic output by American industry—by 18 percent over the next 10 years without sacrificing economic growth (CV 2004a). The U.S. Department of Energy launched Climate VISION (Voluntary Innovative Sector Initiatives: Opportunities Now) the following year to facilitate the involvement of U.S. industries in achieving the President’s goal. The U.S. paper manufacturing industry has joined with the Department of Energy (DOE), Environmental Protection Agency (EPA), Department of Transportation (DOT), U.S. Department of Agriculture (USDA), and the Department of the Interior (DOI) and business organizations representing 11 other industry sectors to support Climate VISION. Led
Table 1-10. Projected Cost of Compliance for Selected Regulations
Projected Costs (Billion $) Regulation AF&PA EPA Industry
1995 Great Lakes Initiative
$1.25 (Capital) $43 million (Annual Operating)
$60-380 million (Combined Capital and Operating)
$2 billion (Combined Capital and Operating)
Cluster Rules
$2.6 (Capital) $273 million (Annual Operating)
$1.8 (Combined Capital and Operating)
0
10
20
30
40
50
60
1970 1975 1980 1985 1990 1995 2000
Million Tons Paper Recovered
0
10
20
30
40
50
60
1970 1975 1980 1985 1990 1995 2000
Million Tons Paper Recovered
Figure 1-6. Recovered Paper Utilization in Paper/Paperboard Production

Energy and Environmental Profile of the U.S. Pulp and Paper Industry 14
by the American Forest Products and Paper Association (AF&PA), forest products and other industries are working to accelerate the development of improved practices, processes, and technologies that are cost-effective, cleaner, more efficient, and more capable of reducing, avoiding, or capturing GHGs. Over the years, the forest products industry has made great strides in streamlining industry energy consumption, reducing reliance on fossil fuels, and reducing greenhouse gas emissions. Since 1972, the industry has, on a per ton of product basis, reduced average energy use by 17% and reduced fossil fuel and purchased energy consumption by 38% (CV 2003). Energy derived from wood waste and other renewable sources now accounts for over half of the energy consumed by the forest products industry. Members of AF&PA are continuing their efforts and are participating in several activities that will contribute to meeting the President’s greenhouse gas reduction goal. Through these activities, AF&PA members anticipate that by 2012 the forest products industry will reduce its GHG emissions intensity by 12%, relative to 2000 levels (CV 2004b). An estimate of carbon emissions is shown in Table 1-11, by fuel type. Note that while emissions from combustion of wood and byproduct fuels are shown, they are not included in total emissions because the uptake from new growth exceeds the emissions from combusting a like amount of cut growth (EPA 2004a; USDA 2000).
Current AF&PA Greenhouse Gas-Related Activities
• Development of Emissions Calculations
Methodologies/Tools: AF&PA collaborated with other organizations to develop a methodology for pulp and paper mills (nearly complete) and wood products facilities (undergoing final review). These tools will ensure a uniform approach to inventorying emissions.
• Implementation of Near-Term Opportunities: Several existing industry initiatives could help reduce greenhouse gas emissions in the near future: 1) AF&PA’s efforts to increase paper recovery and recycling; 2) collaborative work between industry, U.S. Forest Service, universities, and international forest products organizations on carbon sequestration in forests and forest products; and 3) new technologies for enhanced energy efficiency and lower emissions.
• Promotion of the GHG Benefits of Wood and Paper Products: AF&PA and other industry organizations are working to increase public awareness of the environmental benefits of forest products. Wood and paper products help to sequester atmospheric CO2. Paper manufacturers also generate electricity using renewable biomass sources and have the potential to increase electricity exports to the grid.
• Accelerated Investment in Research, Development, and Commercialization of Advanced Technologies: AF&PA members have been participating in cost-shared R&D with DOE through the Agenda 2020 program to develop technologies such as black liquor and biomass gasification. Commercialization of these technologies could move the U.S. forest products industry toward energy self-sufficiency while generating excess power for the grid, all based on clean, renewable resources (CV 2004b).
Table 1-11. Carbon Emissions from Combustion of Fuels in Pulp and Paper
Fuel Type Energy (1012 Btu/yr) Kg CO2/106 Btu MMTCE/yr*
Coal and Coke 266 95.3 6.9 LPG/NGL 24 63.2 0.41 Natural Gas 396 53.0 5.7 Petroleum Products 102 81.7 2.3 Purchased Electricity 155 185.4 7.9 TOTAL Fossil Fuels 943 24.01 Wood and Waste Fuels 1247 89.5 30.5
*million metric tons of carbon equivalent Sources: Energy - AF&PA 2002a; Carbon - EPA 2004a; EPA 2004b; EPA 2005.

Energy and Environmental Profile of the U.S. Pulp and Paper Industry 15
Table 2-1. Major Paper Manufacturing Processes Operation Major Processes
Wood Preparation
Debarking Chipping & Conveying
Pulping Chemical Pulping Kraft Process Sulfite Process Semichemical Pulping Mechanical Pulping Stone Ground Wood (SGW) Refiner Mechanical Pulping (RMP) Thermo-Mechanical Pulping (TMP) Chemi-Thermo-Mechanical Pulping (CTMP) Recycled Paper Pulping
Chemical Recovery
Evaporation Recovery Boiler Recausticizing Calcining
Bleaching Mechanical or Chemical Pulp Bleaching
Papermaking Paper Refining & Screening Newspaper Forming, Pressing, Finishing Linerboard Forming, Pressing, Finishing Tissue Forming, Pressing, Finishing Drying
2 Pulp and Paper Mills 2.1 Overview of the Pulp and Paper Mill Pulp and Paper Mills are Complex and Capital-Intensive The pulp and paper industry is continuously evolving to meet the demand for products that are manufactured cleanly, efficiently, and cost-effectively from wood. The industry is composed of paper and/or paperboard mills, pulp mills, and integrated pulp and paper mills. Integrated mills are generally larger and more cost-effective than nonintegrated mills, but the smaller size of the nonintegrated mills allows them to be located closer to the consumer. The percentage of integrated mills has fallen slightly since the 1980s. As more pulp is imported from offshore, paper production may become more distributed and this downward trend could continue. Pulp and paper mills are highly complex and integrate many different process areas including wood preparation, pulping, chemical recovery, bleaching, and papermaking to convert wood to the final product (see Table 2-1). Processing options and the type of wood processed are often determined by the final product. A schematic of the overall papermaking process is shown in Figure 2-1. Chemical and Mechanical Processes Are Used to Refine Wood Pulp and paper mills operate around the clock to produce thousands of tons of paper products each day in a highly mechanized setting. Five process stages—wood preparation, pulping, chemical recovery, bleaching, and papermaking—comprise the overall process of converting wood resources into paper products. Wood preparation involves mechanically removing the bark from logs and breaking down the debarked logs into wood chips. The chip size depends on the wood species and the pulping process to be used in the next stage. A uniform chip size is necessary to maximize the quality and efficiency of the pulping process. Pulping is the method used to convert fibrous material such as wood into a slurry of fibers. Processes can be classified as chemical, mechanical, or semichemical and are selected based on the desired properties of the final paper product. Chemical processes remove the most lignin, a component of wood that holds the fibers together and adds strength and stiffness to trees, but results in weaker paper that yellows with age. Semichemical processes remove some lignin while mechanical processes do not remove any lignin. Chemical recovery enables the recovery and reuse of chemicals used in chemical and semichemical pulping. During the recovery process, steam and electricity are generated from

Energy and Environmental Profile of the U.S. Pulp and Paper Industry 16
the organic material remaining in the slurry after the pulp has been separated out. The steam and electricity help offset the large energy requirements of pulp and papermaking. Bleaching is a chemical process used to whiten or brighten pulp before it is used in papermaking. The pulping process determines the bleaching method, as different pulping processes remove variable amounts of lignin. Mechanical and semichemical pulps contain a significant portion of original lignin and are whitened by decolorizing the lignin (a nonpermanent effect). In chemical pulp, bleaching removes the small amount of remaining lignin for a more permanent change in pulp brightness. Papermaking involves four main stages: preparation of a homogeneous pulp slurry (stock), dewatering, pressing and drying, and finishing. Stock preparation is a critical step in the papermaking process and entails refining the “crude” pulp slurry and tailoring it to the specific properties of the end-product by refining, blending, and using additives. Finishing or conversion operations take place after the paper is manufactured and can include rewinding the paper onto another reel, trimming, coating, printing, saturation, and box-making.
Figure 2-1. Integrated Pulp and Paper Making Process
De-barkerDe-barker
ChipperChipper Lime Kiln/Mud Concentrator
Lime Kiln/Mud Concentrator
Slaker/ Causticizer
Slaker/ Causticizer
ShredderShredder
Waste chips
Round Wood Logs
White Liquor
Flue Gas
Clean/ScreenClean/ScreenFormingForming
CalenderCalender
Reel/FinishingReel/Finishing
Paper Products
Paper Making
Wood Preparation
DigesterDigester
Blow TankBlow Tank
Washing/ Filtering
Washing/ Filtering
ScreeningScreening
BleachingBleaching
Washing/ Screening
Washing/ Screening
RefinerRefiner
Pulping
Multiple-effect
Evaporators
Multiple-effect
Evaporators
Green Liquor
Direct Contact Evaporator/
Recovery Furnace
Direct Contact Evaporator/
Recovery FurnaceFlue Gas
Con-densedVapor
Water/Screen Rejects
Water/ Chemicals
Black Liquor
White Water
White Water
Pulp
PressPressDryingDrying
Waste Water
Exhaust

Energy and Environmental Profile of the U.S. Pulp and Paper Industry 17
2.2 Energy Overview Paper and Paperboard Drying Consume the Most Energy The pulp and paper industry is energy-intensive, requiring large amounts of steam and electricity to process wood into paper and paper products. Table 2-2 provides estimates of average process energy consumed by each step. The specific process energy can vary widely due to the use of different technologies or variations in operating practices and feedstock composition. It should be noted that the energy consumption for the kraft recovery process does not include the steam and electricity generated from the Tomlinson boiler system, which can range between 4 and 20 million Btu per ton of pulp. The papermaking process is the most energy intensive and consumes about 45% of total energy use. Drying is the highest energy consumer, requiring large amounts of heat (steam) to evaporate water from paper or paperboard. Pulping is the next largest consumer of energy. Mechanical pulping consumes electricity primarily to drive grinding equipment while the energy consumed in chemical and semichemical pulping is split between steam (75%) and electricity (25%) (Martin 2000; EI 1988; Nilsson 1995; Jaccard 1996; AF&PA 2004a).
a Does not reflect the energy generated by the recovery boiler, which ranges from 4-20 million Btu/ton pulp. b Energy units are 106 Btu/million tons of paper; annual production is in million tons of paper. Specific energy is only given for selected
processes where data is available. Linerboard energy consumption is assumed to be representative of the paperboard sector. N/A - not available
Table 2-2. Estimated Energy Use by Process
Process Specific Energy
(106 Btu/Ton Pulp)
Average Energy (106 Btu/Ton
Pulp) Annual Production (106 Tons pulp/Yr)
Annual Energy
(1012 Btu/Yr)
Wood Preparation Debarking Chipping & Conveying
N/A 0.03-0.25 0.26-0.62
0.45 0.10 0.35
57.7 “ “
26.0 5.8 20.2
Pulping Chemical Pulping: Kraft Process Sulfite Process Semichemical Pulping Mechanical Pulping Stone Ground Wood Refiner Mechanical Pulping Thermo-Mechanical Pulping Chemi-Thermo-Mechanical Pulping Recycled Paper Pulping
N/A N/A N/A N/A N/A N/A N/A N/A N/A N/A N/A
N/A 2.68 2.60 5.38 3.86 7.68 5.11 6.10 7.09 7.68 1.30
91.3 49.8
- -
3.3 4.5 - - - -
33.7
224.6 133.5
- -
12.7 34.6
- - - -
43.8 Kraft Chemical Recovery Process Evaporation Recovery Boilera Recausticizing Calcining
N/A 2.05-5.35 1.13-4.0
0.45-1.04 0.94-2.51
8.04 3.86 1.13 1.02 2.03
53.3 “ “ “ “
428.5 205.7 60.2 54.4
108.2 Pulp Bleaching N/A 2.3 29.9 68.8 Paper and Paperboard Productionb Paper Refining & Screening Newsprint Forming, Pressing, Finishing Newsprint Drying Tissue Forming, Pressing, Finishing Tissue Paper Drying Uncoated Paper Forming, Pressing, Finishing Uncoated Paper Drying Coated Paper Forming, Pressing, Finishing Coated Paper Drying Linerboard Forming, Pressing, Finishing Linerboard Drying
N/A N/A N/A N/A N/A N/A N/A
N/A N/A
N/A N/A N/A
6.26 0.84 1.44 4.17 1.82 7.95 1.80
5.10 1.80
5.30 0.92 4.05
88.4 88.4 5.7 5.7 7.0 7.0
12.3
12.3 8.7
8.7
20.5 20.5
553.4 74.3 8.2 23.8 12.7 55.7 22.1
62.7 15.7
46.11 18.9 83.0

Energy and Environmental Profile of the U.S. Pulp and Paper Industry 18
Pulp and paper mills also utilize significant amounts of self-generated fuels that are byproducts of wood processing such as bark, spent pulping liquor, or hog fuels (a mixture of sawdust, wood shavings, slabs and trimmings). The heating value of these byproduct fuels varies considerably with the type of wood and moisture content (see Table 2-3). When moisture content is high, these fuels must be dried or in some cases are co-fired with other fuels. Black liquor undergoes an evaporation process to retrieve a solid fuel for combustion (see Chapter 5).
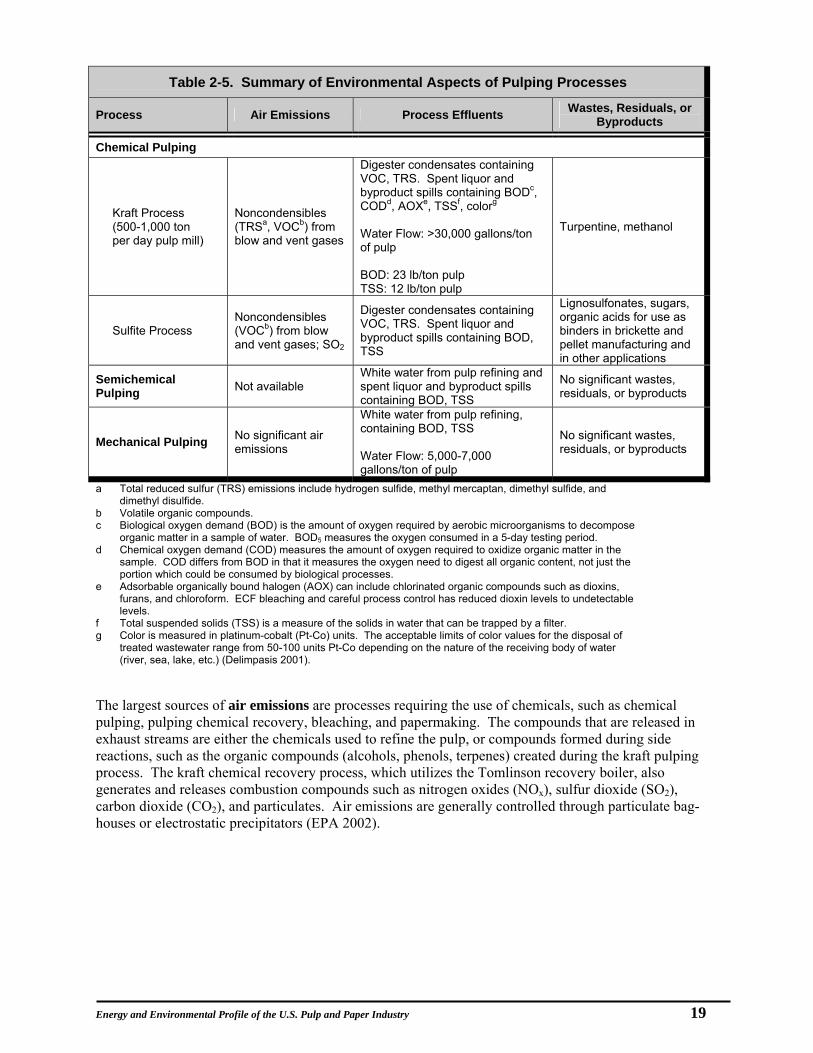
2.3 Environmental Overview Pulp and Paper Making Generates Air and Water Emissions and Residual Wastes The process of breaking down wood into pulp and refining the raw pulp generates various organic and inorganic compounds that are released primarily in process wastewater and air emissions. Residuals and byproducts are also produced and either sold as chemical intermediates, consumed onsite as boiler fuel, or disposed of as solid waste. Tables 2-4 through 2-9 summarize the various air emissions, effluents, residuals, wastes, and byproducts generated by the pulp and paper industry.
a Biological oxygen demand (BOD) is the amount of oxygen required by aerobic microorganisms to decompose organic matter in a sample of water. BOD5 measures the oxygen consumed in a 5-day testing period. b Total suspended solids (TSS) is a measure of the solids in water that can be trapped by a filter. c Color is measured in platinum-cobalt (Pt-Co) units. The acceptable limits of color values for the disposal of treated wastewater range from 50-100 units Pt-Co depending on the nature of the receiving body of water (river, sea, lake, etc.) (Delimpasis 2001).
Table 2-4. Summary of Environmental Aspects of Wood Preparation Processes
Process Air Emissions Process Effluents Wastes, Residuals, or Byproducts
Debarking No significant air emissions
Water used for deicing, washing, debarking, and conveying containing BODa, TSSb, and colorc
Bark and fines that are burned as fuel in boilers
Deicing and/or Washing Prior to Debarking
No significant air emissions
Water Flow: 100-300 gallons/ton of wood debarked BOD5: 1-8 lb/ton TSS: 5-55 lb/ton Color: less than 50 units
No significant wastes, residuals, or byproducts
Wet Drum Debarking
No significant air emissions
BOD: 15-20 lb/ton TSS: 50-100 lb/ton
No significant wastes, residuals, or byproducts
Hydraulic Debarking
No significant air emissions
Water Flow: 5,000-12,000 gallons/cord of wood debarked BOD: 1-10 lb/ton TSS: 6-55 lb/ton
No significant wastes, residuals, or byproducts
Chipping & Conveying
No significant air emissions No significant effluents
Fines that are burned as fuel in boilers. Gross heating value is estimated at 10.5 million Btu/ton (5,250 Btu/lb)
Table 2-3. Heating Value of Selected Wood and Waste Fuels
Fuel Source Higher Heating Value (HHV), Btu/lb(dry)
White Oak* 9,510 Yellow Pine* 10,380 Western Hemlock* 8,000-8,620 Bark* 7,400-10,800 Hog Fuel** 8,620-9,130 Black Liquor 6,000-7,000
(65-70% solids) * oven dried ** air dried
Sources: NRC 2005; CE 1981; USDA 1979; Biermann 1996.
Energy and Environmental Profile of the U.S. Pulp and Paper Industry 19
Table 2-5. Summary of Environmental Aspects of Pulping Processes
Process Air Emissions Process Effluents Wastes, Residuals, or Byproducts
Chemical Pulping
Kraft Process (500-1,000 ton per day pulp mill)
Noncondensibles (TRSa, VOCb) from blow and vent gases
Digester condensates containing VOC, TRS. Spent liquor and byproduct spills containing BODc, CODd, AOXe, TSSf, colorg Water Flow: >30,000 gallons/ton of pulp BOD: 23 lb/ton pulp TSS: 12 lb/ton pulp
Turpentine, methanol
Sulfite Process Noncondensibles (VOCb) from blow and vent gases; SO2
Digester condensates containing VOC, TRS. Spent liquor and byproduct spills containing BOD, TSS
Lignosulfonates, sugars, organic acids for use as binders in brickette and pellet manufacturing and in other applications
Semichemical Pulping Not available
White water from pulp refining and spent liquor and byproduct spills containing BOD, TSS
No significant wastes, residuals, or byproducts
Mechanical Pulping No significant air emissions
White water from pulp refining, containing BOD, TSS Water Flow: 5,000-7,000 gallons/ton of pulp
No significant wastes, residuals, or byproducts
a Total reduced sulfur (TRS) emissions include hydrogen sulfide, methyl mercaptan, dimethyl sulfide, and dimethyl disulfide. b Volatile organic compounds. c Biological oxygen demand (BOD) is the amount of oxygen required by aerobic microorganisms to decompose organic matter in a sample of water. BOD5 measures the oxygen consumed in a 5-day testing period. d Chemical oxygen demand (COD) measures the amount of oxygen required to oxidize organic matter in the sample. COD differs from BOD in that it measures the oxygen need to digest all organic content, not just the portion which could be consumed by biological processes. e Adsorbable organically bound halogen (AOX) can include chlorinated organic compounds such as dioxins, furans, and chloroform. ECF bleaching and careful process control has reduced dioxin levels to undetectable levels. f Total suspended solids (TSS) is a measure of the solids in water that can be trapped by a filter. g Color is measured in platinum-cobalt (Pt-Co) units. The acceptable limits of color values for the disposal of treated wastewater range from 50-100 units Pt-Co depending on the nature of the receiving body of water (river, sea, lake, etc.) (Delimpasis 2001). The largest sources of air emissions are processes requiring the use of chemicals, such as chemical pulping, pulping chemical recovery, bleaching, and papermaking. The compounds that are released in exhaust streams are either the chemicals used to refine the pulp, or compounds formed during side reactions, such as the organic compounds (alcohols, phenols, terpenes) created during the kraft pulping process. The kraft chemical recovery process, which utilizes the Tomlinson recovery boiler, also generates and releases combustion compounds such as nitrogen oxides (NOx), sulfur dioxide (SO2), carbon dioxide (CO2), and particulates. Air emissions are generally controlled through particulate bag-houses or electrostatic precipitators (EPA 2002).

Energy and Environmental Profile of the U.S. Pulp and Paper Industry 20
Table 2-6. Summary of Environmental Aspects of Kraft Chemical Recovery
Process Air Emissions Process Effluents Wastes, Residuals or Byproducts
Evaporation Noncondensibles including TRSa, VOCb, alcohols, terpenes, phenols
Foul condensate containing BODc, suspended solids
Tall oil is recovered when resinous wood is being processed
Recovery Boiler Fine particulates, TRS, SO2, CO, NOx
Potential black liquor storage tank spills None
Recausticizing Particulates (sodium salts), SO2, TRS No significant effluents
Dregs that are composed of unburned carbon and inorganic impurities, such as calcium and iron compounds
Calcining Fine and coarse particulates (sodium and calcium salts), TRS, SO2, CO, NOx
No significant effluents No significant wastes, residuals, or byproducts
a Total reduced sulfur (TRS) emissions include hydrogen sulfide, methyl mercaptan, dimethyl sulfide, and dimethyl disulfide. b Volatile organic compounds. c Biological oxygen demand (BOD) is the amount of oxygen required by aerobic microorganisms to decompose organic matter in a sample of water. BOD5 measures the oxygen consumed in a 5-day testing period.
Table 2-7. Summary of Environmental Aspects of Pulp Bleaching
Process Air Emissions Process Effluents Wastes, Residuals, or Byproducts
Bleaching
Vent gases from bleach towers, washers, and filtrate tanks contain chlorine dioxide and VOCs Chlorine dioxide: 0.05-2.65 kg/air dried metric ton of pulp
Effluents are characterized by BODa, TOCb, CODc, colord, AOXe, and EOXf and levels vary by bleaching process For three softwood kraft pulp bleaching sequences, effluent levels are below: BOD (lb/ton pulp): ECFg: 18-35 TCFh: 26-86 Color: ECF: 57-330 TCF: 59-343 AOX (lb/ton pulp): ECF: 2.0-3.7
No significant wastes, residuals, or byproducts
a Biological oxygen demand (BOD) is the amount of oxygen required by aerobic microorganisms to decompose organic matter in a sample of water. BOD5 measures the oxygen consumed in a 5-day testing period. b Total organic carbon (TOC). c Chemical oxygen demand (COD) measures the amount of oxygen required to oxidize organic matter. d Color is measured in platinum-cobalt (Pt-Co) units. The acceptable limits of color values for the disposal of treated wastewater range from 50-100 units Pt-Co depending on the nature of the receiving body of water (river, sea, lake, etc.) (Delimpasis 2001). e Adsorbable organically bound halogen (AOX) can include chlorinated organic compounds such as dioxins, furans, and chloroform. ECF bleaching and process control have reduced dioxin to undetectable levels. f Extractable organic halogen (EOX). g Elemental chlorine free (ECF) bleaching process. h Totally chlorine-free (TCF) bleaching process.
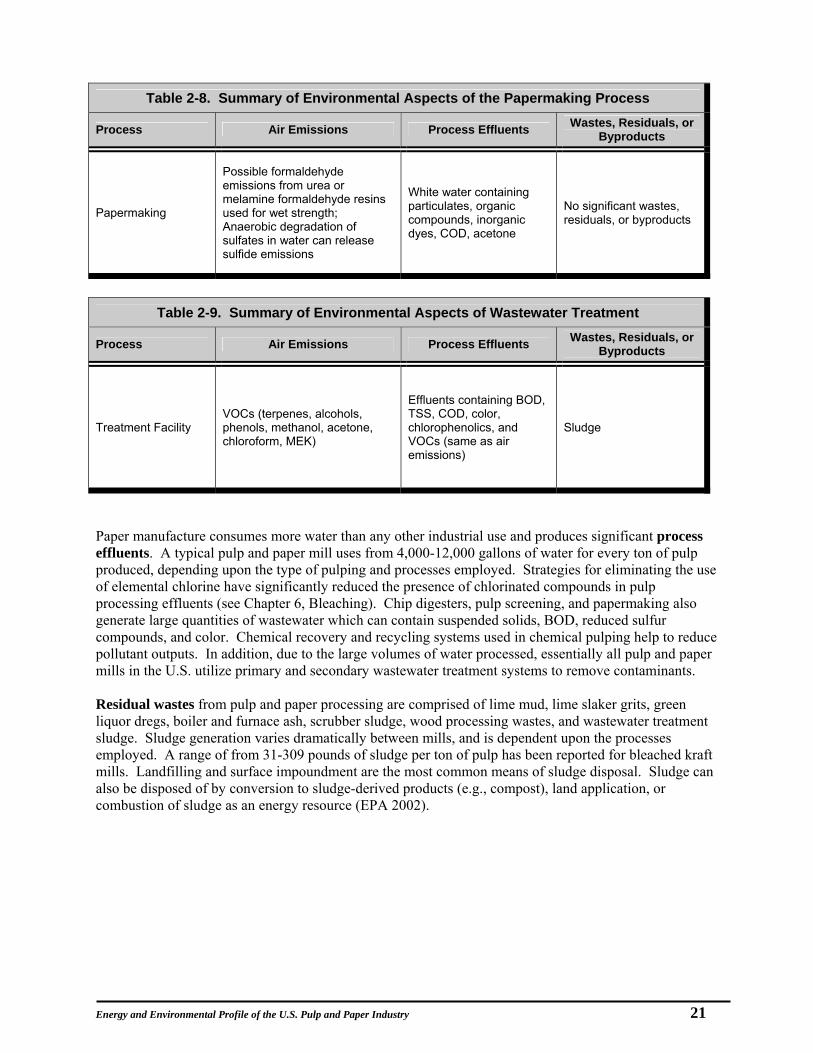
Energy and Environmental Profile of the U.S. Pulp and Paper Industry 21
Table 2-8. Summary of Environmental Aspects of the Papermaking Process
Process Air Emissions Process Effluents Wastes, Residuals, or Byproducts
Papermaking
Possible formaldehyde emissions from urea or melamine formaldehyde resins used for wet strength; Anaerobic degradation of sulfates in water can release sulfide emissions
White water containing particulates, organic compounds, inorganic dyes, COD, acetone
No significant wastes, residuals, or byproducts
Table 2-9. Summary of Environmental Aspects of Wastewater Treatment
Process Air Emissions Process Effluents Wastes, Residuals, or Byproducts
Treatment Facility VOCs (terpenes, alcohols, phenols, methanol, acetone, chloroform, MEK)
Effluents containing BOD, TSS, COD, color, chlorophenolics, and VOCs (same as air emissions)
Sludge
Paper manufacture consumes more water than any other industrial use and produces significant process effluents. A typical pulp and paper mill uses from 4,000-12,000 gallons of water for every ton of pulp produced, depending upon the type of pulping and processes employed. Strategies for eliminating the use of elemental chlorine have significantly reduced the presence of chlorinated compounds in pulp processing effluents (see Chapter 6, Bleaching). Chip digesters, pulp screening, and papermaking also generate large quantities of wastewater which can contain suspended solids, BOD, reduced sulfur compounds, and color. Chemical recovery and recycling systems used in chemical pulping help to reduce pollutant outputs. In addition, due to the large volumes of water processed, essentially all pulp and paper mills in the U.S. utilize primary and secondary wastewater treatment systems to remove contaminants. Residual wastes from pulp and paper processing are comprised of lime mud, lime slaker grits, green liquor dregs, boiler and furnace ash, scrubber sludge, wood processing wastes, and wastewater treatment sludge. Sludge generation varies dramatically between mills, and is dependent upon the processes employed. A range of from 31-309 pounds of sludge per ton of pulp has been reported for bleached kraft mills. Landfilling and surface impoundment are the most common means of sludge disposal. Sludge can also be disposed of by conversion to sludge-derived products (e.g., compost), land application, or combustion of sludge as an energy resource (EPA 2002).

Energy and Environmental Profile of the U.S. Pulp and Paper Industry 22

Energy and Environmental Profile of the U.S. Pulp and Paper Industry 23
Table 3-1. Wood Consumption by Pulping Process and Species
Pulping Process Wood Consumption
(solid ft3 of wood under bark per ton of pulp
production)
Dissolving pulp 230 - 265 Bleached sulfate, pine 142 Bleached sulfate, birch 125 Unbleached sulfate, pine 130 Unbleached sulfate, birch 120 Bleached sulfite, pine 131 Bleached sulfite, birch 139 Unbleached sulfite, pine 118 Unbleached sulfite, birch 133 Unbleached semi-chemical hardwooda 78
Groundwood, spruce 92
Recycled paper pulping 0
a Neutral sulfite semi-chemical pulping. Source: Gullichsen 1999a; Biermann 1996.
3 Wood Preparation 3.1 Process Overview Wood preparation involves the conversion of roundwood logs into a form suitable for pulping and includes processes for debarking, chipping, screening, handling, and storage. Wood from softwood and hardwood trees is the primary source of fiber, with pulp and paper mills also purchasing wood chips generated by outside facilities such as saw mills and tree harvesting operations. As shown in Table 3-1, wood consumption per ton of pulp varies depending on the pulping process used and the tree species being pulped. Debarking Removes Bark, Grit and Dirt Wood chips and logs are typically delivered to the pulp mill by truck or rail, where they are dumped into a receiving pit and conveyed to storage. Wood chips are normally free of bark and can be used after screening and washing. For roundwood deliveries, a front-end loader or log stacker equipped with hydraulic grapples is commonly used to unload the logs to the loading deck. From there, the logs are sorted, and, if necessary, sent to the slasher deck to be cut into manageable lengths. Chain conveyors are typically used to transport logs to debarking. Bark is a contaminant in the pulping process because it contains little fiber as well as chemicals and impurities that interfere with pulping, bleaching, and chemical recovery processes. Debarkers are used to mechanically remove bark from the logs by abrasion. Examples of debarkers include drum, ring, rosserhead, and flail debarkers. Drum debarkers are loaded with several logs by crane into a large steel drum which rotates and uses lifters to agitate the logs and cause them to rub and tumble against each other, creating friction that removes the bark. Although still utilized in some mills, wet drum and hydraulic debarkers (which use high-pressure jets of water to blast bark from the logs) are being phased out of operation. Wet debarking systems are most often used with large-diameter logs. A ring or cambial shear debarker uses a ring of knives that peels off the bark as logs are fed individually through the ring. The rosserhead debarker uses a rotating, toothed head held against a log as it rotates and passes across the head. A flail debarker uses a rotating cylinder with several hanging chains to delimb and debark. Some mills use a deicing and/or washing stage prior to the debarking process. In this process, logs are slowly conveyed through a deicing chamber, where they are showered with hot water in winter and/or cold water in the summer (Smook 1992). This process softens the bark while removing dirt and grit, lessening equipment abrasion and facilitating bark removal. Removed bark is separated from the logs and processed for use as fuel or sold for other purposes such as mulch for gardens. The debarked logs are washed and passed through stone separators to remove all the bark. The logs also pass through metal detectors before they are fed to a chipper.
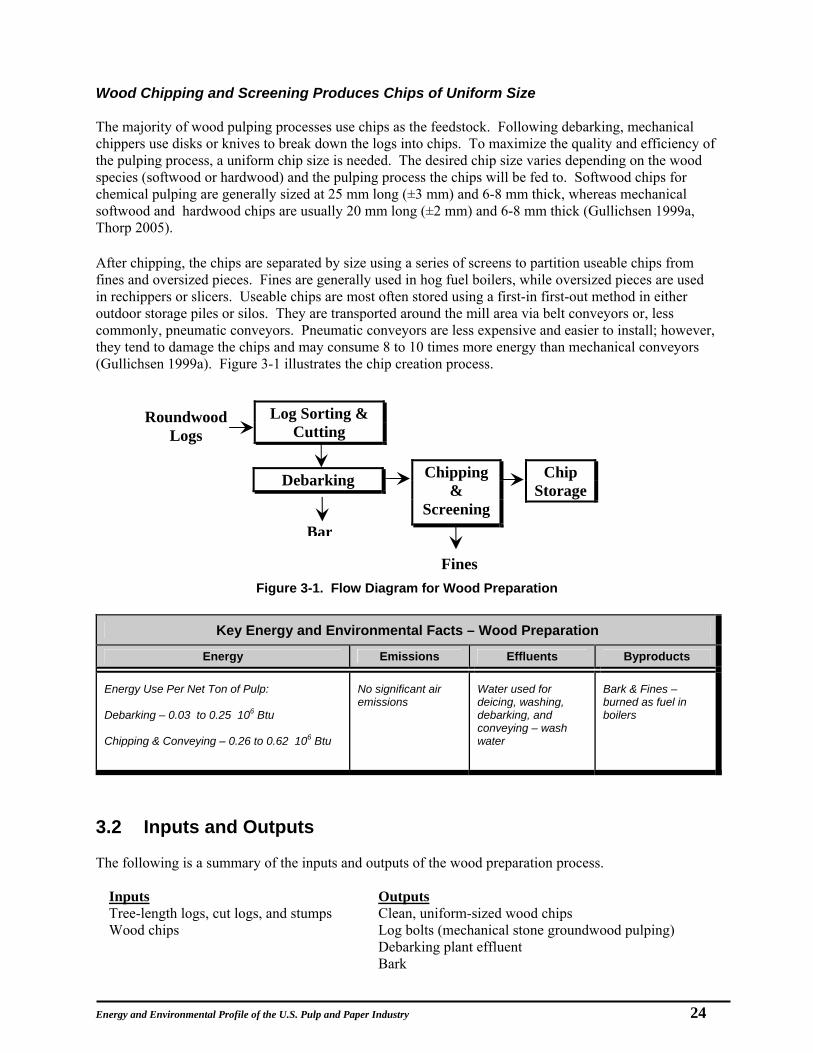
Energy and Environmental Profile of the U.S. Pulp and Paper Industry 24
Wood Chipping and Screening Produces Chips of Uniform Size The majority of wood pulping processes use chips as the feedstock. Following debarking, mechanical chippers use disks or knives to break down the logs into chips. To maximize the quality and efficiency of the pulping process, a uniform chip size is needed. The desired chip size varies depending on the wood species (softwood or hardwood) and the pulping process the chips will be fed to. Softwood chips for chemical pulping are generally sized at 25 mm long (±3 mm) and 6-8 mm thick, whereas mechanical softwood and hardwood chips are usually 20 mm long (±2 mm) and 6-8 mm thick (Gullichsen 1999a, Thorp 2005). After chipping, the chips are separated by size using a series of screens to partition useable chips from fines and oversized pieces. Fines are generally used in hog fuel boilers, while oversized pieces are used in rechippers or slicers. Useable chips are most often stored using a first-in first-out method in either outdoor storage piles or silos. They are transported around the mill area via belt conveyors or, less commonly, pneumatic conveyors. Pneumatic conveyors are less expensive and easier to install; however, they tend to damage the chips and may consume 8 to 10 times more energy than mechanical conveyors (Gullichsen 1999a). Figure 3-1 illustrates the chip creation process.
Figure 3-1. Flow Diagram for Wood Preparation
3.2 Inputs and Outputs The following is a summary of the inputs and outputs of the wood preparation process.
Inputs Tree-length logs, cut logs, and stumps Wood chips
Outputs Clean, uniform-sized wood chips Log bolts (mechanical stone groundwood pulping) Debarking plant effluent Bark
Fines
Bar
Roundwood Logs
Debarking Chip Storage
Chipping &
Screening
Log Sorting & Cutting
Key Energy and Environmental Facts – Wood Preparation
Energy Emissions Effluents Byproducts
Energy Use Per Net Ton of Pulp: Debarking – 0.03 to 0.25 106 Btu Chipping & Conveying – 0.26 to 0.62 106 Btu
No significant air emissions
Water used for deicing, washing, debarking, and conveying – wash water
Bark & Fines – burned as fuel in boilers

Energy and Environmental Profile of the U.S. Pulp and Paper Industry 25
3.3 Energy Requirements Wood preparation and handling is entirely powered by electricity, which is used to drive motors in debarkers, chippers, conveyors, and chip screening devices. These devices are relatively inefficient in the conversion of electricity to usable work. Chipping and conveying are more energy-intensive and use three times the energy required for debarking. Table 3-2 shows average energy consumption for wood preparation, broken down by process. Energy use depends on the design, type, and age of the equipment used for wood preparation as well as the species or age of the roundwood log inputs. Note that the energy consumed in harvesting the wood and delivering it to the site is not considered here. If energy losses associated with electricity generation are considered (10,500 Btu/kWh), energy use for wood preparation totals nearly 80 trillion Btu per year. 3.4 Air Emissions The wood preparation and handling process itself does not create any significant air emissions. Bark removed during wood preparation is sent to hog fuel boilers, which produce air emissions. These boiler systems are discussed in Chapter 8, Supporting Systems. 3.5 Effluents Water used in log/chip washing, debarking, or conveying leads to effluent generation during wood preparation and handling. These effluents contain dissolved and suspended materials and the water quality is measured using biological oxygen demand (BOD), total suspended solids (TSS), and color tests. Chipping operations do not produce any significant effluent flow. In an effort to reduce effluent flow, industry has decreased water use and increased dry stock preparation whenever possible. Dry debarking mechanisms (e.g., dry drum barkers and mechanical ring barkers) represent some of the most effective pollution prevention technologies used during wood preparation, and have been almost universally adopted in pulp and paper mills built since the mid-1970s (McCubbin 1993). Large fluctuations in effluent pollutants can occur depending on the season and weather in which the wood was cut. Water consumption is estimated at between 100 and 300 gallons per ton of wood barked, with BOD5 ranging from 1 to 8 lb per ton, TSS from 5 to 55 lb per ton, and color less than 50 units (Springer 1993). While wet drum and hydraulic debarkers are still in use, many are being phased-out. Wet drum debarkers typically use spent process water, which is often recycled back to the barking unit, thus reducing effluent loading to the treatment system. Wet drum debarking systems typically produce effluents with 15 to 20 lb BOD per ton of wood debarked and from 50 to 100 lb TSS per ton (Springer 1993).
Table 3-2. Average Energy Intensities of Wood Preparation Processes (106 Btu/ton of pulp)
Energy Type Fuel Electricitya Total Energy Useb
(1012 Btu/Yr)
Debarking -- 0.10 5.8
Chipping and Conveying
-- 0.35 20.2
TOTAL -- 0.45 26.0
a Conversion factor of 3,412 Btu/kWh. b Based on annual production of 57.67 million air dried short tons of pulp. -- no data Source: AF&PA 2004a.

Energy and Environmental Profile of the U.S. Pulp and Paper Industry 26
Hydraulic debarkers create fewer pollutants than wet drum barkers because the water is in contact with the wood for a shorter period of time, with no grinding action on the wood. However, hydraulic barkers usually require fresh process water to avoid damaging the high pressure pumping system. Water use is typically 2,500 to 6,000 gallons per ton of wood barked (5,000 to 12,000 gallons per cord of wood) (Springer 1993; Lam 2000; Paperloop 2005). Hydraulic system effluents carry between 1 to 10 lb BOD and 6 to 55 lb TSS per ton of wood barked, and are discharged to a treatment system (Springer 1993). Table 3-3 shows analyses of the effluents produced by wet drum and hydraulic barkers in different mills.
3.6 Byproducts The wood preparation process produces two key byproducts: bark and fines. In the past, these solid materials represented a major solid waste problem, and were either burned, sent to landfills, or used for garden mulches and seedling blocks. Bark and fines are now burned in specially designed hog fuel boilers or in combination boilers to produce steam. Their gross heating value as a fuel is approximately 10.5 million Btu per ton. Bark boilers have an average steam production efficiency of approximately 65% (ADL 2000).
Table 3-3. Effluent Analysis for Wet Drum and Hydraulic Debarkers
Mill TSSa (mg/L) Nonsettleable Solids (mg/L) BOD5
b (mg/L) Colorc Units
Analysis of Wet Drum Debarking Effluents 1 2,017 69 480 20 2 3,171 57 605 50 3 2,875 80 987 50
Analysis of Hydraulic Debarking Effluents 1 2,362 141 85 <50 2 889 101 101 <50 3 1,391 180 64 <50 4 550 66 99 <50
a Total suspended solids (TSS) is a measure of the solids in water that can be trapped by a filter. b Biological oxygen demand (BOD) is the amount of oxygen required by aerobic microorganisms to decompose organic matter in a sample of water in a 5-day test. c Color is measured in platinum-cobalt (Pt-Co) units. The acceptable limits of color values for the disposal of
treated wastewater range from 50-100 units Pt-Co depending on the nature of the receiving body of water (river, sea, lake) (Delimpasis 2001). Source: Springer 1993 (from TAPPI 1981).

Energy and Environmental Profile of the U.S. Pulp and Paper Industry 27
4 Pulping 4.1 Process Overview Pulping is the process of reducing wood (or other cellulosic fiber source) into a fibrous mass suitable for papermaking. The process involves breaking the chemical bonds of the raw material through mechanical and/or chemical means in order to liberate the discrete fibers used to make paper. Once the fibers are separated, they are screened, washed to varying degrees, thickened, and sent to pulp storage. Wood is the Primary Source of Paper Fiber Three main types of raw materials are used for papermaking: 1) pulpwood (trees); 2) recovered paper or paperboard products; and 3) nonwood plant sources such as cotton, sugarcane bagasse, and bamboo. Synthetic fibers made from thermoplastic materials such as nylon, polystyrene, and polyolefins are also used in small amounts to make paper-like materials called “nonwovens.” Pulpwood provides approximately 72% of the fiber for paper produced in the United States. Nonwood plant fiber sources and synthetic fibers made up less than 1% of the fibrous raw materials consumed for pulp production in the United States in 2001 (AF&PA 2002a). North American wood is composed of five basic compounds, as shown in Table 4-1. Cellulose and hemicellulose are the key ingredients of paper and together make up approximately 60-65% of wood. Lignin, which accounts for most of the remaining wood material, functions as a binding agent to hold the cellulose fibers together and adds strength and stiffness to the tree cell walls. If lignin is not removed during the pulping process, the paper will be weaker and tend to yellow with age. Extractives include a large and diverse group of substances found in wood that impart odor, taste, color and, in some cases, decay resistance. They include terpenes, fatty acids, resin acids, and phenolic compounds. Finally, ash consists of the metallic ions and anions remaining after the controlled combustion of wood (Biermann 1996). During pulping and subsequent bleaching stages, the lignin and extractives are removed while retaining as much as possible of the cellulose and hemicellulose fibers. Many of the extractives are recovered for sale to make products such as turpentine and tall oil. Pulping Processes Are Mechanical, Chemical or Semichemical Commercial pulping operations are broadly grouped into four categories: chemical, semichemical, mechanical, and recycled. Chemical processes rely on chemical action; semichemical processes use varying combinations of chemical and mechanical actions; mechanical pulping relies on physical action to separate fibers, and recycled pulping uses primarily mechanical action with chemicals added for pulping recycled paper with higher wet strength. In 2001, chemical processes accounted for approximately 54% of wood pulp production, with 4% semichemical, 5% mechanical, and 37% recycled pulping (AF&PA 2004a). Table 4-2 summarizes the basic features of these processes.
Table 4-1. Typical Compositions of North American Woods (percent)
Compound Hardwoods Softwoods
Cellulose 40-50 45-50
Hemicelluloses 17-35 25-35
Lignin 18-25 25-35
Extractives 1-5 3-8
Ash 0.4-0.8 0.2-0.5
Source: Biermann 1996.

Energy and Environmental Profile of the U.S. Pulp and Paper Industry 28
Table 4-2. General Classification of Pulping Processes
Category Chemical Semichemical (Hybrid) Mechanical Recycled
Description Pulping with chemicals and heat (little or no mechanical energy)
Pulping with combinations of chemical and mechanical treatments
Pulping by mechanical energy (small amount of chemicals and heat)
Pulping by mechanical energy with chemicals and heat added for recycled paper with higher wet strength
Yield Lower yielda (45-50% for bleachable or bleached pulp, 65-70% for brown papers)
Intermediate yielda (55-85%)
High yielda (85-96%) (lignin not removed)
Yieldb depends on type of recycled paper: • Packaging papers and
board (90-95%) • Graphic papers (65-85%) • Hygienic papers
(60-75%) • Specialty papers
(70-95%) • Market DIP (wood-
free) (60-70%) • Market DIP (wood-
containing) (80-85%) Wood Used All woods (kraft);
some hardwoods and non-resinous softwoods (sulfite)
Mostly hardwoods Non-resinous softwoods, some hardwoods like poplar
None (uses recycled paper)
Pulp Properties
• Long, strong fibers • High strength and
stability • Poor print quality
• “intermediate” pulp properties
• Good stiffness and moldability
• Short, impure fibers
• Low strength and brightness
• Unstable • High opacity,
softness, and bulk • Good print quality
• Mixture of fiber grades• Properties depend on
the characteristics of recycled fiber stock
Major Processes
• Kraft (sulfate) • Sulfite
• Neutral sulfite semichemical (NSSC)
• High-yield kraft • High-yield sulfite
• Stone groundwood (SGW)
• Refiner mechanical pulp (RMP)
• Thermomechanical pulp (TMP)
• Chemi-thermomechanical pulp (CTMP)
N/A
Products • Kraft: bag, wrapping, linerboard, newsprint, bleached pulps for white writing and printing papers
• Sulfite: fine paper, tissue, glassine, newsprint, dissolving pulp
• Corrugated board • Food packaging
board • Newsprint,
magazine
• Newsprint, magazines, catalogs
• Books • Container board
• Newsprint • Printing, writing paper • Tissue • Packaging • Container board • Paperboard
a Yield = weight of pulp produced (oven dry) divided by weight of original wood (oven dry) b Recycling yield = weight of pulp produced (after pulping, screening, cleaning, deinking, and bleaching steps) divided by weight of recycled paper DIP – deinked paper N/A – not available Sources: Smook 1992; Biermann 1996; EI 1988; Gottsching 2000; AF&PA 2005a.
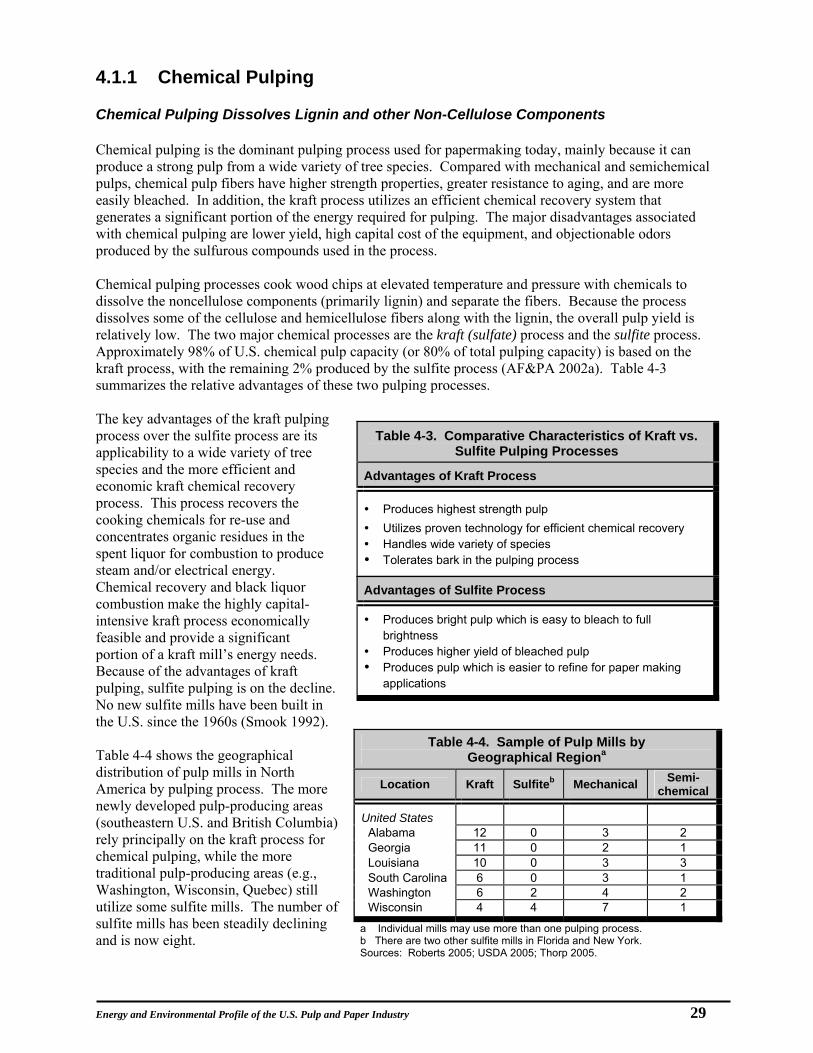
Energy and Environmental Profile of the U.S. Pulp and Paper Industry 29
Table 4-3. Comparative Characteristics of Kraft vs. Sulfite Pulping Processes
Advantages of Kraft Process
Produces highest strength pulp Utilizes proven technology for efficient chemical recovery Handles wide variety of species Tolerates bark in the pulping process
Advantages of Sulfite Process
Produces bright pulp which is easy to bleach to full brightness
Produces higher yield of bleached pulp Produces pulp which is easier to refine for paper making
applications
4.1.1 Chemical Pulping Chemical Pulping Dissolves Lignin and other Non-Cellulose Components Chemical pulping is the dominant pulping process used for papermaking today, mainly because it can produce a strong pulp from a wide variety of tree species. Compared with mechanical and semichemical pulps, chemical pulp fibers have higher strength properties, greater resistance to aging, and are more easily bleached. In addition, the kraft process utilizes an efficient chemical recovery system that generates a significant portion of the energy required for pulping. The major disadvantages associated with chemical pulping are lower yield, high capital cost of the equipment, and objectionable odors produced by the sulfurous compounds used in the process. Chemical pulping processes cook wood chips at elevated temperature and pressure with chemicals to dissolve the noncellulose components (primarily lignin) and separate the fibers. Because the process dissolves some of the cellulose and hemicellulose fibers along with the lignin, the overall pulp yield is relatively low. The two major chemical processes are the kraft (sulfate) process and the sulfite process. Approximately 98% of U.S. chemical pulp capacity (or 80% of total pulping capacity) is based on the kraft process, with the remaining 2% produced by the sulfite process (AF&PA 2002a). Table 4-3 summarizes the relative advantages of these two pulping processes. The key advantages of the kraft pulping process over the sulfite process are its applicability to a wide variety of tree species and the more efficient and economic kraft chemical recovery process. This process recovers the cooking chemicals for re-use and concentrates organic residues in the spent liquor for combustion to produce steam and/or electrical energy. Chemical recovery and black liquor combustion make the highly capital-intensive kraft process economically feasible and provide a significant portion of a kraft mill’s energy needs. Because of the advantages of kraft pulping, sulfite pulping is on the decline. No new sulfite mills have been built in the U.S. since the 1960s (Smook 1992). Table 4-4 shows the geographical distribution of pulp mills in North America by pulping process. The more newly developed pulp-producing areas (southeastern U.S. and British Columbia) rely principally on the kraft process for chemical pulping, while the more traditional pulp-producing areas (e.g., Washington, Wisconsin, Quebec) still utilize some sulfite mills. The number of sulfite mills has been steadily declining and is now eight.
Table 4-4. Sample of Pulp Mills by Geographical Regiona
Location Kraft Sulfiteb Mechanical Semi-chemical
United States
Alabama 12 0 3 2 Georgia 11 0 2 1 Louisiana 10 0 3 3 South Carolina 6 0 3 1 Washington 6 2 4 2 Wisconsin 4 4 7 1
a Individual mills may use more than one pulping process. b There are two other sulfite mills in Florida and New York. Sources: Roberts 2005; USDA 2005; Thorp 2005.
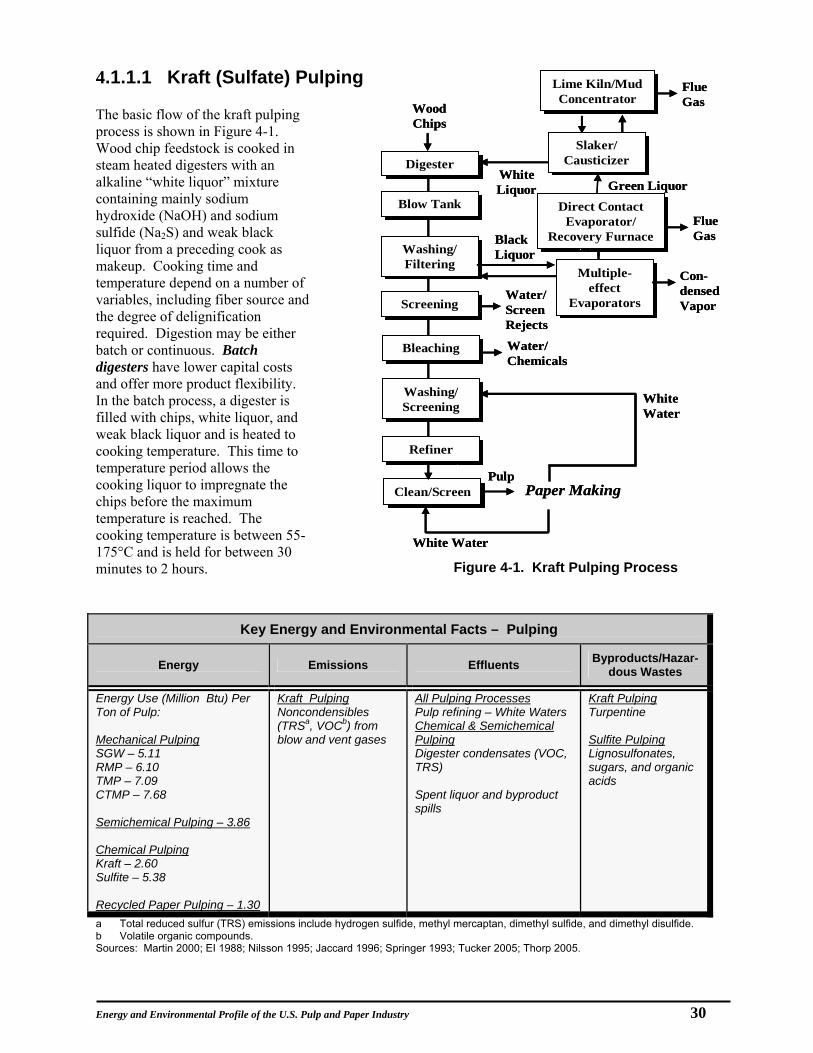
Energy and Environmental Profile of the U.S. Pulp and Paper Industry 30
4.1.1.1 Kraft (Sulfate) Pulping The basic flow of the kraft pulping process is shown in Figure 4-1. Wood chip feedstock is cooked in steam heated digesters with an alkaline “white liquor” mixture containing mainly sodium hydroxide (NaOH) and sodium sulfide (Na2S) and weak black liquor from a preceding cook as makeup. Cooking time and temperature depend on a number of variables, including fiber source and the degree of delignification required. Digestion may be either batch or continuous. Batch digesters have lower capital costs and offer more product flexibility. In the batch process, a digester is filled with chips, white liquor, and weak black liquor and is heated to cooking temperature. This time to temperature period allows the cooking liquor to impregnate the chips before the maximum temperature is reached. The cooking temperature is between 55-175°C and is held for between 30 minutes to 2 hours.
a Total reduced sulfur (TRS) emissions include hydrogen sulfide, methyl mercaptan, dimethyl sulfide, and dimethyl disulfide. b Volatile organic compounds. Sources: Martin 2000; EI 1988; Nilsson 1995; Jaccard 1996; Springer 1993; Tucker 2005; Thorp 2005.
Key Energy and Environmental Facts – Pulping
Energy Emissions Effluents Byproducts/Hazar-dous Wastes
Energy Use (Million Btu) Per Ton of Pulp: Mechanical Pulping SGW – 5.11 RMP – 6.10 TMP – 7.09 CTMP – 7.68 Semichemical Pulping – 3.86 Chemical Pulping Kraft – 2.60 Sulfite – 5.38 Recycled Paper Pulping – 1.30
Kraft Pulping Noncondensibles (TRSa, VOCb) from blow and vent gases
All Pulping Processes Pulp refining – White Waters Chemical & Semichemical Pulping Digester condensates (VOC, TRS) Spent liquor and byproduct spills
Kraft Pulping Turpentine Sulfite Pulping Lignosulfonates, sugars, and organic acids
Figure 4-1. Kraft Pulping Process
Lime Kiln/Mud Concentrator
Lime Kiln/Mud Concentrator
Slaker/ Causticizer
Slaker/ Causticizer
White Liquor
Flue Gas
Clean/ScreenClean/Screen Paper Making
DigesterDigester
Blow TankBlow Tank
Washing/ Filtering
Washing/ Filtering
ScreeningScreening
BleachingBleaching
Washing/ ScreeningWashing/ Screening
RefinerRefiner
Wood Chips
Multiple-effect
Evaporators
Multiple-effect
Evaporators
Green Liquor
Direct Contact Evaporator/
Recovery Furnace
Direct Contact Evaporator/
Recovery FurnaceFlue Gas
Con-densedVapor
Water/Screen Rejects
Water/ Chemicals
Black Liquor
White Water
White Water
Pulp
Lime Kiln/Mud Concentrator
Lime Kiln/Mud Concentrator
Slaker/ Causticizer
Slaker/ Causticizer
White Liquor
Flue Gas
Clean/ScreenClean/Screen Paper Making
DigesterDigester
Blow TankBlow Tank
Washing/ Filtering
Washing/ Filtering
ScreeningScreening
BleachingBleaching
Washing/ ScreeningWashing/ Screening
RefinerRefiner
Wood Chips
Multiple-effect
Evaporators
Multiple-effect
Evaporators
Green Liquor
Direct Contact Evaporator/
Recovery Furnace
Direct Contact Evaporator/
Recovery FurnaceFlue Gas
Con-densedVapor
Water/Screen Rejects
Water/ Chemicals
Black Liquor
White Water
White Water
Pulp

Energy and Environmental Profile of the U.S. Pulp and Paper Industry 31
After the cooking stage, gases and steam in the digester are relieved and the hot pulp and spent liquor are discharged to a blow tank where the softened chips disintegrate into fibers upon impact. Most mills employ a bank of batch digesters so that while one is being filled, others are cooking or blowing. In continuous cooking, chips enter and exit the digester continuously. Continuous systems predominate because of their numerous advantages over batch systems: they are more space-efficient, easier to control (thus producing higher yields and consuming less chemicals), less labor-intensive, and more energy-efficient (Biermann 1996). In the process, as preheated chips and liquor move through the digester, they are impregnated at different stages with liquor, heated to cooking temperature, and held at the cooking temperature to effect pulping. The digester is heated by direct steam injection or by indirectly circulating the cooking liquors through a heat exchanger. After cooking, the hot spent liquors are extracted into a low-pressure tank, and the pulp is quenched with cool liquor from the brown stock washers to stop the pulping process. The flash steam that is generated is used in the presteaming vessel. The direct reuse of steam in continuous digesters reduces their fresh steam consumption by a large extent. From the blow tank, the pulp is sent to the deknotter to remove undigested lumps of wood. The undigested lumps (knots) are either discarded as waste or are returned to the digester for repulping. After deknotting, the pulp is sent to the brown stock washers (commonly rotary vacuum drum washers) to separate the pulp and residual spent cooking chemicals (black liquor). After washing, the pulp is screened to remove oversized particles from the pulp (fiber bundles and contaminants). A decker system is then used to thicken the pulp for storage after screening. From storage, the pulp is used for making paper or else dried and baled for later use or for sale to an off-site paper mill. The long, strong fibers of unbleached kraft pulp are dark brown and can be used to make grocery bags and corrugated shipping containers. For kraft pulp to be used in white papers, it must be bleached to remove the remaining lignin and brighten the pulp. The spent cooking chemicals (black liquor) are removed by dilution and also by displacement. Spent chemicals are diluted in the brown stock washers to form “weak black liquor,” at approximately 15% solids. The weak black liquor contains the original cooking inorganic elements and the degraded, dissolved wood substances (Biermann 1996). In the chemical recovery process (discussed in Chapter 5), the weak black liquor is concentrated in evaporators to “heavy” or “strong black liquor” at about 70-75% solids. The strong black liquor is burned in a recovery boiler to yield steam and electricity for process use, plus an inorganic smelt of sodium carbonate (Na2CO3) and sodium sulfide (Na2S). The smelt is dissolved in water to form green liquor, which is reacted with quick lime (CaO) to convert sodium carbonate to sodium hydroxide and regenerate the white liquor. 4.1.1.2 Sulfite Pulping From approximately 1890 to 1930, the acid sulfite pulping process was the most important pulping process in the world (Smook 1992). It was surpassed by the kraft pulping process in the 1930s, mainly because sulfite pulping does not handle certain wood species well, is intolerant of bark, produces a pulp with approximately 70% of the strength of kraft pulp, and is generally inefficient at chemical recovery. Recent developments in alkaline sulfite-anthraquinone pulping (alkaline sulfite anthraquinone and mini sulfide-sulfite anthraquinone) together with advances in gasification technology (chemical recovery process) may make sulfite processes more competitive with kraft pulping in the future. A typical sulfite pulping process is shown in Figure 4-2 (Smook 1992). The sulfite process uses a mixture of sulfurous acid (H2SO3) and bisulfite ion (HSO3
- ) to dissolve lignin. In the process, the cooking liquor is typically prepared at the mill. Sulfur is burned to produce sulfur dioxide (SO2) gas, which is rapidly cooled and then passed through an absorption tower containing a solution of water and an alkaline base. The solution in the absorption tower absorbs the SO2 gas and leaves the raw cooking solution of sulfurous acid (H2SO3) and bisulfite ion (HSO3
- ).

Energy and Environmental Profile of the U.S. Pulp and Paper Industry 32
Before the cooking acid is used for pulping, it is heated and fortified, under pressure, with the relief gases from the digester. The digester, typically batch type, is filled with wood chips and capped prior to the addition of the hot cooking acid. Once the digester is full of chips and cooking liquor, it is slowly heated up to 140°C and then maintained at that temperature for 6 to 8 hours. After cooking, gases and steam in the digester are relieved to reduce the temperature and pressure before the pulp is discharged into a blow pit. As with kraft pulping, the pulp is then screened and washed to remove uncooked wood. The unbleached sulfite pulp has a creamy beige color that can be brightened without the use of chlorine compounds for use in white papers.
The spent cooking liquor (“red liquor”) recovery process involves five steps: 1) concentration of the spent sulfite liquor, 2) burning of the concentrated liquor, 3) heat recovery during liquor combustion, 4) pulping chemical regeneration, and 5) byproduct recovery (Biermann 1996). Older sulfite mills use calcium as the alkaline base in the absorption towers to prepare the sulfite acid cooking liquor. More soluble bases such as magnesium, sodium, and ammonia are used in modern mills. The higher costs of magnesium and sodium bases have encouraged development of efficient liquor recovery systems that are not used in older, calcium-based facilities. 4.1.1.3 Extended Delignification The extended delignification process was originally developed in Sweden during the early 1980s as an energy-saving concept. It reduces the lignin content of the raw softwood pulp, maintains pulp quality, and reduces the cooking liquor consumption by 5 to 10%. The lower lignin pulp created by extended delignification also reduces the amount of residual delignification necessary during bleaching, which allows a reduction in bleach chemical use and lowers the discharge of chlorinated organic compounds. The process has been successfully applied to batch and continuous cooking (Smook 1992). 4.1.1.4 Oxygen Delignification Similar to extended delignification, oxygen delignification process was developed as a way to remove residual lignin from pulp prior to bleaching, thereby lowering the bleaching chemical requirement and the organic and inorganic content of the bleaching effluent (Smook 1992; Gullichsen 1999a). It uses alkali (oxidized white liquor), oxygen, and steam to remove lignin and is compatible with the kraft pulping process as the effluent can be added to black liquor and processed through the recovery boiler. Although oxygen delignification reduces the bleaching chemical requirement and effluent, its capital cost is high and the load on the chemical recovery system increases (Gullichsen 1999a).
Figure 4-2. Sulfite Pulping Process
Absorption Tower
Absorption Tower
StorageStorage
Water
DigesterDigesterWood Chips
High Pressure Acid Tank
High Pressure Acid Tank
Low Pressure Acid Tank
Low Pressure Acid Tank
Spent Liquor to Recovery
(Red Liquor)
BurnerBurner
Combustion Chamber
Combustion Chamber
CoolerCooler
FanFan
Sulfur Air
Alkaline Base
ScrubberScrubber
Pulp
Blow TankBlow Tank Wash Water
Cooking Acid
Relief
SO2
Burner Gas
Absorption Tower
Absorption Tower
StorageStorage
Water
DigesterDigesterWood Chips
High Pressure Acid Tank
High Pressure Acid Tank
Low Pressure Acid Tank
Low Pressure Acid Tank
Spent Liquor to Recovery
(Red Liquor)
BurnerBurner
Combustion Chamber
Combustion Chamber
CoolerCooler
FanFan
Sulfur Air
Alkaline Base
ScrubberScrubber
Pulp
Blow TankBlow Tank Wash Water
Cooking Acid
Relief
SO2
Burner Gas

Energy and Environmental Profile of the U.S. Pulp and Paper Industry 33
4.1.2 Mechanical Pulping Mechanical Pulping Separates Wood Fibers Using Vibrational Forces In mechanical pulping processes, wood in the form of small logs or chips is converted into fibers by mechanical action. Repeated compression and decompression of the wood in the grinder or refiner causes the fibers to weaken, fatigue, and separate. Pressure, heat, and chemicals may also be added to aid in softening the lignin that binds the fibers together. Because this process does not dissolve lignin, pulp yield is very high (90-94%), but strength and color permanency are low. For this reason, most mechanical pulp is used to make non-permanent paper products such as newsprint, magazines, and catalogs (Biermann 1996). Despite its high electricity requirements, mechanical pulping capacity is increasing in the United States and in other paper-producing countries due to the high yield of the process, lower capital costs, shrinking supplies of fiber resources, fewer environmental concerns, and technological advances (Smook 1992). The different types of mechanical pulping are classified by the type of refining action used and whether pressure, steam, or chemicals are used to make the pulp. Table 4-5 shows the basic characteristics of the four major mechanical pulping processes.
Stone groundwood (SGW) is the oldest and simplest form of pulping. Short log bolts are pressed against a rotating grindstone scored with a burr pattern, and a steady shower of water washes the separated wood fibers off the stone, cooling the stone and keeping it clean. Refiner mechanical pulping (RMP), introduced in the early 1960s, allows the use of residual wood and sawdust from lumber mills, while producing fibers that are longer, stronger, and bulkier than SGW fibers. In the RMP process, wood chips are converted to fiber in a disc refiner or series of disc refiners. The disc refiner is made of rotating metal plates equipped with specially designed metal bars on the surface that shred the chips and “unravel” the fibers. In the thermo-mechanical pulping (TMP) process, the wood feedstock is steamed under pressure for a short period of time prior to and during refining. The steam helps to soften the chips, which results in a higher percentage of long fibers and a stronger overall pulp. Presoftening also allows the TMP process to utilize certain hardwoods as well as softwoods.
Table 4-5. General Characteristics of Major Mechanical Pulping Processes
Stone Groundwood
(SGW) Refiner Mechanical
Pulp (RMP) Thermo-Mechanical
Pulp (TMP) Chemi-Thermo-Mechanical Pulp
(CTMP)
Grinding Mechanism
Pulpstone 2-stage refining using disc refining plates
2-stage refining using disc refining plates
2-stage refining using disc refining plates
Feedstock Softwood log bolts
Primarily softwood chips
Softwood and certain hardwood sawdust, wood chips, and pin chips
Softwood and certain hardwood sawdust, wood chips, and pin chips
Refining Pressure
Atmospheric Atmospheric 1st refiner: >100oC 2nd refiner: atmospheric
1st refiner: >100oC 2nd refiner: atmospheric
Pretreatment None None Presteaming of chips at >100oC for 2-3 minutes
Presteaming with moderate chemical treatment at >100oC for 2-5 minutes
Source: Biermann 1996.

Energy and Environmental Profile of the U.S. Pulp and Paper Industry 34
Chemi-thermo-mechanical pulping (CTMP) adds another step to the TMP process. The chips are fed through an impregnator and preheater digester where they are treated with small amounts of chemical (e.g., 2% sodium sulfite) under elevated temperature and pressure prior to refining. The chemical treatment produces a pulp with higher brightness and marginally greater strength, which expands its use beyond newsprint. Mechanical pulp processing requires more screening to remove dirt, shives, knots, and other contaminants than does chemical pulping. Most mechanical pulp mills use two- or three-stage screening followed by reject refining to pulp screen rejects. In CTMP pulping, pulp washing is also necessary to remove the chemicals from the pulp. As with chemical pulps, the final step of mechanical pulp processing involves thickening to increase stock consistency, followed by transfer to a pulp storage tank. Today, the majority of mechanical pulp is produced by either the TMP or CTMP processes, which produce higher quality pulps (at the expense of high energy requirements). Bleached CTMP (BCTMP) is displacing chemical pulp in low brightness printing and writing grades. 4.1.3 Semichemical Pulping Semichemical pulping processes (see Figure 4-3) combine aspects of the chemical and mechanical pulping methods. Partial delignification is achieved by mild chemical cooking, which is followed by mechanical defibering. The combined pulping methods produce an intermediate range of pulp yields between pure chemical and mechanical pulping.
Two common semichemical pulping processes exist: neutral sulfite semichemical (NSSC) and kraft semichemical pulping. Both methods use a mild chemical treatment followed by moderate mechanical pulping to produce pulp yields between 55 and 85%. The mild chemical treatment causes partial delignification, which makes paper from semichemical pulp very stiff. This stiffness is an important property for corrugating medium, which is frequently manufactured from semichemical pulp. Semichemical pulp is also used for newsprint and specialty boards. Bleached NSSC pulp can be used to manufacture writing papers, bond papers, tissues, and paper towels. NSSC pulping was developed in the early 1940s to incorporate hardwoods into papermaking. Today, NSSC pulping is the most common method for producing corrugating medium. Pulp yields range from 75 to 85% and hardwoods are the most common fiber source. NSSC pulping uses a sodium sulfite (Na2SO3) cooking liquor buffered with sodium carbonate (Na2CO3, soda ash). To eliminate sulfur in the process, mixtures of sodium carbonate and sodium hydroxide (NaOH) are sometimes used as the cooking liquor. The kraft semichemical pulping process uses green liquor (sodium carbonate and sodium sulfide) as the cooking liquor in the chemical step. In both semichemical pulping processes, pulp is cooked in
De-fiberator
Cooking Liquor
Spent Liquor
Pulp
Chips
Digester Blow Tank
Recovery System
Figure 4-3. Semichemical Pulping Process
Refining
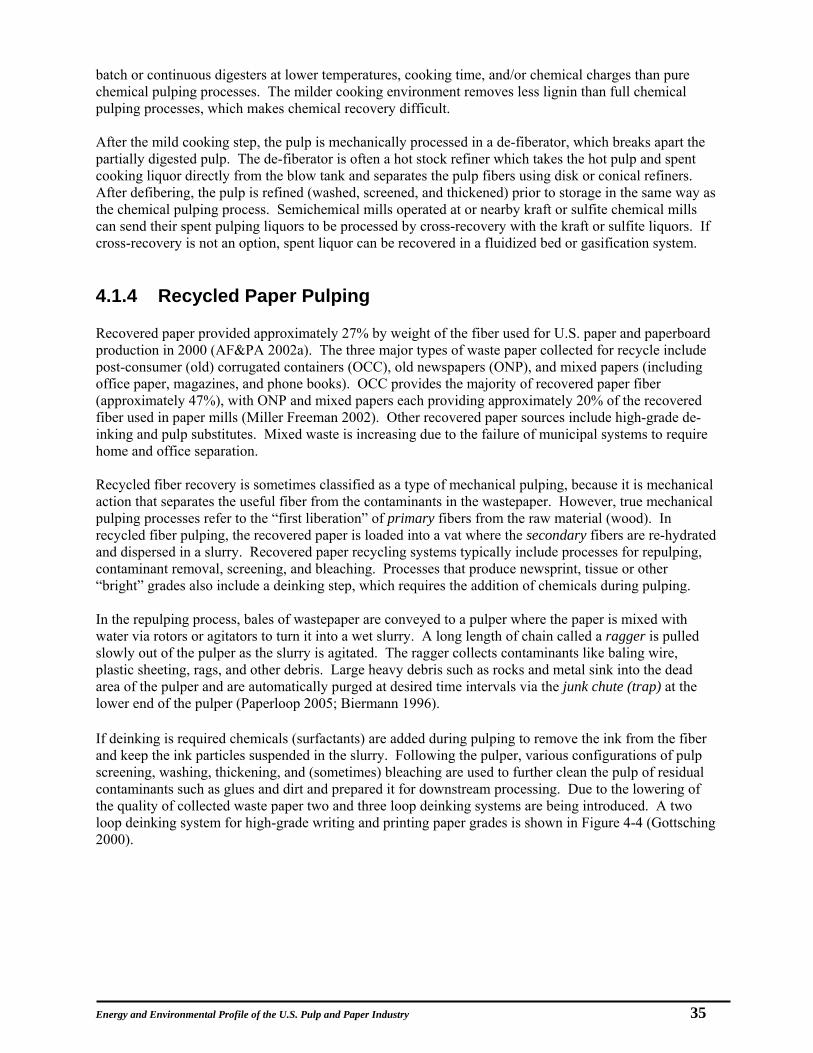
Energy and Environmental Profile of the U.S. Pulp and Paper Industry 35
batch or continuous digesters at lower temperatures, cooking time, and/or chemical charges than pure chemical pulping processes. The milder cooking environment removes less lignin than full chemical pulping processes, which makes chemical recovery difficult. After the mild cooking step, the pulp is mechanically processed in a de-fiberator, which breaks apart the partially digested pulp. The de-fiberator is often a hot stock refiner which takes the hot pulp and spent cooking liquor directly from the blow tank and separates the pulp fibers using disk or conical refiners. After defibering, the pulp is refined (washed, screened, and thickened) prior to storage in the same way as the chemical pulping process. Semichemical mills operated at or nearby kraft or sulfite chemical mills can send their spent pulping liquors to be processed by cross-recovery with the kraft or sulfite liquors. If cross-recovery is not an option, spent liquor can be recovered in a fluidized bed or gasification system. 4.1.4 Recycled Paper Pulping Recovered paper provided approximately 27% by weight of the fiber used for U.S. paper and paperboard production in 2000 (AF&PA 2002a). The three major types of waste paper collected for recycle include post-consumer (old) corrugated containers (OCC), old newspapers (ONP), and mixed papers (including office paper, magazines, and phone books). OCC provides the majority of recovered paper fiber (approximately 47%), with ONP and mixed papers each providing approximately 20% of the recovered fiber used in paper mills (Miller Freeman 2002). Other recovered paper sources include high-grade de-inking and pulp substitutes. Mixed waste is increasing due to the failure of municipal systems to require home and office separation. Recycled fiber recovery is sometimes classified as a type of mechanical pulping, because it is mechanical action that separates the useful fiber from the contaminants in the wastepaper. However, true mechanical pulping processes refer to the “first liberation” of primary fibers from the raw material (wood). In recycled fiber pulping, the recovered paper is loaded into a vat where the secondary fibers are re-hydrated and dispersed in a slurry. Recovered paper recycling systems typically include processes for repulping, contaminant removal, screening, and bleaching. Processes that produce newsprint, tissue or other “bright” grades also include a deinking step, which requires the addition of chemicals during pulping. In the repulping process, bales of wastepaper are conveyed to a pulper where the paper is mixed with water via rotors or agitators to turn it into a wet slurry. A long length of chain called a ragger is pulled slowly out of the pulper as the slurry is agitated. The ragger collects contaminants like baling wire, plastic sheeting, rags, and other debris. Large heavy debris such as rocks and metal sink into the dead area of the pulper and are automatically purged at desired time intervals via the junk chute (trap) at the lower end of the pulper (Paperloop 2005; Biermann 1996). If deinking is required chemicals (surfactants) are added during pulping to remove the ink from the fiber and keep the ink particles suspended in the slurry. Following the pulper, various configurations of pulp screening, washing, thickening, and (sometimes) bleaching are used to further clean the pulp of residual contaminants such as glues and dirt and prepared it for downstream processing. Due to the lowering of the quality of collected waste paper two and three loop deinking systems are being introduced. A two loop deinking system for high-grade writing and printing paper grades is shown in Figure 4-4 (Gottsching 2000).
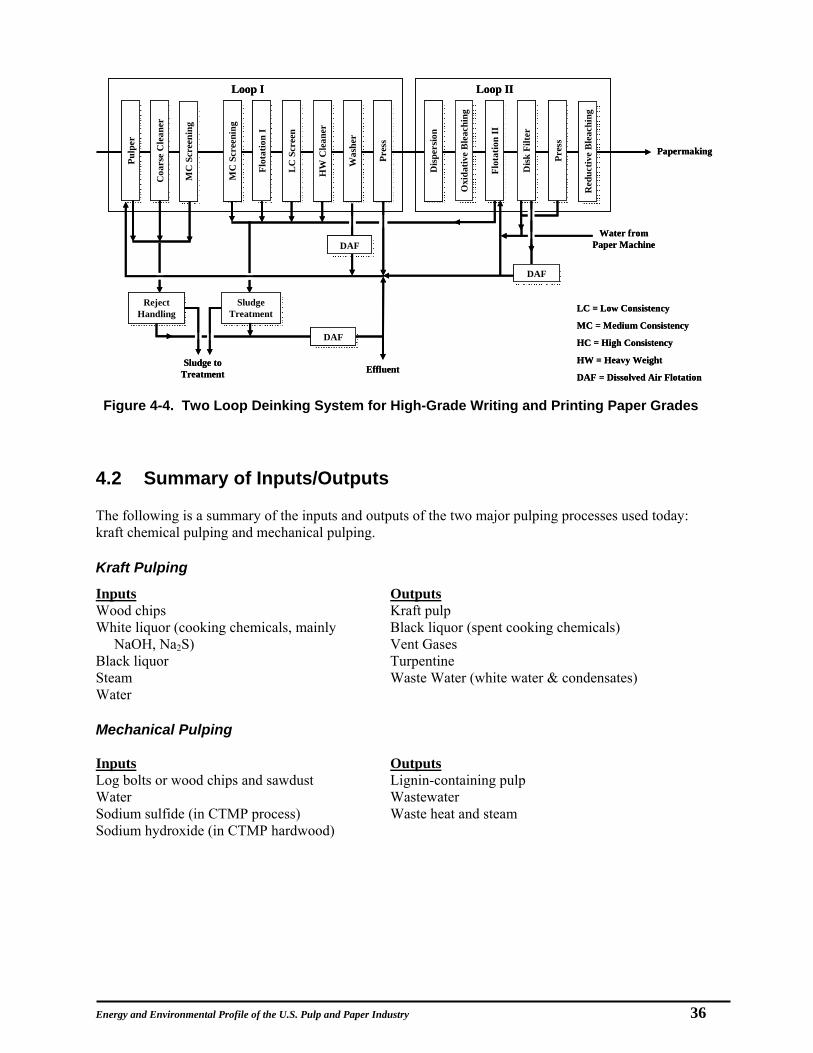
Energy and Environmental Profile of the U.S. Pulp and Paper Industry 36
4.2 Summary of Inputs/Outputs The following is a summary of the inputs and outputs of the two major pulping processes used today: kraft chemical pulping and mechanical pulping. Kraft Pulping
Mechanical Pulping Inputs Log bolts or wood chips and sawdust Water Sodium sulfide (in CTMP process) Sodium hydroxide (in CTMP hardwood)
Outputs Lignin-containing pulp Wastewater Waste heat and steam
Inputs Wood chips White liquor (cooking chemicals, mainly NaOH, Na2S) Black liquor Steam Water
Outputs Kraft pulp Black liquor (spent cooking chemicals) Vent Gases Turpentine Waste Water (white water & condensates)
Figure 4-4. Two Loop Deinking System for High-Grade Writing and Printing Paper Grades
Sludge to Treatment
Pulp
erPu
lper
Coa
rse
Cle
aner
Coa
rse
Cle
aner
MC
Scr
eeni
ngM
C S
cree
ning
MC
Scr
eeni
ngM
C S
cree
ning
LC = Low Consistency
MC = Medium Consistency
HC = High Consistency
HW = Heavy Weight
DAF = Dissolved Air FlotationEffluent
Flot
atio
n I
Flot
atio
n I
HW
Cle
aner
HW
Cle
aner
LC
Scr
een
LC
Scr
een
Was
her
Was
her
Pres
sPr
ess
Dis
pers
ion
Dis
pers
ion
Oxi
dativ
e B
leac
hing
Oxi
dativ
e B
leac
hing
Flot
atio
n II
Flot
atio
n II
Dis
k Fi
lter
Dis
k Fi
lter
Pres
sPr
ess
Red
uctiv
e B
leac
hing
Red
uctiv
e B
leac
hing
Reject HandlingReject
HandlingSludge
TreatmentSludge
Treatment
DAF DAF
DAF DAF
Loop I Loop II
DAF DAF
Water from Paper Machine
Papermaking

Energy and Environmental Profile of the U.S. Pulp and Paper Industry
37
4.3 Energy Requirements Pulping Energy Demand Varies With Digester Type and Potential Energy Recovery The estimated energy intensities for the various pulping processes are shown in Table 4-6. Kraft pulping energy requirements vary depending on the type of digester and modifications used to achieve process control and heat recovery. Continuous digesters consume more electricity than batch digesters, but use significantly less steam. According to a study for Natural Resources Canada (Jaccard 1996), the kraft batch digester consumes 0.71 million Btu of electricity and 4.49 million Btu of steam per ton of pulp, compared with a continuous digester which consumes 0.95 million Btu of electricity and 2.34 million Btu of steam per ton of pulp (about 40% less). Because the organic portion of the black liquor recovered from the brown stock washers is burned to produce energy, the kraft process is overall less fossil-fuel intensive than other primary pulping processes. The energy intensities of the sulfite pulping process are similar to the kraft process. Mechanical pulping is electricity-intensive, with the electricity demands varying depending on the desired pulp qualities. Thermomechanical pulping (TMP) is the most energy-intensive pulping process, consuming 6.32 million Btu of electricity and 0.77 million Btu of steam per ton of pulp. To improve thermal efficiency, modern TMP mills often utilize heat recovery processes to recover as much as 65% of the electric energy input as steam (Nilsson 1995). In these processes, the TMP steam is collected in the heat recovery units, where it is passed through a reboiler. The clean steam produced in the reboiler is often used at the paper machine for drying, while the TMP steam condensate can be used to heat white water for other processes (Sundholm 1999). Approximately half of a paper machine’s steam needs can typically be met by the TMP heat recovery system (Springer 1993). Recycled paper pulping requires less energy than virgin fiber pulping. Chemical recovery and power generation is not an integral part of the process as it would be in virgin fiber processing. As a result, recovered paper mills must depend entirely on purchased electricity and fuels. Substantial economic advantage can be gained, however, by adding recycled pulping capacity to an existing kraft paper mill to incrementally expand kraft pulping capacity.
Table 4-6. Average Energy Intensities of Pulping Processes
Pulping Process
Electricitya (106 Btu/ton
of pulp)
Steam (106 Btu/ton of
pulp)
Total Energy Use (106 Btu/ton of
pulp) Annual Production (million tons pulp)
Total Energy Use (1012 Btu/Yr)
Chemicalb 0.50 2.10 2.60 49.80 129.5
Semichemical 1.56 2.30 3.86 3.30 12.7
Mechanical 6.08 1.60 7.68 4.50 34.6
Recycled Paper 0.50 0.80 1.30 33.70 43.8
TOTAL -- -- -- 91.34 220.9 a Conversion factor of 3,412 Btu/kWh. b Kraft process. -- no data Sources: AF&PA 2004a (production); Martin 2000; EI 1988; Nilsson 1995; Jaccard 1996; Tucker 2005; Thorp 2005.

Energy and Environmental Profile of the U.S. Pulp and Paper Industry
38
4.4 Air Emissions Pulping Produces Sulfur Gases and Volatile Organics The chemical and semichemical pulping processes produce a number of air emissions, including volatile organics such as methanol, formaldehyde, acetaldehyde, and methyl ethyl ketone, as well as reduced sulfur gases. The “rotten egg” odor associated with kraft pulp mills is primarily caused by four reduced sulfur gases: hydrogen sulfide, methyl mercaptan, dimethyl sulfide, and dimethyl disulfide. These compounds are collectively referred to as total reduced sulfur (TRS) emissions and are released from a variety of sources in the kraft chemical and semichemical pulping processes (EPA 2002). TRS and VOC emissions are high-concentration, small-volume sources that are usually destroyed by incineration. Noncondensable gases from the digester blow and relief gases are the major TRS and volatile organic compound (VOC) emission sources; however, measurable concentrations are also found in the brown stock washer, seal tank vents, and liquor storage vents. Alcohols, terpenes, and phenols are the typical VOC constituents. These gases are mild odorants, but they enhance the effect of the sulfur gases. 4.5 Effluents Pulping Uses Larges Quantities of Water and Produces Significant Amounts of Wastewater The pulp and paper industry is the largest industrial process water user in the United States (EPA 1997). Water use in the industry decreased approximately 30% between 1975 and 1990, reflecting efforts by the industry to reduce consumption and increase wastewater reuse and recycle (Miner 1991). This trend is continuing as mills modernize and shift to more closed-cycle operations. The pulping process is responsible for a significant portion of the effluents from the pulp and paper industry. The main effluent loads from pulping processes are dissolved and suspended organic matter derived from wood or recovered paper and process chemicals and their byproducts. Chemical pulping is more water-intensive than mechanical pulping: bleached kraft pulp mills discharge over 30,000 gallons per ton of pulp, while mechanical pulp mills discharge only 5,000-7,000 gallons per ton pulp (Biermann 1996). The chemical pulping process produces effluents with large amounts of biological oxygen demand (BOD) and total suspended solids (TSS). The major sources of effluent pollution in chemical pulping (excluding kraft recovery and bleaching) are white water from pulp refining operations (cleaning, screening, and thickening), digester condensates, and uncontrolled intermittent losses (Springer 1993, Smook 1992). These pulping effluents are called white waters due to their characteristic color. White waters can contain significant BOD with inefficient washing as well as suspended solids from wood particles. These waters can be reused to dilute furnish mixtures or the solids can be collected for reuse. Condensates from the digesters are contaminated with a variety of organic compounds – primarily methanol and terpenes, as well as other alcohols and sulfur compounds. Condensate discharges are minimized in modern mills by reusing them in brown stock washers, as makeup for caustics, in lime kiln stack scrubbers, and for dissolving tank makeup (Springer 1993). Remaining condensate is steam-stripped to remove methanol, sulfur gases, and other volatiles prior to discharge. Finally, intermittent losses (including spills, overflows, and wash-ups) have traditionally accounted for approximately one-half of the BOD and TSS from kraft paper mills. In recent years, mills have improved monitoring and control of intermittent losses by implementing spill collection systems, overflow tanks, and process controls.

Energy and Environmental Profile of the U.S. Pulp and Paper Industry
39
Spills and leaks of spent pulping liquors, turpentine, and soap (tall oil) are the primary sources of hazardous pollutants in pulp and paper wastewaters. The EPA has identified various hazardous compounds found in these effluents, including phenol, zinc, benzoic acid, acetic acid, carbon disulfide, formaldehyde, p-cresol, formic acid, hydrogen sulfide, methyl mercaptan, and sodium hydroxide. The EPA’s regulatory approach for controlling these pollutants is the requirement that chemical pulp mills develop and implement Best Management Practices (BMPs) to prevent and control spent pulping liquor, turpentine, and soap losses, both prior to and after losses that do occur (EPA 1997d). Mechanical pulping mills also have to control BOD and TSS in effluent discharges, including a higher proportion of wood extractives such as resin acids (Biermann 1996). 4.6 Wastes, Residuals, and Byproducts Turpentine and Tall Oil are Byproducts of Pulping Pulping produces no significant solid wastes or residuals. Several byproducts, however, result from the pulping process. Turpentine is a wood extractive that can be separated from digester blow condensate by decanting it and removing the top layer containing the insoluble turpentine. The crude turpentine is usually sold to chemical processors or burned as fuel. Chemical processors use turpentine to produce solvents and disinfectants used in household pine oil cleaners (Biermann 1996). Tall oil (soap) is another wood extractive that can be recovered from spent kraft pulping liquors during the evaporation phase of chemical recovery (discussed in more detail in Chapter 5, Chemical Recovery). Spent liquors from sulfite pulping contain lignosulfonates, sugars, and organic acids, and can be used as a binder in brickette and pellet manufacturing. These byproducts can also be used in leather tanning, drilling mud dispersants, flotation aids, emulsifiers, and simple glue. Artificial vanilla is also made from lignosulfonate (Gullichsen 1999a).

Energy and Environmental Profile of the U.S. Pulp and Paper Industry
40

Energy and Environmental Profile of the U.S. Pulp and Paper Industry
41
5 Kraft Chemical Recovery 5.1 Process Overview Kraft Process Predominates in Chemical Recovery Chemical recovery is an integral part of the kraft pulping process, which is used in more than 80% of U.S. wood pulp production. Sulfite mills, which account for less than 2% of total U.S. wood pulp production, practice varying degrees of chemical recovery depending on the particular chemistry that is used. Because of its widespread use, only the kraft chemical recovery process is covered in this report.
The chemical recovery process is essential to the cost-effective operation of kraft pulp mills. The process recovers the kraft pulp digestion chemicals, minimizing the amount of new chemicals required for pulp digestion, and reducing the effluent load that must be treated prior to discharge. As part of the recovery process, energy is generated from the spent cooling liquor for use in other plant processes. The thermal efficiency of the recovery boiler is typically 65%. Figure 5-1 provides a more detailed flow chart of the Kraft chemical recovery process.
a Total reduced sulfur (TRS) emissions include hydrogen sulfide, methyl mercaptan, dimethyl sulfide, and dimethyl disulfide. b Volatile organic compounds. Sources: Martin 2000; EI 1988; Nilsson 1995; Jaccard 1996.
Key Energy and Environmental Facts – Kraft Chemical Recovery
Energy Emissions Effluents Byproducts/ Hazardous Wastes
Energy Use (Million Btu) Per Net Ton of Pulp: Evaporation – 2.05 to 5.35 Recovery Boiler – 1.13 to 4.0 Generates 4.0 to 20.0 Recausticizing – 0.45 to 1.04 Calcining – 0.94 to 2.51
Evaporation – Noncondensibles (TRSa, VOCb, alcohols, terpenes, phenols) Recovery Boiler – fine particulates, TRS, SO2, CO, NOx Recausticizing – particulates (Na salts), SO2, TRS Calcining – fine and coarse particulates (Na and Ca salts) TRS, SO2, CO, NOx
Evaporation – foul condensate ( suspended solids) Black liquor storage tanks - spills
Recausticizing – Dregs
Chemical Recovery Process Steps • Black liquor evaporation: concentrates the
black liquor to increase solids content • Black liquor combustion (recovery boiler):
burns the organic portion of black liquor to generate steam and produce molten smelt from the spent inorganic cooking chemicals
• Recausticizing: regenerates white liquor from the smelt for reuse in pulp cooking
• Calcining: recovers calcium oxide (lime) for reuse in the recausticizing process
• Byproduct recovery: recovers byproducts such as tall oil

Energy and Environmental Profile of the U.S. Pulp and Paper Industry
42
Lime Mud Wash Water
Makeup Lime
White Liquor
Lime Mud (CaCO3)
Vent Gases
Grit
Water
Flue Gases
Weak Black Liquor
Green Liquor
White Liquor
Lime (CaO)
Wash Water
Dregs
Tall Oil Soap
Clean & Foul Condensate
Dreg Wash Water
Dregs
Water Steam
Smelt Recovery Boiler
Green Liquor Dissolving Tank
Green Liquor Clarifier
Dregs Washer
Slaker Causticizers White Liquor
Clarifier
Lime Mud Washer & Filter
Evaporators
Steam
Lime Kiln
Boiler Feed Water
Fuel
Pulping Process
Flue Gases
Vent Gases
Green LiquorLime
Water
Smelt
Lime Screening & Crushing
Figure 5-1. Kraft Chemical Recovery Flow Diagram

Energy and Environmental Profile of the U.S. Pulp and Paper Industry
43
5.1.1 Black Liquor Evaporation Evaporation Concentrates Black Liquor for Use as a Fuel The weak black liquor from the brown stock washers described in Section 4.1.1 contains 12-20% solids and too much water to be efficiently burned in the recovery boiler (Gullichsen 1999b). An evaporation process removes the water in the black liquor to concentrate the organic and inorganic solids and to enable combustion of these solids as fuels (see Figure 5-2). The resulting heavy or strong black liquor is typically burned at 65-75% solids, although modern mills can now handle black liquor concentrated above 80% solids (Gullichsen 1999b). The limitation on black liquor concentration is viscosity. At concentrations greater than 75%, black liquor becomes difficult to pump but this obstacle can be overcome by newer systems designed to handle high solid concentrations. Evaporation is the largest single use of steam in a kraft mill, accounting for approximately 25% of total pulping process steam use. A large part of this steam is re-used in the form of condensate or hot water in other mill processes. Most evaporator systems used for concentrating black liquor are multiple-effect (i.e., composed of 4 to 6 effects, or heat exchangers) and use condensing steam to indirectly evaporate water from the dilute liquor. To minimize the use of primary steam, the steam that is evaporated from the liquor is reused as the condensing steam in another exchanger. Multiple-effect evaporators are combined in series, using a rising or falling film of liquor that flows countercurrent to the steam. The steam is often introduced into the first effect, and the black liquor feed is split between the last two effects. This "backward" feeding allows the most concentrated black liquor to be evaporated by the highest temperature and pressure steam.
Older mills (installed prior to the mid 1980s) generally use long-tube vertical (LTV) heaters, which are vertical shell and tube heat exchangers with a rising film of liquor on the inside of the tubes (Gullichsen 1999b). The black liquor is heated by the steam on the shell side, causing the liquor to boil and rise up the tubes. Once the steam reaches the top of the heat exchanger, it hits a deflector plate where the steam flashes and is pulled by vacuum to the next effect. These evaporators evaporate the black liquor to approximately 50-60% solids. The solid level is then further increased to 65-70% by a concentrator (Smook 1992).
Newer, more efficient evaporator systems utilize a falling film or forced-circulation flow pattern. Falling film evaporators can be either vertical tube or plate type heat exchangers with coexisting vapor and liquid phases. The main difference between the falling and rising film evaporator is the flow pattern. In a falling film evaporator, the liquor falls down the heat exchanger as the vapor rises up. Forced circulation evaporators heat the liquor in a horizontal heat exchanger, and the liquor is then sent to a flash chamber where the pressure is reduced causing the vapor to flash from the liquid. Direct-contact evaporators that use the hot combustion gases from the recovery boiler have also been used to evaporate additional water from the liquor. These evaporators release hydrogen sulfide and other odorous compounds into the air. To meet regulations where direct-contact evaporators are still in use, the black liquor is oxidized prior to direct-contact evaporation.
Strong Black Liquor 65-75%
Multiple Effect
Evaporators
Steam
Weak Black
Liquor 12-20%
Tall Oil
Clean & Foul
Condensate
To Recovery
Boiler
Figure 5-2. Evaporation of Black Liquor
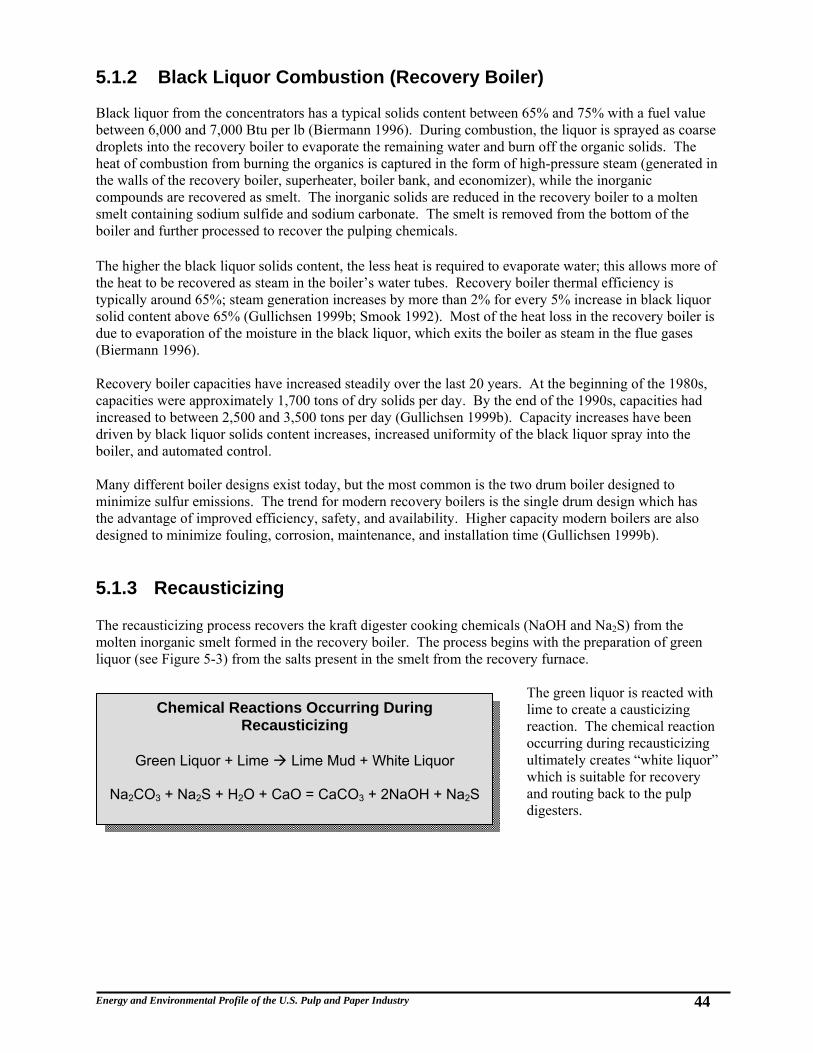
Energy and Environmental Profile of the U.S. Pulp and Paper Industry
44
5.1.2 Black Liquor Combustion (Recovery Boiler) Black liquor from the concentrators has a typical solids content between 65% and 75% with a fuel value between 6,000 and 7,000 Btu per lb (Biermann 1996). During combustion, the liquor is sprayed as coarse droplets into the recovery boiler to evaporate the remaining water and burn off the organic solids. The heat of combustion from burning the organics is captured in the form of high-pressure steam (generated in the walls of the recovery boiler, superheater, boiler bank, and economizer), while the inorganic compounds are recovered as smelt. The inorganic solids are reduced in the recovery boiler to a molten smelt containing sodium sulfide and sodium carbonate. The smelt is removed from the bottom of the boiler and further processed to recover the pulping chemicals. The higher the black liquor solids content, the less heat is required to evaporate water; this allows more of the heat to be recovered as steam in the boiler’s water tubes. Recovery boiler thermal efficiency is typically around 65%; steam generation increases by more than 2% for every 5% increase in black liquor solid content above 65% (Gullichsen 1999b; Smook 1992). Most of the heat loss in the recovery boiler is due to evaporation of the moisture in the black liquor, which exits the boiler as steam in the flue gases (Biermann 1996). Recovery boiler capacities have increased steadily over the last 20 years. At the beginning of the 1980s, capacities were approximately 1,700 tons of dry solids per day. By the end of the 1990s, capacities had increased to between 2,500 and 3,500 tons per day (Gullichsen 1999b). Capacity increases have been driven by black liquor solids content increases, increased uniformity of the black liquor spray into the boiler, and automated control. Many different boiler designs exist today, but the most common is the two drum boiler designed to minimize sulfur emissions. The trend for modern recovery boilers is the single drum design which has the advantage of improved efficiency, safety, and availability. Higher capacity modern boilers are also designed to minimize fouling, corrosion, maintenance, and installation time (Gullichsen 1999b). 5.1.3 Recausticizing The recausticizing process recovers the kraft digester cooking chemicals (NaOH and Na2S) from the molten inorganic smelt formed in the recovery boiler. The process begins with the preparation of green liquor (see Figure 5-3) from the salts present in the smelt from the recovery furnace.
The green liquor is reacted with lime to create a causticizing reaction. The chemical reaction occurring during recausticizing ultimately creates “white liquor” which is suitable for recovery and routing back to the pulp digesters.
Chemical Reactions Occurring During Recausticizing
Green Liquor + Lime Lime Mud + White Liquor
Na2CO3 + Na2S + H2O + CaO = CaCO3 + 2NaOH + Na2S

Energy and Environmental Profile of the U.S. Pulp and Paper Industry
45
Preparation of Green Liquor Ensures Safe Handling of the Hot Smelt To form “green liquor,” the molten inorganic salts (Na2CO3 and Na2S) from the recovery furnace are dissolved in weak wash water from dregs and lime mud washing operations. Pouring the hot smelt directly from the recovery boiler into a tank of cooling water would lead to rapid water vaporization, causing the tank to explode. For safety, the smelt flows out of the furnace through a water-cooled spout into the dissolving tank where it is shattered into small particles by sprays of steam. This allows the smelt to cool rapidly and in a controlled manner, preventing an explosion. The green liquor is then sent to a clarifier to remove the insoluble materials (dregs) before it is recausticized. The dregs are washed and
filtered prior to disposal, and the wash water is sent back to the green liquor dissolving tank. As shown in Figure 5-4, the clarified green liquor is combined with lime (reburned and makeup) in the slaker, where high temperature and rapid agitation accelerate the conversion of lime (CaO) into slaked lime (Ca(OH)2).
The causticizing reaction converts slaked lime into sodium hydroxide (NaOH) and calcium carbonate (CaCO3). Unreacted particles, or “grit,” settle to the bottom of the slaker and are raked out for landfill
Wash Water
Green Liquor Smelt
Recovery Furnace
Green Liquor Dissolving Tank
Green Liquor Clarifier
Green Liquor Storage Tank
Dregs Washer
Weak Wash Storage Tank
Figure 5-3. Green Liquor Preparation
Dregs
Dregs
Slaked Lime Reaction CaO + H2O → Ca(OH)2
Causticizing Reaction Ca(OH)2 + Na2CO3 ↔ 2NaOH + CaCO3 (s)
White Liquor
Slaker White Liquor
Clarifier
White Liquor Storage Tank
Lime (CaO)
Causticizers
Grit Lime Mud (CaCO3)
Figure 5-4. Causticization of Green Liquor to Prepare White Liquor (Recovered Chemicals)
Green Liquor

Energy and Environmental Profile of the U.S. Pulp and Paper Industry
46
disposal or use in neutralizing acidic effluents in the bleaching plant. In addition to the slaking reaction, the causticizing reaction also begins in the slaker and reaches approximately 70% completion. The causticizing reaction, which completes the regeneration of the pulping chemicals, attains 100% completion in the causticizers – a series of continuous-flow, stirred reactors with a total retention time of 1.5 to 2.5 hours (Gullichsen 1999b). The effluent from the causticizers is sent to a clarifier to remove the lime mud (CaCO3). The remaining liquid is the recovered “white liquor,” which can be further screened using high-pressure filters before it is routed back to the pulp digesters for pulping (Biermann 1996). 5.1.4 Calcining (Lime Reburning) Calcining or reburning converts the lime mud (CaCO3) removed from the white liquor in the recaustization process back into lime (CaO) for reuse in the slaker. As shown in Figure 5-5, the lime mud removed in the white liquor clarifier is washed in a settling tank to remove any remaining white liquor to prevent slagging in the kiln. The lime mud wash water is reused in the green liquor dissolving tank along with the dregs wash water. Calcining is accomplished in a lime kiln, where the calcium carbonate is dried, heated, and converted to lime and carbon dioxide. Most mills use fuel-fired kilns for calcining, although some use fluidized bed calciners. Lime kilns are typically 8-13 feet in diameter and 100-400 feet long. The kilns are horizontally inclined 2-5° and rotate at approximately 1 rpm. In the process, the thickened lime mud (at 60-70% solids) is fed into the high, “cold end” of the rotary kiln. In a lime kiln the combustion gases are in direct contact with the lime mud but flow counter currently to the mud flow (Biermann 1996). The dissociation of the calcium carbonate into lime and carbon dioxide occurs at the low end of the kiln, once the mud is heated to approximately 1,100°C, which is sufficient to yield a product that is 90-94% CaO (Smook 1992). The burned lime exits the kiln through a tube cooler which recovers the heat to preheat combustion air that flows into the kiln. After cooling, the burned lime is screened for large particles which are crushed by a lump crusher or hammer mill before going to the silo.
Lime (CaO)
Lime (CaO)
To Weak Wash Storage Tank
Lime Mud Dilution
Lime Mud Washer
Lime Kiln
Lime Mud (CaCO3)
Lime Mud Filter
Lime Screening
Lime Crushing
Lime (CaO)
Silo
Figure 5-5. Lime Reburning and Recovery (Calcining)

Energy and Environmental Profile of the U.S. Pulp and Paper Industry
47
5.2 Summary of Inputs/Outputs The following is a summary of the inputs and outputs of the main processes involved in chemical recovery. Black Liquor Evaporation Black Liquor Combustion Inputs Weak Black Liquor Primary Steam
Outputs Strong Black Liquor Clean Condensate Foul Condensate Tall Oil Soap
Recausticizing Lime Reburning/Calcining Inputs Smelt Lime Mud Wash Water Dregs Wash Water Fresh Makeup Water
Outputs White Liquor Grits Lime Mud (CaCO3) Dregs Wash Water Dregs Vent Gases
5.3 Energy Requirements Steam Meets Most of the Energy Requirements for Chemical Recovery Table 5-1 outlines the estimated energy intensities for the kraft chemical recovery process. Evaporation of the black liquor is the largest source of steam consumption in a kraft mill, consuming around 3.78 million Btu of steam per ton of pulp (Martin 2000). Steam consumption by multiple-effect evaporators can be reduced by increasing the number of effects in the system. Also, using falling film instead of rising film evaporators reduces fouling due to higher liquor flow rates and countercurrent flow of the liquor and vapor. These differences allow falling film evaporators to produce black liquor with a higher solid contents, which enables more efficient black liquor combustion in the recovery boiler. The recovery boiler consumes an estimated 1.13 million Btu per ton of pulp in the form of supplemental fuel and electricity for furnace auxiliaries. However, the boiler also produces 9 to15 times as much energy in the form of heat, which is used to produce steam or electricity for the kraft mill (Martin 2000). Recausticizing energy consumption is minimal compared to the other recovery processes. Steam is used to heat make-up water for green liquor dissolving, and to heat the green liquor in the slaker. Steam can also be used to heat white liquor prior to injection into the digester. Calcining is an endothermic process which requires approximately 2.2 million Btu of fuel (usually oil or natural gas) per ton of pulp in the lime kiln to dry the lime mud, heat the mud to the calcining reaction temperature, and provide the heat of reaction (Martin 2000). Fuel use in the lime kiln can be reduced by decreasing the water content of the lime mud going into the kiln, increasing the heat transfer within the kiln, decreasing the digester alkali charge, and recovering the heat in the kiln flue gases to preheat the mud or combustion air.
Inputs Strong Black Liquor Boiler Feedwater
Outputs Smelt Steam Flue Gases
Inputs Lime Mud (CaCO3) Fuel (oil, natural gas) Water
Outputs Reburned Lime (CaO) Lime Mud Wash Water Flue Gases

Energy and Environmental Profile of the U.S. Pulp and Paper Industry
48
5.4 Air Emissions Air emissions from chemical recovery take the form of reduced sulfur compounds, particulates, and common pollutants from combustion of fuels in the recovery boiler. Table 5-2 summarizes air emission factors for the chemical recovery process. Sulfur Compounds are a Source of Odor The “rotten egg” odor associated with kraft pulp mills is caused by four total reduced sulfur gases (TRS gases - hydrogen sulfide, methyl mercaptan, dimethyl sulfide, dimethyl disulfide). These gases can be destroyed by venting them to the recovery furnace or lime kiln for thermal oxidation. The recovery boiler flue gas is a source of TRS emissions. In direct-contact evaporators, the direct contact between the hot flue gases of the recovery boiler and the black liquor in the direct-contact evaporator is the main source of TRS emissions—the flue gases strip the odorous reduced sulfur compounds from the black liquor. The emissions in these systems can be reduced by oxidizing the sulfides (black liquor oxidation) into less reactive thiosulfates prior to direct contact evaporation. The last indirect contact evaporator was installed in the United States in the 1980s as mills began replacing direct evaporators with indirect evaporators (Thorp 2005). The TRS emissions in indirect evaporator systems can be controlled by efficient boiler operation. Boiler overloading is the most common cause of TRS emissions but can be eliminated by effective monitoring of the boiler oxygen levels, residence time, and turbulence. TRS emissions from the smelt dissolving tank and slaker can be reduced by using water low in sulfides to dissolve the smelt. TRS from the flue gases of the lime kiln can be reduced by efficient mud washing and kiln operation.
Table 5-1. Average Energy Intensities of Kraft Chemical Recovery Processes (106 Btu/ton of pulp)
Energy Type
Evapo- ration
Recovery Boilera
Re-causticizing Calcining
Total Energy
Intensity
Annual Production
(million tons of pulp)
Total Fuel, Steam and
Power
Fuel -- 0.95 -- 1.98 2.93 -- 156.2
Electricityb 0.08 0.18 -- 0.05 0.31 -- 16.5
Steam 3.78 -- 1.02 -- 4.8 -- 255.8
TOTAL 3.86 1.13 1.02 2.03 8.04 53.3 428.5 a Heat produced by the recovery boiler (not shown in table) is 9 to 15 times the amount of boiler energy input and is used to generate steam or electricity. b Conversion factor is 3,412 Btu/kWh. -- no data Sources: Martin 2000; AF&PA 2004a.

Energy and Environmental Profile of the U.S. Pulp and Paper Industry
49
Table 5-2. Air Emission Factors for Kraft Chemical Recoverya
(lb/ton of pulp processed) Source Particulate SO2 CO TRSb NOx
Evaporation -- -- -- 1.2 --
Recovery Boiler and Indirect Evaporator - Uncontrolled
230 -- 11 0.1 2
Recovery Boiler and Indirect Evaporator – Controlled by ESPc
2 -- 11 0.1 2
Recovery Boiler and Direct Evaporator - Uncontrolled
180 7 11 15 2
Recovery Boiler and Direct Evaporator – Controlled by Venturi Scrubber
48 7 11 15 2
Recovery Boiler and Direct Evaporator – Controlled by ESP
2 7 11 15 2
Recovery Boiler and Direct Evaporator – Controlled by Auxiliary scrubber
3 - 15
Recausticizing – Uncontrolled
Controlled – Mesh Pad
Controlled – Packed Tower Scrubber
7
1
0.2
0.2
0.2
--
--
--
--
0.5
0.5
0.5
--
--
--
Calcining – Uncontrolled
Controlled – Scrubber or ESP
56
0.5
0.3
--
0.1
0.1
0.7
0.7
1
1 a Factors expressed in unit weight of air-dried unbleached pulp (ADP). b TRS (Total reduced sulfur) includes methyl mercaptan, dimethyl sulfide, dimethyl disulfide, and hydrogen sulfide. c Electrostatic precipitator. -- no data Source: EPA 1990.
Particulates are Controlled by Scrubbers and Precipitators Fine (fume) and coarse particles are another air pollutant generated in the kraft recovery process and typically require external treatment. Fine particles in the flue gas of the recovery boiler and lime kiln are formed by sublimation of sodium salts such as Na2SO4, Na2CO3, and NaCl as the gases begin to cool. Coarse particle emissions are caused when lime mud in the lime kiln gets drawn into the flue gases. Venturi scrubbers, electrostatic precipitators, and auxiliary scrubbers are just some of the many equipment options that are used to reduce particulate emissions from chemical recovery (Smook 1992). Low-Level Combustion Emissions are Present in Flue Gases Sulfur dioxide, carbon monoxide, and nitrogen oxides are products of combustion and area emitted at low-levels in furnace flue gases (recovery boiler and lime kiln). Sulfur dioxide emissions are reduced by scrubbers, while the carbon monoxide and nitrogen oxides can be reduced by efficient furnace operation.

Energy and Environmental Profile of the U.S. Pulp and Paper Industry
50
5.5 Effluents Foul condensate from multiple-effect evaporators is a concentrated source of biological oxygen demand (BOD) and can contain reduced sulfur compounds. Before discharge, the condensate is usually steam-stripped to remove volatiles and reduce the BOD content. The remaining noncondensibles are burned in the recovery boiler or lime kiln. 5.6 Solid Waste and Byproducts Dregs go to Landfills Green liquor clarification separates the insoluble material (dregs) from green liquor prior to going to the slaker. Dregs are composed of unburned carbon and inorganic impurities, such as calcium and iron compounds, and are usually disposed of in a landfill. Tall Oil is a Byproduct Tall oil is almost always recovered during the evaporation phase of chemical recovery if the mill is using resinous wood such as southern pine. Fatty and resin acids are converted to sodium soaps during the kraft cooking process. These soaps leave the digester dissolved in the black liquor. Tall oil soap solubility drops as the black liquor becomes more concentrated in the evaporators and is recovered by pumping the liquor from the second evaporation effect into a skimming tank. Air and chemical additives are added to the black liquor in the tank to help aid the separation of the tall oil soap. The soap rises to the surface and is skimmed off into a storage tank were it is allowed to settle further. The black liquor is pumped back into the next evaporator effect after sufficient soap removal retention in the skimming tank. The soap is either processed at the mill into raw tall oil or is sent to a chemical processor (Smook 1992).

Energy and Environmental Profile of the U.S. Pulp and Paper Industry
51
6 Bleaching 6.1 Process Overview Bleaching Whitens and Brightens Pulp Unbleached pulps from the various pulping processes are brown or crème in color due to light absorbing compounds contained in the lignin that were not removed from the pulp during the pulping process. Before the pulp can be converted to paper products, it must be subjected to a chemical bleaching process to whiten or brighten the pulp.
Pulp brightness represents the capacity of the unbleached pulp to reflect light. The degree to which the pulp must be brightened depends on the desired product requirements, the type of pulping process employed, and the pulpwood species. The ISO (International Organization for Standardization) brightness levels of unbleached pulps obtained from different pulping processes are shown in Table 6-1. The pulping process (mechanical or chemical) is consequently a key factor in determining the type of bleaching process. Bleaching of mechanical pulp requires chemicals to decolorize the colored compounds in the lignin, whereas chemical pulp
bleaching focuses on removing the remaining lignin from the pulp. The following sections describe the unique bleaching processes used for pulps derived from mechanical versus chemical processes.
Key Energy and Environmental Facts – Bleaching
Energy Emissions Effluents Byproducts/Hazardous Wastes
Energy Use (Million Btu) Per Net Ton of Pulp: 2.3
Vent Gases – bleaching chemicals (ClO2, etc.) and VOCs (carbon monoxide, chloroform, methanol, etc.)
Washer Filtrates – BOD, color, chlorinated organic compounds; Effluents containing chlorinated organic compounds (dioxins, furans, chloroform, etc.)
Negligible
Sources: Martin 2000; EI 1988; Nilsson 1995; Jaccard 1996; Springer 1993; Tucker 2005; Thorp 2005. 6.1.1 Mechanical Pulp Bleaching Bleaching of Mechanical Pulps Decolorizes the Lignin Mechanical pulping produces pulp with high levels of lignin because the cellulose fiber bonds are broken through a mechanical action that does not remove lignin. The bleaching process for mechanical pulps is often called brightening because it decolorizes the lignin in the pulp without removing it. The light absorbing (color) compounds found in the lignin are chemically altered to eliminate their visible light
Table 6-1. ISO Brightness Levels of Unbleached Pulps
Range of Brightnessa Pulp Type
15 – 30 Kraft
40 – 50 Neutral Sulfite Semichemical, Ammonia Bisulfite
50 - 65 Mechanical, Bisulfite, Sulfite
a Ability of pulp to reflect light, index ranging from 0 (black) to 100 (white).
Source: Smook 1992.
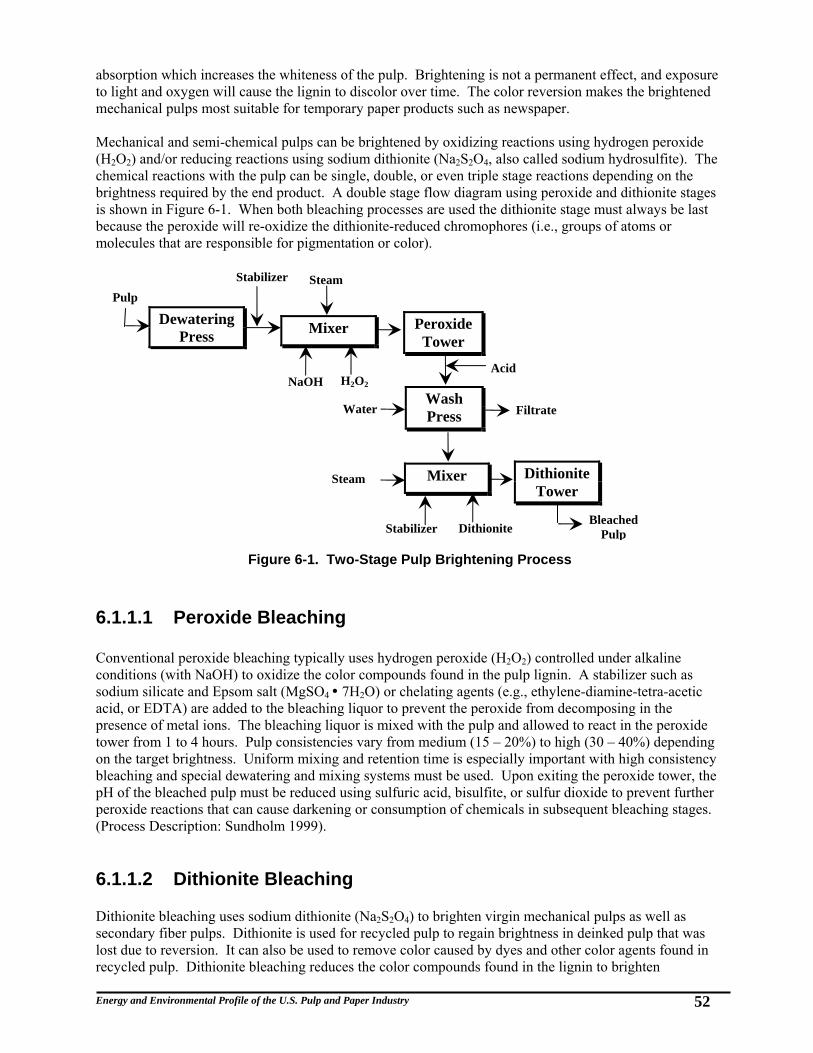
Energy and Environmental Profile of the U.S. Pulp and Paper Industry
52
absorption which increases the whiteness of the pulp. Brightening is not a permanent effect, and exposure to light and oxygen will cause the lignin to discolor over time. The color reversion makes the brightened mechanical pulps most suitable for temporary paper products such as newspaper. Mechanical and semi-chemical pulps can be brightened by oxidizing reactions using hydrogen peroxide (H2O2) and/or reducing reactions using sodium dithionite (Na2S2O4, also called sodium hydrosulfite). The chemical reactions with the pulp can be single, double, or even triple stage reactions depending on the brightness required by the end product. A double stage flow diagram using peroxide and dithionite stages is shown in Figure 6-1. When both bleaching processes are used the dithionite stage must always be last because the peroxide will re-oxidize the dithionite-reduced chromophores (i.e., groups of atoms or molecules that are responsible for pigmentation or color).
6.1.1.1 Peroxide Bleaching Conventional peroxide bleaching typically uses hydrogen peroxide (H2O2) controlled under alkaline conditions (with NaOH) to oxidize the color compounds found in the pulp lignin. A stabilizer such as sodium silicate and Epsom salt (MgSO4 7H2O) or chelating agents (e.g., ethylene-diamine-tetra-acetic acid, or EDTA) are added to the bleaching liquor to prevent the peroxide from decomposing in the presence of metal ions. The bleaching liquor is mixed with the pulp and allowed to react in the peroxide tower from 1 to 4 hours. Pulp consistencies vary from medium (15 – 20%) to high (30 – 40%) depending on the target brightness. Uniform mixing and retention time is especially important with high consistency bleaching and special dewatering and mixing systems must be used. Upon exiting the peroxide tower, the pH of the bleached pulp must be reduced using sulfuric acid, bisulfite, or sulfur dioxide to prevent further peroxide reactions that can cause darkening or consumption of chemicals in subsequent bleaching stages. (Process Description: Sundholm 1999). 6.1.1.2 Dithionite Bleaching Dithionite bleaching uses sodium dithionite (Na2S2O4) to brighten virgin mechanical pulps as well as secondary fiber pulps. Dithionite is used for recycled pulp to regain brightness in deinked pulp that was lost due to reversion. It can also be used to remove color caused by dyes and other color agents found in recycled pulp. Dithionite bleaching reduces the color compounds found in the lignin to brighten
Stabilizer
Stabilizer
Acid
Filtrate Water
Dithionite
Steam
H2O2 NaOH
Bleached Pulp
Pulp
Mixer Peroxide Tower
Figure 6-1. Two-Stage Pulp Brightening Process
Wash Press
Mixer Steam Dithionite Tower
Dewatering Press

Energy and Environmental Profile of the U.S. Pulp and Paper Industry
53
mechanical pulps. As with peroxide bleaching, chelating agents are used to prevent metal ions from decomposing the dithionite and re-oxidizing the chromophore groups. Oxygen can also decompose dithionite and re-oxidize the reduced chromophores, and exposure to air must be limited during dithionite bleaching. This can be done by using low pulp consistencies to reduce exposure to air entrainment and bleach towers that are designed to prevent contact between air and the pulp. Medium consistency bleaching is also used with modern equipment designed to prevent air contact with the pulp. The pH of the pulp is controlled between 4 and 6 using sodium carbonate, sodium tripolyphosphate, or sodium hydroxide. The bleaching liquor is mixed with the pulp and allowed to react for 30 to 60 minutes. After the reactions in the bleaching tower, the pulp does not need to be washed because of the low doses of chemical used in the process (Process Description: Sundholm 1999). 6.1.2 Chemical Pulp Bleaching Chemical pulp contains low levels of lignin because the chemical pulping process dissolves and removes the lignin from the cellulose fibers. As a result, chemical pulp bleaching focuses on removing the remaining lignin from the chemical pulp to produce permanent white pulps for high grade paper applications.
Chemical pulp bleaching involves various stages which alternate between washing and treating the pulp with chemicals. The number of bleaching steps range from three to six, depending on the quality and the desired brightness of the pulp. The different bleaching stages are characterized by the type of chemicals that are used.
The stages mix together in different combinations to form bleaching sequences that vary from mill to mill and are often determined by mill economics, environmental regulations, pulp type, and the final pulp brightness that is required. Each stage is carried out under different conditions in separate towers, with pulp washing between treatments. Table 6-2 illustrates typical bleaching conditions for each stage.
Table 6-2. Chemical Pulp Bleaching Conditions
Condition D E O H Z P
Chemical Addition (on pulp) 0.4 – 0.8 % 2 – 3 %
2 – 3% 60 – 120 psi
Mg2+
2 % (as Cl2)
10 – 14 % 1 – 2 % Na2O2;
Mg2+; Silicate
Pulp Consistency Medium Medium Medium or High Medium Medium
or High Medium
pH 3.5 – 6 11 – 12 10 – 12 8 – 10 2 – 3 8 – 10
Temperature (°F) 140 – 176 122 – 203 194 – 230 95 – 113 86 – 122 140 – 158
Time (hours) 3 – 5 0.75 – 1.5 0.3 – 1.0 1 – 5 1 – 2 minutes 2 – 4
Source: Biermann 1996; Dence 1996.
Chemical Pulp Bleaching Stages Alkaline Extraction (E) - dissolution of reaction products with sodium hydroxide Oxygen (O) - reaction with oxygen at high pressure in alkaline mediumHypochlorite (H) - reaction with hypochlorite in alkaline solution Chlorine Dioxide (D) - reaction with chlorine dioxide in acidic medium Ozone (Z) - reaction with ozone in acidic medium Hydrogen Peroxide (P) - reaction with hydrogen peroxide in alkaline medium
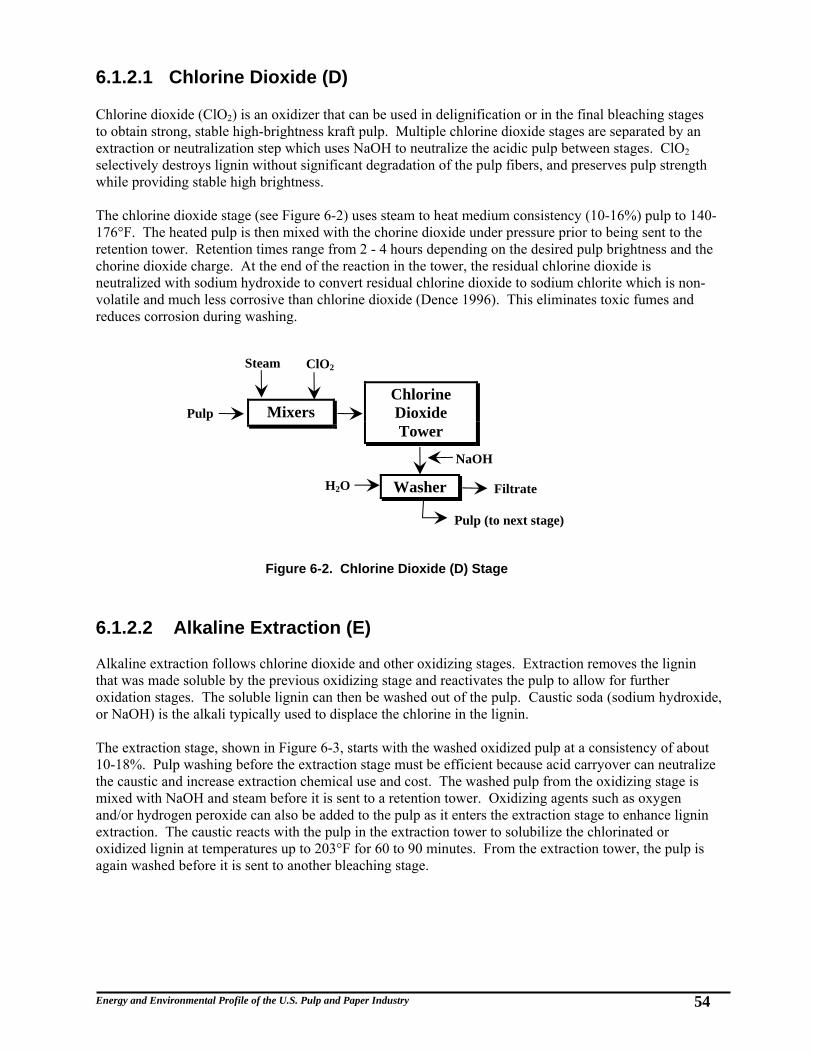
Energy and Environmental Profile of the U.S. Pulp and Paper Industry
54
6.1.2.1 Chlorine Dioxide (D) Chlorine dioxide (ClO2) is an oxidizer that can be used in delignification or in the final bleaching stages to obtain strong, stable high-brightness kraft pulp. Multiple chlorine dioxide stages are separated by an extraction or neutralization step which uses NaOH to neutralize the acidic pulp between stages. ClO2 selectively destroys lignin without significant degradation of the pulp fibers, and preserves pulp strength while providing stable high brightness. The chlorine dioxide stage (see Figure 6-2) uses steam to heat medium consistency (10-16%) pulp to 140-176°F. The heated pulp is then mixed with the chorine dioxide under pressure prior to being sent to the retention tower. Retention times range from 2 - 4 hours depending on the desired pulp brightness and the chorine dioxide charge. At the end of the reaction in the tower, the residual chlorine dioxide is neutralized with sodium hydroxide to convert residual chlorine dioxide to sodium chlorite which is non-volatile and much less corrosive than chlorine dioxide (Dence 1996). This eliminates toxic fumes and reduces corrosion during washing. 6.1.2.2 Alkaline Extraction (E) Alkaline extraction follows chlorine dioxide and other oxidizing stages. Extraction removes the lignin that was made soluble by the previous oxidizing stage and reactivates the pulp to allow for further oxidation stages. The soluble lignin can then be washed out of the pulp. Caustic soda (sodium hydroxide, or NaOH) is the alkali typically used to displace the chlorine in the lignin. The extraction stage, shown in Figure 6-3, starts with the washed oxidized pulp at a consistency of about 10-18%. Pulp washing before the extraction stage must be efficient because acid carryover can neutralize the caustic and increase extraction chemical use and cost. The washed pulp from the oxidizing stage is mixed with NaOH and steam before it is sent to a retention tower. Oxidizing agents such as oxygen and/or hydrogen peroxide can also be added to the pulp as it enters the extraction stage to enhance lignin extraction. The caustic reacts with the pulp in the extraction tower to solubilize the chlorinated or oxidized lignin at temperatures up to 203°F for 60 to 90 minutes. From the extraction tower, the pulp is again washed before it is sent to another bleaching stage.
NaOH
Pulp
Steam
H2O
ClO2
Filtrate
Pulp (to next stage)
Chlorine Dioxide Tower
Figure 6-2. Chlorine Dioxide (D) Stage
Washer
Mixers

Energy and Environmental Profile of the U.S. Pulp and Paper Industry
55
6.1.2.3 Oxygen (O) Oxygen bleaching was commercialized in the late 1960s and its use has been growing due to environmental advantages over bleaching stages that use chlorine-containing compounds. The effluent from oxygen bleaching does not contain chlorine and can be sent to the pulp mill’s recovery process rather than contribute to the mill effluent load. Oxygen is not as selective for lignin removal as the chlorine-containing compounds. In addition, magnesium salts can be added to the process to protect the cellulose fibers from degrading. Oxygen bleaching delignifies unbleached pulp up to 50% under pressure using oxygen gas and an alkali (typically NaOH). Oxygen bleaching can be used as a first stage or in a later stage to delignify the pulp, and can be operated at medium or high consistency. In the medium consistency process (see Figure 6-4), the pulp is mixed with steam, alkali, and a magnesium ion (such as MgSO4). High consistency systems require dewatering prior to chemical addition. The alkali used in the oxygen stage can be either NaOH or oxidized white liquor. After steam mixing, the pulp is sent to a high-shear, medium consistency oxygen mixer where the oxygen is injected into the pulp. After the oxygen is mixed into the pulp, the pulp is sent to a pressurized reaction (up-flow) tower. Oxygen reaction times range from 30-60 minutes at temperatures between 185 - 240°F. After the reaction, the gases are vented to lower the pressure and the pulp is sent to a washer system (Dence 1996).
Pulp (to next stage)
Pulp
Steam
H2O
H2O
NaOH
Filtrate
Extraction Tower
Figure 6-3. Alkaline Extraction (E) Stage
Washer
Mixers
Vent Gases
Pulp
Steam
H2O
NaOH, MgSO4
Filtrate
Pulp (to next stage)
O2
Tower
Figure 6-4. Oxygen (O) Stage
Washer Steam Mixer
To Recovery Process
Oxygen Mixer
O2
Blow Tank

Energy and Environmental Profile of the U.S. Pulp and Paper Industry
56
6.1.2.4 Hypochlorite (H) Hypochlorite bleaching is being phased out of commercial bleach plants due to increasing environmental regulations related to chloroform formation. Hypochlorite is more selective towards reactions with lignin than chlorine and can be used in lignin-preserving pulp brightening applications to a limited degree. It is an oxidizer that first attacks chromophoric groups of lignin but after the initial reaction attacks lignin and cellulose. In addition to brightening, hypochlorite is used to control polymer chain length in dissolved pulp.
Hypochlorite bleaching stages are typically used for sulfite pulps which are easier to bleach because the lignin residues are more reactive than kraft lignin residues. The lignin in kraft pulps is more condensed and less reactive, which causes the hypochlorite to attack the cellulose fibers before the reaction with the lignin is complete. This cellulose degradation limits the pulp brightness attainable by hypochlorite bleaching of kraft pulps making it suitable only as an intermediate bleaching stage. Hypochlorite is also used for semi-bleached pulps to obtain brightness levels up to 75.
Operating conditions for the hypochlorite bleach stage, shown in Figure 6-5, will vary depending on the type, quality, and consistency of the pulp, the chemical application, temperature, retention time, and pH The target terminal pH for hypochlorite bleaching is approximately 10.0 (Dence 1996). Temperature and retention times in the hypochlorite reaction tower are directly related and range from 104-122°F and 1–2 hours (Gullichsen 1999a). 6.1.2.5 Ozone (Z) Commercial use of ozone for pulp bleaching was driven in the 1990s by market demands for chlorine-free pulps that minimize the discharge of chlorinated compounds. Ozone is a powerful oxidizing agent that reacts with most organic materials. The high oxidizing potential of ozone makes it less selective toward lignin than chlorine and chlorine dioxide and therefore low charges of ozone must be used to prevent pulp strength loss. To achieve brightness comparative to chlorine and extraction stages, low lignin pulp from extended pulping or oxygen delignification must be used for ozone bleaching. A typical ozone stage is illustrated in Figure 6-6. The ozone stage can be used for medium or high consistency pulp. In the first step the pulp is acidified. After acidification, medium consistency pulp is transferred under pressure to a high-intensity mixer where compressed ozone is mixed with the pulp suspension to brighten the pulp. The residence time in the mixer is short (a few seconds) after which the residual ozone gas is separated from the pulp in the degassing chute before the pulp is washed. High consistency pulp requires thickening of the acidified pulp and fluffing to maximize the reaction surface area of the pulp in the ozone reactor.
Pulp
Steam
H2O
NaOH, NaOCl
Filtrate
Pulp (to next stage)
Hypochlorite Tower
Figure 6-5. Hypochlorite (H) Stage
Washer
Mixers

Energy and Environmental Profile of the U.S. Pulp and Paper Industry
57
6.1.2.6 Hydrogen Peroxide (P) Hydrogen peroxide (H2O2) is used in both mechanical (see Section 6.1.1.1) and chemical pulp bleaching. With chemical pulp, H2O2 can act as a “true” bleaching agent as it does with mechanical pulp, or as a delignification agent depending upon its application in the chemical pulp bleaching sequence. H2O2 is used in elemental chlorine-free (ECF) bleaching sequences to reinforce the first alkaline extraction stage. Alkaline reinforcement reduces the ClO2 requirement in the initial oxidation stage and can be used with or without oxygen to enhance alkaline extraction. Figure 6-7 shows the oxygen-reinforced extraction stage with H2O2 (EOP stage) which is similar to alkaline extraction (see Section 6.1.2.2). H2O2 can also be used in the second alkaline extraction stage to counteract pulp darkening to reduce chlorine dioxide consumption.
Pulp
Steam
H2O
NaOH, MgSO4
Filtrate
Pulp (to next stage)
Figure 6-7. Oxygen-Reinforced Alkaline Extraction (EOP) Stage
Washer
Mixer Oxygen Mixer
O2 H2O2
Extraction Tower
Pulp
Pulp
Pulp
Acid Ozone gas
Filtrate
Pulp Ozone Reactor Washers Acidification Degassing
Chute
Ozone gas
Medium Consistency
Acid
Ozone gas
Filtrate
Thickening Press
Washers
Acidification
High Consistency
Fluffer Ozone Reactor
Figure 6-6. Ozone (Z) Stage
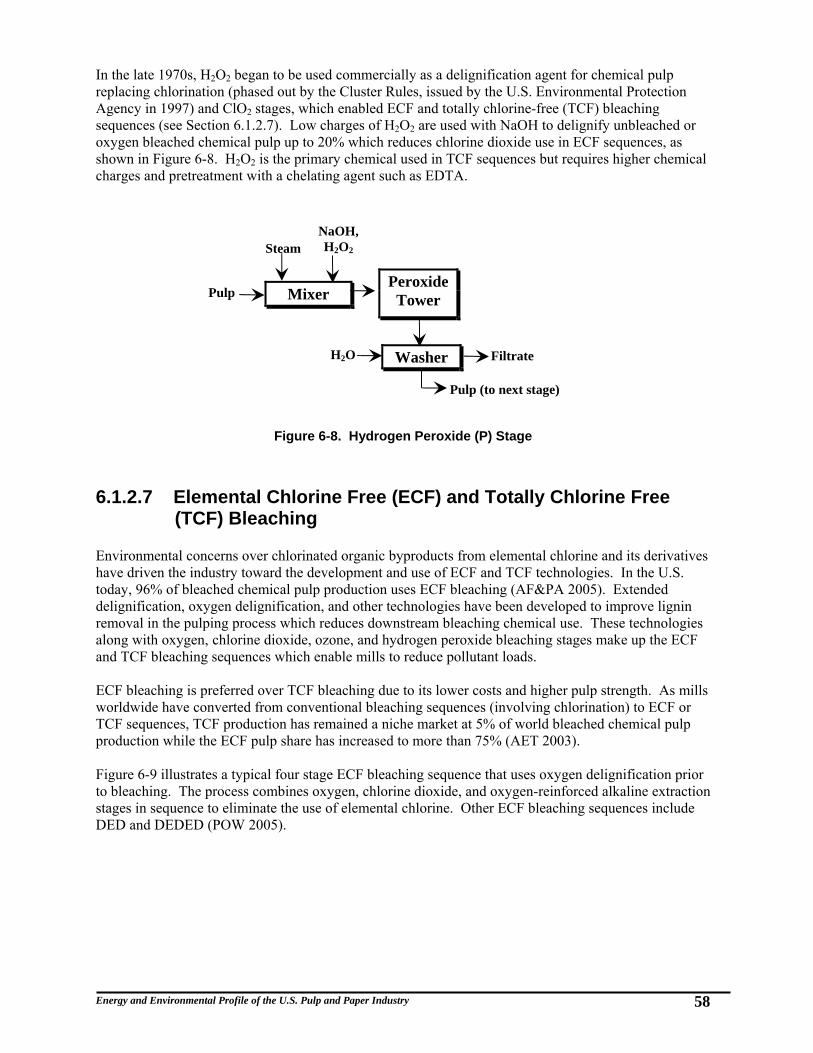
Energy and Environmental Profile of the U.S. Pulp and Paper Industry
58
In the late 1970s, H2O2 began to be used commercially as a delignification agent for chemical pulp replacing chlorination (phased out by the Cluster Rules, issued by the U.S. Environmental Protection Agency in 1997) and ClO2 stages, which enabled ECF and totally chlorine-free (TCF) bleaching sequences (see Section 6.1.2.7). Low charges of H2O2 are used with NaOH to delignify unbleached or oxygen bleached chemical pulp up to 20% which reduces chlorine dioxide use in ECF sequences, as shown in Figure 6-8. H2O2 is the primary chemical used in TCF sequences but requires higher chemical charges and pretreatment with a chelating agent such as EDTA.
6.1.2.7 Elemental Chlorine Free (ECF) and Totally Chlorine Free (TCF) Bleaching Environmental concerns over chlorinated organic byproducts from elemental chlorine and its derivatives have driven the industry toward the development and use of ECF and TCF technologies. In the U.S. today, 96% of bleached chemical pulp production uses ECF bleaching (AF&PA 2005). Extended delignification, oxygen delignification, and other technologies have been developed to improve lignin removal in the pulping process which reduces downstream bleaching chemical use. These technologies along with oxygen, chlorine dioxide, ozone, and hydrogen peroxide bleaching stages make up the ECF and TCF bleaching sequences which enable mills to reduce pollutant loads. ECF bleaching is preferred over TCF bleaching due to its lower costs and higher pulp strength. As mills worldwide have converted from conventional bleaching sequences (involving chlorination) to ECF or TCF sequences, TCF production has remained a niche market at 5% of world bleached chemical pulp production while the ECF pulp share has increased to more than 75% (AET 2003). Figure 6-9 illustrates a typical four stage ECF bleaching sequence that uses oxygen delignification prior to bleaching. The process combines oxygen, chlorine dioxide, and oxygen-reinforced alkaline extraction stages in sequence to eliminate the use of elemental chlorine. Other ECF bleaching sequences include DED and DEDED (POW 2005).
Filtrate
Pulp
Steam
H2O
NaOH, H2O2
Pulp (to next stage)
Peroxide Tower
Figure 6-8. Hydrogen Peroxide (P) Stage
Washer
Mixer

Energy and Environmental Profile of the U.S. Pulp and Paper Industry
59
Figure 6-9. ECF Four Stage [OD(EOP)D] Bleaching Sequence
Vent Gases Oxygen Delignified
Pulp
Steam
H2O
NaOH, MgSO4
Filtrate
Pul
O
Stage Tower Washer Steam
Mixer
To Recovery Process
Oxygen Mixer
O2
Blow Tank
NaO
Steam
H2O
ClO2
Filtrate
D Stage Tower
Washer
Mixers
Pulp
Steam
H2O
NaOH, MgSO4
Filtrate Washer
Mixer Oxygen Mixer
O2 H2O2
Extraction Tower
NaO
Pulp
Steam
H2O
ClO2
Filtrate
Bleached Pulp
D Stage Tower
Washer
Mixers
O Stage
D Stage
EOP Stage
D Stage

Energy and Environmental Profile of the U.S. Pulp and Paper Industry
60
Summary of Inputs/Outputs The following is a summary of the inputs and outputs of mechanical and chemical pulp bleaching. Mechanical Pulp Bleaching Inputs Mechanical Pulp Metal Stabilizers Steam Sodium Hydroxide (NaOH) Hydrogen Peroxide (H2O2) and or Sodium Dithionite (Na2S2O4) Acid (for hydrogen peroxide bleaching) Water
Outputs Waste Water (Filtrate) Bleached Pulp
Chemical Pulp Bleaching Inputs Chemical Pulp Water Chlorine Dioxide (D) Stage: Steam, Chlorine Dioxide (ClO2), Sodium Hydroxide (NaOH) Alkaline Extraction (E) Stage: Steam, Sodium Hydroxide (NaOH) Oxygen (O) Stage: Steam, Sodium Hydroxide (NaOH), Magnesium ion (Mg2+), Oxygen (O2) Hypochlorite (H) Stage: Steam, Sodium Hydroxide (NaOH), Sodium Hypochlorite (NaOCl) Ozone (Z) Stage: Acid, Ozone (O3) Hydrogen Peroxide (P) Stage: Steam, Hydrogen Peroxide (H2O2), Sodium Hydroxide (NaOH)
Outputs Waste Water (Filtrate) Bleached Pulp Vent Gases
6.3 Energy Requirements Bleaching Processes are Steam-Intensive Energy requirements vary depending on the type of equipment and control systems used for bleaching, and the number and type of bleaching stages. Bleaching consumes mostly thermal energy in the form of steam to drive pulp brightening and lignin removal. Electricity is consumed for pumping, blending, mixing, and other mechanical processes. Steam requirements for bleaching range from 0.4 to 3.0 million Btu per ton of pulp and electricity requirements range from 0.21 to 0.58 million Btu per ton of pulp. The estimated average energy intensities for bleaching processes are shown in Table 6-3.

Energy and Environmental Profile of the U.S. Pulp and Paper Industry
61
6.4 Air Emissions Bleaching Produces Emissions of Chlorine Compounds and Volatile Organics Bleaching chemicals such as chlorine dioxide and chlorine compounds formed during the bleaching process (elemental chlorine, etc.) can be released from the vents of the bleach towers, washers, and filtrate tanks. The concentrations of these chemicals in the vent gases vary from plant to plant and data is currently unavailable for ECF and TCF bleaching. Vent gases from ozone bleaching are passed through an ozone destructor and do not contribute to air emissions. Other chemicals present in the bleach plant’s vent gases can include carbon monoxide, and volatile organic compounds (VOCs) such as chloroform, methanol, methylene chloride, acetaldehyde, methyl ethyl ketone, acetone, chloromethane, and trichloromethane (EPA 2002). These fumes are produced during bleaching or may be released from liquid streams that are introduced into the bleach plant. VOCs are often removed from the bleaching vent gases by scrubber systems such as a packed tower scrubber (Dence 1996). 6.5 Effluents Bleaching Effluents Can Contain Over 400 Different Chemicals The various bleaching sequences and stages result in complex effluents. These effluents have been reported to contain over 400 different chemical compounds, some of which have yet to be identified (Dence 1996). Due to this complexity, bleach plant effluents are often characterized by biochemical oxygen demand (BOD), total organic carbon (TOC), chemical oxygen demand (COD), color, adsorbable organically bound halogen (AOX), and extractable organic halogen (EOX), rather than specific compounds. BOD, color, and chlorinated organic compounds are often the most common characteristics of bleach plant effluents reported. BOD is a measure of the oxygen required to degrade the effluent’s organic matter by biochemical oxidation. Effluents with high organic concentrations will have high BOD levels while lower organic concentrations will have lower levels. Bleaching solubilizes residual lignin and black liquor components left in the pulp from the pulping process. The effluent BOD depends on the amount of these components remaining in the pulp after pulping and washing. Typical BOD levels in effluents from the kraft bleaching of softwood pulp are shown in Table 6-4.
Table 6-3. Average Energy Intensities of Bleaching Processes
Energy Type Energy Intensity (106 Btu/ton of
pulp)
Annual Production (106 tons of
paper/yr)
Total Annual Energy Use (1012 Btu/yr)
Electricitya 0.3 37.6 11.3
Steam 2.0 37.6 75.2
TOTAL 2.3 37.6 86.5
a Conversion factor is 3,412 Btu/kWh. Sources: Martin 2000; EI 1988; Nilsson 1995; Jaccard 1996; Thorp 2005; Tucker 2005.

Energy and Environmental Profile of the U.S. Pulp and Paper Industry
62
Color in bleach plant effluents results from suspended and dissolved solids, most of which are organic materials. Over 90% of the total bleach plant effluent color is obtained in the first two bleaching stages. Table 6-5 shows typical color levels of softwood kraft pulp bleaching effluents.
a All data is per short ton of pulp. b Kappa number (measure of lignin content): 30-35. -- no data Source: Dence 1996.
Table 6-5. Color of Softwood Kraft Pulp Bleaching Effluenta,b
Type of Bleaching D Stage lb/ton (kg/ton)
E Stage lb/ton (kg/ton)
Total Bleach Process lb/ton (kg/ton)
ECF 51 (23) 150 (68) 57-330 (26-150)
TCF -- -- 59-343 (27-157)
a All data is per short ton of pulp. b Kappa number (measure of lignin content): 25-45. -- no data Source: Dence 1996. Toxic pollutants from bleaching effluents include chlorinated organic compounds such as dioxins, furans, chloroform, and others that are collectively characterized as adsorbable organic halides (AOX). These compounds are produced in the chlorine derivative and extraction stages and are washed from the pulp to the effluent in bleach stage washers. AOX is used to quantify the chlorinated organic material present in the effluent. The main source of chlorinated organic material in the effluent is from the lignin that is present in the unbleached pulp. Table 6-6 illustrates typical AOX levels for kraft pulp bleaching effluents. Bleach plant effluents are sent to the plant’s waste water treatment facility before they are released to the environment.
Table 6-6. Typical AOX Values for Kraft Pulp Bleaching Effluenta,b
Type of Bleaching D Stage lb/ton (kg/ton)
E Stage lb/ton (kg/ton)
Total Bleach Process lb/ton (kg/ton)
ECF 0.9-1.3 (0.4-0.6) 0.7-0.9 (0.3-0.4) 2.0-3.7 (0.9-1.7)
a All data is per short ton of pulp. b Kappa number (measure of lignin content): 19-34. Source: Dence 1996. Dioxin levels have been reduced by the industry to the point of making them undetectable with ECF and TCF bleaching and careful control of operating practices. Process changes such as extended, oxygen, and ozone delignification can also be implemented to reduce effluent toxicity by reducing the lignin content of the pulp before it reaches the bleach plant.
Table 6-4. BOD of Softwood Kraft Pulp Bleaching Effluenta,b
Type of Bleaching D Stage lb/ton (kg/ton)
E Stage lb/ton (kg/ton)
Total Bleach Process lb/ton (kg/ton)
ECF 14 (6.5) 11 (4.8) 18-35 (8-16)
TCF -- -- 26-86 (12-39)

Energy and Environmental Profile of the U.S. Pulp and Paper Industry
63
Stages of Papermaking • Stock preparation • Dewatering • Pressing and drying • Finishing (converting)
Figure 7-1. Typical Papermaking Flow Diagram
7.0 Papermaking 7.1 Process Overview Papermaking begins with the preparation of homogeneous pulp slurry (stock), where various chemicals and mineral additives may be added to achieve the desired final product. The slurry is then fed into the papermaking machine, where it is formed into a sheet and subsequently subjected to pressing and drying operations. The dry sheets are collected on reels for off-machine finishing operations. Further surface treatments may be necessary, depending on the intended end use of the paper.
Papermaking operations are divided into two sections - “wet end” and “dry end”. The wet end involves all the equipment and operations between the machine chest (where the stock is stored) and the press section (including the paper machine). The dry end begins after the press section and includes the drying section and finishing operations. A flow diagram for a typical papermaking process is shown in Figure 7-1.
Key Energy and Environmental Facts – Papermaking Energy Emissions Effluents Byproducts
Energy Use (Million Btu) Per Net Ton of Pulp (varies with final product):
Steam: 4.0 – 5.2 Electricity: 0.1 – 1.82 Fuel: 3.5 (tissue paper, and coated and uncoated paper production)
Small amounts of formaldehyde, sulfides
White water containing fibers and other solids (recycled or treated)
Paper waste is recycled internally
RefiningRefining
Metering/ Blending/ Screening Cleaning
Metering/ Blending/ Screening Cleaning
Stock Slurry (diluted pulp)
Flow Spreader
Flow Spreader PressPress
ReelReelFinishing
(rewinding, trimming, coating)
Finishing (rewinding, trimming, coating)
Head Box
Head Box Papermaking
Table/Web
Papermaking Table/Web
Stock Prep
Wet End
Dry EndDrying Section
Drying Section
CalenderCalender
Paper Products

Energy and Environmental Profile of the U.S. Pulp and Paper Industry
64
Table 7-1. Wet-End Chemicals and Mineral Additives
Additive Application
Acids and bases Control pH Alum Control pH; fix additives onto fibers; improve retention Sizing agents (e.g., rosin) Control penetration of liquids Dry-strength additives (e.g., starches and gums)
Improve burst and tensile; add stiffness and pick resistance
Wet-strength resins Add wet strength (towels, wraps) Fillers (e.g., clay, talc, TiO2) Improve optical and surface properties Dyes and pigments Impart desired color Retention aids Improve retention of fines and fillers Fiber flocculants Improve sheet formation Defoamers Improve drainage and sheet formation Drainage aids Increase water removal on wire Optical brighteners Improve apparent brightness Pitch control chemicals Prevent deposit/accumulation of pitch Slimicides Control slime growths and other microorganisms Specialty chemicals Corrosion inhibitors, flame-proofing, anti-tarnish
Source: Gullichsen 1999a.
7.1.1 Stock Preparation Stock Preparation Helps Control Final Paper Properties Stock preparation is an important intermediate step between the pulp mill and the paper machine, as it determines the final properties of the paper. In an integrated mill, thick stock is discharged from high-density pulp storage and then diluted to create the slurry. In an independent paper mill, dry pulp bales are repulped in water to form the slurry. Stock preparation involves refining, incorporating additives, blending, screening and cleaning (Smook 1992; CPI 2004). Refining – Refining is a crucial step in papermaking. During refining the pulp fibers are mechanically beaten to achieve the appropriate papermaking properties for the particular product being made. The slurry then passes through a machine that cuts and declusters the fibers to improve fiber bonding properties. Incorporation of wet-end additives - A number of mineral and chemical agents can be added to the stock, either to impart specific properties to the paper product (functional additives) or to facilitate the papermaking process (control additives). Table 7-1 lists the common additives and their functional use. Because it is inexpensive and easily imparts surface brightness, clay has traditionally been the most common additive. However, the trend towards improved paper surface properties, such as brightness, is leading to the displacement of clay with ground calcium carbonate (GCC) and precipitated calcium carbonate (PCC). Control additives are used as needed to enhance the process. Metering and Blending - The various fibrous and non-fibrous furnish components are continuously combined and blended to form the papermaking stock. Screening and Cleaning - Small unwanted particles of dirt and grit are removed through the use of centrifugal cleaners.

Energy and Environmental Profile of the U.S. Pulp and Paper Industry
65
7.1.2 Papermaking Papermaking Machines Have Been in Use Since the Early 19th Century After preparation, the stock is sent to the papermaking machine. Papermaking machines are very expensive and extremely large in size. Today’s machines can exceed 550 feet in length with installation costs as high as $550 million. While the size and speed of papermaking machines has increased over the years, production capacity has grown as well. Older machines typically produced 150,000 tons or less per year. Today’s machines have average capacities of 400,000 tons per year. Modern papermaking machines are characterized by lower operating costs and higher product quality than conventional paper machines. However, many paper companies continue to make their products with older machinery. The modern paper machine is wider, faster, able to integrate off-line operations, and able to incorporate new technology to improve quality and productivity and reduce operating costs. Updated papermaking machines boast improved configurations, better drying capabilities from the roll press sections (reducing energy costs in drying), and higher design speeds (TPS 2003). Along with advances in machinery, technological innovations such as improvements in sensors, controls, and automation have increased the quality, productivity, and cost of modern papermaking. For example, sensors help increase product quality by detecting unwanted particles, monitoring water systems, and increasing wet-end chemistry control. Automated processes, such as full-sheet web scanning systems, can measure with high precision the level of moisture, thickness, ash contents, and many other properties of a web (TPS 2003, Lockie 1998).
A variety of papermaking machines are in use today (see Table 7-2). The first industrial papermaking machine and still the most widely used today, the Fourdrinier was created by the Fourdrinier brothers at the beginning of the 19th century. The machine consists of a flat, horizontal wire that runs through a series of foils and dewatering devices. The Fourdrinier machine illustrated in Figure 7-2 is suitable for a wide range of paper grades (Allman 2005). In many cases these machines have been modified to handle certain specialty papers or grades, incorporating operations such as surface sizing and coating, or special calendering treatments.
The first cylinder machine also dates from the days of the first Fourdriniers. It is relatively inexpensive and has been widely used for single and multi-ply paperboard production. The machine consists of a wire-covered cylinder which rotates in a vat filled with a fiber suspension, forming the sheet against the cylinder.
Table 7-2. Papermaking Machines in the United States by Type (2000)
Fourdrinier Machines 865
Cylinder Machines 192
Twin Wire Machines 178
Other 93 Source: Thorp 2005.
Figure 7-2. Fourdrinier Machine

Energy and Environmental Profile of the U.S. Pulp and Paper Industry
66
The paperboard machine is characterized by four separate flat wires, where the board plies are formed and then couched together. The twin wire machine, popularized in the 1970s and still in use today for production of coated free-sheet and newspaper, employs two wires where the paper is formed (Figure 7-3) (Biermann 1996). A wire is a flat belt consisting of a plastic wire mesh. Other machines differ from the first four in the method used for drying and include multi-dryer machines, yankee machines, and combined paper machines. 7.1.2.1 Wet End Operations Wet end operations include the flow spreader, headbox, papermaking table and web, and press, as illustrated in Figure 7-1. Sheet formation is critical, as it dictates the quality of the paper product. Sheet Formation is a Crucial Stage of Papermaking The papermaking process begins with a flow spreader which evenly distributes the pipeline flow of the stock using a flow spreader. In this step, the stock flows through a headbox which creates a uniform layer of stock across the width of the machine and on the moving forming fabric. In many modern papermaking machines, the flow-spreader is an integral component of the headbox. The design and operation of the headbox is crucial to the papermaking process, as it directly impacts the formation and uniformity of the final paper product. The flow-spreader and headbox ensure even currents of the delivered stock, level out any velocity gradients, control turbulence, and produce an even discharge of the stock at specific angles, direction, and location. In a Fourdrinier machine, the moving fabric forms the fibers into a continuous matted web. Today’s papermachine forming fabrics are almost all comprised of plastic mesh, although the fabric is still often referred to as wire (phosphor bronze mats were used until the late 1960s). With other papermaking machines, sheet formation may be accomplished by formation of a web between two fabrics, on a fabric-covered cylinder, or by other means. A dandy roll is sometimes used to impart a design on the web of paper, such as a laid effect or weave. A watermarking dandy roll incorporates symbols, letters, and other designs into the paper (Smook 1992). Pressing Removes Moisture and Imparts Smoothness and Strength Pressing removes water from the web, imparting a total dryness of 45% - 55%. Pressing operations also consolidate the sheet, provide surface smoothness, reduce bulk, and increase web strength. It is during the pressing stage where the fibers are compacted to enable fiber-to-fiber bonding during drying.
Figure 7-3. Diagrams of Several Types of Twin Wire Formers

Energy and Environmental Profile of the U.S. Pulp and Paper Industry
67
In a suction press, drainage is accomplished by applying pressure to the mat while vacuum boxes below the mat create suction forces. The suction press consists of a hard press roll (solid roll) and a perforated shell containing a suction box (suction roll). Water drops are sucked out from the felt through the holes of the suction roll’s shell and collected in a tray. In a grooved press, drying occurs without the use of a vacuum. Instead, a solid roll presses water from the paper to the felt, and from the felt to a grooved roll. In this way, water flows into the grooves of the roll and is drawn away by centrifugal force. Shoe presses, which use a long nip formed against a stationary shoe, allow better compaction of the web and increased water removal. The extended nip shoe press commercialized in 1980 substantially improved press performance (Luiten 2001). Further improvements resulted in the development of enclosed shoe presses that can be used in the manufacture of all grades of paper (Luiten 2001, Fleischman 2005). 7.1.2.2 Dry End Operations Dry end operations include the dryer section, calender stack, reel building, and off-machine finishing operations, as shown in Figure 7-1. The drying section is massive, and represents the most costly operation in paper making in terms of both capital and operating costs (mostly due to high steam requirements). Drying Occurs Through Several Mechanisms After pressing, the sheet passes through a dryer section where additional water is removed via evaporation. Evaporation is accomplished by pressing the sheet against hot, steam-filled dryer drums. Dryer felts hold the paper web against the drum, which provides better heat transfer and maintains the flatness of the sheet. Meanwhile, the air over the web circulates to avoid vapor saturation from the evaporated water. Three drying processes occur at the same time: (1) flow of heat from the surface of the drying cylinder to the paper (contact drying), (2) cooling of the paper as heat is used to evaporate the water in it (flash drying), and (3) flow of heat from the surrounding air to the paper (convection drying). The following variables affect the rate of water removal:
• Temperature and volume of the steam entering the dryer drums • Effectiveness of steam condensate removal from inside the dryer drum • Contact time, and contact pressure between the dryer and the sheet • Felt properties • Hot air circulation • Pocket ventilation

Energy and Environmental Profile of the U.S. Pulp and Paper Industry
68
Dryer Steam Cans Ready for Shipment In a multi-dryer machine, the pressed web is subjected to a number of rotating steam-heated cylinders. The number of cylinders used ranges from 40-90, depending on the drying rate and evaporative load. Groups of cylinders operate at different steam pressures within the machine. The first cylinders with which the paper makes contact are at the lowest pressure and temperature. As the drying process continues, cylinders have increasingly higher temperatures and pressures. This methodology prevents the paper from sticking to the surface of the cylinders. To improve heat transfer, dryer fabrics are used to press the paper web against the cylinders. Pocket ventilation removes saturated air from the pockets formed by the paper, the dryer cylinder surface, and the dryer fabric. A yankee machine has only one main drying cylinder, which can be twice the diameter of those found in multi-drier machines. The yankee cylinder operates at high pressure, with the inner surface of its shell grooved to collect the steam condensate. In the yankee machine, one or two hot-press rolls are used to press the paper against the outer surface of the cylinder. The two press rolls alone aid the dewatering process, creating an approximate 50% dryness on the sheet. Tissue paper drying is a typical application of yankee machines. In tissue paper drying operations, both a yankee cylinder and hot air at a temperature of 400°C are used. When drying paper grades other than tissue, a low drying rate is employed to prevent the formation of air pockets between the paper and the surface of the cylinder. The combined paper machine has a machine-glazed (MG) cylinder, similar to the yankee cylinder, and also a multi-dryer section. Kraft paper and paperboard can be partially dried with an MG cylinder. This cylinder imparts glossiness on the paper by conveying the smoothness of the cylinder onto the surface of the paper web and allowing for shrinkage of the web fibers during the drying process. Unlike multi-dryer and yankee machines, combined paper machines are not commonly found in today’s paper mills. The MG cylinder requires a specific level of web moisture to operate without causing bottlenecks, and other state of the art techniques have been developed to produce similar results. Calendering Imparts Smoothness and Improves Uniformity Calendering is the term used for pressing the sheet with a roll. This process imparts a smooth surface to the paper for printing, and improves the cross-direction uniformity of certain properties, such as thickness, which is important for downstream collection on the reel and finishing operations. Calendering can be performed on both dry and partially dried paper. The calender stack consists of a series of vertically stacked, solid rolls. The paper passes between the top rolls, and makes its way to the bottom in a snake-like course. The bottom roll is usually larger in diameter than the others (Biermann 1996). Some conventional stacks are being replaced by “soft calenders” which employ shoe press nips (Cody 1998).

Energy and Environmental Profile of the U.S. Pulp and Paper Industry
69
Paper is Collected on a Reel for Storage and Finishing After the calendering process is completed, the paper must be collected in a convenient form for subsequent processing off-machine. The reel is the last part of the paper machine. In the reeling unit, the paper is wound around a rotating spool and stored for off-machine operations (Smook 1992; Biermann 1996). Finishing Includes Rewinding, Trimming, Coating, and Other Operations Finishing operations are usually called “converting” operations. Converting takes place after the paper is manufactured, and can include rewinding, trimming, sheeting, coating, printing, saturation, and box-making. Winding refers to the process where the paper from the large reels is cut into smaller widths and rewound onto smaller rolls. Sheeting consists of cutting the webs into large sheets—a sheeter machine also stacks the large sheets onto a pallet. Saturation consists of distributing a saturating material throughout the entire sheet. This treatment process is commonly used to strengthen the paper and/or induce stiffness (overlays, countertops, and laminates undergo a saturating process). Coating is used on the surface of the paper to induce brightness, gloss, smoothness, and uniformity. Common coatings include pigments and polymers (Biermann 1996). Supercalendering is a technique which uses heated rolls that alternate between hard and soft, and is generally used off-machine, such as after paper coating. It can be used to create a glossy surface on the paper or increase fiber bonding and strength. With new polymer filled rolls, “supercalendering” is no longer restricted to low speeds and modern multinip calendars have been installed on paper machines having design speeds as high as 1,800 meters per minute (Fleischman 2005). 7.2 Summary of Inputs/Outputs The following is a summary of the inputs and outputs of the main processes involved in papermaking. Stock Preparation Inputs High density pulp slurry or pulp bales Wet-end chemicals and mineral additives
Outputs Refined pulp slurry (>95% moisture)
Paper Manufacture – Wet End Operations Inputs Papermaking stock
Outputs Fiber sheet (55-60% moisture)
Paper Manufacture – Dry End Operations Inputs Fiber sheet (55-60% moisture)
Outputs Reel of finished paper (<5% moisture)

Energy and Environmental Profile of the U.S. Pulp and Paper Industry
70
7.3 Energy Requirements Papermaking Accounts for Nearly Half of Industry Energy Use The papermaking process consumes approximately 45% of the total energy used by the pulp and paper industry and is the most energy intensive process in the forest products industry (Jaccard 1996). The two major energy requirements are heat (mostly in the form of steam) for drying the paper, and power to run numerous fans, conveyors, pumps, and miscellaneous mechanical drive systems. Steam can also be used in the wet end to control stock temperature. In some case steam showers are also used in the press section. Table 7-3 shows the average energy consumption of various papermaking processes. As shown in Table 7-3, refining, screening, forming, pressing, and finishing operations rely entirely on electricity. Drying operations require large amounts of steam and small amounts of electricity. In integrated kraft pulp mills, much of the process steam for drying is generated from the combustion of black liquor in the recovery boiler. Energy consumption is impacted most by the operation of steam/condensate and air handling systems. Typical steam economy for a well-maintained system averages about 1.3 kg steam per kg water evaporated. Many drying systems, however, operate with higher steam usage (Smook 1992).
Table 7-3. Energy Consumption in Papermaking (Million Btu per Ton of Finished Paper)
Process Steam Electricity Fuel TOTAL
Paper Refining and Screening 0.84 0.84
Newspaper Forming, Pressing and Finishing 1.44 1.44
Newsprint Drying 4.07 0.10 4.17
Tissue Forming, Pressing, Finishing 1.82 1.82
Tissue Paper Drying 4.0 0.45 3.50 7.95
Uncoated Paper Forming, Pressing, Finishing 1.80 1.80
Uncoated Paper Drying 5.0 0.10 5.10
Coated Paper Forming, Pressing, Finishing 1.80 1.80
Coated Paper Drying 5.2 0.10 5.30
Linerboard Forming, Pressing, Finishing 0.92 0.92
Linerboard Drying 4.0 0.05 4.05
Papermaking Average (6.26 106 Btu/ton) Total Papermaking Energy Use/Yr: 554 1012 Btu (based on annual paper production of 88.4 million tons of paper and paperboard)a
a Linerboard energy averages are assumed to be representative of the paperboard sector. Sources: Jaccard 1996; AF&PA 2004a; Thorp 2005.

Energy and Environmental Profile of the U.S. Pulp and Paper Industry
71
7.4 Air Emissions Papermaking produces very few air emissions because most volatile materials in the wood are lost during the pulping process. Some emissions may occur from incorporation of chemical and mineral additives, such as formaldehyde from urea or melamine formaldehyde resins, which are additives used to impact wet strength. Air pollutants can also arise from finishing operations where surface coatings are applied, and during the anaerobic degradation of sulfates in waste water, which can give rise to sulfide emissions. 7.5 Effluents Large volumes of water containing fibers and other materials retrieved from the papermaking machine (white water) are produced during the production of paper. These may contain particulate wastes, organic compounds, inorganic dyes, or chemical compounds such as acetone. In many cases, these white waters are of sufficient quality to be reused in other sections of the mill. White waters that are not used as furnish dilution are sent to a flotation clarifier (either filter-type or flotation-type), where solids are recovered prior to discharge (Smook 1992). 7.6 Wastes, Residuals, and Byproducts Solid paper wastes produced during papermaking from cutting, trimming, or process rejects are recycled. No other byproducts are produced.

Energy and Environmental Profile of the U.S. Pulp and Paper Industry
72

Energy and Environmental Profile of the U.S. Pulp and Paper Industry
73
8 Supporting Systems 8.1 Overview Pulp and paper manufacturing is energy intensive and consumed about 2.4 quadrillion Btu of energy in 2002 (DOE 2005). The industry relies on a diverse fuel mix that encompasses fossil fuels as well as renewable wood waste and byproducts (see Figure 8-1) (DOE 2005). Wood byproducts serve as the pulp and paper industry’s largest energy source, making up 54% of its total fuel use. A large portion of fuel (~75%) is used to produce steam and power in onsite systems, which are described in detail in Section 8.2.
Paper manufacture also produces air pollutants from furnaces, pulp drying and other operations. A variety of air pollution control and abatement systems are required to control and abate air emissions, and these are described in Section 8.2.
The pulp and paper industry is the largest user of industrial process water in the United States, and produces significant quantities of waste water that must be treated or recycled. Due to the large volumes of water in paper manufacture, mills utilize both primary and secondary wastewater treatment systems. Systems for control and treatment of effluents are described in Section 8.3.
8.2 Steam and Power Generation The onsite production of steam for electricity generation and process heating is a major supporting operation in paper manufacture. On average, more than 40% of electricity is produced onsite along with
cogeneration of steam, which is a critical input to pulp and paper drying. Boiler systems are fired with a diversity of fuels, and exhibit variable boiler efficiencies as shown in Table 8-1. Those fired with waste fuels exhibit the lowest thermal efficiency. The two main types of boilers used in the paper industry are the recovery boiler, which recovers chemicals and energy from spent kraft cooking chemicals, and the power boiler, which generates heat and power (steam and electricity) using a variety of fuels.
Recovery boilers, or Tomlinson boilers, are used to produce smelt for chemical recovery, as well as heat, which is captured to produce steam. The principal purpose of these boilers is to recover the pulping chemicals for reuse. Steam requirements for the plant are usually secondary to the need to process the
Table 8-1. Boiler Fuel Efficiency
Fuel Type Efficiencya
Oil 83 %
Gas 82 %
Coal 81 %
Bark 64 %
Black Liquor 65 %
a Btu steam generated / Btu of fuel energy. Source: Grant 1985.
Figure 8-1. Fuel Distribution in Paper Manufacture
Coal10%
Fuel Oil5%
Electricity10%
Natural Gas21%Byproducts
54%
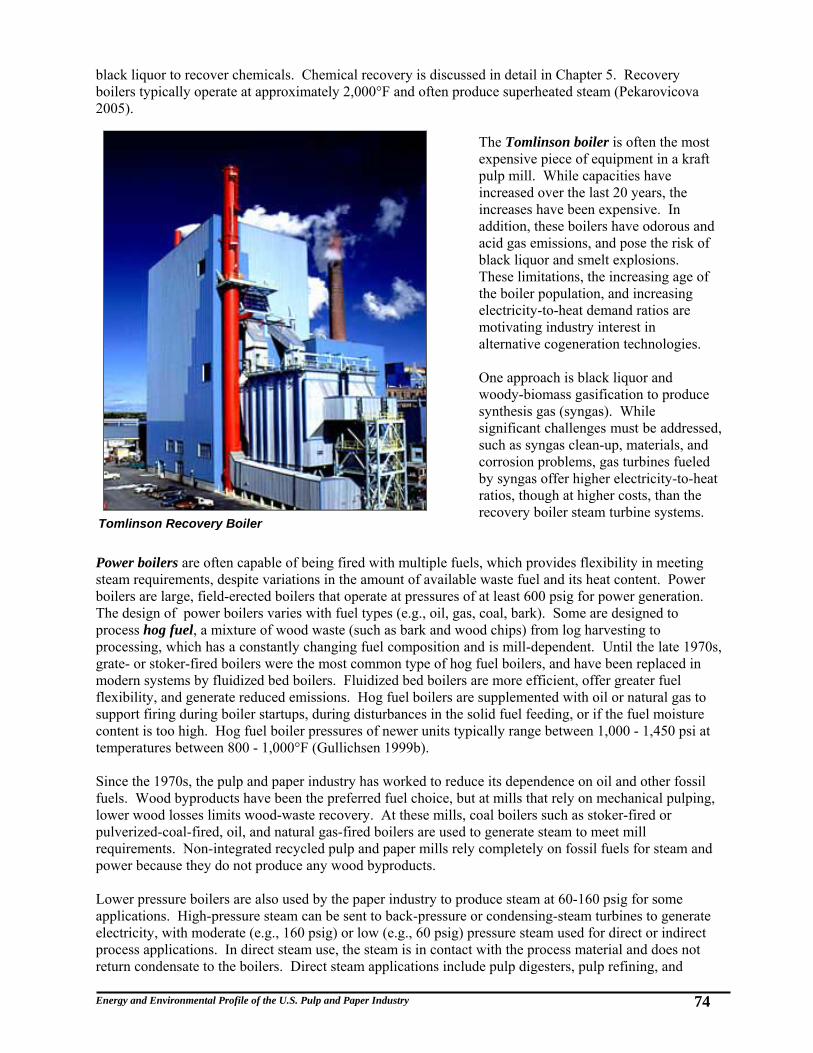
Energy and Environmental Profile of the U.S. Pulp and Paper Industry
74
black liquor to recover chemicals. Chemical recovery is discussed in detail in Chapter 5. Recovery boilers typically operate at approximately 2,000°F and often produce superheated steam (Pekarovicova 2005).
The Tomlinson boiler is often the most expensive piece of equipment in a kraft pulp mill. While capacities have increased over the last 20 years, the increases have been expensive. In addition, these boilers have odorous and acid gas emissions, and pose the risk of black liquor and smelt explosions. These limitations, the increasing age of the boiler population, and increasing electricity-to-heat demand ratios are motivating industry interest in alternative cogeneration technologies. One approach is black liquor and woody-biomass gasification to produce synthesis gas (syngas). While significant challenges must be addressed, such as syngas clean-up, materials, and corrosion problems, gas turbines fueled by syngas offer higher electricity-to-heat ratios, though at higher costs, than the recovery boiler steam turbine systems.
Power boilers are often capable of being fired with multiple fuels, which provides flexibility in meeting steam requirements, despite variations in the amount of available waste fuel and its heat content. Power boilers are large, field-erected boilers that operate at pressures of at least 600 psig for power generation. The design of power boilers varies with fuel types (e.g., oil, gas, coal, bark). Some are designed to process hog fuel, a mixture of wood waste (such as bark and wood chips) from log harvesting to processing, which has a constantly changing fuel composition and is mill-dependent. Until the late 1970s, grate- or stoker-fired boilers were the most common type of hog fuel boilers, and have been replaced in modern systems by fluidized bed boilers. Fluidized bed boilers are more efficient, offer greater fuel flexibility, and generate reduced emissions. Hog fuel boilers are supplemented with oil or natural gas to support firing during boiler startups, during disturbances in the solid fuel feeding, or if the fuel moisture content is too high. Hog fuel boiler pressures of newer units typically range between 1,000 - 1,450 psi at temperatures between 800 - 1,000°F (Gullichsen 1999b). Since the 1970s, the pulp and paper industry has worked to reduce its dependence on oil and other fossil fuels. Wood byproducts have been the preferred fuel choice, but at mills that rely on mechanical pulping, lower wood losses limits wood-waste recovery. At these mills, coal boilers such as stoker-fired or pulverized-coal-fired, oil, and natural gas-fired boilers are used to generate steam to meet mill requirements. Non-integrated recycled pulp and paper mills rely completely on fossil fuels for steam and power because they do not produce any wood byproducts. Lower pressure boilers are also used by the paper industry to produce steam at 60-160 psig for some applications. High-pressure steam can be sent to back-pressure or condensing-steam turbines to generate electricity, with moderate (e.g., 160 psig) or low (e.g., 60 psig) pressure steam used for direct or indirect process applications. In direct steam use, the steam is in contact with the process material and does not return condensate to the boilers. Direct steam applications include pulp digesters, pulp refining, and
Tomlinson Recovery Boiler

Energy and Environmental Profile of the U.S. Pulp and Paper Industry
75
starch cooking, and are less capital-intensive because they do not require heat exchangers and condensate return systems. Indirect applications use heat exchangers to transfer the heat from the steam into the process and require condensate return systems to recycle the condensed steam to the boiler feed water. Paper machine drying cylinders are the largest industry users of indirect steam heating (EI 1988). More detail on steam use for paper drying is found in Chapter 7. Secondary heat is also produced in kraft mills from cooking, black liquor evaporation, flue gas scrubbers, and drying processes. This heat can usually satisfy the hot water needs of a modern mill without the use of steam (Gullichsen 1999b). The paper industry uses electricity to drive machinery such as fans, pumps, conveyors, compressors, and process drives. The largest users in kraft pulp mills are pumps (40-45%) and fans (15-20%). In addition to purchased electricity, power is also produced onsite. Steam turbines generate electricity from high-pressure steam, which is used to turn steam turbines that drive electric generators, creating electric power for the plant. Most of the turbines are non-condensing, meaning that they have positive (low) exhaust pressures. In addition to providing low pressure steam for use in the mill, the turbines often have interstage taps that allow steam to be drawn off at pressure greater than that of the turbine exhaust and used to meet higher pressure steam requirements elsewhere in the plant (DOE 2002). A few mills have added a natural gas-fired turbine to generate power. After driving the turbine, the combustion gases pass through a heat recovery system to generate steam and hot water for the mill (Moeller 1986; Thorp 2005). 8.2 Abatement and Pollution Control Air emissions from pulp and paper operations contain nitrogen oxides, sulfur oxides, reduced sulfur gases, carbon monoxide, hydrochloric acid (HCl), volatile organic compounds (VOCs), heavy metals, and polycyliclic aromatic hydrocarbons. Table 8-2 shows the major types and sources of air pollutants in the pulp and paper industry.
Because black liquor contains large quantities of sulfur (between 3-7%) and alkali metal salts, special attention is given to total reduced sulfur gases (TRS) and particulate emissions from recovery boilers. TRS emissions are explosive at high concentrations and have offensive odors even at low concentrations. In recovery boilers sulfur gases are captured by sodium salt vapor or liquid. Modern recovery boilers also operate at generally higher furnace temperatures, which increases the volatilization of sodium and decreases sulfur gases. For this reason, modern recovery boiler TRS emissions are only 5 ppm (parts per million) or less.
Virgin black liquor contains low amounts of chloride. Hydrogen chloride (HCl) is produced in the reaction of carbon dioxide with potassium chloride and sodium chloride. As with TRS, higher furnace temperatures reduce the amount of HCl emitted by reducing emissions of sodium dioxide.
Table 8-2. Major Types and Sources of Air Pollutants in Pulp and Paper Manufacture
Pollutants Source
Fine Particulates Principally soda fume from the kraft recovery furnace
Coarse particulates Mainly “fly ash” from hog fuel and coal-fired boilers
Sulfur Oxides (SOx) Especially from sulfite mill operations
Nitrogen Oxides (NOx) From all combustion processes
Total Reduced Sulfur Gases (TRS)
From kraft pulping and recovery operations
Volatile Organic Compounds (VOCs)
Noncondensible gases from digester relief and spent liquor evaporation
Sources: Smook 1992; EPA 2002.

Energy and Environmental Profile of the U.S. Pulp and Paper Industry
76
Nitrogen dioxide emissions from recovery boilers, power boilers, and lime kilns are relatively negligible. Nitrogen oxide (NO) emission are also low—recovery boilers typically emit NO in the 40-120 ppm range, which is much lower than the 1,000 ppm for fossil-fuel combustors. VOC emissions are present from noncondensible gases in digester relief and spent liquor evaporation. VOCs are weak odorants, although they can increase the effect of sulfur gases and react photochemically when released into the atmosphere. Control technologies for air emissions are shown in Table 8-3. Combustion at high temperatures can destroy many gaseous air pollutants, such as TRS emissions. At moderate temperature levels, catalytic combustion can be used effectively to control gaseous emissions. In the pulp and paper industry, thermal incineration sources such as power boilers and lime kilns operate at sufficiently high temperature levels to be effective without a catalyst. Adsorption is another technique rarely used in the industry but which offers potential for modern equipment. In this process, gases and odors are collected through the surface of a solid adsorbent material by means of the attractive forces between the gas and the adsorbent.
Wet scrubbing is another method used effectively for cleansing moist, hot gases. Wet scrubbing removes contaminants from gas streams by forcing the gas to make contact with a liquid, such as water. Many types of scrubbers exist, differing in configuration, motion imparted to the gas, and direction and method in which the liquids make contact with the gases. Wet scrubbers can also be mechanically aided with fans or use fibrous beds that provide a contact surface for liquid and gas.
Particulate emissions are produced by lime kilns and dissolving tanks, as well as coal-fired boilers, which produce coarse particulates. Black liquor combustion produces droplet residue particles, droplet fragment residue particles, and fume particles. All recovery boilers are equipped with electrostatic precipitators to control particulate emissions. These precipitators consist of an arrangement of electrodes and collector plates, which are maintained at different voltage levels. The electrodes ionize the fume particles which are then forced to migrate towards the collector plates. Only sub-micron fume particles are of a size small enough to escape electrostatic precipitators. Other methods for particulate removal include mechanical collection, fabric filtration, gravel bed filtration (dry scrubbing), and wet scrubbing. Dry scrubbers operate by the same principles as wet scrubbers but use a moving bed of granular filter material instead of a liquid medium. In a similar method, fabric filters made from cloth are used to prevent solid particulates from escaping. Mechanical collectors force gas through a path that is difficult for particles to follow. Various types of mechanical collectors exist, with the simplest containing a settling chamber where gasses are forced to slow down, causing particles to deposit at the bottom. In other mechanical collectors, the gases are forced to continuously change direction. In a cyclone collector, for example, gas enters at the top of the collector and is forced to follow a spiral path towards the bottom. Centrifugal forces drive the particles outwards, causing them to settle at the bottom of the collector. The particle-free gas then travels upwards through a vortex located at the center (Smook 1992).
Table 8-3. Air Pollution Control Equipment
Gas/Vapor Removal Particulates Removal
Catalytic combustion Thermal incineration
Adsorption Wet scrubbing
Mechanical collection Fabric filtration
Gravel bed filtration Electrostatic precipitation
Wet scrubbing Hybrid designs
Sources: Smook 1992; EPA 2002.

Energy and Environmental Profile of the U.S. Pulp and Paper Industry
77
8.3 Effluents Water used at pulp and paper mills must be treated prior to being released from mill operations. To minimize water losses, much of this process water is recycled for reuse. Mill effluent discharges to receiving waters such as rivers, lakes, and streams, or publicly owned treatment works (POTWs), are regulated by the Environmental Protection Agency (EPA) under 40 CFR, Part 430 to minimize their impact on the environment. Wastewater characteristics vary considerably, depending on the manufacturing process from which they came. The water streams that exit from different processes are likely to have different pollutants, as well as varying temperature, pressures, flow rates, and pH. The design and operation of on-site wastewater treatment at pulp and paper mills requires continuous sampling and monitoring of these parameters. Effluent treatment programs are expensive to implement and operate but are often offset by fiber and energy savings. Table 8-4 lists some of the more commonly regulated effluent properties. Limitations on effluents are process-specific, and are described in the effluent section in individual chapters and in Chapter 2. Major effluent concerns for the pulp and paper industry include:
Organic matter, which is a food source for microorganisms that can overpopulate and deplete the oxygen in rivers;
Color discharges, which affect the appearance of the receiving body of water;
Suspended solids, which can make water appear murky; and Other materials such as fillers, acids, bases, and sludges.
Mill treatment programs focus on reducing the organic matter (oxygen demand) and solids contents of effluent streams. Color is a concern when the dilution factor in the receiving water is low and inhibits light from reaching underwater plants. Severe toxicity is not a problem with pulp and paper effluents; however, a number of effluent constituents such as resin acids, unsaturated fatty acids, and chlorinated organic compounds such as chlorinated phenolics have been identified as toxic. Table 8-5 shows common sources for water pollutants and effluent characteristics.
Table 8-4. Regulated Effluent Characteristics
Dissolved oxygen pH Toxicity Suspended solids Temperature Foam Odor Nutrient concentration Microorganisms
Table 8-5. Common Water Pollutants from Pulp and Paper Processes
Source Effluent Characteristics
Water used in wood handling/debarking and chip washing
Solids, BOD, color
Chip digester and liquor evaporator condensate Concentrated BOD—can contain reduced sulfur compounds
“White waters” from pulp screening, thickening, and cleaning
Large volume of water with suspended solids—can have significant BOD
Bleach plant washer filtrates BOD, color, chlorinated organic compounds
Paper machine water flows Solids—often precipitated for reuse
Fiber and liquor spills (to the treatment lagoon) Solids, BOD, color
Source: EPA 1997d.

Energy and Environmental Profile of the U.S. Pulp and Paper Industry
78

Energy and Environmental Profile of the U.S. Pulp and Paper Industry
79
9 The Forest Biorefinery 9.1 Process Overview The Forest Biorefinery Could Boost the Industry’s Economic Strength As the U.S. pulp and paper industry faces increased competition from mills in less-developed countries, pulp and paper companies are exploring ways to enhance profitability by increasing productivity in a sustainable manner and diversifying their product slate. The forest biorefinery concept—using advanced technologies to efficiently convert the non-cellulosic portions (lignin, hemicellulose) of woody biomass to liquid fuels and value-added chemicals—is attracting interest because it offers the U.S. pulp and paper industry the opportunity to enhance economic strength. Some of today’s pulp and paper mills are already operating as rudimentary forest biorefineries. Byproducts from the pulping process are used in boilers to produce heat and power, and in some cases, marketable products such as kerosene, tall oil, and cellulose derivatives are generated in addition to paper products. In the optimized forest biorefinery, advanced technologies would enable more of the wood feedstock to be converted to higher-valued products, including chemicals and more marketable fuels such as ethanol and hydrogen. The components of the future forest biorefinery are shown in Figure 9-1 (Thorp 2004).
Figure 9-1. Components of the Forest Biorefinery

Energy and Environmental Profile of the U.S. Pulp and Paper Industry
80
Extracting Hemicellulose Sugars Can Add Value to Mill Products Wood is primarily composed of three constituents: cellulose, hemicellulose, and lignin. While the pulp and paper industry has evolved over the decades to be very efficient at maximizing the yield, properties, and value of cellulose, hemicellulose and lignin are used primarily as lower-value energy resources. The hemicellulose and lignin are separated from the cellulose fiber during the chemical pulping process and combusted to generate electricity and steam to run the mill. However, hemicellulose has potentially greater value as a sugar feedstock for chemicals and fuels (see Table 9-1). In an optimized forest biorefinery, part of the hemicellulose that is now burned would be used to create new, more valuable products. A portion of hemicellulose can be extracted from wood chips prior to pulping using hot water extraction in low-pressure digesters (Thorp 2004). Some acetic acid is formed during the extraction process and this must be separated from the sugar solution. The sugars can then be fermented to ethanol or other high-value chemicals, creating an additional product stream. Removing part of the hemicellulose prior to the digester will increase the throughput potential of the pulping process. However, utilizing some of the hemicellulose as a sugar feedstock reduces the energy content of the pulping byproduct black liquor, which is an important renewable energy source for kraft pulp mills. In the future, to fully optimize the forest biorefinery, the economic and energy implications of diverting a portion of hemicellulose to other products will need to be balanced. The loss of this energy source can be offset by improved energy efficiency in the pulp and paper manufacturing process. New value streams could also be created through the implementation of alternative technologies for chemical recovery, such as gasification (see section 9.2). Ultimately, forest biorefineries would potentially use a combination of new technologies that result in more complete, energy efficient and cost-effective use of the wood feedstock, while expanding and diversifying the mill product slate. 9.2 Energy Implications Alternative Technologies Add a New Dimension to the Forest Biorefinery Today’s pulp mills that use the kraft pulping process are able to satisfy all of their steam needs and part of their electricity requirements via the chemical recovery process and the Tomlinson boiler. However, there are alternative technologies, such as gasification, that offer more efficient conversion of the organic materials in black liquor to energy and other products.
Gasification is the process of heating biomass or other carbonaceous materials in the absence of oxygen or with limited oxygen (usually one-third of the oxygen required for efficient combustion). The carbon materials are converted to a mixture of carbon monoxide and hydrogen gas called synthesis gas (syngas). In the case of black liquor gasification, the pulping chemicals would be recovered as a solid or smelt and be regenerated through further processing. The syngas could be combusted to generate power and steam using gas and steam turbines, or serve as a feedstock for valuable transportation fuels and chemicals via Fischer-Tropsch or other chemistries (NREL 2003).
Table 9-1. Potential Products from Residuals and Spent Pulping Liquors
Chemicals Acetic Acid Aldehydes Ammonia Dimethyl Ether Formaldehyde Methyl Tertiary Butyl Ether Mixed Alcohols Olefins
Fuels/Energy Gasoline Diesel Ethanol Methanol FT* Liquid Fuels Hydrogen Steam Electricity
*Fischer Tropsch
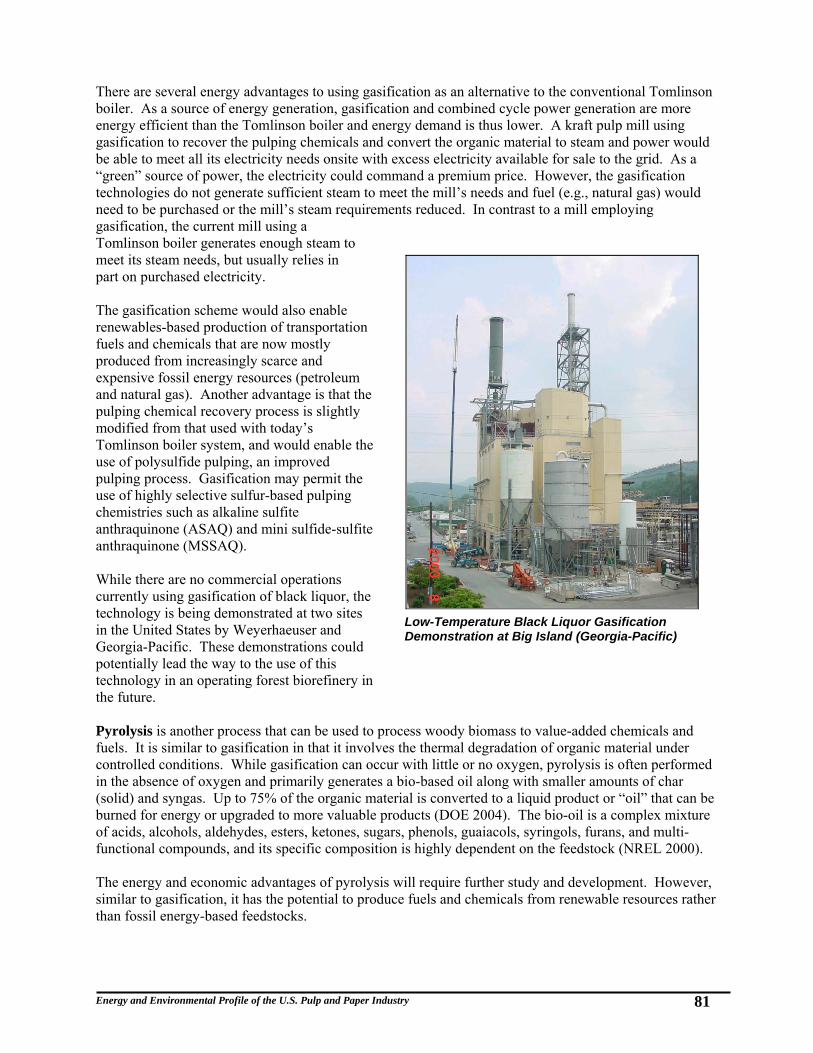
Energy and Environmental Profile of the U.S. Pulp and Paper Industry
81
There are several energy advantages to using gasification as an alternative to the conventional Tomlinson boiler. As a source of energy generation, gasification and combined cycle power generation are more energy efficient than the Tomlinson boiler and energy demand is thus lower. A kraft pulp mill using gasification to recover the pulping chemicals and convert the organic material to steam and power would be able to meet all its electricity needs onsite with excess electricity available for sale to the grid. As a “green” source of power, the electricity could command a premium price. However, the gasification technologies do not generate sufficient steam to meet the mill’s needs and fuel (e.g., natural gas) would need to be purchased or the mill’s steam requirements reduced. In contrast to a mill employing gasification, the current mill using a Tomlinson boiler generates enough steam to meet its steam needs, but usually relies in part on purchased electricity. The gasification scheme would also enable renewables-based production of transportation fuels and chemicals that are now mostly produced from increasingly scarce and expensive fossil energy resources (petroleum and natural gas). Another advantage is that the pulping chemical recovery process is slightly modified from that used with today’s Tomlinson boiler system, and would enable the use of polysulfide pulping, an improved pulping process. Gasification may permit the use of highly selective sulfur-based pulping chemistries such as alkaline sulfite anthraquinone (ASAQ) and mini sulfide-sulfite anthraquinone (MSSAQ). While there are no commercial operations currently using gasification of black liquor, the technology is being demonstrated at two sites in the United States by Weyerhaeuser and Georgia-Pacific. These demonstrations could potentially lead the way to the use of this technology in an operating forest biorefinery in the future. Pyrolysis is another process that can be used to process woody biomass to value-added chemicals and fuels. It is similar to gasification in that it involves the thermal degradation of organic material under controlled conditions. While gasification can occur with little or no oxygen, pyrolysis is often performed in the absence of oxygen and primarily generates a bio-based oil along with smaller amounts of char (solid) and syngas. Up to 75% of the organic material is converted to a liquid product or “oil” that can be burned for energy or upgraded to more valuable products (DOE 2004). The bio-oil is a complex mixture of acids, alcohols, aldehydes, esters, ketones, sugars, phenols, guaiacols, syringols, furans, and multi-functional compounds, and its specific composition is highly dependent on the feedstock (NREL 2000). The energy and economic advantages of pyrolysis will require further study and development. However, similar to gasification, it has the potential to produce fuels and chemicals from renewable resources rather than fossil energy-based feedstocks.
Low-Temperature Black Liquor Gasification Demonstration at Big Island (Georgia-Pacific)
Energy and Environmental Profile of the U.S. Pulp and Paper Industry
82
9.3 Environmental Impacts Forest Biorefineries Could Produce Fewer Emissions and Support Sustainable Forestry The overall environmental implications and life cycle of the forest biorefinery are still being studied. However, there could be a number of positive environmental impacts. For example, a forest biorefinery utilizing gasification (in a black liquor gasification combined cycle configuration) rather than a Tomlinson boiler is predicted to produce significantly fewer pollutant emissions due to the intrinsic characteristics of the BLGCC technology. Syngas clean-up conditioning removes a considerable amount of contaminants and gas turbine combustion is more efficient and complete than boiler combustion (Larson 2003). There could also be reductions in pollutant emissions and hazardous wastes resulting from cleaner production of chemicals and fuels that are now manufactured using fossil energy resources. In addition, it is generally accepted that production of power, fuels, chemicals and other products from biomass resources creates a net zero generation of carbon dioxide (a greenhouse gas), as plants are renewable carbon sinks (EPA 2004a). A key component of the forest biorefinery concept is sustainable forestry (see Chapter 1, Section 1.5). The forest biorefinery concept utilizes advanced technologies to convert sustainable woody biomass to electricity and other valuable products, and would support the sustainable management of forest lands. In addition, the forest biorefinery offers a productive value-added use for renewable resources such as wood thinnings and forestry residues as well as urban wood waste.

Energy and Environmental Profile of the U.S. Pulp and Paper Industry
83
Bibliography ADL 2000 Arthur D. Little, Inc., for the U.S. Department of Energy, Overview of Energy
Flow for Industries in SIC 20-39, (December 2000). AET 2003 Alliance for Environmental Technology, Trends in World Bleached Chemical
Pulp Production: 1990-2002, (2003), retrieved from http://www.aet.org/reports/market/aet_trends_2002.html.
AF&PA 2005 American Forest & Paper Association, (2005), retrieved from
http://www.afandpa.org. AF&PA 2005a American Forest & Paper Association, Recovered Paper Statistical Highlights,
2005 Edition, (2005), retrieved from http://www.afandpa.org. AF&PA 2004 American Forest & Paper Association, Sustainable Forestry Initiative: 9th Annual
Progress Report, (2004), retrieved from http://www.afandpa.org/Content/NavigationMenu/Environment_and_Recycling/SFI/Publications1/Current_Publications/Current_SFI_Publications.htm.
AF&PA 2004a American Forest & Paper Association, Paper, Paperboard & Wood Pulp: 2004
Statistics, Data through 2003, (2004). AF&PA 2002a American Forest & Paper Association, Paper, Paperboard & Wood Pulp: 2002
Statistics, Data through 2001, (2002). AF&PA 2002b American Forest & Paper Association, Sustainable Forestry Initiative®, (2002),
retrieved October 2004, from http://www.afandpa.org/Content/NavigationMenu/Environment_and_Recycling/SFI/SFI.htm.
AF&PA 1998a American Forest & Paper Association, Paper, Paperboard & Wood Pulp: 1998
Statistics Data through 1997, (1998). AF&PA 1998b American Forest & Paper Association, American Forest, Wood and Paper
Industry Gasification Combined Cycle Initiative, (1998), 32. AF&PA 1994 American Forest & Paper Association, Agenda 2020: A Technology Vision and
Research Agenda for America’s Forest, Wood and Paper Industry,(1994). Allman 2005 Allman, R., Ron Allman’s Faculty Homepage, Indiana University Southeast,
retrieved October 21, 2005, from http://homepages.ius.edu/RALLMAN/paper.gif. ASM 2001 U.S. Department of Commerce, Census Bureau, Annual Survey of Manufactures,
(2001 and prior years). Biermann 1996 Biermann, Christopher J., Handbook of Pulping and Papermaking, (1996).
CE 1981 Combustion Engineering, Inc., Combustion Power Systems 3rd Edition, (1981). Cody 1998 Cody, H.M., Multi-Roll Calendars Make Super-Calendar Quality On-Machine
Option, (Pulp & Paper Magazine, April 1998), 95.

Energy and Environmental Profile of the U.S. Pulp and Paper Industry
84
CPI 2004 Confederation of Paper Industries, Papermaking Process: Screening and
Cleaning, retrieved November 19, 2004, from http://www.paper.org.uk/info/process/screening.htm.
CV 2004a Climate VISION, Program Mission, retrieved November 29, 2004, from
http://www.climatevision.gov/mission.html. CV 2004b American Forest & Paper Association, Climate VISION Implementation Plan
(September 2004), retrieved November 29, 2004, from http://www.climatevision.gov/sectors/forest/work_plans.html.
CV 2003 Climate VISION, Climate Fact Sheet (October 2003), retrieved October 28, 2004,
from http://www.climatevision.gov/sectors/forest/index.html. Delimpasis 2001 Delimpasis, Kostas, Ozone Application for Wastewater Color Removal E-
Telescope (June 2001), retrieved October 18, 2004, from http://www.e-telescope.gr/en/cat04/art04_010601.htm.
Dence 1996 Dence, Carlton W. and Douglas W. Reeve, Pulp Bleaching: Principles and
Practice, (TAPPI Press, 1996). DOC 2004 U.S. Department of Commerce, U.S. Census Bureau, Foreign Trade Statistics,
November 2004, (2004). DOC 2001 U.S. Department of Commerce, 2001 Annual Survey of Manufacture: Statistics
for Industry Groups and Industries, (2001), M01(AS)–1. DOC 2001a U.S. Department of Commerce, Expenditures for Residential Improvements and
Repairs, (2001). DOC 2001b U.S. Department of Commerce, Value of Construction Put in Place Supplement,
(2001). DOC 1998 U.S. Department of Commerce, 1996 Annual Survey of Manufactures: Statistics
for Industry Groups and Industries, (1998), M96(AS)–1. DOC 1994 U.S. Department of Commerce, 1992 Annual Survey of Manufactures: Statistics
for Industry Groups and Industries, (1994), M92(AS)–1. DOE 2005 U.S. Department of Energy, Energy Information Administration, 2002
Manufacturing Energy Consumption Survey, (2003), retrieved March 8, 2005, from http://www.eia.doe.gov/emeu/mecs/.
DOE 2004 U.S. Department of Energy, Office of the Biomass Program, Thermochemical
Platform: Pyrolysis and Other Thermal Processing, retrieved November 16, 2004, from http://www.eere.energy.gov/biomass/pyrolysis.html.
DOE 2002 U.S. Department of Energy, Steam System Opportunity Assessment for the Pulp
and Paper, Chemical Manufacturing, and Petroleum Refining Industries, (2002), retrieved from http://www.eere.energy.gov/industry/bestpractices/pdfs/steam_assess_mainreport.pdf.

Energy and Environmental Profile of the U.S. Pulp and Paper Industry
85
DOE 2003 U.S. Department of Energy, Energy Information Administration, Manufacturing Trend Data: 1985-1998, (2003), retrieved from http://www.eia.doe.gov/emeu/efficiency/mecs_trend_tables/mecs_trend.htm.
DOE 1998a U.S. Department of Energy, Office of Industrial Technologies, Design and
Demonstration of Multiport Cylinder Dryers, (1998). DOE 1998b U.S. Department of Energy, Energy Information Administration, Manufacturing
Energy Consumption Survey 1998 (MECS), (1998), retrieved from http://www.eia.doe.gov/emeu/mecs/contents.html.
EBRD 2002 European Bank for Reconstruction and Development, Sub-sectoral
Environmental Guidelines: Pulp and Paper, (August 2002), retrieved October 27, 2004, from http://www.ebrd.com/about/policies/enviro/sectoral/main.htm.
EC 2003 Environment Canada, First Priority Substances List (PSL1): Effluents from Pulp
Mills Using Bleaching,, (September 2003), retrieved October 21, 2005, from http://www.ec.gc.ca/substances/ese/eng/psap/PSL1_bleached_pulp_mill_effluents.cfm.
EI 1988 Energetics Incorporated, for the U.S. Department of Energy, The U.S. Pulp and
Paper Industry: An Energy Perspective, (1988). EPA-TRI U.S. Environmental Protection Agency, TRI Explorer Online Service, retrieved
from http://www.epa.gov/triexplorer/chemical.htm. EPA 2005 U.S. Environmental Protection Agency, Voluntary Reporting of Greenhouse
Gases Program: Fuel and Energy Source Codes and Emission Coefficients, retrieved December 19, 2005, from http://www.eia.doe.gov/oiaf/1605/coefficients.html.
EPA 2004 U.S. Environmental Protection Agency, Office of Air & Radiation, National
Ambient Air Quality Standards (NAAQS), (October 2004), retrieved November 11, 2004, from http://www.epa.gov/air/criteria.html.
EPA 2004a U.S. Environmental Protection Agency, Climate Leaders Greenhouse Gas
Inventory Protocol: Direct Emissions from Stationary Combustion Sources, (2004), retrieved from http://www.epa.gov/climateleaders/resources/cross_sector.html.
EPA 2004b U.S. Environmental Protection Agency, Climate Leaders Greenhouse Gas
Inventory Protocol: Indirect Emissions from Purchase/Sales of Electricity and Steam, (2004), retrieved from http://www.epa.gov/climateleaders/resources/cross_sector.html.
EPA 2002 U.S. Environmental Protection Agency, Profile of the Pulp and Paper Industry
2nd Edition, (EPA Office of Compliance Sector Notebook Project, 2002), EPA 310-R-02-002.
EPA 1997a U.S. Environmental Protection Agency, EPA’s Final Pulp, Paper, and
Paperboard “Cluster Rule”– Overview, (Office of Water 4303, 1997), EPA-821-F-97-010.

Energy and Environmental Profile of the U.S. Pulp and Paper Industry
86
EPA 1997b U.S. Environmental Protection Agency, The Pulp and Paper Industry, the Pulping Process, and Pollutant Releases to the Environment, (Office of Water 4303, 1997), EPA-821-F-97-011.
EPA 1997c U.S. Environmental Protection Agency, The Environmental and Health Benefits
of the Final Pulp and Paper “Cluster Rule” and the Incentives Program, (Office of Water 4303, 1997), EPA-821-F-97-016.
EPA 1997d U.S. Environmental Protection Agency, Technical Support Document for Best
Management Practices for Spent Pulping Liquor Management, Spill Prevention, and Control, (1997).
EPA 1995 U.S. Environmental Protection Agency, Profile of the Lumber and Wood
Products Industry, (EPA Office of Compliance Sector Notebook Project ,1995) EPA 310-R-95-006.
EPA 1990 U.S. Environmental Protection Agency, Compilation of Air Pollutant Emission
Factors, 5th Edition, Volume 1, Chapter 10: Wood Products Industry, (September 1990), AP-42.
ESC 2005 Energy Solutions Center, Dryer Steam Can Photo, (2005), retrieved from
http://www.escenter.org. FR 1998 Office of the Federal Register, National Archives and Records Administration,
Federal Register Volume 63, (1998), 18504. Fleischman 2005 Personal communication with Elmer H. Fleischman, Idaho National Laboratory,
(2005). Gavelin 1998 Gavelin, Gunnar, Paper Machine Design and Operation – Description and
Explanations, (1998). Gottsching 2000 Gottsching, Lothar and Heikki Pakarinen, Papermaking Science and Technology
Book 7 Recycled Fiber and Deinking, (Fapet Oy in cooperation with the Finnish Engineers’ Association and TAPPI, 2000).
Gullichsen 1999a Gullichsen, Johan and Carl-Johan Fogelholm, Papermaking Science and
Technology Book 6A Chemical Pulping (Fapet Oy in cooperation with the Finnish Engineers’ Association and TAPPI, 1999).
Gullichsen 1999b Gullichsen, Johan and Carl-Johan Fogelholm, Papermaking Science and
Technology Book 6B Chemical Pulping, (Fapet Oy in cooperation with the Finnish Engineers’ Association and TAPPI, 1999).
ITA/DOC 2002 International Trade Administration, Trade and Economy: Data Analysis, (2002),
retrieved from http://www.ita.doc.gov/td/industry/otea/industry_sector/tables_naics.htm.
Jaccard 1996 MK Jaccard and Associates and Willis Energy Services Ltd., Industrial Energy
End-Use Analysis & Conservation Potential in Six Major Industries in Canada, (Pulp and Paper, March 1996), Chapter 3.
Lam 2000 Lam, Shirley, The Physics Factbook™: Density of Wood, (2000), retrieved
December 19, 2005, from http://hypertextbook.com/facts/2000/ShirleyLam.shtml.
Energy and Environmental Profile of the U.S. Pulp and Paper Industry
87
Larson 2003 Larson, E.D. (Princeton University), Consonni, S. (Politecnico di Milano), and
R.E. Katofsky (Nagivant Consulting, Inc.), A Cost-Benefit Assessment of Biomass Gasification Power Generation in the Pulp and Paper Industry – Final Report, (October 2003).
Lockie 1998 Lockie, Mark, Startling Possibilities Offered by New Webscanning Techniques
are among many Temptations for Today's Papermakers to get Automated, (Pulp & Paper International, August 1998), retrieved from http://www.paperloop.com/db_area/archive/ppi_mag/1998/9808/ppi3.htm.
LP 2000 Paper and Allied Trades, 2001 Lockwood-Post’s Director of the Pulp, (Paperloop
Publications, 2000). Luiten 2001 Luiten, Ester E.M., Beyond Energy Efficiency: Actors, Networks, and
Government Interventions in the Development of Industrial Process Technologies, (Ph.D. Thesis, Utrecht University, 2001), retrieved from http://www.chem.uu.nl/nws/www/publica/e2001-14.htm.
Martin 2000 N. Martin, N. Anglani, D. Einstein, M. Khrushch, E. Worrell, and L.K. Price,
Opportunities to Improve Energy Efficiency and Reduce Greenhouse Gas Emissions in the U.S. Pulp and Paper Industry, (July 2000).
McCubbin 1993 McCubbin, Neil, Environment and Competitiveness in the Pulp and Paper
Industry, (1993). MGH 1999 U.S. Department of Commerce and International Trade Administration, U.S.
Industry & Trade Outlook® ‘99, (1999). MFI 1998 Miller Freeman, Inc., 1999 North American Pulp & Paper Fact Book, (1999). Miner 1991 Miner, R. and J. Unwiu, Progress Reducing Water Use and Wastewater Loads in
the U.S. Paper Industry, (TAPPI Environmental Conference Proceedings, 1991). Moeller 1986 Moeller, D.J., and D. Kolp, Simpson Paper is Operating First Jet Engine
Cogeneration Plant in U.S., (Pulp & Paper, 1986), Vol. 4, 136. Nilsson 1995 Nilsson, Lars J., Larson, Eric D., Gilbreath, Kenneth R., and Ashok Gupta,
Energy Efficiency and the Pulp and Paper Industry – American Council for an Energy-Efficient Economy, (September 1995).
NRC 2005 Natural Resources Canada, The Model Kraft Market Pulp Mill, (2005), retrieved
September 12, 2005, from http://oee.nrcan.gc.ca/publications/infosource/pub/cipec/pulp-paper-industry/Section-01.cfm?text=N&printview=N.
NREL 2000 Diebold, J.P., A Review of the Chemical and Physical Mechanisms of the Storage
Stability of Fast Pyrolysis Bio-Oils, (January 2000). NREL/SR-570-27613. NREL 2003 Spath, P.L., and D.C. Dayton, Preliminary Screening –Technical and Economic
Assessment of Synthesis Gas to Fuels and Chemicals with Emphasis on the Potential for Biomass-Derived Syngas, (December 2003), NREL/TP-510-34929.
Paperloop 2003 Paperloop, Pulp & Paper 2002 North American Fact Book, (2003).

Energy and Environmental Profile of the U.S. Pulp and Paper Industry
88
Paperloop 2005 Paperloop, PaperHelp, (2005), retrieved November 2005, from
https://www.paperloop.com/pp_mag/paperhelp/homepage.shtml. Pekarovicova 2005 Pekarovicova, A., Chemical Pulping, (2005), retrieved November 3, 2005, from
http://www.wmich.edu/ppse/pekarovicova/130999.html. POW 2005 PaperOnWeb.com, Bleaching Sequences, (2005), retrieved October 21, 2005,
from http://www.paperonweb.com/bleach.htm. Roberts 2005 Personal communication with Mike Roberts, URS Corporation, (2005). Saltman 1998 Thompson, D.L.M., and K.M. Bennett, Pulp and Paper Primer 2nd Edition,
(TAPPI Press, 1998). Smook 1992 Smook, Gary A., Handbook for Pulp & Paper Technologists 2nd Edition, (1992). Springer 1993 Springer, Allan M. Industrial Environmental Control Pulp and
Paper Industry 2nd Edition, (TAPPI Press, 1993). Sundholm 1999 Sundholm, Jan, Gullichsen, Johan, and Pulapuro Hannu. Papermaking Science
and Technology Book 5 Mechanical Pulping, (Fapet Oy in cooperation with the Finnish Engineers’ Association and TAPPI Press, 1999).
TPS 2003 TAPPI, Solutions! For People, Processes and Paper, (November 2003), Volume
86. Thorp 2005 Personal communication with Benjamin A. Thorp, III, Pulp and Paper Industry
Consultant, (2005). Thorp 2004 Thorp, Benjamin A., and Del Raymond. Forest Biorefinery Could Open Door to
Bright Future for P&P Industry, (PaperAge, October 2004). Tucker 2005 Personal communication with Paul Tucker, International Paper, (2005). USDA 2005 Prestemon, J., Pye, J., Barbour, J., Smith, G.R., Ince, P., Steppleton, C., and W.
Xu, 2005 U.S. Wood-Using Mill Location , (September 2005), retrieved October 28, 2005, from http://www.srs.fs.usda.gov/econ/data/mills/mill2005htm.
USDA 2000 U.S. Department of Agriculture, Skog, Kenneth (Forest Service, Forest Products
Laboratory) and Geraldine Nicholson (Maryland Energy Administration), Carbon Sequestration in Wood and Paper Products – General Technical Report RMRS-GTR-59, (2000).
USDA 1979 U.S. Department of Agriculture and Forest Service, Forest Products Laboratory,
How to Estimate Recoverable Heat Energy in Wood or Bark Fuels, – General Technical Report FPL 29, (1979).
Waller 2002 Waller, Mike, Charge Measurement Sensors Offer New Opportunities for Better
Wet-End Control, (Pulp & Paper, March 2002), retrieved from http://www.paperloop.com/db_area/archive/p_p_mag/2002/0003/process_automation.htm.

Energy and Environmental Profile of the U.S. Pulp and Paper Industry
89