it services sector
TRANSCRIPT

Please refer to Disclosures and Disclaimers at the end of the Research Report
IT Services Sector Will The Party Continue ?
17 September 2013PhillipCapital (India) Pvt. Ltd.
Indian IT Services Sector – Tailwinds galore The Indian IT industry has had a dream‐run over the last six months. From the depreciating rupee adding to the margins to signs of revival in discretionary spending in US – the Indian IT companies never had it so good. Aiding these tailwinds has been the companies’ performance in terms of deal wins – the Indian IT companies have captured significant market share from the MNCs.
But not without its share of challenges However, we feel these tailwinds might be short‐lived or temporary in nature. The challenges that the industry faces – in form of tougher immigration laws being looked at by various countries or constantly evolving technology landscape in form of the new age technologies of CAMS (Cloud, Analytics, Mobile & Social) – are more fundamental in nature.
The Offshore Product Development (OPD) segment – an attractive domain India’s OPD exports grew to $1.4bn in FY13, growing faster than the industry average (CAGR of 15% over last five years), driven by Independent Software Vendors' (ISV) demand to improve time‐to‐market, enhance product features on‐the‐fly and adapt to new technologies. Effectively, the OPD companies have evolved from a project‐oriented low‐end support‐services provider into a strategic partnership role for their customers. As per NASSCOM, the OPD sector will grow by 18% over the next two years – outperforming the industry average.
Relatively better placed to exploit the changing environment As domestic unemployment rates rises in most developed countries, we expect more countries to implement stricter immigration laws. To counter its impact, IT companies will have to either start offshoring larger part of their development (does not augur well for the “Services” domain) or increase the proportion of local employees (significant erosion of margins). The OPD companies, on the other hand, offshore more than 80% of their effort and will be much better placed to mitigate the impact of these stricter immigration laws.
Also, the advent of disruptive technologies CAMS has redefined the entire IT landscape. The OPD firms have been ahead of their Services peers in harboring these technologies, and already have gained a clear headstart. In our opinion, the first mover advantage in these highly technical domains, will enable them to outperform the Services companies, over the next decade.
Key Recommendations We recommend BUY on TCS and HCL Tech – both the companies having a perfectly balanced portfolio and outperformed their peers in all respect. Wipro continues to battle with its management woes, but seems to be showing early signs of revival. And finally the risk‐reward profile for Infosys does not look attractive, with the recent exodus of key management personnel and the company lagging its peers in terms of adapting to new technologies. We recommend NEUTRAL on Infosys and Wipro.
In the OPD domain, we initiate coverage with BUY rating on Persistent Systems and KPIT Technologies – both the companies having carved out a niche for themselves and looking much better placed to exploit their early mover advantage in the CAMS domain and mitigate the impact of stricter immigration laws.
Companies Covered Tata Consultancy Services CMP Rs1902Reco BUYTarget Price Rs2223Upside 17% HCL Technologies CMP Rs997Reco BUYTarget Price Rs1256Upside 26% Infosys CMP Rs2992Reco NEUTRALTarget Price Rs2800Downside ‐6% Wipro CMP Rs451Reco NEUTRALTarget Price Rs486Upside 8% Persistent Systems CMP Rs574Reco BUYTarget Price Rs700Upside 22% KPIT Technologies CMP Rs135Reco BUYTarget Price Rs170Upside 27% Relative Positioning (FY14E)
Infosys
TCS
HCL
Wipro
PSYS
KPIT
0
5
10
15
20
0 10 20 30 40 50
P/E (X)
ROE (%)
Vibhor Singhal (+ 9122 6667 9949) [email protected] Varun Vijayan (+ 9122 6667 9992) [email protected]

2 of 67
17 September 2013 / INDIA EQUITY RESEARCH / IT SERVICES SECTOR UPDATE
Table of Contents Indian IT Services – Tailwinds galore ∙∙∙∙∙∙∙∙∙∙∙∙∙∙∙∙∙∙∙∙∙∙∙∙∙∙∙∙∙∙∙∙∙∙∙∙∙∙∙∙∙∙∙∙∙∙∙∙∙∙∙∙∙∙∙∙∙∙∙∙∙∙∙∙∙∙∙∙∙∙∙∙∙ 3
IT spends to report muted growth, competition to intensify ∙∙∙∙∙∙∙∙∙∙∙∙∙∙∙∙∙∙∙∙∙∙∙∙∙∙∙∙∙∙∙∙∙∙∙ 5
Indian IT Services – Challenges ahead ∙∙∙∙∙∙∙∙∙∙∙∙∙∙∙∙∙∙∙∙∙∙∙∙∙∙∙∙∙∙∙∙∙∙∙∙∙∙∙∙∙∙∙∙∙∙∙∙∙∙∙∙∙∙∙∙∙∙∙∙∙∙∙∙∙∙∙∙∙∙∙ 6
Global Products market and Offshoring ∙∙∙∙∙∙∙∙∙∙∙∙∙∙∙∙∙∙∙∙∙∙∙∙∙∙∙∙∙∙∙∙∙∙∙∙∙∙∙∙∙∙∙∙∙∙∙∙∙∙∙∙∙∙∙∙∙∙∙∙∙∙∙∙∙∙∙∙ 7
Evolution of the OPD Sector ∙∙∙∙∙∙∙∙∙∙∙∙∙∙∙∙∙∙∙∙∙∙∙∙∙∙∙∙∙∙∙∙∙∙∙∙∙∙∙∙∙∙∙∙∙∙∙∙∙∙∙∙∙∙∙∙∙∙∙∙∙∙∙∙∙∙∙∙∙∙∙∙∙∙∙∙∙∙∙∙∙∙∙∙∙∙ 9
Summary of recommendations ∙∙∙∙∙∙∙∙∙∙∙∙∙∙∙∙∙∙∙∙∙∙∙∙∙∙∙∙∙∙∙∙∙∙∙∙∙∙∙∙∙∙∙∙∙∙∙∙∙∙∙∙∙∙∙∙∙∙∙∙∙∙∙∙∙∙∙∙∙∙∙∙∙∙∙∙∙∙∙∙∙ 13
Companies Section Tata Consultancy Services ∙∙∙∙∙∙∙∙∙∙∙∙∙∙∙∙∙∙∙∙∙∙∙∙∙∙∙∙∙∙∙∙∙∙∙∙∙∙∙∙∙∙∙∙∙∙∙∙∙∙∙∙∙∙∙∙∙∙∙∙∙∙∙∙∙∙∙∙∙∙∙∙∙∙∙∙∙∙∙∙∙∙∙∙∙∙∙∙∙ 16
HCL Technologies ∙∙∙∙∙∙∙∙∙∙∙∙∙∙∙∙∙∙∙∙∙∙∙∙∙∙∙∙∙∙∙∙∙∙∙∙∙∙∙∙∙∙∙∙∙∙∙∙∙∙∙∙∙∙∙∙∙∙∙∙∙∙∙∙∙∙∙∙∙∙∙∙∙∙∙∙∙∙∙∙∙∙∙∙∙∙∙∙∙∙∙∙∙∙∙∙∙∙∙∙∙∙ 23
Infosys ∙∙∙∙∙∙∙∙∙∙∙∙∙∙∙∙∙∙∙∙∙∙∙∙∙∙∙∙∙∙∙∙∙∙∙∙∙∙∙∙∙∙∙∙∙∙∙∙∙∙∙∙∙∙∙∙∙∙∙∙∙∙∙∙∙∙∙∙∙∙∙∙∙∙∙∙∙∙∙∙∙∙∙∙∙∙∙∙∙∙∙∙∙∙∙∙∙∙∙∙∙∙∙∙∙∙∙∙∙∙∙∙∙∙∙∙∙∙ 31
Wipro ∙∙∙∙∙∙∙∙∙∙∙∙∙∙∙∙∙∙∙∙∙∙∙∙∙∙∙∙∙∙∙∙∙∙∙∙∙∙∙∙∙∙∙∙∙∙∙∙∙∙∙∙∙∙∙∙∙∙∙∙∙∙∙∙∙∙∙∙∙∙∙∙∙∙∙∙∙∙∙∙∙∙∙∙∙∙∙∙∙∙∙∙∙∙∙∙∙∙∙∙∙∙∙∙∙∙∙∙∙∙∙∙∙∙∙∙∙∙∙∙∙ 40
Persistent Systems ∙∙∙∙∙∙∙∙∙∙∙∙∙∙∙∙∙∙∙∙∙∙∙∙∙∙∙∙∙∙∙∙∙∙∙∙∙∙∙∙∙∙∙∙∙∙∙∙∙∙∙∙∙∙∙∙∙∙∙∙∙∙∙∙∙∙∙∙∙∙∙∙∙∙∙∙∙∙∙∙∙∙∙∙∙∙∙∙∙∙∙∙∙∙∙∙∙∙∙∙ 46
KPIT Technologies ∙∙∙∙∙∙∙∙∙∙∙∙∙∙∙∙∙∙∙∙∙∙∙∙∙∙∙∙∙∙∙∙∙∙∙∙∙∙∙∙∙∙∙∙∙∙∙∙∙∙∙∙∙∙∙∙∙∙∙∙∙∙∙∙∙∙∙∙∙∙∙∙∙∙∙∙∙∙∙∙∙∙∙∙∙∙∙∙∙∙∙∙∙∙∙∙∙∙∙∙∙∙ 55

3 of 67
17 September 2013 / INDIA EQUITY RESEARCH / IT SERVICES SECTOR UPDATE
Indian IT Services – Tailwinds galore The Indian IT industry has had a dream‐run over the last 6‐8 months. From the depreciating rupee adding to the margins to signs of revival in discretionary spending in US – the Indian IT companies never had it so good. Stalwarts like TCS and HCL Tech are beating their own targets, and reporting strong growth in all verticals, across geographies. On the other hand, Infosys and Wipro too seem to be finally getting their act together, and are likely to tread the recovery path. Mid‐cap companies too, are reporting strong revenue growth and margin expansion.
Consistent performance by the giants ….. ….. and aptly rewarded by the market too
25%
25%
26%
26%
27%
27%
0
5
10
15
20
25
30
35
FY10 FY11 FY12 FY13
US$bn
Top 4 ‐US$ revenuesTop 4 Avg EBITDA margins %
50
100
150
200
250
300
Apr‐10 Oct‐10 Apr‐11 Oct‐11 Apr‐12 Oct‐12 Apr‐13
HCL Tech Infosys
TCS Wipro
BSE Sensex
Source: Company, PhillipCapital India Research
Strong FX tailwinds to boost growth Driven by the deteriorating domestic economic condition and the widening Current‐account deficit, the Indian Rupee has fallen 15% since April‐2013, against USD. This augurs extremely for the IT companies, who directly benefit from Rupee depreciation – an expansion of 30‐50bps in margins for every 100bps depreciation in Rupee. Our economist expects the Rupee to stabilize at levels close to 64‐65 for the remaining part of FY14, taking the average USD‐INR rate to 63 for FY14. For FY15, we assume the Rupee to partially regain its lost ground, and average at Rs62/$.
Margin impact of 100bps depreciation in Rupee vs USD Rupee has lost significantly against major global currencies
22
37 36
30
52
42
10
15
20
25
30
35
40
45
50
55
Infosys TCS Wipro HCL tech KPIT Cummins
Persistent Systems
Chnage
in margins (bps)
For every 1% change in Re
90
100
110
120
130
Jan‐13 Mar‐13 May‐13 Jul‐13
INR/USD INR/GBP INR/EURO
Source: Bloomberg, PhillipCapital India Research

4 of 67
17 September 2013 / INDIA EQUITY RESEARCH / IT SERVICES SECTOR UPDATE
Grabbing market share from global peers While the developed world has been grappling with recession, leading to reduced discretionary spending by most corporate, we note that the Indian IT companies have performed much better than their global counterparts – in many cases, grabbing market share from the latter. The higher offshoring model provides them better margins than global peers, and hence headroom to win more deals. Also, the technical expertise developed through long standing relationships with clients in various domains has helped the Indian IT companies become the ‘partner by choice’ rather than ‘partner by default’. Indian companies have consistently outperformed the MNCs over last four quarters
‐2,000
‐1,000
0
1,000
2,000
3,000
4,0001Q
FY10
2QFY10
3QFY10
4QFY10
1QFY11
2QFY11
3QFY11
4QFY11
1QFY12
2QFY12
3QFY12
4QFY12
1QFY13
2QFY13
3QFY13
4QFY13
1QFY14
US$
M
Indian Vendors (IVs) MNC Vendors (MVs)
Consistent revenue addition from Indian IT vendors, while MNCs shakes up..
IVs outruns MNCs on revenue adds
IVs outruns MNCs on revenue adds
An upsurge in MNCs revenue
Source: PhillipCapital India Research
Indian IT companies enjoy a significant room in margins, as compared to global peers
7%
9%
11%
13%
15%
17%
19%
21%
23%
25%
FY8 FY9 FY10 FY11 FY12 FY13
Indian IT Avg margins %
MNC Avg margins %
Source: PhillipCapital India Research
However, we feel these tailwinds might be short‐lived or temporary. On the other hand, the challenges that the industry is staring at, are more prolonged, and fundamental in nature. Be it the western world recession and its after effects, or shoestring budgets limiting the discretionary spend of corporate, constantly evolving customer demands and technology landscape or volatile currency market clouding the growth and profitability potential.

5 of 67
17 September 2013 / INDIA EQUITY RESEARCH / IT SERVICES SECTOR UPDATE
IT spends to report muted growth, competition to intensify Gartner estimates CY2013 to have a better spends growth than that of CY12 in terms of overall technology spends as well as global IT Services spends. It suggests that spends on IT hardware would slowdown while mobile equipments and telecom hardware could see a surplus growth for the year. In IT space, it predicts growth from non‐traditional services which includes new age technology such as Cloud, Mobility, Social Media and Analytics. Though IT budget growth expectation remains muted in CY13, Indian vendors would be able to grow at a higher pace with penetration levels in emerging services and gains in marketshare from that of their MNC counterparts. Gartner estimates mellow spends growth for CY13 Particulars 2008 2009 2010 2011 2012 2013E 2014P
Global tech spending ($ Tn) 3.5 3.3 3.4 3.7 3.7 3.8 3.9growth % ‐6.5 3.5 7.4 1.1 2.2 4.0Global IT Services revenues ($bn) 806 769 793 846 890 926 968growth % ‐4.6 3.1 6.7 5.2 4.0 4.5
Source: Gartner estimates
While MNCs such as Accenture and IBM are facing slow down in its key service lines – Consulting and Enterprise services – TCS and HCL Tech have been gaining on them in regions such as Europe and emerging markets in the same horizontals. To meet regulatory norms, industries are outsourcing most of their IT functions to low cost vendors from India – of which TCS is a front runner. Deal flow data has been declining over the past few quarters
5.4
4.4
5.6
6.5
5.4
6
5.4 5.24.9
3.6
0.60.9
1.51.8
0.9
2.1
1.51.2 1.2
0.7
50
100
150
200
250
300
350
400
0
1
2
3
4
5
6
7
1Q'11 2Q'11 3Q'11 4Q'11 1Q'12 2Q'12 3Q'12 4Q'12 1Q'13 2Q'13
US$
bn
Global Market ‐ACV (LHS)Mega deals ‐ACV (LHS)No of deals ‐ (RHS)
Source: ISG data ‐ TPI index
Deal flow data from ISG shows a constant decline in the Total Contract Value (TCV) as well as Annual Contract Value (ACV) of the mega deals awarded in the past five quarters. While this points to a dismal future for the industry as a whole, we note that the ISG data does not include: 1) Deal with ACV < $5mn and TCV < $25mn 2) Renegotiation/Scope‐expansion of existing deals With the recovery in US and European corporate opening to outsourcing for the first time (driven by cost pressures), we expect the deal flow to improve over the next few quarters. We also note that over the next two years, a lot of the contracts with the Indian vendors are coming up for renewal, which will lead to further enhancement of the orderbooks.

6 of 67
17 September 2013 / INDIA EQUITY RESEARCH / IT SERVICES SECTOR UPDATE
Indian IT Services – Challenges ahead Inspite of performing better than their global counterparts, the Indian IT services industry is not without its own share of concerns, many of which bring the growth prospects of the entire industry into question. While few companies like TCS and HCL Technologies have been able to weather the storm and have constantly surprised the markets positively, the malaise has been much widespread. Few of the major issues that the Indian IT Services industry faces, and which have the potential to change the landscape of this industry, in our opinion, are: 1. Tougher immigration laws being (or will be) looked at, by various countries As domestic unemployment rates reach unprecedented highs in most developed countries, we expect more countries to join the US, in implementing stricter immigration laws. To counter their impact, most of IT companies will have to either start offshoring larger part of their development (which might not augur well for the “Services” domain) or increase the proportion of local employees in their workforce (which will lead to significant erosion of margins). 2. Advent of the new technologies CAMS (Cloud, Analytics, Mobility & Social) With the introduction of disruptive technologies like cloud and mobility, the traditional IT business model has gone for a toss. Solutions like SaaS, PaaS and IaaS have enabled the SMBs to scale‐up resources at minimal cost. Both Oracle and SAP have registered a sluggish demand for new license in the last two quarters and have guided for a muted growth in CY13 – primarily due to growth of cloud computing. License sales have historically acted as a leading indicator of growth momentum for the Services companies. Also most corporate now want to migrate their applications to a platform compatible with new age technologies – mobile and social network. These remain highly technical fields, and companies will have to develop strong expertise and domain knowledge, to be able to offer solutions in the same. Lastly, all this has led to a surge in the amount of data available, and hence, increased demand for predictive data analytics. 3. Difficult to move up the ladder to products / consulting functions Intellectual Property (IP) led revenues offer much higher margins than traditional application development jobs, apart from sustainable source of revenue, over a longer period of time. However, ADM or ERP applications for BFSI or Manufacturing, are hardly laden with any high technical requirement, so as to enable the companies develop their niche in any domain. This has been the primary reason behind the big IT Services companies failing to make it big in the IT Products domain. We believe these companies will find it very difficult to change their DNA, and move‐up the value chain to higher IP led revenues.
It is in the wake of the above concerns, that we feel that Indian OPD segment will outperform the traditional IT Services segment. The Indian OPD segment has grown at a robust CAGR of 15% over the last five years, and we expect it to grow by a CAGR of over 18% (NASSCOM estimates) over the next two years. At the same time, the Indian IT Services segment, facing multiple headwinds, is expected to grow by a CAGR of 14% only, over the next two years (NASSCOM estimates). We see the business model of the Indian OPD companies, much more geared to face these headwinds.

7 of 67
17 September 2013 / INDIA EQUITY RESEARCH / IT SERVICES SECTOR UPDATE
Global Products market and Offshoring The global software product market forms ~20% of the overall global IT industry. The total software product spend in CY11 was $335bn – 20% of the total $1.7trn IT spend. CY11 also saw the emergence of software products from the depths of recession – growing by 6% over CY10 as companies adopted the new technologies (read CAMS) to tread the waters. The year also saw renewed demand for global outsourcing – growing by 12% over CY10 – twice as much as the overall product market. Global Software Product Development market
313 309331
353374 391
‐2%
‐1%
0%
1%
2%
3%
4%
5%
6%
7%
8%
0
50
100
150
200
250
300
350
400
450
2008 2009 2010 2011 2012 2013E
In US$
bn
Global software spendinggrowth %
Source: Bloomberg
India’s OPD exports crossed $1bn in FY11 and grew to $1.4bn in FY13 – growing faster than the industry growth of 17%. Over the last five years, it has grown at a CAGR of 15%, and as per NASSCOM estimates, it will grow by 18% over the next two years – again outperforming the IT Services (14%). Indian OPD exports growth has been a shade ahead of the average industry growth
16%
5%
19% 16%
10%15%
5%
19%
27%
10%
0%
5%
10%
15%
20%
25%
30%
FY9 FY10 FY11 FY12 FY13
Indian IT exports growth OSPD exports growth
Source: NASSCOM
Though most MNCs (like Microsoft, Facebook) have mainly offshored product development to their ‘own’ GICs (Global In‐house Centers), third party firms have also been making an increasingly significant contribution – enabling the Independent Software Vendors (ISV) to improve time‐to‐market, enhance product features on‐the‐fly, adapt existing products to new technologies etc. Also, long term exposure to clients’ products has enabled them to develop their own set of innovative product accelerators. Effectively, the third party OPD companies have matured into a strategic partnership role

8 of 67
17 September 2013 / INDIA EQUITY RESEARCH / IT SERVICES SECTOR UPDATE
for their customers – acting as an extended R&D and marketing team for them. We see the relationship only strengthening over the next decade. The Indian OPD market – geared up for the big leap The Indian OPD market has benefitted from both demand and supply side dynamics. There is an ever increasing demand from the ISVs for new product developments, maintenance of legacy products, reduce time‐to‐market for new launches, and re‐engineer product architecture to the new technologies. At the same time, the technological and domain expertise of the OPD firms have meant that these firms are now acting both as consultants and marketing partners – helping customers develop technology roadmap to remain in sync with the rapidly evolving market. And finally, at the center of it all, is the growing proliferation of technologies like cloud computing, data analytics, mobility and social media (CAMS) – especially for the SMBs (Small‐Medium Businesses), which are seeking to leverage these new age technologies to scale‐up resources at minimal cost.
Demand‐Supply side dynamics for the OPD market
• ISV’s: New product development, maintenance of legacy products
• Re‐engineering product architecture to emerging technologies
• SMBs and Industrial clients
• Cloud computing, Mobility, Analytics –expand customer reach, better user insights
• Shorter product lifecycles, faster, on‐the‐fly product upgrades, faster time‐to‐market pressures
• Large number of product releases in the near future
• Consumer‐centric verticals, enterprise application driving growth
• Cloud, Mobility, Big Data/Analytics, Social Media driving new product development
• Legacy systems: Upgradation and migration to new platforms – cloud, mobility
• Verticalised solutions
Service ProvidersCustomers
Market Dirvers
Source: NASSCOM
Client profile of the Indian OPD vendors
Industrial, 20% ISV, 80%
US, 75% Europe, 15%
RoW, 10%
Customer mkt
Geographic mkt
Source: NASSCOM

9 of 67
17 September 2013 / INDIA EQUITY RESEARCH / IT SERVICES SECTOR UPDATE
Evolution of the Indian OPD sector Over the last decade, the Indian OPD firms have evolved from project‐oriented low‐end support‐services provider to an end‐to‐end strategic partner for its clients. The OPD firms started with their USP as providing cost‐arbitrage through product support, helpdesk and testing services. Today, the companies have developed technological and domain expertise to move‐up the value chain, and provide support as well as innovative solutions across the entire product lifecycle. The recent global recession has forced the ISVs to increase their focus on core competencies and end user markets. At the same time, disruptive technologies like cloud, mobility and social media are changing the way business is done. Each of these requires specific technical expertise – which is both time and effort consuming as well as expensive. To mitigate the same, the companies have realized importance and necessity of offshoring more and more activities of their product development process. As a result, the scope of services has evolved dramatically for the OPD firms, over the last five years. The OPD firms now form an integral part of the product development team, with their involvement including product designing, prototyping, product development and also, in few recent cases, marketing the product to the end customer.
Evolution of the OPD market
Product support• Helpdesk, technical• Training• Environment support
Testing• Product & Interoperability• Performance & Load• CertificationProfessional Services• Product Implementation• Product Support• Product Customization+ Product Support
Product management• Requirements gathering• Requirement specification• Proof of concept & prototyping• Product roadmapProduct development• Co‐development• Product globalizationUsability engineeringProduct documentationProduct Advancement &Sustenance• Product enhancements• Sustenance services• App maintenanceProduct re‐engineering• Legacy migration• Porting services• Technology refresh+ Testing + Professional Services + Product Support
New product development• Build & release management• Architecture, Design,• Development & testingIntegration• Architecture & planning• Adaptor development• Enterprise app integrationEmerging market focus• Emerging market initiatives• Business P&L for emg marketsProgram management• Vendor management• Business model consultingInnovation: IP generation+ Product management+ Product development+ Usability engineering+ Product documentation+ Product Advancement + Sustenance+ Product re‐engineering+ Testing + Professional Services + Product Support
2008 onwards
2004‐08
2000‐04
2000
Customer Benefits
• Reduced cost, better ROI
• Faster time to market• Continued focus on core competence development
Source: NASSCOM
10 of 67
17 September 2013 / INDIA EQUITY RESEARCH / IT SERVICES SECTOR UPDATE
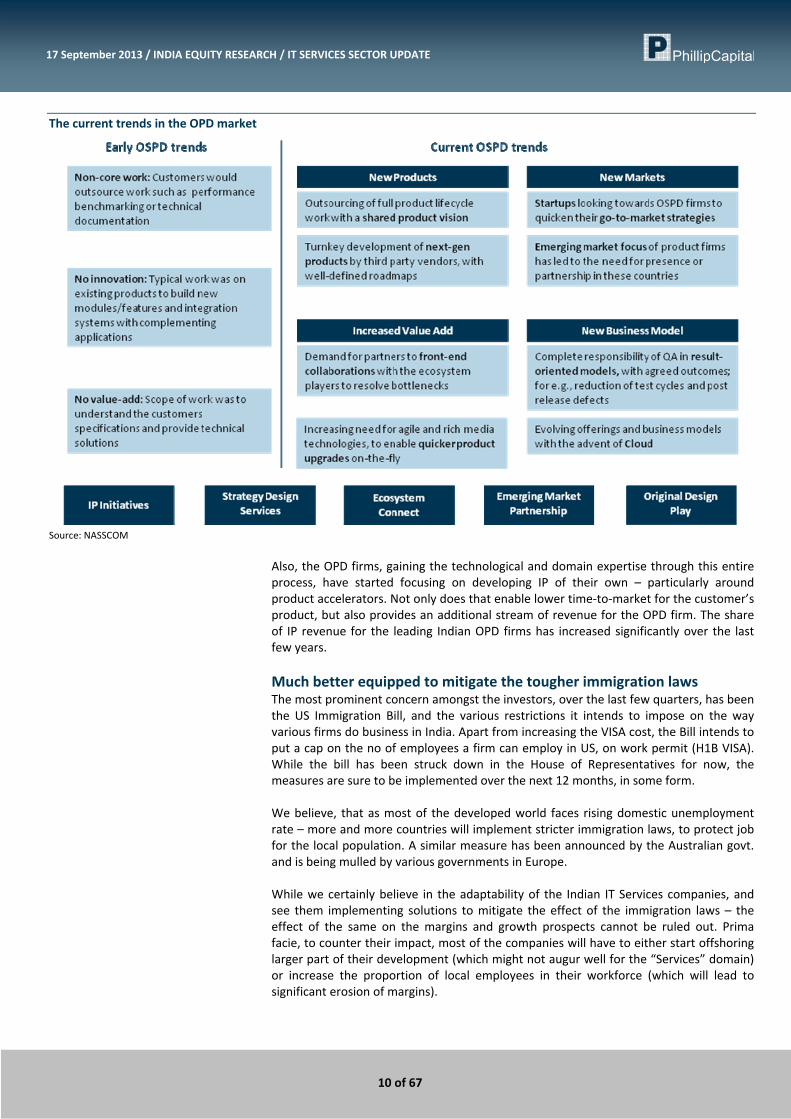
The current trends in the OPD market
Source: NASSCOM
Also, the OPD firms, gaining the technological and domain expertise through this entire process, have started focusing on developing IP of their own – particularly around product accelerators. Not only does that enable lower time‐to‐market for the customer’s product, but also provides an additional stream of revenue for the OPD firm. The share of IP revenue for the leading Indian OPD firms has increased significantly over the last few years. Much better equipped to mitigate the tougher immigration laws The most prominent concern amongst the investors, over the last few quarters, has been the US Immigration Bill, and the various restrictions it intends to impose on the way various firms do business in India. Apart from increasing the VISA cost, the Bill intends to put a cap on the no of employees a firm can employ in US, on work permit (H1B VISA). While the bill has been struck down in the House of Representatives for now, the measures are sure to be implemented over the next 12 months, in some form. We believe, that as most of the developed world faces rising domestic unemployment rate – more and more countries will implement stricter immigration laws, to protect job for the local population. A similar measure has been announced by the Australian govt. and is being mulled by various governments in Europe. While we certainly believe in the adaptability of the Indian IT Services companies, and see them implementing solutions to mitigate the effect of the immigration laws – the effect of the same on the margins and growth prospects cannot be ruled out. Prima facie, to counter their impact, most of the companies will have to either start offshoring larger part of their development (which might not augur well for the “Services” domain) or increase the proportion of local employees in their workforce (which will lead to significant erosion of margins).

11 of 67
17 September 2013 / INDIA EQUITY RESEARCH / IT SERVICES SECTOR UPDATE
On the other hand, the OPD companies do not require significant onsite presence and can work with larger share of their effort being offshored. Even now, over 92% of workforce for PSYS and 85% for KPIT are based at offshore locations. OPD companies are able to offshore much more than the Services companies
25.9%26.9% 27.5% 27.3%
10.2%11.5% 12.4%
13.3%
8%
13%
18%
23%
28%
33%
FY10 FY11 FY12 FY13
Top 4 onsite efforts OSPD onsite efforts
Source: Company, PhillipCapital India Research
In near or distant future, the stricter immigration laws across the globe, is a reality that the IT industry will have to embrace, and implementing a mitigation strategy for the same could prove to be much more expensive for the IT Services firms, than the OPD firms. This, in our opinion, will lead to a significant outperformance of the OPD companies, over the Services companies over the next three – five years, and hence drive their rerating. The game changer – CAMS The last decade has brought forth disruptive technologies like cloud and mobility, which have the potential to redefine the entire IT landscape. The OPD firms have been ahead of their Services peers in harboring these technologies, and already have gained a clear headstart. In our opinion, the first mover advantage in these highly technical domains, will enable them to outperform the Services companies, which are still coming to terms with the new domains. Cloud Computing: Cloud computing has hit the enterprise solution firms like Oracle and SAP the hardest – with both the companies downgrading their guidance for CY13. Taking that as the lead indicator, we expect Enterprise Application Development domain to be badly hit over the next few years and hence the companies which derive a large part of their revenue from the same (Infosys, Wipro). The very nature of the Cloud‐computing model – its OPEX based, multi‐tenancy, ubiquitous, scalable and elastic delivery mechanism – has attracted the SMB segment, who wants to scale‐up resources at minimal cost, and pay only for what they use. OPD firms have been way ahead of their Services peers in building cloud competencies and setting up CoEs (Centre of Excellence) for R&D. They are increasingly partnering with ISVs to build cloud infrastructure software and various tolls and solutions to help migrate the existing products to cloud environment. Mobility: The convergence of mobility and Web has been facilitated by the rapid penetration of mobile connectivity and advent of smartphones. This has opened up new avenues for ISVs to develop mobile solutions, as extensions to their various enterprise applications. As more and more corporate feel the ‘need’ to stay connected while they are ‘mobile’, the potential for mobility solutions cannot be ignored.
27% of the workforce of the top four companies is currently employed onsite, as compared to 13% for the OPD companies
PSYS launched its first cloud based application in 2007. On the other hand, stalwarts like Infosys, have been slow to develop expertise in these domains.
12 of 67
17 September 2013 / INDIA EQUITY RESEARCH / IT SERVICES SECTOR UPDATE
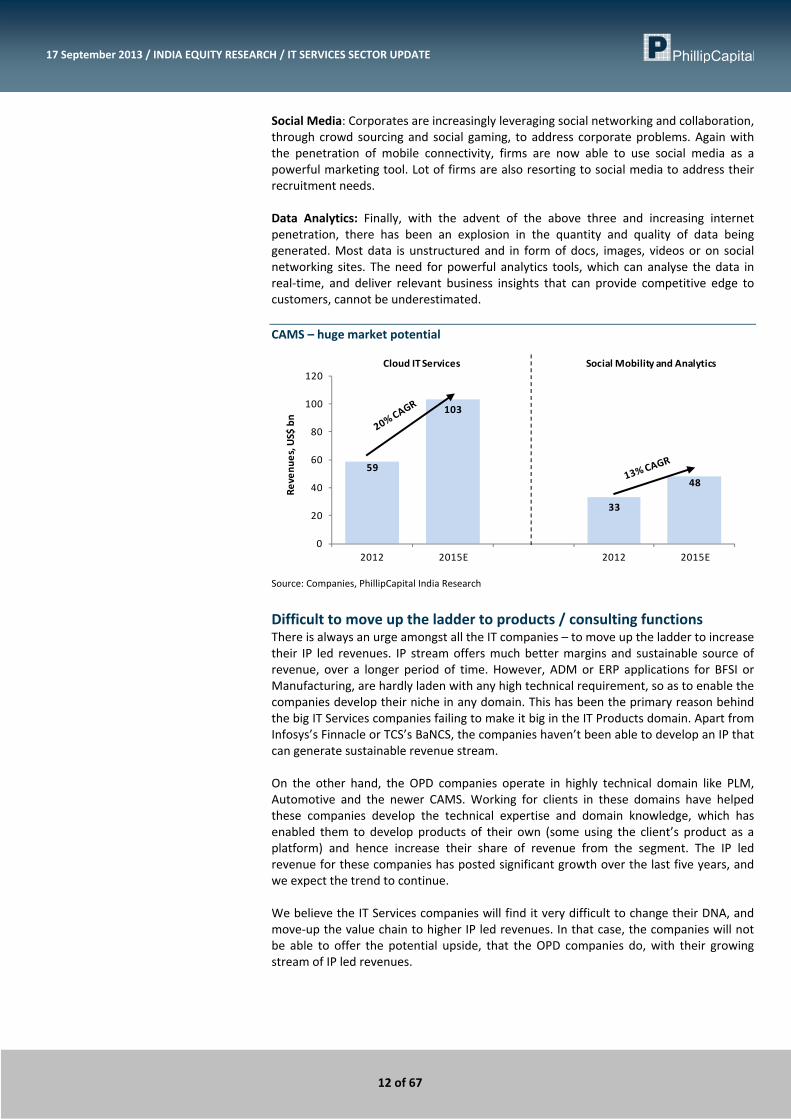
Social Media: Corporates are increasingly leveraging social networking and collaboration, through crowd sourcing and social gaming, to address corporate problems. Again with the penetration of mobile connectivity, firms are now able to use social media as a powerful marketing tool. Lot of firms are also resorting to social media to address their recruitment needs. Data Analytics: Finally, with the advent of the above three and increasing internet penetration, there has been an explosion in the quantity and quality of data being generated. Most data is unstructured and in form of docs, images, videos or on social networking sites. The need for powerful analytics tools, which can analyse the data in real‐time, and deliver relevant business insights that can provide competitive edge to customers, cannot be underestimated. CAMS – huge market potential
59
103
33
48
0
20
40
60
80
100
120
2012 2015E 2012 2015E
Revenu
es, U
S$ bn
Cloud IT Services Social Mobility and Analytics
Source: Companies, PhillipCapital India Research
Difficult to move up the ladder to products / consulting functions There is always an urge amongst all the IT companies – to move up the ladder to increase their IP led revenues. IP stream offers much better margins and sustainable source of revenue, over a longer period of time. However, ADM or ERP applications for BFSI or Manufacturing, are hardly laden with any high technical requirement, so as to enable the companies develop their niche in any domain. This has been the primary reason behind the big IT Services companies failing to make it big in the IT Products domain. Apart from Infosys’s Finnacle or TCS’s BaNCS, the companies haven’t been able to develop an IP that can generate sustainable revenue stream. On the other hand, the OPD companies operate in highly technical domain like PLM, Automotive and the newer CAMS. Working for clients in these domains have helped these companies develop the technical expertise and domain knowledge, which has enabled them to develop products of their own (some using the client’s product as a platform) and hence increase their share of revenue from the segment. The IP led revenue for these companies has posted significant growth over the last five years, and we expect the trend to continue. We believe the IT Services companies will find it very difficult to change their DNA, and move‐up the value chain to higher IP led revenues. In that case, the companies will not be able to offer the potential upside, that the OPD companies do, with their growing stream of IP led revenues.

13 of 67
17 September 2013 / INDIA EQUITY RESEARCH / IT SERVICES SECTOR UPDATE
Summary of recommendations TCS – BUY – On a different planet altogether TCS has consistently outperformed all its peers, across almost all parameters – posting $ revenue growth of 17.8% (CAGR) over 5 years, with margin expansion of 300bps. In the medium term, we expect the Rupee depreciation and robust deal wins to help it beat street expectations. Over longer term, its higher investment in S&M and early mover advantage in the CAMS domain, should boost it far ahead of peers. TCS stock has run‐up significantly run in the last few months (6m, +28%), driven by its robust operating performance, deal wins and rupee depreciation. We remain positive on the stock, and view it as an attractive investment, inspite of the recent run‐up and perceived rich valuations. Infosys – NEUTRAL – Miles to go before … Post its 1QFY14 results, which were at best, in‐line with expectations, Infosys stock has surged 22% ‐ partly aided by the depreciating Rupee. It currently trades at 16x FY14 and 14x FY15 earnings – still too high a multiple, in our opinion, considering the risk to future earnings and the inadequate gap in valuation with TCS (19x FY14 and 16x FY15). We have a negative stand on the stock, and view the exodus of key employees, lower revenue share of emerging technologies and margin contraction expected on the back of higher S&M spend pose significant risk to the earnings. HCL Technologies – BUY – Perfecting the balancing act HCL has a very balanced portfolio, with ES and IMS forming 47% and 32% of topline respectively. ES (highly related to discretionary spending) has grown by 21% CAGR over the last five years while IMS (not dependent of discretionary spending) by 40% over the same period. The latter has also led to signifcant expansion in margins. HCL also started focusing on non‐linear delivery model much ahead of peers, which contribute 52% of its topline today – highest in the industry. HCL currently trades at 12x FY14 and 11x FY15 earnings ‐ significant discount to the top three. We believe its discount to Infosys and Wipro is unwarranted, as it has delivered significantly better results, both on growth and margins front. Wipro – NEUTRAL – Out of the woods ? Constant management reshuffle ever since Mr Kurien took over as CEO in Feb‐2011 have taken a huge hit on Wipro's operations, and led to sub 8% growth (in $ terms) and non‐expansive margins over the last four years. The company has historically been a low spender on S&M activity (13% of sales), leading to loss of wallet share in key accounts, and the revenue per client growing by only 28% in last five years. However, clear management focus on driving non‐linear revenues has led to an increase in its share in revenues from 35% in FY09 to 45% in FY13. Its strong guidance of 2‐4% QoQ growth in 2QFY14E points to signs of revival in the US and increasing acceptance of outsourcing in Europe.
FY15 EPS: Rs117 Target Multiple: 19x Price Target: Rs2223
FY15 EPS: Rs215 Target Multiple: 13x Price Target: Rs2800
FY15 EPS: Rs90 Target Multiple: 14x Price Target: Rs1256
FY15 EPS: Rs35 Target Multiple: 14x Price Target: Rs486

14 of 67
17 September 2013 / INDIA EQUITY RESEARCH / IT SERVICES SECTOR UPDATE
Persistent Systems – BUY – Early bird catches more prey Persistent Systems is a leadng Offshore Product Development company, developed more than 3,000 products and applications for nearly 300 customers in the last five years. It has been a pioneer in CAMS domains, having developed its first application on an external cloud platform in 2007. It is also constantly looking to increase its revenue contribution from IP‐led business (8% in FY12 to 13% in FY13) and has dedicated 5% of its employee base to research and IP development. As more countries implement stricter immigration laws to fight rising domestic unemployment rates, we see the company, with higher offshoring effort (93%), to be able to mitigate the effect better than peers. Also, as onsite opportunities reduce with the services companies (due to higher offshoring or local hiring), they are bound to become less attractive from the employees’ perspective – inturn helping the attrition levels at product companies like PSYS. We expect the company to grow by a CAGR of ~26% over FY12‐15, maintaining average EBITDA margins of ~24% over the period. The company operates at much higher margins than peers in the product engineering space, owing to its higher offshoring profile. The PAT growth is expected to be 30% over this period, enabling the company to deliver robust ROE of 22%. KPIT Cummins – BUY – Unique Business Model KPIT Cummins is a niche IT company, concentrating in the Automotive, Manufacturing and Energy & Utilities domains. The three domains constitute over 90% of its topline, and the management envisions each vertical as $1bn+ potential opportunity. It is the largest third party vendor in the Automotive domain (excluding Auto OEMs and captives), and works with 9 out of 12 top Auto OEMs of the world. In the manufacturing domain, Cummins remains their anchor client, though its contribution from other accounts has been steadily increasing. KPIT has been THE most aggressive IT company, in terms of inorganic growth. It has acquired eight companies, since its merger with Cummins Infotech in 2002. The acquisitions have helped the company grow at a CAGR of 24% over last five years ‐ much higher than peers and industry average. However, the same has led to higher debt levels in the comapny (0.3x debt:equity), negative FCF for the last four years, and declining EBITDA margins (22% in FY10 to 16% in FY13). However, Interest coverage of 20.4x and Net debt/EBITDA of 0.4x suggest leverage is still at innocuous levels. Also, post integration of the acquired companies, we expect higher offshoring to improve the EBITDA margins. We expect KPIT to grow by a CAGR of 30% over FY12‐15, maintaining average EBITDA margins of 16% over the period. The PAT growth is expected to be 35% over FY12‐15, enabling the company to deliver robust ROE of 25%.
Valuation Table CMP M‐Cap ______ROE, %______ _______P/E, x_______ ______P/BV, x______ ____EV/EBITDA, x____
Companies (Rs) (Rs bn) FY14E FY15E FY14E FY15E FY14E FY15E FY14E FY15E
TCS 1,902 3,723 41.5 38.7 19.3 16.3 7.2 5.6 14.1 12.1Infosys 2,992 1,717 25.7 24.4 15.5 13.9 3.7 3.1 9.9 8.3Wipro 451 1108 26.1 23.4 13.7 13.0 3.3 2.8 9.8 9.1HCL Tech 997 688 35.5 30.8 12.1 11.1 3.8 3.0 7.7 7.8Persistent 574 23 25.8 22.8 7.9 7.4 1.9 1.6 4.2 3.7KPIT 135 26 27.2 23.9 8.1 7.3 2.0 1.6 5.1 4.4
Source: PhillipCapital India Research Estimates
FY15 EPS: Rs78 Target Multiple: 9x Price Target: Rs700
FY15 EPS: Rs19 Target Multiple: 9x Price Target: Rs170

15 of 67
17 September 2013 / INDIA EQUITY RESEARCH / IT SERVICES SECTOR UPDATE
Compa
nies Section

– 16 of 67 –
TCS On a different planet altogether…
IT SERVICES: Company Update 17 September 2013
PhillipCapital (India) Pvt. Ltd.
Superior performance all across TCS has consistently outperformed all its peers, across almost all parameters – posting $ revenue growth of 17.8% (CAGR) over 5 years, with margin expansion of 300bps. Delivering robust ROE of ~40%, the company is expected to report robust growth in all its verticals, and should benefit immensely from revival in discretionary spending in US and Europe. Robust client mining in all accounts, driven by strong S&M spend Over the last five years, TCS has almost doubled its revenue contribution from the top‐10 as well as non‐top‐10 clients. It currently spends ~18% of revenues for its SG&A base – significantly higher than peers. The strong S&M spend has helped it win mega new deals and rebids worth of US$8.1b over last two years – imparting high revenue visibility for next two years. Much ahead of peers in adopting new technology and delivery models TCS was one of the first few companies to realize the potential of the CAMS domain, and has already invested heavily in the segment. Its Emerging Services segment forms 35% of the total revenues (behind only HCL). Also, TCS has been the most active IT services company to migrate from linear T&M to non‐linear delivery models. Non‐linear revenues contribute ~50% of the total revenues – much ahead of peers again. Strong bench utilisations owing to top‐in‐class service execution It is almost a too good to be true story! Along with higher than industry growth rates and share of new technology & delivery models, TCS also boasts of the highest utilization rate in the industry (83%), and is targeting to further increase it to 85%. The attrition level too, is one of the lowest in the industry (~11%). Boosting up utilisations would squeeze out more realizations per employee, inturn opening profits for higher investments. Valuations appear expensive, but are justified TCS stock has run‐up significantly in the last few months (6m, +26%), driven by its robust operating performance, deal wins and rupee depreciation. On our estimates, TCS is currently trading at 19x FY14 and 16x FY15 earnings. While this is much higher than peers, we think it is justified. The company has consistently outperformed all its peers, on most parameters, and we expect the trend to continue over next two years. TCS has multiple tailwinds, helping it outperform its rivals. In the medium term, we expect the Rupee depreciation and robust deal wins to help it beat street expectations. Over longer term, its higher investment in S&M and early mover advantage in the CAMS domain should boost it far ahead of peers. We remain positive on the stock, and view it as an attractive investment, inspite of the recent run‐up. We value the stock at 19x FY15 earnings, giving us a price target of Rs2223, representing 17% upside from current levels. We recommend BUY.
BUY TCS IN | CMP RS 1902
TARGET RS 2223 (+17%) Company Data
O/S SHARES (MN) : 1957MARKET CAP (RSBN) : 3730MARKET CAP (USDBN) : 59.552 ‐ WK HI/LO (RS) : 2076 / 1198LIQUIDITY 3M (USDMN) : 42.4FACE VALUE (RS) : 1
Share Holding Pattern, %
PROMOTERS : 74.0FII / NRI : 15.7FI / MF : 5.9NON PROMOTER CORP. HOLDINGS : 0.3PUBLIC & OTHERS : 4.2
Price Performance, % 1mth 3mth 1yrABS 7.0 31.4 35.0REL TO BSE 0.8 28.3 27.9
Price Vs. Sensex (Rebased values)
70
120
170
220
270
320
Apr‐10 Mar‐11 Feb‐12 Jan‐13TCS BSE Sensex
Source: Bloomberg, Phillip Capital Research
Key Ratios
Rs bn FY13 FY14E FY15E
Net Sales 629.9 846.1 966.9EBIDTA 180.9 262.3 301.1Net Profit 139.4 192.4 229.0EPS, Rs 71.2 98.3 117.0PER, x 26.7 19.3 16.3EV/EBIDTA, x 20.5 14.1 12.1P/BV, x 9.1 7.2 5.6ROE, % 34.0 37.3 34.4Source: Phillip Capital India Research Vibhor Singhal (+ 9122 6667 9949) [email protected] Varun Vijayan (+ 9122 6667 9992) [email protected]

– 17 of 67 –
17 September 2013 / INDIA EQUITY RESEARCH / TATA CONSULTANCY COMPANY UPDATE
Consistent outperformance all across TCS has consistently outperformed all its peers, across almost all parameters – posting $ revenue growth of 17.8% (CAGR) over 5 years, with margin expansion of 300bps. Offering a bouquet of services to its clients with incremental revenue run rate of $1.4bn annually, TCS provides a balanced portfolio of traditional and emerging service lines. Keeping major growth focus on enterprise solutions and asset leveraged solutions (products), the company has grown at a CAGR of 17.8% in $ terms and 22.7% in INR terms for the past 5 years. Even when discretionary spends have declined for two years, TCS has been able to grow the traditional services (about 60‐70% – discretionary projects) at 17.2% along with emerging services (IMS, BI, and Analytics) at 18.8% for the last five years – both above industry average.
Above average (top 4) revenue growth in both traditional and emerging services
19.0
11.4
17.2
8.6
13.7
HCLT Infosys TCS Wipro
Traditional Services 5yr CAGR Average
24.8
15.0
18.8
11.0
17.0
HCLT Infosys TCS Wipro
Emerging lines 5 yr CAGR Average
Source: Company, PhillipCapital India Research
#Traditional services: ADMS, PI, consulting, Engg Services, BPO and Business App Services
Keen focus on key growth areas such as enterprise solutions, engineering solutions and infrastructure services has helped TCS run ahead of Infosys and Wipro in the peer group. With a run rate of 7.6% CQGR in IMS, 4.8% in Enterprise solutions and 4.7% in engineering solutions over last 12 quarters, TCS has managed its business well to compensate for the mellow growth in ASM and ADM services. Key support for the company came from its competitiveness in deal wins and marketshare gains. Overall CAGR for 5 years stands above average
21.5
12.2
17.8
9.5
14.8
HCLT Infosys TCS Wipro
Overall revenue CAGR ‐5 years Average
Source: Company, PhillipCapital India Research
– 18 of 67 –
17 September 2013 / INDIA EQUITY RESEARCH / TATA CONSULTANCY COMPANY UPDATE
Consulting firms such as Gartner and KPMG estimates high double‐digit growth for IT services offered in cloud (ITaaS, IaaS, BPaaS) and analytics. Recent innovative strategy of TCS to partner with SAP for cloud‐based enterprise platform is a clear example for the IT leader foraying into this largely under penetrated space. We expect that TCS along with peers like HCL and Cognizant to be a front runner in the cloud‐based outsourcing space, which gives further value to the company’s services.
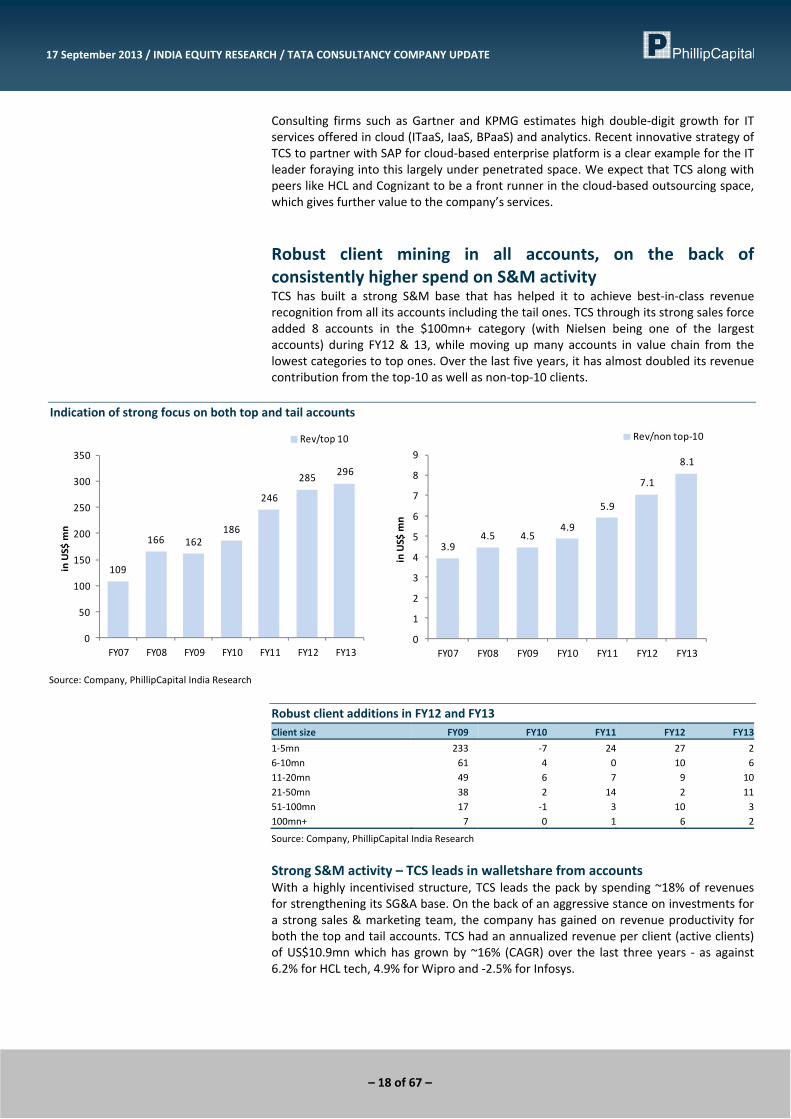
Robust client mining in all accounts, on the back of consistently higher spend on S&M activity TCS has built a strong S&M base that has helped it to achieve best‐in‐class revenue recognition from all its accounts including the tail ones. TCS through its strong sales force added 8 accounts in the $100mn+ category (with Nielsen being one of the largest accounts) during FY12 & 13, while moving up many accounts in value chain from the lowest categories to top ones. Over the last five years, it has almost doubled its revenue contribution from the top‐10 as well as non‐top‐10 clients.
Indication of strong focus on both top and tail accounts
109
166 162186
246
285 296
0
50
100
150
200
250
300
350
FY07 FY08 FY09 FY10 FY11 FY12 FY13
in US$
mn
Rev/top 10
3.94.5 4.5
4.9
5.9
7.1
8.1
0
1
2
3
4
5
6
7
8
9
FY07 FY08 FY09 FY10 FY11 FY12 FY13
in US$
mn
Rev/non top‐10
Source: Company, PhillipCapital India Research
Robust client additions in FY12 and FY13 Client size FY09 FY10 FY11 FY12 FY13
1‐5mn 233 ‐7 24 27 26‐10mn 61 4 0 10 611‐20mn 49 6 7 9 1021‐50mn 38 2 14 2 1151‐100mn 17 ‐1 3 10 3100mn+ 7 0 1 6 2
Source: Company, PhillipCapital India Research
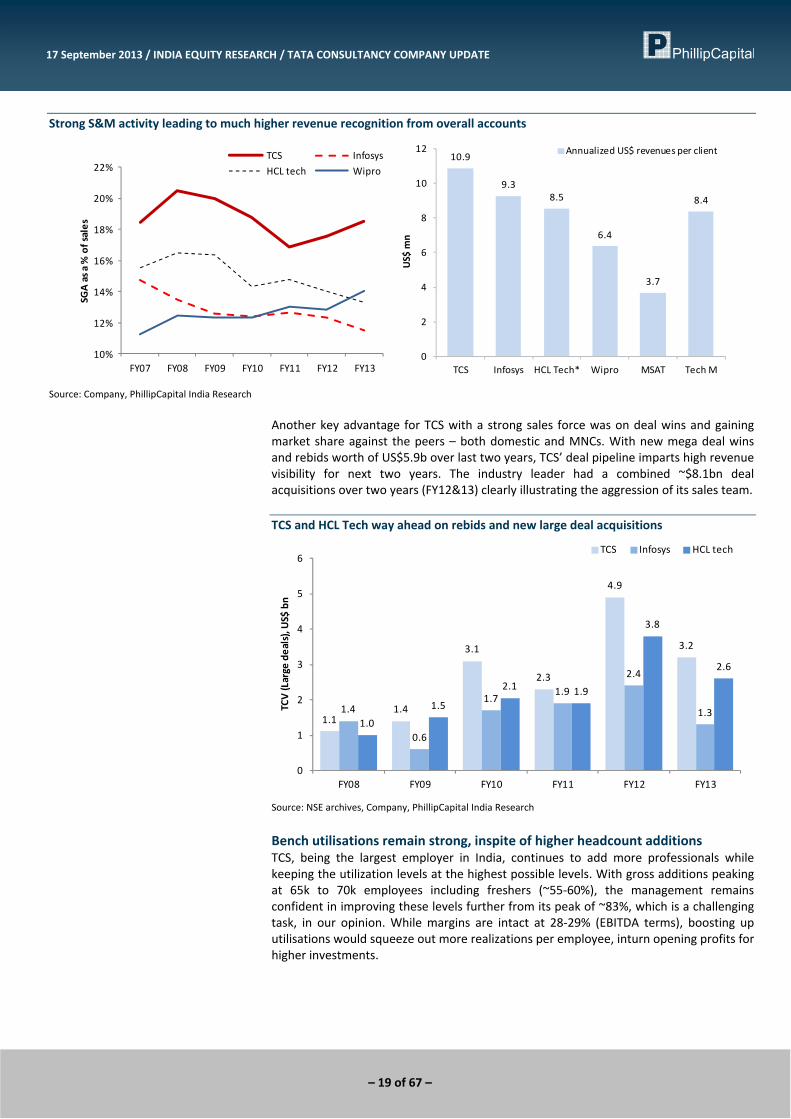
Strong S&M activity – TCS leads in walletshare from accounts With a highly incentivised structure, TCS leads the pack by spending ~18% of revenues for strengthening its SG&A base. On the back of an aggressive stance on investments for a strong sales & marketing team, the company has gained on revenue productivity for both the top and tail accounts. TCS had an annualized revenue per client (active clients) of US$10.9mn which has grown by ~16% (CAGR) over the last three years ‐ as against 6.2% for HCL tech, 4.9% for Wipro and ‐2.5% for Infosys.
– 19 of 67 –
17 September 2013 / INDIA EQUITY RESEARCH / TATA CONSULTANCY COMPANY UPDATE
Strong S&M activity leading to much higher revenue recognition from overall accounts
10%
12%
14%
16%
18%
20%
22%
FY07 FY08 FY09 FY10 FY11 FY12 FY13
SGA as a
% of sales
TCS Infosys
HCL tech Wipro10.9
9.38.5
6.4
3.7
8.4
0
2
4
6
8
10
12
TCS Infosys HCL Tech* Wipro MSAT Tech M
US$
mn
Annualized US$ revenues per client
Source: Company, PhillipCapital India Research
Another key advantage for TCS with a strong sales force was on deal wins and gaining market share against the peers – both domestic and MNCs. With new mega deal wins and rebids worth of US$5.9b over last two years, TCS’ deal pipeline imparts high revenue visibility for next two years. The industry leader had a combined ~$8.1bn deal acquisitions over two years (FY12&13) clearly illustrating the aggression of its sales team. TCS and HCL Tech way ahead on rebids and new large deal acquisitions
1.11.4
3.1
2.3
4.9
3.2
1.4
0.6
1.71.9
2.4
1.31.0
1.5
2.1 1.9
3.8
2.6
0
1
2
3
4
5
6
FY08 FY09 FY10 FY11 FY12 FY13
TCV (Large
deals), US$
bn
TCS Infosys HCL tech
Source: NSE archives, Company, PhillipCapital India Research
Bench utilisations remain strong, inspite of higher headcount additions TCS, being the largest employer in India, continues to add more professionals while keeping the utilization levels at the highest possible levels. With gross additions peaking at 65k to 70k employees including freshers (~55‐60%), the management remains confident in improving these levels further from its peak of ~83%, which is a challenging task, in our opinion. While margins are intact at 28‐29% (EBITDA terms), boosting up utilisations would squeeze out more realizations per employee, inturn opening profits for higher investments.

– 20 of 67 –
17 September 2013 / INDIA EQUITY RESEARCH / TATA CONSULTANCY COMPANY UPDATE
Utilizations at all‐time high …. ….. attrition at all‐time low
26%
27%
28%
29%
30%
31%
32%
79%
80%
81%
82%
83%
84%
1Q'12 2Q'12 3Q'12 4Q'12 1Q'13 2Q'13 3Q'13 4Q'13 1Q'14
Utilizations (LHS)EBITDA margins (RHS)
5%
7%
9%
11%
13%
15%
17%
19%
21%
23%
25%
FY09 FY10 FY11 FY12 FY13
Attrition
%
InfosysTCSWiproHCL Tech
Source: Company, PhillipCapital India Research
Global network delivery model – key differentiator Global network delivery model (GNDM) is a trademark concept introduced by TCS to ease operations abroad. The structure manages onsite work overload from near shore delivery centers situated close to the client’s location. This model reduces the time to market delays and provides flexibility for TCS to allocate its resources in a structured and cost effective manner inturn supporting the overall margins. GNDM also allows TCS to partner with first party enterprise solution ‐ platform vendors to foray into innovative concepts which increases the company’s competitiveness. The model differentiates TCS from other peers including MNCs. Key advantages: Introduction of cost efficient models, Focus on key customisations and R&D, Better realisations than offshoring and high margins. The Global Network Delivery Model
TCS offshore
GDC
Client
GDC1
GDC2
GDC3
Client
SAP oriented
Oracle Oriented
Service oriented approach on a near
shore development
centre
Other key focus
TCS onsite
Partnering with clients providing key platforms for
undeterred services and support
Source: PhillipCapital India Research
Currently TCS has 32 delivery centers across the globe which manages significant portion of the onsite delivery
– 21 of 67 –
17 September 2013 / INDIA EQUITY RESEARCH / TATA CONSULTANCY COMPANY UPDATE
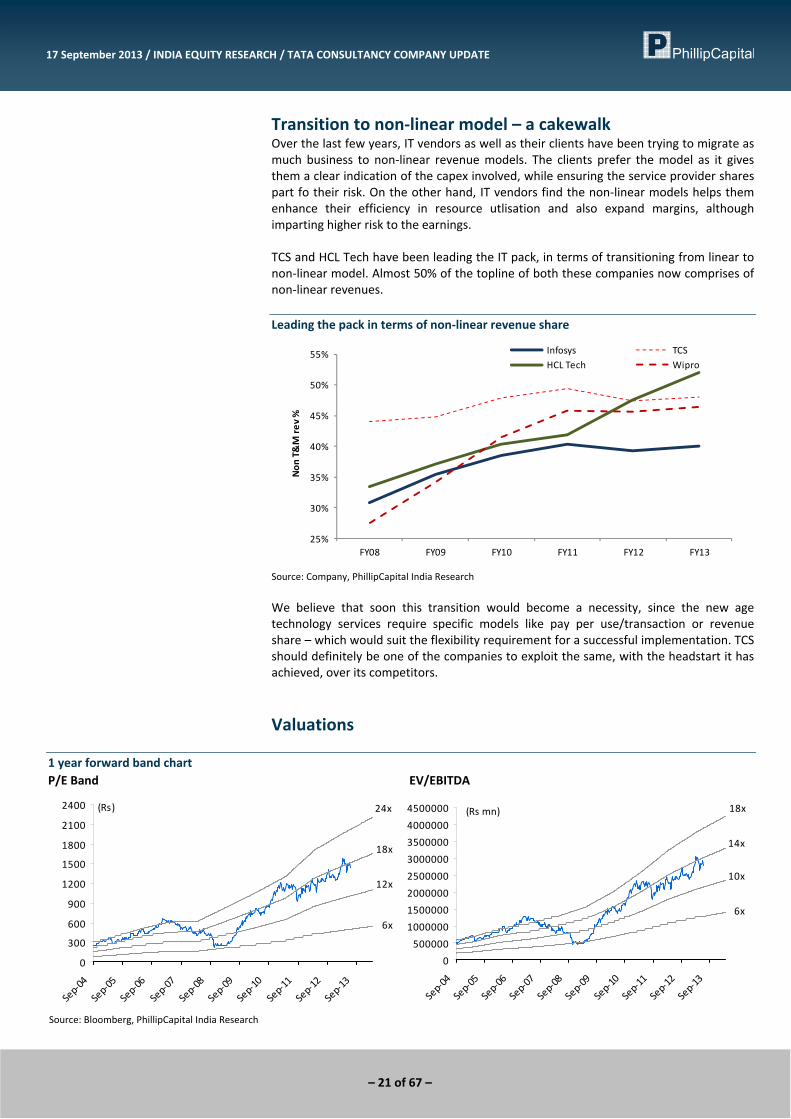
Transition to non‐linear model – a cakewalk Over the last few years, IT vendors as well as their clients have been trying to migrate as much business to non‐linear revenue models. The clients prefer the model as it gives them a clear indication of the capex involved, while ensuring the service provider shares part fo their risk. On the other hand, IT vendors find the non‐linear models helps them enhance their efficiency in resource utlisation and also expand margins, although imparting higher risk to the earnings. TCS and HCL Tech have been leading the IT pack, in terms of transitioning from linear to non‐linear model. Almost 50% of the topline of both these companies now comprises of non‐linear revenues. Leading the pack in terms of non‐linear revenue share
25%
30%
35%
40%
45%
50%
55%
FY08 FY09 FY10 FY11 FY12 FY13
Non
T&M re
v %
Infosys TCSHCL Tech Wipro
Source: Company, PhillipCapital India Research
We believe that soon this transition would become a necessity, since the new age technology services require specific models like pay per use/transaction or revenue share – which would suit the flexibility requirement for a successful implementation. TCS should definitely be one of the companies to exploit the same, with the headstart it has achieved, over its competitors.
Valuations
1 year forward band chart P/E Band EV/EBITDA
6x
12x
18x
24x
0
300
600
900
1200
1500
1800
2100
2400
Sep‐04
Sep‐05
Sep‐06
Sep‐07
Sep‐08
Sep‐09
Sep‐10
Sep‐11
Sep‐12
Sep‐13
(Rs)
6x
10x
14x
18x
0
500000
1000000
1500000
2000000
2500000
3000000
3500000
4000000
4500000
Sep‐04
Sep‐05
Sep‐06
Sep‐07
Sep‐08
Sep‐09
Sep‐10
Sep‐11
Sep‐12
Sep‐13
(Rs mn)
Source: Bloomberg, PhillipCapital India Research

– 22 of 67 –
17 September 2013 / INDIA EQUITY RESEARCH / TATA CONSULTANCY COMPANY UPDATE
Financials
Income Statement Y/E Mar, Rs mn FY12 FY13 FY14E FY15E
Net sales 488,935 629,895 846,081 966,894Growth, % 31 29 34 14Employee expenses ‐258,773 ‐332,545 ‐437,320 ‐496,560Other Operating expenses ‐85,988 ‐116,480 ‐146,501 ‐169,194EBITDA (Core) 144,174 180,870 262,260 301,141Growth, % 28.9 25.5 45.0 14.8Margin, % 29.5 28.7 31.0 31.1Depreciation ‐9,036 ‐10,791 ‐13,528 ‐15,847EBIT 135,138 170,079 248,732 285,294Growth, % 30.1 25.9 46.2 14.7Margin, % 27.6 27.0 29.4 29.5Interest paid 0 0 0 0Other Non‐Operating Income 4,950 11,175 6,392 16,680Pre‐tax profit 139,178 181,254 255,124 301,974Tax provided ‐31,688 ‐40,344 ‐59,227 ‐69,454Profit after tax 107,490 140,910 195,897 232,520Others (Minorities, Associates) ‐1,110 ‐1,494 ‐3,480 ‐3,480Net Profit 106,380 139,416 192,417 229,040Growth, % 22.5 31.1 38.0 19.0Net Profit (adjusted) 106,380 139,416 192,417 229,040Wtd avg shares (m) 1,957 1,957 1,957 1,957
FY12 FY13 FY14E FY15E
US$ Revenue ($ mn) 10,171 11,569 13,414 15,595Growth, % 24 14 16 16Re / US$ (rate) 48.1 54.4 63.1 62.0
Balance Sheet Y/E Mar, Rs mn FY12 FY13 FY14E FY15E
Cash & bank 19,936 18,432 24,786 70,281Marketable securities at cost 0 0 0 0Debtors 115,023 140,766 187,533 216,675Inventory 0 0 0 0Other current assets 87,758 146,169 195,034 227,786Total current assets 222,717 305,367 407,353 514,742Investments 14,783 20,403 27,443 36,443Net fixed assets 174,549 194,965 224,739 270,015Non‐current assets 0 0 0 0Total assets 412,049 520,735 659,535 821,200 Total current liabilities 68,068 88,526 112,814 120,830Non‐current liabilities 13,259 16,088 20,540 22,059Total liabilities 81,327 104,614 133,354 142,889Paid‐up capital 1,957 1,957 1,957 1,957Reserves & surplus 323,490 407,603 514,438 663,088Minorities 5,275 6,561 9,786 13,266Shareholders’ equity 330,722 416,121 526,181 678,311Total equity & liabilities 412,049 520,735 659,535 821,200
Source: Company, PhillipCapital India Research Estimates
Cash Flow Y/E Mar, Rs mn FY12 FY13 FY14E FY15E
Pre‐tax profit 139,178 181,254 255,124 301,974Depreciation 9,036 10,791 13,528 15,847Chg in working capital ‐36,589 ‐61,023 ‐66,869 ‐52,360Total tax paid ‐31,688 ‐40,344 ‐59,227 ‐69,454Other operating activities 0 0 0 0Cash flow from operating activities 79,936 90,678 142,556 196,007Capital expenditure ‐41,316 ‐31,207 ‐43,303 ‐61,122Chg in investments 3,607 ‐5,620 ‐7,040 ‐9,000Chg in marketable securities 0 0 0 0Other investing activities 0 0 0 0Cash flow from investing activities ‐37,708 ‐36,827 ‐50,343 ‐70,122Free cash flow 38,621 59,471 99,254 134,885Equity raised/(repaid) 0 0 0 0Debt raised/(repaid) 1,114 156 ‐23 0Dividend (incl. tax) ‐57,249 ‐50,379 ‐67,536 ‐80,390Other financing activities 19,263 ‐4,924 ‐18,046 0Cash flow from financing activities ‐37,370 ‐55,355 ‐85,860 ‐80,390Net chg in cash 4,858 ‐1,504 6,354 45,495
Valuation Ratios & Per Share Data FY12 FY13 FY14E FY15E
Per Share data EPS (INR) 54.4 71.2 98.3 117.0Growth, % 22.5 31.1 38.0 19.0Book NAV/share (INR) 166.3 209.3 263.8 339.8CFPS (INR) 38.3 40.6 69.6 91.6DPS (INR) 25.0 22.0 29.5 35.1Return ratios Return on assets (%) 28.9 30.2 33.2 31.4Return on equity (%) 32.7 34.0 37.3 34.4Return on capital employed (%) 35.1 36.3 40.0 37.3Turnover ratios Asset turnover (x) 1.9 1.9 2.0 1.8Sales/Total assets (x) 1.3 1.4 1.4 1.3Sales/Net FA (x) 3.1 3.4 4.0 3.9Working capital/Sales (x) 0.3 0.3 0.3 0.3Receivable days 85.9 81.6 80.9 81.8Payable days 71.9 71.1 69.3 65.2Working capital days 100.6 115.0 116.4 122.2Liquidity ratios Current ratio (x) 3.3 3.4 3.6 4.3Quick ratio (x) 3.3 3.4 3.6 4.3Dividend cover (x) 2.2 3.2 3.3 3.3Total debt/Equity (%) 0.7 0.6 0.4 0.3Net debt/Equity (%) (5.5) (3.9) (4.4) (10.2)Valuation PER (x) 35.0 26.7 19.3 16.3PEG (x) ‐ y‐o‐y growth 1.6 0.9 0.5 0.9Price/Book (x) 11.4 9.1 7.2 5.6Yield (%) 1.3 1.2 1.6 1.8EV/Net sales (x) 7.6 5.9 4.4 3.8EV/EBITDA (x) 25.7 20.5 14.1 12.1EV/EBIT (x) 27.4 21.8 14.9 12.8

– 23 of 67 –
HCL Tech Perfecting the balancing act
IT SERVICES: Company Update 17 September 2013
PhillipCapital (India) Pvt. Ltd.
IMS leads through tough times While global economic slowdown impacted most Indian IT Services companies, HCL gained traction by winning large deals in the IMS space ‐ fundamentally decoupled from discretionary spending. The company has posted robust growth in the segment over the last four years (~40%) ‐ much ahead of peers. All along, it has expanded operating margins in the segment by 390bps since FY08, boosting overall margins by 150bps. Balanced portfolio with ES and IMS Services, to capture market share HCL has a very balanced portfolio, with ES and IMS forming 47% and 32% of topline respectively. ES, with its higher correlation to discretionary spending, has grown by 22% CAGR over the last four years for the company – far ahead of peers. IMS, on the other hand, not dependent on discretionary spending, has provided it with both growth and margin expansion. Strong S&M spend leads to higher deal wins HCL has historically been one of the highest spenders (~15% of sales) on S&M activity. The same has resulted in large deal wins for the company over the last few years. We also note a significant improvement in the revenue productivity (Annualized $revenue per employee) for the company in the recent 6 quarters. Alternative approach to IT ‐ geared up for the revolution HCL has been one of the first companies, to adapt to the changing needs of the business. It started focusing on non‐linear delivery model much ahead of peers, which contribute 52% of its topline today – highest in the industry. It has now increased its focus on partnering with businesses and bringing in new services through CAMS, as a part of its 'alternative approach to IT'. BPO Services – a turnaround story HCL management’s strong focus on cost management through automation and rationalisations, while reducing its dependency on resources have led to a strong revival of HCL’s BPO business, which reported continuous erosion of margins through FY11‐12. Margins have significantly improved during the past 4 quarters, indicating a significant change in its structural functions. The management also expects pent up demand from European companies, to drive future growth. Valuation gap not justified in our opinion, recommend BUY HCL currently trades at 12x FY14 and 11x FY15 earnings. While this is slightly higher than its historical average, it is at a significant discount to the top three IT Services giants. While its discount to TCS is justified, we believe it has delivered significantly better results than Infosys and Wipro, both on growth and margins front, to warrant a higher multiple. With a revenue CAGR of 21% over FY13‐15 and average ROE of 33%, we expect a significant re‐rating of the stock. We value the stock at 14x FY15 earnings (8% higher than Infosys), giving us a price target of Rs1256, representing 26% upside from current levels. We recommend BUY.
BUY HCLT IN | CMP RS 997
TARGET RS 1256 (+26%) Company Data
O/S SHARES (MN) : 697MARKET CAP (RSBN) : 695MARKET CAP (USDBN) : 11.152 ‐ WK HI/LO (RS) : 1081 / 548LIQUIDITY 3M (USDMN) : 19.5FACE VALUE (RS) : 2
Share Holding Pattern, %
PROMOTERS : 61.9FII / NRI : 26.0FI / MF : 6.5NON PROMOTER CORP. HOLDINGS : 2.7PUBLIC & OTHERS : 2.9
Price Performance, % 1mth 3mth 1yrABS 8.4 30.9 71.2REL TO BSE 2.1 27.9 64.1
Price Vs. Sensex (Rebased values)
0
50
100
150
200
250
300
350
Apr‐10 Mar‐11 Feb‐12 Jan‐13
HCL Tech BSE Sensex
Source: Bloomberg, Phillip Capital Research
Key Ratios
Rs bn FY13 FY14E FY15E
Net Sales 257.3 340.2 375.1EBIDTA 57.5 82.3 89.4Net Profit 40.2 58.0 63.6EPS, Rs 57.0 82.1 89.7PER, x 17.5 12.1 11.1EV/EBIDTA, x 11.7 8.0 7.1P/BV, x 4.9 3.8 3.1ROE, % 28.1 31.5 27.8Source: Phillip Capital India Research Vibhor Singhal (+ 9122 6667 9949) [email protected] Varun Vijayan (+ 9122 6667 9992) [email protected]

– 24 of 67 –
17 September 2013 / INDIA EQUITY RESEARCH / HCL TECH COMPANY UPDATE
IMS leads through tough times Global economic slowdown in FY09 forced many industries towards higher cost rationalisations and regulation cum compliance requirements, leading them to shift to primarily non‐core outsourcing. This, in‐turn, led most majority of the vendors to shift their focus from discretionary to non discretionary projects. This transformation in strategy was the sole play during the period of 2010‐13 to recover the lost revenues. HCL started with balancing its portfolio and forayed into newer technologies, while moving up its value chain in services. With its strong S&M base, the company gained traction by winning large deals from infrastructure management side of the business. IMS led the company through tough global demand challenges, with a CAGR of ~40% post recession period. Also by providing bundled services, HCL enabled its customers to rethink on their spends, where it engaged in multiple partnerships to provide end‐to‐end solutions.
Revenue growth in IMS for the top 4 Revenue growth in key verticals for the top 4
0%
10%
20%
30%
40%
50%
60%
70%
FY09 FY10 FY11 FY12 FY13
YoY IM
S rev grow
th %
HCL Tech* Infosys
TCS Wipro
0%
10%
20%
30%
40%
50%
60%
70%
FY09 FY10 FY11 FY12 FY13
HCL Tech ‐ IMS Infosys ‐ADMTCS ‐ IMS + AS Wipro ‐TIS
Source: Company, PhillipCapital India Research
IMS leading to strong revenue growth as well as margin expansion
0%
10%
20%
30%
40%
50%
60%
70%
80%
FY07 FY08 FY09 FY10 FY11 FY12 FY13
IMS YoY growth %Overall rev YoY growth
15%
16%
17%
18%
19%
20%
21%
22%
23%
24%
FY07 FY08 FY09 FY10 FY11 FY12 FY13
IMS margins Software services marginsOverall margins
Source: Company, PhillipCapital India Research
– 25 of 67 –
17 September 2013 / INDIA EQUITY RESEARCH / HCL TECH COMPANY UPDATE
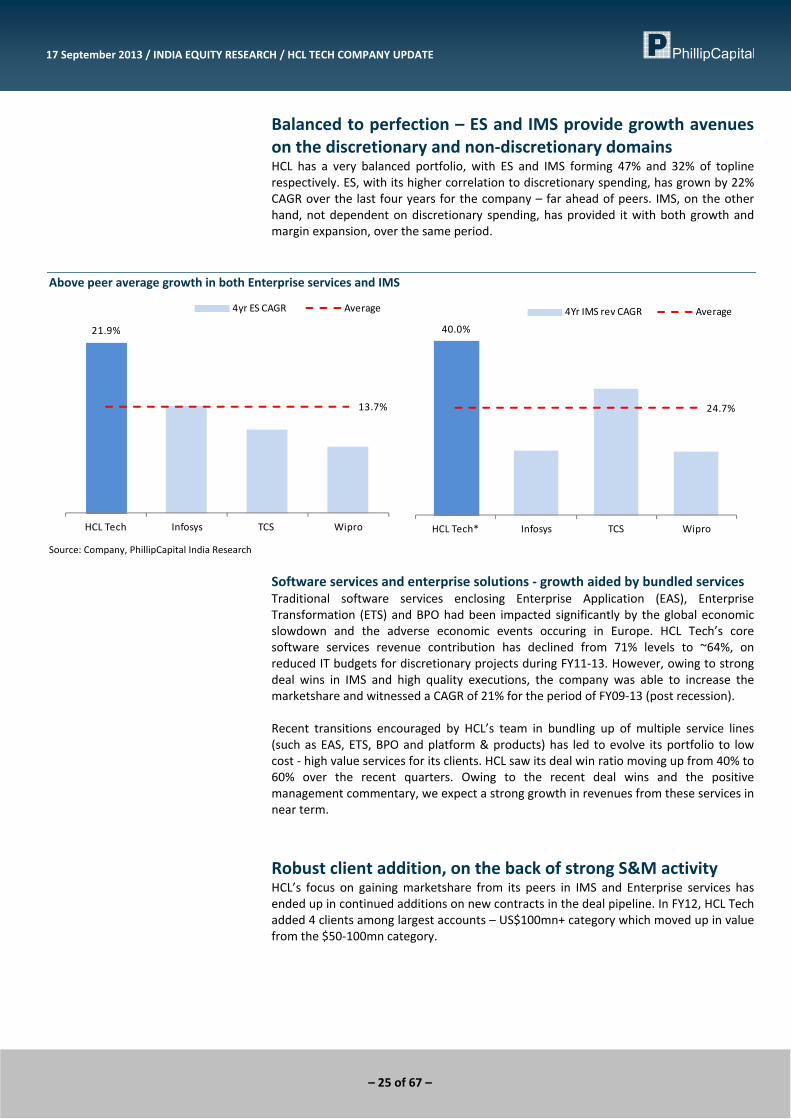
Balanced to perfection – ES and IMS provide growth avenues on the discretionary and non‐discretionary domains HCL has a very balanced portfolio, with ES and IMS forming 47% and 32% of topline respectively. ES, with its higher correlation to discretionary spending, has grown by 22% CAGR over the last four years for the company – far ahead of peers. IMS, on the other hand, not dependent on discretionary spending, has provided it with both growth and margin expansion, over the same period.
Above peer average growth in both Enterprise services and IMS
21.9%
13.7%
HCL Tech Infosys TCS Wipro
4yr ES CAGR Average
40.0%
24.7%
HCL Tech* Infosys TCS Wipro
4Yr IMS rev CAGR Average
Source: Company, PhillipCapital India Research
Software services and enterprise solutions ‐ growth aided by bundled services Traditional software services enclosing Enterprise Application (EAS), Enterprise Transformation (ETS) and BPO had been impacted significantly by the global economic slowdown and the adverse economic events occuring in Europe. HCL Tech’s core software services revenue contribution has declined from 71% levels to ~64%, on reduced IT budgets for discretionary projects during FY11‐13. However, owing to strong deal wins in IMS and high quality executions, the company was able to increase the marketshare and witnessed a CAGR of 21% for the period of FY09‐13 (post recession). Recent transitions encouraged by HCL’s team in bundling up of multiple service lines (such as EAS, ETS, BPO and platform & products) has led to evolve its portfolio to low cost ‐ high value services for its clients. HCL saw its deal win ratio moving up from 40% to 60% over the recent quarters. Owing to the recent deal wins and the positive management commentary, we expect a strong growth in revenues from these services in near term.
Robust client addition, on the back of strong S&M activity HCL’s focus on gaining marketshare from its peers in IMS and Enterprise services has ended up in continued additions on new contracts in the deal pipeline. In FY12, HCL Tech added 4 clients among largest accounts – US$100mn+ category which moved up in value from the $50‐100mn category.

– 26 of 67 –
17 September 2013 / INDIA EQUITY RESEARCH / HCL TECH COMPANY UPDATE
Strong client addition during FY12 Client size FY09 FY10 FY11 FY12 FY13E
1‐5mn 168 8 30 27 25‐10mn 42 7 4 15 2110‐20mn 23 11 4 13 (4)20‐30mn 12 0 1 7 230‐40mn 1 4 7 (1) 340‐50mn 3 (1) (1) 3 150‐100mn 2 2 4 (3) 0100mn+ 2 (1) 0 4 0
Source: PhillipCapital India Research Estimates
While the revenue share from the top accounts declined, the company had been able to compensate from its tail accounts. We expect that owing to a strong S&M team and a robust incentive structure, HCL Tech would be able to bring up tail accounts to a profitable state, while keeping the LEAN program active ‐ to cut off the non performing accounts. Consistent margin expansion on increased wedge of profitability Keeping in mind that a strongly incentivized sales and marketing team would be a major factor in bringing up the revenue productivity, HCL has been building a very successful structure of sales and marketing professionals over the past decade. While HCL has been expanding its margins during FY11‐13, it has reduced the SGA investments which has led to contraction of cost margins. We note a significant improvement in the revenue productivity (Annualized $revenue per employee) for the company in the recent 6 quarters.
Strong S&M activity ….. ….. leading to higher revenue productivity (per employee)
10%
12%
14%
16%
18%
20%
22%
FY07 FY08 FY09 FY10 FY11 FY12 FY13
SGA as a
% of sales
TCS Infosys
HCL tech Wipro
40
42
44
46
48
50
52
54
56
58
60
1Q '12 2Q '12 3Q '12 4Q '12 1Q '13 2Q '13 3Q '13 4Q '13
Rev prod
uctivity, In US$
'000s
HCLT InfosysTCS Wipro
Source: Company, PhillipCapital India Research

– 27 of 67 –
17 September 2013 / INDIA EQUITY RESEARCH / HCL TECH COMPANY UPDATE
HCL's alternative approach to IT The changing demand environment over all the verticals and regions in the past two years has resulted a major migration from the traditional pricing model – T&M – to more outcome‐based model. HCL found their provision of more flexible pricing models – such as pay per solution or pay per use or fixed price models – to be more attractive to their clients. In return, the flexibility in resource allocation provides HCL more profitability while providing client stickiness which was the motivation to migrate from T&M. Along with this migratory pattern, they also focused on alternative methods to improve value of their services.
Alternative approach to IT
Gen1: First time outsource
Gen2 Gen+
Revenue Impact
Cost Impact Business Cost
Front, Middle and Back office innovation
Impact
Tactical
T&M
Resource Cost
Staff Augmentation
Program Based
Managed Services
Services Cost
Managed ServicesAPOConsolidation / VirtualizationEOOTBPlatform BPO
Business Driven & Strategic
Outcome Based
Business Cost
Alternative ITEg. ALT ASM, From No To How BPaaS, TechCMO
Outsourcing
Model
Cost
Key Proposition
Time
• Traditional model adopted by mostof the Indian IT vendors duringFY01‐09.
• During this phase, Indian IT vendorsplayed out on labor arbitrage
• Revenues were linear to resourceaddition.
• Managed services model where thedelivery model was highlydiscretionary.
• HCL and most of its peers are in thisphase currently.
• Transition to Alternative phasesfrom linear business structure.
• More critical and rewarding; clientstend to be more sticky.
• Partnering with businesses andbringing in new services throughnon traditional methods (CAMS)
Source: Company, PhillipCapital India Research
– 28 of 67 –
17 September 2013 / INDIA EQUITY RESEARCH / HCL TECH COMPANY UPDATE
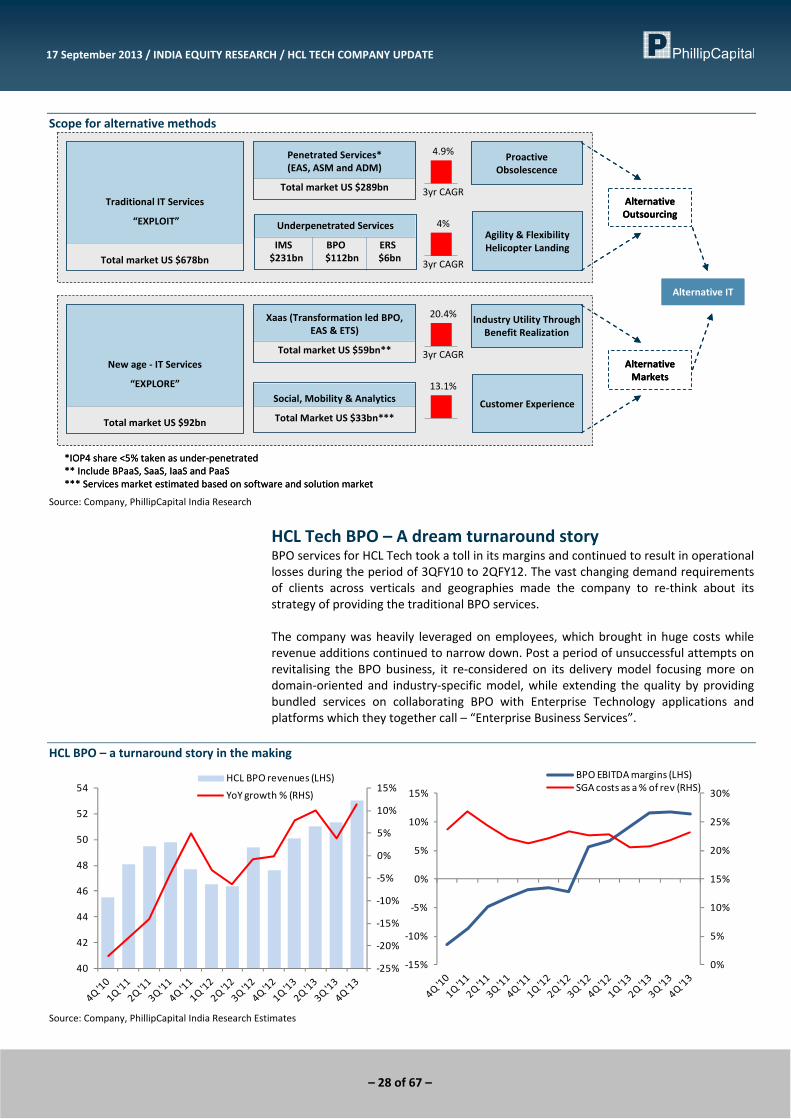
Scope for alternative methods
Proactive Obsolescence
Agility & Flexibility Helicopter Landing
3yr CAGR
3yr CAGR
4.9%
4%
Traditional IT Services
“EXPLOIT”
Total market US $678bn
Penetrated Services*(EAS, ASM and ADM)
Total market US $289bn
Underpenetrated Services
IMS BPO ERS$231bn $112bn $6bn
Alternative Outsourcing
Alternative IT
Industry Utility Through Benefit Realization
Customer Experience
3yr CAGR
*IOP4 share <5% taken as under‐penetrated** Include BPaaS, SaaS, IaaS and PaaS*** Services market estimated based on software and solution market
20.4%
13.1%
New age ‐ IT Services
“EXPLORE”
Total market US $92bn
Xaas (Transformation led BPO, EAS & ETS)
Total market US $59bn**
Social, Mobility & Analytics
Total Market US $33bn***
Alternative Markets
Source: Company, PhillipCapital India Research
HCL Tech BPO – A dream turnaround story BPO services for HCL Tech took a toll in its margins and continued to result in operational losses during the period of 3QFY10 to 2QFY12. The vast changing demand requirements of clients across verticals and geographies made the company to re‐think about its strategy of providing the traditional BPO services. The company was heavily leveraged on employees, which brought in huge costs while revenue additions continued to narrow down. Post a period of unsuccessful attempts on revitalising the BPO business, it re‐considered on its delivery model focusing more on domain‐oriented and industry‐specific model, while extending the quality by providing bundled services on collaborating BPO with Enterprise Technology applications and platforms which they together call – “Enterprise Business Services”.
HCL BPO – a turnaround story in the making
‐25%
‐20%
‐15%
‐10%
‐5%
0%
5%
10%
15%
40
42
44
46
48
50
52
54HCL BPO revenues (LHS)
YoY growth % (RHS)
0%
5%
10%
15%
20%
25%
30%
‐15%
‐10%
‐5%
0%
5%
10%
15%
BPO EBITDA margins (LHS)SGA costs as a % of rev (RHS)
Source: Company, PhillipCapital India Research Estimates

– 29 of 67 –
17 September 2013 / INDIA EQUITY RESEARCH / HCL TECH COMPANY UPDATE
While below EBIT level losses still continue, the operating margins have improved for BPO business during the past 4 quarters, indicating a significant change in its structural functions. We note a change in BPO’s operating model from a traditional service vendor to a combined business services model which the management calls ‘Next Generation BPO’. Outlook on HCL BPO Strong focus on cost management through automation and rationalisations, while reducing its dependancy on resources have taken effect and is turning out to be a grand strategy for revival of HCL’s BPO business. The management expects a pent up demand from European companies who are forced to outsource most of its non‐core IT projects, where HCL’s Enterprise Business Services will come into play. We expect this segment to have higher penetration levels in EU regions where its unique structure would provide an upper hand in winning profitable deals. We also expect margin expansion to lead to the segment margins reaching close to the 15‐16% levels in the near term.
Valuations
1 year forward band chart P/E Band EV/EBITDA
5x
10x
15x
20x
0
200
400
600
800
1000
1200
1400
Apr‐06
Apr‐07
Apr‐08
Apr‐09
Apr‐10
Apr‐11
Apr‐12
Apr‐13
(Rs)
4x
6x
8x
10x
0
100000
200000
300000
400000
500000
600000
700000
800000
Apr‐06
Apr‐07
Apr‐08
Apr‐09
Apr‐10
Apr‐11
Apr‐12
Apr‐13
(Rs mn)
Source: Bloomberg, PhillipCapital India Research

– 30 of 67 –
17 September 2013 / INDIA EQUITY RESEARCH / HCL TECH COMPANY UPDATE
Financials
Income Statement Y/E Jun, Rs mn FY12 FY13 FY14E FY15E
Net sales 210,312 257,336 340,224 375,081Growth, % 33 22 32 10Employee expenses ‐141,413 ‐165,599 ‐214,432 ‐237,980Other Operating expenses ‐29,503 ‐34,201 ‐43,477 ‐47,694EBITDA (Core) 39,396 57,536 82,315 89,407Growth, % 50.2 46.0 43.1 8.6Margin, % 18.7 22.4 24.2 23.8Depreciation ‐5,641 ‐6,726 ‐7,405 ‐8,847EBIT 33,755 50,810 74,910 80,560Growth, % 58.5 50.5 47.4 7.5Margin, % 16.0 19.7 22.0 21.5Interest paid 0 0 0 0Other Non‐Operating Income 706 1,769 1,417 2,027Pre‐tax profit 32,585 52,381 75,379 82,587Tax provided ‐8,180 ‐12,217 ‐17,337 ‐18,995Profit after tax 24,405 40,164 58,041 63,592Others (Minorities, Associates) 0 0 0 0Net Profit 24,405 40,164 58,041 63,592Growth, % 53.0 64.6 44.5 9.6Net Profit (adjusted) 24,405 40,164 58,041 63,592Wtd avg shares (m) 700 705 707 709
FY12 FY13 FY14E FY15E
US$ Revenue ($ mn) 4,152 4,687 5,298 6,050Growth, % 17 13 13 14Re / US$ (rate) 50.7 54.9 64.2 62.0
Balance Sheet Y/E Jun, Rs mn FY12 FY13 FY14E FY15E
Cash & bank 6,673 7,321 13,968 25,046Marketable securities at cost 18,777 42,491 57,491 69,491Debtors 53,440 61,767 82,027 91,458Inventory 0 0 0 0Other current assets 15,212 19,071 23,580 27,719Total current assets 94,102 130,650 177,065 213,714Investments 2,943 577 1,077 1,577Net fixed assets 92,231 99,254 113,603 123,320Non‐current assets 0 0 0 0Total assets 189,276 230,481 291,745 338,611 Total current liabilities 49,394 65,423 85,185 91,280Non‐current liabilities 32,568 22,111 22,548 18,325Total liabilities 81,962 87,534 107,733 109,605Paid‐up capital 1,341 1,341 1,341 1,341Reserves & surplus 105,974 141,607 182,671 227,665Minorities 0 0 0 0Shareholders’ equity 107,314 142,947 184,012 229,005Total equity & liabilities 189,276 230,481 291,745 338,611
Source: Company, PhillipCapital India Research Estimates
Cash Flow Y/E Jun, Rs mn FY12 FY13 FY14E FY15E
Pre‐tax profit 32,585 52,381 75,379 82,587Depreciation 5,641 6,726 7,405 8,847Chg in working capital ‐6,410 3,843 ‐5,006 ‐7,476Total tax paid ‐8,180 ‐12,217 ‐17,337 ‐18,995Other operating activities 0 0 0 0Cash flow from operating activities 23,636 50,733 60,441 64,964Capital expenditure ‐23,437 ‐13,749 ‐21,754 ‐18,564Chg in investments ‐163 2,366 ‐500 ‐500Chg in marketable securities ‐1,566 ‐23,714 ‐15,000 ‐12,000Other investing activities 0 0 0 0Cash flow from investing activities ‐25,166 ‐35,097 ‐37,254 ‐31,064Free cash flow 199 36,984 38,687 46,399Equity raised/(repaid) 0 0 0 0Debt raised/(repaid) 4,441 ‐10,457 437 ‐4,223Dividend (incl. tax) ‐9,702 ‐9,749 ‐16,977 ‐18,598Other financing activities 8,266 5,218 0 0Cash flow from financing activities 3,005 ‐14,988 ‐16,540 ‐22,821Net chg in cash 1,475 648 6,647 11,078
Valuation Ratios & Per Share Data FY12 FY13 FY14E FY15E
Per Share data EPS (INR) 34.9 57.0 82.1 89.7Growth, % 52.4 63.4 44.2 9.2Book NAV/share (INR) 153.3 202.7 260.3 323.0CFPS (INR) 32.8 69.4 83.5 88.8DPS (INR) 11.8 11.8 20.5 22.4Return ratios Return on assets (%) 14.5 19.1 22.2 20.2Return on equity (%) 22.7 28.1 31.5 27.8Return on capital employed (%) 19.3 26.3 31.2 28.0Turnover ratios Asset turnover (x) 2.1 2.3 2.7 2.6Sales/Total assets (x) 1.3 1.2 1.3 1.2Sales/Net FA (x) 2.5 2.7 3.2 3.2Working capital/Sales (x) 0.1 0.1 0.1 0.1Receivable days 92.7 87.6 88.0 89.0Working capital days 33.4 21.9 21.9 27.1Liquidity ratios Current ratio (x) 1.9 2.0 2.1 2.3Quick ratio (x) 1.9 2.0 2.1 2.3Dividend cover (x) 2.9 4.8 4.0 4.0Total debt/Equity (%) 30.3 15.5 12.3 8.0Net debt/Equity (%) 24.1 10.3 4.7 (2.9)Valuation PER (x) 28.6 17.5 12.1 11.1PEG (x) ‐ y‐o‐y growth 0.5 0.3 0.3 1.2Price/Book (x) 6.5 4.9 3.8 3.1Yield (%) 1.2 1.2 2.1 2.2EV/Net sales (x) 3.4 2.6 1.9 1.7EV/EBITDA (x) 17.9 11.7 8.0 7.1EV/EBIT (x) 20.9 13.3 8.8 7.8

– 31 of 67 –
Infosys Miles to go before ….
Company Update 17 September 2013
PhillipCapital (India) Pvt. Ltd.
Too early to turn optimistic – valuation gap with TCS still inadequate Over the last five years, TCS’s robust client mining and Infosys’s inability to ramp‐up and win more deals, has widened the gap in their revenues and narrowed the same in margins. TCS’s revenues have increased from 1.4x of Infosys’s revenues in FY08 to 1.6x in FY13. Over the same period, the margin gap has narrowed from 540bps to almost ZERO. While the market has consistently acknowledged the difference in their performance over the last two years, by awarding a higher multiple to TCS (17x vs 15x for Infosys), we note that the gap in their performance has widened signifcanlty over the last few quarters. Today, Infosys its trades at 14x FY15 vs 16x for TCS – inadequate in our opinion, to reflect the risk‐reward profile of the companies.
Exodus of key employees and new centralized structure not helping Over the last 18months, a number of key high profile executives have left Infosys, joining rival companies for better salary, position or profile. Many of these have happened after Mr. Narayan Murthy was reinstated as the Executive Chairman. His return has meant increasing centralization of decision making process in Infosys, which, in our opinion, may inadvertently delay the decision making process, and might lead to frustration amongst senior employees – a possible reason for the exodus.
Declining revenue growth in all verticals, far behind peers in adapting to new delivery models Infosys has reported a declining revenue growth in almost all its verticals over the last five quarters, including its bread‐and‐butter BFSI domain. Its revenue share of the emerging services (IMS, Consulting and Analytics) remains the lowest (25% vs 37% at TCS) amongst the top 4 Indian IT Services companies – so does the share of non‐linear delivery models (40% vs 48% for TCS). These impart a high risk to the future growth prospects of the company. It has also been a relative laggard in adapting to the new age technologies – CAMS.
Loss of wallet share due to lower S&M spend over the years, increasing it now would lead to margin contraction Infosys today finds itself in a precarious situation. It has historically been the lowest spender on S&M activity (13% vs 19% at TCS) amongst the top 4. The same has led to its inability to win key deals, and loss of wallet share from its existing clients. If it continues at the same levels, it may lose further deals from new as well as existing clients. If it increases the S&M spend, the already depleting operating margins (390bps over last two years) will contract further.
Risk‐reward profile looks unfavorable; recommend NEUTRAL Post its 1QFY14 results, which were at best, in‐line with expectations, Infosys stock has surged 22% ‐ partly aided by the depreciating Rupee. It currently trades at 16x FY14 and 14x FY15 earnings – still too high a multiple, in our opinion, considering the risk to future earnings and the inadequate gap in valutation versus its arch rival TCS (19x FY14 and 16x FY15 for TCS).
We have a negative stand on the stock, and view the exodus of key employees, lower revenue share of energing technologies and margin contraction expected on the back of higher S&M spend pose significant risk to the earnings. We value the company at 13x FY15 earnings, giving us a price target of Rs2800, representing 6% downside from current levels. We recommend NEUTRAL.
NEUTRAL INFO IN | CMP RS 2992
TARGET RS 2800 (‐6%) Company Data
O/S SHARES (MN) : 574MARKET CAP (RSBN) : 1718MARKET CAP (USDBN) : 27.452 ‐ WK HI/LO (RS) : 3173 / 2190LIQUIDITY 3M (USDMN) : 55.8FACE VALUE (RS) : 5
Share Holding Pattern, %
PROMOTERS : 16.0FII / NRI : 53.3FI / MF : 18.3NON PROMOTER CORP. HOLDINGS : 0.5PUBLIC & OTHERS : 11.9
Price Performance, % 1mth 3mth 1yrABS 0.8 25.1 13.8REL TO BSE ‐5.5 22.1 6.8
Price Vs. Sensex (Rebased values)
70
80
90
100
110
120
130
140
Apr‐10 Mar‐11 Feb‐12 Jan‐13Infosys BSE Sensex
Source: Bloomberg, Phillip Capital Research
Key Ratios
Rs bn FY13 FY14E FY15E
Net Sales 403.5 508.9 558.6EBIDTA 115.6 142.6 162.4Net Profit 94.2 110.3 123.0EPS, Rs 164.9 193.1 215.3PER, x 18.1 15.5 13.9EV/EBIDTA, x 12.8 10.1 8.5P/BV, x 4.3 3.7 3.1ROE, % 23.7 24.0 22.5Source: Phillip Capital India Research Vibhor Singhal (+ 9122 6667 9949) [email protected] Varun Vijayan (+ 9122 6667 9992) [email protected]

– 32 of 67 –
17 September 2013 / INDIA EQUITY RESEARCH / INFOSYS COMPANY UPDATE
Widening performance gap with TCS Over the last five years, TCS’s robust client mining and Infosys’s inability to ramp‐up and win more deals, has widened the gap in their revenues and narrowed the same in margins. TCS’s revenues have increased from 1.4x of Infosys’s revenues in FY08 to 1.6x in FY13. Over the same period, the margin gap has narrowed from 540bps to almost 0. While the market has consistently acknowledged the difference in their performance over the last two years, by awarding a higher multiple to TCS (17x vs 15x for Infosys), we note that the gap in their performance has widened signifcanlty over the last few quarters. Post its 1QFY14 results, which were, at best, in‐line with expectations, Infosys stock has surged 22% ‐ partly aided by the depreciating Rupee. Today, on our estimates, its trades at 14x FY15 earnings vs 16x multiple for TCS.
TCS has widened the revenue and shrunk the margin gap ….. but the current valuation gap do not capture the same
0%
5%
10%
15%
20%
25%
30%
35%
40%
0
2
4
6
8
10
12
14
16
18
20
FY08
FY09
FY10
FY11
FY12
FY13
in US$bn
$ Revenue Infy (LHS) $ Revenue TCS (LHS)EBITDA% Infy (RHS) EBITDA% TCS (RHS)
10
12
14
16
18
20
22
1Q '12
2Q '12
3Q '12
4Q '12
1Q '13
2Q '13
3Q '13
4Q '13
1Q '14
Infosys ‐PETCS ‐PE
Source: Company, PhillipCapital India Research
We feel the current valuation gap between the two giants is too narrow to corectly reflect their risk‐reward profile. While a lower than expected 2QFY14 results from Infosys is a distinct possibility, TCS has been consistently beating its own guidance and is expected to deliver a yet another stellar set of result in 2QFY14. In our opinion, that would lead widedning of the valuation gap between the two stocks, again – and presents a potetntial downside risk to Infosys stock, from current levels.
Exodus of key employees to have huge impact Over the last 18 months, a number of key high profile executives have left Infosys, joining rival companies for better salary, position or profile. We believe the exodus could have significant impact on the company’s ability to turn the business around, and recover lost market share in medium to long term.
Some of the key high profile employees have left Infosys over the last 18 months Date Name Designation Move post exit RUM
15‐Apr‐11 Mohandas Pai Head of HR NA
11‐Jun‐11 Subhash Dhar Sr VP and Head ‐ innovations & sales Started “Enterprise Nube”
21‐May‐12 Ritesh Idnani BPO ‐ Chief Operating Officer ISGN ~6.2%
4‐Sep‐12 Shaji Farooq Head of Banking & Capital Markets (BCM), Americas Wipro – Sr VP & Global Head of Advanced Technologies ~17.3%
2‐Jan‐13 Binod Rangadore Sr VP and Global Head of Corp Relations Re‐instated as Head – Global Delivery Model
9‐Jul‐13 Basab Pradhan Global Head of sales and marketing Focused into new ventures in IT space
26‐Aug‐13 Sudhir Chaturvedi Head of Financial Services, Americas COO – NIIT Technologies ~16.6%
29‐Aug‐13 Ashok Vemuri Head of Americas, Global head of Manuf & Engg Services CEO – iGate 61.4%
5‐Sep‐13 Humberto Andrade Head of Latin American BPO Operations Joined CapGemini Source: Media reports, BSE Archives, PhillipCapital India Research; #RUM – Revenue under management before exit.

– 33 of 67 –
17 September 2013 / INDIA EQUITY RESEARCH / INFOSYS COMPANY UPDATE
It is interesting to observe that a number of key high profile exits have happened after Mr. Narayana Murthy was reinstated as the Executive Chairman of the company, in June‐2013. While Mr. Murthy has been brought back to make the company “desirable” again, we see the exit of key employees as a big setback to the effort.
The new centralized structure – solution or the problem ? In June‐2013, Mr. Narayana Murthy was reinstated as the Executive Chairman of the company. Post his retirement from the firm in 2011, this was a desperate attempt by the Infosys management, to help the company capture lost market share and make the company “desirable” again. Mr Murthy also brought along his son, Mr Rohan Murthy, initially as an executive assistant, but it now, as per mdeia reports, awaiting approval from MCA to be formally inculcated in the company as a VP. While Mr. Murthy’s return is definitely a positive development for the company, we expect the overhaul and reconstruction process to be long drawn. Also, Mr. Murthy’s return has meant increasing centralization of decision making process in Infosys, as opposed to decentralization which the current CEO was adopting. The key decision pertaining to deals and their pricing have now been centralized and require approval of an Executive Council, headed by Mr Murhty himself. All the verticals and grography head report to this executive council.
The new centralized structure under Mr. Murthy – will it work ?
Ranganath D Mavinakere(Head – Cost Optimisation
Initiative)
Binod Rangadore(Head –Delivery of software
projects across regions)
Nithyanandan Radhakrishnan(Head – Legal [Internal])
NRN Murthy
Sales Head Vertical Heads Horizontal Heads HR
Rest of the organisation
Centralised Structure: All would be reporting to the executive council formed under the Chairman.
Source: Media reports, Company We believe this centralized structure might be a double edged sword for the company. While it may ensure that all decisions are taken with only one objective in sight, it may inadverently delay the decision making process, and might lead to frustration amongst senior employees. We see this as one of possible reasons for the four highprofile exits from the company, ever since Mr Murthy joined back.

– 34 of 67 –
17 September 2013 / INDIA EQUITY RESEARCH / INFOSYS COMPANY UPDATE
What went wrong with Infosys 3.0? After being hit by the Lehman crisis in 2009, the company overcame most of its challenges by gaining back market share and taking the lead in the IT services business. We also note that during the same period, Infosys had outrun its peers in both revenue growth and margins and kept its credibility in check during FY10‐H1FY12. Post FY10, after 12 years of successful stint for Infosys 2.0, the management came up with a strategic change in its focused areas to a build‐up in consulting and enterprise services space expanding its approach towards emerging verticals such as retail, healthcare, and media & entertainment along with the majors – BFSI & manufacturing for Infosys 3.0. While placing focus on realizing Infosys 3.0, it is apparent that the company lost business from its clients in both ADMS and other emerging service lines when they assumed growth in consulting & PI space. The discretionary part of their business dragged their revenue growth targets and the overall decision cycle delay put the mismatch in its strategic focus, in an overdrive. The scenario of this impact continues to haunt the investors in terms of visibility and deal churns. Consistently falling short of its own guidance over the last two years
‐10%
‐5%
0%
5%
10%
15%
20%
25%
30%
FY09 FY10 FY11 FY12 FY13
Lower range guidance Actual growth % Upper range guidance
Source: Company, PhillipCapital India Research
Declining revenue growth in most horizontals and verticals
‐10%
0%
10%
20%
30%
40%
50%
60%
FY08 FY09 FY10 FY11 FY12 FY13
YoY rev grow
th %
ADMS CPITesting
‐20%
‐10%
0%
10%
20%
30%
40%
50%
60%
70%
FY08 FY09 FY10 FY11 FY12 FY13
YoY rev grow
th %
BFSI ManufacturingRetail Telecom
Source: Company, PhillipCapital India Research

– 35 of 67 –
17 September 2013 / INDIA EQUITY RESEARCH / INFOSYS COMPANY UPDATE
Proportion of emerging services remains lower than peers Infosys remains the company with maximum exposure to services related to discretionary spends (traditional services revenue share ‐ 75%) amongst the the top 4 Indian IT vendors. Service lines such as ADMS, PI and SI all have higher proportion of discretionary projects which also follow the basic T&M model. Unlike the other companies in the outsourcing space, Infosys has either been reluctant to, or worse, has been unable to shift its focus to emerging services ‐ such as Infrastructure services or Business Intelligence or Business Analytics. In the past six years (FY08‐13), Infosys peers’ like TCS, HCL tech and Wipro have grown their emerging service lines from ~30% to a contribution level of ~40% to revenues. That has enabled them to choose the favorable business models to function under the current stressful conditions. Inosys lag well behind at less than 25%. Lowest share of revenue from emerging lines of services – a matter of concern
20%
25%
30%
35%
40%
45%
50%
FY08 FY09 FY10 FY11 FY12 FY13
% con
tribution to sales
Infosys Emgg rev TCS Emgg rev
Wipro Emgg rev HCL Tech Emgg rev
Source: PhillipCapital India Research
Loss in wallet‐share from top as well as tail accounts Infosys saw a decline in its walletshare revenues per accounts in FY13. While its peers gained incremental walletshare significantly during FY11‐13, Infosys saw a decline in its annualized $ revenues per client to two year low from $10.1mn to $9.3mn. This loss in walletshare indicates its loss of favor and a weak client mining, inturn indicating a low incentivized sales team.
Loss in revenue recognition from top and tail accounts
4
5
6
7
8
9
10
11
12
FY07 FY08 FY09 FY10 FY11 FY12 FY13
Ann
ualized
rev/client, in US$
mn
InfosysTCSHCL Tech
3
4
5
6
7
8
9
FY07 FY08 FY09 FY10 FY11 FY12 FY13
Tail accoun
t rev/client, in US$ mn
InfosysTCSHCL Tech
Source: PhillipCapital India Research

– 36 of 67 –
17 September 2013 / INDIA EQUITY RESEARCH / INFOSYS COMPANY UPDATE
Increase in S&M spend might lead to contraction of margins Infosys has seen sigifincat margin erosion over the last five years – from an above industry average of ~32% to 27% in FY13. We believe that additional investments on domain expertise and adaptation to new services might take additional toll on its margins for a medium to long term. Continued competition from TCS on traditional & emerging services, and HCL Tech on IMS and enterprise services would make it a challenging scenario for Infosys to get back their margins to pre‐FY12 levels. Operating margins too, have contracted, on higher technical employee costs
25%
27%
29%
31%
33%
35%
37%
0%
10%
20%
30%
40%
50%
FY07 FY08 FY09 FY10 FY11 FY12 FY13
Revenue growth % (LHS)
EBITDA margins (RHS)
Source: Company, PhillipCapital India Research
The recent move of Infosys management to give salary hikes for the employees along with 8% hike for Infosys’ global sales team is a desperate decision made for regaining the lost vigor for client additions and existing client mining. We note that the average S&M spends by Infosys for the past 5 years has been far behind its peers. This has led to a scenario that the deal wins and client mining at Infosys, has been at a low for the past 4‐5 years, explaining the loss in market share and inability to achieve its revenue targets consistently. To counter this, we expect the company to increase spends in S&M and investments, which might impact the company’s margins in the long run. While rupee volatility would manage to keep the cost inflation at bay, it would only be a short term adjustment.
Infosys and Wipro have the lowest on S&M spends over the last 6 years
10%
12%
14%
16%
18%
20%
22%
SGA as a
% of sales
TCSInfosysHCL techWipro
10%
12%
14%
16%
18%
20%
SGA as a
% of sales
TCSInfosysHCL techWipro
Source: PhillipCapital India Research

– 37 of 67 –
17 September 2013 / INDIA EQUITY RESEARCH / INFOSYS COMPANY UPDATE
Deal wins have narrowed over the last 5 years as against peers
1.11.4
3.1
2.3
4.9
3.2
1.4
0.6
1.71.9
2.4
1.31.0
1.5
2.1 1.9
3.8
2.6
0
1
2
3
4
5
6
FY08 FY09 FY10 FY11 FY12 FY13
TCV (Large
deals), US$
bn
TCS Infosys HCL tech
Source: PhillipCapital India Research
Headroom in utilizations, lowering headcount additions might support margins Infosys’ utilisations saw its bottom during the recent quarters, despite reductions in hiring targets for two years. This signifies the lowering volume recognition from its projects. Alongside we also saw an increase in laterals among gross additions which works out to a high cost strategy in short term. Expansion in utilisations while reducing bench can potentially become a tailwind for margin expansions, for the company.
Reduced headcount addition, higher proportion of laterals to enrich the pool of professionals
0
10
20
30
40
50
FY07 FY08 FY09 FY10 FY11 FY12 FY13
in '000
s
Net addition Gross addition
0%
10%
20%
30%
40%
50%
0
5
10
15
20
25
30
35
FY07 FY08 FY09 FY10 FY11 FY12 FY13
in '000
s
Freshers (LHS)Laterals (LHS)Lateral additions to gross % (RHS)
Source: PhillipCapital India Research
While reducing the bench ratio, expansion in utilisations would improve the company’s productivity, further adding to expansion in margins. We believe that the enrichment of its employee base with experienced professionals replacing trainees would also boost productivity. Lodestone acquisition to support revenue growth Infosys acquired Lodestone as a part of Infosys 3.0 strategy to expand through its IT consulting business. The acquisition was conducted at 1.5x Lodestone’s CY12 revenues at a total acquisition value of US$349mn – paid in cash. The company currently contributes to ~4.5% of overall revenues.

– 38 of 67 –
17 September 2013 / INDIA EQUITY RESEARCH / INFOSYS COMPANY UPDATE
Lodestone, being a US based consulting player, employs ~850 staff most of whom are US localites – factoring in a higher than Infosys’ average employee cost. We note that while Lodestone revenue contribution grows, the margin contribution would drag down the company average further. However the management expects expansion in the margins as the company restructures the resource model currently used by Lodestone. Large cash chest – untapped potential Among the top 4 IT vendors in India Infosys has the largest chest of cash in its books. In FY13, the company had cash and cash equivalents of Rs235bn. Although the RoE levels have declined from 25% in FY11 to ~23% in FY13, its potential of leveraging inorganic avenues to boost its revenues remains high in comparison with other peers. We believe that, inorder to become a “desirable” services vendor in growth horizontals such as consulting and enterprise services, Infosys might go for a streak of medium to big acquisitions across geographies and verticals. This will also provide domain expertise, while offshoring could be infused to improve profitability. The utilisation of cash from books could support Infosys to adapt to the changing environment towards a low cost‐high value business model.
Valuations
1 year forward band chart P/E Band EV/EBITDA
10x
15x
20x
25x
0
1000
2000
3000
4000
5000
Apr‐04
Apr‐05
Apr‐06
Apr‐07
Apr‐08
Apr‐09
Apr‐10
Apr‐11
Apr‐12
Apr‐13
(Rs)
6x
12x
18x
24x
0
500000
1000000
1500000
2000000
2500000
3000000
3500000
Apr‐04
Apr‐05
Apr‐06
Apr‐07
Apr‐08
Apr‐09
Apr‐10
Apr‐11
Apr‐12
Apr‐13
(Rs mn)
Source: Bloomberg, PhillipCapital India Research
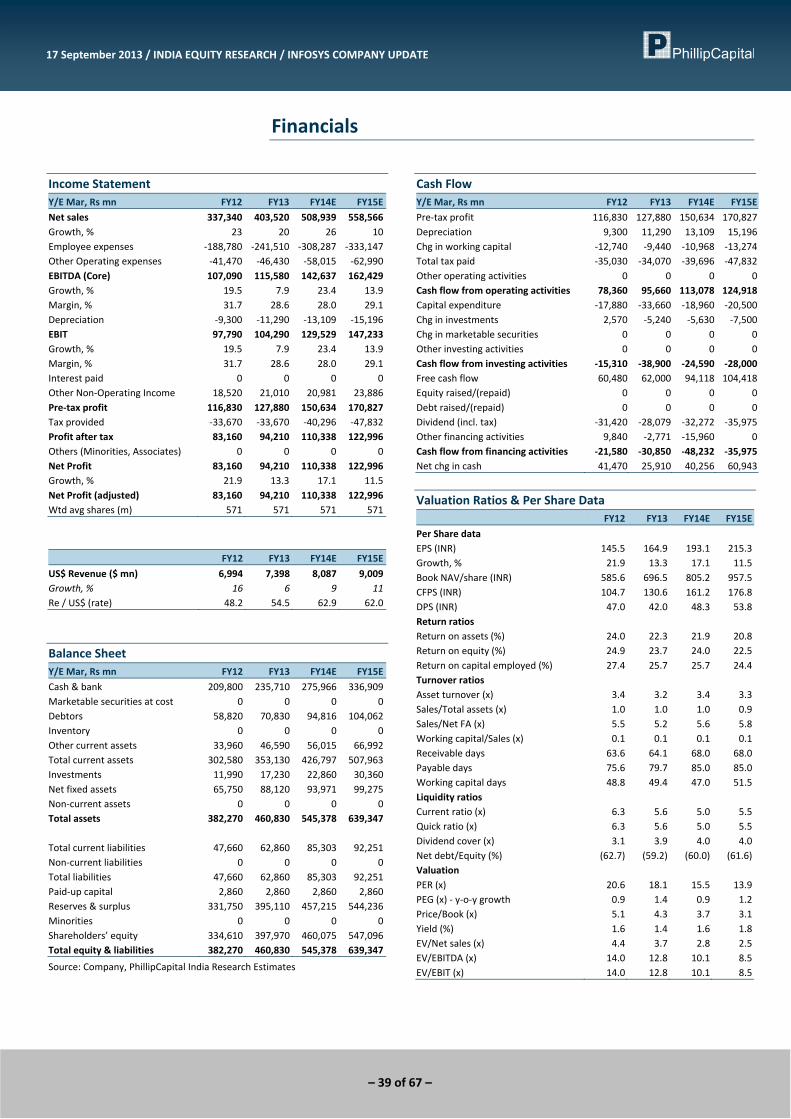
– 39 of 67 –
17 September 2013 / INDIA EQUITY RESEARCH / INFOSYS COMPANY UPDATE
Financials
Income Statement Y/E Mar, Rs mn FY12 FY13 FY14E FY15E
Net sales 337,340 403,520 508,939 558,566Growth, % 23 20 26 10Employee expenses ‐188,780 ‐241,510 ‐308,287 ‐333,147Other Operating expenses ‐41,470 ‐46,430 ‐58,015 ‐62,990EBITDA (Core) 107,090 115,580 142,637 162,429Growth, % 19.5 7.9 23.4 13.9Margin, % 31.7 28.6 28.0 29.1Depreciation ‐9,300 ‐11,290 ‐13,109 ‐15,196EBIT 97,790 104,290 129,529 147,233Growth, % 19.5 7.9 23.4 13.9Margin, % 31.7 28.6 28.0 29.1Interest paid 0 0 0 0Other Non‐Operating Income 18,520 21,010 20,981 23,886Pre‐tax profit 116,830 127,880 150,634 170,827Tax provided ‐33,670 ‐33,670 ‐40,296 ‐47,832Profit after tax 83,160 94,210 110,338 122,996Others (Minorities, Associates) 0 0 0 0Net Profit 83,160 94,210 110,338 122,996Growth, % 21.9 13.3 17.1 11.5Net Profit (adjusted) 83,160 94,210 110,338 122,996Wtd avg shares (m) 571 571 571 571
FY12 FY13 FY14E FY15E
US$ Revenue ($ mn) 6,994 7,398 8,087 9,009Growth, % 16 6 9 11Re / US$ (rate) 48.2 54.5 62.9 62.0
Balance Sheet Y/E Mar, Rs mn FY12 FY13 FY14E FY15E
Cash & bank 209,800 235,710 275,966 336,909Marketable securities at cost 0 0 0 0Debtors 58,820 70,830 94,816 104,062Inventory 0 0 0 0Other current assets 33,960 46,590 56,015 66,992Total current assets 302,580 353,130 426,797 507,963Investments 11,990 17,230 22,860 30,360Net fixed assets 65,750 88,120 93,971 99,275Non‐current assets 0 0 0 0Total assets 382,270 460,830 545,378 639,347 Total current liabilities 47,660 62,860 85,303 92,251Non‐current liabilities 0 0 0 0Total liabilities 47,660 62,860 85,303 92,251Paid‐up capital 2,860 2,860 2,860 2,860Reserves & surplus 331,750 395,110 457,215 544,236Minorities 0 0 0 0Shareholders’ equity 334,610 397,970 460,075 547,096Total equity & liabilities 382,270 460,830 545,378 639,347
Source: Company, PhillipCapital India Research Estimates
Cash Flow Y/E Mar, Rs mn FY12 FY13 FY14E FY15E
Pre‐tax profit 116,830 127,880 150,634 170,827Depreciation 9,300 11,290 13,109 15,196Chg in working capital ‐12,740 ‐9,440 ‐10,968 ‐13,274Total tax paid ‐35,030 ‐34,070 ‐39,696 ‐47,832Other operating activities 0 0 0 0Cash flow from operating activities 78,360 95,660 113,078 124,918Capital expenditure ‐17,880 ‐33,660 ‐18,960 ‐20,500Chg in investments 2,570 ‐5,240 ‐5,630 ‐7,500Chg in marketable securities 0 0 0 0Other investing activities 0 0 0 0Cash flow from investing activities ‐15,310 ‐38,900 ‐24,590 ‐28,000Free cash flow 60,480 62,000 94,118 104,418Equity raised/(repaid) 0 0 0 0Debt raised/(repaid) 0 0 0 0Dividend (incl. tax) ‐31,420 ‐28,079 ‐32,272 ‐35,975Other financing activities 9,840 ‐2,771 ‐15,960 0Cash flow from financing activities ‐21,580 ‐30,850 ‐48,232 ‐35,975Net chg in cash 41,470 25,910 40,256 60,943
Valuation Ratios & Per Share Data FY12 FY13 FY14E FY15E
Per Share data EPS (INR) 145.5 164.9 193.1 215.3Growth, % 21.9 13.3 17.1 11.5Book NAV/share (INR) 585.6 696.5 805.2 957.5CFPS (INR) 104.7 130.6 161.2 176.8DPS (INR) 47.0 42.0 48.3 53.8Return ratios Return on assets (%) 24.0 22.3 21.9 20.8Return on equity (%) 24.9 23.7 24.0 22.5Return on capital employed (%) 27.4 25.7 25.7 24.4Turnover ratios Asset turnover (x) 3.4 3.2 3.4 3.3Sales/Total assets (x) 1.0 1.0 1.0 0.9Sales/Net FA (x) 5.5 5.2 5.6 5.8Working capital/Sales (x) 0.1 0.1 0.1 0.1Receivable days 63.6 64.1 68.0 68.0Payable days 75.6 79.7 85.0 85.0Working capital days 48.8 49.4 47.0 51.5Liquidity ratios Current ratio (x) 6.3 5.6 5.0 5.5Quick ratio (x) 6.3 5.6 5.0 5.5Dividend cover (x) 3.1 3.9 4.0 4.0Net debt/Equity (%) (62.7) (59.2) (60.0) (61.6)Valuation PER (x) 20.6 18.1 15.5 13.9PEG (x) ‐ y‐o‐y growth 0.9 1.4 0.9 1.2Price/Book (x) 5.1 4.3 3.7 3.1Yield (%) 1.6 1.4 1.6 1.8EV/Net sales (x) 4.4 3.7 2.8 2.5EV/EBITDA (x) 14.0 12.8 10.1 8.5EV/EBIT (x) 14.0 12.8 10.1 8.5

– 40 of 67 –
Wipro Out of the woods ?
Company Update 17 September 2013
PhillipCapital (India) Pvt. Ltd.
Management reshuffle leading to muted performance Wipro’s management has seen constant reshuffle ever since Mr Kurien took over as CEO in Feb‐2011. Change in different chief positions from major departments in both IT Services and consumer space have taken a huge hit on its operations for the past 2 years, and led to sub 8% growth (in $ terms) and non‐expansive margins over the last four years. Historically low S&M spend reflecting in poor results now Wipro, along with Infosys has historically been the lowest spender on S&M activity (13% of sales vs 19% for TCS). This has led to loss of wallet share in key accounts, and the revenue per client growing by only 28% in last five years. In the last two years, the client mining has been even more dismal, and so has company’s performance in terms of deal wins. We expect the company will find it difficult to turn this trend around in near future, and any increment in S&M activity will lead to contraction in margins. Increasing focus on non‐linear revenue stream Wipro’s revenue contribution from non‐linear avenues has increased from 35% of total revenues in FY09 to 45% in FY13. While it still lags TCS and HCL Tech, the gap has significantly narrowed in last two years. We see clear management focus on driving non‐linear revenues, especially from the new age technologies of CAMS, and the same to help company mitigate slackening of demand in the discretionary spending. Demerger of consumer business adds to value creation By unlocking the high margin core IT business from a low margin consumer business (~13% of consolidated revenues and ~5% of net profit), investors gained a better value stock with 22% RoEs and with a cash position of Rs154bn. We expect the demerger to lead to operational efficiencies with increased focus and reallocation of senior management to separate responsibilities. Strong revenue guidance for 2QFY14 indicates management confidence Wipro management has guided to 2‐4% QoQ growth in topline ($ terms) for 2QFY14 – a strong guidance as compared to peers. The management seems confident of achieving the same on the back of recent deal wins, signs of revival in the US and increasing acceptance of outsourcing in Europe. If the company manages to meet its guidance, we expect the stock to react sharply and can lead to significant re‐rating in near future. Valuation gap with bellwether to remain Wipro is currently trading 14x FY14 and 13x FY15 earnings – a significant discount to TCS (19x FY14 and 16x FY15 earnings). We expect the gap to remain unless the company shows signs of significant turnaround, sustainable over longer period of time. We do not see the same happening in near future. We value the stock at 14x FY15 earnings, giving us a price target of Rs486, representing 8% upside from current levels. We recommend NEUTRAL.
NEUTRAL WPRO IN | CMP RS 451
TARGET RS 486 (8%) Company Data
O/S SHARES (MN) : 2465MARKET CAP (RSBN) : 1113MARKET CAP (USDBN) : 17.752 ‐ WK HI/LO (RS) : 501/ 299LIQUIDITY 3M (USDMN) : 17.5FACE VALUE (RS) : 2
Share Holding Pattern, %
PROMOTERS : 73.5FII / NRI : 10.3FI / MF : 4.6NON PROMOTER CORP. HOLDINGS : 5.3PUBLIC & OTHERS : 6.4
Price Performance, % 1mth 3mth 1yrABS ‐1.0 33.7 29.8REL TO BSE ‐7.3 30.7 22.8
Price Vs. Sensex (Rebased values)
60
70
80
90
100
110
120
130
140
Apr‐10 Mar‐11 Feb‐12 Jan‐13
Wipro BSE Sensex
Source: Bloomberg, Phillip Capital Research
Key Ratios
Rs bn FY13 FY14E FY15E
Net Sales 374.3 455.4 481.9EBIDTA 79.8 101.6 106.5Net Profit 61.3 80.9 85.3EPS, Rs 24.9 32.9 34.7PER, x 18.1 13.7 13.0EV/EBIDTA, x 12.9 9.9 9.2P/BV, x 3.9 3.3 2.8ROE, % 21.6 24.0 21.7Source: Phillip Capital India Research Vibhor Singhal (+ 9122 6667 9949) [email protected] Varun Vijayan (+ 9122 6667 9992) [email protected]

– 41 of 67 –
17 September 2013 / INDIA EQUITY RESEARCH / WIPRO COMPANY UPDATE
Management reshuffles affected the core – leading to muted performance over the years Wipro has seen a major reshuffle in its top management starting from the time when Mr T K Kurien took over as the CEO of the company in February of 2011. Change in different chief positions from major departments in both IT Services and consumer space have taken a huge hit on its operations over the past 2 years. Except for the pent up growth in FY11 (industry phenomena), Wipro has reported muted sub 8% growth (in $ terms). Journeying through a weak demand environment, Wipro still shows weakness on many levels such as low visibility in growth and non‐expansive margins over the years. We believe that the internal issues have impacted most of Wipro’s operations to the core. However its recent focus on technology infrastructure services have helped the segment to grow close to average industry growth rates in the space for the past 3 quarters. We note that the recent change in the management’s outlook could be an indication of improvement from their strategic structural benefits, but it might be too early to judge on Wipro’s operational performance.
Muted performance in terms of revenue growth as well as margin expansion
0%
2%
4%
6%
8%
10%
12%
14%
16%
18%
20%
0
1
2
3
4
5
6
7
FY09 FY10 FY11 FY12 FY13
in US$
bn
US$ revenues (LHS)
YoY growth % (RHS)
15%
16%
17%
18%
19%
20%
21%
22%
23%
24%
FY09 FY10 FY11 FY12 FY13
Wipro EBIT margins %
Source: PhillipCapital India Research
Constant management reshuffle hasn’t helped the cause Date Name Designation Changes in management roles/exits
Aug‐13 Manish Dugar Global CEO of Wipro BPO Joined InMobi as VP Finance and Legal
Nov‐12 Shaji Farooq Infosys' Head of BFS, Americas Joined Wipro as Head of Advanced Technologies and Alliances
Jun‐11 Suresh Senapathy Wipro Limited CFO Centralised CFO position of Wipro Limited, Wipro IT business and Wipro BPO
Jun‐11 Manish Dugar Wipro IT business' CFO Changed to Head of Wipro BPO
Feb‐11 T K Kurien President of Wipro Eco Energy business CEO of Wipro Technologies (IT business)
Jan‐11 Suresh Vaswani
Joint CEOs of Wipro Technologies (IT Business)
Joined as Exec VP of Dell Services, and chairman of Dell India business
Girish Paranjpe Joined IBS board as and independent director. Currently at Bloom EnergyInternational as MD
Source: Media reports, Company

– 42 of 67 –
17 September 2013 / INDIA EQUITY RESEARCH / WIPRO COMPANY UPDATE
Historically low S&M spend leading to loss of wallet‐share from key accounts Wipro, along with Infosys has historically been the lowest spender on S&M activity. This has led to loss of wallet share in key accounts, and the revenue per client growing by only 28% in last five years.
After being one of the lowest spenders on S&M over the years, Wipro has picked up over the last few quarters
10%
12%
14%
16%
18%
20%
22%
SGA as a
% of sales
TCSInfosysHCL techWipro
10%
12%
14%
16%
18%
20%
SGA as a
% of sales
TCSInfosysHCL techWipro
Source: PhillipCapital India Research
The company has witnessed a gradual decline in revenue growth from its entire client base – top 10 as well as tail accounts. Lower S&M spend over the years has left the company exposed to competition, especially from TCS and HCL Tech, which remain the highest spenders on S&M activity, and have managed to grab most deals in the last two years.
Revenue growth has declined from top‐10 as well as non‐top‐10 accounts
0%
5%
10%
15%
20%
25%
FY09 FY10 FY11 FY12 FY13
Top 10 growthNon Top 10 growthOverall rev growth
‐4%
‐2%
0%
2%
4%
6%
8%
10%
1Q '12 2Q '12 3Q '12 4Q '12 1Q '13 2Q '13 3Q '13 4Q '13
Top 10 growthNon Top 10 growthOverall rev growth
Source: Company, PhillipCapital India Research
In terms of client mining too, Wipro’s performance appears dismal. Annualized revenue per client has grown by 28% over the last five years (~100% for TCS). It is interesting to note that the client mining activity hasn’t improved, inspite of the company ramping‐up the S&M spend over the last two years – pointing to difficulty in reversing these trends.

– 43 of 67 –
17 September 2013 / INDIA EQUITY RESEARCH / WIPRO COMPANY UPDATE
Muted performance in terms of client additions Client size FY09 FY10 FY11 FY12 FY13
1‐3mn 207 ‐27 ‐6 9 163‐5mn 67 ‐7 15 9 ‐65‐10mn 60 10 ‐7 22 ‐510‐20mn 40 0 9 ‐3 1120‐50mn 36 4 6 4 050mn+ 17 ‐1 6 3 1
Source: PhillipCapital India Research
Wallet share – revenue recognition in top and tail has dragged over last two years
5.05.2
5.8
6.3 6.4
2.5
3.0
3.5
4.0
4.5
5.0
5.5
6.0
6.5
7.0
FY09 FY10 FY11 FY12 FY13
In US$
mn
Annualized rev/client
4.04.2
4.7
5.0 5.0
2.0
2.5
3.0
3.5
4.0
4.5
5.0
5.5
FY09 FY10 FY11 FY12 FY13
In US$
mn
Rev/non top 10
Source: PhillipCapital India Research
Gradually capturing lost ground of non‐linear revenues Wipro’s revenue contribution from non‐linear avenues has increased from 35% of total revenues in FY09 to 45% in FY13. While it still lags TCS and HCL Tech, the gap has significantly narrowed in last two years. We see clear management focus on driving non‐linear revenues, especially from the new age technologies of CAMS, and the same to help company mitigate and slackening of demand in the discretionary spending Lags the peers in terms of non‐linear revenue share
30%
35%
40%
45%
50%
55%
FY09 FY10 FY11 FY12 FY13
Non
T&M re
v %
Infosys TCS
HCL Tech Wipro
Source: Company, PhillipCapital India Research

– 44 of 67 –
17 September 2013 / INDIA EQUITY RESEARCH / WIPRO COMPANY UPDATE
IMS to lead through tough times Wipro is currently the leader (market share) and was the initiator of non‐discretionary services like IMS. However, it has been unable to capitalize on the headstart and has been unable to gain deal wins or improve its value to the customer. However, IMS (32% of revenues) remains the domain which we expect would help the company to mitigate the current slowdown in discretionary spending.
Wipro continues to be the leader in IMS space
0
200
400
600
800
1000
1200
1400
1600
FY09 FY10 FY11 FY12 FY13
IMS rev, in
US$
mn
Infosys HCLTTCS Wipro
0%
5%
10%
15%
20%
25%
30%
35%
40%
FY09 FY10 FY11 FY12 FY13
IMS rev YoY growth %
Source: PhillipCapital India Research
Demerger of the consumer business – operational efficiencies Demerging Wipro’s consumer business (~13% of consol revenues and ~5% PAT) was a positive move in terms of increasing value for the investors. By unlocking the high margin core IT business from a low margin consumer business, investors gained a better value stock with 22% RoEs and with a cash position of Rs154bn (incl marketable securities). In terms of operational advantage, the demerger provides better focus on both the businesses, through reallocation of resources and re‐categorization of incentive structures. We expect an improvement in efficiency both in terms of business structure and also the strategy in focus for the IT business.
Valuations
1 year forward band chart P/E Band EV/EBITDA
6x
12x
18x
24x
0
200
400
600
800 (Rs)
6x
12x
18x
24x
0
400000
800000
1200000
1600000
2000000
2400000 (Rs mn)
Source: Bloomberg, PhillipCapital India Research

– 45 of 67 –
17 September 2013 / INDIA EQUITY RESEARCH / WIPRO COMPANY UPDATE
Financials
Income Statement Y/E Mar, Rs mn FY12 FY13 FY14E FY15E
Net sales 318,747 374,256 455,418 481,861Growth, % 3 17 22 6Employee expenses ‐217,027 ‐250,808 ‐299,986 ‐319,530Other Operating expenses ‐33,041 ‐43,619 ‐53,862 ‐55,800EBITDA (Core) 68,679 79,829 101,570 106,531Growth, % 7.4 16.2 27.2 4.9Margin, % 21.5 21.3 22.3 22.1Depreciation ‐8,767 ‐9,857 ‐9,875 ‐10,430EBIT 59,912 69,972 91,695 96,100Growth, % 4.7 16.8 31.0 4.8Margin, % 18.8 18.7 20.1 19.9Interest paid 0 0 0 0Other Non‐Operating Income 5,611 8,624 10,691 11,721Pre‐tax profit 68,942 83,608 102,387 107,822Tax provided ‐12,955 ‐16,912 ‐21,024 ‐22,103Profit after tax 55,987 66,696 81,363 85,718Others (Minorities, Associates) ‐257 ‐337 ‐419 ‐441Net Profit 55,730 66,359 80,944 85,277Growth, % (1.3) 17.3 31.9 5.4Net Profit (adjusted) 52,311 61,347 80,944 85,277Wtd avg shares (m) 2,458 2,459 2,461 2,461
$ mn FY12 FY13 FY14E FY15E
US$ Revenue (Consol) 6,711 6,935 7,239 7,772Growth, % 3.3 4.4 7.4Re / US$ (rate) 48.0 54.4 62.9 62.0
Balance Sheet Y/E Mar, Rs mn FY12 FY13 FY14E FY15E
Cash & bank 77,666 84,838 88,818 89,499Marketable securities at cost 41,961 69,171 93,219 108,219Debtors 80,328 76,635 92,331 100,333Inventory 10,662 3,263 3,743 3,960Other current assets 62,871 73,496 90,023 104,029Total current assets 273,488 307,403 368,134 406,040Investments 3,232 0 0 0Net fixed assets 131,154 106,995 115,671 123,141Non‐current assets 28,127 25,332 31,879 34,694Total assets 436,001 439,730 515,685 563,875 Total current liabilities 117,685 144,740 156,284 152,984Non‐current liabilities 32,153 10,007 20,968 16,672Total liabilities 149,838 154,747 177,252 169,656Paid‐up capital 4,917 4,926 4,928 4,928Reserves & surplus 280,397 278,886 332,145 387,490Minorities 849 1,171 1,360 1,801Shareholders’ equity 286,163 284,983 338,433 394,219Total equity & liabilities 436,001 439,730 515,685 563,875
Source: Company, PhillipCapital India Research Estimates
Cash Flow Y/E Mar, Rs mn FY12 FY13 FY14E FY15E
Pre‐tax profit 68,942 83,608 102,387 107,822Depreciation 8,767 9,857 9,875 10,430Chg in working capital ‐43,030 30,317 ‐27,707 ‐28,339Total tax paid ‐12,955 ‐16,912 ‐21,024 ‐22,103Other operating activities ‐3,419 ‐5,012 0 0Cash flow from operating activities 18,305 101,858 63,530 67,810Capital expenditure ‐3,785 14,302 ‐18,551 ‐17,900Chg in investments ‐239 3,232 0 0Chg in marketable securities 7,321 ‐27,210 ‐24,048 ‐15,000Other investing activities 0 0 0 0Cash flow from investing activities 3,297 ‐9,676 ‐42,599 ‐32,900Free cash flow 14,520 116,160 44,979 49,910Equity raised/(repaid) 6,972 ‐18,768 534 0Debt raised/(repaid) 1,699 ‐22,146 10,961 ‐4,297Dividend (incl. tax) ‐17,252 ‐20,141 ‐28,409 ‐29,932Other financing activities 3,603 ‐23,940 192 0Cash flow from financing activities ‐5,077 ‐85,010 ‐16,952 ‐34,229Net chg in cash 16,525 7,172 3,980 681
Valuation Ratios & Per Share Data FY12 FY13 FY14E FY15E
Per Share data EPS (INR) 21.3 24.9 32.9 34.7Growth, % (1.6) 17.2 31.9 5.3Book NAV/share (INR) 116.1 115.4 137.0 159.4CFPS (INR) 16.6 28.0 28.3 24.3DPS (INR) 6.0 7.0 9.9 10.4Return ratios Return on assets (%) 13.9 15.2 17.0 15.9Return on equity (%) 18.3 21.6 24.0 21.7Return on capital employed (%) 19.0 21.7 24.9 22.3Turnover ratios Asset turnover (x) 1.6 2.0 2.4 2.3Sales/Total assets (x) 0.8 0.9 1.0 0.9Sales/Net FA (x) 2.4 3.1 4.1 4.0Receivable days 92.0 74.7 74.0 76.0Inventory days 12.2 3.2 3.0 3.0Payable days 69.0 59.6 58.7 57.1Working capital days 41.4 8.4 23.9 41.9Liquidity ratios Current ratio (x) 2.3 2.1 2.4 2.7Quick ratio (x) 2.2 2.1 2.3 2.6Dividend cover (x) 3.5 3.6 3.3 3.3Total debt/Equity (%) 24.0 25.7 21.8 17.4Net debt/Equity (%) (3.2) (4.2) (4.5) (5.4)Valuation PER (x) 21.2 18.1 13.7 13.0PEG (x) ‐ y‐o‐y growth (13.5) 1.1 0.4 2.4Price/Book (x) 3.9 3.9 3.3 2.8Yield (%) 1.3 1.6 2.2 2.3EV/Net sales (x) 3.3 2.7 2.2 2.0EV/EBITDA (x) 15.4 12.9 9.9 9.2EV/EBIT (x) 17.6 14.7 10.9 10.2

– 46 of 67 –
Persistent Systems Early bird catches more prey
Initiating Coverage 17 September 2013
PhillipCapital (India) Pvt. Ltd.
Superior return profile; margins much higher than peers We expect PSYS to grow by a CAGR of ~26% over FY12‐15, maintaining average EBITDA margins of ~24% over the period. The company operates at much higher margins than peers in the product engineering space, owing to its higher offshoring profile (90%). The PAT growth is expected to be 30% over this period, enabling the company to deliver robust ROE of 22%.
Leading player in the Offshore Product development (OPD) domain India’s OPD exports grew to $1.4bn in FY13 – growing faster than the industry growth of 17%. We expect Persistent Systems (PSYS), one of the leading players in the OPD domain, with the experience of having developed more than 3,000 products and applications for nearly 300 customers in the last five years, to benefit immensely from the ever increasing demand for offshoring of the product development process from varoius ISVs.
Early mover advantage in CAMS domain PSYS has been a pioneer in CAMS domains, which, according to various experts, are the building blocks for technology products and enterprise applications of the future. PSYS developed its first application on an external cloud platform in 2007. We expect the technical expertise and relationships that PSYS has developed in these domains, to be the growth driver for the company, over the next decade.
Tough immigration laws to make product companies more attractive As domestic unemployment rates reach unprecedented highs in most developed countries, we expect more countries to join the US, in implementing stricter immigration laws. To counter their impact, most of IT companies will have to either start offshoring larger part of their development (which might not augur well for the “Services” domain) or increase the proportion of local employees in their workforce (which will lead to significant erosion of margins).
PSYS derives 80% of its revenues from offshore services, with offshore effort forming 90% of its total effort. Hence, we see the company in a much better position to mitigate the impact of stricter immigration laws. Also, as onsite opportunities reduce with the services companies (due to higher offshoring or local hiring), they are bound to beocme less attractive from the employees’ perspective – inturn helping the attrition levels at product companies like PSYS.
IP led revenues to provide a solid foundation for future earnings PSYS’s share of revenue from IP led services has increased from 8% in FY12 to 17% in FY13. We expect PSYS to build upon its portfolio of products over the next decade, and emerge as one of the biggest IT Product development companies in India. The company has dedicated 5% of its employee base to research and IP development and is continuously tracking technology disruptions in the market.
Valuations attractive, initiate with BUY At current market price, PSYS is trading at 8x FY14 and 7.4x FY15 earnings – a significant discount to the top‐4 and to its historical average (8.3x). We expect a significant re‐rating for the stock, on the back of its robust return profile, driven by the early mover advantage in the CAMS domain. We value the company at 9x FY15 earnings, which gives us a price target of Rs700. We recommend BUY.
BUY PSYS IN | CMP RS 575
TARGET RS 700 (+22%) Company Data
O/S SHARES (MN) : 40MARKET CAP (RSBN) : 23MARKET CAP (USDBN) : 0.452 ‐ WK HI/LO (RS) : 620 / 92LIQUIDITY 3M (USDMN) : 0.3FACE VALUE (RS) : 10
Share Holding Pattern, %
PROMOTERS : 39.0FII / NRI : 20.6FI / MF : 14.5NON PROMOTER CORP. HOLDINGS : 1.0PUBLIC & OTHERS : 25.0
Price Performance, % 1mth 3mth 1yr
ABS 5.9 13.7 37.3REL TO BSE ‐0.3 10.6 30.2
Price Vs. Sensex (Rebased values)
60
80
100
120
140
160
May‐10 Apr‐11 Mar‐12 Feb‐13Persistent BSE Sensex
Source: Bloomberg, Phillip Capital Research
Key Ratios
Rs mn FY13 FY14E FY15E
Net Sales 12,945 17,184 19,747EBIDTA 3,352 4,220 4,445Net Profit 1,876 2,917 3,102EPS, Rs 46.9 72.9 77.5PER, x 12.2 7.9 7.4EV/EBIDTA, x 6.7 5.3 5.0P/BV, x 2.3 1.9 1.6ROE, % 18.4 23.5 21.0Source: Phillip Capital India Research Vibhor Singhal (+ 9122 6667 9949) [email protected] Varun Vijayan (+ 9122 6667 9992) [email protected]
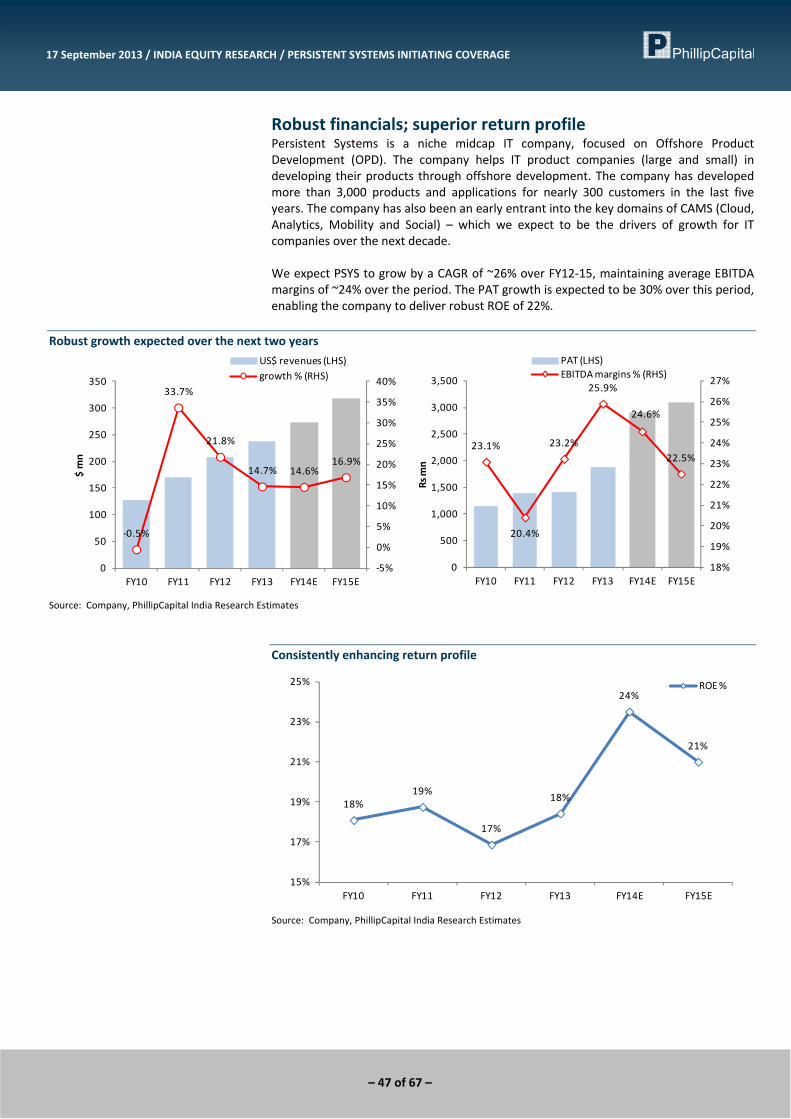
– 47 of 67 –
17 September 2013 / INDIA EQUITY RESEARCH / PERSISTENT SYSTEMS INITIATING COVERAGE
Robust financials; superior return profile Persistent Systems is a niche midcap IT company, focused on Offshore Product Development (OPD). The company helps IT product companies (large and small) in developing their products through offshore development. The company has developed more than 3,000 products and applications for nearly 300 customers in the last five years. The company has also been an early entrant into the key domains of CAMS (Cloud, Analytics, Mobility and Social) – which we expect to be the drivers of growth for IT companies over the next decade. We expect PSYS to grow by a CAGR of ~26% over FY12‐15, maintaining average EBITDA margins of ~24% over the period. The PAT growth is expected to be 30% over this period, enabling the company to deliver robust ROE of 22%.
Robust growth expected over the next two years
‐0.5%
33.7%
21.8%
14.7% 14.6%16.9%
‐5%
0%
5%
10%
15%
20%
25%
30%
35%
40%
0
50
100
150
200
250
300
350
FY10 FY11 FY12 FY13 FY14E FY15E
$ mn
US$ revenues (LHS)growth % (RHS)
23.1%
20.4%
23.2%
25.9%
24.6%
22.5%
18%
19%
20%
21%
22%
23%
24%
25%
26%
27%
0
500
1,000
1,500
2,000
2,500
3,000
3,500
FY10 FY11 FY12 FY13 FY14E FY15E
Rs mn
PAT (LHS)EBITDA margins % (RHS)
Source: Company, PhillipCapital India Research Estimates
Consistently enhancing return profile
18%19%
17%
18%
24%
21%
15%
17%
19%
21%
23%
25%
FY10 FY11 FY12 FY13 FY14E FY15E
ROE %
Source: Company, PhillipCapital India Research Estimates

– 48 of 67 –
17 September 2013 / INDIA EQUITY RESEARCH / PERSISTENT SYSTEMS INITIATING COVERAGE
Offshore Product Development (OPD) – an increasingly attractive domain The Indian OPD market has benefitted from both demand and supply side dynamics. There is an ever increasing demand from the ISVs for new product developments, maintenance of legacy products, reduce time‐to‐market for new launches, and re‐engineer product architecture to the new technologies. At the same time, the technological and domain expertise of the OPD firms have meant that these firms are now acting both as consultants and marketing partners – helping customers develop technology roadmap to remain in sync with the rapidly evolving market. And finally, at the center of it all, is the growing proliferation of technologies like cloud computing, data analytics, mobility and social media (CAMS) – especially for the SMBs (Small‐Medium Businesses), which are seeking to leverage these new age technologies to scale‐up resources at minimal cost. Indian OPD exports have outgrown the overall industry
16%
5%
19% 16%
10%15%
5%
19%
27%
10%
0%
5%
10%
15%
20%
25%
30%
FY9 FY10 FY11 FY12 FY13
Indian IT exports growth OSPD exports growth
Source: NASSCOM
Set to reap benefits of higher offshoring … Protect margins in the wake of tough immigration reforms PSYS derives 80% of its revenues from offshore services, with offshore effort forming 92% of the overall effort. In recent past, US and Australian governments have signaled implementation of path‐breaking immigration reforms, that might alter the landscape of the Indian IT Services industry. As more geographies fight against rising domestic unemployment rate, we see more governments implementing similar measures. To counter the impact of immigration laws, most of IT Services companies will have to either start offshoring larger part of their development (which might not augur well for the “Services” domain) or increase the proportion of local employees in their workforce (which will lead to significant erosion of margins). Companies like PSYS, which do not require significant onsite presence of employees, would emerge to be the winners of the stricter immigration laws, in our opinion. Better margins provide room for higher investments Persistent systems enjoys operating margins at 26% levels which are significantly higher than that of its peers in the product engineering space, owing to its high offshoring profile. While in an investment intensive field of IT industry, engineering companies such as PSYS & KPIT have to continuously re‐configure themselves, to the everchanging environment in the solutions space, which requires greater focus and higher investments. Enjoying a margin differential of 7‐8% from that of the industry, the
India’s OPD exports crossed $1bn in FY11 and grew to $1.4bn in FY13 – growing faster than the industry growth of 17%.
PSYS also has a strong M&A strategy to expand its domain skills as well as geography footprints. It has made 7 acquisitions in the last 2 years.
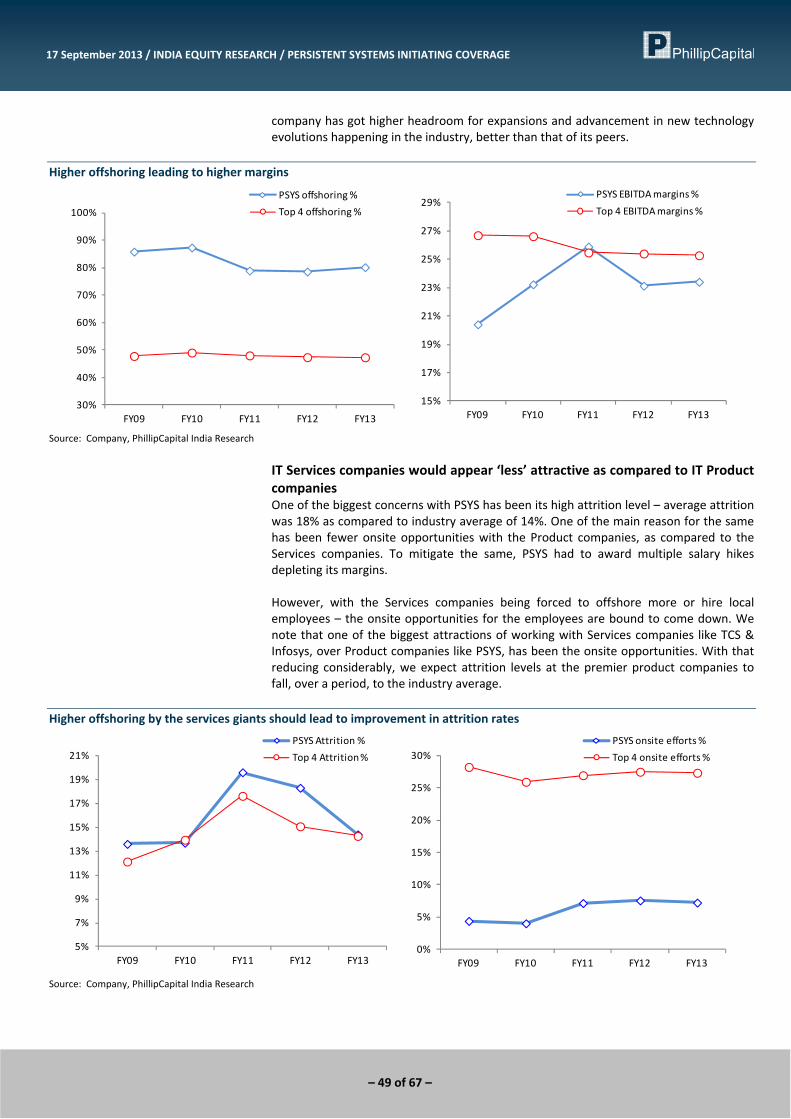
– 49 of 67 –
17 September 2013 / INDIA EQUITY RESEARCH / PERSISTENT SYSTEMS INITIATING COVERAGE
company has got higher headroom for expansions and advancement in new technology evolutions happening in the industry, better than that of its peers.
Higher offshoring leading to higher margins
30%
40%
50%
60%
70%
80%
90%
100%
FY09 FY10 FY11 FY12 FY13
PSYS offshoring %
Top 4 offshoring %
15%
17%
19%
21%
23%
25%
27%
29%
FY09 FY10 FY11 FY12 FY13
PSYS EBITDA margins %
Top 4 EBITDA margins %
Source: Company, PhillipCapital India Research
IT Services companies would appear ‘less’ attractive as compared to IT Product companies One of the biggest concerns with PSYS has been its high attrition level – average attrition was 18% as compared to industry average of 14%. One of the main reason for the same has been fewer onsite opportunities with the Product companies, as compared to the Services companies. To mitigate the same, PSYS had to award multiple salary hikes depleting its margins. However, with the Services companies being forced to offshore more or hire local employees – the onsite opportunities for the employees are bound to come down. We note that one of the biggest attractions of working with Services companies like TCS & Infosys, over Product companies like PSYS, has been the onsite opportunities. With that reducing considerably, we expect attrition levels at the premier product companies to fall, over a period, to the industry average.
Higher offshoring by the services giants should lead to improvement in attrition rates
5%
7%
9%
11%
13%
15%
17%
19%
21%
FY09 FY10 FY11 FY12 FY13
PSYS Attrition %
Top 4 Attrition %
0%
5%
10%
15%
20%
25%
30%
FY09 FY10 FY11 FY12 FY13
PSYS onsite efforts %
Top 4 onsite efforts %
Source: Company, PhillipCapital India Research
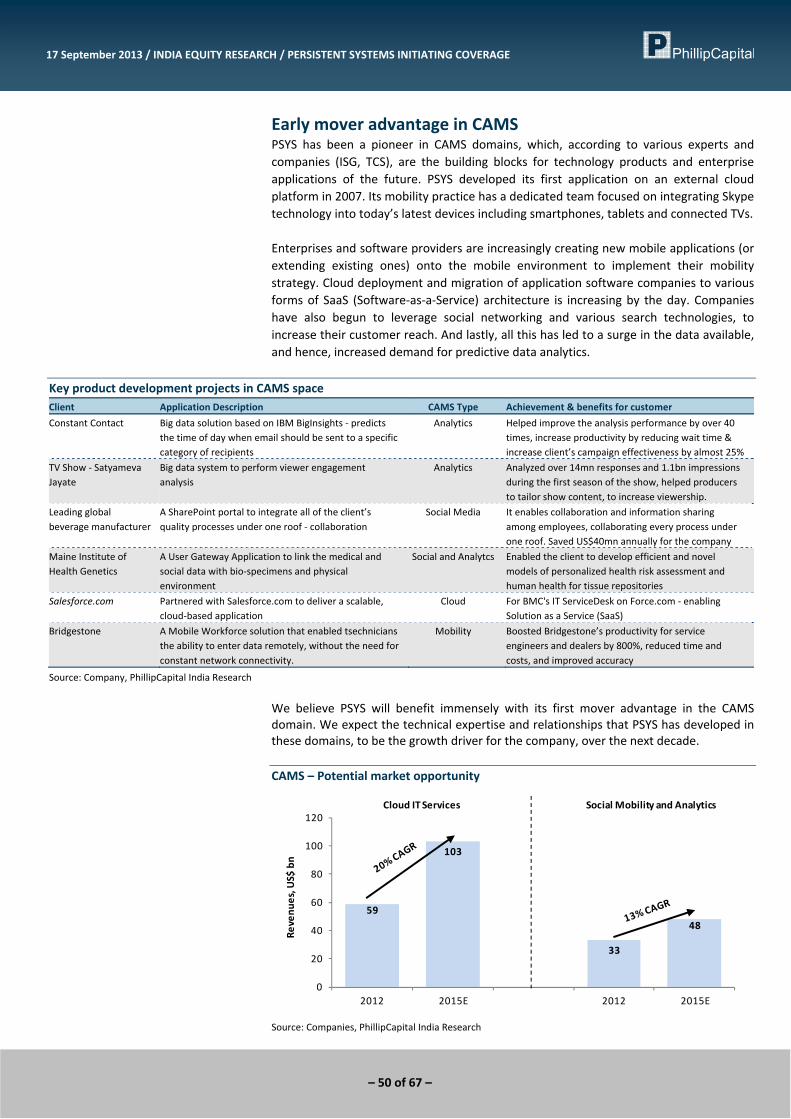
– 50 of 67 –
17 September 2013 / INDIA EQUITY RESEARCH / PERSISTENT SYSTEMS INITIATING COVERAGE
Early mover advantage in CAMS PSYS has been a pioneer in CAMS domains, which, according to various experts and companies (ISG, TCS), are the building blocks for technology products and enterprise applications of the future. PSYS developed its first application on an external cloud platform in 2007. Its mobility practice has a dedicated team focused on integrating Skype technology into today’s latest devices including smartphones, tablets and connected TVs. Enterprises and software providers are increasingly creating new mobile applications (or extending existing ones) onto the mobile environment to implement their mobility strategy. Cloud deployment and migration of application software companies to various forms of SaaS (Software‐as‐a‐Service) architecture is increasing by the day. Companies have also begun to leverage social networking and various search technologies, to increase their customer reach. And lastly, all this has led to a surge in the data available, and hence, increased demand for predictive data analytics.
Key product development projects in CAMS space Client Application Description CAMS Type Achievement & benefits for customer
Constant Contact Big data solution based on IBM BigInsights ‐ predicts the time of day when email should be sent to a specific category of recipients
Analytics Helped improve the analysis performance by over 40 times, increase productivity by reducing wait time & increase client’s campaign effectiveness by almost 25%
TV Show ‐ Satyameva Jayate
Big data system to perform viewer engagement analysis
Analytics Analyzed over 14mn responses and 1.1bn impressions during the first season of the show, helped producers to tailor show content, to increase viewership.
Leading global beverage manufacturer
A SharePoint portal to integrate all of the client’s quality processes under one roof ‐ collaboration
Social Media It enables collaboration and information sharing among employees, collaborating every process under one roof. Saved US$40mn annually for the company
Maine Institute of Health Genetics
A User Gateway Application to link the medical and social data with bio‐specimens and physical environment
Social and Analytcs Enabled the client to develop efficient and novel models of personalized health risk assessment and human health for tissue repositories
Salesforce.com Partnered with Salesforce.com to deliver a scalable, cloud‐based application
Cloud For BMC's IT ServiceDesk on Force.com ‐ enabling Solution as a Service (SaaS)
Bridgestone A Mobile Workforce solution that enabled tsechnicians the ability to enter data remotely, without the need for constant network connectivity.
Mobility Boosted Bridgestone’s productivity for service engineers and dealers by 800%, reduced time and costs, and improved accuracy
Source: Company, PhillipCapital India Research
We believe PSYS will benefit immensely with its first mover advantage in the CAMS domain. We expect the technical expertise and relationships that PSYS has developed in these domains, to be the growth driver for the company, over the next decade. CAMS – Potential market opportunity
59
103
33
48
0
20
40
60
80
100
120
2012 2015E 2012 2015E
Revenu
es, U
S$ bn
Cloud IT Services Social Mobility and Analytics
Source: Companies, PhillipCapital India Research

– 51 of 67 –
17 September 2013 / INDIA EQUITY RESEARCH / PERSISTENT SYSTEMS INITIATING COVERAGE
IP led revenues to provide a solid foundation for future earnings PSYS’s share of revenue from IP led services has increased from 8% in FY12 to 17% in FY13. IP led revenues typically constitute of products that the company develops, and sells them with minor modifications to various customers. While most of its products are currently more of add‐on features on the existing products being developed and marketed by its clients, an increasing share now comes from the direct relationships that PSYS has developed with the various clients of its clients. We expect PSYS to build upon its portfolio of products over the next decade, and emerge as one of the biggest IT Product companies in India. The company has dedicated 5% of its employee base to research and IP development and is continuously tracking technology disruptions in the market. The company has launched 10 products over the last five years, and we expect it to pursue higher IP led revenues, more aggressively. IP Revenues to drive the future
5.2%
7.2%8.8% 8.8%
17.1%
0%
2%
4%
6%
8%
10%
12%
14%
16%
18%
FY09 FY10 FY11 FY12 FY13
IP led revenue share
Source: Company, PhillipCapital India Research
Key Products launched by Persistent Systems Products Related to Launched on
Paxpro Brand asset lifecycle management solution for CPG brands 14‐Jul‐11
Location based services Location infrastructure product for telecom operators and handset vendors to comply with government regulations and offer consumer/enterprise oriented location based services
Radia client automation Enterprise solution platform for automation of entire lifecycle ‐ where irrespective of devices ‐ from provisioning to retirement for cost efficiency
Sep‐04
ChemLMS Lab information management systems (LMS) ‐ solution for Healthcare and life sciences for an optimal IT infrastructure ‐ information traceability throughout the complete process
Sep‐09
ViewMOR Mail discovery platform ‐ context based search platform for all industries
Enterprise Search ‐ Google Partner offerings for Google search appliance to overcome challenges accessing information within the enterprise
Enterprise Search ‐ Exalead Information Discovery and Search Based Application/platform ‐ Exalead Cloudview & Exalead Value Proposition
Exploriments Learning apps co created within a platform for advanced support for education through mobile devices. 13‐Jan‐13
e2GMigrator Email migration solution for all industries
Skype on Embedded Device Skype application customised for embedded systems. Persistent is a registered Skype developer.
KLISMA Intent Based Buying HTML platform for retail e‐purchases ‐ intent based buying solutions
Cloud Assessment Tool Persistent’s Cloud Assessment tool ‐ helps customers address common cloud enablement related challenges FY12
DriverCentral A dedicated device driver portal for analytical instruments ‐ HTML based
TLALOC Large scale on‐demand load generation tool for Amazon EC2 ‐ also cloud based FY12
CLAP Cloud Based Load Testing and Performance Tool ‐ a framework that leverages cloud infrastructure to test the apps FY12
eMee Employee engagement platform launched specifically for SMEs with distributed workforce, to encourage social networking in the workplace ‐ comprehensive gamification platform
4‐Oct‐11
Device Monitoring System Helps the administrator monitor and deploy important Key Performance Indicators for Juniper devices (related to innovation in networking)
Source: Company, PhillipCapital India Research

– 52 of 67 –
17 September 2013 / INDIA EQUITY RESEARCH / PERSISTENT SYSTEMS INITIATING COVERAGE
4*4*4 Business strategy to drive future growth As a strategy to take the company forward into the next decade, PSYS management has embarked upon a 4*4*4 Business Model – where the company will be focusing on 4 key verticals, 4 business models and 4 new initiatives. We believe it to be an excellent strategy given the constantly evolving landscape of the IT industry globally. 4*4*4 Business Strategy Model
Cloud Collaboration
Analytics Mobility
Product Engg
Sell with Partnerships
IP Led
Technology Consulting
TE
LS
IS
BFS
New initiatives
Business Models
Verticals
Telecom (TE)
Life Sciences (LS)
Infrastructure Systems (IS)
Banking and Finance (BFS)
Source: PhillipCapital India Research
Valuations
1 year forward band chart P/E Band EV/EBITDA
6x
8x
10x
12x
0
200
400
600
800
1000
1200
Apr‐10 Apr‐11 Apr‐12 Apr‐13
(Rs)
(Rs mn)
3x
5x
7x
9x
0
5000
10000
15000
20000
25000
30000
35000
40000
45000
50000
Apr‐10 Apr‐11 Apr‐12 Apr‐13 Source: Bloomberg, PhillipCapital India Research

– 53 of 67 –
17 September 2013 / INDIA EQUITY RESEARCH / PERSISTENT SYSTEMS INITIATING COVERAGE
Revenue break‐up
Telecom, 25.3% IMS, 64.2% Life sciences, 10.6%
North America, 84.8%
Europe,6.5%
Asia Pacific8.7%
T&E, 75.0%FPP8.0%
IP driven,17.1%
Horizontals
Geographies
Business mix
Clients and Contract profile
Top 1, 20.4%
Top 2‐5, 15.6%
Top 6‐10, 11.4%
Non Top‐10, 52.5%
< $ 1 Mn, 276> $ 1Mn, < $ 3Mn,
29
$3mn+, 15
Client Revenue Share
Contract profile (No of Contracts)
Source: Company, PhillipCapital India Research
Efforts & revenue mix Attrition & Utilization levels
Onsite, 19.9%
Offshore, 80.1%
Onsite, 7.2%
Offshore, 92.8%
Revenue mix
Effort mix
0%
5%
10%
15%
20%
25%
70%
71%
72%
73%
74%
75%
76%
77%
FY09 FY10 FY11 FY12 FY13
Utilizations % (LHS)Attrition % (RHS)
Source: Company, PhillipCapital India Research

– 54 of 67 –
17 September 2013 / INDIA EQUITY RESEARCH / PERSISTENT SYSTEMS INITIATING COVERAGE
Financials
Income Statement Y/E Mar, Rs mn FY12 FY13 FY14E FY15E
Net sales 10,003 12,945 17,184 19,747Growth, % 29 29 33 15Employee expenses ‐5,922 ‐7,311 ‐9,767 ‐11,664Other Operating expenses ‐1,757 ‐2,283 ‐3,197 ‐3,638EBITDA (Core) 2,324 3,352 4,220 4,445Growth, % 46.8 44.2 25.9 5.3Margin, % 23.2 25.9 24.6 22.5Depreciation ‐611 ‐783 ‐993 ‐1,063EBIT 1,713 2,569 3,227 3,381Growth, % 47.8 50.0 25.6 4.8Margin, % 17.1 19.8 18.8 17.1Interest paid 0 0 0 0Other Non‐Operating Income 489 283 379 592Pre‐tax profit 1,969 2,630 4,102 4,369Tax provided ‐551 ‐754 ‐1,186 ‐1,267Profit after tax 1,418 1,876 2,917 3,102Others (Minorities, Associates) 0 0 0 0Net Profit 1,418 1,876 2,917 3,102Growth, % 1.7 32.3 55.5 6.4Net Profit (adjusted) 1,418 1,876 2,917 3,102Wtd avg shares (m) 40 40 40 40
FY12 FY13 FY14E FY15E
US$ Revenue ($ mn) 207 238 272 318Growth, % 22 15 15 17Re / US$ (rate) 48.2 54.4 63.1 62.0
Balance Sheet Y/E Mar, Rs mn FY12 FY13 FY14E FY15E
Cash & bank 1,375 561 728 534Marketable securities at cost 0 0 0 0Debtors 2,033 2,509 3,531 4,058Loans and Advances 682 545 572 601Other current assets 182 434 612 812Total current assets 4,271 4,050 5,444 6,004Investments 2,041 3,813 4,813 5,813Net fixed assets 3,724 4,677 5,184 6,121Non‐current assets 0 0 0 0Total assets 10,143 12,730 15,631 18,127 Total current liabilities 1,738 2,547 3,223 3,354Non‐current liabilities 0 0 0 0Total liabilities 1,738 2,547 3,223 3,354Paid‐up capital 400 400 400 400Reserves & surplus 8,005 9,783 12,007 14,373Minorities 0 0 0 0Shareholders’ equity 8,405 10,183 12,407 14,773Total equity & liabilities 10,143 12,730 15,631 18,127
Source: Company, PhillipCapital India Research Estimates
Cash Flow Y/E Mar, Rs mn FY12 FY13 FY14E FY15E
Pre‐tax profit 1,969 2,630 4,102 4,369Depreciation 611 783 993 1,063Chg in working capital ‐84 217 ‐550 ‐624Total tax paid ‐628 ‐837 ‐1,186 ‐1,267Other operating activities 0 0 0 0Cash flow from operating activities 1,868 2,792 3,359 3,541Capital expenditure ‐1,469 ‐1,735 ‐1,500 ‐2,000Chg in investments 460 ‐1,772 ‐1,000 ‐1,000Chg in marketable securities 0 0 0 0Other investing activities 0 0 0 0Cash flow from investing activities ‐1,010 ‐3,507 ‐2,500 ‐3,000Free cash flow 399 1,057 1,859 1,541Equity raised/(repaid) 0 0 0 0Debt raised/(repaid) 0 0 0 0Dividend (incl. tax) ‐279 ‐419 ‐692 ‐736Other financing activities ‐170 321 0 0Cash flow from financing activities ‐484 ‐98 ‐692 ‐736Net chg in cash 375 ‐813 167 ‐194
Valuation Ratios & Per Share Data FY12 FY13 FY14E FY15E
Per Share data EPS (INR) 35.4 46.9 72.9 77.5Growth, % 1.7 32.3 55.5 6.4Book NAV/share (INR) 210.1 254.6 310.2 369.3CFPS (INR) 34.3 62.5 74.8 73.7DPS (INR) 6.0 9.0 14.8 15.7Return ratios Return on assets (%) 14.7 16.4 20.6 18.4Return on equity (%) 16.9 18.4 23.5 21.0Return on capital employed (%) 16.5 18.2 23.2 20.6Turnover ratios Asset turnover (x) 2.0 2.1 2.3 2.2Sales/Total assets (x) 1.0 1.1 1.2 1.2Sales/Net FA (x) 3.0 3.1 3.5 3.5Working capital/Sales (x) 0.2 0.2 0.2 0.2Receivable days 74.2 70.8 75.0 75.0Liquidity ratios Current ratio (x) 4.8 2.9 3.0 3.2Quick ratio (x) 4.8 2.9 3.0 3.2Dividend cover (x) 5.9 5.2 4.9 4.9Total debt/Equity (%) 0.1 0.1 ‐ ‐Net debt/Equity (%) (16.3) (5.4) (5.9) (3.6)Valuation PER (x) 16.2 12.2 7.9 7.4PEG (x) ‐ y‐o‐y growth 9.4 0.4 0.1 1.2Price/Book (x) 2.7 2.3 1.9 1.6Yield (%) 1.0 1.6 2.6 2.7EV/Net sales (x) 2.2 1.7 1.3 1.1EV/EBITDA (x) 9.3 6.7 5.3 5.0EV/EBIT (x) 12.6 8.7 6.9 6.6

– 55 of 67 –
KPIT Technologies Unique Business Model
Initiating Coverage 17 September 2013
PhillipCapital (India) Pvt. Ltd.
Superior return profile; margins much higher than peers We expect KPIT to grow by a CAGR of 30% over FY12‐15, maintaining average EBITDA margins of 16% over the period. The company has hisrorically grown at a CAGR of 30% over the last five years, driven by series of acquisitions – much higher than the industry. The PAT growth is expected to be 35% over FY12‐15, enabling the company to deliver robust ROE of 25%.
Niche play on automotive domain KPIT is the largest third party vendor in the Automotive domain (excluding Auto OEMs and captives). Through its long standing relationships with Automotive companies and series of acquisitions (In2soft GmBh, Mechanical Design Services and CG Smith Software), it has developed strong technical expertise in the domain. Today it works with 9 out of 12 top Auto OEMs of the world.
For KPIT, the segment has grown at a robust rate of 24% over the last five years, forming ~25% of the topline in FY13. We expect the company to report strong growth in this domain, driven by its technical expertise, strong relationships and growth in the electronic component of vehicles across the globe.
Expanding presence in Manufacturing domain sans Cummins In 2002, Manufacturing represented ~75% of the total topline, with Cummins accounting for ~48% of overall. Cummins has been their largest client ever since – however their dependence has diminished significantly over the years. In FY13, Manufacturing accounted for 50% of the topline, with Cummins accounting for 19%. The company has carved a niche for itself in this domain, and is reckoned as one of the preferred outsourcing vendor in this domain.
Inorganic route driving the growth KPIT has been THE most aggressive IT company, in terms of inorganic growth. It has acquired eight companies, since its merger with Cummins Infotech in 2002. While three of these have been in the Automotive domain, others have been spread across domains like SAP, Oracle and Offshore Consulting.
While the acquisition have helped company report a strong 30% revenue CAGR over the last five years, it has had its negative effects on the balance sheet. The debt levels in the company have increased to Rs3.2bn at FY13 ‐ representing debt:equity of 0.3x ‐ quite high for an industry with net cash balance sheets. The comany reported negative FCF for the last four years, and the EBITDA margins have declined from 22% in FY10 to 16% in FY13.
However, we see these negative developments as minor price the company has had to pay, for the robust growth. Interest coverage of 20.4x and Net debt/EBITDA of 0.4x suggest leverage is still at innocuous levels. Also, post integration of the acquired companies, we expect higher offshoring to improve the EBITDA margins.
Valuations attractive, initiate with BUY At current market price, KPIT is trading at 8x FY14 and 7.3x FY15 earnings – a significant discount to the top‐4 and to its historical average (9x). We expect a significant re‐rating for the stock, on the back of its robust return profile, driven by the its inorganic growth model. We value the company at 9x FY15 earnings, which gives us a price target of Rs170. We recommend BUY.
BUY KPIT IN | CMP RS 135
TARGET RS 170 (+26%) Company Data
O/S SHARES (MN) : 193MARKET CAP (RSBN) : 26MARKET CAP (USDBN) : 0.452 ‐ WK HI/LO (RS) : 160 / 92LIQUIDITY 3M (USDMN) : 0.8FACE VALUE (RS) : 2
Share Holding Pattern, %
PROMOTERS : 24.3FII / NRI : 46.0FI / MF : 10.9NON PROMOTER CORP. HOLDINGS : 4.6PUBLIC & OTHERS : 14.3
Price Performance, % 1mth 3mth 1yr
ABS ‐3.0 18.3 5.4REL TO BSE ‐9.3 15.3 ‐1.7
Price Vs. Sensex (Rebased values)
0
50
100
150
200
250
300
Apr‐10 Mar‐11 Feb‐12 Jan‐13
KPIT BSE Sensex
Source: Bloomberg, Phillip Capital Research
Key Ratios
Rs mn FY13 FY14E FY15E
Net Sales 22,386 28,964 33,434EBIDTA 3,356 4,913 5,344Net Profit 2,027 3,214 3,573EPS, Rs 10.9 16.6 18.5PER, x 12.4 8.1 7.3EV/EBIDTA, x 7.8 5.7 5.1P/BV, x 2.4 2.0 1.6ROE, % 19.6 24.2 21.6Source: Phillip Capital India Research Vibhor Singhal (+ 9122 6667 9949) [email protected] Varun Vijayan (+ 9122 6667 9992) [email protected]

– 56 of 67 –
17 September 2013 / INDIA EQUITY RESEARCH / KPIT TECHNOLOGIES INITIATING COVERAGE
Robust financials; superior return profile KPIT Cummins is a niche midcap IT company, concentrating in the Automotive, Manufacturing and Energy & Utilities domains. KPIT Cummins started as a software development firm focusing on the BFSI domain. However, after their merger with Cummins Infotech in 2002, the company made Manufacturing and later, Automotive, their key domains. We expect KPIT to grow by a CAGR of 30% over FY12‐15, maintaining average EBITDA margins of 16% over the period. The PAT growth is expected to be 35% over this period, enabling the company to deliver robust ROE of 25%.
Robust growth expected over the next two years
‐12%
44%40%
33%
12%17%
‐20%
‐10%
0%
10%
20%
30%
40%
50%
0
100
200
300
400
500
600
FY10 FY11 FY12 FY13 FY14E FY15E
$ mn
US$ revenues (LHS)
growth % (RHS)
22%
15% 15%16% 17%
16%
0%
5%
10%
15%
20%
25%
0
500
1,000
1,500
2,000
2,500
3,000
3,500
4,000
FY10 FY11 FY12 FY13 FY14E FY15E
Rs mn
PAT (LHS)EBITDA margins % (RHS)
Source: Company, PhillipCapital India Research Estimates
Consistently enhancing return profile
22%
16% 17%
20%
24%
22%
22%
16% 17%19%
22%20%
0%
5%
10%
15%
20%
25%
30%
FY10 FY11 FY12 FY13 FY14E FY15E
RoE % RoCE %
Source: Company, PhillipCapital India Research Estimates

– 57 of 67 –
17 September 2013 / INDIA EQUITY RESEARCH / KPIT TECHNOLOGIES INITIATING COVERAGE
Niche play on the automotive and energy domains KPIT has carved out a niche for itself in the IT domain, by focusing on three key domains (Automotive, Energy & Utilities and Manufacturing) – all of which are small enough so as to ward excessive competition and large enough to help the company report robust growth. The three domains constitute over 90% of its topline, and the management envisions each vertical as $1bn+ potential opportunity. Automotive: KPIT is the largest third party vendor in the Automotive domain (excluding Auto OEMs and captive development centers). Through its long standing relationships with Automotive companies and series of acquisitions (In2soft GmBh, Mechanical Design Services and CG Smith Software), it has developed strong technical expertise in the domain. Today it works with 9 out of 12 top Auto OEMs of the world. There has been an ever increasing demand and need for advanced technology features in vehicles, partly aided by the regulatory developments. EU’s directive on mandatory LDWS (Lane Departure Warning Systems), High level theft warning/tracking systems and Safety are few of the regulations that have forced Auto OEMs to insert more electronic features into their vehicles. Also, currently only 10% of the developmental work in the sector is outsourced – the KPIT management expects this to reach 18‐20% levels, with the OEMs realizing the benefits like lower cost, lower time to market and innovations. For KPIT, the segment has grown at a robust rate of 24% over the last five years, forming ~25% of the topline in FY13. We expect the company to continue reporting strong growth in this domain, driven by its technical expertise, strong list of existing clients and growth in the electronic component of vehicles across the globe. Auto division – key growth driver
‐20%
‐10%
0%
10%
20%
30%
40%
50%
0
20
40
60
80
100
120
FY09 FY10 FY11 FY12 FY13
In US$
mn
KPIT Auto engg revenues (LHS)
YoY growth % (RHS)
Source: Company, PhillipCapital India Research Manufacturing: In 2002, Manufacturing represented ~75% of the total topline, with Cummins accounting for ~48% of overall. Cummins has been their largest client ever since – however their dependence has diminished significantly over the years. In FY13, Manufacturing accounted for 50% of the topline, with Cummins accounting for 19%. While the parent company Cummins Plc is facing headwinds due to dwindling macro situation in the economies it operates in (Europe, US and LatAm), the account has reported robust growth for KPIT.

– 58 of 67 –
17 September 2013 / INDIA EQUITY RESEARCH / KPIT TECHNOLOGIES INITIATING COVERAGE
Reducing dependence on Cummins, even as the account continues to grow
0%
5%
10%
15%
20%
25%
30%
35%
40%
45%
0
10
20
30
40
50
60
70
80
90
FY09 FY10 FY11 FY12 FY13
In US$
mn
Cummins revenues (LHS)
% of overall revenues (RHS)
Source: Company, PhillipCapital India Research
To reap benefits of higher offshoring … Protect margins in the wake of tough immigration reforms KPIT derives 46% of its revenues from offshore efforts, with offshore effort forming 85% of the total effort. In recent past, US and Australian governments have signaled implementation of path‐breaking immigration reforms, that might alter the landscape of the Indian IT Services industry. As more geographies fight against rising domestic unemployment rate, we see more governments implementing similar measures. To counter the impact of immigration laws, most of IT Services companies will have to either start offshoring larger part of their development (which might not augur well for the “Services” domain) or increase the proportion of local employees in their workforce (which will lead to significant erosion of margins). Companies like KPIT, which do not require significant onsite presence of employees, would emerge to be the winners of the stricter immigration laws, in our opinion.
Offshoring levels have come down over the years, and the margins have followed suit
30%
35%
40%
45%
50%
55%
60%
65%
30%
35%
40%
45%
50%
55%
60%
65%
FY09 FY10 FY11 FY12 FY13
KPIT offshoring % (LHS)
Top 4 offshoring % (RHS)
0%
5%
10%
15%
20%
25%
30%
0%
5%
10%
15%
20%
25%
FY09 FY10 FY11 FY12 FY13
KPIT EBITDA margins % (LHS)
Top 4 EBITDA margins % (RHS)
Source: Company, PhillipCapital India Research

– 59 of 67 –
17 September 2013 / INDIA EQUITY RESEARCH / KPIT TECHNOLOGIES INITIATING COVERAGE
IT Services companies would appear ‘less’ attractive With the Services companies being forced to offshore more or hire local employees – the onsite opportunities for the employees are bound to come down. We note that one of the biggest attractions of working with Services companies like TCS & Infosys, over Product companies like KPIT, has been the onsite opportunities. With that reducing considerably, we expect attrition levels at the premier product companies to fall, over a period, to the industry average.
Higher offshoring by the services giants should lead to improvement in attrition rates
0%
5%
10%
15%
20%
25%
30%
FY09 FY10 FY11 FY12 FY13
KPIT onsite efforts %Top 4 onsite efforts %
0%
4%
8%
12%
16%
20%
24%
28%
32%
36%
FY09 FY10 FY11 FY12 FY13
KPIT attrition %Top 4 attrition %
Source: Company, PhillipCapital India Research
Inorganic route driving the growth KPIT has been THE most aggressive IT company in terms of inorganic growth. The company has acquired eight companies, since their merger with Cummins Infotech in 2002. While three of these have been in the Automotive domain, others have been spread across domains like SAP, Oracle and Offshore Consulting. While some of these acquisitions have provided the company with invaluable technical domain expertise, others like Pivolis and Systime Global provided them with a strong anchor client.
Growing via the inorganic route Target Country Year Date Deal Value Stake Domain
Cummins Infotech Ltd India 2002 100% Manufacturing Panex Consulting USA 2003 15‐Aug‐03 US$1.7mn 100% SAP Pivolis France 2005 22‐Nov‐05 US$2.5mn 100% BFSI SolvCentral USA 2005 22‐Nov‐05 US$2mn 100% BI C G Smith Software Pvt Ltd India 2006 6‐Mar‐06 US$9.5mn 100% Automotive Mechanical Design Services India 2008 8‐Jul‐08 100% Automotive Sparta Consulting USA 2009 3‐Nov‐09 US$38mn 100% SAP CPG Solutions USA 2010 28‐Sep‐10 US$13.2mn 100% Oracle In2Soft GmBH Germany 2010 21‐Oct‐10 Automotive Systime Global 2011 24‐Mar‐11 US$56mn 100% Oracle
Source: Company, PhillipCapital India Research KPIT follows a three point strategy to identify acquisition targets: • Technical competence • Anchor Client • Geographical Expansion Along with the above the company focuses on two key integration issues: • Cultural Fit: Prefers targets with whom company or its partners have worked before • Financial Fit: Payback of period of less than three years

– 60 of 67 –
17 September 2013 / INDIA EQUITY RESEARCH / KPIT TECHNOLOGIES INITIATING COVERAGE
While the primary driver of company’s growth has been its inorganic route, KPIT has also reported strong organic growth in the last five years – much higher than industry average. While acquisitions have driven the growth, organic growth too has been robust
‐12%
46% 43%
33%
‐17%
40% 37%
21%
FY10 FY11 FY12 FY13
Overall $ revenue growth %Organic $ revenue growth %
Source: Company, PhillipCapital India Research
Side effects of the aggressive acquisition strategy Negative FCF: While KPIT has grown much higher than industry average over the last five years – driven by the acquisition and the synergies post‐integration, the company has reported negative FCF over the period. While this remains a key area of concern, we note that OCF remains strong for the company. We do not expect the FCF to turn positive for the company in near future, as it continues on its inorganic route to grow higher than the industry. Collateral damage of inorganic growth – negative FCF
‐2,000
‐1,500
‐1,000
‐500
0
500
1,000
1,500
2,000
2,500
3,000
3,500
FY09 FY10 FY11 FY12 FY13
In RS mn
PAT OCF FCF
Source: Company, PhillipCapital India Research
Higher leverage: Another side effect of the strong inorganic growth model adopted by KPIT is the leverage that it has imparted to its balance sheet. At the end of FY13, the company had a gross debt of Rs3.2bn, implying a Debt:Equity of 0.3x – quite high for an industry where most companies have net cash balance sheets. While the leverage is still at innocuous levels – Interest coverage of 20.4x and Net debt/EBITDA of 0.4x at the end of FY13; we feel the leverage might only rise, as the company continues on its acquisition strategy. The balance sheet leverage hence, would need to be monitored closely.
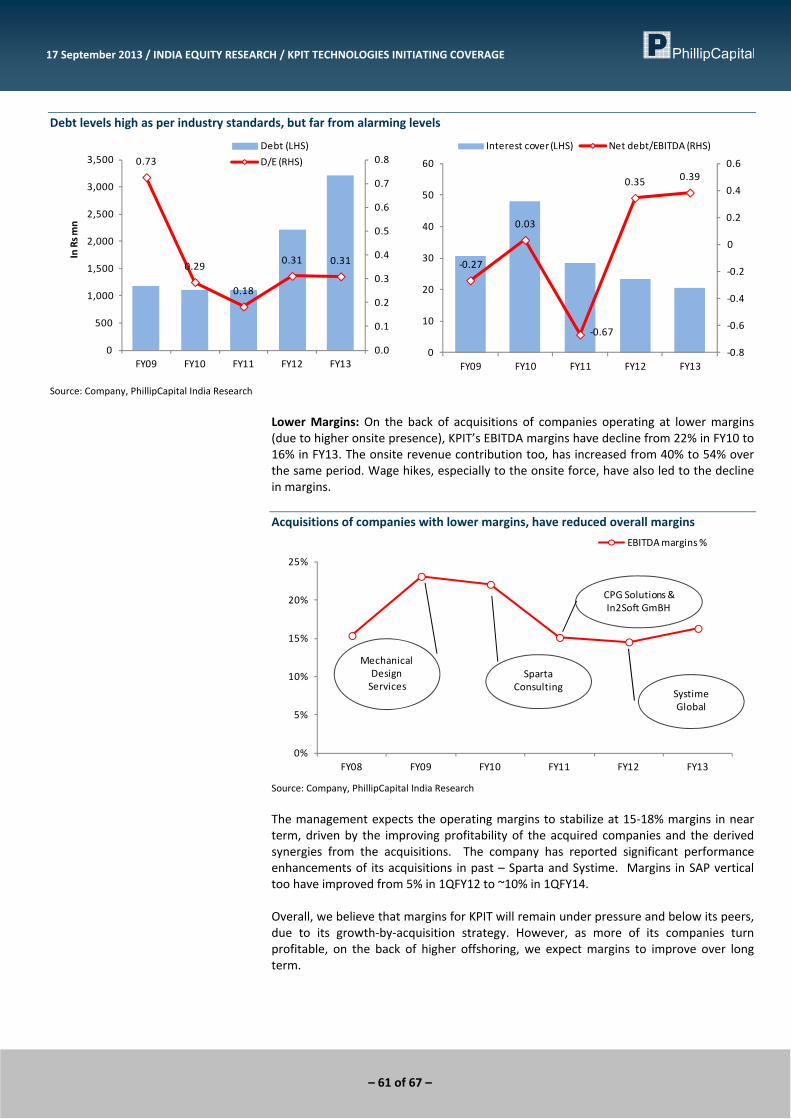
– 61 of 67 –
17 September 2013 / INDIA EQUITY RESEARCH / KPIT TECHNOLOGIES INITIATING COVERAGE
Debt levels high as per industry standards, but far from alarming levels
0.73
0.29
0.18
0.31 0.31
0.0
0.1
0.2
0.3
0.4
0.5
0.6
0.7
0.8
0
500
1,000
1,500
2,000
2,500
3,000
3,500
FY09 FY10 FY11 FY12 FY13
In Rs m
n
Debt (LHS)
D/E (RHS)
‐0.27
0.03
‐0.67
0.35 0.39
‐0.8
‐0.6
‐0.4
‐0.2
0
0.2
0.4
0.6
0
10
20
30
40
50
60
FY09 FY10 FY11 FY12 FY13
Interest cover (LHS) Net debt/EBITDA (RHS)
Source: Company, PhillipCapital India Research
Lower Margins: On the back of acquisitions of companies operating at lower margins (due to higher onsite presence), KPIT’s EBITDA margins have decline from 22% in FY10 to 16% in FY13. The onsite revenue contribution too, has increased from 40% to 54% over the same period. Wage hikes, especially to the onsite force, have also led to the decline in margins. Acquisitions of companies with lower margins, have reduced overall margins
0%
5%
10%
15%
20%
25%
FY08 FY09 FY10 FY11 FY12 FY13
EBITDA margins %
Mechanical DesignServices
SpartaConsulting
CPG Solutions &In2Soft GmBH
SystimeGlobal
Source: Company, PhillipCapital India Research
The management expects the operating margins to stabilize at 15‐18% margins in near term, driven by the improving profitability of the acquired companies and the derived synergies from the acquisitions. The company has reported significant performance enhancements of its acquisitions in past – Sparta and Systime. Margins in SAP vertical too have improved from 5% in 1QFY12 to ~10% in 1QFY14. Overall, we believe that margins for KPIT will remain under pressure and below its peers, due to its growth‐by‐acquisition strategy. However, as more of its companies turn profitable, on the back of higher offshoring, we expect margins to improve over long term.

– 62 of 67 –
17 September 2013 / INDIA EQUITY RESEARCH / KPIT TECHNOLOGIES INITIATING COVERAGE
On track to achieve the $1bn target by 2017 KPIT management has set a target to achieve $1bn in revenues by 2017. From the current levels of $410mn, it implies a CAGR of 19.5% over FY13‐FY18. Taking into account the 1QFY14 revenue of $109mn, that also translates into a CQGR of 4.85% during the period. While that looks an aggressive target, we note that the company has historically performed even better. It has grown at a CAGR of 30% over FY09‐FY13, inspite of a 12% decline in topline in FY10 (on the back of industry slowdown, esp Cummins). The CQGR over the last eight quarters has also been a strong 5.7%. We note that the company had earlier guided to an exit rate of $500mn for FY13 – however it was unable to meet that guidance with 4QFY13 topline of $106mn. We expect the company to achieve its guidance of $1bn in FY18, given its historical growth rate, and the continuous urge to grow inorganically. In the worst case scenario, the company should be able to end FY18 with an exit rate of $1bn annualized revenue – implying a healthy 4.5% CQGR from hereon –growth rate far above its peers.
Robust historical growth indicate likelihood of the company achieving its target of $1bn by 2017
‐20%
‐10%
0%
10%
20%
30%
40%
50%
0
50
100
150
200
250
300
350
400
450
FY8
FY9
FY10
FY11
FY12
FY13
In mn
US$ revenues (LHS) growth % (RHS)
0%
10%
20%
30%
40%
50%
60%
0
20
40
60
80
100
120
1QFY12
2QFY12
3QFY12
4QFY12
1QFY13
2QFY13
3QFY13
4QFY13
1QFY14
In US$
mn
$ revenues (LHS) YoY growth % (RHS)
Source: Company, PhillipCapital India Research
Revolo – to provide additional boost to the earnings KPIT, through a 50:50 JV with Bharat Forge, is developing a plug‐in parallel hybrid solution, that transforms contemporary vehicles into a completely fuel efficient, green automobile. The innovation includes a clever battery management system, proprietary software, and mechanical assembly. While Bharat Forge is developing the mechanical part, KPIT is in charge of the software and design part of the product. Revolo has received an umbrella patent in US, and has also received permission to perform trial‐runs in India on 350 vehicles. While it is too early to predict the potential of the product, it definitely provides an additional avenue for growth for the company. The product launch has already been delayed by over 1 year, and while its commercial sales were earlier expected from FY13, we expect it to trickle well down into FY15. We do not attribute any value to Revolo yet, awaiting further clarity on its launch timeframe and the potential market size of the same. However, once operational, it might provide a significant boost to the earnings and the stock price.

– 63 of 67 –
17 September 2013 / INDIA EQUITY RESEARCH / KPIT TECHNOLOGIES INITIATING COVERAGE
Revolo – can it be a potential game changer ?
Source: Company, PhillipCapital India Research
Valuations
1 year forward band chart P/E Band EV/EBITDA
6x
12x
18x24x
0
100
200
300 (Rs)
4x
8x12x16x
0
10000
20000
30000
40000 (Rs mn)
Source: Bloomberg, PhillipCapital India Research

– 64 of 67 –
17 September 2013 / INDIA EQUITY RESEARCH / KPIT TECHNOLOGIES INITIATING COVERAGE
Revenue break‐up
Integrated ES, 47%
Auto engg, 24%
SAP, 29%
Manufacturing, 73% E&U, 14%
Others, 13%
Americas, 76%
Europe, 13%
RoW, 11%
T&M, 72%
Non‐Linear, 28%
Horizontals
Verticals
Geographies
Business mix
Share of onsite and offshore
Onsite , 54%
Offshore, 46%
Onsite, 15%
Offshore, 85%
Revenue mix
Effort mix
Client profile Utilization and Attrition levels
Top 1, 19%
Top 2‐5, 17%
Top 6‐10, 8%
Non top 10, 56%
0%
5%
10%
15%
20%
25%
30%
35%
40%
65%
66%
67%
68%
69%
70%
71%
72%
73%
74%
75%
FY09 FY10 FY11 FY12 FY13
Utilizations % (LHS)
Attrition % (RHS)
Source: Company, PhillipCapital India Research

– 65 of 67 –
17 September 2013 / INDIA EQUITY RESEARCH / KPIT TECHNOLOGIES INITIATING COVERAGE
Financials
Income Statement Y/E Mar, Rs mn FY12 FY13 FY14E FY15E
Net sales 15,000 22,386 28,964 33,434Growth, % 52 49 29 15Employee expenses ‐7,718 ‐11,408 ‐19,502 ‐22,753Other Operating expenses ‐5,117 ‐7,622 ‐4,550 ‐5,337EBITDA (Core) 2,166 3,356 4,913 5,344Growth, % 45.9 55.0 46.4 8.8Margin, % 14.4 15.0 17.0 16.0Depreciation ‐445 ‐472 ‐556 ‐621EBIT 1,721 2,884 4,357 4,723Growth, % 60.4 67.6 51.0 8.4Margin, % 11.5 12.9 15.0 14.1Interest paid ‐73 ‐142 ‐209 ‐164Other Non‐Operating Income 138 117 278 334Pre‐tax profit 1,786 2,860 4,425 4,894Tax provided ‐437 ‐766 ‐1,212 ‐1,321Profit after tax 1,349 2,095 3,214 3,573Others (Minorities, Associates) ‐168 ‐68 0 0Net Profit 1,181 2,027 3,214 3,573Growth, % 24.9 71.6 58.5 11.2Net Profit (adjusted) 1,181 2,027 3,214 3,573Wtd avg shares (m) 177 185 193 193
FY12 FY13 FY14E FY15E
US$ Revenue ($ mn) 309 410 460 539Growth, % 40 33 12 17Re / US$ (rate) 48.5 54.5 63.0 62.0
Balance Sheet Y/E Mar, Rs mn FY12 FY13 FY14E FY15E
Cash & bank 1,473 1,921 1,305 1,732Marketable securities at cost 0 0 0 0Debtors 4,544 5,496 7,618 8,794Inventory 0 0 0 0Other current assets 1,253 1,748 2,181 2,679Total current assets 7,270 9,165 11,104 13,205Investments 582 2,186 2,686 3,686Net fixed assets 5,475 6,428 8,295 9,174Non‐current assets 0 0 0 0Total assets 13,328 17,848 22,154 26,134 Total current liabilities 3,681 4,002 5,374 6,292Non‐current liabilities 2,195 3,213 3,213 3,013Total liabilities 5,876 7,215 8,587 9,305Paid‐up capital 356 386 386 386Reserves & surplus 6,770 9,977 12,911 16,172Minorities 326 270 270 270Shareholders’ equity 7,451 10,633 13,567 16,828Total equity & liabilities 13,328 17,848 22,154 26,134
Source: Company, PhillipCapital India Research Estimates
Cash Flow Y/E Mar, Rs mn FY12 FY13 FY14E FY15E
Pre‐tax profit 1,786 2,860 4,425 4,894Depreciation 445 472 556 621Chg in working capital ‐728 ‐1,366 ‐1,436 ‐954Total tax paid ‐159 ‐567 ‐959 ‐1,122Other operating activities 0 0 0 0Cash flow from operating activities 1,344 1,398 2,586 3,439Capital expenditure ‐3,039 ‐1,424 ‐2,423 ‐1,500Chg in investments ‐106 ‐1,604 ‐500 ‐1,000Chg in marketable securities 0 0 0 0Other investing activities 0 0 0 0Cash flow from investing activities ‐3,145 ‐3,028 ‐2,923 ‐2,500Free cash flow ‐1,696 ‐26 163 1,939Equity raised/(repaid) 87 1,762 0 0Debt raised/(repaid) 1,117 991 0 ‐200Dividend (incl. tax) ‐145 ‐202 ‐280 ‐311Other financing activities ‐30 ‐350 0 0Cash flow from financing activities 1,178 2,078 ‐280 ‐511Net chg in cash ‐623 448 ‐616 428
Valuation Ratios & Per Share Data FY12 FY13 FY14E FY15E
Per Share data EPS (INR) 6.7 10.9 16.6 18.5Growth, % 14.7 63.8 52.3 11.2Book NAV/share (INR) 40.3 55.9 68.9 85.8CFPS (INR) 6.8 6.9 12.0 16.1DPS (INR) 0.7 0.9 1.2 1.4Return ratios Return on assets (%) 12.5 14.0 16.7 15.2Return on equity (%) 16.6 19.6 24.2 21.6Return on capital employed (%) 16.6 18.6 21.9 20.1Turnover ratios Asset turnover (x) 2.3 2.4 2.4 2.3Sales/Total assets (x) 1.3 1.4 1.4 1.4Sales/Net FA (x) 3.6 3.8 3.9 3.8Working capital/Sales (x) 0.1 0.1 0.2 0.2Receivable days 110.6 89.6 96.0 96.0Liquidity ratios Current ratio (x) 2.0 2.3 2.1 2.1Quick ratio (x) 2.0 2.3 2.1 2.1Interest cover (x) 23.5 20.4 20.8 28.9Dividend cover (x) 9.5 11.7 13.4 13.4Total debt/Equity (%) 31.2 31.0 24.2 18.2Net debt/Equity (%) 10.5 12.5 14.4 7.7Valuation PER (x) 20.2 12.4 8.1 7.3PEG (x) ‐ y‐o‐y growth 1.4 0.2 0.2 0.7Price/Book (x) 3.4 2.4 2.0 1.6Yield (%) 0.5 0.7 0.9 1.0EV/Net sales (x) 1.6 1.2 1.0 0.8EV/EBITDA (x) 11.4 7.8 5.7 5.1EV/EBIT (x) 14.3 9.1 6.4 5.8

– 66 of 67 –
17 September 2013 / INDIA EQUITY RESEARCH / IT SERVICES SECTOR UPDATE
Management Vineet Bhatnagar (Managing Director) (91 22) 2300 2999 Jignesh Shah (Head – Equity Derivatives) (91 22) 6667 9735
Research Automobiles Deepak Jain (9122) 6667 9758 Banking, NBFCs Manish Agarwalla (9122) 6667 9962 Sachit Motwani, CFA, FRM (9122) 6667 9953 Consumer, Media, Telecom Naveen Kulkarni, CFA, FRM (9122) 6667 9947 Ennette Fernandes (9122) 6667 9764 Vivekanand Subbaraman (9122) 6667 9766 Cement Vaibhav Agarwal (9122) 6667 9967 Economics Anjali Verma (9122) 6667 9969
Engineering, Capital Goods Ankur Sharma (9122) 6667 9759 Infrastructure & IT Services Vibhor Singhal (9122) 6667 9949 Varun Vijayan (9122) 6667 9992 Metals Dhawal Doshi (9122) 6667 9769 Dharmesh Shah (9122) 6667 9974 Mid‐caps Kapil Bagaria (9122) 6667 9965 Oil&Gas, Agri Inputs Gauri Anand (9122) 6667 9943 Saurabh Rathi (9122) 6667 9951
Pharma Surya Patra (9122) 6667 9768 Retail, Real Estate Abhishek Ranganathan, CFA (9122) 6667 9952 Neha Garg (9122) 6667 9996 Quant Shikha Khurana (9122) 6667 9948 Sr. Manager – Equities Support Rosie Ferns (9122) 6667 9971
Sales & Distribution Kinshuk Tiwari (9122) 6667 9946 Ashvin Patil (9122) 6667 9991 Shubhangi Agrawal (9122) 6667 9964 Kishor Binwal (9122) 6667 9989 Sidharth Agrawal (9122) 6667 9934 Dipesh Sohani (9122) 6667 9756
Dilesh Doshi (Sales Trader) (9122) 6667 9747 Suniil Pandit (Sales Trader) (9122) 6667 9745 Rajesh Ashar (Sales Trader) (9122) 6667 9748
Mayur Shah (Execution) (9122) 6667 9945
Contact Information (Regional Member Companies)
SINGAPORE
Phillip Securities Pte Ltd 250 North Bridge Road, #06‐00 Raffles City Tower,
Singapore 179101 Tel : (65) 6533 6001 Fax: (65) 6535 3834
www.phillip.com.sg
MALAYSIA Phillip Capital Management Sdn Bhd B‐3‐6 Block B Level 3, Megan Avenue II,
No. 12, Jalan Yap Kwan Seng, 50450 Kuala Lumpur Tel (60) 3 2162 8841 Fax (60) 3 2166 5099
www.poems.com.my
HONG KONG Phillip Securities (HK) Ltd
11/F United Centre 95 Queensway Hong Kong Tel (852) 2277 6600 Fax: (852) 2868 5307
www.phillip.com.hk
JAPAN Phillip Securities Japan, Ltd
4‐2 Nihonbashi Kabutocho, Chuo‐ku Tokyo 103‐0026
Tel: (81) 3 3666 2101 Fax: (81) 3 3664 0141 www.phillip.co.jp
INDONESIA PT Phillip Securities Indonesia
ANZ Tower Level 23B, Jl Jend Sudirman Kav 33A, Jakarta 10220, Indonesia
Tel (62) 21 5790 0800 Fax: (62) 21 5790 0809 www.phillip.co.id
CHINA Phillip Financial Advisory (Shanghai) Co. Ltd.
No 550 Yan An East Road, Ocean Tower Unit 2318 Shanghai 200 001
Tel (86) 21 5169 9200 Fax: (86) 21 6351 2940 www.phillip.com.cn
THAILAND Phillip Securities (Thailand) Public Co. Ltd.
15th Floor, Vorawat Building, 849 Silom Road, Silom, Bangrak, Bangkok 10500 Thailand
Tel (66) 2 2268 0999 Fax: (66) 2 2268 0921 www.phillip.co.th
FRANCE King & Shaxson Capital Ltd.
3rd Floor, 35 Rue de la Bienfaisance 75008 Paris France
Tel (33) 1 4563 3100 Fax : (33) 1 4563 6017 www.kingandshaxson.com
UNITED KINGDOM King & Shaxson Ltd.
6th Floor, Candlewick House, 120 Cannon Street London, EC4N 6AS
Tel (44) 20 7929 5300 Fax: (44) 20 7283 6835 www.kingandshaxson.com
UNITED STATES Phillip Futures Inc.
141 W Jackson Blvd Ste 3050 The Chicago Board of Trade Building
Chicago, IL 60604 USA Tel (1) 312 356 9000 Fax: (1) 312 356 9005
AUSTRALIA PhillipCapital Australia
Level 37, 530 Collins Street Melbourne, Victoria 3000, Australia
Tel: (61) 3 9629 8380 Fax: (61) 3 9614 8309 www.phillipcapital.com.au
SRI LANKA Asha Phillip Securities Limited
Level 4, Millennium House, 46/58 Navam Mawatha, Colombo 2, Sri Lanka
Tel: (94) 11 2429 100 Fax: (94) 11 2429 199 www.ashaphillip.net/home.htm
INDIA PhillipCapital (India) Private Limited
No. 1, C‐Block, 2nd Floor, Modern Center , Jacob Circle, K. K. Marg, Mahalaxmi Mumbai 400011 Tel: (9122) 2300 2999 Fax: (9122) 6667 9955 www.phillipcapital.in

– 67 of 67 –
17 September 2013 / INDIA EQUITY RESEARCH / IT SERVICES SECTOR UPDATE
Disclosures and Disclaimers PhillipCapital (India) Pvt. Ltd. has three independent equity research groups: Institutional Equities, Institutional Equity Derivatives and Private Client Group. This report has been prepared by Institutional Equities Group. The views and opinions expressed in this document may or may not match or may be contrary at times with the views, estimates, rating, target price of the other equity research groups of PhillipCapital (India) Pvt. Ltd. This report is issued by PhillipCapital (India) Pvt. Ltd. which is regulated by SEBI. PhillipCapital (India) Pvt. Ltd. is a subsidiary of Phillip (Mauritius) Pvt. Ltd. References to "PCIPL" in this report shall mean PhillipCapital (India) Pvt. Ltd unless otherwise stated. This report is prepared and distributed by PCIPL for information purposes only and neither the information contained herein nor any opinion expressed should be construed or deemed to be construed as solicitation or as offering advice for the purposes of the purchase or sale of any security, investment or derivatives. The information and opinions contained in the Report were considered by PCIPL to be valid when published. The report also contains information provided to PCIPL by third parties. The source of such information will usually be disclosed in the report. Whilst PCIPL has taken all reasonable steps to ensure that this information is correct, PCIPL does not offer any warranty as to the accuracy or completeness of such information. Any person placing reliance on the report to undertake trading does so entirely at his or her own risk and PCIPL does not accept any liability as a result. Securities and Derivatives markets may be subject to rapid and unexpected price movements and past performance is not necessarily an indication to future performance. This report does not have regard to the specific investment objectives, financial situation and the particular needs of any specific person who may receive this report. Investors must undertake independent analysis with their own legal, tax and financial advisors and reach their own regarding the appropriateness of investing in any securities or investment strategies discussed or recommended in this report and should understand that statements regarding future prospects may not be realized. In no circumstances it be used or considered as an offer to sell or a solicitation of any offer to buy or sell the Securities mentioned in it. The information contained in the research reports may have been taken from trade and statistical services and other sources, which we believe are reliable. PhillipCapital (India) Pvt. Ltd. or any of its group/associate/affiliate companies do not guarantee that such information is accurate or complete and it should not be relied upon as such. Any opinions expressed reflect judgments at this date and are subject to change without notice Important: These disclosures and disclaimers must be read in conjunction with the research report of which it forms part. Receipt and use of the research report is subject to all aspects of these disclosures and disclaimers. Additional information about the issuers and securities discussed in this research report is available on request. Certifications: The research analyst(s) who prepared this research report hereby certifies that the views expressed in this research report accurately reflect the research analyst’s personal views about all of the subject issuers and/or securities, that the analyst have no known conflict of interest and no part of the research analyst’s compensation was, is or will be, directly or indirectly, related to the specific views or recommendations contained in this research report. The Research Analyst certifies that he /she or his / her family members does not own the stock(s) covered in this research report. Independence: PhillipCapital (India) Pvt. Ltd. has not had an investment banking relationship with, and has not received any compensation for investment banking services from, the subject issuers in the past twelve (12) months, and PhillipCapital (India) Pvt. Ltd does not anticipate receiving or intend to seek compensation for investment banking services from the subject issuers in the next three (3) months. PhillipCapital (India) Pvt. Ltd is not a market maker in the securities mentioned in this research report, although it or its affiliates may hold either long or short positions in such securities. PhillipCapital (India) Pvt. Ltd does not hold more than 1% of the shares of the company(ies) covered in this report. Suitability and Risks: This research report is for informational purposes only and is not tailored to the specific investment objectives, financial situation or particular requirements of any individual recipient hereof. Certain securities may give rise to substantial risks and may not be suitable for certain investors. Each investor must make its own determination as to the appropriateness of any securities referred to in this research report based upon the legal, tax and accounting considerations applicable to such investor and its own investment objectives or strategy, its financial situation and its investing experience. The value of any security may be positively or adversely affected by changes in foreign exchange or interest rates, as well as by other financial, economic or political factors. Past performance is not necessarily indicative of future performance or results. Sources, Completeness and Accuracy: The material herein is based upon information obtained from sources that PCIPL and the research analyst believe to be reliable, but neither PCIPL nor the research analyst represents or guarantees that the information contained herein is accurate or complete and it should not be relied upon as such. Opinions expressed herein are current opinions as of the date appearing on this material and are subject to change without notice. Furthermore, PCIPL is under no obligation to update or keep the information current. Copyright: The copyright in this research report belongs exclusively to PCIPL. All rights are reserved. Any unauthorized use or disclosure is prohibited. No reprinting or reproduction, in whole or in part, is permitted without the PCIPL’s prior consent, except that a recipient may reprint it for internal circulation only and only if it is reprinted in its entirety. Caution: Risk of loss in trading in can be substantial. You should carefully consider whether trading is appropriate for you in light of your experience, objectives, financial resources and other relevant circumstances. For U.S. persons only: This research report is a product of PhillipCapital (India) Pvt Ltd. which is the employer of the research analyst(s) who has prepared the research report. The research analyst(s) preparing the research report is/are resident outside the United States (U.S.) and are not associated persons of any U.S. regulated broker‐dealer and therefore the analyst(s) is/are not subject to supervision by a U.S. broker‐dealer, and is/are not required to satisfy the regulatory licensing requirements of FINRA or required to otherwise comply with U.S. rules or regulations regarding, among other things, communications with a subject company, public appearances and trading securities held by a research analyst account. This report is intended for distribution by PhillipCapital (India) Pvt Ltd. only to "Major Institutional Investors" as defined by Rule 15a‐6(b)(4) of the U.S. Securities andExchange Act, 1934 (the Exchange Act) and interpretations thereof by U.S. Securities and Exchange Commission (SEC) in reliance on Rule 15a 6(a)(2). If the recipient of this report is not a Major Institutional Investor as specified above, then it should not act upon this report and return the same to the sender. Further, this report may not be copied, duplicated and/or transmitted onward to any U.S. person, which is not the Major Institutional Investor. In reliance on the exemption from registration provided by Rule 15a‐6 of the Exchange Act and interpretations thereof by the SEC in order to conduct certain business with Major Institutional Investors, PhillipCapital (India) Pvt Ltd. has entered into an agreement with a U.S. registered broker‐dealer, Marco Polo Securities Inc. ("Marco Polo").Transactions in securities discussed in this research report should be effected through Marco Polo or another U.S. registered broker dealer PhillipCapital (India) Pvt. Ltd. Registered office: 2nd Floor, C‐Block, Modern Centre, Mahalaxmi, Mumbai – 400011