it market outlook a new reality after september 11 january 16, 2002 sung-lae park [email protected]...
TRANSCRIPT

IT Market Outlook A New Reality
After September 11
IT Market Outlook A New Reality
After September 11January 16, 2002
Sung-Lae Park
Research Director / IDC Korea
January 16, 2002
Sung-Lae Park
Research Director / IDC Korea

IDC= Internet Data
Center
IDC is the foremost global market intelligence and advisory firm since 1964
IDC= International Data Corporation

Components and Peripherals
Channels
Communications
Personal SystemsEnterprise Systems
Software
IT Overview
Verticals
Internet and eBusiness
Services
Global Depth and Breadth400+ Subscription Services
Technology Areas
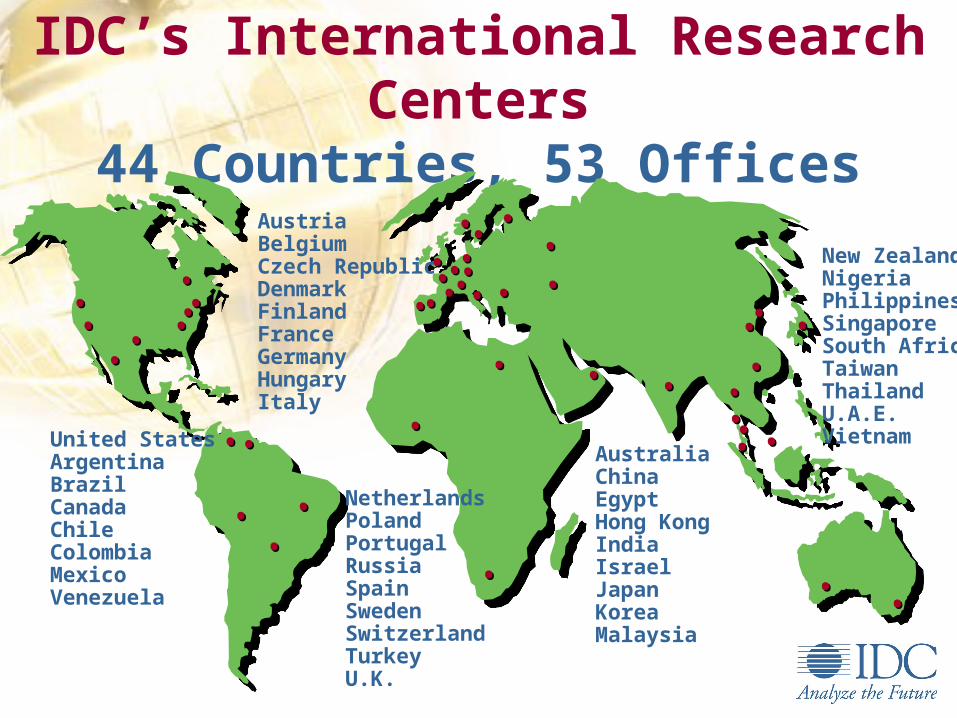
IDC’s International Research Centers44 Countries, 53 Offices
United StatesArgentinaBrazilCanadaChileColombiaMexicoVenezuela
AustriaBelgiumCzech RepublicDenmarkFinlandFranceGermanyHungaryItaly
AustraliaChinaEgyptHong Kong IndiaIsraelJapanKoreaMalaysia
Netherlands PolandPortugalRussiaSpainSwedenSwitzerlandTurkeyU.K.
New ZealandNigeriaPhilippinesSingaporeSouth AfricaTaiwanThailandU.A.E.Vietnam
••••
••••
••••••
••
•• ••
••••
••
••
••
••••
••
••
••••••••
••
•• ••••••••
•• •• ••••
••
•••• ••••
••••••••
••
••
••
Agenda
The Scene before September 11 Worldwide IT Spending, 2001 Sep. 11 and Operation Beacon Assumptions for New Scenarios
IT Market Outlook for 2002 and beyond Outlook by Product Outlook by Industry Outlook by Region Worst Case Scenario
Conclusions & Recommendations

IT Spending, 2001
US$B998 US$B432
Source: IDC, 2002
Worldwide
US43%
ROW57%
U S
Hardware31.5%
Software22.4%
Services46.1%

Before: A “Perfect Storm”
Internet Stock Crash
March 2000
US Economy
Slide
Q4 2000
Telecom Capacity
Glut
2001

But Things Weren’t That Bad
GDP was expected to bottom Q3 (Consensus)
Tax rebates almost .5% GDP, energy prices falling, leading indicators up, interest rate cuts
IDC surveys Q1, Q2, Q3 showed 2002 IT budget growth
CIO Tech Poll of CIOs in August showed spending trough in May

11.1
6.6
7.8
10.7
10.9
5.0
0
2
4
6
8
10
12
2000 2001 2002 2003 2004 2005
The Rebound Was Coming
US IT Spending“Worst Case”
Scenario
Source: IDC Global IT Economic Outlook Program
• GDP Up Q4, Business Investment Positive• Businesses able to anticipate profits start to spend again
• Recovery by segment
% Growth

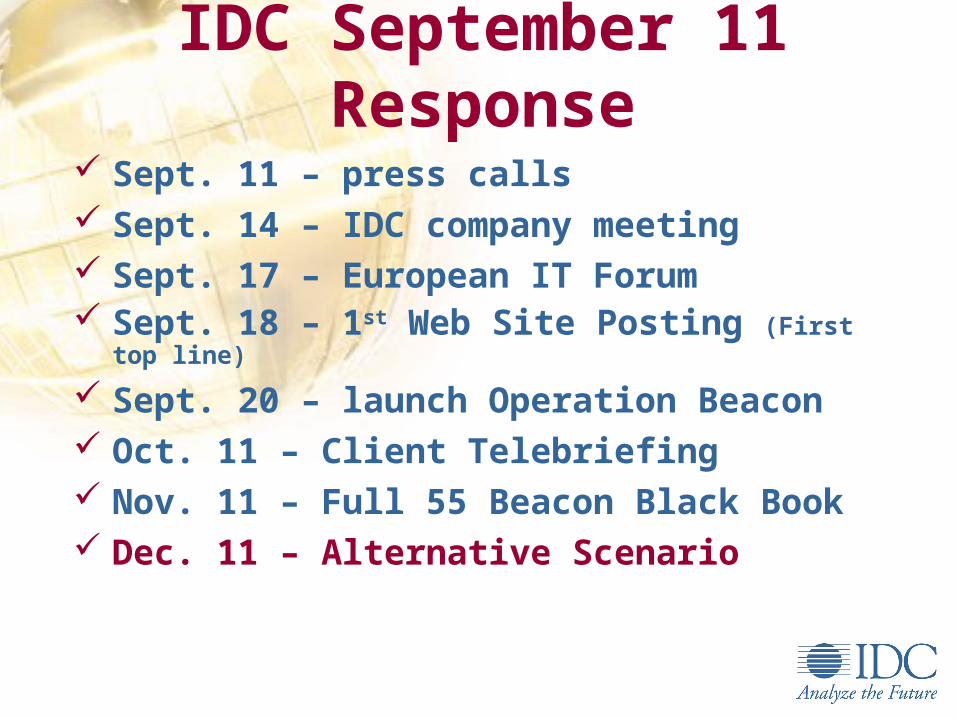
IDC September 11 Response
Sept. 11 – press calls Sept. 14 – IDC company meeting Sept. 17 – European IT Forum Sept. 18 – 1st Web Site Posting (First top line)
Sept. 20 – launch Operation Beacon Oct. 11 – Client Telebriefing Nov. 11 – Full 55 Beacon Black Book Dec. 11 – Alternative Scenario

Operation Beacon

Elements of Operation Beacon Discuss and agree on a common scenario Agree on a schedule, common format, analysis
framework Use common analytical inputs – historical
context, GDP histories, etc. Perform small group Delphi process to adjust
growth rates; adjust first for worsening economy prior to September 11, then for the attack
Constantly update

Components and Peripherals
Channels
Communications
Personal SystemsEnterprise Systems
Software
IT Overview
Verticals
Internet and eBusiness
Services
Recasting 1000 Forecasts

The Beacon Scenario*
Beacon
Terrorism No major
Reaction Back to normal
Economy Rebound Q2
US GDP Just positive 2001
WE GDP 1%-2% 2002
Housing Starts stay up
Unempl. Nothing said
* Established on 9/20/2001

Inputs for a New Scenario
Y2K economic impact model
Other wild card events
100 analysts
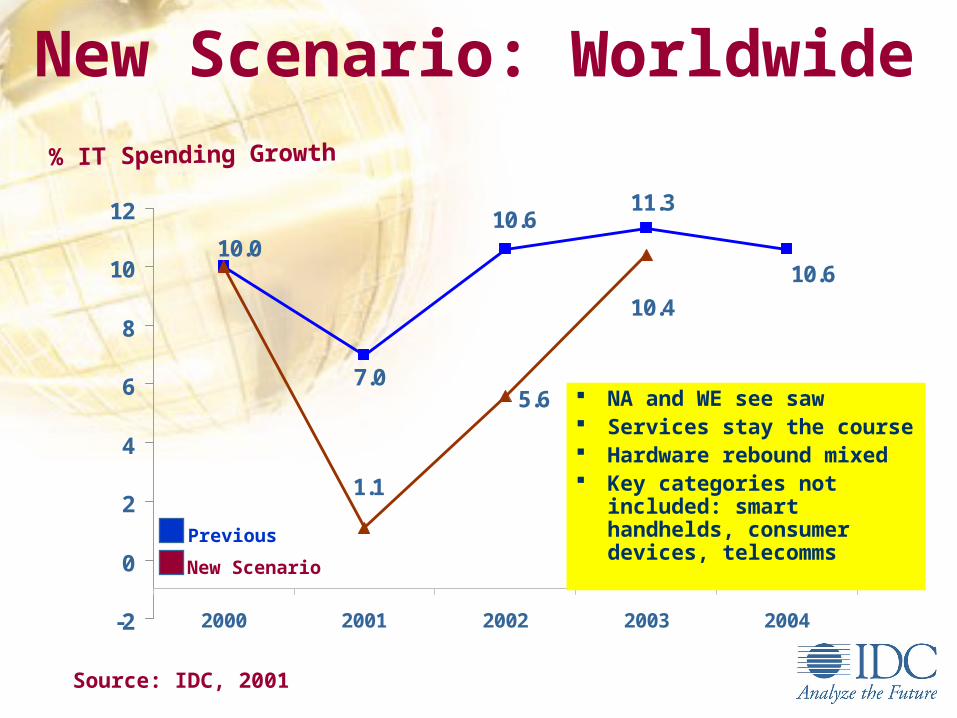
New Scenario: Worldwide
5.6
10.010.6
11.3
10.6
7.0
1.1
10.4
-2
0
2
4
6
8
10
12
2000 2001 2002 2003 2004
% IT Spending Growth
Source: IDC, 2001
Previous
New Scenario
NA and WE see saw Services stay the course Hardware rebound mixed Key categories not
included: smart handhelds, consumer devices, telecomms

PC Spending WW
Source: IDC, 2001
Economy, weak consumer sales in Europe, market saturation in the US, and slowdown in developing regions had already taken a toll
Portable replacements of desktops a long term driver
Windows XP not a major upgrade impetus
Commercial replacement cycles elongatingPrevious Forecast New Scenario
Growth
PCs: Already Down
-20%
-15%
-10%
-5%
0%
5%
10%
15%
2000 2001 2002 2003

Server Spending WW
Source: IDC, 2001
The economy had already turned the market negative
Price declines take their toll
Entry server market flattens out
“Mainframes” hold their own
New technology at risk McKinley will help out in
2002Previous Forecast New Scenario
Growth
Servers: Transition Ahead
-10%
-5%
0%
5%
10%
2000 2001 2002 2003
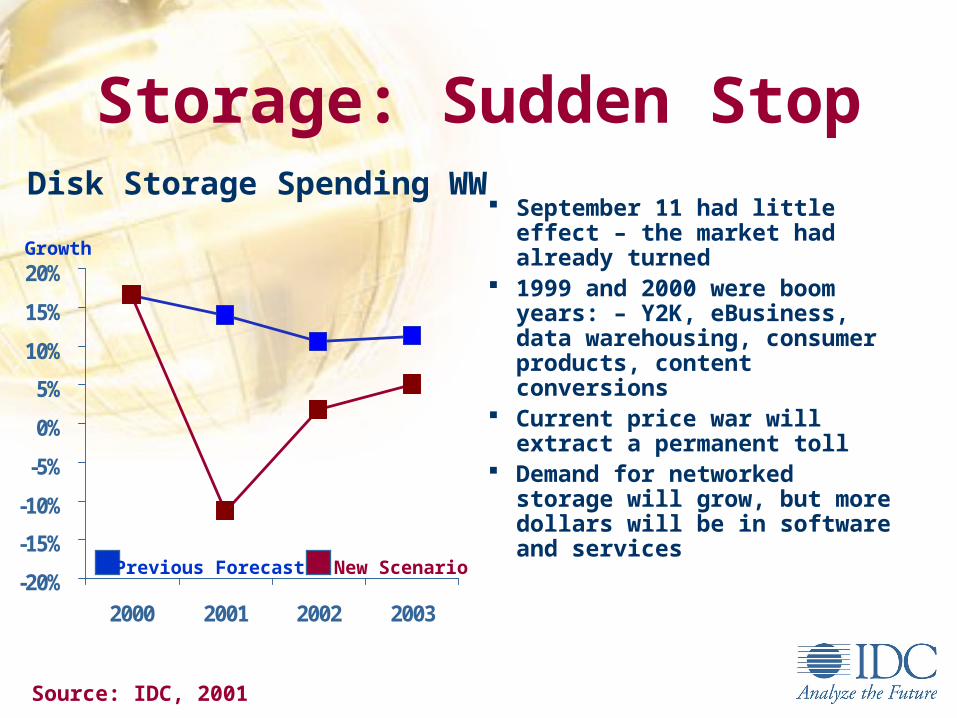
Disk Storage Spending WW
Source: IDC, 2001
September 11 had little effect – the market had already turned
1999 and 2000 were boom years: – Y2K, eBusiness, data warehousing, consumer products, content conversions
Current price war will extract a permanent toll
Demand for networked storage will grow, but more dollars will be in software and services
Previous Forecast New Scenario
Growth
Storage: Sudden Stop
-20%
-15%
-10%
-5%
0%
5%
10%
15%
20%
2000 2001 2002 2003

Printer Spending WW
Source: IDC, 2001
PC still drive printer shipments
Worst downturn as a result of the economy, not Sept. 11
Inkjet tied to consumer confidence; laser to commerce spending
High growth areas – wireless, photo, color laser – still to small to impact totals
Printer base aging – may drive an up tick
Previous Forecast New Scenario
Growth
Printers: Tied To PCs
-15%
-10%
-5%
0%
5%
10%
2000 2001 2002 2003

Network Equip. Spending WW
Source: IDC, 2001
Dot-com and CLEC implosion caused more problems than Sept. 11
New spending will focus on upgrades/add-ons
Wireless should get a boost Government Intervention to
solve congestion could help Spike in videoconferencing
equipment too small to make a difference
Previous Forecast New Scenario
Growth
Networking: Quick Spike
0%
5%
10%
15%
20%
2000 2001 2002 2003

Semiconductor Spending WW
Source: IDC, 2001
The worst year for semiconductors was already underway
A slowed economy will simply depress sales more
Inventories still haven’t cleared out of the channel
Wireless will lead the rebound Price cuts are not generating
demand Networking market holding up
– but opaqueNew Scenario
Growth
Semis: Paying The Price
-40%
-30%
-20%
-10%
0%
10%
20%
30%
40%
96 97 98 99 00 01 02
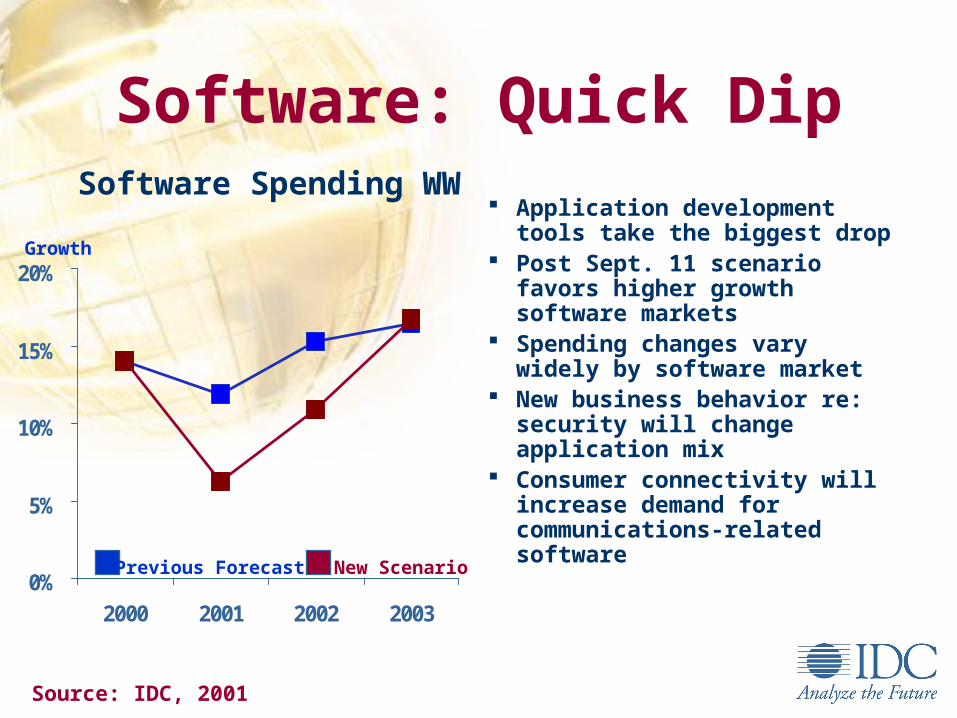
Software Spending WW
Source: IDC, 2001
Application development tools take the biggest drop
Post Sept. 11 scenario favors higher growth software markets
Spending changes vary widely by software market
New business behavior re: security will change application mix
Consumer connectivity will increase demand for communications-related softwarePrevious Forecast New Scenario
Growth
Software: Quick Dip
0%
5%
10%
15%
20%
2000 2001 2002 2003

Services Spending WW
Source: IDC, 2001
Device-related services down, but outsourcing, network consulting, and contract-based services less affected
Europe remains strong; US stays above 7.5% growth
Projects coming in smaller chunks, but pent-up demand to start hitting in 2003 in systems integration, CRM, supply chain servicesPrevious Forecast New Scenario
Growth
Services: Industry Fly Wheel
5%
10%
15%
2000 2001 2002 2003

Telecomms Spending WW
Source: IDC, 2001
The market is as big as IT, dominated by voice
No discernible effect from Sept. 11
Most growth outside US, which has been hit by economy, price wars, excess capacity, and CLEC implosion
Wireless is high growth but less than 15% of the market
Previous Forecast New Scenario
Growth
Telecomms: Status Quo
4%
8%
12%
2000 2001 2002 2003

Relative Size of IT Spending
Ave
rage
Bu
sin
ess
Gro
wth
, 200
2/20
01
Construction
Education
Transport
Health
Utilities
Insurance
Govmt
Comms/Media
Services
Banking/Finance
Average Share of US Business Market
Lower Growth
No Change
Higher Growth
Source : IDC’s Enterprise Technology Trends 2001
Verticals Post Sept. 11 Growth
Process Mfg/Resource
Retail Whol
Discrete Mfg

New Scenario: Worldwide
% IT Spending Growth
Source: IDC, 2001
Previous
New Scenario
NA and WE see saw Services stay the course Hardware rebound mixed Key categories not
included: smart handhelds, consumer devices, telecomms
5.6
10.010.6
11.3
10.6
7.0
1.1
10.4
-2
0
2
4
6
8
10
12
2000 2001 2002 2003 2004

New Scenario: North America
% IT Spending Growth
Source: IDC, 2001, Nov 11 Update
Previous
New Scenario
Price wars haven’t helped Canada doesn’t fall as far
as US Services and software
rebound helps most
4.1
12.0
9.5
11.3
10.5
5.7
-1.8
10.8
-2
0
2
4
6
8
10
12
2000 2001 2002 2003 2004

New Scenario: Western Europe
% IT Spending Growth
Source: IDC, 2001
Previous
New Scenario
Europe already deals with terrorism
Causes of downturn are mingled
Hardware most affected Mixed sector results –
Govt. up, transport down
12.0
10.2 10.5
10.2
8.4
6.1
4.9
8.7
0
2
4
6
8
10
12
2000 2001 2002 2003 2004

New Scenario: Asia Pacific
% IT Spending Growth
Source: IDC, 2001
Previous
New Scenario
Japan used to a down economy
AP spring back in 2003, China, India hold up region
Consumer exports hit mildly form Sept. 11
Domestic IT unaffected
8.0
12.0
13.1
11.810.8
8.2
2.7
11.9
2
4
6
8
10
12
14
2000 2001 2002 2003 2004

Market Opportunities by CountryTotal IT Spending, US$ MillionsTotal IT Spending, US$ Millions
Source: IDC Asia/Pacific, October 2001
0 5,000 10,000 15,000 20,000 25,000 30,000
Others
Vietnam
Indonesia
Philippines
Thailand
New Zealand
Malaysia
Hong Kong
Singapore
India
Taiwan
Korea
Australia
PRC
200220012000

The Case For A Downside View
Risk of further terrorist attacks
Self-reinforcing global downturn
Rising unemployment
Deflation
US$/stock market crash
A minority but not miniscule opinion

The Shipwreck Scenario
Beacon Shipwreck
Terrorism No major Possibly more
Reaction Back to normal Permanent change
Economy Rebound Q2 No rebound till 2003
US GDP Just positive 2001 Negative all 2002
WE GDP 1%-2% 2002 Below 1% 2002
Housing Starts stay up Market falls
Unempl. Nothing said Over 7% US

Two Scenarios: Worldwide
% IT Spending Growth
Source: IDC, 2001
Software has bad 2002 Services impact in 2002
& 2003 $275 billion
permanently lost between 2002-2004
Beacon
Shipwreck
1.1
10.411.5 11.2
5.6 7.6
10.2
-0.6
10.5
-2
0
2
4
6
8
10
12
2001 2002 2003 2004 2005

Two Scenarios: US
% IT Spending Growth
Source: IDC, 2001
Same trajectory as worldwide but steeper dip
Beacon
Shipwreck
-2.1
10.411.5 11.2
5.6
2.5
10.5
-3.7
10.3
-4
0
4
8
12
2001 2002 2003 2004 2005

PC Spending WW
PCs: Shipwreck Scenario
Source: IDC, 2001
2003 market 70% of 2000 market under “shipwreck,” US almost half
Weak consumer sales in Europe, market saturation in the US
Windows XP not a major upgrade impetus
Commercial replacement cycles elongate
Growth
Beacon
Shipwreck
-25%
-20%
-15%
-10%
-5%
0%
5%
10%
15%
2001 2002 2003 2004

Spending WW
Servers & Storage: Shipwreck Scenario
Source: IDC, 2001
Pent-up demand drives rebound when economy improves
Some regions defy lower economic growth assumptions
Market not back to 2000 levels until 2004
Growth
Beacon
Shipwreck
-15%
-10%
-5%
0%
5%
10%
15%
2001 2002 2003 2004

Software Spending WW
Software: Shipwreck Scenario
Source: IDC, 2001
Big difference if recovery delayed Cancellations, not delays Some pent-up demand
dissipates
Long term new world order for software
New Scenario
Growth
Beacon
Shipwreck
0%
5%
10%
15%
20%
2001 2002 2003 2004

Services Spending WW
Services: Shipwreck Scenario
Source: IDC, 2001
Even outsourcing falls off
Other regions are impacted more by the economy
Support revenues flatten and stay there
Project cutbacks in 2002 affect 2003 revenue
Growth
Beacon
Shipwreck
0%
5%
10%
15%
2001 2002 2003 2004

Other
Same trajectory in other regions – delay of upturn, no “make-up”
Hardware “drag” matters less in the shipwreck scenario
Exchange rates not factored in – but would make a difference

Insights
Sept. 11 had little impact on many markets – the economy had already done its job
Price wars weren’t creating demandServices is the great flywheelCurrency exchange adds an impossible
dimension

E.g., Mobile Internet
Drivers of Pent-Up Demand
Source: IDC, 2001
Postponed Enterprise Applications
eBusiness Integration 71% say important 21% have it
New software architectures Collaboration Distribution
Background processing Mobile eBusiness (see
chart at left)
% of Total in 2003
Should Be Much Higher
0%
10%
20%
30%
40%
Mobile Users Mobile Sites

Caveats
These are scenarios, not final forecastsNumbers may change over timeAssumptions may change over timeExchange rates were held constantBeware of “irrational gloom” as counter to
“irrational exuberance”
* For more details by sector or region, contact the specific programs
Recommendations
Plan for a rebound in mid 2002 – with the possibility it could come sooner!
Stay close to your customers, counter FUD with RAS
Use the IDC Beacon forecasts; keep the “Shipwreck” scenario only for contingency planning

Upcoming IDC Events