issn 2072-7925 well-being at school: does infrastructure matter? … · 2012-03-01 · 6 cele...
TRANSCRIPT

1
Well-being at school: does infrastructure matter?
ISSN 2072-7925Well-being at school: does infrastructure matter?CELE Exchange 2011/10© OECD 2011
By Katrien Cuyvers, Gio De Weerd, Sanne Dupont, Sophie Mols and Chantal Nuytten, Institute for Educational and Information Sciences, Instructional and Educational Science, University of Antwerp.
What is the impact of school infrastructure on the well-being of students in Flemish secondary schools? A study, commissioned by AGIOn (the Flemish agency that subsidises school buildings), investigated the impact of educational spaces on their users and set out to identify empirical evidence supporting the importance of school infrastructure on the well-being of students in secondary schools.
Research in the field of well-being among Flemish students in secondary schools has shown that age is an important predictor of well-being (Engels et al., 2004a). The feeling of well-being decreases during secondary education and the lowest scores occur in the 9th and 10th grade, i.e. students aged 14 and 15, which is why our research team chose to study this age group. We were motivated by the thought that if our findings support the hypothesis that school infrastructure matters, small adjustments could lead to important advantages for the well-being of these vulnerable students.
A pre-fabricated building,
used as a classroomRights reserved; © University of Antwerp
This led us to ask the following fundamental questions:
1. Can differences in students’ well-being be attributed to the quality of their school’s infrastructure?
2. Are there differences in well-being between students who study in good vs. poor quality school infrastructure, regardless of gender, grade and type of education?1
3. If point (2) applies, do these differences in well-being exist regardless of the type of urban area where the school is located and the school’s educational network?2
4. Does school infrastructure have the same impact on all students? Are certain student groups more sensitive to infrastructure than others?
1. Flemish schools dispense four types of education. More information can be found at: www.ond.vlaanderen.be/publicaties/eDocs/pdf/120.pdf.
2. According to www.ond.vlaanderen.be/publicaties/eDocs/pdf/120.pdf, an educational network is “a representative association of governing bodies and often takes over some of the responsibilities of governing bodies”. Flanders has three educational networks.
2
CELE Exchange 2011/10 – ISSN 2072-7925 – © OECD 2011
Well-being at school: does infrastructure matter?
MEthoDoloGyTo constitute the sample group we used data collected by AGIOn’s monitoring system (Leemans, 2008) which consisted of 48 quality indicators. They all relate to different aspects of well-being so it would have been impossible to use all of them. We therefore reviewed the international literature on aspects of school infrastructure which can influence non-cognitive outcomes (well-being, behaviour, etc.). After careful consideration, we chose the following quality indicators:
• the school building has a clear spatial structure where it is easy to find one’s way around,
• as far as possible, the classrooms open onto a (green) outside area,
• the school building provides well-integrated ICT and easy access to various sources for research,
• all indicators which relate to safety (e.g. the school building is well protected against break-ins),
• criteria on the condition of school buildings,
• criteria on the amenity and physical comfort of school buildings (temperature, acoustics, lighting and ventilation).
We ignored the other quality indicators, for which we found no possible relationship to non-cognitive outcomes.
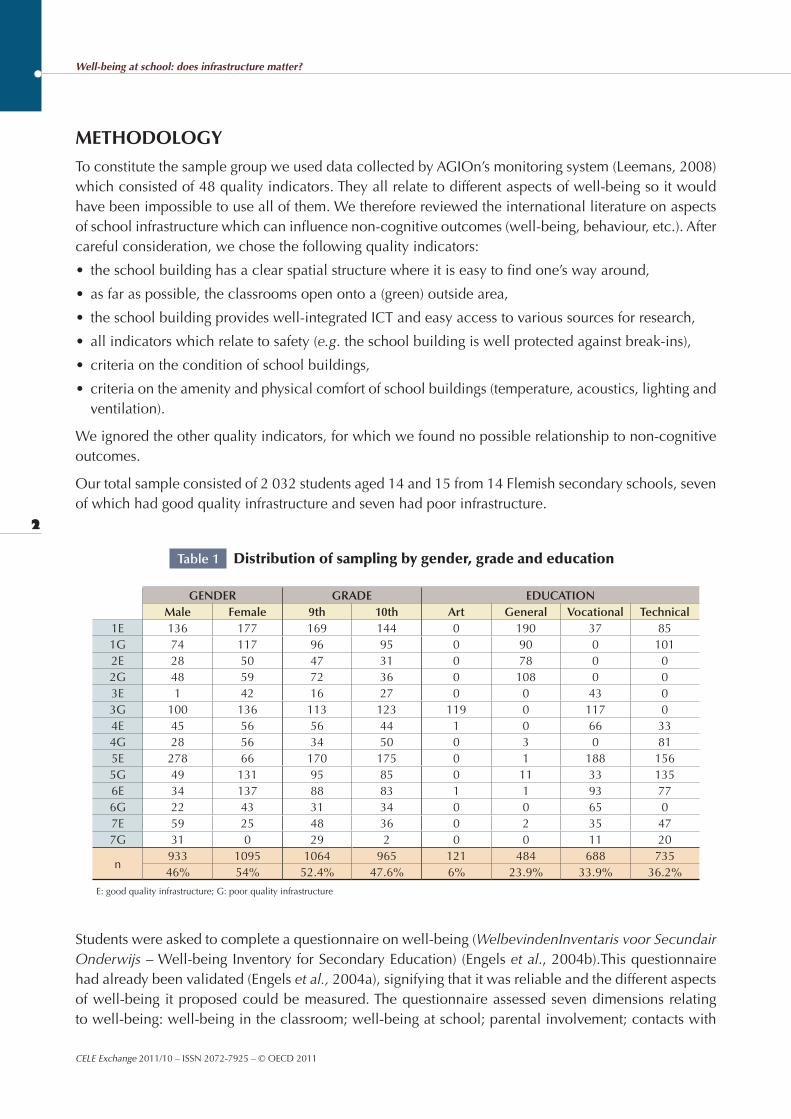
Our total sample consisted of 2 032 students aged 14 and 15 from 14 Flemish secondary schools, seven of which had good quality infrastructure and seven had poor infrastructure.
Table 1 Distribution of sampling by gender, grade and education
GendeR GRAde edUcATionMale Female 9th 10th Art General Vocational Technical
1E 136 177 169 144 0 190 37 851G 74 117 96 95 0 90 0 1012E 28 50 47 31 0 78 0 02G 48 59 72 36 0 108 0 03E 1 42 16 27 0 0 43 03G 100 136 113 123 119 0 117 04E 45 56 56 44 1 0 66 334G 28 56 34 50 0 3 0 815E 278 66 170 175 0 1 188 1565G 49 131 95 85 0 11 33 1356E 34 137 88 83 1 1 93 776G 22 43 31 34 0 0 65 07E 59 25 48 36 0 2 35 477G 31 0 29 2 0 0 11 20
n933 1095 1064 965 121 484 688 73546% 54% 52.4% 47.6% 6% 23.9% 33.9% 36.2%
E: good quality infrastructure; G: poor quality infrastructure
Students were asked to complete a questionnaire on well-being (WelbevindenInventaris voor Secundair Onderwijs – Well-being Inventory for Secondary Education) (Engels et al., 2004b).This questionnaire had already been validated (Engels et al., 2004a), signifying that it was reliable and the different aspects of well-being it proposed could be measured. The questionnaire assessed seven dimensions relating to well-being: well-being in the classroom; well-being at school; parental involvement; contacts with
3
© OECD 2011 – ISSN 2072-7925 – CELE Exchange 2011/10
Well-being at school: does infrastructure matter?
friends; study pressure; curriculum; and behaviour and general well-being. Scales consisted of different questions and these were grouped according to type (Engels et al., 2004a).
1. Questions relating to feelings: students were asked to assess a specific context and then give it a score in function of how they felt about it, varying from “very bad” to “very good”. Example: Do teachers treat you with respect? How do you feel about this?
2. Questions relating to satisfaction: students were asked to answer questions relating to their satisfaction with certain topics. Again, answers varied on a five-point scale from “not at all” to “entirely”. Example: Do you think the school building is attractive?
3. Questions relating to behaviour: students assessed their own behaviour and how often they have behaved in a certain way at school, varying from “never” to “always”. Example: Do you participate in class?
4. General questions which give insight in the well-being of students: responses could vary from “I do not agree” to “I agree entirely”. Example: In general, I feel happy at school.
Again, we had to make choices, this time in relation to the concept of well-being. Once we had reviewed the international literature, variables were selected and average scores were estimated for general well-being, well-being related to the school atmosphere and well-being related to school infrastructure.
We used multilevel models to analyse the data and took into account the issue of hierarchy: students are based in classes and classes are based in schools. Students are individuals but they share a social context, i.e. their class and the school they attend. Because of this, students’ well-being is based on similar elements and they cannot be considered to be independent. With this in mind, multilevel models enabled us to investigate variance within schools and between schools (Maeyer and Rymenans, 2004; Pustjens et al., 2004; Maeyer et al., 2010).
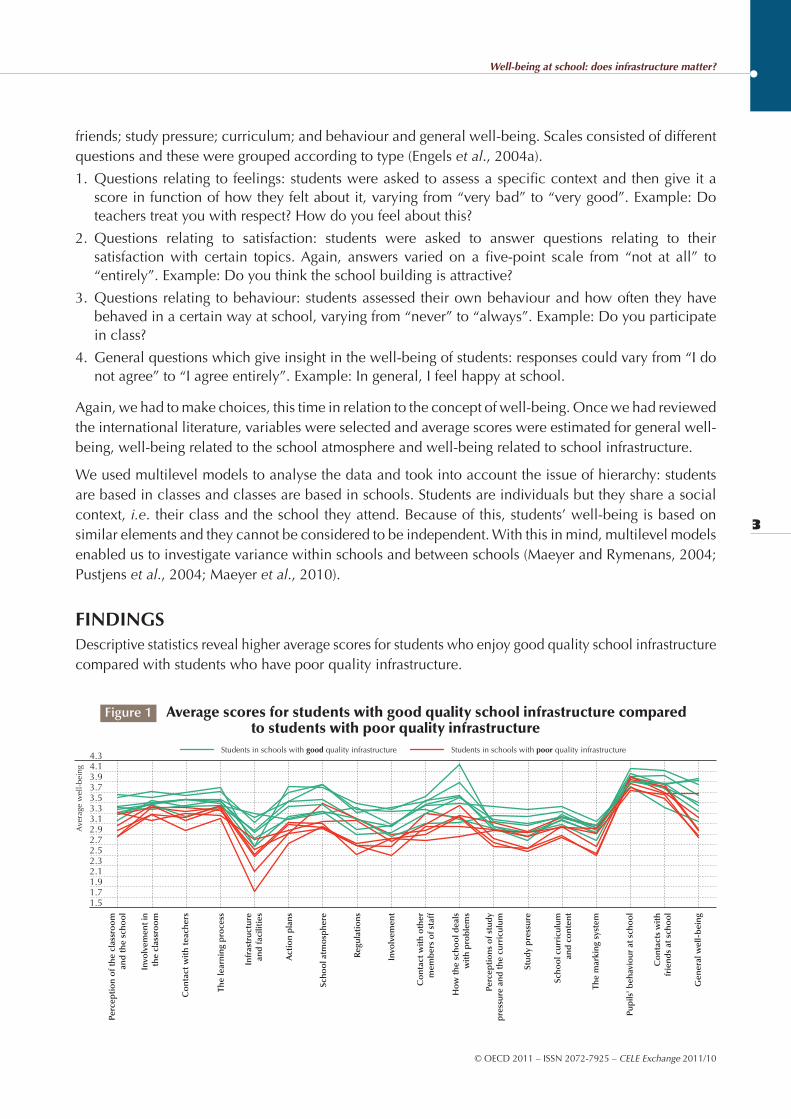
FINDINGSDescriptive statistics reveal higher average scores for students who enjoy good quality school infrastructure compared with students who have poor quality infrastructure.
Figure 1 Average scores for students with good quality school infrastructure compared to students with poor quality infrastructure
4.34.13.93.73.53.33.12.92.72.52.32.11.91.71.5
Ave
rage
wel
l-be
ing
Perc
epti
on
of t
he c
lass
roo
man
d t
he s
cho
ol
Invo
lvem
ent
inth
e cl
assr
oo
m
Co
ntac
t w
ith
teac
hers
The
lear
ning
pro
cess
Infr
astr
uctu
rean
d fa
cilit
ies
Act
ion
pla
ns
Scho
ol a
tmo
sphe
re
Reg
ulat
ions
Invo
lvem
ent
Co
ntac
t w
ith
oth
erm
emb
ers
of s
taff
How
the
sch
oo
l dea
lsw
ith
pro
ble
ms
Stud
y p
ress
ure
Scho
ol c
urri
culu
man
d c
ont
ent
The
mar
king
sys
tem
Pup
ils' b
ehav
iour
at
scho
ol
Co
ntac
ts w
ith
frie
nds
at s
cho
ol
Gen
eral
wel
l-b
eing
Perc
epti
ons
of s
tud
yp
ress
ure
and
the
cur
ricu
lum
Students in schools with good quality infrastructure Students in schools with poor quality infrastructure
4
CELE Exchange 2011/10 – ISSN 2072-7925 – © OECD 2011
Well-being at school: does infrastructure matter?
Analysis shows that there was a stark contrast in satisfaction levels between students attending schools with good quality infrastructure as compared with those in schools with poor infrastructure. Similarly, high levels of well-being were recorded among those attending schools which corresponded to the following criteria: “to the extent possible, possible the classrooms open onto a (green) outside area” and “the school building provides well-integrated ICT and easy access to various sources for research”; conversely, students attributed low scores to schools which fared badly on these aspects. Without a doubt, we were able to conclude that school infrastructure definitely contributes to the well-being of students.
Referring back to the first fundamental question raised earlier (“Can differences in students’ well-being be attributed to the quality of their school’s infrastructure?), the answer is yes. Differences in students’ well-being can be linked to the quality of the infrastructure of the schools they attend. It follows that scores on well-being were significantly lower among students attending schools with poor quality infrastructure and schools with low scores on both variables (“to the extent possible, possible the classrooms open onto a (green) outside area” and “the school building provides well-integrated ICT and easy access to various sources for research”). Differences remain significant irrespective of student characteristics (gender, grade, type of education) and school characteristics (urbanisation and educational networks). So, regardless of these criteria, the quality of school infrastructure definitely has a strong impact on an individual’s perception of his well-being.
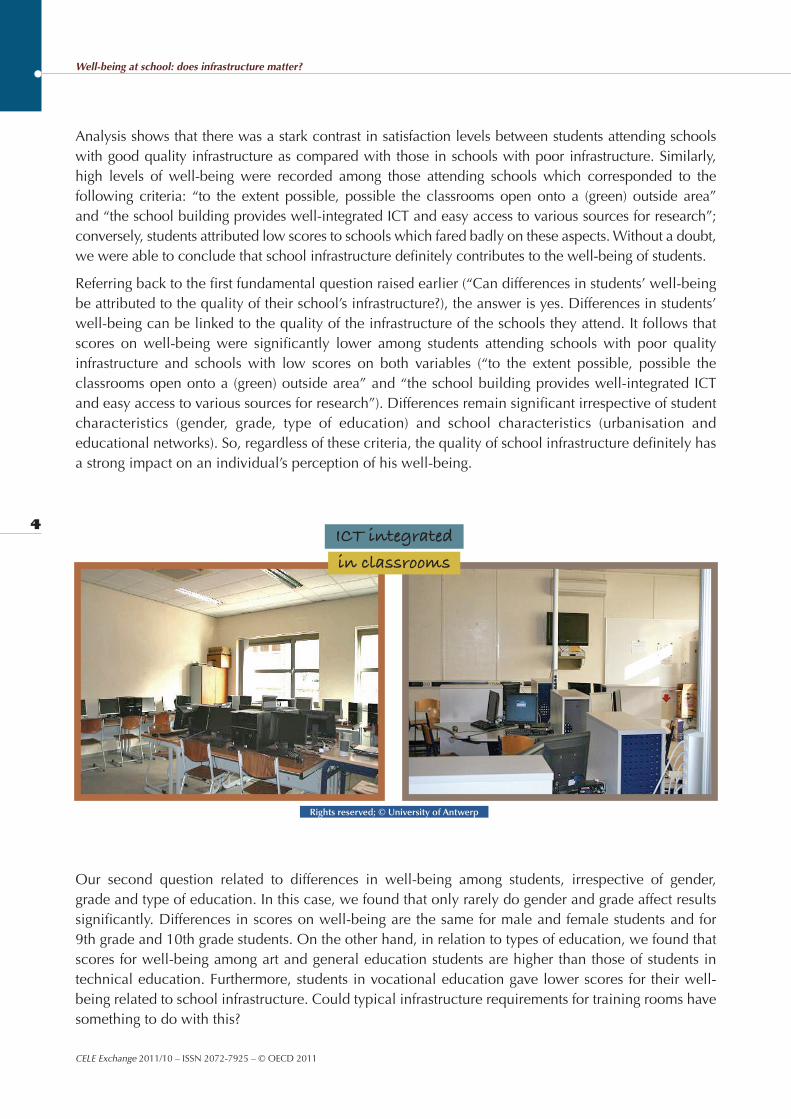
Rights reserved; © University of Antwerp
ICT integrated
in classrooms
Our second question related to differences in well-being among students, irrespective of gender, grade and type of education. In this case, we found that only rarely do gender and grade affect results significantly. Differences in scores on well-being are the same for male and female students and for 9th grade and 10th grade students. On the other hand, in relation to types of education, we found that scores for well-being among art and general education students are higher than those of students in technical education. Furthermore, students in vocational education gave lower scores for their well-being related to school infrastructure. Could typical infrastructure requirements for training rooms have something to do with this?

5
© OECD 2011 – ISSN 2072-7925 – CELE Exchange 2011/10
Well-being at school: does infrastructure matter?
Question three related to the school’s characteristics. Here, we found that the effect of infrastructure remains, regardless of urbanisation. There is no difference in scores on well-being in rural and urban schools. A school with poor quality infrastructure will affect well-being in the same way, whether it be rural or urban.
Lastly, we asked if the impact of school infrastructure is the same for all students. In order to answer this question we investigated, for instance, whether the effect on well-being of attending a school with good quality school infrastructure is the same for male and female students, for arts students and vocational education students. On the whole we found that female students are more sensitive to school infrastructure than their male colleagues and that 9th grade students are more sensitive than 10th grade students. We also found that general education students are less sensitive than other students. One very specific finding was that vocational education students are much more sensitive to well-integrated information communication technology (ICT) compared with other students.
Rig
hts
rese
rved
; © U
nive
rsit
y o
f Ant
wer
p
Skateboard lockers
make life easier
Anyone for a picnic?

6
CELE Exchange 2011/10 – ISSN 2072-7925 – © OECD 2011
Well-being at school: does infrastructure matter?
To summarise, the research team found empirical evidence to support the importance of school infrastructure on the well-being of students in the Belgian region of Flanders. Previous international research indicated that the subject was significant; this research takes it a step further by offering tentative findings on effects and tendencies. Although the present research has some limitations and more work is required in order to refine our findings, we hope nevertheless to have contributed to the body of scholarly research on the subject.
ReferencesEngels, N. et al. (2004a), “Factors which influence the well-being of pupils in Flemish secondary schools”, Educational Studies, Vol. 30, Issue 2.
Engels, N. et al. (eds.) (2004b), Graag naar school. Een meetinstrument voor het welbevinden van leerlingen secundair Onderwijs, Brussels.
Leemans, G. (2008), De schoolgebouwenmonitor. Indicator voor de kwaliteit van schoolgebouwen in Vlaanderen, AGIOn, Garant, Brussels.
Maeyer, S. (de), D. Kavadias and L. Coertjens (2010), Open leerpakket Gevorderde analysetechnieken. Inleiding tot multilevel analyse, University of Antwerp.
Maeyer, S. (de) and R. Rymenans (2004), Onderzoek naar kenmerken van effectieve scholen, Academia Press, Gent.
For more information, contact:Katrien CuyversRozengaard 102550 KontichBelgiumE-mail: [email protected]
For further reading, see here.

ORGANISATION FOR ECONOMIC CO-OPERATION AND DEVELOPMENT
The OECD is a unique forum where governments work together to address the economic, socialand environmental challenges of globalisation. The OECD is also at the forefront of efforts to
understand and to help governments respond to new developments and concerns, such as corporategovernance, the information economy and the challenges of an ageing population. The Organisation
provides a setting where governments can compare policy experiences, seek answers to commonproblems, identify good practice and work to co-ordinate domestic and international policies.
The OECD member countries are: Australia, Austria, Belgium, Canada, Chile, the Czech Republic,Denmark, Estonia, Finland, France, Germany, Greece, Hungary, Iceland, Ireland, Israel, Italy, Japan,
Korea, Luxembourg, Mexico, the Netherlands, New Zealand, Norway, Poland, Portugal, theSlovak Republic, Slovenia, Spain, Sweden, Switzerland, Turkey, the United Kingdom and the
United States. The European Commission takes part in the work of the OECD.
OECD Publishing disseminates widely the results of the Organisation’s statistics gathering and
research on economic, social and environmental issues, as well as the conventions, guidelines andstandards agreed by its members.
ISSN 2072-7925
Corrigenda to OECD publications may be found on line at: www.oecd.org/publishing/corrigenda.
© OECD 2011
You can copy, download or print OECD content for your own use, and you can include excerpts from OECD publications, databases and multimedia
products in your own documents, presentations, blogs, websites and teaching materials, provided that suitable acknowledgment of OECD as source
and copyright owner is given. All requests for public or commercial use and translation rights should be submitted to [email protected]. Requests for
permission to photocopy portions of this material for public or commercial use shall be addressed directly to the Copyright Clearance Center (CCC) at
[email protected] or the Centre français d’exploitation du droit de copie (CFC) at [email protected].
This work is published on the responsibility of the Secretary-General of the OECD. The
opinions expressed and arguments employed herein do not necessarily reflect the official
views of the Organisation or of the governments of its member countries.
This work is published on the responsibility of the Secretary-General of the OECD. The
opinions expressed and arguments employed herein do not necessarily reflect the official
views of the Organisation or of the governments of its member countries.