ispod district report - onslow 10oct01
Upload: north-carolina-alliance-for-athletics-health-physical-education-recreation-and-dance-ncaahperd
Post on 09-Mar-2016
215 views
DESCRIPTION
IsPOD Data Results Spring 2010 2010 NC IsPOD Evaluation All rights reserved.TRANSCRIPT
2010 NC IsPOD Evaluation All rights reserved.
ONSLOW COUNTY
The North Carolina Alliance for Athletics, Health, Physical Education, Recreation,
and Dance (NCAAHPERD), launched In-school Prevention of Obesity and Disease (IsPOD) in 2007. The initiative began with a grant from the NC Health and Wellness Trust Fund and was expanded with grants from the Blue Cross
Blue Shield of North Carolina Foundation. The expansion to a state-wide program
is supported by a $3.6 million grant from the Kate B. Reynolds Charitable Trust. NCAAHPERD is engaged with a large network of health and physical education
groups seeking greater opportunities for a healthier and more creative North Carolina.
IsPOD DataResults
Spring 2010
2010 NC IsPOD Evaluation
Conducted by NCAAHPERD/NC DPH All rights reserved.
Onslow County
SPARK Training
Staff from Onslow County began receiving SPARK training in the 2008-2009
school year with the KBR Grant. Onslow County has 28 K-8 public schools. Of
these 28 schools, 25 schools (or 89%) have received SPARK training. At these
schools, a total of 38 PE teachers and 1 coordinators have been trained in
SPARK. Table 1 shows the Onslow County K-8 schools that have received
SPARK training and the number of staff trained. FitnessGram Response Rates
are also given for each of the K-8 schools.

2010 NC IsPOD Evaluation Conducte4d by NCAAHPERD/NC DPH
All rights reserved.
2
Table 1
Onslow County K-8 Schools
Schools with SPARK Training and FitnessGram Response Rates
ID School Name
DEMOGRAPHICS SPARK FITNESSGRAM
2009-2010 ADM
% Needy
SPARK Trained?
# Staff Trained
Using FG?
FG Response Rates
Grades 1-2
Grades 3-5
Grades 6-8
304 Bell Fork Elementary 509 59% YES 1 YES 0% 42% NA
308 Blue Creek Elementary 551 61% YES 2 YES 0% 94% NA
310 Carolina Forest Elementary 622 32% YES 2 YES 0% 96% NA
312 Clyde Erwin Elementary 429 64% YES 1 NO 0% 0% NA
314 Dixon Elementary 685 49% YES 2 NO 0% 0% NA
318 Dixon Middle 528 43% YES 1 NO NA NA 0%
321 Hunters Creek Elementary 536 61% YES 2 YES 0% 94% NA
322 Hunters Creek Middle 803 39% YES 1 NO NA NA 0%
323 Jacksonville Commons Elem 709 49% YES 3 YES 0% 79% NA
325 Jacksonville Commons Mid 662 49% NO 0 NO NA NA 0%
329 Meadow View Elementary 699 52% YES 1 NO 0% 0% NA
330 Morton Elementary 557 50% YES 1 YES 0% 32% NA
331 New Bridge Middle 489 53% YES 1 NO NA NA 0%
332 Northwoods Elementary 467 65% YES 3 YES 0% 96% NA
335 Queens Creek Elementary 623 53% YES 1 YES 0% 95% NA
336 Northwoods Park Middle 677 40% NO 0 NO NA NA 0%
337 Richlands Primary 677 40% YES 1 NO 0% NA NA
338 Parkwood Elementary 645 28% YES 1 YES 0% 95% NA
339 Richlands Elementary 669 54% NO 0 NO NA 0% NA
341 Sand Ridge Elementary 591 56% YES 1 YES 0% 97% NA
342 Silverdale Elementary 446 54% YES 1 YES 0% 96% NA
343 Southwest Elementary 741 57% YES 1 NO 0% 0% NA
345 Southwest Middle 519 51% YES 1 NO NA NA 0%
346 Summersill Elementary 528 45% YES 2 NO 0% 0% NA
347 Stateside Elementary 558 NA YES 1 YES 0% 95% NA
350 Swansboro Elementary 473 36% YES 3 YES 37% 96% NA
351 Swansboro Middle 846 39% YES 2 NO NA NA 0%
356 Trexler Middle 793 38% YES 2 NO NA NA 0%

2010 NC IsPOD Evaluation Conducted by NCAAHPERD/NC DPH
All rights reserved.
3
Onslow County
FitnessGram Response Rates
In spring 2010, 13 of the Onslow County K-8 schools, or 46%, conducted
FitnessGram assessments and submitted their data. Table 2 shows the
FitnessGram Response Rates by grade for all Onslow County K-8 schools
combined.
2010 NC IsPOD Evaluation Conducte4d by NCAAHPERD/NC DPH
All rights reserved.
4
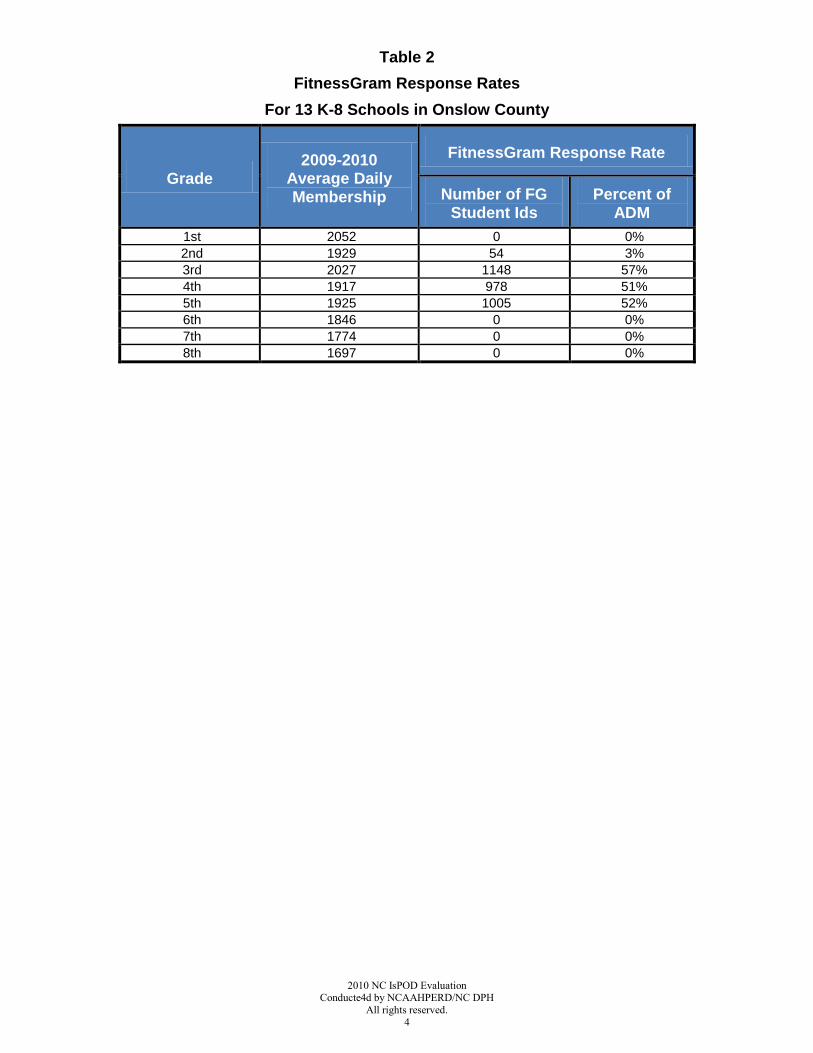
Table 2
FitnessGram Response Rates
For 13 K-8 Schools in Onslow County
Grade 2009-2010
Average Daily Membership
FitnessGram Response Rate
Number of FG Student Ids
Percent of ADM
1st 2052 0 0%
2nd 1929 54 3%
3rd 2027 1148 57%
4th 1917 978 51%
5th 1925 1005 52%
6th 1846 0 0%
7th 1774 0 0%
8th 1697 0 0%

2010 NC IsPOD Evaluation Conducted by NCAAHPERD/NC DPH
All rights reserved.
5
Body Mass Index (BMI)
North Carolina
Spring 2010 Percent in Health Fitness Zone (HFZ)
FitnessGram Results for 370 NC K-8 Schools in 61 NC Counties
Grade
Percent in HFZ Counts in HFZ
Female Male
Female Male
Total FG Results
N in HFZ Total FG Results
N in HFZ
1st 56% 57% 937 528 884 500
2nd 55% 57% 1175 642 1209 689
3rd 57% 55% 9670 5556 10075 5558
4th 54% 52% 9624 5227 10103 5260
5th 53% 51% 9396 4961 9857 5043
6th 54% 50% 3528 1893 3550 1785
7th 57% 52% 3315 1897 3149 1644
8th 56% 54% 3174 1780 3321 1802
56%
55% 57%
54%
53%
54% 57%
56%
57%
57%
55%
52%
51%
50%
52%
54%
0%
10%
20%
30%
40%
50%
60%
70%
80%
90%
100%
1st 2nd 3rd 4th 5th 6th 7th 8th
Pe
rce
nt
in H
FZ
Grade
Female Male

2010 NC IsPOD Evaluation Conducte4d by NCAAHPERD/NC DPH
All rights reserved.
6
Body Mass Index (BMI)
Onslow County
Spring 2010 Percent in Healthy Fitness Zone (HFZ)
FitnessGram Results for 13 K-8 Schools in Onslow County
Grade
Percent in HFZ Counts in HFZ
Female Male
Female Male
Total FG Results
N in HFZ Total FG Results
N in HFZ
1st NA NA 0 0 0 0
2nd 58% 72% 24 14 29 21
3rd 64% 67% 218 140 216 144
4th 59% 58% 161 95 186 107
5th 59% 56% 219 129 213 120
6th NA NA 0 0 0 0
7th NA NA 0 0 0 0
8th NA NA 0 0 0 0
58% 64%
59%
59%
72%
67%
58%
56%
0%
10%
20%
30%
40%
50%
60%
70%
80%
90%
100%
2nd 3rd 4th 5th
Pe
rce
nt
in H
FZ
Grade
Female Male
2010 NC IsPOD Evaluation Conducted by NCAAHPERD/NC DPH
All rights reserved.
7
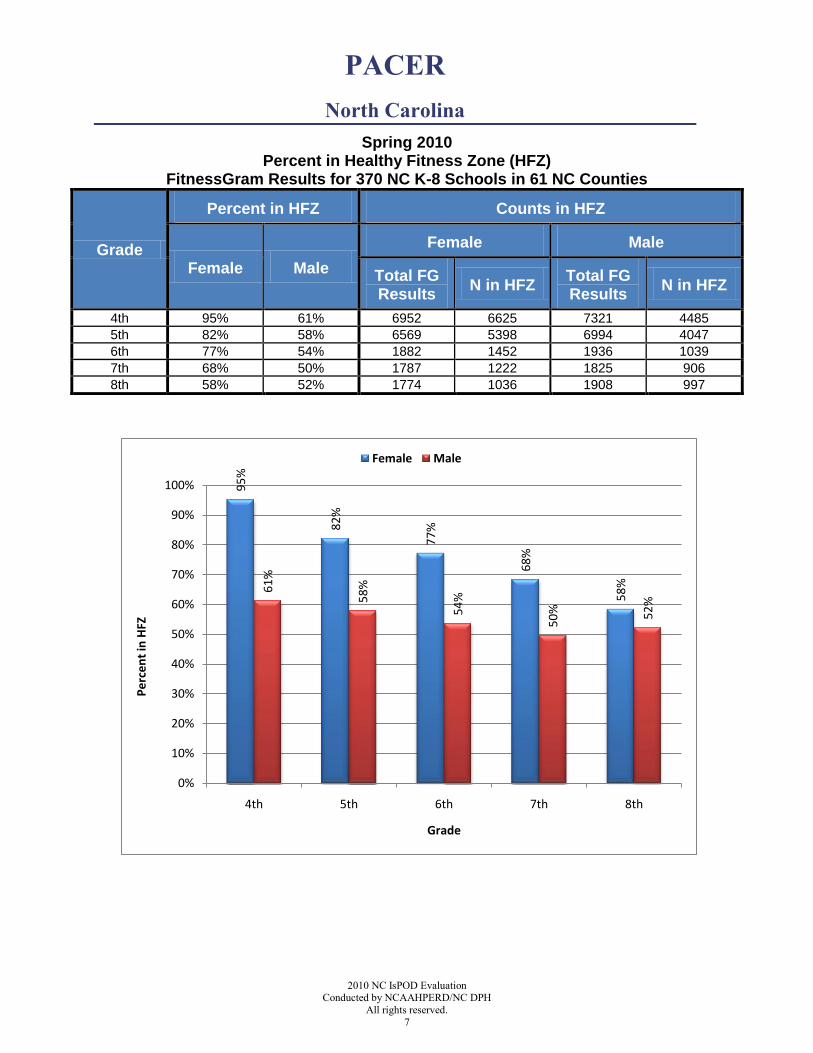
PACER
North Carolina
Spring 2010 Percent in Healthy Fitness Zone (HFZ)
FitnessGram Results for 370 NC K-8 Schools in 61 NC Counties
Grade
Percent in HFZ Counts in HFZ
Female Male
Female Male
Total FG Results
N in HFZ Total FG Results
N in HFZ
4th 95% 61% 6952 6625 7321 4485
5th 82% 58% 6569 5398 6994 4047
6th 77% 54% 1882 1452 1936 1039
7th 68% 50% 1787 1222 1825 906
8th 58% 52% 1774 1036 1908 997
95%
82%
77%
68%
58%61%
58%
54%
50% 52%
0%
10%
20%
30%
40%
50%
60%
70%
80%
90%
100%
4th 5th 6th 7th 8th
Pe
rce
nt
in H
FZ
Grade
Female Male

2010 NC IsPOD Evaluation Conducte4d by NCAAHPERD/NC DPH
All rights reserved.
8
PACER
Onslow County
Spring 2010 Percent in Healthy Fitness Zone (HFZ)
FitnessGram Results for 13 K-8 Schools in Onslow County
Grade
Percent in HFZ Counts in HFZ
Female Male
Female Male
Total FG Results
N in HFZ Total FG Results
N in HFZ
4th 94% 50% 16 15 24 12
5th 94% 52% 54 51 64 33
6th NA NA 0 0 0 0
7th NA NA 0 0 0 0
8th NA NA 0 0 0 0
94%
94%
50%
52%
0%
10%
20%
30%
40%
50%
60%
70%
80%
90%
100%
4th 5th
Pe
rce
nt
in H
FZ
Grade
Female Male

2010 NC IsPOD Evaluation Conducted by NCAAHPERD/NC DPH
All rights reserved.
9
CURL-UP
North Carolina
Spring 2010 Percent in Healthy Fitness Zone (HFZ)
FitnessGram Results for 370 NC K-8 Schools in 61 NC Counties
Grade
Percent in HFZ Counts in HFZ
Female Male
Female Male
Total FG Results
N in HFZ Total FG Results
N in HFZ
1st 83% 84% 917 759 879 742
2nd 78% 79% 1260 989 1300 1032
3rd 82% 82% 11285 9254 11683 9544
4th 80% 81% 11221 8954 11729 9512
5th 78% 80% 10865 8483 11370 9152
6th 86% 87% 3857 3316 3895 3373
7th 86% 87% 3477 2978 3427 2990
8th 84% 88% 3402 2869 3448 3029
83%
78% 82%
80%
78%
86%
86%
84%
84%
79% 82%
81%
80% 87%
87%
88%
0%
10%
20%
30%
40%
50%
60%
70%
80%
90%
100%
1st 2nd 3rd 4th 5th 6th 7th 8th
Pe
rce
nt
in H
FZ
Grade
Female Male
2010 NC IsPOD Evaluation Conducte4d by NCAAHPERD/NC DPH
All rights reserved.
10
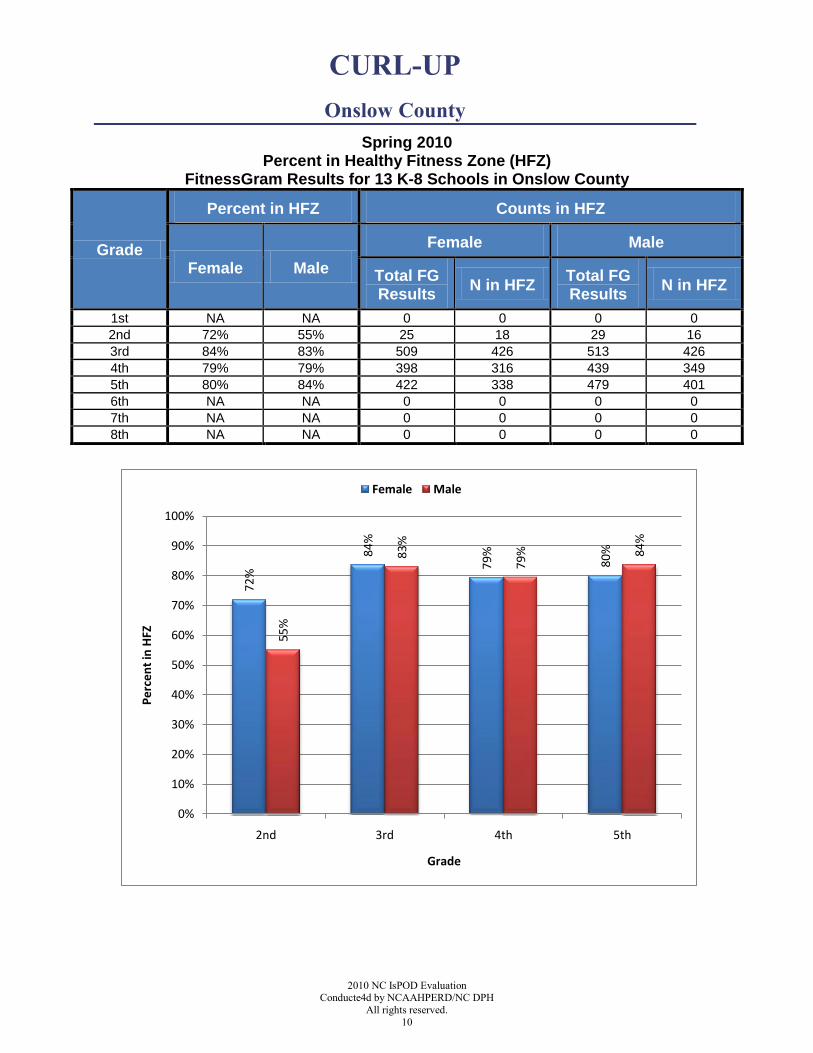
CURL-UP
Onslow County
Spring 2010 Percent in Healthy Fitness Zone (HFZ)
FitnessGram Results for 13 K-8 Schools in Onslow County
Grade
Percent in HFZ Counts in HFZ
Female Male
Female Male
Total FG Results
N in HFZ Total FG Results
N in HFZ
1st NA NA 0 0 0 0
2nd 72% 55% 25 18 29 16
3rd 84% 83% 509 426 513 426
4th 79% 79% 398 316 439 349
5th 80% 84% 422 338 479 401
6th NA NA 0 0 0 0
7th NA NA 0 0 0 0
8th NA NA 0 0 0 0
72%
84%
79%
80%
55%
83%
79% 84%
0%
10%
20%
30%
40%
50%
60%
70%
80%
90%
100%
2nd 3rd 4th 5th
Pe
rce
nt
in H
FZ
Grade
Female Male

2010 NC IsPOD Evaluation Conducted by NCAAHPERD/NC DPH
All rights reserved.
11
PUSH-UP
North Carolina
Spring 2010 Percent in Healthy Fitness Zone (HFZ)
FitnessGram Results for 370 NC K-8 Schools in 61 NC Counties
Grade
Percent in HFZ Counts in HFZ
Female Male
Female Male
Total FG Results
N in HFZ Total FG Results
N in HFZ
1st 50% 63% 627 314 592 372
2nd 48% 62% 935 451 924 573
3rd 56% 70% 9157 5163 9527 6638
4th 52% 68% 9129 4713 9510 6475
5th 52% 66% 8900 4642 9309 6117
6th 68% 72% 3092 2093 3165 2272
7th 69% 72% 2768 1912 2742 1984
8th 68% 70% 2696 1830 2811 1965
50%
48%
56%
52%
52%
68%
69%
68%
63%
62%
70%
68%
66% 72%
72%
70%
0%
10%
20%
30%
40%
50%
60%
70%
80%
90%
100%
1st 2nd 3rd 4th 5th 6th 7th 8th
Pe
rce
nt
in H
FZ
Grade
Female Male

2010 NC IsPOD Evaluation Conducte4d by NCAAHPERD/NC DPH
All rights reserved.
12
PUSH-UP
Onslow County
Spring 2010 Percent in Healthy Fitness Zone (HFZ)
FitnessGram Results for 13 K-8 Schools in Onslow County
Grade
Percent in HFZ Counts in HFZ
Female Male
Female Male
Total FG Results
N in HFZ Total FG Results
N in HFZ
1st NA NA 0 0 0 0
2nd 21% 52% 24 5 29 15
3rd 46% 61% 178 81 187 115
4th 43% 62% 130 56 156 97
5th 50% 63% 157 78 167 105
6th NA NA 0 0 0 0
7th NA NA 0 0 0 0
8th NA NA 0 0 0 0
21%
46%
43% 50%
52%
61%
62%
63%
0%
10%
20%
30%
40%
50%
60%
70%
80%
90%
100%
2nd 3rd 4th 5th
Pe
rce
nt
in H
FZ
Grade
Female Male
2010 NC IsPOD Evaluation Conducted by NCAAHPERD/NC DPH
All rights reserved.
13
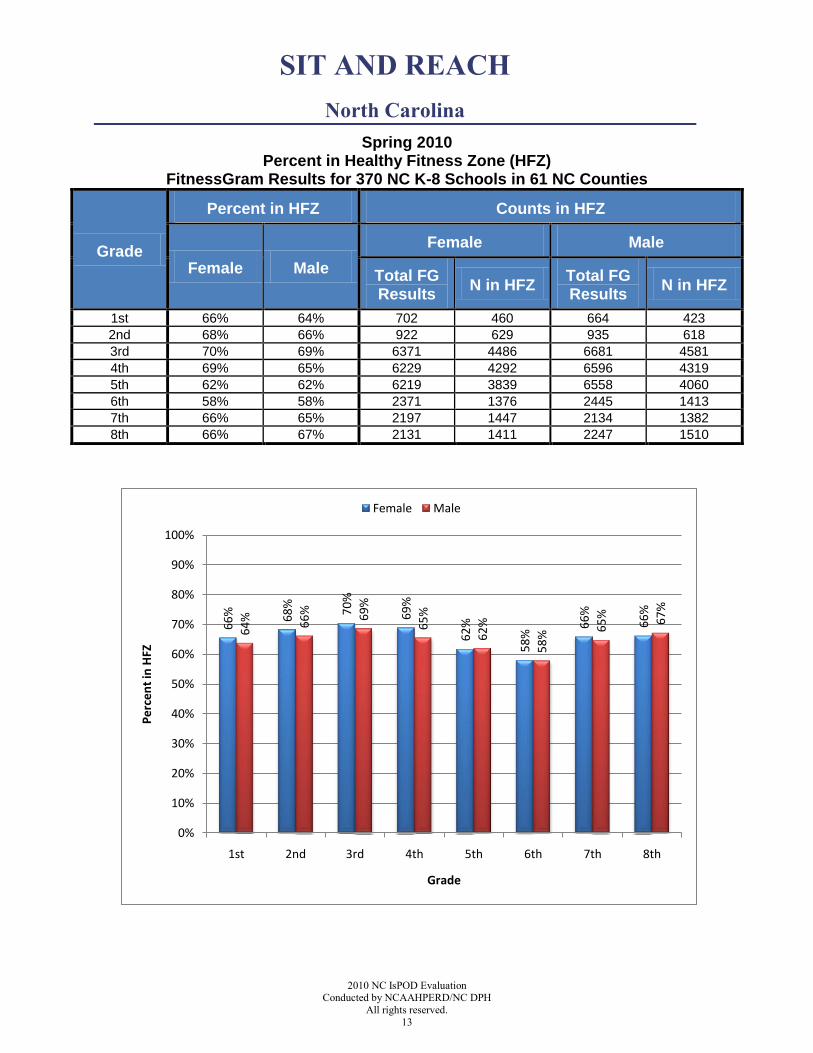
SIT AND REACH
North Carolina
Spring 2010 Percent in Healthy Fitness Zone (HFZ)
FitnessGram Results for 370 NC K-8 Schools in 61 NC Counties
Grade
Percent in HFZ Counts in HFZ
Female Male
Female Male
Total FG Results
N in HFZ Total FG Results
N in HFZ
1st 66% 64% 702 460 664 423
2nd 68% 66% 922 629 935 618
3rd 70% 69% 6371 4486 6681 4581
4th 69% 65% 6229 4292 6596 4319
5th 62% 62% 6219 3839 6558 4060
6th 58% 58% 2371 1376 2445 1413
7th 66% 65% 2197 1447 2134 1382
8th 66% 67% 2131 1411 2247 1510
66% 68%
70%
69%
62%
58%
66%
66%
64% 66% 69%
65%
62%
58%
65% 67%
0%
10%
20%
30%
40%
50%
60%
70%
80%
90%
100%
1st 2nd 3rd 4th 5th 6th 7th 8th
Pe
rce
nt
in H
FZ
Grade
Female Male

2010 NC IsPOD Evaluation Conducte4d by NCAAHPERD/NC DPH
All rights reserved.
14
SIT AND REACH
Onslow County
Spring 2010 Percent in Healthy Fitness Zone (HFZ)
FitnessGram Results for 13 K-8 Schools in Onslow County
Grade
Percent in HFZ Counts in HFZ
Female Male
Female Male
Total FG Results
N in HFZ Total FG Results
N in HFZ
1st NA NA 0 0 0 0
2nd 80% 72% 25 20 29 21
3rd 64% 59% 442 282 440 261
4th 59% 55% 396 233 439 242
5th 51% 49% 434 220 480 234
6th NA NA 0 0 0 0
7th NA NA 0 0 0 0
8th NA NA 0 0 0 0
80%
64%
59%
51%
72%
59%
55%
49%
0%
10%
20%
30%
40%
50%
60%
70%
80%
90%
100%
2nd 3rd 4th 5th
Pe
rce
nt
in H
FZ
Grade
Female Male

2010 NC IsPOD Evaluation Conducted by NCAAHPERD/NC DPH
All rights reserved.
15
TRUNK LIFT
North Carolina
Spring 2010 Percent in Healthy Fitness Zone (HFZ)
FitnessGram Results for 370 NC K-8 Schools in 61 NC Counties
Grade
Percent in HFZ Counts in HFZ
Female Male
Female Male
Total FG Results
N in HFZ Total FG Results
N in HFZ
1st 91% 88% 744 680 746 659
2nd 91% 92% 1063 963 1056 971
3rd 93% 91% 10281 9572 10608 9648
4th 84% 80% 10205 8587 10688 8573
5th 81% 77% 9821 7973 10336 8001
6th 83% 79% 3438 2859 3361 2646
7th 82% 77% 3231 2656 3086 2364
8th 84% 79% 3136 2631 3161 2492
91%
91% 93%
84%
81%
83%
82%
84%88% 92%
91%
80%
77%
79%
77%
79%
0%
10%
20%
30%
40%
50%
60%
70%
80%
90%
100%
1st 2nd 3rd 4th 5th 6th 7th 8th
Pe
rce
nt
in H
FZ
Grade
Female Male

2010 NC IsPOD Evaluation Conducte4d by NCAAHPERD/NC DPH
All rights reserved.
16
TRUNK LIFT
Onslow County
Spring 2010 Percent in Healthy Fitness Zone (HFZ)
FitnessGram Results for 13 K-8 School in Onslow County
Grade
Percent in HFZ Counts in HFZ
Female Male
Female Male
Total FG Results
N in HFZ Total FG Results
N in HFZ
1st NA NA 0 0 0 0
2nd 88% 86% 24 21 29 25
3rd 94% 87% 155 145 151 131
4th 88% 77% 138 122 163 126
5th 79% 70% 154 122 181 126
6th NA NA 0 0 0 0
7th NA NA 0 0 0 0
8th NA NA 0 0 0 0
88% 94%
88%
79%
86%
87%
77%
70%
0%
10%
20%
30%
40%
50%
60%
70%
80%
90%
100%
2nd 3rd 4th 5th
Pe
rce
nt
in H
FZ
Grade
Female Male