ishwar k. puri dean and professor - nc state university14/ishwar_puri-global...8.2%), capital goods...
TRANSCRIPT

An introductionIshwar K. Puri!
Dean and Professor

First, !Canada and USA

Canada USA
Exports Partners
Canada!$462.9B
motor vehicles and parts, industrial machinery, aircraft, telecommunications equipment; chemicals, plastics, fertilizers; wood pulp, timber, crude petroleum, natural gas, electricity, aluminum
USA 74.5%, China 4.3%, UK 4.1% (2012)
USA!$1,561B
agricultural products 4.9%, industrial supplies 32.9% (crude oil 8.2%), capital goods 30.4% (computers, telecommunications equipment, motor vehicle parts, office machines, electric power machinery), consumer goods 31.8% (automobiles, clothing, medicines, furniture, toys)
China 19%, Canada 14.1%, Mexico 12%, Japan 6.4%, Germany 4.7%
CIA Factbook

Business Higher Ed Federal Provincial Non-Profit
In 2011, Canada’s gross domestic expenditure on research and development was $30.7B
Where it was spent
$11.6B
$16B
$2.6B $332M
$127M
http://www.statcan.gc.ca/pub/88-221-x/88-221-x2013001-eng.pdf
$65.1B in !U.S. Higher Ed!(NSF)

In 2011, the U.S. higher education expenditure on research and development was $65.1B

Business Higher Ed Federal Foreign All other
In 2011, Canada’s gross domestic expenditure on research and development was $30.7B
Where it came from
$6.1B
$14.7B
$5.3B
$1.8B$2.8B
http://www.statcan.gc.ca/pub/88-221-x/88-221-x2013001-eng.pdf
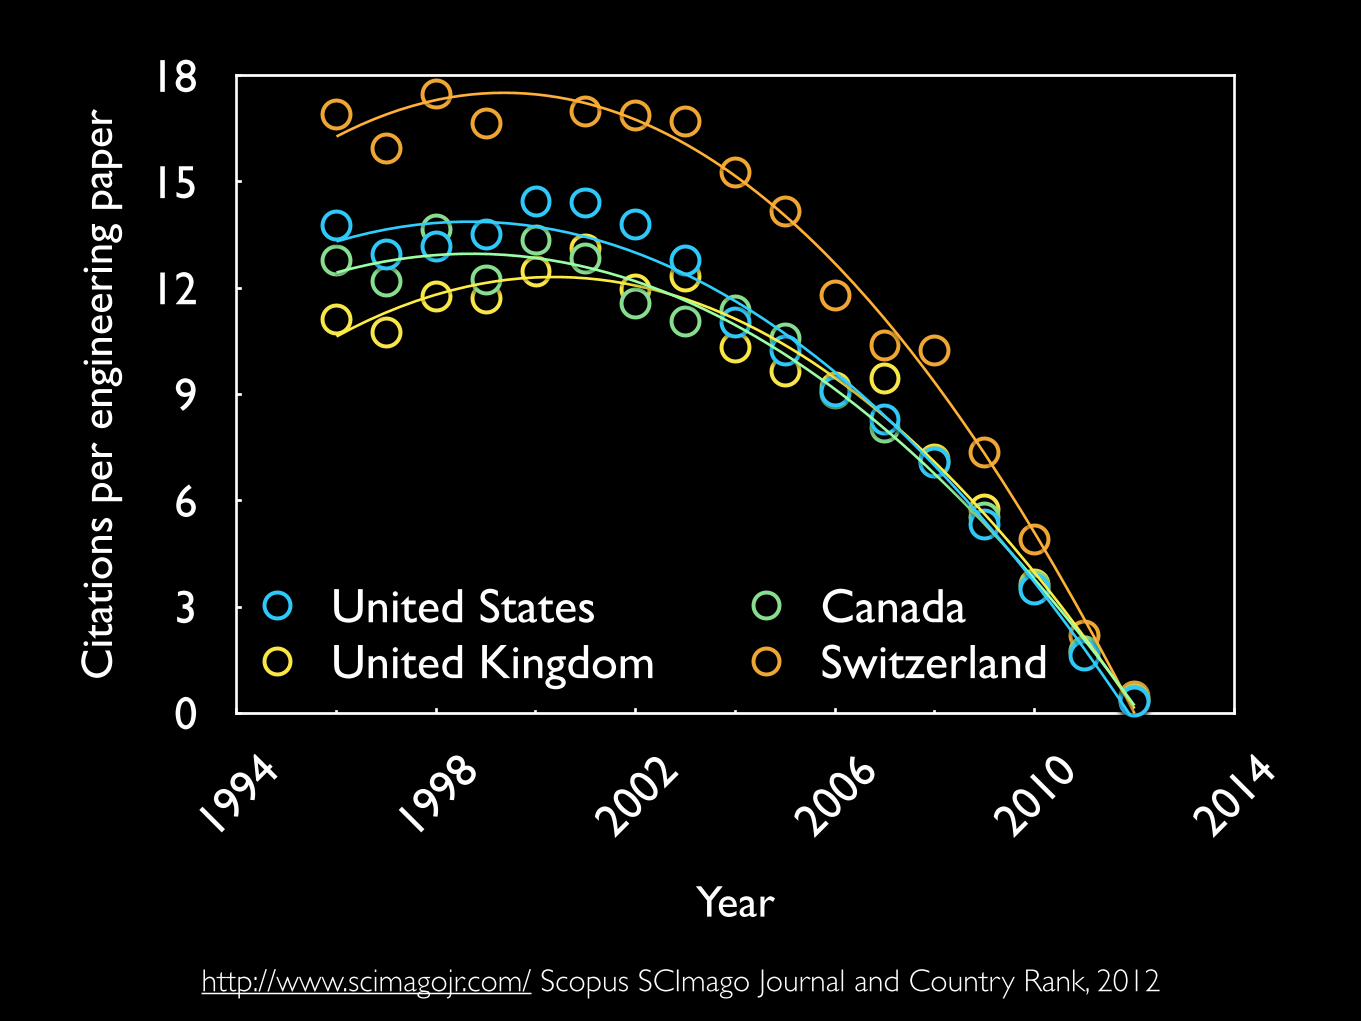
Cita
tions
per
eng
inee
ring
pap
er
0
3
6
9
12
15
18
Year
1994
1998
2002
2006
2010
2014
United States CanadaUnited Kingdom Switzerland
http://www.scimagojr.com/ Scopus SCImago Journal and Country Rank, 2012

(Cite
s -S
elf C
ites)
per
eng
inee
ring
pa
per
0
3
6
9
12
15
18
Year
1994
1998
2002
2006
2010
2014
United States CanadaUnited Kingdom Switzerland
http://www.scimagojr.com/ Scopus SCImago Journal and Country Rank, 2012
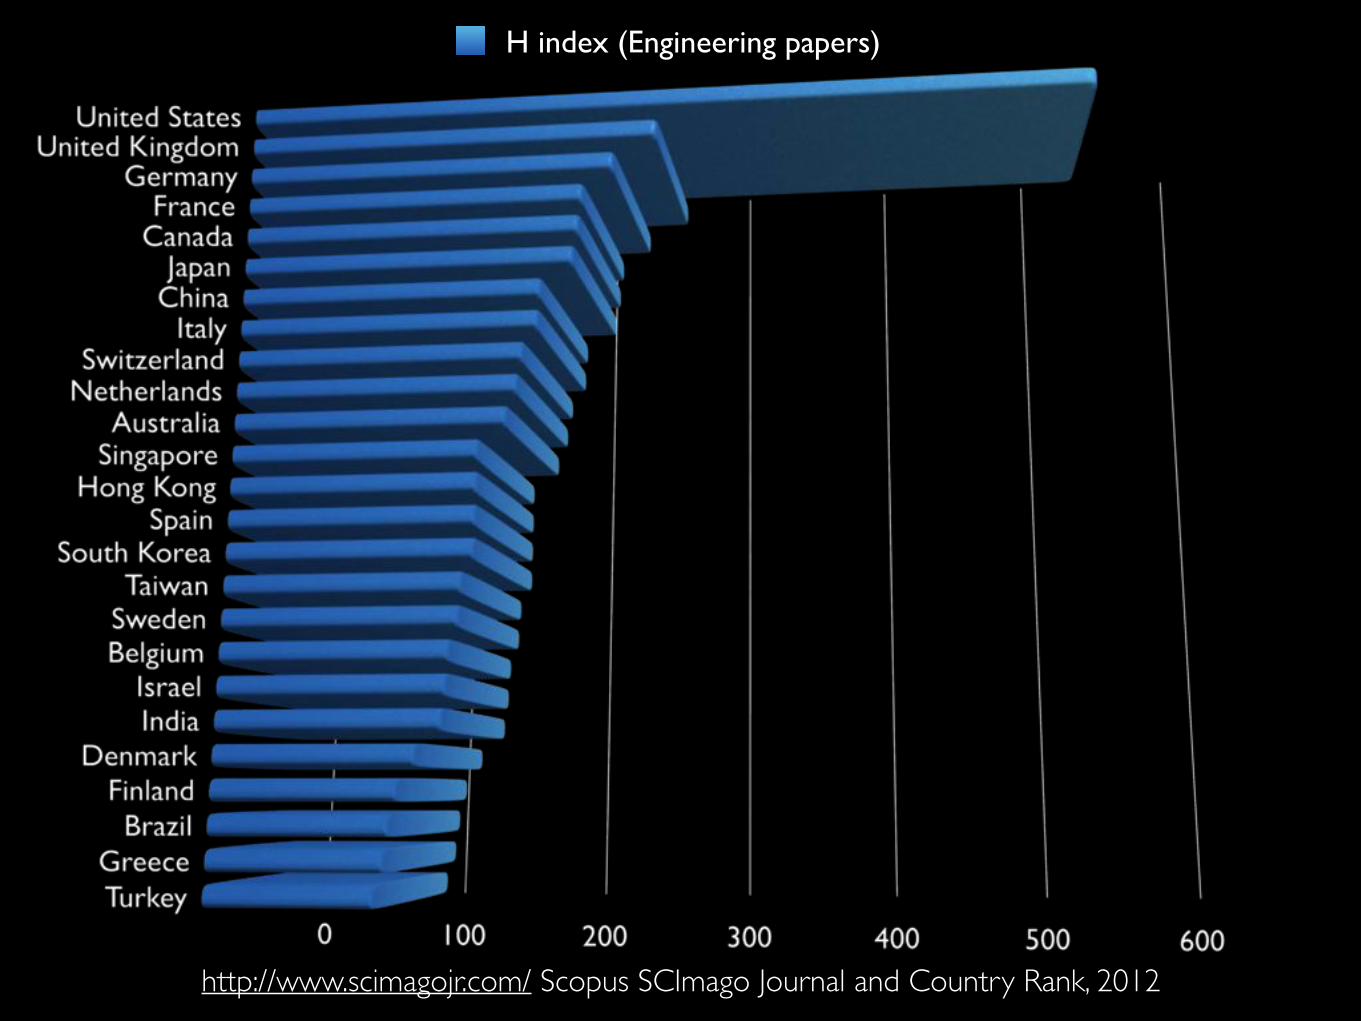
H index (Engineering papers)
http://www.scimagojr.com/ Scopus SCImago Journal and Country Rank, 2012

Population, MH index (Engineering papers)
http://www.scimagojr.com/ Scopus SCImago Journal and Country Rank, 2012


Student-centred, research-intensive

About McMaster• Established in 1887!
• 29,000+ undergraduate and graduate students (Fall 2012)!
• 1,300+ full-time faculty!
• Six Faculties – health sciences, engineering, business, humanities, science, social sciences!
• 40 undergraduate degree programs!
• Students & faculty from 80+ countries!
• 147,000 alumni in over 140 countries

Some Highlights• Times Higher Education World University
Rankings 2012: 1st in Canada and 14th in the world for clinical and health!
• Ranked 92nd in 2012 Shanghai Jiao Tong Ranking of World Universities – one of four Canadian universities in Top 100!
• Ranked 6th among Canada’s top research universities with research income of $325M (2012)!
• Ranked 2nd in Canada in research intensity, attracting $250,000 (direct) per faculty FTE!
• Only Canadian host site of a United Nations University (1 of only 2 in North America)

Education and Employability

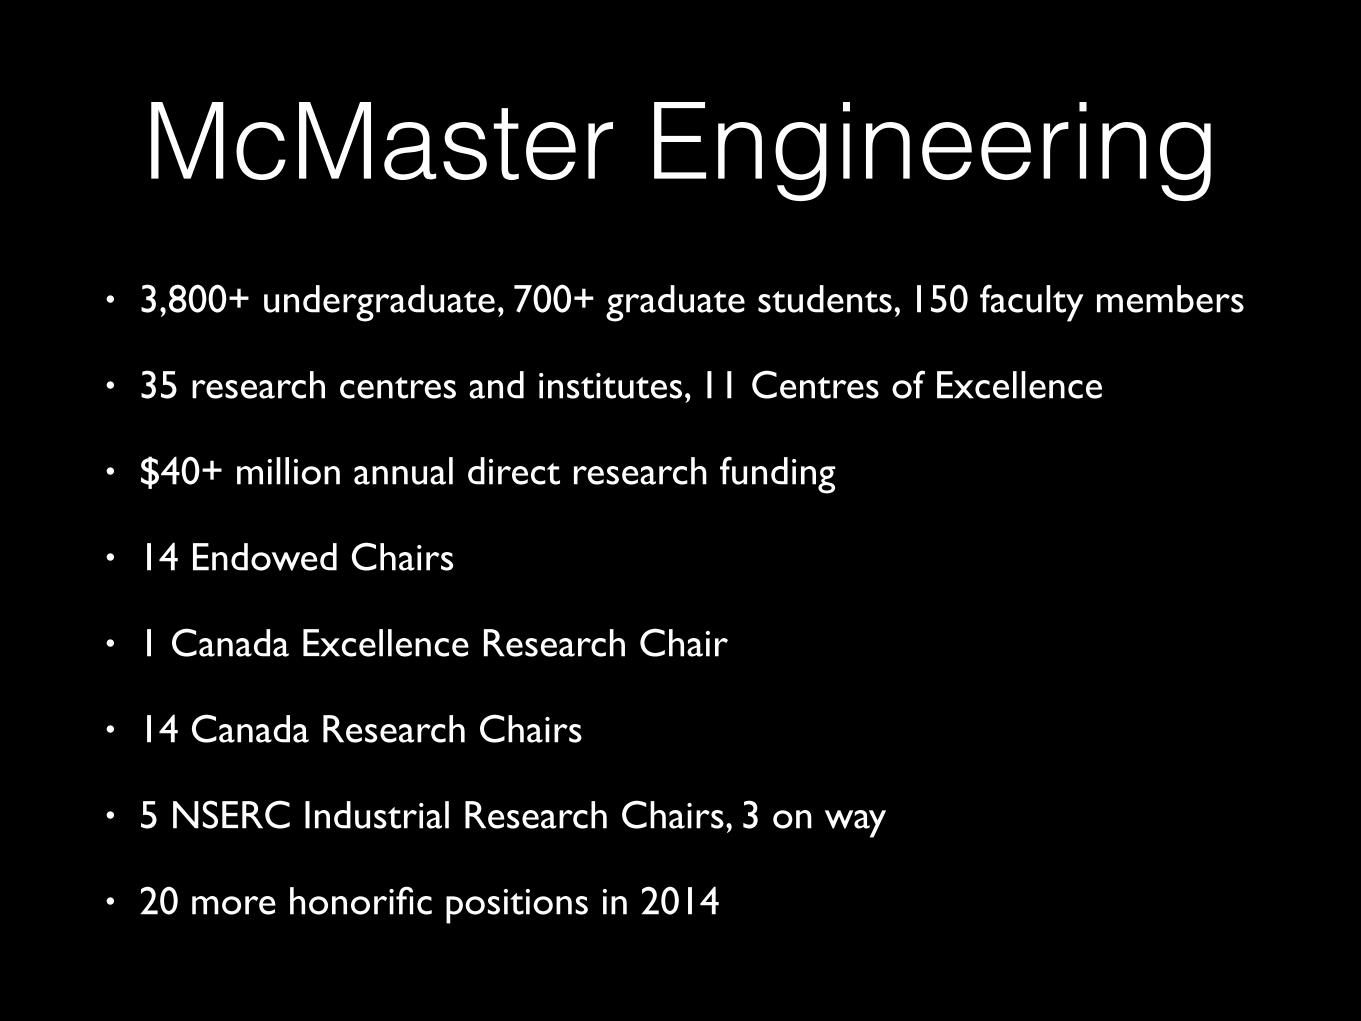
McMaster Engineering• 3,800+ undergraduate, 700+ graduate students, 150 faculty members!
• 35 research centres and institutes, 11 Centres of Excellence!
• $40+ million annual direct research funding!
• 14 Endowed Chairs!
• 1 Canada Excellence Research Chair!
• 14 Canada Research Chairs!
• 5 NSERC Industrial Research Chairs, 3 on way!
• 20 more honorific positions in 2014

Undergraduate Education
Leading-Edge Programs:! Engineering and Management!
Engineering and Society! Chemical & Bioengineering !
Biomedical Engineering! Environmental!
Nanotechnology! Nuclear Engineering!
Photonics! Software Engineering &
Game Design! Mechatronics
Departments:! Chemical!
Civil! Computing & Software ! Electrical & Computer !
Engineering Physics ! Materials!
Mechanical
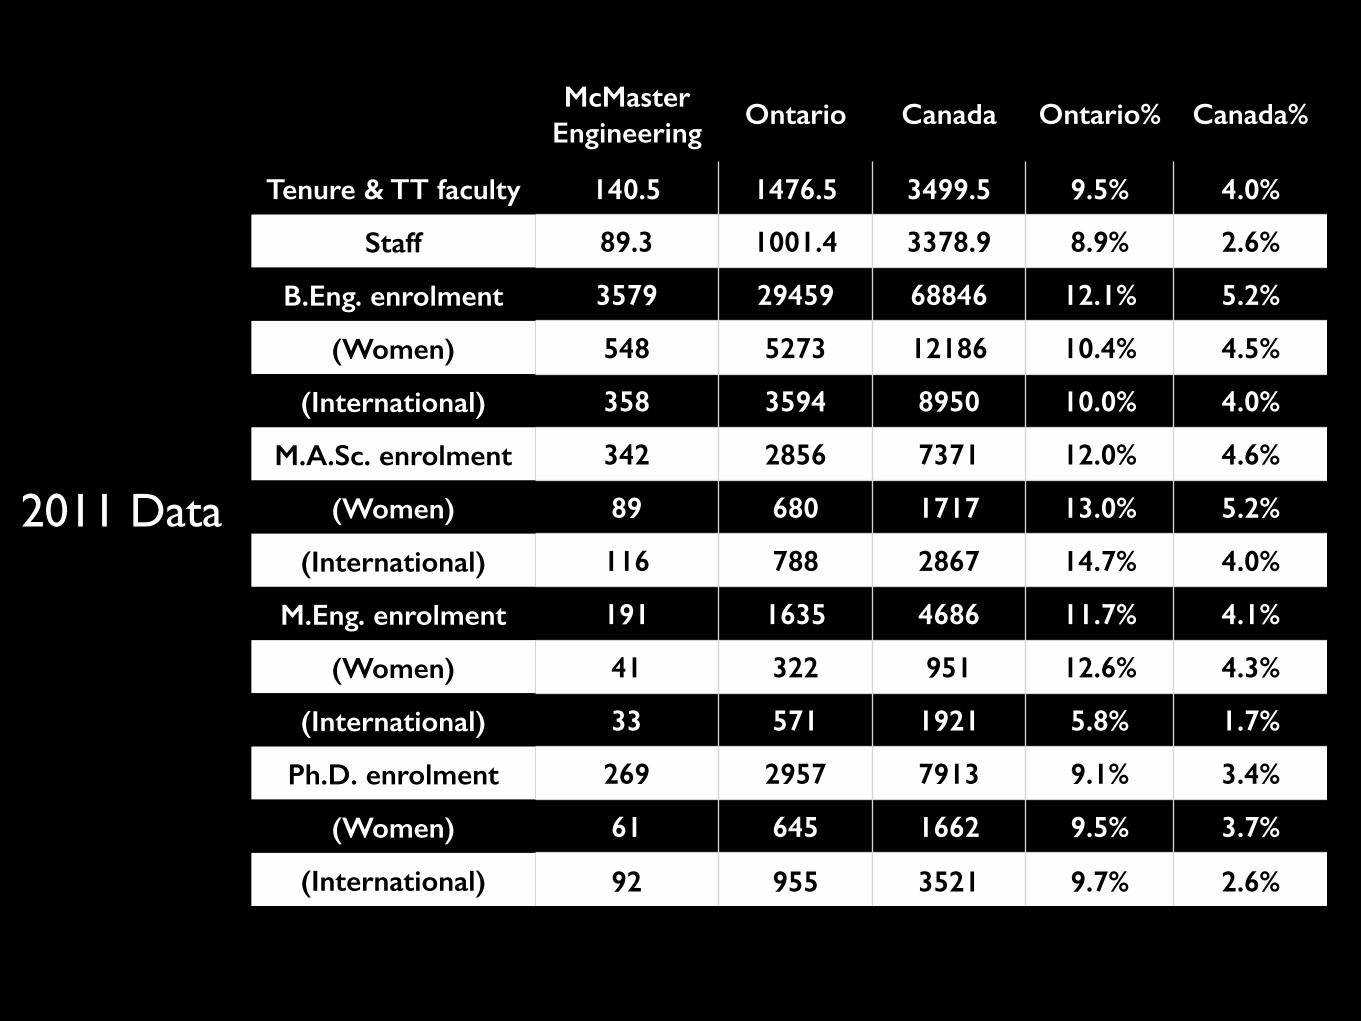
McMaster Engineering
Ontario Canada Ontario% Canada%
Tenure & TT faculty 140.5 1476.5 3499.5 9.5% 4.0%
Staff 89.3 1001.4 3378.9 8.9% 2.6%
B.Eng. enrolment 3579 29459 68846 12.1% 5.2%
(Women) 548 5273 12186 10.4% 4.5%
(International) 358 3594 8950 10.0% 4.0%
M.A.Sc. enrolment 342 2856 7371 12.0% 4.6%
(Women) 89 680 1717 13.0% 5.2%
(International) 116 788 2867 14.7% 4.0%
M.Eng. enrolment 191 1635 4686 11.7% 4.1%
(Women) 41 322 951 12.6% 4.3%
(International) 33 571 1921 5.8% 1.7%
Ph.D. enrolment 269 2957 7913 9.1% 3.4%
(Women) 61 645 1662 9.5% 3.7%
(International) 92 955 3521 9.7% 2.6%
2011 Data

One of every 25 engineering students in Canada was at McMaster, as was one of 10 in Ontario
McMaster Engineering
Ontario Canada Ontario% Canada%
Tenure & TT faculty 140.5 1476.5 3499.5 9.5% 4.0%
Staff 89.3 1001.4 3378.9 8.9% 2.6%
B.Eng. enrolment 3579 29459 68846 12.1% 5.2%
(Women) 548 5273 12186 10.4% 4.5%
(International) 358 3594 8950 10.0% 4.0%
M.A.Sc. enrolment 342 2856 7371 12.0% 4.6%
(Women) 89 680 1717 13.0% 5.2%
(International) 116 788 2867 14.7% 4.0%
M.Eng. enrolment 191 1635 4686 11.7% 4.1%
(Women) 41 322 951 12.6% 4.3%
(International) 33 571 1921 5.8% 1.7%
Ph.D. enrolment 269 2957 7913 9.1% 3.4%
(Women) 61 645 1662 9.5% 3.7%
(International) 92 955 3521 9.7% 2.6%
2011 Data

McMaster Engineering Ontario Canada Ontario% Canada%
Tenure & TT faculty 140.5 1476.5 3499.5 9.5% 4.0%
Staff 89.3 1001.4 3378.9 8.9% 2.6%
B.Eng. degrees 582 4957 11389 11.7% 5.1%
(Women) 98 853 2061 11.5% 4.7%
(International) 62 387 979 16.1% 6.4%
Master's degrees 250 2173 4384 11.5% 5.7%
(Women) 48 474 982 10.1% 4.9%
(International) 73 578 1587 12.6% 4.6%
Ph.D. degrees 52 463 989 11.2% 5.3%
(Women) 16 100 201 16.0% 8.0%
(International) 10 73 202 13.6% 4.9%
One of every twelve engineering doctoral degrees awarded to women in Canada was from McMaster, as was one out of six in Ontario
2011 Data

2007/082008/092009/102010/112011/12
Federal CFI Provincial Industry

THE Rank
Faculty strength Bachelor’s Ph.D. Master’s 1st Year Applicants Offers Funds
McMaster University 92 151 670 57 217 1117 6712 3570 $41,847,416
University of Arizona 103 176 465 78 186 670 1823 1469 $63,366,317
University of California, Irvine 93 186 770 112 261 901 $84,954,000
University of Colorado, Boulder 97 163 636 86 498 778 4670 2575 $77,557,224
University of Pittsburgh 78 135 517 56 194 529 3815 2211 $86,658,000
University of Rochester 95 85 194 41 101 1237 14987 5370 $92,946,000
University of Virginia 112 86 302 53 89 329 5374 912 $66,493,000
Vanderbilt University 88 127 550 84 130 615 4412 1557 $71,366,704
University of Toronto 20 219 931 109 410 931 9326 3309 $70,300,000
University of British Columbia 31 193 836 74 312 1289 6644 2121 $36,912,000
McGill University 35 135 505 62 136 713 7648 2865
University of Waterloo 226-250 254 990 115 415 1001 4864
A North American engineering peer analysis, 2012 data

THE Rank Bachelor/FTE Ph.D./FTE Master’s/
FTE Selectivity Research $/FTE
McMaster University 92 4.44 0.38 1.44 53% $277,135
University of Arizona 103 2.64 0.44 1.06 81% $360,036
University of California, Irvine 93 4.14 0.60 1.40 $456,742
University of Colorado, Boulder
97 3.90 0.53 3.06 55% $475,811
University of Pittsburgh 78 3.83 0.41 1.44 58% $641,911
University of Rochester 95 2.28 0.48 1.19 36% $1,093,482
University of Virginia 112 3.51 0.62 1.03 17% $773,174
Vanderbilt University 88 4.33 0.66 1.02 35% $561,943
University of Toronto 20 4.25 0.50 1.87 35% $321,005
University of British Columbia 31 4.33 0.38 1.62 32% $191,254
McGill University 35 3.74 0.46 1.01 37%
University of Waterloo 226-250 3.90 0.45 1.63
A North American engineering peer analysis by intensity

McMaster University has a rich history of
industrially relevant engineering research


World-class facilities


Thank you!Ishwar K. Puri!
Dean and Professor
