isbn: 978-1-84170-636-8 - teagasc...• design and layout of cow roadways. (see section 3.2:...
TRANSCRIPT

ISBN: 978-1-84170-636-8
Help for what matters
Help in achieving growth for your farmGet in touch with your local Agri Business Development Manager. Email [email protected]
Ulster Bank Ireland DAC. A private company limited by shares, trading as Ulster Bank, Ulster Bank Group, Banc Uladh and Lombard. Registered in the Republic of Ireland. Registered No. 25766 Registered Office: Ulster Bank Group Centre, George’s Quay, Dublin 2, DO2 VR98. Ulster Bank Ireland DAC is regulated by the Central Bank of Ireland.
Help for what matters
Help for the hands that work with the soilGet in touch with your local Agri Business Development Manager. Email [email protected]
Ulster Bank Ireland DAC. A private company limited by shares, trading as Ulster Bank, Ulster Bank Group, Banc Uladh and Lombard. Registered in the Republic of Ireland. Registered No. 25766 Registered Office: Ulster Bank Group Centre, George’s Quay, Dublin 2, DO2 VR98. Ulster Bank Ireland DAC is regulated by the Central Bank of Ireland.

Page 3
Dairy Farm InfrastructureHandbook
July, 2017
Teagasc,Animal & Grassland Research and Innovation Centre, Moorepark,
Fermoy, Co. Cork
www.teagasc.ie
Compiled by:Pat Tuohy, John Upton, Bernie O’Brien,
Pat Dillon (Teagasc Moorepark), Tom Ryan (Teagasc Kildalton)and Daire Ó hUallacháín (Teagasc Johnstown Castle)

Moorepark | Dairy farm infrastructure hanDbook
Page 4
Sponsor Welcome 5
1. Introduction 6
2. Farm layout, planning and costs 7
3. Grazing infrastructure 93.1 Paddock layout 93.2 Roadways 123.3 Fencing 193.4 Water system 22
4. Milking facilities 304.1 Planning a milking parlour 304.2 Milking equipment 314.3 Deciphering automation: key terms 314.4 Design of milking facilities 34
4.4.1 Access roadway 344.4.2 Collecting yard 354.4.3 Backing gates 364.4.4 Dairy entrance design 364.4.5 Drafting systems 374.4.6 Milking machine maintenance checklist 384.4.7 Milking machine costs 38
4.5 Milking system 394.5.1 Herringbone/side x side milking systems 394.5.2 Rotary milking systems 394.5.3 Automatic milking systems 40
4.6 Milking efficiency 404.7 Milking management 42
4.7.1 Effect of changing milking interval (from 16:8 to 12:12) on milk production, composition and quality 42
4.7.2 Effect of milking frequency on milk production 42
5. Milk cooling 465.1 Milk pumps 485.2 Bulk tank size 48
6. Energy and water use efficiency on dairy farms 496.1 Dairy Energy Costs 496.2 Calculate your energy costs 50
6.2.1 Water heating 506.2.2 Heat recovery 516.2.3 Dairy lighting 526.2.4 Vacuum pumps 52
6.3 Water use on dairy farms 536.4 Strategies to reduce energy use in milking facilities 536.5 Milking parlour power requirements 55
7. Land drainage design and installation 577.1 Causes of impeded drainage 587.2 Drainage investigations 587.3 Indicative costs 62
8. Importance of biodiversity on dairy farms 648.1 Measures to enhance biodiversity on dairy farms 648.2 GLAS measures 65

Page 5
Sponsor WelcomePat HorganHead of Ulster Bank SME Banking – South, Midlands & West
Ulster Bank is proud to be the key partner for the Dairy Farm Infrastructure Handbook. It highlights the key on-farm efficiencies needed by Irish dairy producers as they seek to compete successfully on a global stage.
At Ulster Bank we are passionate about helping farmers make Agri Business a success. We recognise the importance of agriculture to the economic and social fabric of the country. It is a core part of our business. At Ulster Bank, we have skilled managers who understand farming and the agri-food sector and are committed to supporting both individuals and enterprises from farmyards to boardrooms in a focused, structured and strategic manner. We take a long term view of agricultural lending recognising the inherent volatility in farming and the efficiencies required to prosper. This handbook is designed to be used as a guide for dairy farmers who wish to upgrade their existing dairy farm infrastructure or invest in the establishment of a new dairy farm enterprise. It covers important areas such as grazing infrastructure, milking facilities, milk cooling, water and energy efficiency, land drainage design and installation plus the importance of incorporating biodiversity.
The increased volatility evident in the agriculture sector due to weather, price or unexpected individual on-farm challenges is a reality that the sector must learn to manage. Farmers must continue to improve on-farm efficiencies and competitiveness to survive the income cycles. The production and utilisation of grass on livestock farms drives efficiency. Furthermore, farmers should analyse their costs of production, compare them to those of their peers and adopt best technologies, particularly investments in grazing infrastructure, drainage, reseeding and soil fertility. Ulster Bank believes all farmers need to continue to develop a broad range of skills. Greater understanding of technical efficiency, people management and business skills are required to successfully develop farming operations in this increasingly uncertain environment.
Whether you are looking to grow your dairy business or just starting out, talk to Ulster Bank about our practical solutions to help.

Moorepark | Dairy farm infrastructure hanDbook
Page 6
1. IntroductionThe guiding principal of good dairy farm infrastructure is that it’s safe, produces quality milk from healthy animals using management practices that are sustainable from an animal welfare, labour efficient, economic and environmental perspective. This handbook is designed to be used as a guide for dairy farmers who wish to upgrade their existing dairy farm infrastructure or invest in the establishment of a new dairy farm enterprise. The handbook covers important areas such as grazing infrastructure, milking facilities, milk cooling, water and energy efficiency, land drainage design and installation plus the importance of incorporating biodiversity. Grazing infrastructure in relation to roadways, paddock layout and water systems will be important in terms of overall herd performance as it can allow more days at grass and therefore greater profitability. A key measure of labour productivity on dairy farms is cows milked per person milking per hour; therefore the correct design and size of the milking facilities will be critical. Refrigeration of milk is important as it inhibits bacterial spoilage; likewise since it accounts for the largest component of electricity use on dairy farms, reducing its costs using the most appropriate pre-cooling processes will be important. The section on land drainage design and installation highlights the importance of carrying out a site and soil test pit investigation prior to installing a drainage system. Finally, biodiversity management is important because it provides both productivity benefits on farm and social and environmental outcomes for the wider community.
In this publication sometimes there are references to commercial suppliers and to products of particular manufactures. By such reference, it is not intended to indicate that these are the only products, suppliers and materials available; such references are for demonstration purposes only. It is strongly recommended that dairy farmers consult with their advisory officers before using the information provided.

Page 7
2. Farm layout, planning and costsIn grazing systems cows are required to walk to the milking parlour and back twice daily to wherever they are grazing. In addition, cows may also need to be moved between paddocks when grazing is completed. This occurs in all weather conditions and can be either during the day or night. Longer walks reduce animal production and require additional labour. Consequently, a lot of thought needs to be invested in deciding where to site the farmyard on the farm, how to subdivide the farm into a paddock system and what the optimum layout of roadways should be to make animal movement most efficient. The four key issues to consider are:
• Distance that cows are required to walk.
• Design and layout of cow roadways. (See section 3.2: Roadways, page 12).
• Access to the milking parlour for milk tankers and other large vehicles separate from cow roadways.
• Farm security and animal disease biosecurity.
Large vehicle access onto a farm must meet local planning requirements as well as providing easy traffic flow, however they are secondary to the cow requirements which have the potential to allow far bigger efficiency and cost gains by minimizing walking distance.
Key issues to consider in the siting of a new dairy unit
• Milking parlour and other farmyard facilities need to be sited near to the centre of the farm (considering current and future needs). When a suitable site is identified then a farm roadway system can be designed to this point. This will be required to reduce roadway construction costs and increases the milking efficiency.
• Locating the dairy unit away from public roads make it easier to control security and prevent unauthorized access to restricted areas such as calf rearing sheds, etc.
• The farmyard should be free of obstructions and allow space for possible future expansion of milking parlour, wintering facilities and slurry storage facilities.
• Milk tankers and other large service transport should have a separate access to the dairy unit, should not cross cow roadway system for stock movement with plenty of space for vehicle movement.
• If a lagoon is used to store slurry and wash water then ideally the milking parlour, silage slab and wintering facilities should be sited where the land slope is suitable and favours easy drainage to the lagoon.
• A guideline of the costs of various items in relation to building a new dairy unit is shown on Table 1.

Moorepark | Dairy farm infrastructure hanDbook
Page 8
Table 1. Guideline building costs
Items Units used Cost per item (€)Building milking parlour (shed, yard) per unit 4,000 – 5,000
Milking machine per unit 2,000 – 8,000
Bulk tank per litre 1.70 – 2.50
Cubicle shed + slatted tank per cow 1,000 + 500
Topless cubicle and lined lagoon per cow 400 + 300
Silage slab per cow 250 -550
Specific building items
Roof per m2 50
Slatted tank (18 wk. storage for 100 cows) per m3 90
Stanchion bases each 25
Cubicles and cubicle beds each 190
Concrete floors per m2 22
External walls per linear metre 140
Feeding barriers per bay 180
Automatic scrapers per passage 2800
Electrical work per bay 250
Cubicle Mats each 45

Page 9
3. Grazing infrastructure
3.1 Paddock layoutProper subdivision of grazing land into paddocks is essential to be able to successfully manage pastures and achieve desirable rotation intervals. Paddocks must be connected with an efficient roadway system so that herd can move from one paddock to any other paddock on the farm. An accurate map of the farm is essential; preferably GPS.
The ideal paddock system should include:
• About 20 to 23 full sized paddocks and a few small paddocks near the parlour for sick cows etc.
• The roadways from the parlour/farmyard to the paddocks should be wide, smooth and as short a distance as is practical.
• The paddocks should be big enough so that there is sufficient pasture for the full herd for 24 hours when the pre-grazing cover does not exceed 1300-1500 kg DM per ha and on a 21 day grazing rotation.
• Paddocks to be rectangle to square in shape and wetter paddocks should have longest sides running adjacent to the roadways to avoid poaching in wet weather.
• Alter paddock shape to facilitate stock movement into and out of the paddock i.e. stock move down-hill to exit paddocks.
• Roadways to follow contours on steep ground and be wide with gentle sweeping bends.
• Locate roadways on the sunny windy side of a ditch, hedge or tree line.
• Avoid putting roadways directly through springs or swampy ground.
• Plan underpasses carefully to allow for gentle slopes into and out of the underpass and for drainage.
• Main paddock gateways to be angled to the roadway with at least two gateways for each paddock.
• Plan for multiple gateways from the roadway for paddocks on wet ground or for paddocks to be grazed by small mobs near the parlour.
• Have several gateways between adjacent paddocks.
• One wire (electrified) fences between paddocks with interconnecting gateways.
• Electrified fences divided into sections with easy to access cut-off switches.
• Number the paddocks with a tag on the gate and on a map of the farm.

Moorepark | Dairy farm infrastructure hanDbook
Page 10
Picture 1. Farm map prior to division into paddocks
Picture 2. Farm map after division into paddocks

Page 11
Creating paddocks
• Use farm maps to consider several different ways of laying out the farm and consider the positives and negatives of each one.
• Decide on the number of paddocks required; this will depend on whether the paddock will be used for one, two, three or four grazings.
• Determine most suitable road layout to service each paddock.
• Determine most appropriate water trough(s) position in each paddock.
• Allow for multiple entrances into each paddock.
• Ideally keep paddocks square/rectangular, ideally depth:width ratio should be 2:1.
• Chose the option which ticks the most positives and the least negatives.
• Mark the layout on the ground with marker pegs. Use different colours for roadway edges and paddock boundaries.
• Re-consider the layout both from the practicality of construction and operation and from the perspective of the cow. Does this actually make sense?
» Are the paddock entrances in dry ground?
» Are the paddock entrances in the down-hill corner of the paddock?
» Is the slope of the roadway less than 10%?
» Will the roadway disrupt normal flow of water down a slope?
• Re-align the markers on the ground to correct for the issues identified.
• Record the final layout on an accurate map and make lots of copies. Get a very large one made that is suitable to put on a wall at the milking parlour.
Paddock size
Long narrow paddocks results in too much walking over ground to graze the end of the paddocks creating an excessive risk of poaching. In excessively large paddocks grass re-growths are grazed if there are over three grazings per paddock. Using a strip wire to divide the paddock requires extra labour during the main grazing season. If paddocks are too small there will be insufficient grass for one grazing and a requirement for additional water troughs. The maximum depth of a paddock should be 250 metres (m) from the access roadway reducing to 100 m in wet areas more prone to poaching.
Calculate paddock size (April–June)
Step 1: Establish cow numbers (Plan for long term).
Step 2: Establish daily demand. e.g. 100 cows X 17kg DM= 1,700kg DM for 24 hours.
Step 3: Ideal pre-grazing yield is 1,400kg DM/ha in mid-season.
Step 4: To calculate paddock size, divide herd demand by ideal pre-grazing yield.
» Two grazing 1,700/1,400 = 1.2 ha for 100 cows in 24 hours.
» Three grazing 1,700 X 1.5 days/1,400 = 1.8ha for 100 cows in 36 hours.
The remaining area is normally closed for silage during this period. It could also be divided into similar paddocks.
Peak grass growing months April/May/June will normally determine paddock numbers. A number of commercial companies specialise in farm mapping. They use GPS to get

Moorepark | Dairy farm infrastructure hanDbook
Page 12
exact paddock sizes and will lay out paddock, water and road systems to meet individual requirements.
Table 2. Number of grazings per paddock in mid-seasonGrazing/ paddock
Pros Cons Recommendation
1 Good Grass utilisation
Regrowths not affected
Better in wet weather
Easy to identify surplus/ deficit of grass
Cows could be underfed
Heifers tend to suffer
More water troughs required
Least Recommended
2-3 Regrowths protected
Cows less restricted
Easier machinery access
More difficult to manage in first and last rotation
Most Recommended
4+ Fewer water troughs required
Fewer paddocks required
Allows for future expansion
Regrowths affected
More difficult to graze out
Harder to get cows out of larger paddocks
Project management
• If the conversion involves re-seeding, it is recommended that the cultivation and re-seeding are done before putting in water reticulation, paddock fencing and constructing roadways.
• Department rules require that where existing ditches are to be removed, new hedgerows have to be created before the old ditches are removed.
• Accurately detail all the work that is to be done, (widths, distances, design) and get several quotes.
• Select the contractor/ supplier on the basis of price, quality of work, and reputation for getting the work done on time.
3.2 RoadwaysThe milking process really starts when the cows leave the paddock. A well-designed, carefully built and properly maintained farm roadway system has many benefits, including, less lameness, less mastitis and better general animal health, faster and easier stock movement, cleaner cows and milk, less roadway maintenance and more efficient paddock access.
Assessing roadway condition
Take a quick look at the condition of your farm roadways for defects that may be causing problems. These defects can include, potholes, a roadway that is level or almost level with adjacent fields, wheel track depressions, a raised hump of soil under the fence at either side and cow tracks made between the fence and the roadway or on the roadway.
Problems are caused by; pebbles and loose stones on the surface, a bumpy surface with secure stones, lodged/trapped water on the surface, very dirty section near the farmyard,

Page 13
and a roadway level with or lower than the field. The reasons for these defects are many but may be due to flawed construction methods, unsuitable materials and lack of maintenance. The appearance of the roadway now bears little resemblance to what it looked like when it was initially constructed.
Picture 3. Farm roadway with some loose surface stones - not suitable for cow traffic
Picture 4. Water trapped on the roadway lodges at low points. The photograph shows the most vulnerable first 100 m of this farm roadway. The cows are following tracks due to a less than perfect surface
Cow behavior
Cows like to walk with their heads down so they can see where to put their front feet. The hind foot is also placed on ground that the cow has seen. When cows cannot place their feet safely they will slow down. It could be because the roadway surface is poor or because they are being forced to move on from behind. If forced to move on from behind cows become bunched and they lift up their heads and shorten their stride. Now they cannot see where to put their front feet and they lose control of where to place their hind feet. Given time a cow that is left to move along quietly will seldom misplace a foot, even on a poor surface.
Moorepark | Dairy farm infrastructure hanDbook
Page 14
Cows have an average walking speed of 2-3 km per hour (0.6 to 0.8 m per second). On a good farm roadway they can walk at speeds over 4 km per hour (up to 1.2 m per second).
There is a social hierarchy and dominance within the herd. Cows like to stick to their social groups as they walk along to the parlour. Cows don’t like too much physical contact with other cows as they walk along. When dominant cows slow or stop the rest of the herd will do likewise. Cows have a slightly different milking order to their walking order, so they need space and time to re-organise themselves in the collecting yard before milking. Pushing them in too tight will only lead to stress and lameness.
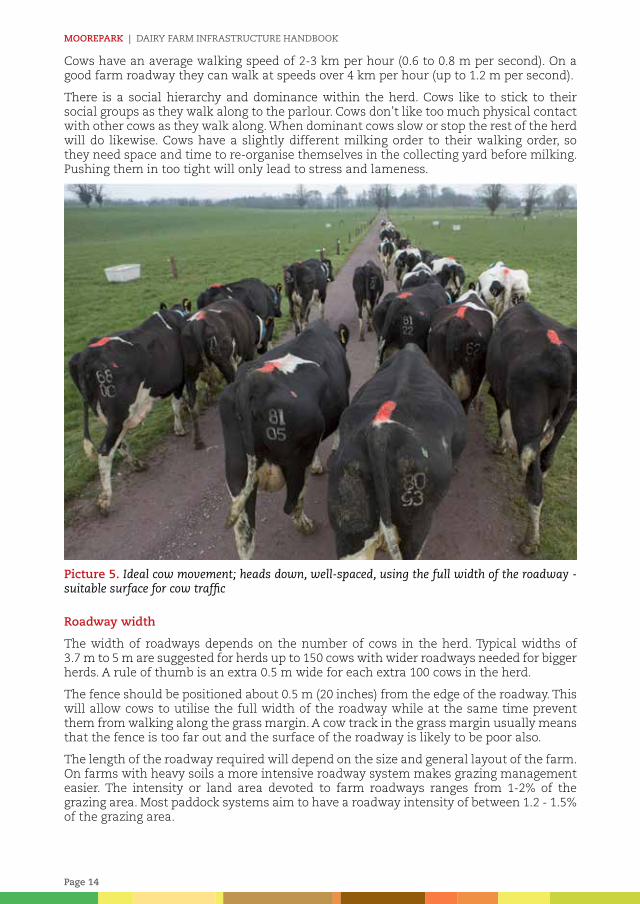
Picture 5. Ideal cow movement; heads down, well-spaced, using the full width of the roadway - suitable surface for cow traffic
Roadway width
The width of roadways depends on the number of cows in the herd. Typical widths of 3.7 m to 5 m are suggested for herds up to 150 cows with wider roadways needed for bigger herds. A rule of thumb is an extra 0.5 m wide for each extra 100 cows in the herd.
The fence should be positioned about 0.5 m (20 inches) from the edge of the roadway. This will allow cows to utilise the full width of the roadway while at the same time prevent them from walking along the grass margin. A cow track in the grass margin usually means that the fence is too far out and the surface of the roadway is likely to be poor also.
The length of the roadway required will depend on the size and general layout of the farm. On farms with heavy soils a more intensive roadway system makes grazing management easier. The intensity or land area devoted to farm roadways ranges from 1-2% of the grazing area. Most paddock systems aim to have a roadway intensity of between 1.2 - 1.5% of the grazing area.

Page 15
Picture 6. Sweeping bend at roadway junction
Lameness
The surface of the roadway has a big influence on the level of lameness in the herd. The surface needs to be smooth, fine and strong enough to support animals but with a little give in it also. Ideally, the hoof prints from the cows should be visible across the roadway, but not so much to damage the surface when the weather is wet. Rough surfaces with protruding stones, loose gravel or pebbles (either sharp or round) lying on the surface are a major lameness factor. Moorepark research on 14 commercial dairy farms found that on average between 12 and 16 cows per 100 became lame in a six month period (either Jan-Jun or July-December). On individual farms the figure could be as high as 31 cows per 100 during any six month period. White line disease was the most common cause of lameness followed by sole ulceration. Poor maintenance of roads with little use of top dressing with fine material increased the incidence of lameness. Thus, prevention of lameness at pasture must entail maintaining roads in good condition.
The presence of concrete roadways on farms increased the incidence of lameness. Therefore, if concrete roads are used for cows, care must be taken to ensure; that the junction between the concrete and the roadway is maintained in good condition, that the concrete is kept free of grit, and run-off from the concrete should be diverted away from the roadway. A kerb or nib wall, close to the end of the concrete where it meets the roadway may be useful. If the kerb is a bit back from the edge of the concrete (about 0.5 m), there will be less wear and tear on the roadway where the two meet. Regular brushing/cleaning of the concrete is required. Holding cows for long periods on concrete before and after milking should be avoided.
A kerb is also recommenced between the roadway and the entrance to the collecting yard. This will force cows to lift their feet dropping off stones before the entrance. The kerb also prevents soiled water from the collecting yard running onto the roadway or rainfall run-off from the roadway flowing onto the collecting yard. The gradients in this area could be in four different directions depending on the lie of the land, the way it was planned or built, etc. The collecting yard could be sloping to or away from the parlour and the farm roadway could be sloping to or away from the collecting yard. Suitable arrangements must be made for collecting effluent/washings from the soiled yards and the drainage away of rainfall from the roadway. Deepening the fine surface layer and ensuring good drainage in the stretch of roadway near the collecting yard will mean cleaner cows, less lameness and lower cell counts.
Moorepark | Dairy farm infrastructure hanDbook
Page 16
Roadway construction
New farm roadways must be laid in good weather when soil conditions are dry. This is primarily to ensure that the roadway material does not mix or get pressed into soft soil. Ideally remove a thin layer of topsoil before placing the roadway material. Topsoil contains pores, organic matter, is generally weak and is likely to deflect and shear under load. Be careful not to remove too much topsoil as the depth of the roadway will have to be increased to bring the roadway surface above field level. If too much soil is removed the finished roadway may end up being too low. The finished level of the roadway must be above the level of the field, otherwise drainage will be onto the roadway instead of off it.
A wide variety of locally sourced materials may be used as the main road material. If this material is available on the farm, so much the better. However, the cost of using it should be weighed up against the cost of purchased material.
This foundation layer is made up of granular fill material. The usual depth is about 200-300 mm (8-12 inches). The biggest stones should be no bigger than about one third of the thickness of this layer. The intended slope should be formed in the foundation layer. This means that the surface layer will have the same slope and an even thickness.
Generally, 75 or 100 mm (3 or 4 inch) down material is used. This is a graded mixture of different sized stones from 75 or 100 mm down to dust. Crushed rubble can also be used.
Compact with a vibrating road roller before the surface layer is spread. Compaction interlocks the material to give a stronger roadway and helps prevent loose stones from mixing with the surface layer.
Geotextile
Consider using a geotextile membrane between the road materials and the soil. A geotextile is a synthetic porous fabric used to separate the foundation layer from the ground underneath. It prevents the stones from becoming mixed with the soil and vica versa. The geotextile keeps the roadway foundation material clean, free-draining and therefore dry and strong. Farm roadways can suffer considerable deformation in use and the role of the geotextile in this situation is to provide physical support, as well as separation.
A geotextile is highly recommended where soil is heavy or wet. It won’t solve drainage problems; therefore any necessary drainage should be tackled beforehand. A geotextile also highly recommended on roadways used for heavy machinery. A geotextile suitable for farm roadways costs about 75 cent per square metre.
Crossfalls
Getting water off the roadway quickly will extend the life of the surface and reduce the cost of maintenance. Potholes will also be less likely to develop. To remove water quickly from roadways they should slope to one or both sides. A roadway that slopes to one side is easier to construct and machinery runs better on it. However, cows apparently spread out better on a roadway that slopes to both sides. A crossfall of between 1 in 15 and 1 in 20 is about right. A 4.5 m (15 ft) wide roadway with the fall to one side would have a height difference of from 225-300 mm (9-12 inches), or if the fall is to both sides, the centre would be 112-150 mm (4½-6 inches) higher than the sides. Water must not be trapped at the edge of the roadway or in wheel tracks; it must be shed completely and allowed to soak away in the soil or drained along by the side of the roadway and piped out under the roadway at the lowest point.
Roadways on steeply sloping ground can be subjected to a stream of water running the length of a section of roadway during heavy rain. The one in 15-20 crossfall should be enough to divert this water away to the sides in many cases. However, where the ground falls considerably along the roadway crossfalls may be insufficient to prevent this scouring, so, low ridges, shallow channels or cut-off drains at intervals across the roadway will

Page 17
divert water before it builds up volume and momentum. Do not allow water to flow off at gaps, gaps are difficult enough to keep right, as it is, without adding to their problems.
Surface layer
The roadway should be completed with about 50-75 mm (2-3 inches) of a fine material on the surface. If the surface is poor most of the benefits of having a farm roadway are gone. The surface layer needs to be laid evenly and compacted. Spread it out to the slope formed in the foundation layer. Many different types of fine material can be used for the surface layer.
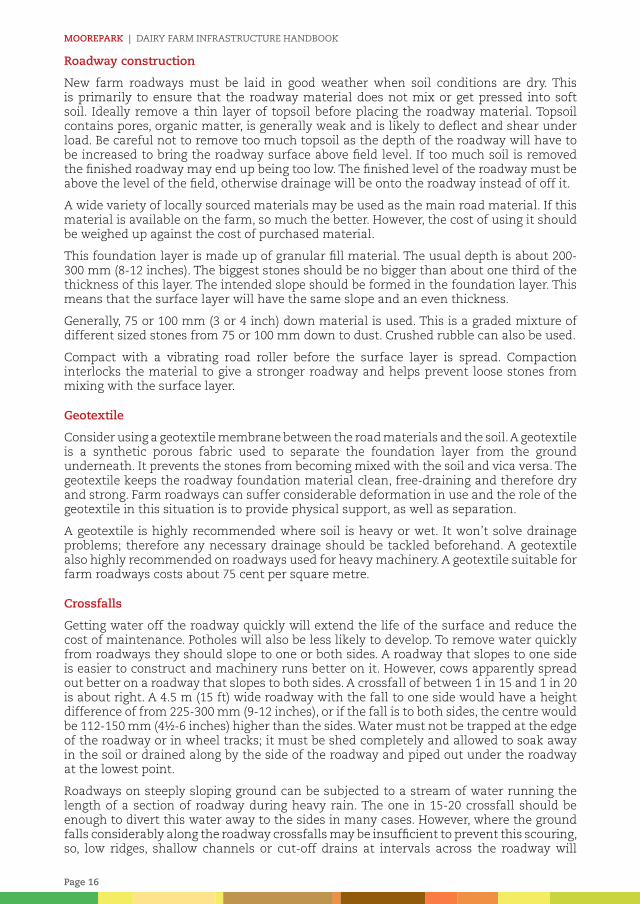
Picture 7. Fine surface material
Table 3. Key specifications Cross fall/ slope 1:20 one sided slope, 1:15 two sided slope
Construction Geotextile (optional) 200 – 300 mm hard core plus 50-75 mm fine material
Cow walking speed 2-3 km on good road surface
Road slope Max of 3:1
Fencing 50 cm from edge of road
Approx. cost €18 – 30 / metre
Costs
A 4.3 m wide roadway, with 0.3 m depth of material and will need one 25 tonne load to cover a length of 9-10 metres. This assumes a density of about two tonnes per m3 for the material used. A similar sized load would cover 45 metres with a 63 mm (2½ inch) thick surface layer. The price of road making material, both crushed stone and dust for the surface, is typically €7-10 per tonne plus VAT. As the construction material amounts to over 80% of the overall cost, strict control over the depth and width of the roadway, in line with needs and good construction practice, is essential. Farm roadway costs range between €4 and €7.5 per square metre. Calculate costs in advance and monitor progress. This will avoid surprises and cost overruns. VAT is refundable on new farm roadways but not on repairs.

Moorepark | Dairy farm infrastructure hanDbook
Page 18
Repairing an existing roadway
Roadways should be repaired as necessary - probably needing some attention every year. Pay particular attention to the most used part of the roadway, especially the first 50-100 m near the parlour. This area can get very dirty, worn and low. This dirties cows coming in and going out, leading to increased Somatic Cell Count (SCC) levels, udder washing, raised Total Bacteria Count (TBC) and sediment levels. It also predisposes foot disorders.
Typical areas that require on-going attention are drainage outlets, water diversion ramps/channels, filling potholes and adding extra surface material to rough areas. Roadways that are in a bad state will need a major repair job to get them right. Remove any grass and clay from the edges and the centre. If the roadway is lower than the level of the field it will have to be raised. If there is no crossfall, one will have to be created.
Generally, 40 or 50 mm (1½ or 2 inch) down granular fill material is used to raise the level. If it has to be raised a lot you may have to use 75 mm (3 inch) down. This granular fill should be laid to the falls of the finished surface. Finish off with a suitable surface material and compact.
Cow tracks
Cow tracks can be installed as extra roadways, as spur roadways off normal wider roadways or at the end of the main farm roadway. They are generally only suitable for short runs. They are useful for getting access to out of the way paddocks, to silage ground and making grazing management easier early and late in the season.
A depth of about 150 mm of material is laid on the surface of the ground. This should be compacted and topped off with a fine surface layer and the surface layer should be compacted also. The width should range between 1.8 m and 2.5 m, costing €8-€11 per metre run.
Some key points
• Put in two gateways to paddocks to reduce gateway wear and tear.
• Do not site water troughs on farm roadways or near paddock gateways.
• Carry out regular roadway repairs. Aim to maintain the surface layer.
• Avoid sharp bends; have swept bends at corners and T junctions to avoid bottlenecks.
• Critically watch the cow movement and remove restrictions and distractions to cow-flow.
• Remove trees that shade the roadway causing dirty wet surfaces.
• On steep roadways; use ramps or channels to divert water at intervals otherwise flowing water will create tracks and wash away the surface layer.
• Get cows to enter collecting yards towards the rear. This lines-up the cows for milking makes it easier for them to adjust their social order for milking.
• Keep pebbles and stones off concrete yards/roadways.
• If stones on the collecting yard are a problem consider installing a kerb at the roadway. yard junction and an extra depth of fine surface material on the lead-in roadway.
• Allow cows to move along roadways at their own pace to minimise lameness. This also keeps the cows calm.
• Slow down with farm machinery and keep tractor and heavy machinery use on roadways to a minimum.
• If cows slow down on a farm roadway they do so for a reason.

Page 19
• If the surface is poor, cows will take longer to walk along it.
• Repair potholes in good time and with fine material.
• Avoid holding cows on the roadway before letting them off, say to cross a public road; dung/dirt builds up on the roadway, leading to difficulty in controlling SCC, dirty clusters, open teats after milking, etc.
3.3 FencingFencing is an essential element of grassland management. Good fencing is critical for controlled grazing where the farm target is to increase grass yield and maximise the utilisation of grass.
The level of control you require is the most important consideration when erecting a fence. A permanent fence will require different design than a temporary one. Boundary fences may be designed differently than internal divisions.
Materials
The quality of materials will have a major influence on the longevity of the fence. The choice of posts, wire, insulators, gate openings etc. can vary. When erecting a fence use quality materials. These may not always be the cheapest but will be more reliable and require less maintenance in future years.
Strain posts: These form the backbone of any fence. For most fencers the strainer post should be 20 – 25 cm diameter (8-10 inches) and 2.1 - 2.5 m (7-8 ft) long. This will allow approximately 1.2 m (4 ft) of the post to be driven into the ground. These posts may be softwoods or hard woods provided they are treated. The distance between straining posts may be up to 200 m depending on type and topography of the land.
Intermediate Posts: The ideal post for most fencers would be round posts 10-12 cm (4 inches) diameter, 1.7 m (5 ft 6ins) long. Square posts (7.5 cm X 7.5 cm/3 inches X 3 inches) are also suitable.
Wire: 2.5 (12 gauge) high tensile wire is most suitable for electric fencing. Proper galvanised wire will have a life of 20 -25 years, poor quality wire decays after seven to eight years.
Picture 8. Fencing equipment

Moorepark | Dairy farm infrastructure hanDbook
Page 20
Choice of fence
Single strand electrified fence
This is cheap, easy to erect and very effective against cows and adult cattle. It is most suitable for internal divisions such as paddocks. The height of wire for cows is 90 cm (35 inches). Intermediate post spacing should be 14 m.
Double strand electrified fence
This is suitable for cows, cattle and calves. The height of top strand would be 90 cm with the second strand 37.5 cm (15 inches) lower.
Four/Five strand electrified fence
Cattle, sheep and lambs will be controlled. This fence requires annual maintenance. Grass and weeds underneath the fence must be continually cut or sprayed. The five-strand fence is particularly effective against dogs and foxes. This type fence may be useful where stray dogs are present. The spacing for the five strand from the ground up is 12.5 (5 inches), 15 cm (6 inches), 17.5 cm (7 inches), 20 cm (8 inches) and 22.5 cm (9 inches). Intermediate posts are spaced at 10 metres apart.
Temporary fencing of paddocks is widely practised for strip grazing. Geared reels with wire and white electrified tape are most suitable. There are flexible, light and easily moved.
Fixed or flexible paddocks
A fixed or flexible system of paddocks can be used - flexible paddocks should be considered by some farmers who are either constructing new paddocks or reorganising their existing systems.
The flexible paddock system entails the use of a farm roadway and permanent post at specific distance along the side of the roadway. Temporary electric fences are used to give the herd a 12-hour or a 24-hour supply of grass with a back-fence used to prevent them going back to graze the previous area. Multiple access points exist from the roadway to the grazing area. For example, in May, one hectare (2.47 acres) should feed 50 for two days. One hectare equals 10,000 square metres. So for one day the 50 cows need 5,000 m2 (1¼ acres). If the field is 100 m long from roadway to the back of the paddock, then, the new temporary fence will be erected 50 m measured along the roadway. If permanent posts are sited every 25 m along the roadway it becomes very easy to measure distances.
If we examine the advantages and disadvantages of both paddock systems, farmers should be able to decide which system best suits their own farm and management ability.
Both paddock systems have advantages and disadvantages. The fixed paddock layout can be very rigid resulting in under or over grazing in the set time allowed because there is a quarter of a days grazing too much or too little depending on the growth rate or the changes in herd structure. This is avoided in the Flexible System because the exact quantity of grass can be allocated daily. But it requires a higher degree of grazing management skills. The farmer will have to be able to assess the daily grass cover, the daily herd requirement and then measure out the area to be allocated. But this will result in higher intakes and therefore more milk and protein as well as ensuring faster regrowth. A Flexible System would ensure better utilisation of grass in wet weather and less poaching damage. It would also result in quicker mechanical operations such as topping, cutting, fertiliser spreading, etc. In order to facilitate efficient grazing of silage fields in spring (before closing) and again the autumn, a narrow roadway (for cows walking) should be constructed down the middle of large fields and flexible paddocks operated at either side. This would ensure no re-growths are eaten.

Page 21
Table 4. Advantages and disadvantages of fixed and flexible paddock systems
Fixed paddocks Flexible paddocksAdvantages
Suits inexperienced operators Less expensive to construct
Set daily area Very flexible
See quantity of grass ahead Less under or overgrazing
Achieve recommended rotations Interchange of grazing & silage fields
No daily movement of fences Easier for machinery to work
Good electric current transmission No weeds under wire
Encourages active grazing management
Easier to graze when ground conditions are poor
Disadvantages
Expensive to construct Higher level of grassland management ability required
Less flexible Daily assessment of herds’ needs
Risk of Under-grazing or over-grazing Daily assessment of grass covers
Doesn’t allow for changing herd size Daily movement of temporary fence
Fertiliser spreading, topping/cutting & reseeding more difficult
Difficult to manage calves
Less paddock access points More water troughs required to allow flexibility
Key criteria
Strain posts
• 20 – 25 cm diameter (8-10 inches) and 2.1 - 2.5 m (7-8 ft) long.
• Approximately 1.2 m (4 ft) of the post to be driven into the ground.
• May be softwoods or hard woods provided they are treated.
• Distance between posts up to 200 m depending on type and topography of the land.
Intermediate posts
• Round posts 10-12 cm (4 inches) diameter, 1.7 m (5 ft 6ins) long.
• Square posts 7.5 cm x 7.5 cm (3 inches x 3 inches) are also suitable.
Wire
• 12 gauge high tensile wire is most suitable for electric fencing.
• Proper galvanized wire will have a life of 20 -25 years, poor quality wire decays after 7 - 8 years. Wire should comply with one of the Irish or British standards.
Single strand electrified fence
• Contract price approx. €1.50/m, plus VAT for tanalized (pressure treated) posts, (creosote posts add €0.25/m). Contract price includes approx. 40% labour.
• Cheap, easy to erect and very effective against cows and adult cattle.
• Suitable for internal divisions such as paddocks, post spacing about 14 m.
• Height of wire for cows is 90 cm (35 inches).

Moorepark | Dairy farm infrastructure hanDbook
Page 22
Double strand electrified fence
• Contract price approx. €1.75/m, plus VAT for tanalized posts.
• Suitable for cows and calves.
• Top strand would be 90 cm high, second strand 37.5 cm (15 inches) lower.
Four/Five strand electrified fence
• Contract price approx. €4.50/m run, plus VAT for tanalized posts.
• This fence requires annual maintenance, not used widely.
Sheep mesh with a single electrified strand
• Contract price approx. €6/m run, plus VAT for tanalized posts.
• Suited to farm boundaries, around farmyards, internal roadways and calf paddock for young calves.
• 80 cm (32 inches) sheep mesh is commonly used, topped with a single strand of electrified wire.
• Barbed wire could also be used. Intermediate posts are spread at seven to eight metres apart.
Picture 9. Fence wire-strainer Picture 10. Creosoted straining post at paddock entrance
3.4 Water systemA good water supply is extremely important for production, health and welfare of livestock. The water supply system must be good enough to supply adequate water needs in paddocks, the parlour and dairy, and the dwelling. On most farms the water system consists of a series of expansions or additions carried out over the years as requirements changed. Only when the system fails to cope, such as during a dry summer, do people realise how marginal their system has become.
A fact often overlooked, is that improving water supply can result in an increase in milk yield. A dairy cow can be satisfied long before she is full, so if the water is slow to come through to the trough, she may be quite contented, but milk yield can suffer by over 20%.
Common problems on most farms centre on inadequacies in areas such as, water source, pumping plant, pipe sizes, ballcocks and troughs.

Page 23
Table 5. Key requirements for water systemCow water intake 60 - 110 litres/day dependent on weather conditions -
typically four litres of water per litre of milk producedCow drinking speed 14 litres per minute (3 gallons/min)Cow drinking time 30%-50% water intake within three hours of milkingTrough size Allow 5-7 litres per cowBallcock Medium pressure-gives flow rate of 32 litres/min versus 8
litres/min with high pressureMain pipe layout Ring/loop system preferable
Picture 11. Example water system layout
Water source
A bored well is the most common source on farms. If the well is unable to meet peak demand, the installation of a reservoir of, for example, 9,000 litres (2000 gallons) which can be a pre-cast concrete tank will rectify the situation. The tank can be buried in the ground or placed overground.
A booster pump is then used to pump the water from the reservoir into the water supply system, at whatever flow rate and pressure are necessary. Frequently, this booster pump can double as the pump for a wash-down system as well. Modern frequency controlled centrifugal pumps will automatically maintain pressure and flow in response to demand. The pump speed will increase when an extra tap or ballcock comes into use and vica versa. In large scale units, where electric power is not limiting two of these pumps can be installed in parallel to efficiently cope with the demand for high flow rates.

Moorepark | Dairy farm infrastructure hanDbook
Page 24
Pumping plant
Submersible or surface pumps may be used in water supply systems. In general, only submersible pumps should be used to pump from deep wells (boreholes). The running costs of a surface pump, being used to pump from a deep well, can be up to five times higher than for a submersible pump, because some water has to be pumped down into the well to bring water to the surface. Maintenance costs are higher also. Surface pumps can be used for shallow wells where the water can be sucked directly by the pump. Consider replacing an existing deep well surface pump with a submersible pump.
In deciding on pump size, take into account the depth of the well, the output of the well and the working pressure required to overcome any rise in ground level from the well to the top of the system. Where a new pump replaces a previous unit, the size of the electric cable used to supply the pump must be taken into consideration. Poor standards of installation lead to bad performance and unreliability. Lack of starter switches or wrongly adjusted starters fail to give motors adequate protection. Experienced pump suppliers will be able to help you in planning the system to suit your requirements.
Small pipe sizes
This is probably the most common problem with water supply on farms. Even on farms where piping was laid in recent years under-sizing of pipes still occurs. Table 6 shows the pressure loss in psi for different pipe bores over a range of flow rates for 100 m length of water pipe. For example, at a flow rate of 3 m3 per hour (50 lit/min or 11 gal/min) with a 32 mm (1¼ inch) pipe the pressure is reduced by 4.83 psi for every 100 m of pipe. The reason the flow rate reduces because of friction between the water and the inside surface of the pipe.
Table 6. Pressure loss in psi for different pipe sizes at various flow rates for 100 metres length of water pipe
Pipe bore (mm)
Flow rate m3 per hour (litres per minute)
1 (17) 2 (33) 3 (50) 4 (67) 5 (83)20 14.20
25 3.27 11.50
32 0.64 2.27 4.83 7.60 11.65
38 0.34 1.21 2.49 4.05 6.25
50 0.11 0.38 0.88 1.34 2.06
Table 6 doesn’t take into account the extra pressure required if you are pumping uphill or the pressure gained pumping downhill. Pressure lost due to restrictions at ballcocks and fittings is also extra. It doesn’t show values for 12.5 mm (1/2 inch) pipes because at any of the flow rates shown the pressure loss would be very high. Where 12.5 mm pipes are used on farms the flow rate is reduced to a trickle due to pressure loss.
With regard to pipe size it’s the change in cross-sectional area in relation to its bore (diameter) that’s important. It’s hard to imagine that a 20 mm (3/4 inch) pipe has approximately twice the cross-sectional area of 12.5 mm (1/2 inch) pipe. Similarly, a 25 mm (1 inch) pipe has four times the cross-sectional area of 12.5 mm (1/2 inch) pipe, although it’s only twice the bore.
The pressure loss is also affected by the pipe length. The pressure loss and the resultant reduced flow rate are directly proportional to the length of the pipe, i.e. if you double the length of the pipe you double the pressure loss. You can use Table 6 to judge how much pumping pressure is lost with various pipe sizes and flow rates, while taking the pipe length into account.
The net effect of pressure loss is reduced flow rates. Increasing system pressure to maintain flow rate is not a good solution. It would be extremely energy inefficient and give rise to

Page 25
damaging levels of pressure. The answer is to use the right pipe size.
Ring system
If you are installing a new main line, incorporate the existing line as well if it’s in good condition and not too difficult to do. This is worthwhile where pressure is low or the main line is long and the end of the new line and the existing line are not too far apart. Connecting up the ends of two main lines (of the same size) to form a ring main will almost double the flow rate.
Laying pipes
If you are using a mole plough to lay the pipe, do it in stages, using a digger to make holes at intervals where connections are going to be made. Try to get the pipe down to a depth of 450 mm or more. Tractors with double-acting rams on the arms can add enough weight to the mole plough to get the depth. Do a “dummy run” first before feeding in the pipe and allow the pipe time to recover from the stretching before making connections.
Ballcock problems
Very often the ballcocks are the weak link in an otherwise satisfactory water supply system. Ballcocks are frequently over restrictive, even on systems where the pipe sizes are adequate. A high pressure 12.5 mm ballcock in the drinking trough is not capable of allowing an adequate flow rate, which is in most situations about 16 to 22 litres per minute (3.5 to 5 gal/min).
In general, standard ballcocks are described by their size and pressure. Ballcocks can have high, medium or low pressure jets. The high, medium and low pressure refers to the pressure the ballcock can withstand without leaking when the trough is full.
Picture 12. High, medium and low pressure jets
The high-pressure jet has the smallest hole and the low-pressure jet the biggest.
The high pressure jet in a standard ½ inch ballcock is only 1/8 of an inch in diameter whereas the medium jet is ¼ of an inch in diameter. Other ballcocks are available that have openings of ½ inch or greater.
In most systems medium pressure ballcocks will provide an adequate flow rate (Table 7). In practice, most standard ballcocks are sold with high pressure jets in them, which is one reason why so many farms have flow rate problems.
High or medium pressure jets will fit into all 12.5 mm ballcocks (Picture 13). The low pressure jet will not fit up against the gasket in standard 12.5 mm ballcocks. If you want

Moorepark | Dairy farm infrastructure hanDbook
Page 26
the option of using a low-pressure jet get the 12.5 mm ballcock that can take any size of jet. It has a bigger plunger and a bigger gasket (Picture 14).
Picture 13. Two standard ½ inch ballcocks, one showing a shorter float arm. High and medium pressure jets can be used with this type of ballcock
Picture 14. This is a bulkier version of the ½ inch ballcock, in which fits the low pressure jet as well. Note the bigger seating gasket for the jet inside
Using a longer float arm or a larger float can solve the problem of leaking ballcocks by increasing the force on the gasket with the extra leverage. Longer float arms are available or they can be lengthened by braising on a piece.
Ballcock jets should be checked from time to time to see that they are free flowing because they can become encrusted with lime scale or partially blocked with dirt.
Table 7. Flow rate l/min (gal/min) with a standard 12.5 mm (1/2 inch) ballcock and a system pressure of 3.6 bar (52 psi) for different jet sizes
Jet type12.5mm (½”) ballcock
Low pressure
Medium pressure
High pressure
Jet size mm (inch) 10mm (3/8”) 6mm (1/4”) 3mm (1/8”)Flow Rate l/min (gal/min) 42 (9.25) 32 (7) 8 (1.75)
Table 7 shows the effect of using different jet sizes on flow rate. We put the three different jets in turn into the same standard 12.5 mm ballcock at a trough in a paddock. The system pressure at the trough with no water flowing was 3.6 bar (52 psi). The most striking finding is the massive increase in flow rate between the high and medium pressure jets, going from 8 to 32 litres per minute. Table 8 shows the combined effect of pressure and ballcock jet size on flowrate. Note that quadrupling the static pressure will double the flow rate while quadrupling the jet size will increase flow rate by a factor of 16.

Page 27
Table 8. Flow rate (gal/min) through ballcock at varying static pressure and ballcock jet size
Static Pressure (P.S.I.)Ballcock jet size
1/8” 1/4” 3/8” 1/2”0.5 0.20 0.82 1.84 3.281.0 0.29 1.16 2.61 4.652.0 0.41 1.65 3.69 6.574.0 0.58 2.33 5.22 9.297.0 0.77 3.08 6.90 12.3010.0 0.92 3.69 8.27 14.7015.0 1.13 4.52 10.10 18.0020.0 1.31 5.22 11.70 20.8025.0 1.46 5.82 13.00 23.2030.0 1.60 6.40 14.30 25.5035.0 1.73 6.90 15.50 27.5040.0 1.85 7.38 16.50 29.50
Note: The pressure is at the ballcock and NOT at the pump
Water troughs
Cows can drink anything from 10 litres of water when dry to 60 - 110 litres when milking, depending on production levels and weather conditions; typically cows will require four litres of water per litre of milk produced. They can drink at the rate of 14 litres a minute from a trough. Allow cattle 10 to 15 litres per 100kgs of body weight per day. Peak water intake generally coincides with peak grazing periods. Peak demands occur especially after evening milking and to a lesser extent after morning milking. Water flow rates must be capable of supplying these peaks of demand.
Carefully consider trough location; cows don’t like to walk more than about 250 m to get a drink. Locate water troughs away from paddock gateways and farm roadways. This will shorten the walk to water, prevent bottlenecks, and reduce the wear and tear at gateways. Check water troughs regularly to ensure that ballcocks are working properly and that there are no leaks; a leak at a water trough is a real disaster.
Flow rate should be considered before trough size in ensuring adequate supply. However, large troughs provide more drinking space and can compensate a bit for poor flow rate at peak drinking time. The main advantage of big troughs is they give more space for drinking. Each cow drinking at a trough needs 450 mm of space measured along the trough rim. For large herds it may be necessary to install a second trough in the paddock. Siting troughs underneath a paddock wire fence will more than halve drinking space. Heifers and timid cows may also get bullied if adequate drinking space is not available.
The area around the trough should be able to take a lot of cow traffic i.e. a similar surface to a farm roadway and ideally have good drainage.

Moorepark | Dairy farm infrastructure hanDbook
Page 28
Picture 15. This is a typical 0.5 m3 (110 gallon) rectangular water trough. It is located on a high point in the field with a good surface around the trough. The length of the rim of the trough all around is 4.8 m (16 ft.). It could allow in theory about 10 cows to drink together. A 1.6 m3 (350 gallon) round trough has a drinking rim of almost 6 m (20 ft.), which in theory is room for about 13 cows.
Calculating water flow rate
Assuming a daily demand of 80 litres per cow, almost 50% of which is consumed in a three hour period soon after evening milking, means that an hourly flow rate of 13 litres per cow per hour is required (i.e. 80 x 50%/3 = 13 litres/cow/hour.). Therefore, for a herd of 100 cows the flow rate needs to be about: 100 cows x 13 litres/hour = 1300 litres/hour or 22 litres per minute.
To check the flow rate on your farm:
• Mark the level of water in a trough.
• Tie up the ballcock and empty, say, 25 litres from the trough.
• Release the ballcock, hold it down and measure the time it takes (in minutes) to refill to the original mark.
• Divide the 25 litres by the time taken to refill, e.g. if it takes a minute to refill then the flow rate is 25 litres per minute (25/1 = 25).
• If the flow rate measured is less than that required for your herd, then your water supply system needs to be improved. Check the flow rate of troughs around the farm.

Page 29
Picture 16. Top-fill 500 gallon water trough servicing adjacent paddocks
Leaks
Troughs can overflow and pipes can leak. Leaks can make a mess and add considerably to water bills. Overflowing troughs and leaking pipes frequently go unnoticed. A leak in a metered supply downstream of the meter may lead to massive water bills. Leaks in a private supply are costly also because electric motors are very expensive to run, if running continuously. Use quality fittings and install isolation valves on pipelines to isolate different sections of the paddock water supply. Isolate all the sections during the housing period.
Portable water troughs
It may be necessary to use portable water troughs in some situations e.g. strip grazing. To provide a portable trough use frost-proof gate valves and good quality non-restrictive quick-couplers. Connection points should ideally be away from fixed troughs because they can be damaged and some valve types can be opened by stock, causing leaks.
Key points
• Daily drinking water requirements vary but can be 60 – 110 litres per cow.
• Milk production and animal health are affected by inadequate water supply.
• Many water systems are inadequate especially for expanding herds.
• Allow 450 mm (18 inches) drinking space per cow so that close to 10% of your herd to drink at the same time.
• Main pipelines should be at least 25 or 32 mm and 38 or 50 mm for larger herds.
• Use 12.5 mm medium pressure standard ballcocks or newer bigger types; avoid high pressure ballcocks.
• Correct siting of water troughs is important.
Moorepark | Dairy farm infrastructure hanDbook
Page 30
4. Milking facilitiesMilking is the main chore on dairy farms and typically consumes over 30% of total labour input. In the past, most dairy farmers focused on having about ten cows per milking unit and space for additional units was in many cases omitted. In the future, apart from restricted land resources, milking and specifically labour personnel for milking, is likely to be the most important factor in the limitation of herd size and having a parlour with a large output in terms of kg’s of milk produced per person per hour will be necessary. The number of milking units an operator can safely handle is now a major issue and all forms of automation are now being considered by farmers, as labour demand in milking parlours is now a priority. Herd sizes will continue to grow in Ireland, as driven by the abolition of the quota regime in 2015. Against this background, many farmers are milking in unsuitable parlours and need to invest in a new parlour to suit their needs. With high labour costs and problems accessing skilled labour, the recent trend has been to install milking parlours with a greater number of units to be handled by one operator. Installing a new parlour is an expensive, once in a generation investment and should be planned carefully.
4.1 Planning a milking parlourIn an ideal situation the milker can carry out the complete milking without leaving the pit. The following factors influence the output of a milking parlour:
• Design of milking equipment.
• Milk yield and milking routine.
• Parlour design and level of automation.
• Holding yard design.
• Skill of the operator.
• Location of udder wash hoses, teat spray jets, and power hose for occasional washing of cow standings.
• Operation of entry, exit and drafting gates from the pit.
• Location of parlour.
Installation Standards for milking machines
Key Points
• The first port of call for planning a new dairy should be to consult the specification S106, ‘Minimum Specification for Milking Premises and Dairies’ published by the Department of Agriculture, Fisheries and Food.
• In particular it is important not to overlook the presence/proximity of an open slurry tank. The parlour must be at least 10 m distant, or more preferably, from an existing open slurry tank. The parlour must not share a common wall with silage or ensiled material. Location in relation to surface waters and a public water supply source is also an important issue when deciding the location of new parlours. There is a distinction made between existing and new farmyards. Reference should be made to S103 for modifications to existing parlours.
• International and Irish Milk Quality Co-operative Society (IMQCS) standards exist and may be used as a basis for installing a new milking machine. The IMQCS was set up in 1989 to ensure that Irish milking machine installation and testing standards are at least equal to ISO standards. Teagasc, ICOS, the main milking machine manufacturers and the milking technicians were closely involved in implementing the new revision of

Page 31
ISO standards, which were introduced in 2008. This publication is essential reading and can be downloaded from www.milkquality.ie.
4.2 Milking equipment • The choice of milking systems should be directly related to the number of cows
currently being milked and the herd size envisaged for the future. Plan to allow for milking an expanded herd in no more than 1 hour 30 mins.
• Larger herd sizes will lead to a greater focus on time, working conditions and ergonomics associated with milking. It is important that maximum potential milking performance be achieved from new milking installations and from changes in existing milking parlour size and design.
• The particular requirements of the individual dairying enterprise and the cost of hired labour must dictate the level of automation decided on. The capital, maintenance and running costs of the automation must be carefully considered also. If a high level of automation is installed, then it must be ensured that it is reliable and dependable and can be operated by a person of reasonable skill.
• Generally it is better to focus on having adequate milking units at the expense of high levels of automation.
• It is extremely important that the operator does not have to leave the pit during milking time.
Upgrading of many parlours in respect to these characteristics is required.
4.3 Deciphering automation: key terms
Automatic Cluster Removers (ACRs)
• While cluster removers are often considered unnecessary in smaller parlours (less than 14 units), they offer great flexibility in larger parlours. The installation of ACRs can help cows’ health by eliminating the risk of over-milking.
• Cluster removers ensure consistency around the end-point of milking which is beneficial if the milker’s are inexperienced or if more senior farmers are carrying out the milking operation.
• Swing arms are usually required for correct operation, i.e. to prevent clusters getting dirty and swinging free across the pit when detached and to support the rams for cluster removers and also to support the long milk tube.
• If planning for the installation of cluster removers at a later date, swing arms should be installed making the fitting of cluster removers easier in the future.
• Correct ACR operation requires good cow positioning in the parlour.
Bailing systems
• The installation of bailing systems allows cows to be located conveniently for proper operation of ACRs. The main advantage with bailing systems is that cows are controlled and positioned better for easy and safer cluster removal, compared to having a straight-breast rail or angled mangers. When there is a large variety of cow sizes in the herd (e.g. if there is a large number of first lactation animals), extra cows can fit into the row unless there is a suitable cow positioning system. This causes poor cow position and may double the row time.
Moorepark | Dairy farm infrastructure hanDbook
Page 32
Automatic Cow Identification (Auto ID)
• Electronic management tags are used to monitor and automate day-to-day management tasks on the farm. They operate in conjunction with equipment such as out of parlour feeders, calf feeders, electronic milk meters, drafting gates and weighing devices. They serve an internal on-farm herd management function.
Automatic drafting
• Where Auto ID is available, cows can be diverted automatically in up to three different directions according to management needs with no labour input required.
• Cows can be accurately sorted and normal cow flows are not disrupted.
• It provides gentle cow treatment and maximum cow traffic speed away from the parlour.
Automated milking machine wash systems
• Automatic wash systems reduce wash up time as well as ensuring safe and accurate addition of cleaning chemicals to wash water.
• Many farmers do not measure the exact amount of cleaning chemicals used in the wash trough for circulation or for plant rinsing, thus allowing for the possibility of milk residues.
• Air purge units, used in conjunction with auto washers to remove residual water (and residual milk after milking) from the milking machine, eliminating the risk of adding water to milk.
Summary
The particular requirements of the individual dairying enterprise and the cost of hired labour must dictate the level of automation decided on. The capital, maintenance and running costs of the automation must also be considered. If a high level of automation is installed, then it must be ensured that it is reliable and dependable, can be operated by a person of reasonable skill and requires the presence of, and accessibility to a very good timely repair service. Initially, it is better to focus on having adequate milking units at the expense of high levels of automation. However, provision should be made for the easy addition of automation at a later date, for example swing-over arms are usually required to support the rams for cluster removers and also to support the long milk tube. It has been observed that milking speed is increased by approx. 10% with 16 mm bore long milk tubes, compared to 13.5 mm bore tubes. In most cases, the swing-over arms prevent excessive sagging of the 16mm bore long milk tubes. If planning for the installation of automatic cluster removers (ACRs) at a later date, swing-over arms should be installed making the fitting of ACRs easier in the future. The installation of individual animal bailing systems allows cows to be located conveniently for proper operation of ACRs. There is considerable debate now on the feasibility and necessity of installing bailing systems in new milking parlours. The main advantage with bailing systems is that cows are controlled and positioned better for easy and safe cluster attachment and removal, compared to having a straight-breast rail or angled mangers. They are however, expensive and slow down milking. Dump lines are also an optional extra however, operating a second herd of ‘unhealthy’ cows (mastitis, lameness or other ailment which require antibiotic treatment) is recommended practice (for larger herds) from a milk quality perspective.

Page 33
Picture 17. Example of automated drafting system

Moorepark | Dairy farm infrastructure hanDbook
Page 34
Picture 18. Manually operated drafting system
4.4 Design of milking facilities
4.4.1 Access roadway
In addition to the construction of roadways which was discussed earlier (section 3.2, see page 12), a well-designed, carefully built and properly maintained paddock-to-yard system can result in many benefits. These include:
• Reduced lameness, less mastitis and better general animal health.
• Faster and easier stock movement, unrestricted cow flow into the yard ensures less time is spent herding.
• Cleaner cows mean potentially reduced teat preparation.
• Improved milk quality due to improved cow cleanliness.
The design and maintenance of paddock gateways, roadways and junctions is critical for the efficient travel of cows to the dairy. Minimising restrictions and maintaining a good roadway surface is the best way to encourage cows to keep walking to the dairy. Water is the enemy of a stable roadway. A 50-75 mm kerb at the intersection of the roadway and collecting yard prevents the wash-water from flowing onto the roadway.
When cows walk onto a concrete collecting yard they can carry gravel and pebbles with them, especially if the lead-in path is muddy or inadequately constructed. Kerbing also acts as a stone trap when cows lift their feet clear off the ground. This creates an opportunity

Page 35
for stones and pebbles to fall off the hoof. Stones should be cleared away from these areas regularly to prevent injury to other cows. Regular roadway maintenance saves money in the long term. Examples of quick and cost effective changes to improve key aspects of the paddock to yard cow movement process include:
• Paddock gates should be the full width of the roadway to enhance cow-flow.
• Support heavy gates with wheels.
• Put in two gates per paddock to reduce gateway wear and tear.
• Put in hitching points so that open gates don’t blow shut.
• Moving troughs away from the gate prevents drinking cows blocking the gateway and also reduces wet areas around gateways.
• Roadway width will limit cow speed - but generally there is no advantage in gates wider than the roadway.
• Slow down - calm cows produce more milk when they get to the milking parlour.
• Clean drains to facilitate roadways lasting longer.
• Keep cows out of the drains on the side of the roadway.
• Critically watch the cow movement and remove restrictions and distractions to cow-flow.
• Remove trees that shade the roadway and cause poor drying conditions.
• Get cows to enter the holding yard at the rear to preserve their social order for milking.
4.4.2 Collecting yard
Good design will help ensure cows remain calm and willing to enter the parlour. There are two aspects to consider when constructing a collecting yard;
• The average size of cows in the herd.
• The herd size.
Small cows require 1.2 m2 per cow while large cows require 1.5 m2 . Multiply the average cow size by the maximum number of cows. This calculation will indicate the total area required. Both circular and rectangular yards have positives and negative attributes (Table 9). In a large dairy herd optimising cow flow around the milking parlour is essential for high labour efficiency.
The yard entrance should be the full width of the track; otherwise they will impede cow flow. Gates should not interrupt cow flow and should be easy to manage. For areas exposed to high stock pressure (i.e. for the last 10-20 m before the yard entry) ensure roadway fence is strong enough. Wooden railings are ideal as they will cause minimal injuries.
Table 9. Advantages and disadvantages of rectangular and circular collecting yards
Rectangular yards Circular yardsEasier to build More complex to build
Can be extended easily Difficult to enlarge
Promotes good cow flow if cows enter from rear
Promotes good cow flow
Important to taper the yard towards dairy entrance
Can support automatic backing gate cleaning system
Can support automatic backing gate cleaning system
Possible to put second herd onto same yard without moving backing gate
Moorepark | Dairy farm infrastructure hanDbook
Page 36
4.4.3 Backing gates
A calm and consistent routine as the cows enter the parlour results in: fast milk let-down, shorter milking duration and less-frequent dunging and urination. It also encourages the critical element of cows willingly entering the parlour for milking without relying on the milker leaving the pit. Backing gates can assist with cow-flow into the milking parlour but they need to be well designed and used correctly. Backing gates work by reducing yard size as the number of cows waiting to be milked decreases, which keeps cows close to the dairy entrance. Audible (not loud) alerts (such as a bell) can be used to warn cows that the backing gate is advancing.
Although not part of the entrance to the parlour, the positioning of other cow handling facilities can impact on the flow of cows as they enter. If correctly positioned, the race, crush and loading ramp can share space without diminishing yard performance. But a screen should be placed so as to prevent entering cows being distracted by drafted cows and other activities taking place. The backing gate should move very slowly, at a speed sufficient for cows to move ahead of the gate without being run over by it. The milker must be able to activate the backing gate from the pit and the gate should only move while the milker is activating it.
The holding yard should provide a clear entry into the milking parlour. The yard is often built to the full width of the parlour. Tapering-in the walls of the yard to the parlour entrance aids cow-flow, as it eliminates corners and cows are spaced for smooth entry to the parlour. Yards and entrance should be wetted before cow arrival.
4.4.4 Dairy entrance design
The interface between the holding yard and inside the parlour should be designed to encourage cows to enter. There are several factors that need to be considered to create a good entrance design. These include: footing, lighting levels and entrance widths. A well-designed entrance to the parlour promotes the voluntary entry of cows into milking positions. Safe, reliable footing is essential to give cows confidence to enter the dairy. Grooving concrete helps provide traction, but the grooves need to be consistent with the drainage direction. The slope of the entrances to the parlour should not exceed 1 in 25 and steps should be avoided if possible. Skylights combined with natural lighting can even out light levels between the outdoor yard and indoor parlour - dark shadows in the entrance causes cows to pause before entering. Cows need to feel secure as they move from the holding yard into the parlour and therefore any physical restrictions at the entrance should be avoided include poor lighting, floor surfaces, sharp turns, railings, posts and inadequate space allowances. It is also advisable to avoid doing painful procedures to cows while in the parlour. The natural pecking order of the cows should be maintained, a timid cow may be bullied at this point and may stand further back, where she feels safer. Cows have a natural tendency to follow one another, thus if the entrance design obscures the cow in front from view, the next cow will be reluctant to follow. Protection from the wind and elements at the parlour entrance can also aid cow-flow. A typical entry race width would be 760-820 mm.

Page 37
Picture 19. A well designed lead in to the parlour improves cow flow
4.4.5 Drafting systems
Key Elements
• Milker should be able to draft without having to leave pit.
• Farmers with good drafting facilities are inclined to AI for longer.
• Drafting systems can be manual (rope and pulley) or automatic.
• Front exit parlours make manual drafting easier.
• Side exit parlours can also be drafted manually with a gate at exit.
• Holding pens for drafted animals should be large enough to hold 10% of herd.
• Exit gates from parlour that can be operated from anywhere in the pit are essential. Scissor gates are ideal in that they can be both opened and closed from anywhere in the pit.
Well-designed drafting facilities at exit from the parlour will:
• Save time, provide gentle cow treatment, and maximum cow traffic speed through the parlour.
• Cows can be accurately drafted and normal cow flows are not disrupted.
• A system that funnels cows into a single file on exit from the parlour and into a chute is required. This can then widen after drafting to allow for rapid cow exiting.
• A short self-closing drafting gate can be opened across the race from the pit via a rope and pulley system. It is important when cows are being drafted that they have adequate space in front so that they do not hesitate at the drafting gate passage.
• A secure holding pen should be of adequate size, e.g. hold 10% of the herd, should have a gate to guide animals towards a crush, and provide shelter where cows are held for long periods.
Moorepark | Dairy farm infrastructure hanDbook
Page 38
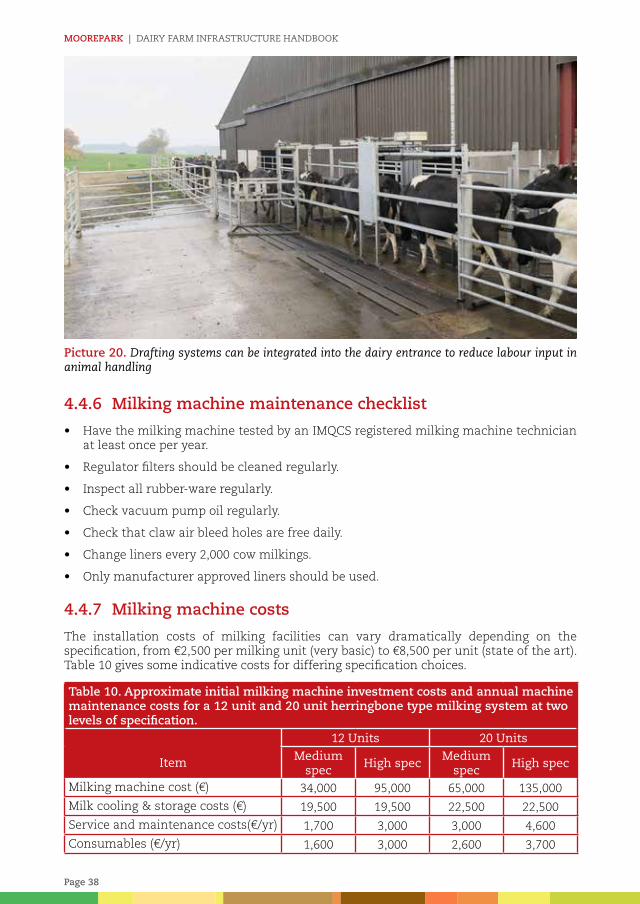
Picture 20. Drafting systems can be integrated into the dairy entrance to reduce labour input in animal handling
4.4.6 Milking machine maintenance checklist
• Have the milking machine tested by an IMQCS registered milking machine technician at least once per year.
• Regulator filters should be cleaned regularly.
• Inspect all rubber-ware regularly.
• Check vacuum pump oil regularly.
• Check that claw air bleed holes are free daily.
• Change liners every 2,000 cow milkings.
• Only manufacturer approved liners should be used.
4.4.7 Milking machine costs
The installation costs of milking facilities can vary dramatically depending on the specification, from €2,500 per milking unit (very basic) to €8,500 per unit (state of the art). Table 10 gives some indicative costs for differing specification choices.
Table 10. Approximate initial milking machine investment costs and annual machine maintenance costs for a 12 unit and 20 unit herringbone type milking system at two levels of specification.
Item
12 Units 20 UnitsMedium
specHigh spec
Medium spec
High spec
Milking machine cost (€) 34,000 95,000 65,000 135,000
Milk cooling & storage costs (€) 19,500 19,500 22,500 22,500
Service and maintenance costs(€/yr) 1,700 3,000 3,000 4,600
Consumables (€/yr) 1,600 3,000 2,600 3,700

Page 39
The 12 unit medium specification scenario included automatic in-parlour batch feeders. The 12 unit high specification scenario included milk meters, electronic individual cow feeders, automatic identification, automatic cluster removers, automatic drafting, electronic milk diversion line, automatic cluster flushing between cow milkings and an automatic washer. The 20 unit medium specification scenario included automatic in-parlour batch feeders and automatic cluster removers. The 20 unit high specification scenario included milk meters, electronic individual cow feeders, automatic identification, automatic drafting, electronic milk diversion line, automatic cluster flushing between cow milkings and an automatic washer.
4.5 Milking systemAll milking parlours represent a significant capital investment, and therefore, careful consideration is required when selecting the appropriate type. Milk quality will increasingly contribute to competitive advantage as well, and this may also be impacted on by milking equipment. Thus, it is critical to consider alternative milking facilities and their efficiency in terms of labour demand, capital investment and cow udder health.
4.5.1 Herringbone/side x side milking systems
The most common type of milking parlour in pasture-based systems is the swing-over herringbone, accounting for 91% of the milking parlours in Ireland. This parlour is popular owing to its lower investment costs and good potential for expansion.
Factors that influence overall milking efficiency and parlour performance include:
• Number of milking units.
• Operator work routine.
• Individual cow production and associated duration of unit attachment to the cow.
Increasing the number of units reduces herd milking time to a point at which labour becomes limiting (i.e. the operator cannot keep up with the number of milking units and milk-out times). This point is dependent on the operator work routine and individual cow milk production level (assuming one operator in the milking parlour). Further improvement can only be achieved by removing or automating elements of the operator work routine of the milking process.
Note: increases in unit numbers (in the absence of automatic cluster removers, [ACRs]) causes an increased risk of cow over-milking.
4.5.2 Rotary milking systems
Large herds (>500 cows) in New Zealand and Australia tend to be milked through rotary dairies (approx. 25% of herds). They may be an option for farms of increasing herd size in Ireland. The operating efficiency of rotary parlours is determined by:
• Number of bails on the platform.
• Distribution of individual cow milking times (determined by milk yield, milk flow rate and end of milking criteria).
• Speed at which the platform is rotating.
The speed of the rotation is the only factor directly controlled by the operator, and platform speed must be set based on the capability of the operator attaching the clusters.

Moorepark | Dairy farm infrastructure hanDbook
Page 40
4.5.3 Automatic milking systems
The decision to invest in an automatic milking (AM) system rather than a conventional system is often associated with the issue of labour requirement.
The labour associated with AM systems includes: monitoring of milking data, observation of cows, checking of attention lists, cleaning, increased attention to grass allocations, etc. rather than physical tasks associated with milking.
Although the AM system is associated with somewhat lower profitability (compared with medium specification conventional milking technology), the lower labour associated with AM still make it an attractive lifestyle choice for some farmers.
Any decision to invest in AM should consider the availability of skilled labour, lifestyle sought by the farmer, interest in technology, and the initial capital investment required for the milking system.
4.6 Milking efficiencyEfficient milking systems, in terms of labour demand, capital investment and cow udder health are critical to successful dairy herd management and optimization. A study was conducted to establish the effect of two primary influencing factors on efficient milking performance, i.e. parlour size (number of milking units) and pre-milking cow preparation routine (full and none) of spring-calved cows, in a single-operator side-by-side, swing-over milking parlour. Five combinations of parlour size (14, 18, 22, 26 and 30 milking units) each with two different pre-milking routines (Full: spray, strip, wipe, attach clusters, and Non: attach clusters) were examined. The trial was carried out over 40 milking sessions, at both peak and late lactation.
It is recommended to inspect foremilk of cows and to present a clean cow for milking. However, cow preparation may not be conducted in some parlours at certain times of the year. When no preparation is used, the milking operator can manage more milking units, particularly so at peak lactation when cow milking duration is longer. But over-milking can occur in late lactation.
• In a one-person milking process, when no pre-milking routine is applied throughout lactation, 22 milking clusters may be operated without over-milking of longer than two min, in the absence of ACRs, resulting in a milking time of 2.0 and 1·6 h in early and late lactation, respectively, for a herd of 220 cows (e.g. 10 rows, 9·5-min milking row time).
• The use of ACRs would allow up to 26 clusters to be managed owing to the ACR effect in eliminating over-milking in late lactation, thus enabling a 260-cow herd to be milked in 2.0 and 1·8 h in peak and late lactation, respectively, (e.g. 10 rows, 11·8-min milking row time).
• Alternatively, when a full pre-milking routine is applied throughout lactation, milking cluster numbers of 14 (peak lactation) or less (late lactation) may be operated without experiencing over-milking of longer than two min in the absence of ACRs.
• While ACRs prevent over-milking when using more milking clusters, such additional units in this scenario will not allow significantly more cows to be milked within a specified time e.g. 2.0 h, as the pre-milking routine is the limiting factor.
• The remaining alternative of applying no preparation and full routine preparation in peak and late lactation, respectively, is limited by the full routine in late lactation, and therefore ACRs are required to prevent over-milking.
• While minimum unit numbers reduce capital investment, this can have the negative effect of increasing overall milking time. It has been reported that after 2.0 h of uninterrupted work, the efficiency of even highly trained and experienced operators can decrease because of physical tiredness, resulting in interruptions and errors which adversely affect productivity.

Page 41
• There is a trade-off between operator idle time and cluster idle time. If the operator has no idle time (all time taken with attaching clusters, etc.) and if cluster number is increased, there will be no throughput advantage and cluster idle time will begin to increase.
Further work in New Zealand has developed a mathematical model to illustrate the efficiency gains that could be achieved by implementing a maximum milking time (i.e. removing the clusters at a pre-set time regardless of whether the cow had finished milking or not). This model indicated:
• Application of a maximum milking time could improve cow throughput (66% increase in an 18-unit parlour when truncating the milking time of 20% of cows).
• Example: expected throughput in an 18 - unit parlour using current standard milking practices could be approximately 75 cows/h; by truncating the milking duration of 20% of the herd, throughput could be increased to 125 cows/h (66% increase).
Performance parameters of the milking system
Milking performance is dependent on the milking facility which, in turn, is dependent on herd size, preferred milking duration, labour availability, level of automation, and capital investment. Various measures can be used to assess milking performance, but these measures must be interpreted with the values of the owner of the system in mind. For example, a farmer may wish to spend more time preparing cows for milking in order to protect milk quality, and so, may prefer a less than optimum result for the cows milked/operator/hour performance measure.
Cows/operator/hour (1st cluster on to last cluster off)
Many farmers measure their performance in terms of cows/hour which is good where there is one milking operator in the parlour. However, larger parlours (with more than one milker) always appear better with this measure. Thus, the cows/operator/hour measure may be more appropriate in that instance.
Litres/operator/hour (1st cluster on to last cluster off)
This measure focuses on the productivity of the labour used in the parlour. From a labour productivity point of view, it is better to milk fewer, higher producing cows than a greater number of lower producing cows.
Cows/cluster/hour
This is a good measure to use to evaluate equipment performance, as it examines how many cows are milked by an individual cluster in each hour of milking time.
Litres/operator/hour of total milking process time
This performance measure includes the labour required for all milking processes, i.e. paddock to yard, parlour entry, milking and the cleaning up. Thus, different sized dairies and herds, with different labour requirements, can be compared on the same basis.
Maximising time efficiency at milking
Labour associated with milking remains a significant constraint on dairy farms. A 2016 study indicated that 33% of labour input on dairy farms is associated with the milking process. This represents an average of 3.9 hours of labour per day between March and November.
• Milking parlours are run most efficiently when the capacity of the milking equipment matches the capacity of the labour person(s) milking the cows. The milking operator should not be waiting for the milking equipment (e.g. cluster) to become available and the equipment should be fully utilised, not idle and waiting for the operator to catch up. Thus, efficiency is maximised when the equipment and labour are balanced.

Moorepark | Dairy farm infrastructure hanDbook
Page 42
The degree of efficiency to which the milking task is conducted can have a very significant impact on overall milking process time and the daily life of the operator.
4.7 Milking management
4.7.1 Effect of changing milking interval (from 16:8 to 12:12) on milk production, composition and quality
On many dairy farms the morning and evening milkings give structure to the days’ activities. Often the milking task is the first and last task to be conducted at the start and end of the day, respectively. Thus, if evening milking was completed earlier, this would leave more free time in the evening for family or other lifestyle choices. This option is often not considered because of a perceived reduction in milk yield with unequal milking intervals.
A short-term study was undertaken to investigate the effect of unequal and equal milking intervals on milk yield, composition and SCC of milk in cows yielding ~25 kg/day (Table 11). Sixty-six spring-calved cows were assigned to two treatments for a four week period (April 16 to May 14). The majority of cows were at peak milk production (average 60 days in milk at the start of the experiment). Cows on Treatments 1 and 2 were milked at 16:8 h and 12:12 h milking intervals, respectively. The average lactation yield was 5,037 kg. Both treatment groups grazed under similar conditions and were stocked at 4.49/ha.
Table 11. The effects of milking at two different interval regimes in a 24-h period on milk yield and compositionWeek 1-4 16:8 h 12:12 h
Milk yield (kg/cow/day) 25.1 25.0
Fat yield (kg/cow/day) 0.87 0.83
Fat % (g/100 g) 3.47 3.30
Protein % (g/100 g) 3.29 3.28
Lactose % (g/100 g) 4.52 4.56
There was no difference between the 16:8 h and 12:12 h interval with respect to daily yields of milk, milk protein and lactose. Daily milk fat yield and concentration were reduced (P<0.05) by the 12:12 h interval but protein, lactose and SCC were not affected.
Message: A milking interval of 16:8 h (rather than an interval of 12:12 h) may be used without any negative impact on milk production, protein and lactose contents and milk SCC.
4.7.2 Effect of milking frequency on milk production
Milking cows twice a day (TAD) is a time-constraining task for dairy farmers. Opportunities exist to improve labour output and reduce costs.
• Once a day (OAD) milking may offer the following potential benefits for different sectors of dairy farmers:
» Increased labour productivity and reduced costs (including that of hired labour).
» Permit the uptake of alternative employment or alternative business interests.
» Improved management of large herds in terms of milking time and cow walking distance on fragmented land bases.
» Ease of work in terms of ergonomics together with shorter time input to the dairying operation.
» An easier lifestyle.

Page 43
• 13 times weekly milking (13TWM), that is eliminating one evening milking per week, particularly a week-end afternoon milking may offer an opportunity to reduce labour costs if the farm employs hired labour, or alternatively to improve lifestyle in a family operated farm situation.
However, such potential alternative systems must be critically examined from both management and economic viewpoints.
Once a day milking in early lactation
Research Centre - Clermont Ferrard, France OAD milking was used for three or six weeks at the start of lactation with management then changing to TAD milking. Milk production and SCC measurements were conducted during the experimental period and over the following 12 weeks. Milk yield losses of 20% and 34% were shown with three and six week periods of OAD. The subsequent lactation losses (over 12 weeks only) were 6% and 16% for three and six weeks, respectively. Protein increases of 0.10 and 0.20 were observed for three and six week periods of OAD. Somatic cell counts were not significantly different between the groups. Cows milked OAD lost less body condition and live-weight than the control TAD milking group and their energy balance was less negative over the period.
Once a day versus twice a day milking over entire lactation
Sixty spring-calving multiparous Holstein-Friesian cows were assigned after calving to four treatments; TAD milking on a high or low nutritional level and OAD milking on a high or low nutritional level. Nutritional level was defined by concentrate offered (420 and 135 kg) and post-grazing height (75 and 55 mm). Mean calving date for all cows was 11th March. Individual cow milk yield, milk composition, SCC, BCS was recorded over two complete lactations. The effect of TAD and OAD milking frequencies were at high and low nutritional levels on cow production and milk quality is shown in Table 12. OAD milking in association with a low nutritional plane reduced milk yield and yield of milk solids (MS) compared to TAD milking and a high nutritional plane, respectively.
Milk yield/cow was reduced by 26% and MS/cow by 20% with OAD compared to TAD milking. Fat and protein contents of milk were increased with OAD compared to TAD milking. Fat content was not affected by nutritional level, but protein content was reduced at the low compared to the high nutritional level. Milking frequency did not affect the incidence of new mastitis infections and while SCC of the OAD low nutritional herd was increased compared to TAD milking, the SCC of the OAD high nutritional herd remained well below 250x103 cells/ml throughout the lactation.
Table 12. Effect of milking frequency (MF) and nutritional level (NL) on mean cow milk production, live-weight (LWT), body condition score (BCS) and milk SCC
Milking frequency Nutritional level
TAD OAD High LowMilk yield (kg/cow) 6013 4437 5669 4780
Milk solids yield (kg/cow) 437 351 429 359
Fat % (g/100g) 3.99 4.40 4.17 4.22
Protein % (g/100g) 3.29 3.53 3.46 3.36
Lactose % (g/100g) 4.55 4.52 4.55 4.52
BCS at 275 DIM 2.73 3.49 3.31 2.92
SCS (SCC Log 10 ) 4.77 4.82 4.64 4.94
Message: A OAD milking regime over the complete lactation will result in a 26% and 20% reduction in yield and MS, respectively.
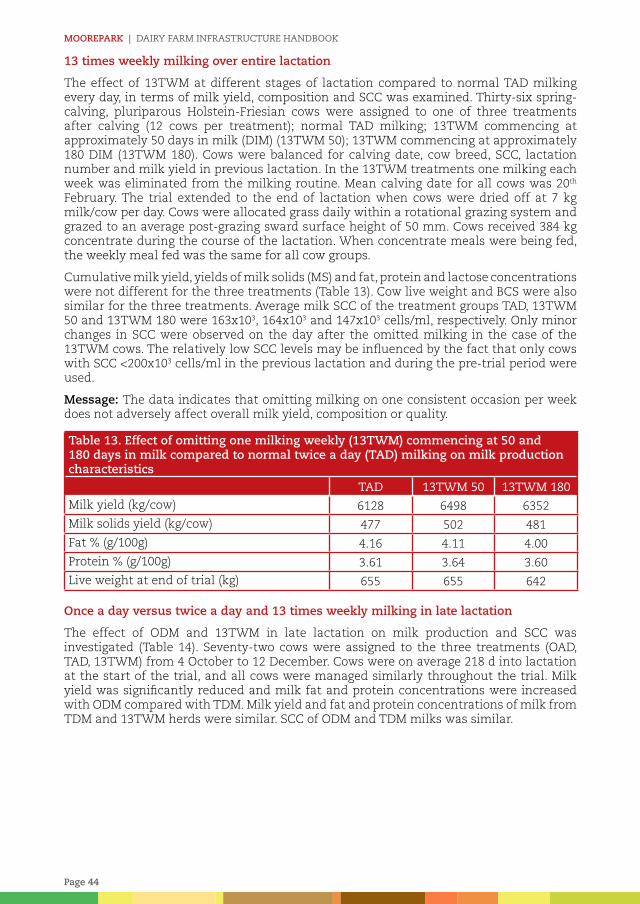
Moorepark | Dairy farm infrastructure hanDbook
Page 44
13 times weekly milking over entire lactation
The effect of 13TWM at different stages of lactation compared to normal TAD milking every day, in terms of milk yield, composition and SCC was examined. Thirty-six spring-calving, pluriparous Holstein-Friesian cows were assigned to one of three treatments after calving (12 cows per treatment); normal TAD milking; 13TWM commencing at approximately 50 days in milk (DIM) (13TWM 50); 13TWM commencing at approximately 180 DIM (13TWM 180). Cows were balanced for calving date, cow breed, SCC, lactation number and milk yield in previous lactation. In the 13TWM treatments one milking each week was eliminated from the milking routine. Mean calving date for all cows was 20th February. The trial extended to the end of lactation when cows were dried off at 7 kg milk/cow per day. Cows were allocated grass daily within a rotational grazing system and grazed to an average post-grazing sward surface height of 50 mm. Cows received 384 kg concentrate during the course of the lactation. When concentrate meals were being fed, the weekly meal fed was the same for all cow groups.
Cumulative milk yield, yields of milk solids (MS) and fat, protein and lactose concentrations were not different for the three treatments (Table 13). Cow live weight and BCS were also similar for the three treatments. Average milk SCC of the treatment groups TAD, 13TWM 50 and 13TWM 180 were 163x103, 164x103 and 147x103 cells/ml, respectively. Only minor changes in SCC were observed on the day after the omitted milking in the case of the 13TWM cows. The relatively low SCC levels may be influenced by the fact that only cows with SCC <200x103 cells/ml in the previous lactation and during the pre-trial period were used.
Message: The data indicates that omitting milking on one consistent occasion per week does not adversely affect overall milk yield, composition or quality.
Table 13. Effect of omitting one milking weekly (13TWM) commencing at 50 and 180 days in milk compared to normal twice a day (TAD) milking on milk production characteristics
TAD 13TWM 50 13TWM 180Milk yield (kg/cow) 6128 6498 6352
Milk solids yield (kg/cow) 477 502 481
Fat % (g/100g) 4.16 4.11 4.00
Protein % (g/100g) 3.61 3.64 3.60
Live weight at end of trial (kg) 655 655 642
Once a day versus twice a day and 13 times weekly milking in late lactation
The effect of ODM and 13TWM in late lactation on milk production and SCC was investigated (Table 14). Seventy-two cows were assigned to the three treatments (OAD, TAD, 13TWM) from 4 October to 12 December. Cows were on average 218 d into lactation at the start of the trial, and all cows were managed similarly throughout the trial. Milk yield was significantly reduced and milk fat and protein concentrations were increased with ODM compared with TDM. Milk yield and fat and protein concentrations of milk from TDM and 13TWM herds were similar. SCC of ODM and TDM milks was similar.

Page 45
Table 14. Yield, composition and quality of milk and live weight of cows on twice a day milking (TAD), 13 milkings per week (13TWM) and once a day milking (OAD)
Twice daily 13 times weekly Once a dayDaily yield (kg/cow)
Milk 12.9 12.8 9.1
Fat 0.57 0.56 0.44
Protein 0.50 0.50 0.37
Lactose 0.56 0.56 0.39
Concentration in milk % (g/100 g)
Fat 4.43 4.39 4.86
Protein 3.90 3.92 4.19
Lactose 4.36 4.35 4.16
Live weight gain (kg/day) 0.44 0.37 0.61
Condition score 3.0 3.0 3.1
SCC (x 103 cells/ml)
4 Oct – 7 Nov 153 - 177
8 Nov – 12 Dec 157 - 205
OAD reduced milk yield by 3.8 kg/cow/day, which resulted in a cumulative loss of 266 kg/cow compared with normal TAD milking during the last 10 weeks of lactation.
Message: OAD milking resulted in a milk yield reduction of 29% but did not adversely affect milk SCC. Moreover, one evening milking per week could be eliminated without adverse effects on milk yield or composition.
The preceding work indicates that alternative milking regimes (to TAD) such as OAD or 13TWM at various times during the lactation may be conducted with cows yielding approximately 6,000 kg. Milk yield may be negatively impacted in some instances but SCC remained well below 250x103 and 200x103cells/ml in most of the trials. Reduced yield associated with OAD milking may be partially compensated by increased cow numbers, assuming land is not limiting. Alternatively, retaining a similar herd size to a TAD milking regime would result in significantly reduced milk receipts, but would allow flexibility to explore the possibility of carrying out some degree of alternative enterprise on or off-farm. A further option is that the extra time saved with OAD milking may be spent as leisure time. Milking OAD will only suit the goals of some dairy farmers. The decision to change from TAD to OAD milking requires a calculation of the trade-off between economic and lifestyle goals.

Moorepark | Dairy farm infrastructure hanDbook
Page 46
5. Milk coolingRefrigerating milk on the farm has two main aims, to inhibit bacterial spoilage and to extend storage on the farm so as to minimise milk transport cost. The cooling of milk immediately after milking is vital to maintaining high milk quality levels. On a typical Irish dairy farm the cooling process is completed in two stages; pre-cooling and refrigeration. Pre-Cooling is achieved by passing the hot milk through a Plate Heat Exchanger (PHE) before entry to the bulk tank. Cold water is pumped through the opposite side of the PHE. The cold water absorbs a portion of the heat, thus pre-cooling the milk. A PHE is designed to run at certain operating conditions; each PHE has a specific milk to water flow ratio and extra plates can be added to accommodate for very large milk flow rates. The goal of pre-cooling is to bring the milk temperature as close as possible to that of the water. This requires a milk to water flow ratio of at least 1:2. Unrestricted water flow from the well or mains supply through the plate cooler through large diameter pipes will be necessary to achieve this goal. Control the water flow through the plate cooler with a solenoid valve so that water is not being pumped unnecessarily when milk is not flowing through the plates. It can be difficult to validate the flow ratios without installing water meters on the water pipe, however a useful check is to measure the temperature of the cold water from the well and the temperature of the milk exiting the PHE. The pre-cooled milk should be within five degrees of the well water temperature.
Following a series of audits on plate heat exchangers currently being used on active dairy farms it was concluded that the vast majority of PHEs were performing at only a fraction of their full cooling effectiveness. This was mainly due to the improper milk to water flow ratios being employed, the average of which was 1:1.2. Table 15 represents the results of PHE testing at varying milk to water flow rates and with an increasing number of plates. The milk and water entry temperatures were set to 35°C and 10°C, respectively and the milk exiting temperature from each test was recorded.
Table 15. Milk exit temperatures (ºC) for a plate heat exchanger ratio and plate capacity test
Milk:Water ratioNo. plates 1:1 1:2 1:3 1:4
25 20.8 16.8 14.8 13.729 20.7 16.6 14.6 13.633 20.5 16.3 14.5 13.537 20.5 16.1 14.3 13.341 20.4 16.0 14.1 13.245 20.4 15.9 14.0 12.9
The most noticeable result from the above test is the reduction in milk exiting temperature corresponding with the increased milk to water ratio. However, it takes an ever increasing water flow rate to reduce the milk temperature, as the ratio increases the cooling effect per litre of water is reduced.
Another observation from the test is the influence of increased plate capacity on milk temperature. The extra plates have a mild effect on the performance of the PHE. The addition of extra plates to the heat exchanger increases its heat transfer area however this also increases the number of flow channels, thus reducing the milk flow velocity and water flow velocity at a set flow rate. This reduction in flow velocities reduces the heat transfer rate in the PHE. The resulting effect is that increasing the number of plates on a PHE produces only a modest increase in cooling performance.
If a PHE is sized correctly in relation to the power of the milk pump and the correct ratio of water is supplied then the power consumed during the refrigeration stage can be reduced by up to 50%.

Page 47
Two types of milk cooling systems are used on Irish dairy farms. Firstly “Direct expansion” (DX) refers to a system where the evaporator plates are incorporated in the lower portion of the storage tank in direct contact with the milk. Liquid refrigerant expands inside the evaporator taking heat out of the milk directly thus the name “direct expansion”. Milk cooling takes place within the tank. Generally, this milk cooling system cannot cool the milk as fast as the milk enters the tank. The cooling system must run for a period during and after milking. DX cooling systems are the most efficient cooling system in terms of kWhs consumed per liter of milked cooled however they generally operate on about 60% day rate electricity.
Secondly, ice bank builders can generate enough ice at night to meet the entire milk cooling demand the next day. This system takes advantage of significantly cheaper night rate electricity. “Instant” cooling is where the milk cooling is completed external to the storage tank and then pumped into storage. An intermediate cooling fluid, such as chilled water from an ice builder is used to cool milk rapidly in a dual stage plate heat exchanger. The first stage of these systems uses well water as described previously, and the second stage uses ice chilled water from the ice bank. This cooling system is less efficient in terms of kWh consumed per litre of milk cooled, however, they can deliver very low running costs if ice is generated on night rate electricity.
The return on investment for Direct Expansion vs Ice bank cooling systems is examined in Section 6.4 (See page 53).
Picture 21. Dual stage plate cooler fitted with solenoid valve on the water pipe
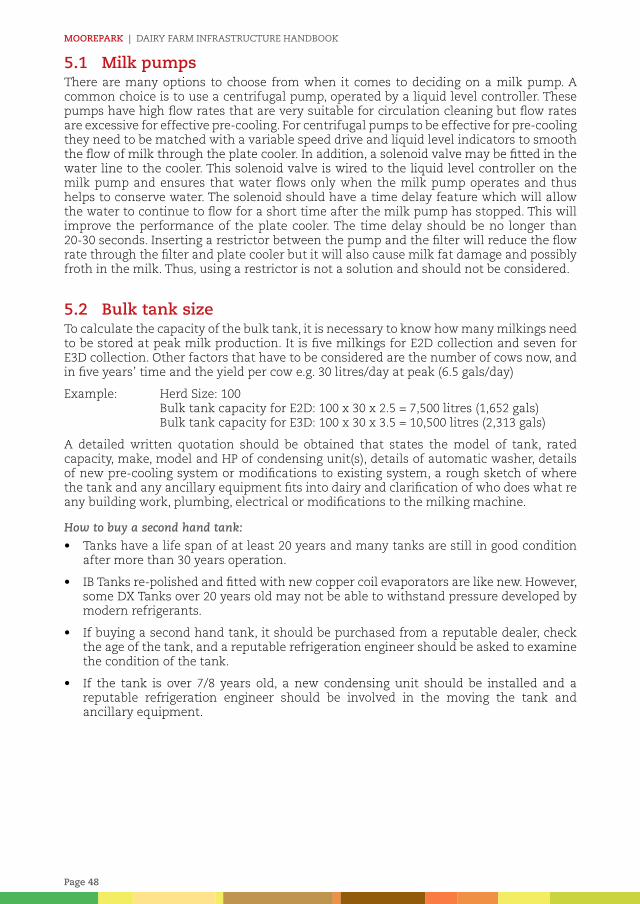
Moorepark | Dairy farm infrastructure hanDbook
Page 48
5.1 Milk pumpsThere are many options to choose from when it comes to deciding on a milk pump. A common choice is to use a centrifugal pump, operated by a liquid level controller. These pumps have high flow rates that are very suitable for circulation cleaning but flow rates are excessive for effective pre-cooling. For centrifugal pumps to be effective for pre-cooling they need to be matched with a variable speed drive and liquid level indicators to smooth the flow of milk through the plate cooler. In addition, a solenoid valve may be fitted in the water line to the cooler. This solenoid valve is wired to the liquid level controller on the milk pump and ensures that water flows only when the milk pump operates and thus helps to conserve water. The solenoid should have a time delay feature which will allow the water to continue to flow for a short time after the milk pump has stopped. This will improve the performance of the plate cooler. The time delay should be no longer than 20-30 seconds. Inserting a restrictor between the pump and the filter will reduce the flow rate through the filter and plate cooler but it will also cause milk fat damage and possibly froth in the milk. Thus, using a restrictor is not a solution and should not be considered.
5.2 Bulk tank sizeTo calculate the capacity of the bulk tank, it is necessary to know how many milkings need to be stored at peak milk production. It is five milkings for E2D collection and seven for E3D collection. Other factors that have to be considered are the number of cows now, and in five years’ time and the yield per cow e.g. 30 litres/day at peak (6.5 gals/day)
Example: Herd Size: 100 Bulk tank capacity for E2D: 100 x 30 x 2.5 = 7,500 litres (1,652 gals) Bulk tank capacity for E3D: 100 x 30 x 3.5 = 10,500 litres (2,313 gals)
A detailed written quotation should be obtained that states the model of tank, rated capacity, make, model and HP of condensing unit(s), details of automatic washer, details of new pre-cooling system or modifications to existing system, a rough sketch of where the tank and any ancillary equipment fits into dairy and clarification of who does what re any building work, plumbing, electrical or modifications to the milking machine.
How to buy a second hand tank:
• Tanks have a life span of at least 20 years and many tanks are still in good condition after more than 30 years operation.
• IB Tanks re-polished and fitted with new copper coil evaporators are like new. However, some DX Tanks over 20 years old may not be able to withstand pressure developed by modern refrigerants.
• If buying a second hand tank, it should be purchased from a reputable dealer, check the age of the tank, and a reputable refrigeration engineer should be asked to examine the condition of the tank.
• If the tank is over 7/8 years old, a new condensing unit should be installed and a reputable refrigeration engineer should be involved in the moving the tank and ancillary equipment.

Page 49
6. Energy and water use efficiency on dairy farms
6.1 Dairy Energy CostsThe average cost of electricity usage on Irish dairy farms is €5 per 1,000 litres milk produced. But there is a large variation in that figure – from €2.60 to €8.70 per 1,000 litres produced, or from €15 to €45 per cow per year. These figures suggest that there is potential for many farmers to reduce their electricity usage by making some changes to how they produce milk. Teagasc estimates that the average farm could save €1,800 per year through altered management strategies and the use of energy efficient technologies. These costs exclude VAT and network charges. The main drivers of energy consumption on dairy farms are milk cooling (31%), the milking machine (20%) and water heating (23%), see Figure 1.
Key Point Night Rate electricity Vs Day Rate electricity
• Night rate is charged at €0.08 per kWh while day rate is charged at €0.16 per kWh, exact costs vary by the electricity supplier.
• Checking your pricing and tariff structure against the best available rates can also yield significant savings. The cheapest supplier could be 20% less than the most expensive one.
• This can be done using a pricing comparison website such as www.bonkers.ie. All you need is information about your present tariff, annual usage and night rate usage in order to make comparisons and calculate possible savings. If you decide to switch suppliers it is important to read the small print. Check the standing charges and termination charges.
• It is strongly recommended to use night rate electricity as much as possible.
• Night rate hours are from 11pm to 8am during winter time and 12 midnight to 9 am for summer time.
• Where appliances are required to operate during night rate hours, i.e. electrical water heaters, digital time clocks with battery backup should be used.
• Analogue timers without battery back-up will become out of sync in power failures.
• Note: There is no charge from ESB networks to install a night rate meter. The meter standing charges increase from approx. €0.46 per day to €0.60 per day after moving to night rate electricity. This means that a minimum of 1.5 units of electricity would need to be used each night to offset the extra charges.
• A typical dairy water heater uses approx. 1.5 units of electricity per hour and takes about six hours to reach full temperature.

Moorepark | Dairy farm infrastructure hanDbook
Page 50
Figure 1. Shows the average component consumption on 60 commercial dairy farms
6.2 Calculate your energy costsA simple calculation can be made to approximate on-farm electricity costs. Firstly add up the total electricity charges over a year excluding standing charges, VAT and PSO levy, these figures can be found on the electricity bill. Multiply by 100 to convert from euro to cents. Next add up the total number of litres of milk sold to the processor over the same period. Dividing the electricity cost in cents by the number litres will give the cost in cent per litre. The average three bedroom house in Ireland uses approximately 5,000 units of electricity per year, this can be deducted to account for domestic usage if the dwelling house is on the same meter as the farm.
6.2.1 Water heating
Introduction
• An adequate and reliable supply of hot water is an essential element in the production of high quality milk on any dairy farm.
• Every farmer should have their water tested for hardness. A water softener should be installed in areas of hard water.
• Indicative running costs per 100 litres of water at 80 degrees are:
» Day rate electricity €2.00.
» Night rate electricity €1.00.
» Oil fired system €0.65 (heating oil at €0.62 per litre on 24/04/2017).
Key risks
• Failure to have adequate supplies of hot water at required temperatures can lead to rapid increases in bacterial contamination and subsequent reduction in milk quality.
• Build-up of limescale in water heating systems will shorten life and increase running costs.
Key points
• All hot water pipes and hot water storage tanks should be heavily insulated.
• Electrical water heating systems should be operated on night rate electricity only.
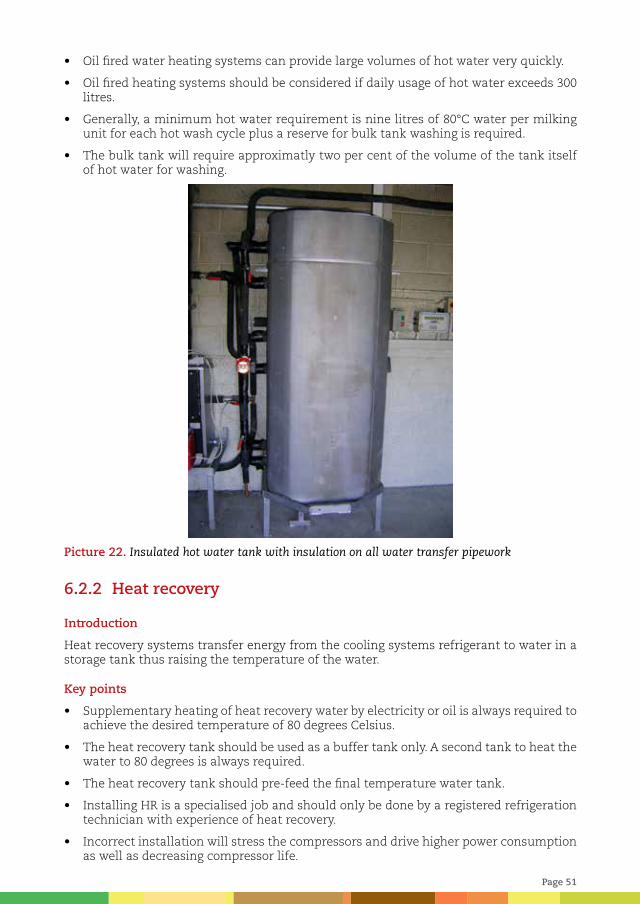
Page 51
• Oil fired water heating systems can provide large volumes of hot water very quickly.
• Oil fired heating systems should be considered if daily usage of hot water exceeds 300 litres.
• Generally, a minimum hot water requirement is nine litres of 80°C water per milking unit for each hot wash cycle plus a reserve for bulk tank washing is required.
• The bulk tank will require approximatly two per cent of the volume of the tank itself of hot water for washing.
Picture 22. Insulated hot water tank with insulation on all water transfer pipework
6.2.2 Heat recovery
Introduction
Heat recovery systems transfer energy from the cooling systems refrigerant to water in a storage tank thus raising the temperature of the water.
Key points
• Supplementary heating of heat recovery water by electricity or oil is always required to achieve the desired temperature of 80 degrees Celsius.
• The heat recovery tank should be used as a buffer tank only. A second tank to heat the water to 80 degrees is always required.
• The heat recovery tank should pre-feed the final temperature water tank.
• Installing HR is a specialised job and should only be done by a registered refrigeration technician with experience of heat recovery.
• Incorrect installation will stress the compressors and drive higher power consumption as well as decreasing compressor life.

Moorepark | Dairy farm infrastructure hanDbook
Page 52
Key risks
• Installation of a HR system by anyone other than the original manufacturer/commissioner of the system will almost certainly void the warranty.
• Many older cooling systems still operate on old refrigerant R12 or similar, this is now no longer available. Upgrading an old system to heat recovery involves changing to new 404A refrigerant which is expensive as is not recommended. When installed by a qualified refrigeration engineer as part of a new cooling system upgrade it is much safer.
• A guarantee should be sought for all heat recovery installations.
6.2.3 Dairy lighting
Introduction
Moisture resistant double fluorescents or high bay metal halide lamps are the most common types of lighting used on Irish dairy farms. Similar size dairies using metal halide lights can use over three times more electricity on lighting than a farm using fluorescent type lights.
Key risks
• Modern fluorescent tube fittings tend to interfere with milking parlours automatic cow identification systems, reducing the effective distance from the cows’ ear tag to the antenna.
• The underlying reason for this is the use of high frequency switching ballasts within the light fittings themselves. These ballasts give out high frequency nuisance signals which interfere with the automatic identification antenna.
Key Points
• Switch start or magnetic ballast fluorescent tubes (double five foot T8 58 W switch start) fluorescent tube are still commercially available and where automatic identification systems are installed these lights are the best option.
• Where automatic cow identification is not installed T5 high efficiency fluorescent tubes (double five foot 58 W T5) are the best option.
• Low pressure sodium (LPS) lights are the most efficient solution for lighting external areas where colour perception is not a priority.
6.2.4 Vacuum pumps
Introduction
International and Irish Milk Quality Co-operative Society (IMQCS) standards are a basis for installing a new milking machine.
New revisions of these standards were introduced in 1989, 2004 and 2008. One of the changes that has been implemented over the years was an increase in recommended vacuum pump capacity for a given size of milking machine for example in 1989 the recommended vacuum pump capacity was 1400 l/min for a 20 unit milking machine. In 2008 the recommendation was 2422 l/min. This is because modern milking machines require a large vacuum reserve for washing due to large milk-line bores.

Page 53
Key goals
• During milking the plant consumption is a fraction of the vacuum pump capacity resulting in large amounts of air being drawn in through the regulator.
• Addition of a variable speed drive (VSD) to the vacuum pumps of these large modern milking machines can result in savings of over 60% on vacuum pump running costs which would be a saving of €410 per year for the average 100 cow farm.
• The VSD is able to adjust the rate of air removal from the milking system by changing the speed of the vacuum pump motor to equal the rate air is admitted to the system at a given vacuum level. All of the energy used to move air through the conventional vacuum regulator is saved.
6.3 Water use on dairy farms • Water meters were installed on 25 Irish commercial farms and monitored for a 12
month period.
• The average volume of water consumed per litre of milk produced was 6.4 litres.
• Consumption by livestock and other miscellaneous use accounted for two thirds of water use on the farms.
• The second largest use of water was the plate cooler (1.69 L/L).
• Efficient recycling strategies for this plate cooler water will be important in reducing direct water use while maintaining energy efficiency. Plate cooler water can be collected and reused for wash-down procedures and animal drinking water (provided the bacterial load of the source is low).
• Maintenance of water systems was identified as a key aspect in efficient water use. Leaks can add to the pumping cost of water, with leaks of 10 L/min costing up to €526 per annum in pumping costs.
• A hot water leak of 60 mL/min (1 drip/sec) could cost up to €240 per annum in associated pumping and heating costs.
Table 16. On-farm water use on 25 commercial dairy farms
(L/L)a (range)
Specific water useSupply 6.40 (1.16 – 12.01)
Livestock & miscellaneous 4.38 (1.18 - 9.51)
Parlour 2.02 (0.2 - 4.59)
Within parlourb
Plate cooler 1.69 (0.0 - 4.36)
Water heater 0.17 (0.0 - 0.42)
Wash-down 1.28 (0.2 - 3.02)a Litres of water / Litres of milk; b∑ parlour processes ≠ parlour, due to the reuse of water within the parlour network (i.e. recycling plate cooler water)
6.4 Strategies to reduce energy use in milking facilitiesTo examine potential strategies to reduce electricity consumption and costs, we used a model for simulating electricity consumption and associated costs and profitability of dairy farms. The main inputs to the model were milk production, number of cows and capacity of the milk cooling, milking machine, water heating, lighting and water pump systems, the winter housing facilities as well as details of the management of the farm
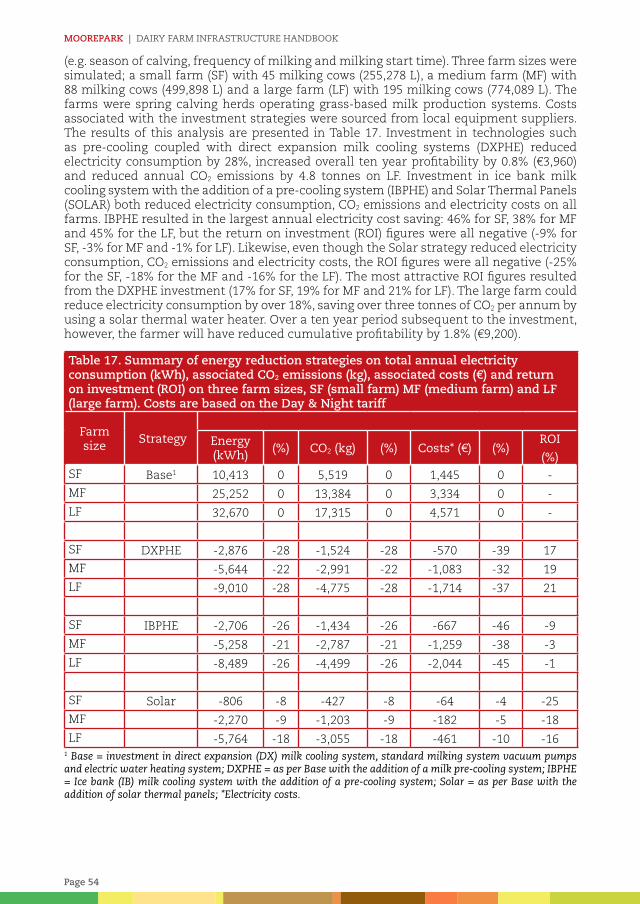
Moorepark | Dairy farm infrastructure hanDbook
Page 54
(e.g. season of calving, frequency of milking and milking start time). Three farm sizes were simulated; a small farm (SF) with 45 milking cows (255,278 L), a medium farm (MF) with 88 milking cows (499,898 L) and a large farm (LF) with 195 milking cows (774,089 L). The farms were spring calving herds operating grass-based milk production systems. Costs associated with the investment strategies were sourced from local equipment suppliers. The results of this analysis are presented in Table 17. Investment in technologies such as pre-cooling coupled with direct expansion milk cooling systems (DXPHE) reduced electricity consumption by 28%, increased overall ten year profitability by 0.8% (€3,960) and reduced annual CO2 emissions by 4.8 tonnes on LF. Investment in ice bank milk cooling system with the addition of a pre-cooling system (IBPHE) and Solar Thermal Panels (SOLAR) both reduced electricity consumption, CO2 emissions and electricity costs on all farms. IBPHE resulted in the largest annual electricity cost saving: 46% for SF, 38% for MF and 45% for the LF, but the return on investment (ROI) figures were all negative (-9% for SF, -3% for MF and -1% for LF). Likewise, even though the Solar strategy reduced electricity consumption, CO2 emissions and electricity costs, the ROI figures were all negative (-25% for the SF, -18% for the MF and -16% for the LF). The most attractive ROI figures resulted from the DXPHE investment (17% for SF, 19% for MF and 21% for LF). The large farm could reduce electricity consumption by over 18%, saving over three tonnes of CO2 per annum by using a solar thermal water heater. Over a ten year period subsequent to the investment, however, the farmer will have reduced cumulative profitability by 1.8% (€9,200).
Table 17. Summary of energy reduction strategies on total annual electricity consumption (kWh), associated CO2 emissions (kg), associated costs (€) and return on investment (ROI) on three farm sizes, SF (small farm) MF (medium farm) and LF (large farm). Costs are based on the Day & Night tariff
Farm size
Strategy
Energy (kWh)
(%) CO2 (kg) (%) Costs* (€) (%)ROI
(%)SF Base1 10,413 0 5,519 0 1,445 0 -
MF 25,252 0 13,384 0 3,334 0 -
LF 32,670 0 17,315 0 4,571 0 -
SF DXPHE -2,876 -28 -1,524 -28 -570 -39 17
MF -5,644 -22 -2,991 -22 -1,083 -32 19
LF -9,010 -28 -4,775 -28 -1,714 -37 21
SF IBPHE -2,706 -26 -1,434 -26 -667 -46 -9
MF -5,258 -21 -2,787 -21 -1,259 -38 -3
LF -8,489 -26 -4,499 -26 -2,044 -45 -1
SF Solar -806 -8 -427 -8 -64 -4 -25
MF -2,270 -9 -1,203 -9 -182 -5 -18
LF -5,764 -18 -3,055 -18 -461 -10 -161 Base = investment in direct expansion (DX) milk cooling system, standard milking system vacuum pumps and electric water heating system; DXPHE = as per Base with the addition of a milk pre-cooling system; IBPHE = Ice bank (IB) milk cooling system with the addition of a pre-cooling system; Solar = as per Base with the addition of solar thermal panels; *Electricity costs.

Page 55
Summary
Of the options studied, the most profitable technology investment strategy consisted of a direct expansion milk cooling system with pre-cooling of milk to 15°C before entry to the milk storage tank and heating water with an electrical water heating system. Ice bank milk cooling systems can reduce electricity consumption by 45% on a large farm with about 195 cows without delivering a positive return on investment in the ten year period subsequent to the investment.
6.5 Milking parlour power requirementsOne important aspect of expanding an existing milking parlour, or building a new facility is the power demand that will be required to run all the necessary components, without overloading the maximum import capacity (MIC) of the ESB networks transformer fitted to the farm. Exceeding the MIC can result in the main fuse fitted at the electricity supply meter blowing, which is extremely disruptive as this is most likely to happen during milking. Working in collaboration with an electrician, the milking equipment supplier and the ESB networks to ensure an adequate transformer is fitted prior to equipment installation will avoid unforeseen time delays due to electrical power demand shortages, allow at least three months for this process.
Table 18 shows the total current demand that would be required for four different facility sizes. These are approximate and represent a worst case scenario where all equipment runs together. Many farms are using a 16 kVA transformer which would allow for a current demand of 70 amps, this would be inadequate for all sizes of facility presented in Table 18. However, if the water heater is synced with night rate hours, and the scrapers are not operated during milking, then the current demand for the 10 unit would drop to 50 amps, allowing safe operation on a 16 kVA supply (see Table 19).
Table 18. Approximate current draw (amps) for dairy farms with different size milking parlours operating on a single phase supply (230V)Unit Number1 10 16 24 30Vacuum (A) 17 26 35 35Cooling (A) 22 30 43 61Heating (A) 13 26 26 39Lighting (A) 5 8 13 15Scrapers (A) 13 13 26 39Air compressor (A) 4 7 9 11Milk pump (A) 4 4 9 9Water pump (A) 7 7 9 13Total2 85 121 169 222
1Number of units in the milking machine2Total represents a worst case scenario where all listed items operate simultaneously
Table 19. Commonly available transformer size along with commonly fitted fuse sizesTransformer Size (kVA) 12 16 20 29 33Fuse Size (A) 50 70 90 125 140
Similarly on first inspection, the 24 unit facility exceed the maximum allowable current draw for all single phase supplies, however if the water heating and scraping loads are not operated during milking times then the 24 unit facility could be safely operated on a 33 kVA single phase supply. The 30 unit facility however will struggle to operate on a single phase supply without major risk of exceeding the MIC. It is advised to opt for a three phase supply for installations greater than 24-units, however in some circumstances this is not possible due to prohibitively high installation costs for three phase. In this case, oil

Moorepark | Dairy farm infrastructure hanDbook
Page 56
or gas water heating, variable speed vacuum pumps and an ice bank milk cooling system timed to use night rate electricity would need to be explored to keep the MIC below the maximum allowable limit.
In general three phase power installation is only cost effective if the lines are within 500 m of the farmyard, where installation costs range from between €4,000 and €10,000 depending the amount of work needed. Beyond these distances, quotes are available from ESB networks on a per meter basis. It is a much easier process to upgrade the transformer to a higher single phase MIC transformer than to install three phase in most circumstances. To apply for an upgraded transformer, contact ESB networks to fill in the necessary forms. The cost ranges from €2,000 to €4,000.

Page 57
7. Land drainage design and installationApproximately 49.5% (3.4 million ha) of the total land area of Ireland is classified as “marginal land” which is affected by natural limitations related to its soil, topography, relief and climate. The major limitation of this marginal land is its poor drainage status and much is in need of artificial drainage if its productivity is to be improved. In wet years poorly drained soils may never dry out as persistent rainfall maintains high soil moisture contents. Grass yields are limited due to the adverse effect of excess water and a lack of air at rooting depth, which limits plant respiration and growth. In cases of prolonged waterlogging, plants will eventually die due to a lack of oxygen in the root zone. Furthermore, waterlogged soils are impassable to agricultural traffic (both machinery and livestock) for long periods, due to high soil moisture content and reduced soil strength. This reduces the number of grazing days and hinders silage harvesting, thus introducing higher costs related to imported feedstuffs.
The purpose of land drainage is to remove excess water from the soil as quickly as possible. How best to achieve this will vary with soil type. There is a need therefore, for a better understanding of the underlying causes of drainage problems and of the design and implementation of appropriate drainage systems to resolve these problems. We must move away from the short-sighted approach that a broadly similar drainage system can be installed in every wet field regardless of soil and site conditions. An assessment of soil type and its drainage status is a vital first step.
• No drainage work should be carried out before the drainage characteristics of the soil are established by a site and soil test pit investigation.
• Two types of drainage system exist: a groundwater drainage system and a shallow drainage system. The design of the system depends entirely on the drainage characteristics of the soil.
• Distinguishing between the two types of drainage systems essentially comes down to whether or not a permeable layer is present (at a workable depth) that will allow the flow of water with relative ease. If such a layer is evident a piped drain system is likely to be effective, at this depth. If no such layer is found during soil test pit investigations, it will be necessary to improve the drainage capacity of the soil. This involves a disruption technique such as moling, gravel moling or subsoiling in tandem with collector drains.
• Drains are not effective unless they are placed in a permeable soil layer or complimentary measures (mole drainage, subsoiling) are used to improve soil drainage capacity. If water isn’t moving through the soil in one or other of these two ways, the watertable will not be lowered.
• Drain pipes should always be used for drains longer than 30 m. If these get blocked it is a drainage stone and not a drainage pipe issue.
• Drainage stone should not be filled to the top of the field trench except for very limited conditions (the bottom of an obvious hollow). Otherwise it is an expensive way of collecting little water.
• Most of the stone being used for land drainage today is too big. Clean aggregate in the 10–40 mm (0.4 to 1.5 inch approx.) grading band should be used. Generally you get what you pay for.
• Subsoiling is not effective unless a shallow impermeable layer is being broken or field drains have been installed prior to the operation. Otherwise it will not have any long-term effect and may do more harm than good.
• Maintenance or re-instatement of outfalls and open drains are great ways to kick start a drainage project. Most land drainage systems are poorly maintained. Open drains should be clean and as deep as possible and field drains feeding into them should be regularly rodded or jetted.

Moorepark | Dairy farm infrastructure hanDbook
Page 58
7.1 Causes of impeded drainageThe difficulties of drainage problems in Ireland are largely due to our complex geological and glacial history. Soil layers of varying texture and composition have the effect of irregularly distributing groundwater flow, with fine textured soils acting as a barrier to movement, impeding drainage, and lenses of gravels and sands promoting water flow, transmitting groundwater over large areas with resulting seepages and springs on lower ground. In poorly drained soils the rate of water infiltration at the soil surface is regularly exceeded by the rainfall rate due to:
• Low permeability in the subsoil (or a layer of the subsoil).
• High watertable due to low lying position and poor/poorly-maintained outfall.
• Upward movement of water from seepage and springs.
Objectives of land drainage
To achieve effective drainage the works will have to solve one or more of these problems. The objective of any form of land drainage is to lower the watertable providing suitable conditions for grass growth and utilization. A controlled watertable promotes deeper rooting which improves productivity and improves load-bearing capacity of the soil.
When planning any drainage programme, the potential of the land to be drained needs to be first assessed to determine if the costs incurred will result in an economic return through additional yield and/or utilisation. Some thought is needed in deciding the most appropriate part of the farm to drain. From a management point of view it is better to drain that land which is nearer to the farmyard and work outwards, however it may be more beneficial to target areas with high potential for improvement. This ensures a better return on the investment.
7.2 Drainage investigationsWhat exactly is the problem? How good is the existing drainage network (if any)? Is the whole profile made up of poor soils or is the problem caused by specific layers? Is there water movement at any depth?
Knowledge of previous drainage schemes in the area, and their effectiveness will often provide an insight. A number (approx. 1 per ha) of test pits (at least 2.5 m deep) should be excavated within the area to be drained to investigate. These are dug in areas that are representative of the area as a whole; consider digging in wet and dry areas for comparison sake. As the test pits are dug, the faces of the pits are observed, soil type should be established and the rate and depth of water seepage into the test pit (if any) recorded. Visible cracking, areas of looser soil and rooting depth should be noted as these can convey important information regarding the drainage status of the different layers. The depth and type of the drain to be installed will depend on the interpretation of the characteristics revealed by the test pits.
Two principle types of drainage system are distinguished:
• Groundwater drainage system: A network of piped drains exploiting permeable layers.
• Shallow drainage system: Where movement of water is impeded at all depths.
Groundwater drainage system
Strong inflow of groundwater or seepage from the faces of test pit walls, indicate that layers of high permeability are present. Under these circumstances the use of a piped drainage system (at the depth of inflow) is advised to capture and remove this water, thereby controlling the watertable. Deep piped drains are usually installed at a depth of 1.5-2.5 m and at spacings of 15–50 m, depending on the slope of the land and the

Page 59
permeability and thickness of the drainage layer. Piped drains should always be installed across the slope to intercept as much groundwater as possible, with open drains and main piped drains running in the direction of maximum slope. Where groundwater seepage and springs are identified, deep drains, 2 to 4 m deep can be used to intercept flow. Pipe drains are most effective in the layer transmitting groundwater flow, characterised by high water breakthrough. This issue is very site specific.
Clean aggregate, in the 10 – 40 mm grading band, should to be used to surround the drain pipe. The gravel should be filled to a minimum depth of 300 mm from the bottom of the drain to cover the pipe. The stone should provide connectivity to a layer of high permeability and should not be filled to the ground surface. The purpose of a drain pipe is to facilitate a path of least resistance for water flow. In long drain lengths (greater than 30 m) a drain pipe is vital to allow a high a flow-rate as possible from the drain, stone backfill alone is unlikely to have sufficient flow capacity to cater for the water volume collected.
Picture 23. Test pit excavation

Moorepark | Dairy farm infrastructure hanDbook
Page 60
Picture 24. Drainage trench excavation
Shallow drainage systems
Where a test pit shows no inflow of groundwater at any depth a shallow drainage system is required. These soils with very low permeability throughout are more difficult to drain. Shallow drainage systems aim to improve the capacity of the soil to transmit water by fracturing and cracking the soil. They rely on soil disruption techniques, namely; mole and gravel mole drainage and sub-soiling.
Mole drainage is suited to stone-free soils with a high clay content which form stable channels. Mole drains are formed with a mole plough comprised of a torpedo-like cylindrical foot attached to a narrow leg, followed by a slightly larger diameter cylindrical expander. The foot and trailing expander form the mole channel while the leg creates a narrow slot that extends from the soil surface to the mole channel depth. The mole plough creates both a zone of increased permeability adjacent to the mole leg (shallower depths) and a channel for water flow at moling depth. The effectiveness of mole drainage will depend on the extent soil cracking during installation. As such the ideal time for carrying out mole drainage is during dry summer conditions, to allow for maximum cracking in the upper soil layers and adequate traction to prevent wheel-spin on the surface.
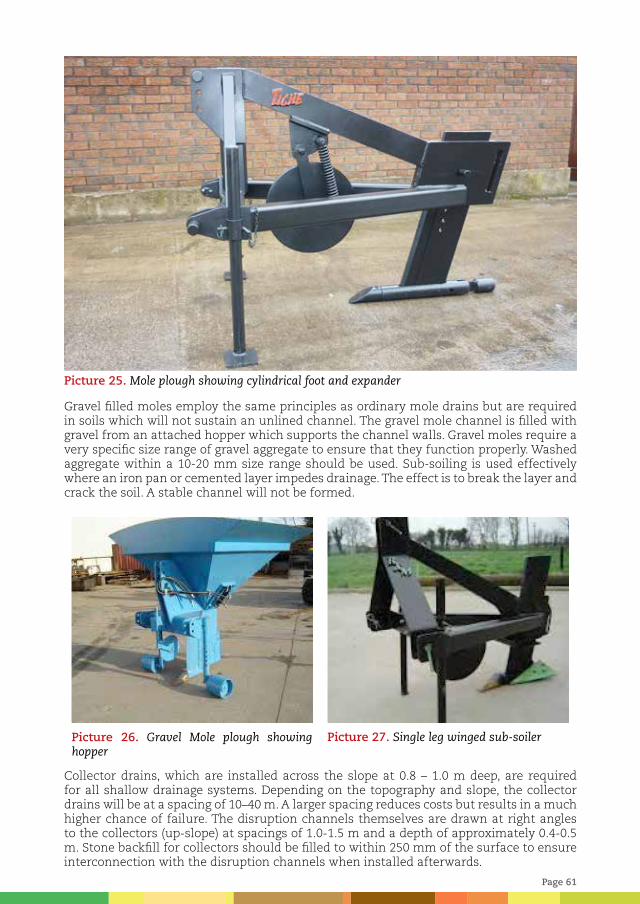
Page 61
Picture 25. Mole plough showing cylindrical foot and expander
Gravel filled moles employ the same principles as ordinary mole drains but are required in soils which will not sustain an unlined channel. The gravel mole channel is filled with gravel from an attached hopper which supports the channel walls. Gravel moles require a very specific size range of gravel aggregate to ensure that they function properly. Washed aggregate within a 10-20 mm size range should be used. Sub-soiling is used effectively where an iron pan or cemented layer impedes drainage. The effect is to break the layer and crack the soil. A stable channel will not be formed.
Picture 26. Gravel Mole plough showing hopper
Picture 27. Single leg winged sub-soiler
Collector drains, which are installed across the slope at 0.8 – 1.0 m deep, are required for all shallow drainage systems. Depending on the topography and slope, the collector drains will be at a spacing of 10–40 m. A larger spacing reduces costs but results in a much higher chance of failure. The disruption channels themselves are drawn at right angles to the collectors (up-slope) at spacings of 1.0-1.5 m and a depth of approximately 0.4-0.5 m. Stone backfill for collectors should be filled to within 250 mm of the surface to ensure interconnection with the disruption channels when installed afterwards.

Moorepark | Dairy farm infrastructure hanDbook
Page 62
Outfalls/maintenance
Every drainage scheme is only as good as its outfall. Cleaning and upgrading of open drains acting as outfalls from land drains is an important step in any drainage scheme. Before commencing land drainage the proposed outfall should be assessed and where necessary upgraded. Open drains, running in the direction of maximum slope, should be established to a great a depth as possible. Spoil from such works, where suitable, can be spread over the adjoining land filling depressions and should not impede surface runoff to the watercourse. Unsuitable spoil should be buried and covered with topsoil or removed to waste ground.
When a drainage scheme has been completed, the layout should be drawn and noted on a farm map. This map can then be used as a guide when maintaining the works, as well as a record of the works. Land drain outlets should be regularly cleaned and maintained especially if open drains are cleaned/upgraded as this will result in blockages at the drain outlets. The use of a concrete or un-perforated plastic pipe over the end of the drain pipe, minimum one metre in length, will protect the outlet from damage and will make locating and maintaining it easier.
7.3 Indicative costsThe cost of drainage works will vary depending on such factors as soil type, site access, extent of open drains, availability/cost of backfill stone, and experience with drainage works among other factors. As such, costs are quite variable and will be specific to a particular job. Table 19 provides guidelines only. Cost for the provision of open drains is not included.
Table 19 covers as far as possible the general arrangements available. Where a shallow drainage system is considered the price will depend largely on the collector drains required. If an existing drainage system of closely spaced piped drains is already in place at the appropriate depth it may be possible to pull mole drains through this existing network or from an existing open drains. In this case the cost of mole drainage can be very cost effective. Where a collector system needs to be installed the total cost will be higher.
It is of the utmost importance that the selection of a drainage system for a particular site is not decided on the basis of cost. Alternatively an effective drainage system should be designed and costed and then a decision made as to whether or not to proceed. It is important to remember that the closer the drain spacing the higher the cost.
Table 20. Approximate costs of drainage systems
Drainage systemDrain
spacing (m)
Depth (m)
Cost/m (€)
Cost/acre (€)
Cost/hectare (€)
Groundwater drainage systemGroundwater drainage 15 - 50 1.0 - 2.5 7-9 600-2400 1400-6000Shallow drainage systemMole drainage 1 - 1.5 0.45 - 0.6 - 50-100 125-250Gravel mole drainage 1 – 2.0 0.35 - 0.5 - 500-1000 1250-2500Collector drains 20 0.75- 1.0 5-7 1000-1400 2500-3500Collector drains 40 0.75- 1.0 5-7 500-700 1200-1700Collector drains 60 0.75- 1.0 5-7 350-450 800-1150

Page 63
More in-depth Information
Land Drainage Booklet
A freely downloadable practical guidebook to land drainage is available via the Teagasc website, www.teagasc.ie/publications . Search “Land Drainage”
Land Drainage Manual
The Teagasc Manual on Drainage - and Soil Management is available from Teagasc offices or can be ordered via the Teagasc website, www.teagasc.ie/publications . Search “Teagasc Manuals”
Picture 28. Teagasc Manual on Drainage – and Soil Management

Moorepark | Dairy farm infrastructure hanDbook
Page 64
8. Importance of biodiversity on dairy farms
Centuries of agriculture have helped shape the Irish landscape and the wildlife (biodiversity) it contains. Many of our best known farmland plants and animals are dependent on agricultural practices, and changes in these practices in turn affect farmland ecology. Intensification of agriculture over recent decades has resulted in a decline of biodiversity within agricultural systems. Whilst there is a need to increase production to cope with increasing food demands, the environment and ecosystem services it provides need not be compromise. Emerging research and policy agendas are now based on sustainable management of agricultural land.
Grass-based farming systems in Ireland are well positioned in terms of the wildlife they support within the landscape. It is estimated that natural and semi-natural habitats make up 12-14% area of grassland farms. The amount of wildlife habitats is highest on more extensively managed farmland, resulting in most focus to date being centred on sustaining and enhancing biodiversity within these more-extensive systems. However, intensively-managed dairy systems can also play an important role in halting the decline of farmland biodiversity. Objectives of the Food Harvest 2020 and FoodWise 2025 reports include the pressing need for the development of effective methods for biodiversity conservation, as part of the development of sustainable production systems in both intensive and extensive systems. Incorporation of such measures could provide a very important and much overlooked branding and marketing opportunity to Irish farmers and retailers in terms of capitalising on Ireland’s ‘clean, green’ image.
8.1 Measures to enhance biodiversity on dairy farmsIntensively-managed dairy systems do not typically support the same abundance or quality of habitats and wildlife as more extensive systems. However, appropriately-designed wildlife measures, targeted for intensive dairy systems, could play an important role in halting the decline of biodiversity and achieving the goals of sustainable expansion. Such measures can also play an important role in delivering on other environmental goals such as improving water quality and reducing greenhouse gas emissions.
Maintain and manage existing habitats
It is important to optimise the biodiversity value of existing farmland habitats before new biodiversity measures are established on dairy farms. It is typically more effective to retain existing habitats rather than establishing new ones. Existing habitats, including woodland plots, ponds and wetlands should be protected from more intensive agricultural management. These areas should be appropriately managed and avoided when sites are being selected for ‘new’ biodiversity initiatives. Many of these semi-natural habitats benefit from farm management that prevent the area from scrubbing over (e.g. light grazing of woodland plots (Picture 29) in spring and autumn can help improve the quality of the area thus benefitting a variety of species).
Hedgerow management
Appropriately managed hedgerows can have multiple benefits, including providing shelter for stock and improving biosecurity; intercepting overland flow and improving water quality; sequestering carbon; and acting as a refuge for biodiversity. Ensure that appropriate management is undertaken outside the closed period from March 1st to August 31st.
• Leave occasional trees or bushes to mature. Mature trees and bushes provide greater feeding and nesting habitats for birds, pollinators and a variety of insects.
Page 65
• The sides of hedges should be trimmed, with the top allowed to grow taller. This approach provides greater shelter and stock-proofing for animals, but also improves the diversity of habitats for wildlife.
• Replant escaped or ‘gappy’ hedgerows with native species (e.g. hawthorn). Native species support a greater abundance and diversity than non-native species.
Watercourses and buffer strips
Riparian buffer strips are strips of permanent vegetation adjacent to rivers and streams that are typically excluded from intensive farming practices. Appropriately managed buffer strips play an important role in maintaining water quality, ensuring bank stability, providing a habitat for biodiversity and acting as a wildlife corridor. To optimally manage these strips:
• Avoid nutrient (fertiliser or slurry) or herbicide application in the buffer strip.
• Allow vegetation in the strip to develop, but avoid the strips becoming dominated by scrub. Periodic cutting or grazing can improve the buffering capacity and habitat quality of the strip.
• Instream work should be targeted from July to September to avoid disruption to spawning fish. When cleaning the channel-bed, the spoil should be deposited away from the buffer strip.
Establish new habitats
New biodiversity measures play an important ecological role where there is a lack of existing habitats. New measures could be targeted to less productive areas of the farm.
• The banks of a cattle underpass could be sown with grass and wildflower mixes (see Picture 30). This measure helps stabilise the banks, prevents undesirable plant species from encroaching into the field, and also provides a habitat for plants and animals.
• Awkward field corners could be left uncut following silage removal. This temporary measure provides food and cover for a variety of species such as farmland birds and small mammals. Corners could be grazed-off when animals are re-introduced to the field.
8.2 GLAS measures
Bird and bat boxes
Populations of farmland birds and bats are declining and efforts should be undertaken to enhance their populations.
• Avoid interfering with existing bird nests or bat colonies.
• Erect boxes for bats and birds on suitable trees and buildings.
Wild Bird Cover
Wild Bird Cover (a spring-grown mixture of cereals that is not harvested) could be sown on dairy farms, thus providing winter food and cover for declining farmland birds. Mixtures include a cereal (oats or triticale) and oilseed rape, linseed or mustard. The measure is part of the Green Low Carbon Agri-environment Scheme (GLAS).
Summary
• Wildlife measures designed and targeted for intensive dairy systems can play an important role in halting the decline of biodiversity and achieving the goals of sustainable expansion.

Moorepark | Dairy farm infrastructure hanDbook
Page 66
• The quality of existing farmland habitats should be maintained or enhanced before new biodiversity measures are established.
• New biodiversity measures could be targeted to less-productive areas of the farm.
Additional information https://www.teagasc.ie/environment/biodiversity-countryside/
Picture 29. Light grazing of woodland plots in spring and autumn prevents scrub encroachment thus benefitting a variety of species
Picture 30. Planting banks with grass and wildflower mixes helps stabilise the banks, prevents undesirable plant species from encroaching into the field, and also provides a habitat for plants and animals

Page 67
Notes

Moorepark | Dairy farm infrastructure hanDbook
Page 68

Page 69

Moorepark | Dairy farm infrastructure hanDbook
Page 70

Help for what matters
Help in achieving growth for your farmGet in touch with your local Agri Business Development Manager. Email [email protected]
Ulster Bank Ireland DAC. A private company limited by shares, trading as Ulster Bank, Ulster Bank Group, Banc Uladh and Lombard. Registered in the Republic of Ireland. Registered No. 25766 Registered Office: Ulster Bank Group Centre, George’s Quay, Dublin 2, DO2 VR98. Ulster Bank Ireland DAC is regulated by the Central Bank of Ireland.
Help for what matters
Help for the hands that work with the soilGet in touch with your local Agri Business Development Manager. Email [email protected]
Ulster Bank Ireland DAC. A private company limited by shares, trading as Ulster Bank, Ulster Bank Group, Banc Uladh and Lombard. Registered in the Republic of Ireland. Registered No. 25766 Registered Office: Ulster Bank Group Centre, George’s Quay, Dublin 2, DO2 VR98. Ulster Bank Ireland DAC is regulated by the Central Bank of Ireland.

ISBN: 978-1-84170-636-8