is there a green bond premium in the nordic countries?
TRANSCRIPT

Tommi Hyrkäs
Is there a green bond premium in the Nordic countries?
Vaasa 2021
School of Accounting and Finance Master’s thesis in Finance
Master's Degree Programme in Finance

2
UNIVERSITY OF VAASA School of Accounting and Finance Author: Tommi Hyrkäs Title of the Thesis: Is there a green bond premium in the Nordic countries? Degree: Master of Science in Economics and Business Administration Programme: Master’s Degree Programme in Finance Supervisor: Timo Rothovius Year: 2021 Pages: 58
ABSTRACT:
The thesis concentrates on the yield difference between green bonds and conventional
bonds. We assume, based on previous studies, that there is a negative green bond
premium. We are creating synthetic conventional bonds from two conventional bonds
that are close the green bond in sense of characteristics. We are using the matching
method to build the synthetic bond with some slight adjustments due to data
limitations. Our results state that there is a positive 1.7 basis point green bond
premium.
KEYWORDS: ESG, green bonds, green bond premium, SRI

3
Vaasan yliopisto Laskentatoimen ja rahoituksen yksikkö Tekijä: Tommi Hyrkäs Tutkielman nimi: Is there a green bond premium in the Nordic countries? Tutkinto: Kauppatieteiden maisteri Oppiaine: Rahoituksen maisteriohjelma Työn ohjaaja: Timo Rothovius Vuosi: 2021 Sivumäärä: 58
TIIVISTELMÄ:
Tutkielma keskittyy tuottoerojen tarkasteluun vihreiden ja tavallisten
joukkovelkakirjojen välillä. Oletamme aiempien tutkimusten nojalla, että tuloksena on
negatiivinen vihreiden joukkovelkakirjojen preemio. Luomme synteettisen
joukkovelkakirjan kahdesta tavallisesta joukkovelkakirjasta, jotka ovat lähellä
ominaisuuksiltaan niitä vastaavaa vihreää joukkovelkakirjaa. Käytämme 'matching
methodia' rakentaaksemme synteettisen joukkovelkakirjan pienillä säädöillä johtuen
dataa koskevista rajoituksista. Tulokseksi saamme 1.7 korkopisteen suuruisen vihreän
joukkovelkakirjan positiivisen preemion.
AVAINSANAT: ESG, vihreät joukkovelkakirjat, vihreä joukkovelkakirja preemio, SRI

4
Table of Contents
1 Introduction 8
1.1 Background 8
1.2 Purpose of the study 11
1.3 Research question and hypotheses 12
1.4 Structure of the thesis 12
2 Literature review 13
2.1 Corporate social performance 13
2.2 Green bond premium 14
2.3 Mixed results of the green bond premium 17
3 Data and methodology 27
3.1 Data 27
3.2 Methods 29
4 Experimental methodology 34
4.1 Is there a green bond premium or a green bond discount? 34
4.2 Further tests 42
5 Results 46
5.1 Positive green bond premium 46
5.2 Checking the robustness 47
6 Conclusion 51
References 53

5
Figures
Figure 1. Distribution of the green bonds by issuer type in the Nordics. Adapted from
Danske Bank's data. 28
Figure 2. Amount of issued green bonds by 6/2020. Adapted from Danske Bank's data.
28
Figure 3. "Interpolation and extrapolation of the synthetic conventional bond yield.
This figure shows how we calculate the yield of the synthetic conventional bond
through (a) a linear interpolation or (b) a linear extrapolation of the yields of CB1 and
CB2 at the maturity date of the green bond." Zerbib (2019). 31
Tables Table 1. Descriptive statistics of the bonds in the sample. The table summarizes the 64
green bonds and the two matching conventional bonds qualities. 33
Table 2. Liquidity proxy . is the difference between green bonds' bid-ask
spread and the conventional bonds' distance-weighted average bid-ask spread on a
period of time that has been explained earlier. 35
Table 3. Yield difference . = + β + while being the
error term with fixed effect panel regression. 37
Table 4. Yield difference . = + β + while being the
error term with random effect panel regression. 38
Table 5. Hausman test. Hausman test says that the individual effects correlate with the
explanatory variable and the probability-value is statistically significant at 1 % level.
Thus, we use the fixed effect estimator. 39
Table 6. Yield difference . = + + β
+ while being the error term with fixed effect panel regression.
40

6
Table 7. Yield difference . . =
+ + β + while being the error term with fixed
effect panel regression. 41
Table 8. The estimated green bond premium with a OLS regression. We use dummy
variables that represent the most common variables among our sample. 42
Table 9. The estimated green bond premium with a OLS regression and PCSE. We use
dummy variables that represent the most common variables among our sample. 43
Table 10. The estimated green bond premium with a OLS regression. We use dummy
variables that represent the remaining variables of our sample. 44
Table 11. The estimated green bond premium with a OLS regression and PCSE. We use
dummy variables that represent the remaining variables of our sample. 44
Table 12. The estimated green bond premium in our fixed effect regression: = +
β + while being the error term with fixed effect panel
regression. 46
Table 13. The equation (2) estimated green bond premium with 10-day annualized
volatility and a lagged dependent variable with Beck-Katz robust estimations of the
standard errors. 48
Table 14. The equation (2) estimated green bond premium with 30-day annualized
volatility and a lagged dependent variable with Beck-Katz robust estimations of the
standard errors. 49
Table 15. The equation (2) estimated green bond premium with 10-day annualized
volatility. 50
Table 16. The equation (2) estimated green bond premium with 30-day annualized
volatility. 50

7
Abbreviations CBI Climate Bonds Initiative
CSP Corporate Social Performance
EIB European Investment Bank
ESG Environmental, Social and Corporate Governance
EU HLEG European Union High-Level Group on Sustainable Finance
GBP Green Bond Principles
ICMA International Capital Market Association
OECD Organization for Economic Co-operation and Development
PSM Propensity Score Matching
SRI Socially Responsible Investing

8
1 Introduction
1.1 Background
As Climate Bonds Initiative (2018) (hereinafter "CBI") states green bonds (referred also
climate bonds) are issued to finance climate change solutions. Green bonds are a
rather new security in the market, first green bond was issued in 2007 by the European
Investment Bank (EIB). Green bonds can be issued by governments, banks, local
government or corporations. Private placement, securitization, covered bond, and
sukuk and green loans can be labeled as a green bond if they fulfill the Green Bond
Principles (GBP) or the Green Loan Principles (Climate Bonds Initiative (2018)).
International Capital Market Association (2018) has defined the green bonds in a
following way: "Any type of bond instrument where the proceeds will be exclusively
applied to finance or re-finance, in part or in full, new and/or existing eligible Green
Projects and which are aligned with the four core components of the Green Bond
Principles (GBP)". The aforementioned four core components are:
1. Use of proceeds,
2. Process for Project Evaluation and Selection,
3. Management of Proceeds, and
4. Reporting.
As International Capital Markets Association (2018) describes "the cornerstone of a
green bond is the utilization of the proceeds of the bond for green projects, which
should be appropriately described in the legal documentation for the security. Projects
can be stated to be green, if they advance environmental objectives, such as climate
change mitigation, adaptation, pollution prevention and control. Issuer should also
communicate clearly the sustainability objectives, the net proceeds of the green bond
should be trackable by the issuer in an appropriate manner, and attested to by the
issuer in a formal internal process linked to the issuer’s lending and investment
operations for green projects. Issuers should make, and keep, readily available up to

9
date information on the use of proceeds to be renewed annually until full allocation,
and on a timely basis in case of material developments."
Organization for Economic Co-operation and Development (2017) (hereinafter "OECD")
note that parties agreed in the Paris Agreement to hold the global average
temperature to below 2°C and make efforts to limit the temperature increase to 1.5°C
above pre-industrial levels. The parties also agree to align financial flows with the path
towards low greenhouse gas emissions and climate-resilient development.
Debt finances the most of infrastructure investment. Bond finance is a natural fit for
low-carbon and climate-resilient infrastructure assets; renewable energy infrastructure,
where the upfront capital costs are high and long-dated. Annual issuance of green
bonds rose from 3 billion USD in 2011 to 95 billion USD in 2016 (OECD (2017)). As
earlier stated, there are the GBP and many other green bond definitions but there is no
universal rules and standardization; this is a shared concern among the participants in
the market (OECD (2017)). With generally accepted definitions the effectiveness,
efficiency and integrity of the market would increase.
Green bonds have some benefits in green investing: 1) they add one segment more to
green financing; 2) they add long-term financing by addressing maturity mismatches; 3)
they add the positive reputation of issuers and clarify issuers' environmental strategy; 4)
they can offer cost advantages; 5) they add greenness to traditionally brown segments;
and 6) they add one segment more to responsible and long-term investors (OECD
(2017)).
Why to issue green bonds because the companies could also issue conventional bonds?
Green bonds have to be used to green projects and this itself restricts companies'
investment practices. If the bond is labeled to be a green bond it should be certified by
a third-party and this adds compliance and administrative costs. Companies could issue
conventional bonds and to invest the proceeds to green projects if they would be

10
financially beneficial (Flammer (2018)). Flammer (2018) represents three different
potential explanations why to issue green bonds. "First is that green bond may serve as
a credible signal of the company's commitment towards the environment (signaling
argument). Signal can be valuable because investors do not have enough information
of the company's environmental commitment. Second argument is that the companies
can practice green washing with green bonds. The companies could issue green bonds
even if they would not perform any real actions (greenwashing argument). The third
argument is that if green bond investors are willing to change financial returns for
societal benefits, companies are more willing to issue green bonds because they will
get cheaper financing (cost of capital argument)." Flammer (2018) states that the
evidence speaks on behalf of the first argument.
Hyun et al. (2019) note that green bonds are built in a same way as conventional bonds,
but green bonds are specially used for green projects that are environmentally friendly.
This means that costs are bigger when they are issued. The green bond market is still
very small in size and also in liquidity. The market structure and standards that are
accepted generally are still being created. There is for example documents, which show
that the bonds are green, guarantees and also letter of comforts in order to show the
greenness. These kind of actions of course create additional costs for green bond
issuers. After the issuance the costs are still rather high because green bond issuers
have to create regular reports. These costs can be significant to small and medium-
sized issuers. However, green bonds also help issuers to improve their reputation and
expand their investor base.
As Zerbib (2019) states a report from the European Commission (2016) emphasizes
many barriers to the development of the green bond market; there is no green bond
definition, framework, and transparency. Because of the aforementioned reasons, the
EU High-Level Group on Sustainable Finance (EU HLEG (2018)) make many
recommendations regarding the green bond market in 2018. The creation of a
technical committee responsible for building a sustainable taxonomy and a

11
introduction of an official European standard for green bonds contributing an overt
meaning of these bonds and based on the common taxonomy.
International Capital Market Association (2017) states that there are four different data
providers that cite green bonds that are issued. Zerbib (2019) mentions that Bloomberg
and Climate Bond Initiative strictly require that cited bond have to be aligned with the
GBP. For example Zerbit (2019) and Flammer (2018) use the Bloomberg database.
1.2 Purpose of the study
The purpose of the thesis is find is there a difference between the yields between a
green bond and an otherwise identical conventional bond and how much is this
possible difference in the Nordics. I call the aforementioned difference: the green bond
premium as Zerbib (2019).
The contribution of this thesis is that green bonds are still rather new security in the
market and even if there is already different articles regarding the green bonds the
topic is still rather new and untouched compared to some other finance topics. There is
some articles regarding the green bond premium but not specially handling the Nordics.
The current articles about the green bond premium have found opposite findings and
some have found the premium but some have stated that there is no premium.
Zerbib (2019) and Baker et al. (2018) handle the pricing and is there a discount while
trading green bonds compared to normal bonds. Zerbib (2019) find a negative green
bond premium of 2 basis points, Baker et al. (2018) find a green premium of 6 basis
points and Karpf and Mandel (2018) find a discount in green bonds; they find a positive
yield differential of 8 basis points. However Larcker and Watts (2020) note that the past
studies have ended up in mixed results because they have made methodological design
misspecifications that end up in biased estimates. They state for example that Karpf
and Mandel (2018) use taxable and non-taxable securities and this have caused that
the results indicate the green bond premium. Larcker and Watts (2020) instead use

12
matching methodology while trying to seek whether there is a green bond premium or
not; they seek a quasi-matching normal bond from the same issuer and examine the
possible green bond premium in this way. They have stated that the green bond premi-
um is zero.
1.3 Research question and hypotheses
My research question is whether or not there is a difference between the yields
between a green bond and an otherwise identical conventional bond and how much is
this possible difference in the Nordics. The null hypothesis (H0) states that there is no
green bond premium. The alternative hypothesis (H1) states that there is a green bond
premium.
1.4 Structure of the thesis
This research is structured in a following way. The second section goes through the
existing literature about the topic. The third section goes through the data, fourth
section is about methodology, fifth is about results, sixth is about conclusions.

13
2 Literature review
2.1 Corporate social performance
In general corporate social performance (CSP) has been studied by many and good
environmental performance has an effect on stock returners of companies (Kempf and
Osthoff (2007), Semenova and Hassel (2013)). It is widely stated that CSP has a positive
effect on financial performance of companies. CSP has an effect on cost of equity
capital; when the CSP is high of the company (Dhaliwal et al. (2011)) and a low
environmental effect take an advantage of the low cost of equity capital (Chava (2014)).
Zerbib (2019) states that there are problems when transferring these findings to the
debt market. The first reason is that the payoff profile of a debt holder differs from that
of a stockholder reported that a bond payoff can be replicated by the purchase of a
stock and the sale of a call option of the same asset. Because bondholders have upside
available, it is important to analyze and assess all the downside risks for example
environmental accidents. It is more important for investing that is socially responsible
to insure against a market downturn and when a company acts socially responsible
manner the credit rating increases and it has a strong effect on default risk decrease of
a company. The second reason is that companies are affected by the bond market
investors because companies are seeking financing via the debt market more
frequently than they increase their capital.
Zerbib (2019) notes that studies have been made about CSP's effect on corporate bond
yield, no consensus have been found. Magnanelli and Izzo (2017) state that CSP has an
negative effect on cost of debt; it increases the cost of debt. Their theory states that if
a company uses its resources to CSP it is a waste of valuable resources and it has an
effect on company's performance. Menz (2010) states that on the European corporate
bond market socially responsible companies gain negative impact on large credit
spread on the contrary than non-socially responsible firms. Oikonomou et al. (2014)
state that good CSR performance enables lower bond yields and CSR irresponsibility is
correlated in a positive way with financial risk for U.S. corporate debt. Hasan et al.

14
(2017) note that companies that are in U.S. and, which have high level of social capital
gain benefit from low at-issue bond spreads. Goss and Roberts (2011) research how
the CSR scores of U.S. companies impact on the price of the bank loand of the firms.
They have noted that firms with lowest CSR scores have to pay the highest prices of the
bank loans; 7 to 18 basis points more than the more responsible ones. Klock et al.
(2005) state that when comparing companies with strong shareholder rights and
companies with strong management rights they have a 34 basis point lower cost of
debt. Ge and Liu (2015) have stated that new corporate bonds, which are issued in the
U.S. primary market and when companies have positive reports in CSP the spreads of
the bonds are smaller.
2.2 Green bond premium
Zerbib (2019) states that the green bond yield is not based on the CSP of the issuing
company because the green bond label is only used with the funded projects and not
with the issuer type. This is the reason why a green bond yield can be compared to
similar conventional bonds. Ehlers and Packer (2017) and CBI (2018) study the
difference between a green bond and a conventional bond and they have compared
the differences in the yields of the bonds. CBI (2018) do not find differences that were
significant on the primary market and this states that the inverstors are not eager to
pay premium to get a green bond at issuance. Ehlers and Packer (2017) find a -18 basis
points negative premium at issuance in 2014 - 2017 on 21 Euro- and USD-demoninated
bonds. Barclays (2015) and Bloomberg (2017) examine a yield difference on the
secondary market. Barclays (2015) examines credit spread on market risk factors by
using the OLS regression and by using this they report a negative premium of 17 basis
points between March 2014 and August 2015. Bloomberg (2017) instead reports a
negative premium of 25 basis points by examining twelve Euro-denominated
government-related bonds but it doesn't report premium on USD-denominated and
corporate bonds bonds between March 2014 and December 2016.

15
Various authors have researched green bond premium. Karpf and Mandel (2018)
research the topic. They concentrate on the US municipal bond market; they
investigate whether or not investors value green bonds differently from conventional
bonds. They use a sample of 1880 bonds but the sample does not meet the strict
limitations of the Green Bond Principles and they report a positive 7.8 basis points
average yield premium on green bonds between 2010 and 2016; however premium is
negative since 2015. Karpf and Mandel (2018) note that when green bonds offer a
premium; the premium is reflected in share price also. Karpf and Mandel (2018) also
note that green bonds have a lower cost of capital to issuers compared to conventional
bonds. Differences in return rates can be covered by issuer characteristics. The fact that
green bonds are green is not itself explaining the difference.
Karpf and Mandel (2018) get support to this statement from Tang and Zhang (2018).
Tang and Zhang (2018) state that a yield spreads of green bonds and conventional
bonds, that are issued by commercial entities, compared to firms that have issued
conventional bonds, green bonds have benefits in pricing for their issuers. When the
same firms issues green bonds and conventional bonds there are no pricing benefits.
Tang and Zhang (2018) have however only 41 observations so it quite unreliable and it
is dangerous to make strong conclusions based on that. Barclays (2015) and Karpf and
Mandel (2018) suggest that the liquidity premium should be controlled by using the a
time variable in the regression because the emission for the previous article and a
variable equal to the number of transactions within the past 30 days for the latter.
Zerbib (2019) states that the current researches on the relative valuation of green
bonds are lacking of a limited of analysis and incomplete control of the liquidity
premium. Zerbib (2019) states that his research contributes to the current literature in
a following way; he is going to "carry out an extensive analysis of the green bond
premium by using a global database and at the same time controls the liquidity and
maturity biases". Zerbib (2019) states also that they show that the small negative yield
premium is a result from an excess of demand of green bonds compared to

16
conventional bonds and this theory is suitable at least to investment-grade, low-rated
bonds and financial bonds. Zerbib (2019) states that "the results complement the
literature on the relationship between CSR and bond yield by highlighting the existence
of a premium linked to the preference for an asset dedicated to funding sustainable
development, independent of the issuer's CSP."
Larcker and Watts (2020) state that it is not nontraditional theoretical idea that
investors can value securities above their expected risk and return features. They note
also that it is difficult to separate the effect in real market settings. Martin and Moser
(2016) and Riedl and Smeets (2017) try to find out the aforementioned preferences
from experimental or survey data. Barber et al. (2020) use expected returns and risk
from actualized returns and security characteristics. Larcker and Watts (2020) state that
it is still unclear whether investors are ready to abstain financial benefits in real market,
if risk and return are known beforehand. Larcker and Watts (2020) state that green
bonds are very good way to explore the matter. They function same way as the
standard debt securities issued by municipalities and corporations.
Larcker and Watts (2020) are interested to find whether or not the investors in bond
markets are ready to give up returns to invest in environmentally sustainable assets.
Larcker and Watts (2020) concentrate on the municipal green bond market because it
"offers a nearly ideal setting to explore this research question." By investing the
municipal bonds Larcker and Watts (2020) can use various one of a kind institutional
characteristics of municipal markets. One of these is that municipal issuers often issue
otherwise identical green and non-green municipal securities at the same time. They
are identical to ordinary municipal bonds expect they are used to finance one or more
environmentally friend projects. This enables usage of a model-free matching method
to appraise treatment effects. Yields, spreads and other bond characteristics can be
compared between almost identical securities from the same issuer and on the same
issue date. Larcker and Watts (2020) state also that another useful property is that the
mediocre issuance size of the municipal bonds is about 5 million dollars. The average

17
issuance size of corporate bonds in the United States in the same time period is about
400 million dollars. Green issues are thus rather small and this allows smaller traders
also invest when the green issues are large it restrains smaller traders out of the
offerings. Larcker and Watts (2020) note that "investors with utility for green
investments and the willingness to trade off bond yield for green use of funds are likely
to be marginal trader setting the price of the bond." For these reasons Larcker and
Watts (2020) state that their style is a good way to find greenium if it exists.
2.3 Mixed results of the green bond premium
Quite many of the studies provide appraisal for greenium, but the results are impure.
Karpf and Mandel (2018), Baker et al. (2018) and Larcker and Watts (2020) are mostly
related to one another. Each of the studies use rather large sample of issued green
bonds in the municipal market. Larcker and Watts (2020) have the biggest sample and
Karpf and Mandel (2018) and Baker et al. (2018) sample is about 60 % of the Larcker
and Watts (2020) sample. Karpf and Mandel (2018) find positive yield differential;
green bond discount, which is about eight basis points. Baker et al. (2018) find a green
bond premium of six basis points. The findings are discrepant compared to industry
practitioners views. Chiang (2017) states that people who answered by the State
Treasures Office of California stated that "their firms would not accept a lower yield for
a green bond."
Larcker and Watts (2020) believe that the inconsistent results of the earlier studies is a
consequence of "methodological design misspecifications that produce biased
estimates" and as stated already earlier Zerbib (2019) states that the current
researches on the relative valuation of green bonds are lacking of a limited of analysis
and incomplete control of the liquidity premium. Larcker and Watts (2020) note that
Baker et al. (2018) and Karpf and Mandel (2018) compare taxable and non-taxable
securities; thus they ignore the effect of taxation in the municipal securities market.
Baker et al. (2018) use a pooled fixed-effects model in their analyses. Larcker and Watts
(2020) state that this is insufficient to "successfully control for nonlinearities and

18
issuer-specific time variation, which ultimately leads to spurious inferences." Larcker
and Watts (2020) state that they avoid this by "taking advantage of the unique
institutional features of the municipal securities market". This enables optional security.
Larcker and Watts (2020) find a small differential between green and conventional
bonds. They state that "this pattern is robust to perceived differences in liquidity or
institutional ownership." They state also that greenwashing by issuers is improbable to
be responsible for their findings. Larcker and Watts (2020) state also that municipal
investors in the USA are not eager to offer up returns to invest in green bonds. Green
bonds are only a small share of the debt market. The reason for this is the high
issuance cost according Larcker and Watts (2020) and Chiang (2017). Larcker and Watts
(2020) state that only benefit in the green bonds is that they diversify the investor base
of the issuer and this result is consistent with the practitioners' views (Braun (2019)).
Larcker and Watts (2020) note that municipal securities market is institutionally
different compared to other asset classes.
For example in the corporate green bond market there might be premium in green
bonds but Larcker and Watts (2020) see that it is however unlikely; the premium
should appear in the municipal green bonds most likely. The second reason is that the
sample size of Larcker and Watts (2020) is rather small and it is likely that green
investors are the marginal trader for pricing the asset. This is the reason why the
municipal green bond pricing should reveal if the small traders of green bonds are the
marginal investors for pricing the asset. Thus, municipal green bond pricing ought
uncover if the green bond marginal trader is consenting to pay a premium for a bond
that is used to finance environmentally friendly scheme.

19
Zerbib (2019) states that green bonds are engaging financial instruments that advance
the environmental change and at the same time they are making possible for low-
carbon project possessors to spread out their funding ability. Zerbib (2019) compared
the yield of a green bond compared to equal synthetic conventional bond via a match-
ing method. By green bond premium Zerbib (2019) means the yield difference between
the green bond and the conventional bond and before this controlling the difference in
liquidity. As said earlier, Zerbib (2019) finds small but pregnantly negative and equal to
-2 basis points in the whole sample. The negative premium is bigger for financial bonds
and low-rated investment-grade bonds. Zerbib (2019) states that the study has many
implications. Investors and issuers can use the method for pricing the recently issued
green bond fixed points. It also shows that there is a lack of green bonds conditional to
the investment demand in many market segments and calls for operative and fiscal
measures to increase the administration of green bonds issued. The investors at the
moment can soak up a yield at issuance; it is a bit lower than indicated by the
conventional curve.
Zerbib (2019) notes that the methodology that he has used is being used also with the
European Investment Bank green bonds while investing the existence of the green
bond premium. The results note that there is a -8 basis points negative premium since
January 2017 for the four main green bonds issued. Zerbib (2019) notes that the
quality of the data may cause inaccuracy to the results and the fair value can be biased.
Zerbib (2019) state that following researches should focus on understanding the
determinants of the green bond premium via a market microstructure theoretical
model. Second idea that Zerbib (2019) introduces is "designing public supporting
measures, assessing their effects on the green bond market's microstructure, and
comparing the differential impacts via sensitivity scenarios." Third idea is that Zerbib's
(2019) study could be expanded to another kind of bonds for example to social impact
bonds.

20
Hyun et al. (2019) examine if the information about greenness has an effect on the
green bond market prices. Hyun et al. (2019) use liquidity-adjusted yield premiums of
green bonds and compare these to synthetic conventional bonds. They find no relevant
premium from green bonds or reduction that is strong to distinct estimation
procedures. Instead, they find strong proof that information of the greenness
indicators pregnantly effect on the level of the green bond premium. Green bond with
CBI certificate get 6 basis points and 15 basis points reduction compared to green
bonds that do not have that kind of information. The aforementioned reduction can
essentially compensate for the supplementary expense of these information
enhancers. When the green bond market develops, the information enhancers may
take action to decrease the expense of obtaining independent reviews and verification.
Hyun et al. (2019) state that the issue size can decrease the green bond premium and
that there is a green bond premium.
Hyun et al. (2019) state also that green bonds are naturally good way to finance green
projects but they could be developed further, in connection with market structure and
arrangement. In the eyes of the supply side it is expensive to issue green bonds
comparared to conventional bonds. In the eyes of the demand side, the investors meet
information asymmetry about greenness in relation of issuers. Green bond standard
and guideline decrease heterogeneity and segmentation of worldwide green bond
markets. Issuers can reduce their financing expenses and investors can benefit of lower
greenness information costs if the information enhances. Hyun et al. (2019) state that
by investing to green investments should not lead to lower returns. Certain green
bonds offer smaller returns but at the same time they offer lower information costs. In
order to tempt institutional investors to invest to green bonds, issuers should monetise
environmental externalities and positive impacts. This might stimulate institutional
investors to add green bonds in to their investment palette and asset targeting.
Febi et al. (2018) note that there is a yield spread in green bonds, which is -5 to -30
basis points smaller than in conventional bonds. This yield spread premium is however

21
changed to trivial in the recent years, this can mean that green bond market is
maturing. As Larcker and Watts (2020) state the green bond premium that different
researchers have found can be a result from the higher bond liquidity compared to
conventional bonds and not all the researchers have controlled this effect in their stud-
ies. Febi at al. (2018) study the determinant power of bid-ask spread. Whether the ask
price surpass the bid price and LOT liquidity measure, which measure the difference
between the percent of buying cost and the percent of selling costs and yield spread
between conventional bonds and green bonds. They state that conventional bonds are
less liquid that green bonds because of bid-ask spread an LOT liquidity measure. Febi et
al. (2018) like Zerbib (2019) state that bid-ask spread is unmeaning determinant for
green bond returns but it is meaningful determinant for conventional bonds. Febi et al.
(2018) state that LOT measure is a admissible determinant for green bond yields but at
the same time it is a trivial determinant for conventional bonds.
Febi et al. (2018) state that green bonds seem to face higher liquidity levels in the
market and this is a strong event in the market. Now and also in the future, investors
will face pressure to point out ESG and SRI entrustment. This will head to imposition
exceed over to provision. The provision will probably remain low because of fiscal
stimulus for investments (Zerbib (2019)) state that and inexistence of an official and
global disposal (Cochu et al. (2016)) of course GBP is trying to patch this up. This means
that better liquidity of green bonds does not come from environmental enhancements
but from deficiency of supply and this makes it possible green bond premiums (Zerbib
2019). Cochu et al. (2016) state that also the inexistence of credit risk profile
concerning unfit reporting of green projects can prove the illiquidity of green bonds
compared to conventional bonds. Cochu et al. (2016) note that the ratings of green
bonds are concentrated to balance sheets in place of green project investments. This
means that green bonds can be directed to riskier investments compared to
conventional bonds and this should mean actually a negative green bond premium.
Higher risk level gets a support from bond maturity and yield relation. Campbell and
Taksler (2003) state that investment grade bonds are very likely to have a positive

22
linkage among maturity and yield spreads. The most of the green bonds are investment
grade bonds and hence the results should be equivalent. Febi et al. (2018) note
however that the results is reciprocal between the aforementioned factors; normally
this result is expected for speculative-grade bonds. Karpf and Mandel (2018) found the
same appearance in their study; there is reversed relationship between the
aforementioned factors for bonds when the years to maturity are under three years.
Gianfrate and Peri (2019) use a propensity score matching approach to study 121
European green bonds issued between 2013 and 2017. They state that green bonds are
financially more convenient than conventional bonds. For corporate issuers the benefit
is larger and it remain in the secondary market. Gianfrate and Peri (2019) state that
their findings keep up the view that green bonds can help in greening the finance
without penalizing the issuers. Stellner et al. (2015) note that superior corporate social
performance (CSP) leads in systematically reduced credit risk but the evidence is
however weak. Menz (2010) note that in European corporate bond market the
premium in the risk for socially responsible firms is higher than for non-socially
responsible firms the finding is slightly significant. Gianfrate and Peri (2019) state also
like many other that the results concerning the green premium is mixed in the primary
market and also in the secondary market.
Gianfrate and Peri (2019) note that their research extend the existing literature
concerning the green bonds by providing evidence of the existence of a significant
advantage for the primary market of European green bonds adopting a propensity
score matching (PSM) methodology. They note also that the premium stays after the
issuance; in the secondary market. Gianfrate and Peri (2019) use also Bloomberg's data
from "Bond radar "as many other researchers. They use bonds issued from January
2007 to December 2017. In the bond radar there is 7589 public eurodenominated
bonds issued since January 2007 and 154 of these are green bonds. They do not use
bonds that have variable interest payments because this can affect on the pricing at
issuance. They do not use also bonds that are missing the returns or if the size is lower

23
than 200 million euros, this enables that the bonds are liquid. They also do not use
bonds at high risk of default and bonds that are not priced using European rates. Using
the aforementioned parameters, there are 121 green bonds left in the data and there
are different entities such as corporates, national and multinational agencies,
municipalities, sovereign states and financial institutions. They divide the sample to
two different samples: "Corporate Issuers" and "Non-corporate Issuers". 43 of the
observations concerning the Corporate Issuers are labeled green and 78 of the Non-
Corporate Issuers are labeled to be green.
Gianfrate and Peri (2019) evaluate whether it is convenient of issuing green bonds for
companies and to non-corporate entities that want to invest in green projects like in
energy and water efficiency and bioenergy. They state that green bonds are more
favourable than conventional bonds because normally they offer lower returns for the
financiers. Gianfrate and Peri (2019) note that the "result is stronger for corporate
issuers with the implication that private sector - whose support will be necessary to
achieve the Paris Agreement's temperature goal - are better off financially when they
issue bonds that are labelled as green."
Green bonds have transaction costs because they have to be certified, monitor and
report on the green use of progresses. Gianfrate and Peri (2019) state that financial
savings that issuers get seems to be a result of a strong demand for these financial
products and this means that there is willingness to invest in green projects.
Institutional financiers want to decorbanise their portfolios and redirect their assets to
environment-friendly investments because climate change is also a increasing threat to
the economic growth in a long perspective. The law also effects on the institutional
investors because for example in France investors have to report on how they reduce
CO₂ releases and what they do to control climate related risks. In future countries can
for example offer tax benefits for investors that invest in green products for to help to
improve the market. It can be waited that there is coming new green bond issues
because of the adoption of a common European Union green asset taxonomy

24
(European Commission (2018)). Banks will probably start to implement the reporting
recommendations that are set forth by the Taskforce for Climate related Financial
Disclosure (TFCD (2017)). Monetary policies will probably also favour investments that
are made in green-labelled assets. Issuers will get better financial results with green
bonds and also the financial results are better. The global economy also turn into more
sustainable and it can also enable investors to comply with the current and coming
legislation.
Gianfrate and Peri (2019) have a rather small data sample and the sample should be
bigger and also the geographical region should be wider. When the quantity and
quality of data will be better, it is relevant to do further research in the eyes of the
issuers, investors and policymakers. Researches in the future should contain
information whether or not green bonds' amenity has objectively changed in the
course of time and has there been variation over industries and regions. Secondly, by
analyzing better and understanding the formation of the demand of these bonds and
its drivers, the policies can be designed to proceed with and foster the growth of the
market. Gianfrate and Peri (2019) note also that the green label should be studied
more closely. The bonds can suffer from that there is now clear definition what is a
green bond and what is not. In order to create a reliable and consistent criteria for the
bonds demand both scientific analysis and political and standard-setting decisions. A
formal taxonomy is trying to be created by the European Commission and with this
action the misuse of the green bond label can be avoided.
Gianfrate and Peri (2019) note that global warming can be restricted to 1.5°C but this
require changes in the economic and social systems. Gianfrate and Peri (2019) state
that "Financial markets will play a major role in those disruptive changes and
practitioners, policymakers, and scholars are converging in stressing how crucial the
support of finance is in delivering an actual and timely transition to a low carbon
economy." Gianfrate and Peri (2019) show that green bonds can be used to achieve a
lower cost of capital for organizations that need to finance or re-finance green projects.

25
Gianfrate and Peri (2019) note that there is limited evidence on corporate decisions in
issuing green bonds and their findings fill in the existing literature gap and companies
can use the results to make decisions regarding different financial instruments.
Policymakers can use it while they make policies; they recognize which policies startle
or stimulate the market and issuers to pass innovative green funding instruments.
Barua and Chiesa (2019) examine what is the size of the financing that happens with
green bond supply. They use cross-section OLS regressions and Blinder-Oaxaca
decomposition analysis and they have a global data for 8 years (2010 - 2017) and the
data is from Bloomberg. They investigate how the bond characteristics, issuer
characteristics, and market characteristics effect on issue size. They test also "the
persistence of the effects by year-wise and rating grade-wise estimations". They note
features that had a relevant impact on issue size, "the effects of coupon rates (negative
effects) and credit rating (positive effects) on issue size is permanent in nature as they
consistently persist over the years and across rating grades". Concerning "the issuer-
specific, revenue growth (mostly negative effects) and profitability (positive effects)
have relatively more persistence across the estimations". Issue sizes are larger in
emerging markets of the market and economy variables. Also the issuances that are in
EURO and targeted to global market have most likely a bigger issue size, and the impact
is most persist across assessments. Issue size is likely to be smaller when the issuance is
targeted to international market.
Barua and Chiesa (2019) note that their research confirm the aforementioned effects
of the abovementioned factors, especially for high-grade bonds. They note that they
have not found evidence of a notable increase of average issue size in 2017 compared
to 2016. This can mean that environmentally responsible and sustainable business
projects have not been undertaken more by the companies. High-grade bonds on
average get less finance per issue compared to other bonds. Barua and Chiesa (2019)
state that their finding have important policy implications. First, for example "better
financial health (e.g., profitability) and higher quality of the security (e.g., rating) would

26
enable firms to finance a larger amount, which should be considered by the
policymakers and relevant agencies when encouraging green bond issuance". Second,
policymakers could target to pledge emerging markets more to increase financing size.
Third, EURO denominated bonds are rather popular but issuances of larger USD and
CNY should be increased. Fourth, issuance per issue on average is not increasing
although the aggregate green bond market has broaden fast. In the future, policy
efforts should pay more attention to "per issue size of financing" and there should be
countenance to finance more per issue. Companies could for example move from
traditional finance to green bonds. Barua and Chiesa (2019) note that " although most
of the existing green bond have an investment grade rating, high grade bonds show a
relatively low size of financing compared with the others. To ensure that the green
market expands properly and mobilizes even a greater finance towards
environmentally responsible investments, we need to ensure that the size of financing
by firms consistently increases over time, particularly by higher quality green bonds
issuance".

27
3 Data and methodology
3.1 Data
Data for the research is combined from two sources. A data concerning the green bond
issuers is retrieved from Danske Bank and from their data we were able to collect ISINs
of green bonds and based on these ISINs the University of Vaasa was able to collect bid
and ask prices of the green bonds and also the yield data. Because we needed also two
matching conventional bonds towards a green bond the University of Vaasa delivered
conventional bond data from the same issuers as the green bonds and after this we
had to go through a thousand of conventional bonds to find the matching conventional
bonds as described later on the study. There is no certainty where Danske Bank get
their data but it can be gathered Bloomberg's database but there is no full certainty of
this. The data contained everything else of the green bonds but not the bid and ask
prices. The University of Vaasa provided the price data based on the data that Danske
Bank delivered. The University of Vaasa researched the price data from Datastream.
Danske Bank's data contains 531 green bonds when limiting it to concern only the
Nordics.
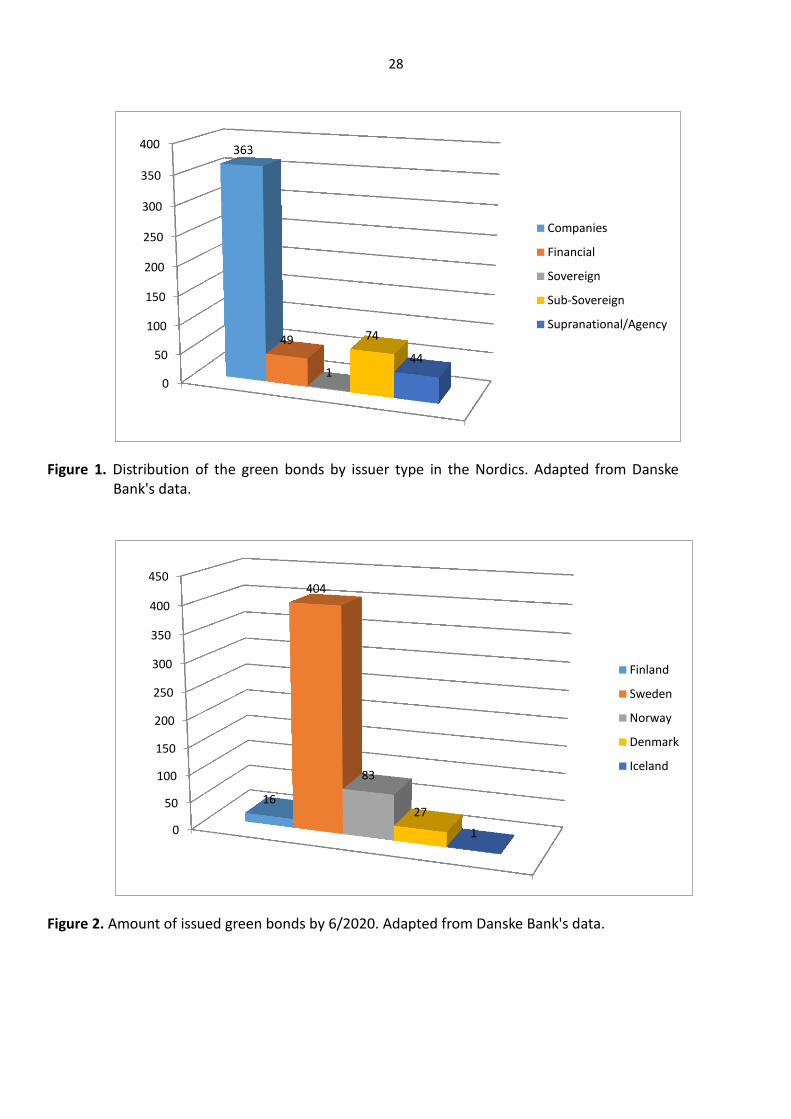
28
Figure 1. Distribution of the green bonds by issuer type in the Nordics. Adapted from Danske Bank's data.
Figure 2. Amount of issued green bonds by 6/2020. Adapted from Danske Bank's data.
0
50
100
150
200
250
300
350
400 363
49
1
74
44
Companies
Financial
Sovereign
Sub-Sovereign
Supranational/Agency
0
50
100
150
200
250
300
350
400
450
16
404
83
27
1
Finland
Sweden
Norway
Denmark
Iceland

29
3.2 Methods
Studies that concern CSR and are analyzing bond spreads use a regression on a
appropriate definition as a empirical method. This requires that financial and extra-
financial independent variables are defined and they are used to define endogenous
value of the bond spread as comprehensively as possible while making sure that the
specification is robust (Zerbib (2019)). The aforementioned style can be used also in
this research. We can match two similar bonds from the same issuer. Zerbib (2019)
notes that the most of the factors that are affecting to the yield are identical. This
enables usage of a matching method. This method can be used to analyze the
endogenous value of a specialized financial instrument. When using the method a pair
of securities with the same qualities except for the one property whose impact we are
interested in. Helwege et al. (2014) use for example the method to match and compare
pairs of bonds issued by the same firm in order to research the cost of liquidity.
The same method is being used as Zerbib (2019) and making a database in order to
evaluate the yield spread between a green bond and a similar synthetic conventional
bond. We need a matched pair that contains a green bond and a conventional bond
with similar characteristics except the liquidity. We are doing the same as Zerbib (2019)
and adding a new parameter, which is the greenness of a bond. We want to know how
this parameter affects on the bond yield. The green bond yield and the equivalent
synthetic conventional bond yield is thus the cumulative effect of the liquidity
differential and the green bond premium.
The data includes different kind of bonds: corporate, financial, sovereign, sub-
sovereign / municipality and supranational / agency. We have to create a synthetic
bond for every green bond. This demands that we have a two conventional bonds with
a quite close maturity from the same issuer and the other characteristics should be the
same such as: currency, rating, bond structure, seniority, collateral and coupon type.
The maturities are not equal but they should be rather close to the green bond, thus
we are using the same method as Zerbib (2019) and collecting conventional bonds that

30
have a maturity that is neither two years shorter nor two years longer than green
bond's maturity. By doing this we are able to estimate more precisely the
corresponding synthetic conventional bond yield in the next step. Zerbib (2019) notes
that the difference in bonds liquidity is other difference between these two group of
bonds. The difference can be estimated by the issue amount or the issue date as
Houweling et al. (2005) for example note. If there is a notable difference in liquidity it
can have a big difference on the yield level and this is the reason why it has to be
limited. We have to restrain the suitable conventional bonds to those as Zerbib (2019)
has noted "(i) with an issue amount of less than four times the green bond's issue
amount and greater than one-quarter of this amount and (ii) with an issue date that is,
at most, six years earlier or six years later than the green bond's issue date." By using
this double restriction as Zerbib (2019) notes we are able to control better residual
liquidity bias in the estimation step of the green bond premium. By doing the
aforementioned limits to our data, we have 64 green bonds.
Maturity bias is the next thing that we want to eliminate and this happens by forming a
panel composed of pairs of bonds as Zerbib (2019) notes. The yields are retrieved for
the green bond and the matching two conventional bonds from the issue date of the
green bond up to December 31, 2020. Ask yields of the aforementioned three bonds
are under more close examination because we want to observe investors' demand and
issuers' supply of green bonds. Zerbib (2019) limits its data also by removing the line
from their panel if on a specific day, at least one of the three ask yields is not available.
We are not able to do the same due to lack of data we have to modify Zerbib's model
and we have to include also bonds that do not have a data on a specific date. This can
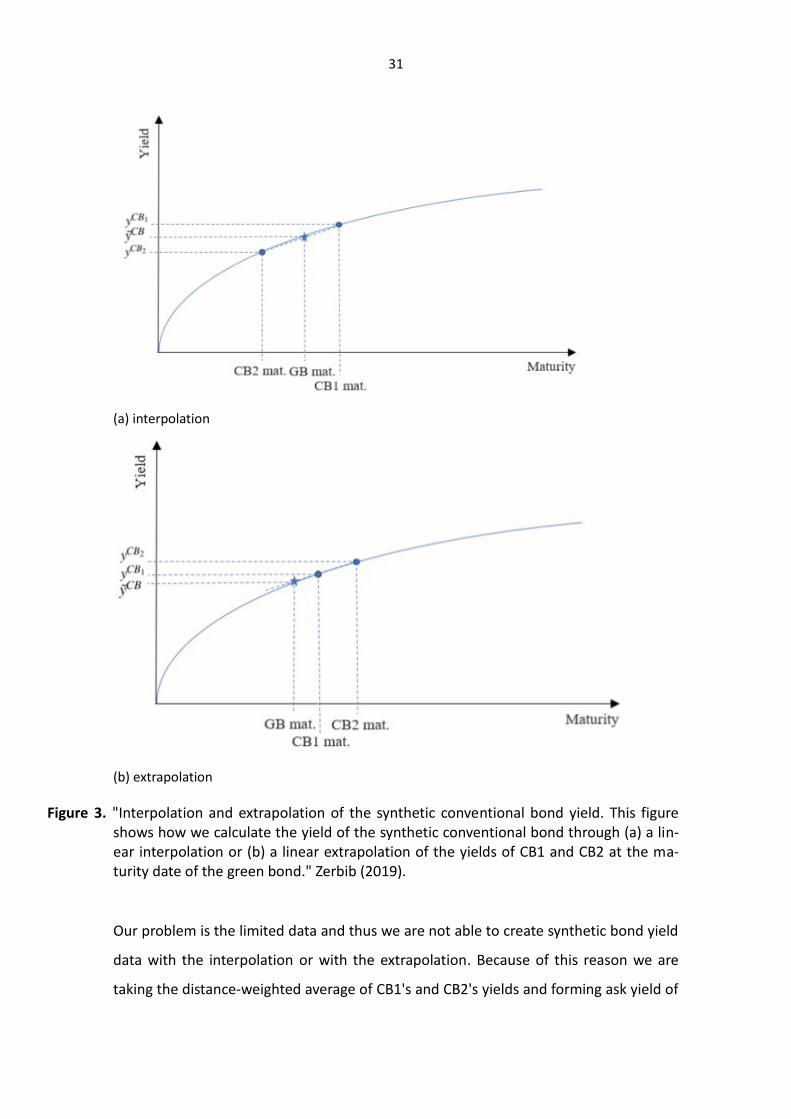
cause some bias to the results. Zerbib (2019) interpolates or extrapolate the two
conventional bonds' yields linearly at the green bond maturity date to obtain a
synthetic conventional bond yield. Thus, the synthetic conventional bond has the same
properties as the green bond except the difference in liquidity.
31
(a) interpolation
(b) extrapolation
Figure 3. "Interpolation and extrapolation of the synthetic conventional bond yield. This figure shows how we calculate the yield of the synthetic conventional bond through (a) a lin-ear interpolation or (b) a linear extrapolation of the yields of CB1 and CB2 at the ma-turity date of the green bond." Zerbib (2019).
Our problem is the limited data and thus we are not able to create synthetic bond yield
data with the interpolation or with the extrapolation. Because of this reason we are
taking the distance-weighted average of CB1's and CB2's yields and forming ask yield of

32
the synthetic bond and taking the yield difference of the green bond and the
synthetic bond ( ). We can see from the table 1 that maturities are rather close to
each other and yields are a bit larger among the conventional bonds compared to the
green bonds. Issue amounts seem to be a bit higher among green bonds. Some of the
green bonds were lacking of yield data and we are left with 57 green bonds after
searching the yield data.
Kapraun et al. (2019) have compared also the issue yield difference and our issue yield
difference of the green bond and the CB1 and CB2 is -3,74 basis points and the
difference of the green bond and the CB1 and CB2 median is -4,2 basis points. Yield
difference is 1,4 basis points and median is 7,2 basis points when we are comparing the
green bond with the synthetic bond that we formed with the distance-weighted
average of CB1's and CB2's yields. We are using the latter results / data in our further
tests.

33
Min Median Mean Max
Issue yield of the GB -0,3950 0,2940 0,4764 2,212
Issue yield of the CB1 -0,589 0,2940 0,4861 3,813
Issue yield of the CB2 -0,7810 0,3360 0,5415 3,813
Issue yield of the CB1 and CB2 -0,7810 0,3360 0,5138 3,813
Yield difference % ( ) -34,0929 0,7216 0,1396 30,5352
GB Coupon (%) 0,00 0,7365 0,8470 2,473
CB1 Coupon (%) 0,00 0,6570 0,7905 4,301
CB2 Coupon (%) 0,00 0,7225 0,8122 4,318
GB issue amount (EUR) 94707621,26 62442783,05 19661370,25 1000000000,00
CB1 issue amount (EUR)
78727964,3 46695754,35 9830685,13 1000000000,00
CB2 issue amount (EUR) 72874532,00 44238083,07 9830685,13 1000000000,00
GB maturity (years) 2,5 5,45 5,02 7,8
CB1 maturity (years) 2,0 5,25 4,7 8,2
CB2 maturity (years) 2,0 4,75 4,57 7,4
Table 1. Descriptive statistics of the bonds in the sample. The table summarizes the 64 green bonds and the two matching conventional bonds qualities.

34
4 Experimental methodology
4.1 Is there a green bond premium or a green bond discount?
We are estimating the green bond premium as Zerbib (2019) with experimental
methodology by trying to control the residual difference in liquidity. For the previous
purpose we need a variable , with the variable we can find the difference
in liquidity between a green bond and a conventional bond liquidity:
= -
(1)
Thus, we can define green bond premium as an unobserved effect in the fixed
effect panel regression on :
= + β + while being the error term (2)
As Zerbib (2019) notes there are three restrictive aspects when deciding the liquidity
proxies when taking into account data sources and our regression model. Our data is
low-frequency data and thus we cannot use intraday liquidity indicators such as Roll
and Gamma measure. Second point is that we do not have data of the daily trading
volumes, which have been used as liquidity proxies. Zerbib (2019) states also that "to
ensure full rank condition of a within regression, any variable that does not change
over with a given bond is not suitable". Thus, the issue amount and the issue date
cannot be used (Houweling et. al (2005)). We are using the closing percent quoted bid-
ask spread like Zerbib (2019). Fong et al. (2017). Fong et al. (2017) have proved that it is
the best low-frequency liquidity proxy and it is widely used as a measure of illiquidity
of a bond.

35
As noted earlier the synthetic bonds is structured of two conventional bonds, thus the
conventional bond's bid-ask spread is the distance-weighted average of CB1's and
CB2's bid-ask spreads. We are using here the same method as Zerbib (2019) and
and
. We get the synthetic conventional bond's bid-ask spread with the
following formula (Zerbib (2019)):
=
+
(3)
= -
is thus the independent variable, which is used in equation (2) to
estimate the fixed effect-linear panel. Table 2 contains data about is
approximately zero and like in Zerbib (2019) we have also a low standard deviation.
This means that the issue amount and the date of issuance as the liquidity controls in
the matching method ended up results that are acceptable.
Min Median Mean Max Standard de-
viation
-17,664 % -0,003 % -0,079 % 3,944 % 0,590 %
Table 2. Liquidity proxy . is the difference between green bonds' bid-ask spread and the conventional bonds' distance-weighted average bid-ask spread on a period of time that has been explained earlier.
We are estimating the fixed effect in equation (2) for numeral reasons. We are able
to control the bond-specific time-variant unobserved effect and at the same time we
are not inflicting distribution or getting effect from the other bonds. The data also
includes the characteristics of a specific bond (Zerbib (2019)). Zerbib (2019) notes also
that "strict exogeneity holds and ensures unbiasedness and consistency of the
estimator." Thirdly, we do not need "the difference in liquidity proxy to be uncorrelated

36
with the unobserved specific effect provides for a wide range of potential control
parameters" (Zerbib (2019)).
We are running the fixed effect panel data regression and also random effect panel
data regression and after the random effect panel regression running a Hausman test
to see the efficiency of fixed effect estimator. The Hausman test notes that the
individual effects correlate with the explanatory variable and the probability-value is
statistically significant at 1 % level. Thus, we use the fixed effect estimator. We can see
that there is some problem because Durbin-Watson stat is under 1. Rule of thumb is
that if the Durbin-Watson is less than 2 there is positive serial correlation. Because of
this we are using lagged version of the yield difference (Table 6) and we can see that
the Durbin-Watson value is much better and we get rid of the serial correlation.

37
Table 3. Yield difference . = + β + while being the error term with fixed
effect panel regression.

38
Table 4. Yield difference . = + β + while being the error term with
random effect panel regression.

39
Table 5. Hausman test. Hausman test says that the individual effects correlate with the explanatory variable and the probability-value is statistically significant at 1 % level. Thus, we use the fixed effect estimator.

40
Table 6. Yield difference . = + + β +
while being the error term with fixed effect panel regression.

41
Table 7. Yield difference . . = + + β
+ while being the error term with fixed effect panel regression.
As Zerbib (2019) notes we are controlling the yield difference by the liquidity difference.
This enables that we are not facing any simultaneity effects: the difference between
the yields does not have retroactive effect on the liquidity of the bonds. We use the
Beck-Katz robust estimation of the standard errors also in the Table 7. While observing
the test it seems that there is positive green bond premium of 1,7 basis points. This
means that green bonds are being sold by discount.

42
4.2 Further tests
We are running still some further test to find out if some other variables have an effect
on to the results. We are using the rating, the currency, the maturity and the issue
amount of the green bond and also the sector of the issuer. We are running an OLS
regression and some robust estimation of the standard errors. We are running a OLS
regression with dummy variables:
while being the error term. (4)
Table 8. The estimated green bond premium with a OLS regression. We use dummy variables that represent the most common variables among our sample.
It seems that there is a serial correlation in the Table 8 according to Durbin-Watson and
because of this reason we are running the regression analysis with Beck-Katz robust
estimations of the standard errors because it should be a good tool in small panels and
the results are in the Table 9.

43
Table 9. The estimated green bond premium with a OLS regression and PCSE. We use dummy variables that represent the most common variables among our sample.
We are also running a OLS regression with other dummy variables:
while being the error term. (5)
It seems that there is a serial correlation in the Table 10 according to Durbin-Watson
and because of this reason we are running the regression analysis with Beck-Katz
robust estimations of the standard errors because it should be a good tool in small
panels and the results are in the Table 11.

44
Table 10. The estimated green bond premium with a OLS regression. We use dummy variables that
represent the remaining variables of our sample.
Table 11. The estimated green bond premium with a OLS regression and PCSE. We use dummy variables that represent the remaining variables of our sample.

45
We are following Zerbib (2019) and using logarithm of the issue amount to linearize the
values of the variable that can be interpolated by an exponential function. We are
using dummy variables to represent currency, rating and sector to find if they change
the values.
46
5 Results
5.1 Positive green bond premium
We are estimating the green bond premium, its significance, sign and magnitude. We
use Hausman test to find out that the fixed effect estimator is better than random
effect model. We cannot say that the within estimator is unbiased and consistent
because we can see that the Durbin-Watson states that there is a serial correlation.
However we are getting the same results while we are using the lagged dependent
variable (Table 7) and while the Durbin-Watson is much better.
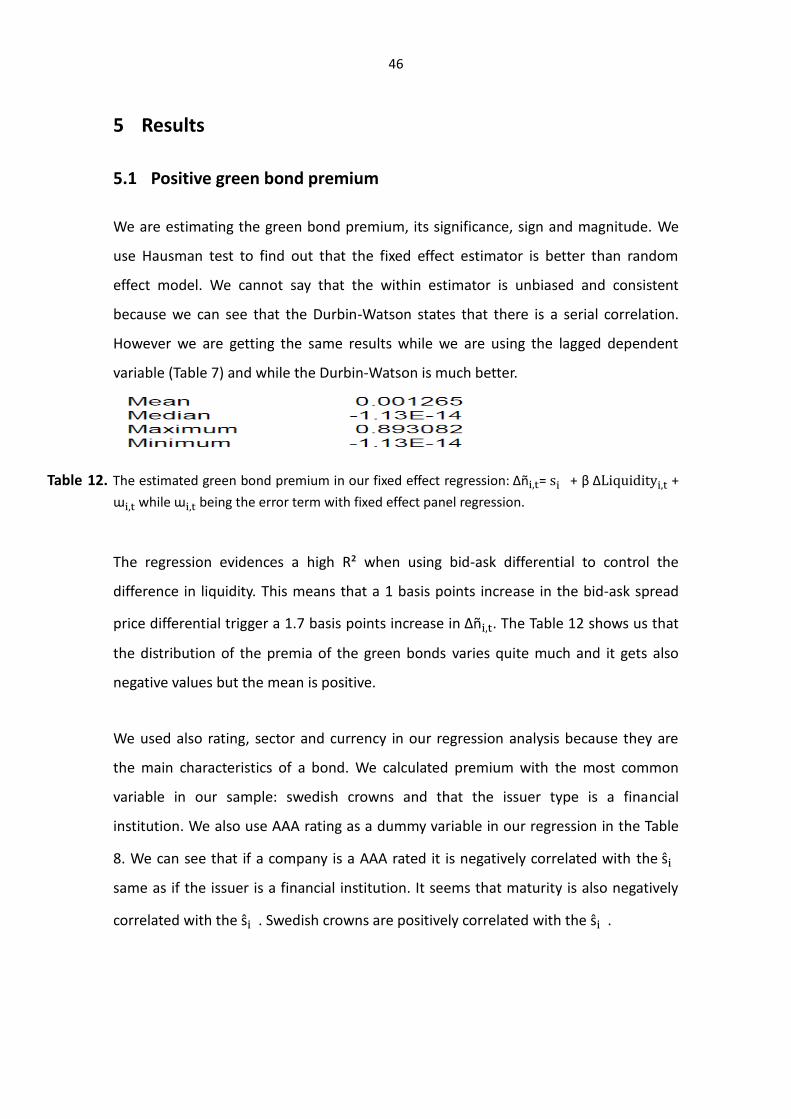
Table 12. The estimated green bond premium in our fixed effect regression: = + β +
while being the error term with fixed effect panel regression.
The regression evidences a high R² when using bid-ask differential to control the
difference in liquidity. This means that a 1 basis points increase in the bid-ask spread
price differential trigger a 1.7 basis points increase in . The Table 12 shows us that
the distribution of the premia of the green bonds varies quite much and it gets also
negative values but the mean is positive.
We used also rating, sector and currency in our regression analysis because they are
the main characteristics of a bond. We calculated premium with the most common
variable in our sample: swedish crowns and that the issuer type is a financial
institution. We also use AAA rating as a dummy variable in our regression in the Table
8. We can see that if a company is a AAA rated it is negatively correlated with the
same as if the issuer is a financial institution. It seems that maturity is also negatively
correlated with the . Swedish crowns are positively correlated with the .

47
The Table 10 notes also that other ratings than AAA are positively correlated with the
premium. We have to note that quite much of the sample is N/A and we do not have
better perception of the sample so this can bias our results. Other currencies are
negatively correlated with the premium but we have to understand that most of the
bonds of the sample are issued in Swedish crowns so they represent a big sampling of
the sample. Issuers that are not financial institution are positively correlated with the
premium. Maturity seems to have a negative effect on to the premium in the Table 8
and also in the Table 10. Issue amount is positively correlated with the premium in the
Table 8 and also in the Table 10. Maturity seems to be statistically insignificant in our
Tables (8 - 11) and also financial institutions as a dummy variable seems to be
statistically insignificant.
5.2 Checking the robustness
We test the robustness. Zerbib (2019) notes that the negative green premium can
reflect the fact that they are less riskier than conventional bonds. We are calculating
the 10-day and 30-day rolling annualized volatility during the period of interest
regarding the green bonds and the synthetic bonds. We follow the equation (3)
modified to the volatility and take the difference between the green bond and the
synthetic bond. After this we are running the equation (2) and we add the difference in
volatility as an independent variable. We use also Beck-Katz robust estimations of the
standard errors and we find no evidence that a difference in volatility is not a result
from the yield differential between the green and conventional bonds. Thus, the green
bond premium should differ from a risk premium. Table 13 and Table 14 note that the
green bond premium does not differ that much with the volatility dependent variable.
We can see from the Table 15 and Table 16 that without lagged dependent (and Beck-
Katz robust estimation of the standard errors) variable there is a serial correlation.

48
Table 13. The equation (2) estimated green bond premium with 10-day annualized volatility and a lagged dependent variable with Beck-Katz robust estimations of the standard errors.
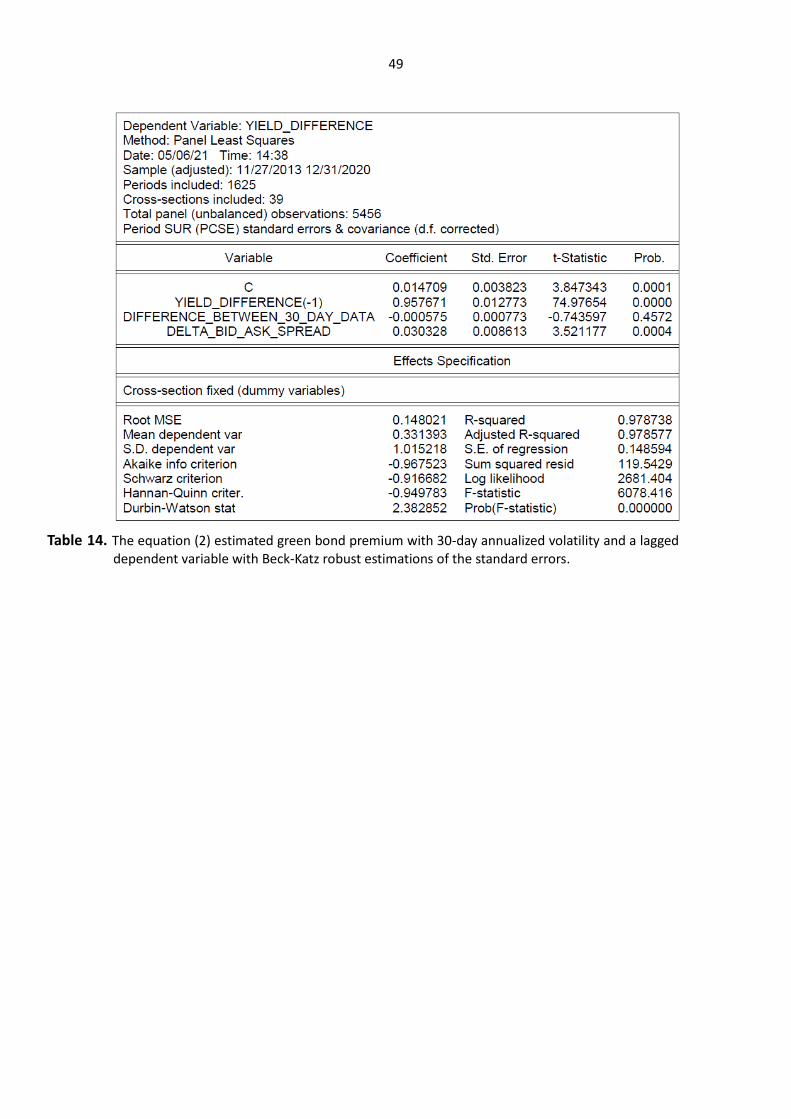
49
Table 14. The equation (2) estimated green bond premium with 30-day annualized volatility and a lagged dependent variable with Beck-Katz robust estimations of the standard errors.
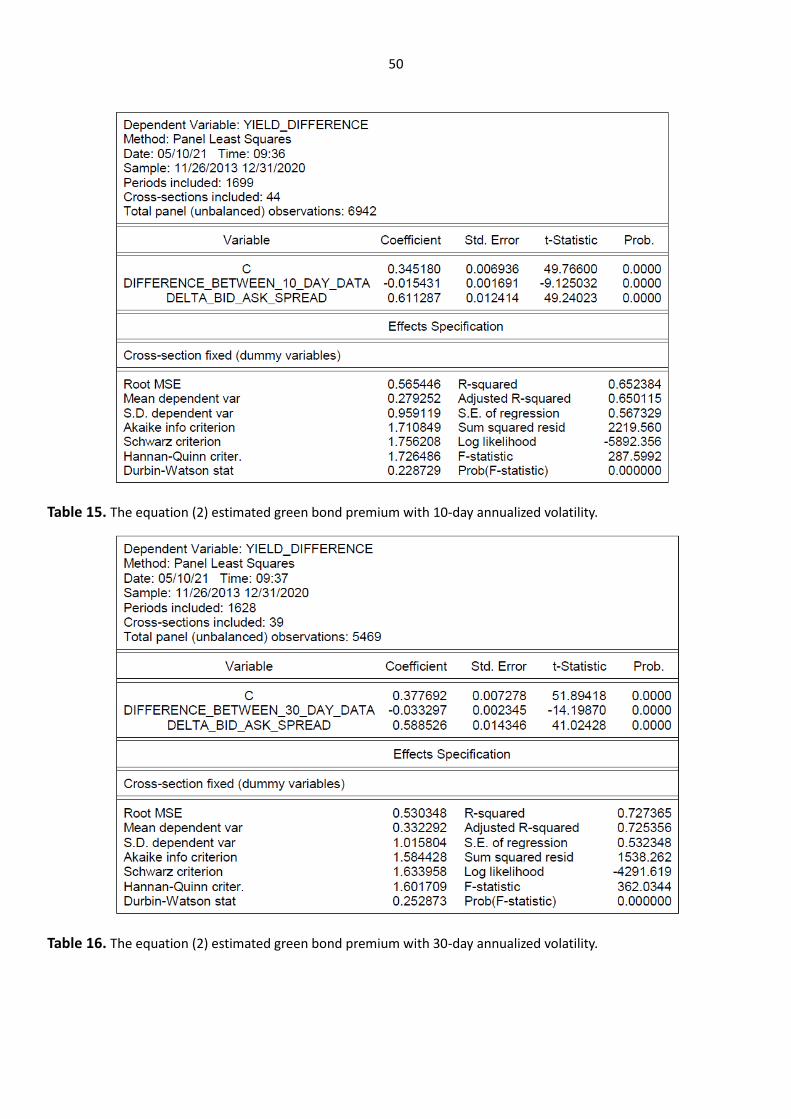
50
Table 15. The equation (2) estimated green bond premium with 10-day annualized volatility.
Table 16. The equation (2) estimated green bond premium with 30-day annualized volatility.

51
6 Conclusion
We find the positive green bond premium vice versa as we believed in. We analyzed
the green bond versus an equivalent synthetic conventional bond. We used the
matching method with some slight adjustments to the maturities of the bonds because
our data was a bit narrow and we could not use the exact same methods as Zerbib
(2019). The adjustments resulted probably some bias in our analysis because there is
serial correlation that we correct with lagged dependent variable. The probabilities of
the results are also almost too good to be true and the R-squared is rather high.
However our result is that there is a non negative premium but the positive premium is
quite small. The premium is defined as Zerbib (2019) that it is a yield difference
between the green bond and the conventional bond after controlling the difference in
liquidity. Our sample consist of bonds that are issued in the Nordics. Most of the
issued green bonds are from Sweden.
We thought that we would find also a negative premium as Zerbib (2019). The negative
premium would have stated "the fact that the buying pressure relative to the supply
capacity in the case of green bonds is greater than that in conventional bonds" (Zerbib
(2019)). The negative premium can also explain the stakeholder theory that a better
environmental performance decreases the cost of capital (Zerbib (2019)). Issuer could
benefit of the negative green bond premium. The market is ready to take more green
debt and to offer a primary yield that is a bit lower than the conventional bond (Zerbib
(2019)). Our result is opposite of the aforementioned and it seems that the green
bonds are being sold by discount and the buyers would benefit from this situation. This
would mean also that it is more expensive to issue green bonds than conventional
bonds.
We note also that the median premium was negative but the mean was slightly
positive. When the issued bonds are in Swedish crowns it has a positive impact like if
the issuer is something else than a financial institution. Issue amount seems to have a

52
positive impact also to the premium. Zerbib (2019) notes that the negative premium is
larger for financial bonds and it seems that our results state the same.
The most largest limitations of our research is the data. The data is so narrow that we
were not able to use all the same methods as Zerbib (2019) but we wanted study the
Nordics because the Nordic countries are often pioneers in sustainable development
and also well organized and trustworthy. In the future there will be more green bonds
and there is available data from a longer time period and further researchs can be
done also in the Nordics regarding the green bonds.
Due to results of our paper we cannot state that the issuers are able to get cheaper
financing through green bonds because our premium was positive even though just
slightly. The buyers would be able to buy green bonds with a discount.
53
References
Baker, M.P., Bergstresser, D.B., Serafeim, G., Wurgler, J.A. (2018). Financing the
response to climate change: The pricing and ownership of U.S. green bonds.
Harvard Business School. Retrieved from: https://www.brookings.edu/wp-
content/uploads/2018/07/Wurgler-J.-et-al.pdf. Read: 20.7.2020.
Barber, B.M., Morse, A., Yasuda, A. (2020). Impact Investing. Retrievied from
https://papers.ssrn.com/sol3/papers.cfm?abstract_id=2705556&download=yes.
Read: 22.9.2020.
Barua, S., Chiesa, M. (2019). Sustainable financing practices through green bonds:
What affects the funding size? Business Strategy and the Environment. Volume
28, issue 6, p. 1131 - 1147.
Barclays. (2015). The Cost Being Green. Credit research. Retrieved from:
https://www.environmental-
finance.com/assets/files/US_Credit_Focus_The_Cost_of_Being_Green.pdf.
Read: 19.9.2020.
Bloomberg. (2017). Investors are willing to pay a "green" premium. Bloomberg New
Energy Finance report.
Bloomberg Philanthropies (2015). Green bonds - Mobilising the debt capital markets for
a low-carbon transition. Retrieved from:
https://www.oecd.org/environment/cc/Green%20bonds%20PP%20%5Bf3%5D
%20%5Blr%5D.pdf. Read: 7.6.2020.
Braun, M.Z. (2019). Muni-bond buyers want tax breaks. Saving the Earth? Not much.
Bloomberg. Retrieved from: https://www.bloomberg.com/news/articles/2019-

54
04-11/muni-bond-buyers-want-tax-breaks-saving-the-earth-not-so-much. Read:
3.10.2020.
Campbell, J., Taksler, G. (2003). Equity volatility and corporate bond yields. Journal of
Finance. Volume 58, issue 6, p. 2321-2350.
Chava, S. (2014). Environmental externalities and cost of capital. Management Science.
Volume 60, issue 9, p. 2223–2247.
Chiang, J. (2017). Growing the U.S. Green Bond Market. Volume 1. California State
Treasurer’s Office.
Climate Bonds Initiative (2018). Green bonds: The state of the market 2018. Retrieved
from: https://www.climatebonds.net/resources/reports/green-bonds-state-
market-2018. Read: 3.6.2020.
Cochu, A., Glenting, C., Hogg, D., Georgiev, I., Skolina, J., Elsinger, F., Jespersen, M.,
Agster, R., Fawkes S., & Chowdury, T. (2016). Study on the potential of green
bond finance for resource-efficient investments. Report. European Commission.
Dhaliwal, D., Li, O., Tsang, A., Yang, Y. (2011). Voluntary nonfinancial disclosure and the
cost of equity capital: the initiation of corporate social responsibility reporting.
The Accounting Review. Volume 86, issue 1, p. 59–100.
Ehlers, T., Packer, F. (2017). Green bond finance and certification. Bank for International
Settlements Quarterly Review.
EU HLEG (2018). Financing a sustainable European economy. Final Report 2018 by the
High-Level Expert Group on Sustainable Finance. Retrieved from:

55
https://ec.europa.eu/info/sites/info/files/180131-sustainable-finance-final-
report_en.pdf. Read: 7.7.2020.
European Commission (2018). Action plan: Financing Sustainable Growth. Retrieved
from: http://eur-lex.europa.eu/legal-content/EN/TXT/PDF/?uri=CELEX:
52018DC0097&from=EN. Read: 7.7.2020.
Febi, W., Schäfer, D., Stephan, A., Sun, Chen. (2018). The impact of liquidity risk on the
yield spread of green bonds. Finance Research Letters. Volume 27, p. 53-59.
Flammer, C. (2018). Corporate Green Bonds. SSRN Electronic Journal. Retrieved from:
https://papers.ssrn.com/sol3/papers.cfm?abstract_id=3125518&download=yes.
Read: 25.6.2020.
Fong, K., Holden, C., Trzcinka, C. (2017). What Are the Best Liquidity Proxies for Global
Research. Review of Finance. Volume 21, issue 4, p. 1355 - 1401. Retrieved from:
https://doi.org/10.1093/rof/rfx003. Read: 16.4.2021.
Ge, W., Liu, M. (2015). Corporate social responsibility and the cost of corporate bonds.
Journal of Accounting and Public Policy. Volume 34, issue 6, p. 597–624.
Gianfrate, G., Peri, M. (2019). The green advantage: Exploring the convenience of
issuing green bonds. Journal of Cleaner Production. Volume 219, p. 127-135.
Goss, A., Roberts, G. (2011). The impact of corporate social responsibility on the cost of
bank loans. Journal of Banking and Finance. Volume 35, issue 7, p. 1794–1810.
Hasan, I., Hoi, C., Zhang, H. (2017). Social Capital and Debt Contracting: Evidence from
Bank Loans and Public Bonds. Journal of Financial and Quantitative Analysis.
Volume 52, issue 3, p. 1017–1047.
56
Helwege, J., Huang, J-Z., Wang, Y. (2014) Liquidity effects in corporate bond spreads.
Journal of Banking & Finance. Volume 45, p. 105 - 116.
Houweling, P., Mentink, A., Vorst, T. (2005). Comparing possible proxies of corporate
bond liquidity. Journal of Banking & Finance. Volume 29, issue 6, p. 1331 - 1358.
HSBC. (2016). Green Bonds 2.0. Fixed Income Credit report.
Hyun, S., Park, D., Tian, Shu. (2019). The price of going green: the role of greenness in
green bond markets. Accounting & Finance. Volume 60, issue 1, p. 73-95.
International Capital Market Association (2018). Green Bond Principles; Voluntary Pro-
cess Guidelines for Issuing Green Bonds. Retrieved from:
https://www.icmagroup.org/assets/documents/Regulatory/Green-
Bonds/Green-Bonds-brochure-150616.pdf. Read: 4.6.2020.
International Capital Market Association (2017). The GBP Databases and Indices
Working Group – Summary of Green Bond Database Providers. Retrieved from:
https://www.icmagroup.org/assets/documents/Regulatory/Green-Bonds/
Green-Bond-Databases-Summary-Document-190617.pdf.
Kapraun, J. and Scheins, C. (2019). (In)-Credibly Green: Which Bonds Trade at a Green
Bond Premium? Proceedings of Paris December 2019 Finance Meeting
EUROFIDAI - ESSEC. Retrieved from: http://dx.doi.org/10.2139/ssrn.3347337.
Read: 20.4.2021.
Karpf, A. and Mandel, A. (2018). The Changing Value of the ‘Green’ Label on the US
Municipal Bonds Market. Nature Climate Change. Volume 8, issue 2, p. 161-165.

57
Kempf, A. and Osthoff, P. (2007). The Effect of Socially Responsible Investing on Portfolio
Performance. European Financial Management. Volume 13, issue 5, p. 908–922.
Klock, M., Mansi, S., Maxwell, W. (2005). Does Corporate Governance Matter to
Bondholders. Journal of Financial and Quantitative Analysis. Volume 40, issue 4,
p. 693–717.
Larcker, D.F., Watts, E.M. (2020). Where's the greenium? Journal of Accounting and
Economics. Volume 69, issues 2-3. Retrieved from: https://www-sciencedirect-
com.libproxy.aalto.fi/science/article/pii/S0165410120300148. Read: 21.7.2020.
Magnanelli, B.S., Izzo, M.F. (2017). Corporate social performance and cost of debt: the
relationship. Social Responsibility Journal. Volume 13, issue 2, p. 250–265.
Martin, P.R., Moser, D.V. (2016). Managers' green investment disclosures and investors'
reaction. Journal of Accounting and Economics. Volume 6, issue 1, p. 239-254.
Menz, K. (2010). Corporate social responsibility: is it rewarded by the corporate bond
market? A critical note. Journal of Business Ethics. Volume 96, p. 117–134.
Oikonomou, I., Brooks, C., Pavelin, S. (2014). The Effects of Corporate Social
Perfomance on the Cost of Corporate Debt and Credit Ratings. The Financial
Review. Volume 49, issue 1, p. 49-75.
Organisation for Economic Co-operation and Development (OECD, 2017). Mobilising
Bond Markets for a Low-Carbon Transition, Green Finance and Investment.
OECD Publishing, Paris. Retrieved from: https://read.oecd-
ilibrary.org/environment/mobilising-bond-markets-for-a-low-carbon-
transition_9789264272323-en#page1. Read: 9.6.2020.

58
Riedl, A., Smeets, P. (2017). Why do investors hold socially responsible mutual funds?
The Journal of Finance. Volume 72, issue 6, p. 2505-2550.
Semenova, N., Hassel, L. (2013). Industry risk moderates the relation between
environmental and financial performance. Sustainable Investment Research
Platform Working Papers. Retrieved from:
https://www.researchgate.net/publication/5093409_Industry_Risk_Moderates
_the_Relation_between_Environmental_and_Financial_Performance. Read:
9.6.2020.
Stellner, C., Klein, C., Zwergel, B. (2015). Corporate social responsibility and Eurozone
corporate bonds: the moderating role of country sustainability. Journal of
Banking & Finance. Volume 59, p. 538 - 549.
Tang, D., Zhang, Y. (2018). Do shareholders benefit from green bonds? Journal of
Corporate Finance. Volume 61.
Taskforce for Climate related Financial Disclosure (TFCD (2017)). The task force on
climate-related financial disclosures. Retrieved from https://www.fsb-
tcfd.org/publications/final-recommendations-report/. Read: 15.11.2020.
Zerbib, O.D. (2019). Is there a Green Bond Premium? The yield differential between
green and conventional bonds. Journal of Banking and Finance. Volume 98, p.
39–60.