is networking a substitute or a complement to regional innovation
TRANSCRIPT

EUR 23836 EN - 2009
Is networking a substitute or a complement to regional innovation capacity? Evidence from the EU's 5th Framework Programme
Authors: Attila Varga and Dimitrios Pontikakis

European Commission Joint Research Centre - Institute for Prospective Technological Studies Directorate General Research Contact information Address: Edificio Expo. c/ Inca Garcilaso, 3. E-41092 Seville (Spain) E-mail: [email protected] Tel.: +34 954488318 Fax: +34 954488300 IPTS website: http://ipts.jrc.ec.europa.eu JRC website: http://www.jrc.ec.europa.eu DG RTD website: http://ec.europa.eu/research/ Legal Notice Neither the European Commission nor any person acting on behalf of the Commission is responsible for the use which might be made of this publication.
Europe Direct is a service to help you find answers to your questions about the European Union
Freephone number (*):
00 800 6 7 8 9 10 11
(*) Certain mobile telephone operators do not allow access to 00 800 numbers or these calls may be billed.
A great deal of additional information on the European Union is available on the Internet. It can be accessed through the Europa server http://europa.eu/ JRC 51996 EUR 23836 EN ISSN 1018-5593 Luxembourg: Office for Official Publications of the European Communities © European Communities, 2009 Reproduction is authorised provided the source is acknowledged Printed in Spain

Is networking a substitute or a complement to regional
innovation capacity? Evidence from the EU's 5th
Framework Programme
Attila Varga and Dimitrios Pontikakis

Acknowledgements
This report is part of ongoing work in the frame of the ERAWATCH project (http://cordis.europa.eu/erawatch/), undertaken by the Knowledge for Growth Unit at the Institute for Prospective Technological Studies (IPTS) of the Joint Research Centre (JRC), European Commission in collaboration with Directorate General for Research (DG RTD), Directorate C. We are grateful to George Chorafakis (Unit A3, DG RTD) who co-authored the scientific paper that underpins the present policy note and Catharina Bamps (Competitiveness and Sustainability Unit, JRC-IPTS) for help with improving our maps. We also thank Michele Cincera, Laura de Dominicis, Xabier Goenaga, Jan Larosse, the participants to an IPTS Seminar on this topic and to the Dynamics of Institutions and Markets in Europe (DIME) International Workshop "Reconsidering the Regional Knowledge Economy: Theoretical, Empirical and Policy Insights from Diverse Research Approaches", University of Newcastle upon Tyne, for their constructive comments and suggestions. We extend our gratitude to Paul Cunningham and Lena Tsipouri who reviewed the present policy note in their capacity as members of the QANA group. Any errors and omissions are the responsibility of the authors. The views expressed are those of the authors and may not in any circumstances be regarded as stating an official position of the European Commission.

Executive Summary
A recent debate in the context of the future evolution of the European Research Area is concerned with the optimal spatial and thematic allocation of resources for research. This stems from a concern that EU research funds are spread too thinly across Europe without achieving the impact that is expected of them. "Smart specialisation" or the spatial and thematic concentration of R&D resources on the basis of existing patterns of technological specialisation, is put forward as one possible policy direction. Agglomeration economies have been shown to be important for research: scientists and technologists tend to be more productive when located in proximity to populous communities of knowledge workers and knowledge-intensive business services. Network effects have also been shown to have a positive influence on regional knowledge production processes. A policy of sustaining or even increasing the degree of connectedness in EU research, or "networked specialisation" is therefore put forward as a possible alternative. The present policy note draws from original empirical work attempting to shed some light on the joint importance of regional innovation capacity (proxied by a novel index of regional agglomeration of knowledge intensive employment) and scientific networking (proxied by an index of interregional collaboration in Framework Programme (FP) 5) on R&D productivity and draw comparisons. We find that regional innovation capacity and scientific networking are neither complements nor substitutes but have different functions according to the type of research involved. Our findings indicate that there are distinct paths to obtaining "critical mass" for scientific and technological research. The regional agglomeration of innovation capacity is important for the productivity of technological research whereas this is not the case for scientific research; likewise, scientific research is more productive in regions that are well connected in interregional knowledge production networks, but the same networking has no discernible effect on technological research. These findings suggest that differentiated responses will be needed, with increased networking for scientific research and a strengthening of regional innovation capacity for technological research. In that respect, the adoption of fine-tuned instruments for industry (Integrated Projects (IP), Specific Targeted Research Projects (STREP)) and science (Networks of Excellence (NoE)) from FP6 onwards appear to be a step in the right direction. Complementary interventions will be needed to support the innovation capacity of lagging regions.

Interregional networking vs. regional innovation capacity: the case of FP5
Page 1 of 17
1. Introduction
A recent debate is concerned with the optimal spatial and thematic allocation of resources for research1. This stems from a concern that EU research funds are spread too thinly across Europe without achieving the impact on growth and employment that is expected of them2. The recent Green Paper on the European Research Area expresses concern at the lack of critical mass and suggests that "[…] some concentration and specialisation is necessary […]3". Precisely what policies may foster such changes is still an open question. "Smart specialisation" or the spatial and thematic concentration of R&D resources on the basis of existing patterns of technological specialisation, is put forward as one possible policy direction4. This draws from a long strand of literature on economic geography (dating back to the pioneering work of Alfred Marshall) which highlights the positive effects of regional concentration of economic activity, or what is often referred to as agglomeration economies. Agglomeration economies have been shown to be important for research: scientists and technologists tend to be more productive when located in proximity to populous communities of knowledge workers and knowledge-intensive business services. Modern Information and Communication Technologies (ICTs) offer the possibility for delocalised contact and collaboration. It has therefore been argued, that delocalised networking could complement agglomeration economies or (in their absence) even substitute them5. The Framework Programme for research (FP), the major EU research policy instrument, is implicitly built on this assumption. The FP unites research teams from across Europe, promotes an international and interregional division of labour and facilitates the sharing of knowledge and capacity building. Impacts stemming from networking, as distinct to those of other factors, are often referred to as network effects. Network effects have also been shown to have a positive influence on regional knowledge production processes. A policy of sustaining or even increasing the degree of connectedness in EU research, or "networked specialisation" is therefore put forward as a possible alternative6. However, until now, the forces of agglomeration and networks have not been studied jointly. The present policy note draws from original empirical work attempting to shed some light on the joint importance of regional innovation capacity and scientific networking on R&D productivity and draw comparisons.
1 See the contributions of participants to the JRC-IPTS workshop "R&D Specialisation in the EU" (Barcelona, June 30, 2008) in Pontikakis, Kyriakou and van Bavel (forthcoming). 2 Foray and Van Ark (2007). For a similar assessment of the performance of European universities (though not specific to EU funds) see Soete, L. (2005). 3 CEC (2007), p. 14 4 Foray and Van Ark (2007) 5 Johansson and Quigley (2004) 6 Georghiou et al. (2008)
Interregional networking vs. regional innovation capacity: the case of FP5
Page 2 of 17
2. Why R&D productivity matters
Not all regions get the same amount of knowledge outputs for a given level of inputs. Improvements in R&D productivity are one of the principal expectations attached to policy arguments in favour of specialisation. Faced with a budget constraint, a rational decision maker will want to maximise the amount of output that can be had for a given level of inputs. From a public finance perspective, governments would like to ensure that their R&D expenditures have a meaningful impact. Private companies too make decisions on the location of their R&D investments on the basis of expectations about future returns. In the long-run and for a given level of commitment to R&D7, interregional convergence of research capacities is conditional on improvements in R&D productivity.
3. The determinants of regional R&D productivity
Literature insights Localised interactions play a central role in innovation8. The importance of scale effects on the productivity of regional innovation systems has also been acknowledged: prior work9 has identified a threshold level of regional agglomeration, above which increases in the marginal productivity of R&D inputs can be expected. This suggests that regional research efforts can have a much more meaningful impact where a critical mass of agglomeration (in terms of business services and high-technology employment) is present. Other studies emphasise the role of networks and evolving structural features and highlight the systemic nature of regional knowledge production processes10. Importantly, different types of research impose different requirements on scale and place a different emphasis on tacit knowledge and by extension, proximity11. A sharp contrast can be expected between the worlds of scientific and technological research. Scientific research relies to a great extent on knowledge codified in scientific publications. This is possible because in the world of academic research openness and sharing of methodological steps and findings tend to be the norm. To contrast with, research seeking technological improvements is, more often than not, motivated by expectations of monetary returns which may be undermined by full disclosure. Much of the knowledge that is relevant for cutting-edge research of this type is therefore often not codified and even when it is, secrecy and intellectual property rights are used to limit its 7 The difficulties faced so far in reaching the Lisbon's Strategy's elusive 3% target, serve to underscore the limits of what can be achieved by resource mobilisation. And although the impact of the current financial crisis on R&D expenditures remains to be seen (in the US at least the American Recovery and Reinvestment Act foresees generous endowments for scientific research), an adverse macroeconomic outlook has traditionally been associated with the rationing of R&D resources. Both contingencies bring the issue of R&D productivity to the fore. 8 Jaffe et al. (1993) and Anselin et al. (1997) 9 Varga (2000) 10 Maggioni, et al. (2007); Ponds et al. (2009) 11 Malmberg and Maskell (1997)

Interregional networking vs. regional innovation capacity: the case of FP5
Page 3 of 17
widespread diffusion. As a result, research conducted with economically useful applications in mind places a premium on tacit knowledge – that is knowledge possessed by individuals that can by definition be only in one place at any one time. An econometric analysis of regional knowledge production supported by FP5 Our empirical work is based on aggregate statistics at the level of regions (see the Annex for a description of data and sources). We proxy agglomeration economies with a novel index of regional innovation capacity (δi) and network effects with an index of interregional collaboration in FP5 (NETi). Our analysis estimates an enhanced Romer-Jones knowledge production function (KPF) at the EU regional level, within a framework that also takes into account possible spatial dependence effects (see extensive description in the Annex). In its simplest form (see Figure 1), knowledge outputs (in our case counts of patents and publications in 2002) are assumed to be a function of R&D expenditures (our variable GRD2001, i.e. regional GERD for 2001), past knowledge (our variable PSTCK2001, i.e. accumulated stock of EPO patents by 2001, depreciated) and other variables (including various forms of spatial dependence). This framework allows us to estimate jointly the effects of regional innovation capacity and scientific networking on R&D productivity and draw comparisons.
Figure 1: A conceptual diagram of new knowledge flows
We estimate the KPF separately for patents and publications, testing for the statistical significance of regional innovation capacity and interregional collaboration in FP5. A detailed description of the econometric analysis and its results can be found in the Annex. The main findings can be summarised as follows. With respect to the production of patents:
• Innovation flows throughout European regions are on average about proportionate to R&D inputs;
• Regional innovation capacity has a positive, statistically significant and quantitatively distinct effect on R&D productivity, confirming the significance of agglomeration effects;
Knowledge outputs
(patents /
scientific publications)
R&D expenditures
Past knowledge
(other variables, incl. spatial dependence)
(productivity of R&D moderated by innovation capacity, networking)

Interregional networking vs. regional innovation capacity: the case of FP5
Page 4 of 17
• The average R&D expenditures of collaborating regions do not affect R&D productivity in the region, suggesting that FP5 networks did not have a statistically significant effect on regional patenting;
• Historically accumulated technological knowledge has a positive, statistically significant and quantitatively distinct effect on regional patenting;
• Overall, the inventive performance of adjacent regions does not seem to affect a region's innovation flows. However, the statistical importance of distance hints at some other important spatial limitation, possibly national boundaries.
With respect to the production of scientific publications:
• Gross regional R&D expenditures explain most of the variation, and, as with patents, the production of scientific publications is about proportional to R&D expenditures (near unit-elasticity);
• Strikingly, agglomeration effects appear to have no statistically significant influence on scientific R&D productivity;
• On the contrary, interregional scientific networking in FP5 exerts a statistically significant and quantitatively distinct influence on scientific R&D productivity. In other words, networked regions can perform research efficiently even in the absence of regional agglomeration;
• The fact that none of the spatial dependence measures is statistically significant, confirms the importance of codified (as opposed to tacit) knowledge for scientific research.
On the basis of the model coefficients, we can calculate robust estimates (i.e. controlling for factors such as R&D expenditures, prior knowledge stock and spatial dependence) of R&D productivity, given each region's innovation capacity endowment (δi) and manifested networking in FP5 (NETi)12. As such, the following maps (Figures 2 and 3) relate the estimates of our models to the contemporary reality of the regional landscape in the EU, offering a more intuitive way of interpreting them. To facilitate comparisons, these are normalised in terms of standard deviations from the European average. A quick glance at Figure 2 confirms that regions that are known for their high regional innovation capacity (industrial centres of Western Europe, Sweden, Finland and capital cities elsewhere) were amongst the most productive in terms of patenting. Likewise, Figure 3 highlights regions which scored highly in terms of interregional networking in FP5 and, by extension, in terms of scientific productivity.
12 The calculation method is detailed in the Annex (p. 17).

Interregional networking vs. regional innovation capacity: the case of FP5
Page 5 of 17
Figure 2: Regional R&D productivity in patenting (expressed in standard deviations from the European average)

Interregional networking vs. regional innovation capacity: the case of FP5
Page 6 of 17
Figure 3: Regional R&D productivity in publications (expressed in standard deviations from the European average)

Interregional networking vs. regional innovation capacity: the case of FP5
Page 7 of 17
4. Conclusions
We find that both regional innovation capacity and scientific networking are important for regional R&D productivity. They are however neither complements nor substitutes but have different functions according to the type of research concerned. Our findings indicate that there are distinct paths to obtaining "critical mass" for scientific and technological research. The regional agglomeration of innovation capacity is important for the productivity of technological research whereas this is not the case for scientific research; likewise, scientific research is more productive in regions that are well connected in interregional knowledge production networks, but the same networking has no discernible effect on technological research. The above suggests that a single-pronged instrument that does not distinguish between the two will miss part of its target. The increases in interregional networking that are promoted by the FP appear to have a substantial effect on the productivity scientific research, but more will need to be done to promote technological research. Appropriately adjusted contracts for industry support introduced in FP6 appear to be a step in the right direction: As data for later years13 becomes available, further work could extent this analysis to FP6 and examine the role of such newly introduced instruments as IPs, STREPs (for industry) and NoEs (for science). Supporting the development of regional innovation capacities in lagging regions will not be easy: Our study suggests that regional innovation capacity takes time to develop and comprises a cognitive (knowledge stocks) element as well as an economic element (knowledge-intensive employment). The involvement of diverse policy domains (education, industrial, labour, fiscal policy), the constructive deployment of complementary instruments (direct funding, fiscal incentives, awareness raising) and an intensified coordination of interventions at various levels (European, national, regional) seem necessary.
13 The additional indicators that would be needed to evaluate the impact of FP6 (covering the period 2002-2006) are still not available as there is a considerable lag between the time research was actually done and the time by which it leaves a measurable trail (e.g. in scientific publications, patents).

Interregional networking vs. regional innovation capacity: the case of FP5
Page 8 of 17
Annex: Data and Methodology
Data Sources The study draws on data from DG RTD's Regional Key Figures14 (RKF) database (which uses combined Eurostat, OECD and CTWS data) and Eurostat's New Cronos database. Our estimates are based on regional-level data for 190 European regions (a mixture of NUTS2 and NUTS1 regions) where information was complete enough for the purposes of our study (see Figures 1 and 2). The study also makes use of original data, extracted from the Commission's internal FP participations databases (containing information not only on projects but also on details of the participants) to construct an indicator of interregional collaboration in FP5 networks15: An n by n matrix has been constructed (where n=number of NUTS regions in the sample) where a matrix element with a value 1 means a common FP project of two regions and zero otherwise. This matrix is used to calculate the average R&D expenditures of network partner regions for each region16. We use counts of patents17 as a proxy of new technological knowledge and counts of scientific journal publications as a proxy of new scientific knowledge. We use a cross-section of EU regions as opposed to a panel, due to limited data in the time-series dimension. A quick glance over the regional R&D and patenting data for Europe indicates that, even where the data is complete, variation in the time-series dimension is small. Dependent variables are lagged by one period, reflecting the dynamic nature of our system. Temporally lagged dependent variables have the added advantage of partially countering potential endogeneity problems. Spatial econometric tests and, where appropriate, adjustments have been made in all estimates. Three different types of national patent stocks were constructed and tested empirically: patent stocks with no depreciation (Porter and Stern, 2000; Furman, Porter and Stern, 2002), and, using the perpetual inventory method (PIM), patent stocks with a 13 per cent (Park and Park, 2006) and a 15 per cent annual depreciation rate (Hall, 1993) respectively. Non-depreciated stocks are simply the cumulative number of patent applications from 1992 on, while PIM estimates of contemporary patent stocks are based on the following formula:
PSTCKt = PSTCK t-1 * (1 - d) + PAT t
14 RKF is a novel database combining publicly available science, technology and innovation indicators from various disparate sources with indicators that have been developed for Commission use. The database has been commissioned by DG RTD and is implemented by Fraunhofer ISI. Data on scientific publications in particular are Thomson's ISI and were compiled by CWTS, Leiden University. 15 We are indebted to our colleague George Chorafakis for providing us with this measure. 16 The binary approach was preferred to say, a numerical count of pairwise collaborations, given the small number of observations in many pairs of European regions. 17 Although patent counts are far from a perfect proxy of innovation (Griliches, 1990), they are the only measure that is available for a large number of European regions and over a number of years. Comfortingly, previous research has shown that at the level of regions, patent counts correlate well with innovation counts (Acs, Anselin and Varga, 2002) and both measures provide very similar results in the knowledge production function context.

Interregional networking vs. regional innovation capacity: the case of FP5
Page 9 of 17
Where PATt are contemporary patent flows and d is the depreciation rate (0.13 or 0.15). Like other independent variables all patent stock variables are lagged by one period. Initial stocks are set in year 1998 taking into account compound annual growth in the five preceding years18. As most measures of absolute concentration of economic activity introduce multicollinearity, they are likely to be problematic in a regression context with interaction terms. We overcome this problem by using a novel index of regional innovation capacity, δ, proxied by the agglomeration of knowledge intensive employment. Our index is a size-adjusted (in the spirit of the index developed by Elison and Glaeser (1997)) variant of the popular location quotient (LQ) measure and is calculated as:
δi=[(EMPKIi/EMPKIEU) / (EMPi / EMPEU)] / [(1-Σj(EMPKIij / EMPKIj,EU)] [1-(EMPi / EMPEU)] Where EMPK is employment in knowledge intensive economic sectors19, EMP is total employment and the subscripts i and EU stand for region and EU aggregate respectively. Just like the LQ, δ has the interesting property of taking a value of 1 for regions with a level of agglomeration close to the EU average. However, unlike the LQ, in δ the denominator is designed in such a way as to penalise small regions, by yielding higher values for regions with a higher level of employment. As δ captures economic activity that is heavily involved not only in the production but also in the diffusion, assimilation and productive deployment of knowledge, we consider it an appropriate indicator of regional innovation capacity. Analytical Framework A spatial econometric methodology has been employed to model the relationships between R&D and other variables. We employ a multiple equation system20 encompassing a knowledge production function (KPF), a function modelling the parameter (beta) of the R&D variable in the KPF, a function estimating the spatial location of R&D expenditures and a function estimating the spatial location of regional innovation capacity. Our starting point is the basic KPF initially specified by Romer (1990) and parameterised by Jones (1995):
Eq.1 dA = δ HAλ Aφ,
Where HA refers to research inputs (e.g. number of researchers or research expenditures), A refers to the total stock of technological knowledge (codified knowledge component of knowledge production in books, patent documents etc.), dA refers to the 18 Initial stock equals flows for first year divided by the sum of compound growth for the preceding five year period and the depreciation rate. As all patent stock variables are time t-1, annual compound growth rates for the PIM variables were calculated for the 5 year period 1992-1997. Exceptions are Malta and Lithuania, where due to lack of data in the time series dimension, the preceding 4 year period (1993-1997) was used instead. For the non-depreciated stocks, a value of 1 was assumed in the case of Lithuania for 1992 (which is close to the average for that country in the following two years), while the 1998 value was estimated as the average of 1997 and 1999. 19 The classification of knowledge intensive economic sectors (devised by Eurostat) includes: high and medium high technology manufacturing (NACE 1.1 sectors, 24, 30, 32, 33, 35.3, 29, 31, 34, 35 (excluding 35.1 and 35.3)), high technology services, knowledge intensive market services (NACE 1.1 sectors 61, 62, 70, 71, 74), financial services (NACE 1.1 sectors 65, 66, 67), amenity services – health, education, recreation (NACE 1.1 sectors 80, 85, 92). 20 This framework draws heavily from Varga (2006), where the rationale for the specification of equations is explained in further detail.

Interregional networking vs. regional innovation capacity: the case of FP5
Page 10 of 17
change in technological knowledge, δ is the "research productivity parameter" (0<δ<1), φ is "codified knowledge spillovers parameter" (reflects spillovers with unlimited spatial accessibility) and λ is the "research spillovers parameter" (reflects the geography of knowledge spillovers). Eq. 1 suggests that an increase in the resources devoted to research (HA) or to the amount of existing knowledge accessible to researchers (A) will have a positive effect on technological change (dA). We adopt here the spatial interpretation of the Romer equation outlined in Varga (2006: 1175) which, drawing from literature on regional and urban economics and the new economic geography, assumes that the parameter of HA, λ changes with the geographic concentration of economic activities. The size of the parameter could vary, depending on the balance between positive and negative agglomeration economies. Eq. 2 describes regional knowledge production, specifying Kr, the amount of new knowledge produced in region r as some function of R&D inputs and other factors Zr such as the level of regional agglomeration21.
Eq.2 Kr = K (RDr, Zr)
As emphasised by as diverse strands of literature as endogenous growth accounting, innovation systems and the new economic geography, knowledge production is a dynamic, cumulative process. This process is described by Eqs. 3 and 4a,b. In a static context (Eq. 3), research already in the region (RD) and agglomeration (Zr) affect R&D productivity across regions (∂Kr/∂RDr).
Eq.3 ∂Kr/∂RDr = f (RDr, Zr)
However, changes in RDr and Zr (dRDr and dZr) are themselves determined by manifested R&D productivity and research already in the region respectively. This dynamic effect is described in equations 4a and 4b: in Eq. 4a the geographic distribution of R&D expenditures is a function of R&D productivity across different regions whereas in Eq. 4b the level of regional agglomeration is a function of research already in the region.
Eq.4a dRDr = R(∂Kr/∂RDr)
Eq.4b dZr = Z(RDr)
At the national level, the magnitude of λ, reflecting the impact that the same number of researchers has on technological change, depends on the geographic structure of HA (where HA = Σr RD).
Eq.5 λ = λ (GSTR(HA))
Correspondingly, the rate of national technological change may be described in the Romer-Jones fashion as:
Eq.6 dA = δ HA λ Aφ
21 Alternatively Z may reflect network effects: its precise specification is an empirical matter.

Interregional networking vs. regional innovation capacity: the case of FP5
Page 11 of 17
The above equations may be tested empirically, subject to the availability of appropriate data. We proxy R&D inputs with data on regional R&D expenditures and new knowledge flows with data on patent applications to the EPO with at least one inventor based in the region. In order to test empirically these relationships we use the following econometric specifications. In terms of functional form we opt for a (natural) logarithmic conversion of all our variables, which has the appealing quality of allowing the interpretation of coefficients as elasticities22. Using subscripts i and N to denote individual regions and nations (in our case EU member states) respectively, the regional KPF may be specified as: Eq. 7. Log(Ki)= α0+ α1Log(RDi)+ α2Log(PSTCKN) + εi
Eq. 8. α1,i= β0+ β 1Log(δi)+ β 2Log(NETi) + εi
Eq. 9. Log(Ki)= α0+ β0Log(RDi)+ β 1Log(δi)Log(RDi)+β 2Log(δi)Log(RDi) α2Log(PSTCKN)
where α1,i is regional research productivity, δi is regional innovation capacity, NETi is interregional research networks and PSTCKN is national patent stock. The above are essentially empirical tests of equations 2 and 3. Following on, the determinants of the location of R&D expenditures (RDi) and regional innovation capacity (δi) may be empirically tested by:
Eq. 10 Log(RDi) = λ0 + γ1Log(α1,i) + λ1Log(PSTCKN,i)+ui
Eq. 11 Log(δi) = ξ0 + ξ 1Log(RDi) + ξ 2Log(PSTCKN,i)+µi
Econometric Estimation Estimation results are presented in Tables 1 (effects on the production of patents) and 2 (effects on the production of scientific publications). Since both sides of the equation are expressed in logarithms, the regression coefficients may be interpreted as elasticities. The value of R&D coefficient in Model 1 indicates that innovation flows throughout European regions are on average about proportionate to R&D inputs. Model 2 includes the product of lagged R&D expenditures and δ, our index of regional innovation capacity. Model 2 suggests that regional innovation capacity has a positive, statistically significant and quantitatively distinct effect on R&D productivity, confirming the significance of agglomeration effects. Interpreted from an innovation systems perspective, this finding reflects the importance of knowledge interactions between different institutional actors engaged in knowledge-intensive economic activities (e.g. users versus producers, academic institutions, government actors etc) for the innovation23. The importance of collocation is also suggestive of the significance of tacit knowledge24. Taken together with 22 This functional form is common in empirical specifications of Romer-type KPFs (see Porter and Stern, 2000; Furman et al., 2002; Varsakelis, 2006). Taking logarithms also has the added advantage of minimising the influence of outliers and normalising measures expressed in different units of measurement. 23 Andersen (1992); Nelson (1993); Edquist (1997); Cooke (2001) 24 Malmberg and Maskell (1997)

Interregional networking vs. regional innovation capacity: the case of FP5
Page 12 of 17
the fact that the inventive performance of adjacent regions does not seem to affect a region's innovation flows (as Neighb is not statistically significant) this seems to be consistent with the idea of national boundaries as a brake to knowledge spillovers, though of course it is does not conclusively demonstrate its veracity. Models 3 and 4 test the significance of network effects, by including the product of gross regional R&D expenditures times the average value of the R&D expenditures with which region i had at least one joint research project in FP5 ( Log(GRD2001)*Log(NET) ). The product term is statistically insignificant with (4) or without (3) the agglomeration product. This result suggests that the average R&D expenditures of collaborating regions do not affect R&D productivity in the region. Model 5 introduces national patent stocks (PSTCK2001, PIM depreciated by 13%), indicating that historically accumulated technological knowledge has a positive, statistically significant and quantitatively distinct effect on regional patenting. Interestingly, the coefficient of Log(GRD2001)*Log(δ) drops from around 2.6 in models 2 and 4 to about 1.7, suggesting that codified knowledge spillovers capture at least some of the effect attributed to agglomeration in the previous models. In models 1-5, tests for spatial dependence indicated no influence from adjacent proximity (Neighb), but some role for distance (INV1 and INV2). In model (6), controlling for spatial dependence, the substantive results remain, although the value of the coefficient for the agglomeration interaction term is smaller and its statistical significance drops to 95 per cent. Overall, the inventive performance of adjacent regions does not seem to affect a region's innovation flows. However, the statistical importance of distance hints at some other important spatial limitation, possibly national boundaries. It is worth noting that all models explain 70 per cent or more of the variation in regional patenting. In all models there is no indication of a problem with multicollinearity, as the Multicollinearity Condition Number is below the rule-of-thumb value of 30

Interregional networking vs. regional innovation capacity: the case of FP5
Page 13 of 17
Table 2 estimates the KPF with scientific publications for year 2002 as the dependent variable. Gross regional R&D expenditures explain most of the variation, with a coefficient in model 1 (0.94) suggestive of almost constant returns to scale. Strikingly, agglomeration effects appear to have no statistically significant influence on scientific R&D productivity (Models 2 and 4), while network effects (Models 3, 4 and 5) exert a statistically significant and quantitatively distinct influence on scientific R&D productivity. It appears then that, in the case of scientific research at least, interregional networking is more important than regional agglomeration. In other words, regions can perform research efficiently even in the absence of regional agglomeration. The fact that none of the spatial dependence measures is statistically significant, confirms the importance of codified (as opposed to tacit) knowledge for scientific research. In all models, regression diagnostics indicate no problems with multicollinearity and, as with patents, the KPFs explain more than 70 per cent of variation in the data.
Table 1. Regression Results for Log (Patents) for EU regions, 2002 (N=190)
Model (1) (2) (3) (4) (5) (6) Estimation OLS OLS OLS OLS OLS IV-Spatial
Lag Constant W_Log(PAT2002) Log(GRD2001) Log(GRD2001)*Log(δ) Log(GRD2001)*Log(NET) Log(PSTCK2001)
-2.06*** (0.316)
1.131*** (0.054)
-0.951*** (0.416)
0.941*** (0.071)
0.267*** (0.068)
-2.377*** (0.431)
1.283*** (0.150)
-0.0001 (0.0001)
-1.274** (0.502)
1.096*** (0.152)
0.268*** (0.068) -0.0001 (0.0001)
-2.475*** (0.445)
0.830*** (0.067)
0.171*** (0.064)
0.238*** (0.037)
-2.677*** (0.429)
0.041*** (0.010)
0.837*** (0.064) 0.139** (0.062)
0.159*** (0.040)
R2-adj 0.70 0.72 0.70 0.72 0.77 0.79 Multicollinearity Condition Number Jarque-Bera test on normality of errors White test for heteroskedasticity LM-Err Neighb INV1 INV2 LM-Lag Neighb INV1 INV2
7
3582***
0.195
4.165 59.915*** 62.669***
0.157 52.502*** 67.106***
10
5778***
0.537
2.591 46.40*** 34.699***
0.123 43.583*** 42.889***
22
3529***
2.842
3.259* 65.397*** 58.886***
0.133 51.876*** 64.697***
24
5662***
5.506
1.912 40.966*** 32.400***
0.151 42.536*** 40.952***
13
12822***
1.619
0.671 10.502*** 12.896***
0.489 18.388*** 10.439***
0.052 1.445
6.027**
Notes: Estimated standard errors are in parentheses; spatial weights matrices are row-standardized: Neigh is neighborhood contiguity matrix; INV1 is inverse distance matrix; INV2 is inverse distance squared matrix; W_Log(PAT2002) is the spatially lagged dependent variable where W stands for the weights matrix INV1; instruments in the IV-Spatial Lag estimation are W_Log(GRD2001), W_Log(δ), W_[Log(GRD2001)*Log(δ)] and W_[Log(GRD2001)*Log(NET)], where W stands for the weights matrix INV1. *** indicates significance at p < 0.01; ** indicates significance at p < 0.05; * indicates p < 0.1.

Interregional networking vs. regional innovation capacity: the case of FP5
Page 14 of 17
On the basis of the above estimates we can calculate how R&D productivity varies according to variation in δi and NETi across Europe. BETAPATi and BETAPUBi reflect the expected percentile increase in research output, in terms of patents and publications respectively, for a one per cent increase in R&D expenditures. In both equations the first number is drawn from the estimated R&D coefficient in each of our final models and the second number from the coefficient of the product of R&D and δi and R&D and NETi respectively (Tables 1 and 2):
BETAPATi= 0.837 + 0.139 * log(δi) BETAPUBi= 0.422 + 0.0004 * log(NETi)
Table 2. Regression Results for Log (Publications) for EU regions, 2002 (N=189)
Model (1) (2) (3) (4) (5) Estimation
OLS
OLS
OLS
OLS
OLS Constant Log(GRD2001) Log(GRD2001)*Log(δ) Log(GRD2001)*Log(NET) Log(PSTCK2001)
1.352*** (0.231)
0.943*** (0.039)
1.113*** (0.316)
0.984*** (0.054) -0.058 (0.052)
2.408*** (0.296)
0.440*** (0.103)
0.0004*** (7.18E-05)
2.167*** (0.356)
0.482*** (0.108) -0.061 (0.049)
0.0004*** (7.17E-05)
2.378*** (0.308)
0.422*** (0.114)
0.0004*** (7.47E-05)
0.011 (0.030)
R2-adj 0.75 0.75 0.78 0.78 0.78 Multicollinearity Condition Number Jarque-Bera test on normality of errors White test for heteroskedasticity LM-Err Neighb INV1 INV2 LM-Lag Neighb INV1 INV2
7
35***
18.054***
1.681 0.612 0.545
2.777* 6.028** 1.421
10
44***
26.661***
1.354 0.315 0.628
2.602 5.40** 1.029
22
37***
25.774***
2.890 0.111 0.009
2.056 2.636 0.780
24
45***
19.688***
2.599 0.041 0.006
1.276 2.062 0.449
28
37***
33.071***
2.556 0.174 0.005
2.258 3.196 0.781
Notes: Estimated standard errors are in parentheses; spatial weights matrices are row-standardized: Neigh is neighborhood contiguity matrix; INV1 is inverse distance matrix; INV2 is inverse distance squared matrix. *** indicates significance at p < 0.01; ** indicates significance at p < 0.05; * indicates p < 0.1.
Interregional networking vs. regional innovation capacity: the case of FP5
Page 15 of 17
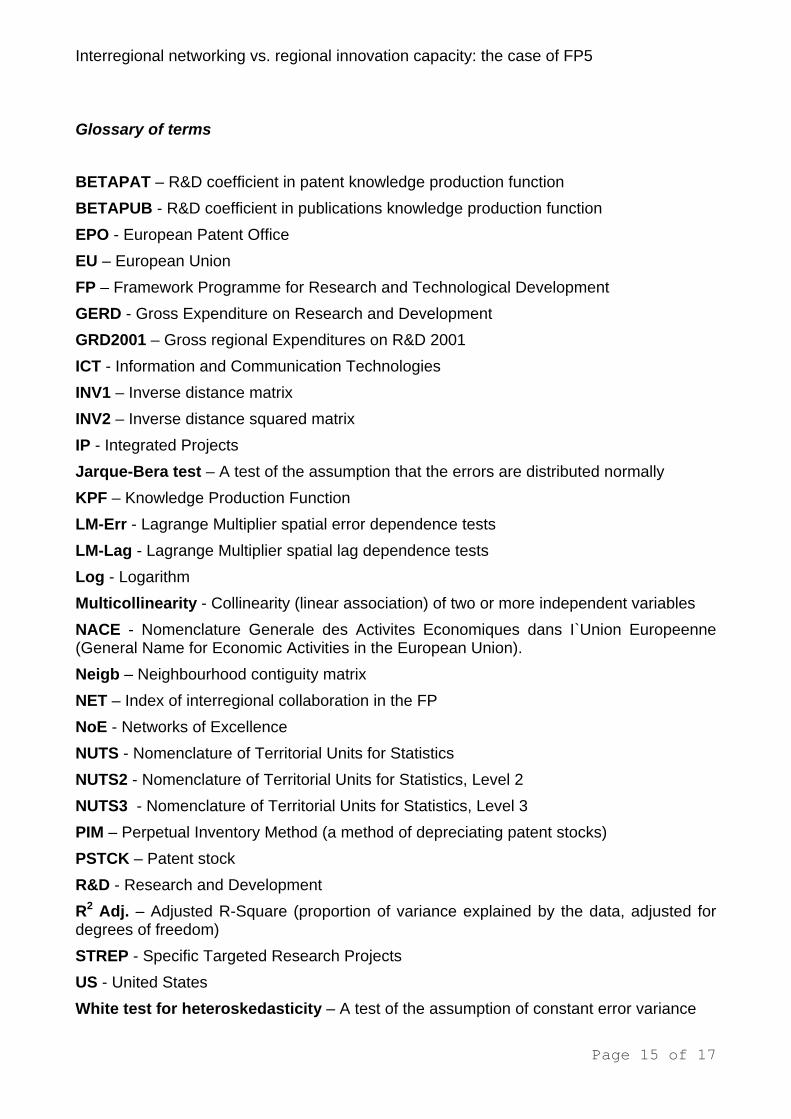
Glossary of terms BETAPAT – R&D coefficient in patent knowledge production function BETAPUB - R&D coefficient in publications knowledge production function EPO - European Patent Office EU – European Union FP – Framework Programme for Research and Technological Development GERD - Gross Expenditure on Research and Development GRD2001 – Gross regional Expenditures on R&D 2001 ICT - Information and Communication Technologies INV1 – Inverse distance matrix INV2 – Inverse distance squared matrix IP - Integrated Projects Jarque-Bera test – A test of the assumption that the errors are distributed normally KPF – Knowledge Production Function LM-Err - Lagrange Multiplier spatial error dependence tests LM-Lag - Lagrange Multiplier spatial lag dependence tests Log - Logarithm Multicollinearity - Collinearity (linear association) of two or more independent variables NACE - Nomenclature Generale des Activites Economiques dans I`Union Europeenne (General Name for Economic Activities in the European Union). Neigb – Neighbourhood contiguity matrix NET – Index of interregional collaboration in the FP NoE - Networks of Excellence NUTS - Nomenclature of Territorial Units for Statistics NUTS2 - Nomenclature of Territorial Units for Statistics, Level 2 NUTS3 - Nomenclature of Territorial Units for Statistics, Level 3 PIM – Perpetual Inventory Method (a method of depreciating patent stocks) PSTCK – Patent stock R&D - Research and Development R2 Adj. – Adjusted R-Square (proportion of variance explained by the data, adjusted for degrees of freedom) STREP - Specific Targeted Research Projects US - United States White test for heteroskedasticity – A test of the assumption of constant error variance

Interregional networking vs. regional innovation capacity: the case of FP5
Page 16 of 17
References
Andersen, E.S. (1992), "Approaching the National Systems of Innovation from the Production and Linkage Structure", edited in Lundvall, B. Å. (ed), National Systems of Innovation: Towards a Theory of Innovation and Interactive Learning, London: Pinter Anselin, L., Varga, A. and Acs, Z. (1997), "Local geographic spillovers between university research and high technology innovations", Journal of Urban Economics, 42, pp. 422–448 Commission of the European Communities, (2007), "The European Research Area: New Perspectives (Green Paper)", SEC(2007),161-412, April 4 Cooke, P., (2001), "Regional Innovation Systems, Clusters and the Knowledge Economy", Industrial and Corporate Change, Vol. 10, No. 4, pp. 945- 974 Edquist, C., (ed.) (1997), Systems of Innovation: Technologies, Institutions and Organizations, Pinter, London Ellison, G., Glaeser, E., (1997), "Geographic concentration in US manufacturing industries: a Dartboard approach", Journal of Political Economy, Vol. 105, No. 5, pp 889–927 Foray, D. and Van Ark, B. (2007), "Smart specialisation in a truly integrated research area is the key to attracting more R&D to Europe", Knowledge for Growth Expert Group, Policy Brief No 1, http://ec.europa.eu/invest-in-research/pdf/download_en/policy_brief1.pdf. Furman, J. L., Porter, M. E. and Stern, S. (2002), "The determinants of national innovative capacity", Research Policy, Vol. 31, pp. 899-933 Georghiou, L., Cooke, P., Cozzens, S., Dearing, A., Henriques, L., Langer, J., Laredo, P., Sanz Menendez, L., Weber, M. (2008), "Challenging Europe's Research: Rationales for the European Research Area (ERA)", Report of the ERA Expert Group, http://ec.europa.eu/research/era/pdf/eg7-era-rationales-final-report_en.pdf Hall, B. H. (1993), "The Stock Market's Valuation of R&D Investment During the 1980's", The American Economic Review, Vol. 83, No. 2, Papers and Proceedings of the Hundred and Fifth Meeting of the American Economic Association, pp. 259-264 Jaffe, A., Trajtenberg, M. and Henderson, R. (1993), "Geographic localization of knowledge spillovers as evidenced by patent citations", Quarterly Journal of Economics, 108, pp. 577–598 Johansson, B. and Quigley, J.M. (2004), "Agglomeration and networks in spatial economies", Papers in Regional Science, Vol. 83, pp. 1-13

Interregional networking vs. regional innovation capacity: the case of FP5
Page 17 of 17
Maggioni, M.A, Nosvelli, M. and Uberti, T.E. (2007), "Space Vs. Networks in the Geography of Innovation: A European Analysis", Papers in Regional Science, Vol. 86, No. 3, pp. 471-493 Malmberg, A. and Maskell, P. (1997), "Towards an explanation of regional specialization and industry agglomeration", European Planning Studies, Volume 5, Number 1, pp. 25-41 Nelson, R. (1993), National Innovation Systems: A Comparative Analysis, New York: Oxford University Press Park, G. and Park, Y. (2006), "On the measurement of patent stock as knowledge indicators", Technological Forecasting and Social Change, Vol. 73, pp. 793-812 Ponds, R., van Oort, F.G., Frenken, K. (2009), "Internationalization and regional embedding of scientific research in the Netherlands", edited in A. Varga (ed.), Universities and Regional Development, Cheltenham, UK and Northampton MA: Edward Elgar Pontikakis, D., Kyriakou, D, and van Bavel, R. (eds.) (forthcoming), The Question of R&D Specialisation: Perspectives and policy implications, Luxembourg: Office for Official Publications of the European Communities Porter, M. E. and Stern, S. (2000), "Measuring the 'ideas' production function: evidence from international patent output", NBER Working Papers, No. 7891, National Bureau of Economic Research Soete, L. (2005) "Activating Knowledge", Chapter on The Hampton Court Agenda: A Social Model for Europe, London: Policy Network, pp. 67-80 Varga, A. (2000), "Local Academic Knowledge Transfers and the Concentration of Economic Activity", Journal of Regional Science, Volume 40, No. 2, pp. 289-309 Varga, A. (2006), "The Spatial Dimension of Innovation and Growth: Empirical Research Methodology and Policy Analysis", European Planning Studies 9, pp. 1171-1186 Varsakelis, N.C. (2006), "Education, political institutions and innovative activity: A cross-country empirical investigation", Research Policy, Vol. 35, pp. 1083-1090

European Commission EUR 23836 EN Joint Research Centre – Institute for Prospective Technological Studies Directorate General Research Title: Is networking a substitute or a complement to regional innovation capacity? Evidence from the EU's 5th Framework Programme Authors: Attila Varga and Dimitrios Pontikakis Luxembourg: Office for Official Publications of the European Communities 2009 EUR – Scientific and Technical Research series – ISSN 1018-5593 Abstract A recent debate in the context of the future evolution of the European Research Area is concerned with the optimal spatial and thematic allocation of resources for research. This stems from a concern that EU research funds are spread too thinly across Europe without achieving the impact that is expected of them. 'Smart specialisation’ or the spatial and thematic concentration of R&D resources on the basis of existing patterns of technological specialisation, is put forward as one possible policy direction. Agglomeration economies have been shown to be important for research: scientists and technologists tend to be more productive when located in proximity to populous communities of knowledge workers and knowledge-intensive business services. Network effects have also been shown to have a positive influence on regional knowledge production processes. A policy of sustaining or even increasing the degree of connectedness in EU research, or 'networked specialisation' is therefore put forward as a possible alternative. The present policy note draws from original empirical work attempting to shed some light on the joint importance of regional innovation capacity (proxied by a novel index of regional agglomeration of knowledge intensive employment) and scientific networking (proxied by an index of interregional collaboration in FP5) on R&D productivity and draw comparisons. We find that regional innovation capacity and scientific networking are neither complements nor substitutes but have different functions according to the type of research involved. Our findings indicate that there are distinct paths to obtaining ‘critical mass’ for scientific and technological research. The regional agglomeration of innovation capacity is important for the productivity of technological research whereas this is not the case for scientific research; likewise, scientific research is more productive in regions that are well connected in interregional knowledge production networks, but the same networking has no discernible effect on technological research. These findings suggest that differentiated responses will be needed, with increased networking for scientific research and a strengthening of regional innovation capacity for technological research. In that respect, the adoption of fine-tuned instruments for industry (IPs, STREPs) and science (NoEs) from FP6 onwards appear to be a step in the right direction. Complementary interventions will be needed to support the innovation capacity of lagging regions.
How to obtain EU publications Our priced publications are available from EU Bookshop (http://bookshop.europa.eu), where you can place an order with the sales agent of your choice. The Publications Office has a worldwide network of sales agents. You can obtain their contact details by sending a fax to (352) 29 29-42758.