is it still pizza, spaghetti and mandolino? on the ... annual meetings/2007-austria... · is it...
TRANSCRIPT

Is It Still Pizza, Spaghetti and Mandolino? On the Evolution of
Corporate Ownership in Italy
STEFANO MENGOLI, FEDERICA PAZZAGLIA AND ELENA SAPIENZA1
ABSTRACT
This paper investigates the effect of government regulations that are inspired by the Anglo-Saxon
model of corporate governance in countries characterized by poor balance between ownership
and control. We use the example of Italy, a country characterized with poor corporate
governance systems, which recently experienced a series of regulatory changes to radically
reform the system. We find that although the separation of ownership and control of listed firms
reduced over time, it was fostered by increased shareholder awareness and pressure from
investors rather than by government regulations. Also, whilst regulations caused a shift in the
level of control of listed companies towards new thresholds as dictated by the novel regulations,
they still remained completely in control of the ultimate shareholder.
JEL classification: G32, G38
Keywords: Corporate governance, Ownership structure, Expropriation, Regulation
1 Stefano Mengoli is from the Department of Management, University of Bologna, [email protected]. Federica Pazzaglia is from the Department of Finance and Management Science, University of Alberta, [email protected]. Elena Sapienza is from the Department of Economics, University of Padova, [email protected].

1. Introduction
Although the finance literature emphasizes the role of widely held corporations a la Berle
and Means (1932), in which ownership is dispersed across small shareholders while control is
exercised by managers, recent evidence has cast doubt upon its diffusion around the world. Some
recent studies by have shown that in Europe and the Far East the majority of firms are not widely
held but rather family or State controlled (e.g. Claessens, Djankov, and Lang, 2000; Faccio and
Lang, 2002; Khanna and Rivkin, 2001; La Porta, Lopez-de-Silanes, Shleifer and Vishny (1999).
In these regions, the controlling shareholders often use devices such as dual classes of shares and
pyramiding to gain control rights in excess of their voting rights, while minority shareholders
face a high risk of being expropriated. Differently from Anglo-Saxon countries where managers
are generally hired professionals who do not own a substantial share in the firm they control,
controlling shareholders in the European and Far-Eastern countries are often involved in the
management of the firm.
This evidence has led finance scholars to argue whether better corporate governance
systems will be adopted (Coffee, 2000). On the one hand, La Porta, Lopez de Salinas, Shleifer
and Vishny (1997; 1999) believe that the Anglo-Saxon system is a superior model as
shareholder-protection is ensured by the civil law system. The level of development reached by
the stock market in countries following Anglo-Saxan models is shown as proof of their thesis. By
this reasoning, investors’ in non Anglo-Saxon systems will demand for higher legal standards
due to the low shareholder protection and this will lead to the adoption of rules inspired by the
Anglo-Saxan model (Coffee, 2000). On the other hand, Roe (1994) and Bebchuk and Roe (1999)
point out that even if it could be proved that an optimal governance system existed, its adoption
will likely be opposed by controlling shareholders unwilling to give up their private benefits of
1

control. They may be able to use their influence over politicians responsible for financial
legislation to protect their interests (Stigler, 1964; Rajan and Zingales, 2003; Morck et al, 2004).
The empirical evidence on the above predicament has been so far mixed at best. Guillen
(1999) strongly argues that the convergence of cross-national systems towards the Anglo-Saxon
model will not occur due to differences in the legal, institutional and political environments.
Gilson (2001) further argues in favor of distinguishing between formal convergence
(convergence in corporate law) and functional convergence (convergence in business practices)
and observes that cross-country convergence is more likely to be functional. Johnson and
Shleifer (1999) document that the adoption and enforcement of new securities market regulations
in Poland aimed at protecting minority shareholders has rapidly increased the development of the
stock market. More recently, Hansmann and Kraakman (2000) claim that shareholders pressure
will ensure gradual convergence in the corporate law and conclude that “the triumph of the
shareholder-oriented model of the corporation over its principal competitors is now assured”.
Although several nations have now adopted a series of reforms with the aim of improving
shareholders’ protection (Gilson, 2001), the effect of these regulations is under-explored. This
raises two related question: Are these regulations effective in reducing the risk of expropriation
faced by minority shareholders? Is this process leading to a reduction in the level of
concentration of corporate ownership, traditionally seen as a substitute for poor legal protection?
This paper attempts to answer these questions through the analysis of the evolution of
ownership structure in Italy in the period 1995-2005. We investigate whether the convergence of
the Italian corporate governance regulation towards the Anglo-Saxon model (Pagano and Volpin,
2001) leads to a reduction in the separation of ownership and control, ultimately decreasing the
risk of expropriation faced by minority shareholders (Faccio and Lang, 2002; Volpin, 2002). We
2

also examine the effect of the dominant business practices and norms followed by the nation on
the effectiveness of this body of reforms; an example in point being the tendency of Italian
shareholders attempting to obtain full control over the firms in which they invest.
Italy is an ideal empirical setting to investigate the effectiveness of the introduction of a
new body of regulation for several reasons. First, Italian firms have been historically more prone
to choosing a closely-held ownership structure characterized by a wide separation between
ownership and control (Faccio and Lang, 2002; Johnson, La Porta, Lopez de Salinas and
Shleifer, 2000; Volpin, 2002). Second, Italy is a country where the low protection of minority
shareholders allows controlling shareholders to extract a considerable amount of private benefits
(see among others Bigelli and Mengoli, 2004; McCahery and Vermeulen, 2004; Bigelli,
Merhotra, and Rau, 2006). Third, Italy is a country where dominant shareholders attribute a large
value to the control of publicly listed firms as suggested by the evidence of an 82 percent
premium attributed to voting shares over non voting shares (Zingales, 1994), one of the highest
in the world (Nenova, 2003; Dyck and Zingales, 2004). And finally, in a relatively brief period of
time (1998-2005), Italy has experienced a series of regulatory changes that have attempted to
radically reform the existing corporate governance system, thereby showcasing itself as a
“natural corporate governance experiment” (Denis and McConnell, 2003) that can be used to
study the effect of the evolution of the legal structure on the ownership structure of listed firms.
We find that there appears to be a reduction in the separation of ownership and control of
public companies over the sample period. This phenomenon appears to be driven by a reduction
in the use of dual-class shares and pyramids induced by greater shareholder awareness and by
increased pressures from institutional investors, rather than by government regulations. Our
investigation of the role played by the new corporate governance regulations reveals that they do
3

not necessarily lead to an increase in the level of shareholder protection as predicted by La Porta,
Lopez de Salinas, Shleifer and Vishny (1998). Instead, we document a shift in the level of control
of listed firms towards new thresholds as dictated by novel regulations, which leaves them still
completely in control of the ultimate shareholder. Overall, these results are not supportive of the
claim that the adoption of regulations inspired by Anglo-Saxon countries leads to a reduction in
the risk of expropriation faced by minority shareholders. Rather, they seem to suggest that the
dominant business practices in these countries might moderate the effect of regulations.
We believe our study makes a number of contributions to the finance literature. First, we
contribute to the debate on the convergence among corporate governance systems by arguing that
although regulatory reforms appear to lead to stricter corporate governance practices (e.g. as
adopted in Anglo-Saxan countries), the dominant business practices in recipient countries might
reduce the effectiveness of these regulatory changes. Second, we contribute to the corporate
finance literature by presenting evidence in support of the role played by shareholders’ activism
in reducing the use of devices used by controlling shareholders to expropriate which has been
facilitated by an increased openness of the Italian market to foreign investors2. While some
previous studies (Amoako-Adu and Smith, 2001; Bigelli, Mehrotra, Rau, 2006) present some
evidence relating recent trends towards the unification of dual classes of shares to pressures from
institutional investors, we show that such activism also reduces practices such as pyramidal
groups. Third, we contribute to the debate between scholars proposing that legal origin (La Porta,
Lopez de Salinas, Shleifer and Vishny, 1998) and scholars proposing that openness (Rajan and
Zingales, 2003) is the main determinant of financial development, by providing evidence
supportive of the latter. And fourth, our study has relevant practical implications for regulators in
2 In a clinical study, Desai and Moel (2004) show as in a Converging World International investors who invest in poor investor protection countries are less likely to be expropriated.
4

countries with poor investors’ protection in that regulatory authorities should be cognizant of
dominant business practices while attempting to implement new regulations.
The remainder of the paper is organized as follows. Section 2 outlines the evolution of the
institutional setting focusing on the changes in regulations introduced during the decade under
investigation. Section 3 describes our sample, data and methodology. Section 4 presents our
empirical results. Section 5 concludes the paper.
2. Institutional setting
Differently from US, which has been defined as a country with “strong managers, weak
owners” (Roe, 1994), Italy could be defined as a country with “weak managers, strong block-
holders and unprotected minority shareholders” (Melis, 2000). In fact, even when publicly listed,
Italian firms have been historically characterized by a wide separation of ownership and control
due to the presence of a large majority shareholder, either the State or a family group, and several
minority shareholders.
The level of legal protection for minority shareholders in Italy was until recently one the
weakest among developed countries (La Porta, Lopez de Salinas, Shleifer and Vishny, 1998). In
their cross-country comparison of 27 wealthy economies, La Porta, Lopez de Salinas, Shleifer
and Vishny (1998) rate the level of aggregate shareholders’ rights for Italian public companies 1
out of 63. The lack of legal protection was not offset by any mandatory dividend rights.4 Over the
last decade, several new regulatory provisions have been introduced to increase the legal
3 The only antidirector right which favored minority shareholders against dominant shareholders was the preemptive right in case of equity issues (LLSV, 1998; Table 2, page 1130). 4 Non voting shares have some privileges in terms of higher dividends comparing voting shares (Bigelli, Merhotra, and Rau, 2006).
5

protection granted to minority shareholders’. Table 1 summarizes the main changes introduced
by the regulatory provisions emanated over the period 1998-2005. 5
-----Table 1 about here --
The ‘Draghi Law’ also known as ‘Corporate Governance Reform’, represented the first step
towards a complete reform of the Italian corporate law and regarded various aspects of it, in the
attempt to counteract the evident deviations from the one share-one vote principle (Grossman and
Hart, 1988; Harris and Raviv, 1988). The new regulation established a maximum length of three
years for pacts amongst controlling shareholders aimed at setting a common voting policy to
stabilize control of listed firms (Enriques and Volpin, 2006). Among other provisions, the
‘Draghi Law’ reduces the threshold to call an extraordinary meeting from 20 to 10 percent, and
attributes more rights to voice to minority shareholders, who can also vote by proxy solicited by
banks and institutional investors6 and completely reforms the existing takeover regulation. The
new regulation establishes that a raider willing to take over a listed firm has to launch a public
offer to all minority shareholders once she controls 30 percent of the voting capital.7 It also
establishes that the directors of the target firm must refrain from taking actions that could
interfere with the completion of the tender offer unless the resolutions were not approved by
shareholders representing at least 30 percent of the outstanding voting shares net of those owned
by majority blockholders, a provision also known as ‘passivity rule’.
Although some scholars have questioned the use of the La Porta, Lopez de Salinas, Shleifer
and Vishny’s anti-director rights index (see Siems, 2005 and Spamann, 2005), a re-assessment of
the protection granted by the corporate law to minority shareholders after the 1998 reform would 5 We have to record also a relevant step back in 2004 due to the partial decriminalization of false accounting.6 Bianchi and Enriques (2001) claim that after the 1998 reform the investors with a relevant block of shares get more influential power to the controlling shareholders. 7 This value is in line with most European countries such as UK and France (see Goergen, Martynova, and Reneeboog, 2005).
6

have turn out to a score of 5 out of 6, higher than the average for common law countries, equal to
4 out of 6.8
As the ‘Corporate Governance Reform’ did not contain any explicit provision concerning the
Board of directors and the conflict of interests among different companies within the same group,
a new regulation, the Code of Conduct or ‘Codice Preda’ was emanated in 1999 (and then
revisited in 2002), to rule composition, appointment, remuneration, and role of Board of
Directors.9 Among its provisions we find the recommendation that the board of directors should
be composed by both executive and non-executive directors, and that an adequate number of
non-executive directors should be independent, to increase the protection of minority
shareholders. The independent directors should not entertain, either directly or through a third
party, any relationship with either the company, any of its subsidiaries, the controlling
shareholders or the executive directors. Members of the board of directors should be proposed by
a nomination committee in those cases where it is difficult to reach consensus on a candidature.
The Code also suggested setting up an ‘internal control committee’, appointed by the board of
directors, to assess the adequacy of internal control systems and report to the external auditors,
whose members should be prevalently independent directors.
Other subsequent steps in the process leading to an increase in the level of investors’
protection in Italy are represented by the ‘Corporate Law Reform’ (Vietti Reform) in 2004 that
has reinforced the power of the minority blocks of shares by increasing the threshold needed to
control extraordinary meetings from 50 percent of the voting right to 66.78 percent of the voting
8 Spamann (2005) documents an improvement of the Italian shareholder protection when using a more sophisticated method for re-coding. The author points out the need to revisit the evidence linking the legal system and the financial development. 9 The regulator opts for a voluntary regulation working on a “comply or disclose” basis in line with the UK Cadbury Code of Conduct. To give an idea of the increasing awareness of these themes a SpencerStuart report (2003) show that 93 percent of Italian firms in 2003 comply with the Code vs. less than 20 percent in 1999.
7

rights10. Particular attention has received by the regulator the issue of related party transactions
within pyramids.11 The use of pyramids has then partially disfavored by the 2003 Tax Reform
which has partially removed the tax relief on dividend paid to a company. Introduced in 1977,
the tax credit eliminated double taxation of dividends paid from the bottom to the top of a
pyramidal group.12 This is likely to be one of the reasons behind the simplification of the Pirelli
group, previously the most impressive pyramidal structure in Italy, through the merger of
Telecom and TIM in 2004. The reorganization was due to the fact that the proceeds generate by
TIM, located at the bottom of the Pirelli chain, was used to service the debt assumed by the upper
layers of the chain. As the fiscal reform, taxing the dividends flow towards the high leveraged
upper companies, might have increase the fiscal costs in the fight to keep debt under control, the
ultimate shareholder established to merge Telecom and TIM in order to avoid the double
taxation13. This new regulatory setting has come along with an emerging awareness of minority
shareholder expropriation as an obstacle for financial market development (Rajan and Zingales,
2004). We give some examples of this new attitude starting from one of the first cases of voice
by minority shareholders. In 1999, after the buyout of Telecom Italia and TIM by Olivetti, the
10 This implies that 33.34 percent is the new threshold which identifies a block shares with relevant power. 11 Consob advise n. 97001574 as of February 20th, 1997. This advises was than ruled in the Draghi Law and later on reinforced by the Corporate Law Reform in January 2004. Among several novelties, the most relevant to our analysis is that directors of parent companies are currently legally responsible for any operation which might harm the profitability or the economic value of any subsidiary (article 2497 civil code). The Consob advice just suggested listed companies to disclose the information. 12 In US, dividends paid from a subsidiary to its parent are 100%, 80% or 70% exempted in case the parent holds 100%, between 20% and 80%, or less than 20% of the subsidiary’s capital respectively. These provisions discourage the formation of pyramidal groups in US (Morck, 2002). In Italy, after 1977 companies belonging to a group have enjoied a full tax relief on dividends paid to the parent. Then, in 2004, the Corporate Reform has reduced this relief usually applying a tax rate of 12.5 percent. At the same time, in case the company is controlled (50 percent plus 1 voting shares) by an other company, it is currently possible to opt for a group tax-declaration and settlement which again ensure a fully dividend exemption 13 Calculations made by authors reveal that a 5% tax rate applied to intra-group dividend payment in the case of Telecom-Tim corresponds to 60.8 million euros a year. The present value of this perpetuity is equal to 661 million euros. The estimate is based on a dividend per share of 25.67%, 8,434,004,716 voting shares forming the capital of TIM, a 56.16% control stake of Telecom in Tim, a beta of equity for Telecom equal to 1.04 in 2003 a risk free rate of 4% and an equity premium of 5%.
8

ultimate shareholder Roberto Colaninno tried to transfer TIM and its most valuable asset to
Tecnost, the debt-laden shell company Olivetti stripping it from Telecom Italia. The transaction
contained provisions proposing a unification cash plan of voting and non-voting shares, which
does not recognize any preferential rights to non voting shareholders, this way resulting in their
expropriation. In order to avoid the restructuring, hundreds of Telecom Italia minority
shareholders and fund managers,14 sent letters of opposition to the plan. Some of them had also
threatened to go to court against Colaninno.
In 2001 when S. Paolo, one of the largest Italian banks, launched a takeover upon Banco di
Napoli, some relevant block non-voting shareholders (mainly K Capital and CSFB) entitled a
person to act for a stock unification of non voting shares.15 In 2002 the CEO of Jolly Hotels,
listed on the MSE, announced a plan of conversion of voting shares in non voting shares based
on a ratio of 100 voting shares for 1 non voting share motivating the decision with the need to
increase the liquidity of non voting shares. Non voting shareholders contested that the plan
intended to let voting shareholders control the assembly of non voting shareholders and block
potential initiatives aimed at increase their protection and took the case to court. Later on, the
extraordinary meeting of Jolly hotel’s shareholders voted in favor of the conversion at par value
of non voting shares, which in the meantime had been cancelled from the MSE, in voting shares.
One of the most infamous cases of shareholders’ activism, however, remains the
announcement made in August 1998 by the controlling shareholder of Parmalat, Calisto Tanzi, of
his intention to issue non voting shares at a price around 3,000 Lira per share instead of the
analysts’ assessment which was around 1,570 Lira. While the main Italian financial newspaper
“Il sole 24 Ore” did not report any comment about the controlling shareholder misconduct, the
14 See BusinessWeek Olivetti: “Back to the Bad Old Ways?” http://www.businessweek.com/1999/99_42/b3651116.htm15 The news was reported on the Italian newspaper “Il Sole 24 ore” dates 24 February 2001.
9

Financial Times highlighted as Tanzi intent was likely to jeopardize non-voting subscribers.16
The plan was contested and stopped due to the intervention of institutional investors. Few years
later the company was involved in one of the most controversial defaults in Italian history which
interested more then ten thousands investors. This and other scandals involving listed firms then
defaulted,17 put higher pressure on the Government to improve corporate regulation (McCahery
and Vermeulen, 2003). In 2001, to respond to investors’ demand for better corporate governance
standards among listed firms, the MSE introduced a new segment, called Star, for firms
characterized by corporate governance principles in line with highest international standards.
Firms listing on the Star segment accept to comply with higher standard of disclosure in order to
signal their superior quality.
--Table 2 about here --
The evolution of the corporate governance system has been accompanied by an increasing
importance of the stock market in the country. Table 2 presents several indicators of the level of
financial development in the period 1995-2005. Our first set of variables measures the level of
development of the stock market. The ratio of the stock market capitalization to GDP (Rajan and
Zingales, 2003) increases from 18% in 1995 to over 60% in the years 1999-2000, it declines to
48% in 2001 and 36% in 2002 and then it increases again to above 40% in the period 2004-2005.
The sharp increase in 1999 and 2000 and the sudden decline in 2001 and 2003 are most likely the
result of the peak and burst of the tech bubble. However, the increasing trend over the entire
sample period is consistent with a raising importance of the stock market in the country. The
number of listed firms per million of population increases from 3.27 in 1995 to 4.2 in 2001 and
then declines slightly to 3.85 in 2005, almost 18% higher than in 2005. The time series of the
16 August 14, 1998. Financial Times “Tired of milking the cows? Try the shareholders” 17 See for example Parmalat (Melis, 2005), Cirio, and Gacomelli.
10

ratio of equity issues to GDP is quite volatile over the sample period. Years with the highest
issuance activity are 1998 (6.8 percent), 1999 (14.98 percent) and, in recent years, 2003 (6.89
percent), and 2005 (9 percent).
Our second set of variables measures the development of the banking sector (Rajan and
Zingales, 2003). The ratio of saving deposit to GDP decreases steadily over the sample period
from 9% in 1996 to 0% in the period 2002-2005. This evidence, together with the increasing
trend for the stock market capitalization as a percentage of GDP suggests that investors
increasingly regard the stock market as a more attractive investment than bank deposits.
We then report the level of revenues of the first financial newspaper in Italy, Il Sole 24 Ore,
as a proxy of the level of investor awareness in the decade under investigation. In 1995, revenues
of “Il Sole 24 Ore” amount to slightly less than 253 million euros. By 1999 the figure has
increased to 391 million euros and then to 471 million euros in 2000, after which the level of
revenues remains relatively stable at levels above 450 million euros. We also report the time-
series for the revenues of the main non-financial newspaper in Italy, Il Corriere della Sera. Over
the period 1995-2005, the amount of revenues for Il Corriere della Sera declines of
approximately 34%, from 331 million euros in 1995 to 219 million in 2005. Differently for the
case of Il Sole 24 Ore, Italians seem to be spending less money in general information. Overall,
this evidence can be interpreted as a cautious signal that, in recent years, investors are spending
more in information dedicated to the stock market and thus can be considered more aware. The
last row of Table 2 reports the number of convictions for violations of the insider trading
regulation in the period 1995-2005. There is some evidence that some countries approve insider
trading regulations without enforcing them and that the enforcement of these laws and not their
mere introduction can effectively reduce firms’ cost of capital (Bhattacharya and Daouk, 2002)
11
this way making the stock market more efficient. In Italy, insider trading regulation existed since
1991 and enforcement since 1996. This explains why there are 0 convictions for violations of the
insider trading regulations in1995 and 1996, the lowest for the entire decade. The number
increases gradually from 1 in 1998 to 3 in 2000-2001, the highest for the decade, declines in
2003-2004 and then rises to 3 in 2005. Therefore, it appears that there trend towards a greater
enforcement in recent years (2000-2005), which can be taken as a sign of a lower cost of capital
and thus of a higher level of development of the stock market in the country. However, the
number of convictions does not appear related to a particular regulation. Following both 1996,
when enforcement for insider trading was first introduced, and 1998, with the ‘Corporate
governance reform’ was passed, we do not observe a significant number of convictions.
3. Data and Variable construction
3.1 Variables
Consistent with previous studies (Classens, Djankov and Lang, 2000; Classens, Djankov, Fan
and Lang, 2002; Faccio and Lang, 2002), we define the ownership structure of a firm in terms of
cash flow rights and control rights held by the ultimate shareholder. We use two primary sources:
the “Edizioni Speciali - Bollettino Consob” N. 4/96, N. 4/97, and N. 4/98 for the years before
1998, and the Consob web site for the remaining years (Faccio and Lang (2002).18 Both sources
provide information of ownership stakes of at least 2 percent held either by individuals or by
firms.19 As limited voting shares (‘preference shares’) and non voting shares (’saving shares’) are
18 Consob (www.consob.it) is the Italian Stock Exchange regulatory authority. 19 Beyond this percentage, shareholders are required by law to disclose their holding to the Consob.
12
commonly used in Italy to enhance control (Zingales, 1994)20 we collected information on firms’
equity structure from “Il Calepino dell’azionista”. Datastream was used to collect accounting and
financial data, while “Il Taccuino dell’azionista”, “Il Calepino dell’azionista”, and “Il Sole 24
Ore” were used to check missing data.
Cash flow rights indicate how much of each Euro generated by a company is claimed by each
shareholder, after taking into consideration the effect of pyramiding, dual classes of shares and
cross-holdings. We estimated the level of cash flow rights using the methodology proposed by
Brioschi, Buzzacchi, and Colombo (1990).21 Defining xi as the direct holding of the ultimate
shareholder on firm i, aij the fraction of the equity capital owned by firm j of the overall equity
capital of firm i, and n the number of listed firms in the market, the amount of cash flow rights
owned by the ultimate shareholder in firm i, yi , is given by
∑=
+=n
jjjiii yaxy
1 for i = 1, 2 …n . (1)
In matrix notation, equation (1) can be rewritten as
y = x + A y (2)
where A is a nxn matrix whose elements represent the ownership stakes of firm i (rows) in firm j
(columns), x = (x1, x2, …,xn)’ is the vector of direct ownership stakes and y = (y1, y2, …,yn)’ is
the vector of cash flow rights held by the ultimate shareholders of the n firms in the market, the
elements unknown. Solving the system of equations with respect to the vector y yields
y = (I – A)-1 x (3)
20 In Italy, preference shares and saving shares represent senior claims on dividends and on reimbursement in case of liquidation than voting shares. However, all shares have the same face value. See Bigelli (2003) for an extensive discussion of the rights of different types of shareholders in Italy. 21 This methodology builds on the pioneering work by Nobel Prize Leontief (1951) on the input-output inter-industry interdependence in US.
13

where I identifies the identity matrix and -1 the inverse matrix.
-- Figure 1 about here --
We recall the example on the ownership structure of Unicem, discussed in Faccio and
Lang (2002), to illustrate a direct application of the methodology discussed above. Figure 1
illustrates the ownership structure of Unicem, a company controlled by the Agnelli family
through pyramiding, dual-class shares, and multiple control chains. Using the notation introduced
above, A is the following 5x5 matrix
A = 0.00535 1.00000 0.09194 0.00000 0.25896
0.00000 0.00000 0.23708 0.00000 0.00000
0.00000 0.00000 0.00074 0.00000 0.11682
0.00000 0.00000 0.00145 0.00000 0.00126
0.00000 0.00000 0.00000 0.00000 0.00000
The first column of A represents the ownership stakes of Giovanni Agnelli & C. in IFI (B),
Carfin (C), Ifil (D), Toro (E), and Unicem (F) respectively. The second column represents the
ownership stakes of Carfin (C) in IFI (B), Carfin (C), Ifil (D), Toro (E), and Unicem (F)
respectively, and so on. Along the main diagonal we find the percentage of its own stocks held
by each of the companies in the group. The first row shows that IFI (B) owns 0.535% of the
capital in IFI itself22, 100% of the ownership rights in Carfin (1x2 element), 9.194% of the
ownership rights in Ifil (1x3 element, calculated as the product of 14.60% and 62.97%), 0% of
the ownership rights in Toro (1x4 element), and 25.896% of the ownership rights in Unicem (1x5
element, calculated as a product of 32.83% and 78.88%). This method considers both own stocks
and reciprocal holdings.
22 Ifi holds 1.07 percent of its own voting stocks, that is the 0.535 (1.07% x 50%) percent of the full capital.
14
The vector of direct ownership stakes, x, in IFI (B), Carfin (C), Ifil (D), Toro (E), and
Unicem (F) is as follows
x = 0.4123
0.0000
0.0000
0.4465
0.0233
In fact, the Agnelli family owns a direct stake in IFI (B), Toro (E), and Unicem (F). Finally,
solving the system of equations (3) yields
y = 0.4145
0.4145
0.1371
0.4465
0.1473
suggesting that the first shareholder owns 41.45 percent of the cash flow rights in IFI (B), 41.45
percent of the cash flows in Carfin (C), 13.71 percent in Ifil (D), 44.64 percent in Toro (E), and
14.73 percent in Unicem (F). Following Zingales, who asserts as Italian “family members tend to
vote together” (1994: 132), we treat all members of a family as a unique shareholder. In fact,
they usually split their stakes only for tax-planning purpose. This assumption, made by other
studies investigating ownership patterns around the world (e.g. Classens et al., 2002) removes
possible bias that could lead to underestimating the real voting power of the ultimate shareholder.
Voting rights are computed using a slightly different version of the methodology used by
Faccio and Lang (2002), who introduce the concept of the weakest link along the pyramidal
15

chain. Again recalling Figure 1, Faccio and Lang (2002: 376) calculate the ultimate shareholder’s
control stake in Unicem as the sum of the weakest control stakes along each of the six chains.
The first one is a direct control stake totalling 2.96 percent of the voting rights. The second one,
linking A to F through E, equals 0.16 percent calculated as min(62.35; 0.16)). The third one,
linking A to F through E and D, equals 0.23 percent, calculated as min (62.35;0.23/(1-
0.0118);14.81)). The fourth one, linking A to F through B, C and D equals 14.81 percent,
calculated as min (82.45/(1-0.0107);100;37.65/(0.0118);14.81). The fifth one, linking A to F
through B and D, yields 0 percent23. Finally, the last chain, linking A to F through B, yields
32.83 percent control stake, calculated as min(82.45/(1-0.0107);32.83). Summarizing, the control
stake of the Agnelli Family in Unicem is given by the sum of the weakest control stakes
Direct stake = 0.0296
A-E-F min(62.35;0.16) = 0.0016
A-E-D-F min(62.35;0.23/(1-0.0118);14.81) = 0.0023
A-B-C-D-F min(82.45/(1-0.0107);100;37.65/(0.0118);14.81) = 0.1481
A-B-D-F min(82.45/(1-0.0107);14.6/(1-0.0118);0) = 0.0000
A-B-F min(82.45/(1-0.0107);32.83) = 0.3283
The sum of the weakest control stakes, equal to 50.99 percent, signals that the Agnelli family
controls Unicem despite owning only 15 percent of its cash flow rights.
We would like to point out, however, that this methodology is not robust to changes in the
order in which the control chains are considered. For instance, if the control chains are
considered in the following order, A-B-F (32.83%), A-B-D-F (14.77%), A-B-C-D-F (14.81%),
A-E-D-F (0%), A-E-F (0.16%), and finally the direct stake (2.96%), the control stake of the
23 Following Faccio and Lang (2002), we report 0 percent as control stake of D in F instead of 14.81 percent, as the link has already been considered in the previous chain.
16

Agnelli family in Unicem increases from 50.99 percent to 65.53 percent. To correct for this
potential bias, we develop an alternative methodology based on an automatic VBA top-down
routine. We calculate the control rights of the ultimate shareholder moving gradually from the
top to the bottom of the control chain and identifying at each step the control rights of the
ultimate shareholder in each company. So, the Agnelli family controls 100 percent of Giovanni
Agnelli & C. and min(100%; 82.45%/(1-0.0107)) in IFI and Camfin, that is 83.34 percent. The
control stake in Ifil is given by the sum of min(83.34;37.65%/(1-0.0118)), min(83.34%;14.60/(1-
0.0118)), and min(45.82%;0.23%/(1-0.0118)), equal to 53.11%. Similarly, for Unicem the
control stake is given by the sum of 2.96%, min(62.35%;0.16%), min(53.11%;14.81), and
min(83.34;32.83%), that is 50.76 percent. This methodology is consistent regardless of the order
in which the control chains are considered.
Finally, the Ownership-Control ratio is calculated as the ratio of the ownership rights and
control rights of the ultimate shareholder and measures the risk of expropriation faced by
minority shareholders (La Porta et al., 1999). A value close to 1 indicates low risk of
expropriation, while a value close to 0 indicates a high risk of expropriation. In the case of
Unicem, the Agnelli family controls 50.76 percent of the voting rights and owns 14.73 percent of
the cash flow rights, corresponding to an ownership-control ratio of 0.2901, signal of a relatively
high risk of expropriation.
3.2 Data
Our initial data set consists of all firms listed on the Milan Stock Exchange (MSE) at the
end of each calendar year over the period 1995-2005. We excluded banks and insurance
companies from the sample as previous studies (among others Faccio and Lang, 2002) show that
17
they present singular characteristics of the phenomenon under investigation. For example, Faccio
and Lang (2002) report that financial intermediaries appear to be almost three times more likely
to be widely held and four times less likely to be controlled by a family group than non-financial
firms. This leaves us with an unbalanced panel of 420 companies, corresponding to 1995 firm-
year observations, which constitutes our final sample.
--Table 3 about here --
The first column of Table 3 shows that in 1995 there are 186 firms listed on the MSE. The
number of listed firms decreases slightly until 1998, increases from 179 to 240 in the period
1998-2002, and then stabilizes in the latter part of the decade. In 2005, the last year of our sample
period, there are 226 listed firms. The number of IPOs increases steadily from 10 in 1995 to 45
in 2000, then declines substantially until 2005. The highest number of IPOs is observed in the
period 1998-2001 (more then 58 percent of the IPOs in our sample occur in this period), while
the lowest number is observed in the period 2002-2004.
The increase in the number of listed firms following 1998 appears to be related to the
high number of listed firms in the period 1998-2001. In particular, we speculate that it is mainly
related to the introduction in 1999 of a new Stock Exchange, named ‘New Market’ (‘Nuovo
Mercato’), dedicated to medium-sized and small-sized firms with high growth potential. When
the New Market was re-absorbed in the MSE in the early months of 2005, it had attracted 46
IPOs (more than a quarter of the IPOs in our entire sample).
The last column of Table 2 reports the number of firms that delisted over the sample
period. Years with the highest number of delistings are 1996 (22 delistings), 1997(17 delistings)
and 2000 (17 delistings) while years with the lowest number of delistings are 1999 (3 delists),
2001 (6 delists), 2004 (4 delistings) and 2005 (5 delistings). The comparison of the number of
18

delistings in the years prior and post introduction of the Draghi Law in 1998 reveals that the
change in the corporate governance law does not appear to be associated with a higher number of
delistings. This is somewhat different to the case of US, where the introduction of more stringent
regulations has been associated with a large number of delistings due to going private
transactions (Marosi and Massoud, 2005).
4. Results
4.1. The evolution of ownership structure in Italy
In order to investigate the evolution of the ownership structure in Italy, we calculate the
level of cash flow rights (O), control rights (C), and ownership-control ratio (OC) held by the
ultimate shareholder for our sample of firms listed on the MSE over the sample period.
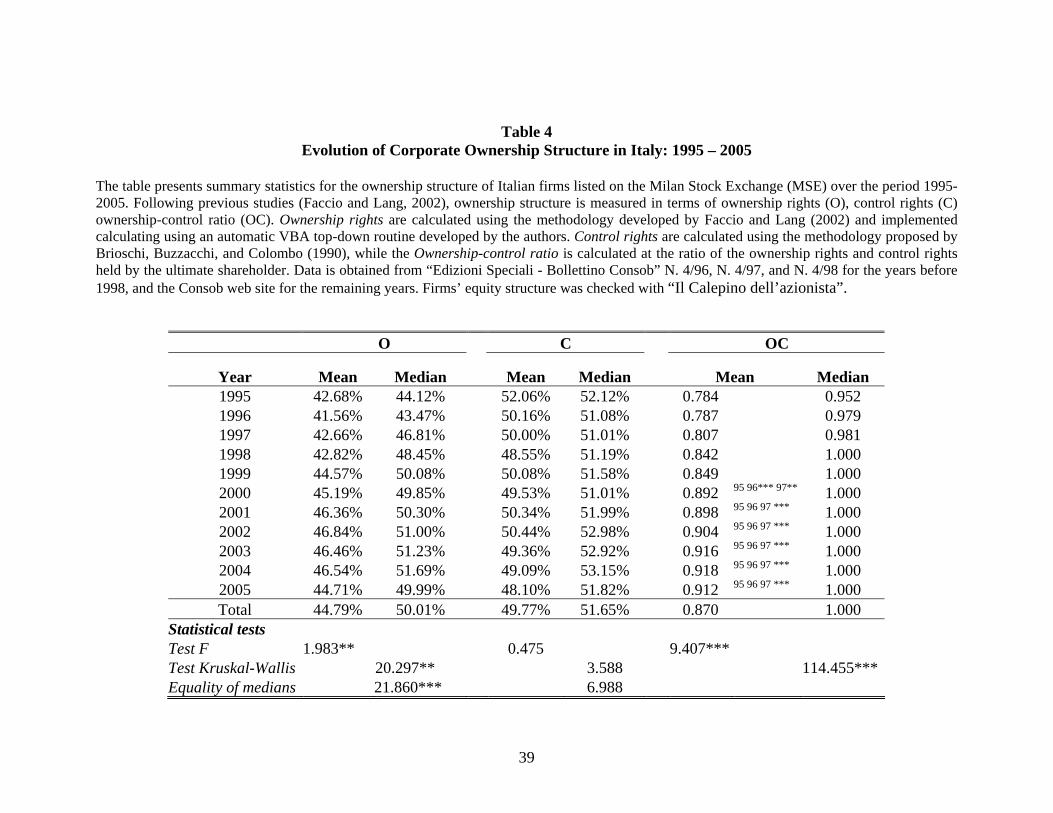
-- Table 4 about here --
The table confirms previous findings of concentration of the ownership structure of
Italian publicly listed firms. The ultimate shareholder owns 44.79 percent of cash flow rights (O)
and has full control (C) over the average listed firm. The median is 50 percent for cash flow
rights and 51.65 percent for control rights. Both average and median values for cash flow rights
appear to be higher than the average and median values –equal to 38.3% and 39.6% -- found in
Faccio and Lang (2002), while the average and median values for the control rights measure –
equal to 50.23% and 52% -- are quite comparable with the average and median values of 48.3%
and 50.11 %. The left tail of the distribution of the ownership variable (O) – not reported in the
table – appears to be fatter than the corresponding left tail of the distribution of the control
variable (C). This suggests that there are few cases where ownership is extremely low which are
19
not associated with extremely low control, suggesting the presence of few cases where the
separation of ownership and control is particularly severe.
The average (median) ownership displays an increasing trend from 42.68 (44.12) percent in
1995 to 46.54 (51.69) percent in 2004 and then decreases slightly in 2005, when the average
(median) ownership is 44.71 (49.99) percent. By contrast, the average control displays a
decreasing trend from 52.06 (52.12) percent in 1995 to 48.10 (51.65) percent in 2005. Test
statistics (F for means and Kruskal-Wallis for medians) confirm that while the ownership
variable (O) is significantly different across years (F=1.98 and Z=20.30, respectively), the
control variable (C) remains substantially unchanged over time (F=0.47 and Z=3.58,
respectively). This evidence appears consistent with previous studies showing that the benefits of
controlling a listed firm are critical in Italy (Aganin and Volpin, 2003; Zingales, 1994) and is
ultimately consistent with the hypothesis that business practices in the country are unchanged
despite the complete reform of the corporate governance law started in 1998. The average
ownership-control ratio (OC) exhibits an increasing trend over time, from 0.784 in 1995 to 0.912
in 2005. The average value for OC in the years from 2000 to 2005 is significantly higher than the
average values in the previous years, suggesting that minority shareholders in recent years face
an increasingly lower risk of expropriation (Faccio and Lang, 2002 ). The median ownership-
control ratio increases from 0.952 in 1995 to 1 in 1998 and it remains stable afterwards, revealing
that the median firm after 1998 is not characterized by any separation of ownership and control.
The discrepancy between average and median values of the ownership-control ratio
indicates that the separation of ownership and control that has been suggested characterizes
Italian firms (Barca, 1994; Faccio and Lang, 2002; La Porta, Lopez de Salinas, Shleifer and
Vishny, 2000) is the result of a small group of firms characterized by a pronounced level of
20
separation. That is, the evidence pointing at Italy as a case of bad corporate governance appears
to be due to few infamous cases (see Aganin and Volpin, 2003; Faccio and Lang, 2002) and does
not appear to be an accurate representation of the population of firms listed on MSE. The gap
between average and median values of OC narrows in the second part of the sample period. We
interpret this result as suggestive that, in recent years, the risk of expropriation faced by minority
shareholders has reduced even for the extreme cases of bad governance.
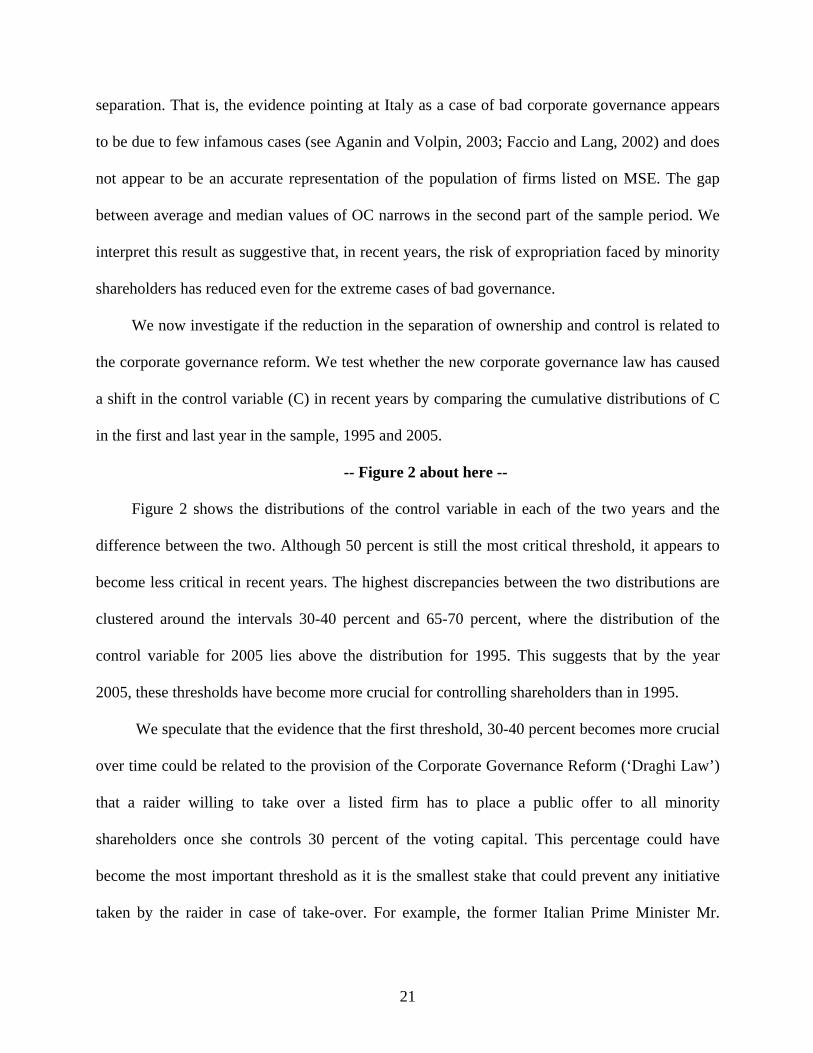
We now investigate if the reduction in the separation of ownership and control is related to
the corporate governance reform. We test whether the new corporate governance law has caused
a shift in the control variable (C) in recent years by comparing the cumulative distributions of C
in the first and last year in the sample, 1995 and 2005.
-- Figure 2 about here --
Figure 2 shows the distributions of the control variable in each of the two years and the
difference between the two. Although 50 percent is still the most critical threshold, it appears to
become less critical in recent years. The highest discrepancies between the two distributions are
clustered around the intervals 30-40 percent and 65-70 percent, where the distribution of the
control variable for 2005 lies above the distribution for 1995. This suggests that by the year
2005, these thresholds have become more crucial for controlling shareholders than in 1995.
We speculate that the evidence that the first threshold, 30-40 percent becomes more crucial
over time could be related to the provision of the Corporate Governance Reform (‘Draghi Law’)
that a raider willing to take over a listed firm has to place a public offer to all minority
shareholders once she controls 30 percent of the voting capital. This percentage could have
become the most important threshold as it is the smallest stake that could prevent any initiative
taken by the raider in case of take-over. For example, the former Italian Prime Minister Mr.
21
Silvio Berlusconi, who controls the first Italian TV Broadcaster Mediaset listed on the MSE, has
recently reduced his stake from 51 percent to 34 percent24. The second threshold, 65-70 percent,
could be explained by controlling shareholders’ attempt to reduce the voting power of minority
shareholders in the occasion of extraordinary shareholders’ meetings. Currently, in fact,
takeovers are conditioned upon reaching a threshold equal to 66.6 percent of voting capital. For
example, the Italian luxury yacht group Ferretti was the target in 2002 of a Public Purchase Offer
launched by the private equity fund Permira, which, as a result of the purchase offer, gained
control of nearly 70 percent of the capital of Ferretti and voted to take the company private.
We also relate the evolution of the separation between ownership and control among listed
firms to the use of mechanisms usually employed to enhance control, such as non-voting shares
and pyramiding.
-- Table 5 about here --
Table 5 reveals a progressive decline in the diffusion of pyramidal structures over the
sample period. The percentage of firms controlled through pyramids declines from 31 percent in
1995 to 26 percent in 1998 (a decrease of 16.3 percent), and then to 14 percent in 2005 (a
decrease of 46.2 percent). In particular, the period 1999-2000 appears characterized by the larger
jump in the use of pyramids: from 24% of 1999 to 17% in 2000. This phenomenon is unlikely to
be caused only by regulations, as provisions especially dedicated to pyramids were introduced
only in 2004. However, the decline could be related in part to the provisions contained in the
Draghi Law aimed at reducing the impact of deviations from the one share, one vote criterion.
The use of dual classes of shares declines over the sample period, from 39 percent in 1995 to
12% percent in 2005. However, while in the case of pyramiding there is a major jump between
24 The news was published by the New York Times in an article titled “Berlusconi’s Family to Reduce Share in Broadcast Company” (see New York Times, 14 April 2005, page 14).
22
1999 and 2000, the decline in the use of dual classes of shares occurs steadily over the sample
period. Thus, it is unlikely that this phenomenon is due to regulation, given the absence of a
revised law dealing with non-voting shares (Bigelli, Mehrotra, and Rau, 2006). The trend
towards a one share-one vote equity structure has been documented for others countries (see
Amoaku-Adu and Smith, 2001 for Canada; Dittman and Ulbricht, 2003 for Germany, Lauser and
Lauterbach, 2003 for Israel; Berglof and Pajuste, 2003 for Western European Countries), also in
relation to a dislike of institutional shareholders for dual classes of shares. Interestingly, even
when firms maintain limited voting shares, the weight of the non-voting capital as a fraction of
total capital of the firm tends to reduce over time. This suggests that on average firms that in the
past had a more pronounced use of limited voting shares are the ones that have recently
announced the conversion of limited voting shares into voting shares. This finding appears
consistent with increasing shareholder opposition against these devices as documented by
episodes of Parmalat’s attempt to issue $500 million non-voting share in 1998 which was later
cancelled by the negative reaction of institutional investors and the decision by the general
manager of Pirelli group to reduce the pyramiding of Pirelli-Telecom through a merger between
Telecom and Tim, as pyramidal schemes were not receiving the favor of institutional investors.
4.2 Other Trends in Ownership structure
Besides to the new regulation, the observed decline in the level of separation of ownership
and control could also be due to a change in the characteristics of our sample firms over time. To
investigate this possibility, we compare the observed propensity to separate with one estimated
based on firm characteristics. We focus on firms for which the OC measure is lower than 99
percent, as for these firms we observe at least a minimum tendency to separate.
23

-- Table 6 about here --
We identify 50 cut-offs based on the size of the firms always present in the sample at the
end of each year. Each firm is then assigned a number in the interval 1-50 depending on its size.
This method allows us to reduce potential biases caused by year by year variation in the size of
the sample firms. The estimated propensity to separate ownership and control is obtained from
the following logit model as
Pr (DOC99i= 1) =α + β (Rank Sizei) + εi,
DOC99i is a dichotomous variable taking on the value 1 when a firm has a level of OC lower or
equal to 99 percent25. The model yields the estimate of the likelihood that a firm will engage in
separation in a given year based on its size.
Column 3 of Table 6 reveals that, over the entire sample period, 28 percent of the firms
exhibit an even minimal level of separation of ownership and control. However, the propensity to
separate declines steadily over time, from 46 percent to 41 percent from 1995-1997 and from 41
percent to 17 percent from 1997 to 2005. Columns 5-6 of Table 6 report the propensity to engage
in separation for each year estimated using market value as our measure of size, while columns
7-8 report the propensity to engage in separation estimated using the book value of total assets as
our measure of size. The coefficient on size in both logit models is positive and significant, a
signal that large firms are more likely to engage in separation. This result is also consistent with
wealth constrained shareholders creating separation to control a large amount of capital while at
the same time investing the least possible in the firm.
While in the period 1995-1995-1997 the actual and the expected propensity to separate
appear comparable, starting from 1998 the actual propensity to separate is systematically lower 25 We also estimate an alternative model including also variables measuring the growth rate and profitability of the firm (Fama and French, 2002) but the relative coefficients are not significant.
24
than the corresponding estimated value. These results suggest that, based on firm size alone, the
observed probability to separate ownership and control should not have reduced as dramatically
as it was observed over the sample period. In other regressions not reported in the paper we
repeat our analysis using 90 percent as a cutoff for the OC variable, but this does not change the
sign or the magnitude of our results.
We investigate the ownership structure of IPO and delisted firms in our sample. Analyzing
the ownership structure of IPO firms can provide more information on the evolution of the
separation of ownership and control because the ownership structure of already established firms
tends to change more slowly (Zhou, 2001). We test whether the documented reduction in the
separation of ownership and control is driven by the inclusion in our sample of a relatively large
number of IPO firms. We compare the ownership structure of firms already listed on the MSE
with that of firms that went public after 1998 to test whether the documented reduction in the
separation between ownership and control is an ‘IPO effect’. In the five-year period 1999-2005,
127 firms satisfying the listing requirements have become part of the sample; of these, 31 have
become listed over the period 2003-2005.
-- Figure 3 about here --
Figure 3 compares the ownership structure of firms always present in our sample, IPO
firms and firms that delisted in the sample period. Panel A compares the evolution of Ownership
(O) for these three groups of firms. There appear to be a wide discrepancy between the average
ownership for firms always present in the sample – the lowest of the three groups of firms -- and
IPOs in 1995 (40% vs. 55%). Over time, the average ownership of IPOs and firms always present
in the sample tend to converge: IPOs exhibit a decreasing trend, from 50 percent in 1996 to
approximately 45 percent in 2005, while firms always present in the sample exhibit an increasing
25
trend, from approximately 42 percent in 1996 to slightly above 45% in 2005. Overall, the figure
suggests that while IPOs are characterized by higher levels of ownership than the other three
groups of firms over the entire period 1995-2005, continuing firms experience an increase in
ownership over time.
The comparison of the evolution of the level of control (C) across the three groups of firms
reveals that, although at the beginning of the sample period (1995-1996) the level of control
rights is higher for IPOs than for firms always present in the sample, the differential reduces
substantially in 1997 and remains almost negligible until 2005, when control rights for IPOs fall
below 50% while those of continuing firms increase slightly above 50%. Overall, Panel B
confirms our previous result of a clustering in the level of control rights held by the ultimate
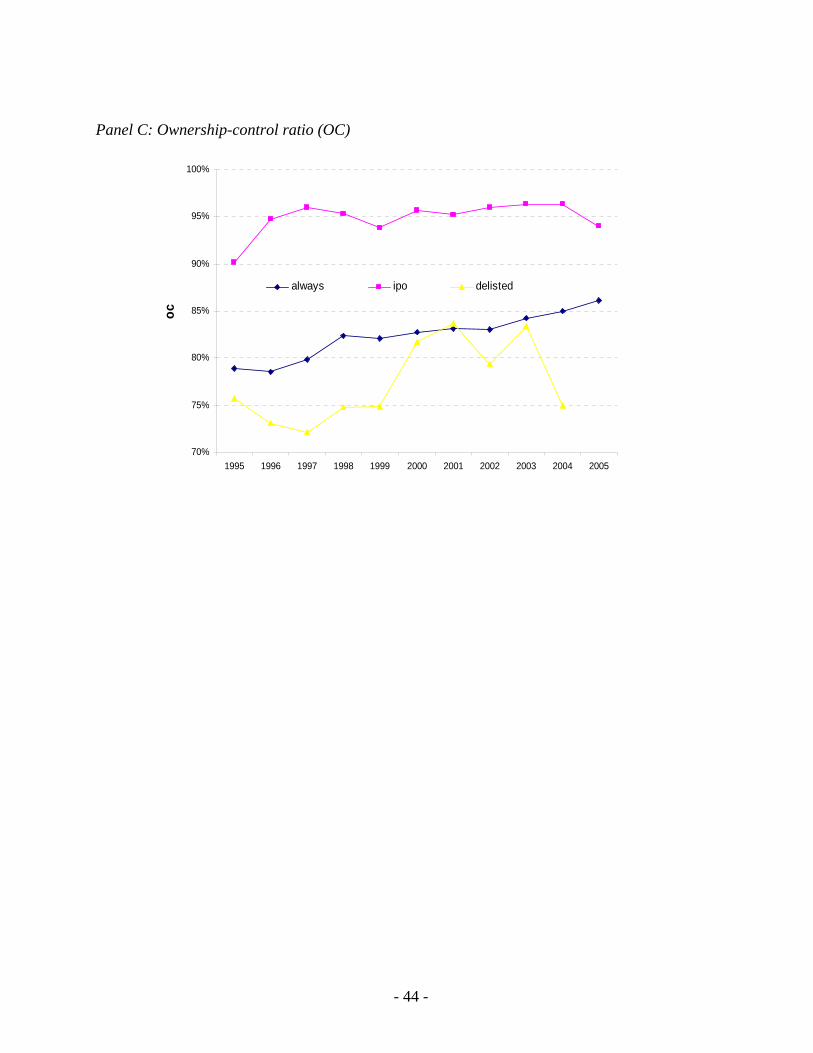
shareholders of listed firms at 50% over the decade under investigation. Panel C of Figure 3
compares the level of the Ownership-Control (OC) ratio for the three groups of firms. IPOs are
characterized by a higher value of the OC ratio than continuing firms and delisting firms over the
entire sample period, indicating a lower risk of expropriation. The OC ratio for continuing firms
exhibits an increasing trend over time, consistent with our hypothesis of separation of ownership
and control over time.
In summary, there appear to be differences in the ownership structure of IPO and non-IPO
firms. On the one hand the level of ownership rights held by the ultimate shareholder are
significantly higher for IPO firms, despite in recent years they are converging towards a 45
percent level. On the other hand, the level of control rights appears comparable across the two
groups and could reflect majority shareholders’ desire not to relinquish control. We speculate a
couple of reasons for the difference between IPO and non-IPO firms. Assuming that low levels
of separation between ownership and control constitute new market equilibrium, and that the
26

reaction of existing shareholders is affected by inertia, we could argue that IPO firms achieve the
new equilibrium ownership structure faster than non-IPO firms. An alternative explanation could
be that IPO firms have significantly different characteristics and this reflects onto their ownership
structure. However, the fact that considering continuing firms alone does not remove the time
trend presented so far referring the whole sample is another piece of evidence supporting our
previous conclusion of a marked tendency to the reduction in the separation of ownership from
control in recent years.
4. Conclusions
In this paper we investigated the effect of the introduction of a body of regulation inspired by
the US model of corporate governance in Italy, a country characterized by high separation of
ownership and control and high risk of expropriation of minority shareholders, whose corporate
governance system has been completely reformed in recent years. We test the argument that
formal convergence to US regulation leads to a reduction in ownership concentration and a
reduced risk of expropriation. Our examination of the evolution of ownership rights, control
rights and ownership-control ratio reveals a reduction in the level of separation of ownership and
control. Recent episodes highlighting the role of institutional investors in the simplification of
pyramidal structures (Pirelli), and in opposing further issues of non-voting shares (Parmalat) or
pressing for the unification of dual-classes of shares (S.Paolo), suggest that the decrease in
separation is related to an increase in shareholders’ activism rather than to increased legal
protection. We also document a shift over the sample period in the level of control rights held by
the ultimate shareholder towards new thresholds which, however, leave the firm still completely
controlled by the ultimate shareholder. Overall, our results offer a critical perspective on the
27

effectiveness of formal convergence and highlight the role of dominant business practices in
moderating the effect of regulation.
28
References
Aganin, A. and Volpin, P. (2005), The History of Corporate Ownership in Italy, in: Morck, R.K., The History of Corporate Governance Around the World, University of Chicago Press, 325-361. Amoako-Adu, B. and Smith, B.F. (2001), Dual class firms: Capitalization, ownership structure and recapitalization back into single class, Journal of Banking and Finance, 25, 1083-1111. Barca, F. (1994), Assetti proprietari e mercato delle imprese, Volume I e II, Il Mulino, Bologna, Italy. Bebchuk, L. and Roe M. (1999), A Theory of Path Dependence in Corporate Governance and Ownership, Stanford Law Review, 52, 127-170. Berglof, E. and A. Pajuste (2003), Corporate Governance in Central and Eastern Europe, in: P. Cornelius P. and Kogut B., Global Competitiveness and Corporate Governance, Oxford University Press. Berle, A. and Means, G. (1932), The modern corporation and private property, Macmillan, New York, NY. Bianchi, M. and Enriques, L. (2001), Corporate Governance in Italy after the 1998 Reform: What Role for Institutional Investors, CONSOB Quaderni di Finanza, No. 43. Bigelli, M. (2003), Le azioni di risparmio: un’analisi economica e gli effetti sulla governance d’impresa, ed Il Mulino, Bologna, Italy. Bigelli, M. and Mengoli, S. (2004), Sub-Optimal Acquisition Decisions under a Majority Shareholder System, Journal of Management and Governance, 8, 373-405. Bigelli, M., Mehrotra, V., and Rau, R. (2006), Expropriation through unification? Wealth effects of dual class share unifications in Italy, Working Paper. Brioschi, F., Buzzacchi, L., and Colombo, M. (1990), Gruppi di imprese e mercato finanziario: la struttura del potere nell’industria italiana, Nuova Italia Scientifica, Roma, Italy. Claessens, S., Djankov, S. and Lang, L.H.P. (2000), The separation of ownership and control in East Asian corporations, Journal of Financial Economics, 58, 81–112. Claessens, S., Djankov , S.,Fan J. and Lang, L.H.P. (2002), Disentangling the incentive and entrenchment effects of large shareholdings, Journal of Finance, 52(6), 2, 2741-2771. Coffee, J. (1999), The Future as History: The Prospects for Global Convergence in Corporate Governance and Its Implications, Northwestern University Law Review, 93(3), 641-708.
29
Coffee, J.C. (2000), Convergence and its Critics: What are the Preconditions to the Separation of Ownership and Control?, Columbia Law and Economics Working Paper No. 179. Commissione Nazionale per le Società e la Borsa, CONSOB, 199, Bollettino – Edizione speciale n. 4/97 – Compagine azionaria delle società quotate in borsa o ammesse alle negoziazioni nel mercato ristretto al 31 dicembre 1996. CONSOB, Milan. Denis, D. and McConnell, J. (2003), International Corporate Governance, ECGI - Finance Working Paper No. 05/2003. Dittmann, I. and Ulbricht, N. (2005), Timing and wealth effects of German dual class stock unifications, unpublished working paper, Erasmus University. Dyck, A. and Zingales, L. (2004), Private Benefits of Control: An International Comparison, Journal of Finance, 59(2), 537-600. Enriques, L. and Volpin, P. (2006), Corporate Governance Reforms in Continental Europe, Journal of Economic Perspectives, forthcoming. Faccio, M. and Lang, L. (2002), The Ultimate Owner of Western European Corporations, Journal of Financial Economics, 65(3), 365-95. Gilson, R.J. (2001), Globalizing Corporate Governance: Convergence of Form or Function, American Journal of Comparative Law, 49, 329-357. Grossman, S.J. and Hart, O.D. (1988), One share-one vote and the market for corporate control, Journal of Financial Economics, 20, 175-202. Guillén, M.F. (1999), Corporate Governance and Globalization: Arguments and Evidence against Convergence, Working paper, Wharton business School. Hansmann, H. and Kraakman R.H. (2001), The End of History for Corporate Law, Georgetown Law Journal 89, 439-468. Harris, M., and Raviv A. (1988), Corporate governance: Voting rights and majority rules, Journal of Financial Economics 20, 203-235. Johnson, S. and Shleifer, A. (1999), Coase v. the Coasians, NBER Working Papers no. 7447.
Khanna, T. and Rivkin, J. (2001), Estimating the performance effects of business groups in emerging markets, Strategic Management Journal, 22(1), 45 – 74. Kruse, T., 2005, Ownership, Control and Shareholder Value in Italy: Olivetti's Hostile Takeover of Telecom Italia, ECGI - Finance Working Paper No. 83/2005.
30

La Porta, R., Lopez-de-Silanes, F., Shleifer, A., and Vishny, R. (1997), Legal determinants of external finance, Journal of Finance, 52, 1131-1150. La Porta, R., Lopez-de-Silanes, F., Shleifer, A., and Vishny, R. (1998), Law and finance, Journal of Political Economy, 101, 678-709. La Porta, R., Lopez-de-Silanes, F., and Shleifer, A. (1999), Corporate ownership around the world, Journal of Finance, 54, 471-517. Hauser, S. and Lauterbach, B. (2004), The value of voting rights to majority shareholders: evidence from stock unifications, The Review of Financial Studies, 17(4), 1167-1184. Leontief, W.W. (1951), The structure of american economy, 1919-1939; an empirical application of equilibrium analysis, Oxford University Press, New York, NY. McCahery, J. and Vermeulen, E. (2003), Organizational Law and Venture Capital, in: McCahery, J. and Renneboog L., Venture Capital and the Valuation of High Tech Firms, Oxford University Press, 162-187 McCahery J. and Vermeulen, E. (2004), The Evolution of Closely Held Business Forms, in: Europe, in: McCahery J., Raaijmakers M. and Vermeulen E., The Governance of Close Corporations and Partnerships: US and European Perspectives, Oxford University Press, 191-239. Melis, A. (2000), Corporate Governance in Italy, Corporate Governance An International Review, 8(4), 347 Melis, A. (2004), On The Role of the Board of Statutory Auditors in Italia Listed Companies, Corporate Governence An International Review, 12, 74-84. Nenova, T. (2003), The Value of Corporate Voting Rights and Control: A Cross-country Analysis, Journal of Financial Economics. 68(3), 325-51. Pagano, M. and P. Volpin (2001), The Political Economy of Finance, Oxford Review of Economic Policy, 17, 502-519. Rajan, R.G. and Zingales, L. (2003), The Great Reversals: The Politics of Financial Development in the 20th Century, Journal of Financial Economics 69, 5-50. Rajan, R.G. and Zingales, L., (2004), Saving Capitalism from the Capitalists: Unleashing the Power of Financial Markets to Create Wealth and Spread Opportunity, Princeton University Press, Princeton, NJ. Roe, M., (1994), Strong Managers and Weak Owners: The Political Roots of American Corporate Finance, Princeton University Press, Princeton, N.J.
31
32
Siems, M.M. (2005), What Does Not Work in Comparing Securities Laws: A Critique on La Porta et al. Methodology, International Company and Commercial Law Review, 300-305 Spamann, H. (2005), Recoding LLSV’s Law and Finance, Mimeo, Harvard Law School.
Stulz, R.M. and Williamson R.G., 2003, Culture, Openness, and Finance, Journal of Financial Economics 70, 313-349. Taccuino dell’Azionista. Annuario di documentazione finanziaria industriale e di borsa, Milano, Italy. Volpin, P. (2002), Governance with poor investor protection: evidence from top executive turnover in Italy, Journal of Financial Economics, 64, 61-90. Zingales, L. (1994), The value of the voting right: A study of the Milan stock exchange experience, Review of Financial Studies 7, 125-148.
Table 1 Evolution of Corporate Governance Law in Italy: 1995-2005
1995 1996 1997 1998 1999 2000 2001 2002 2003 2004 2005 2006
Panel A – Anti-director rights and minority shareholders rights
Shares not blocked before meeting V
Proxy by mail allowed D
% of share capital to call an ESM D: 20% 10%
Preemptive rights to new issue D
Oppressed Minorities D V
Cumulative voting or proportional representation of Minorities in the board
R
ESM quorum D: 50% 2/3
Panel B – Disclosure requirements
Director compensation R
Block disclosure (2%) D
Transaction between related parties R
SO plan disclosure R
Fair Value principle
Syndicate agreements D
Panel C – Liability standards
Liability standard for directors R
Liability standard for distributors R
Liability standard for accountants R
Panel D – Private enforcement
Take to court D: 10% 5%
R: 5% 2.5%
Bring claims on behalf of the company D:5%
2%
Internal deali ng MA, CA
Insider trading D MA
Accounting IAS
Class action
Panel E - Public enforcement
Characteristics of Supervisor (CONSOB) D R
Investigative power of Supervisor (CONSOB) D R
Sanction powers of Supervisor (CONSOB) D R
Panel F – Takeovers regulation
OPA regulation D
Limits on Cross-shareholdings (no more 2%, otherwise no vote)
D
In case of public offering parties in a syndicate agreement are free to tender
D
Public offering in case of control of more than 30% of listed firm
D
Cascade public offering on bottom listed firms (in case book value of bottom firms is 1/3 of book value of the top firm)
D
Passivity Rule D (30% ESM)
34
Panel G – Board regulation
Board responsibility CA
Separation of CEO and Chairman CA CA
Board size CA
Number, structure and independence of internal committees
CA V
Independent members CA CA R CA
Definition of ‘independence’ CA CA
Directors’ Remuneration CA
Three board typology (US, German, Italian) V
Panel H – Other events
Cirio’s default
Parmalat’s default
E uro
Star Segment
CA: Code of Conduct (‘Preda Code’), 1999, 2002, 2006 D: Corporate Governance Reform, (‘Draghi Law’), 1998 V: Corporate Law Reform (‘Vietti Reform’), 2004 R: Savings Reform (‘Riforma del Risparmio’), 2005 MA: Market Abuse (First phase: January 2006; second phase: April 2006)
35
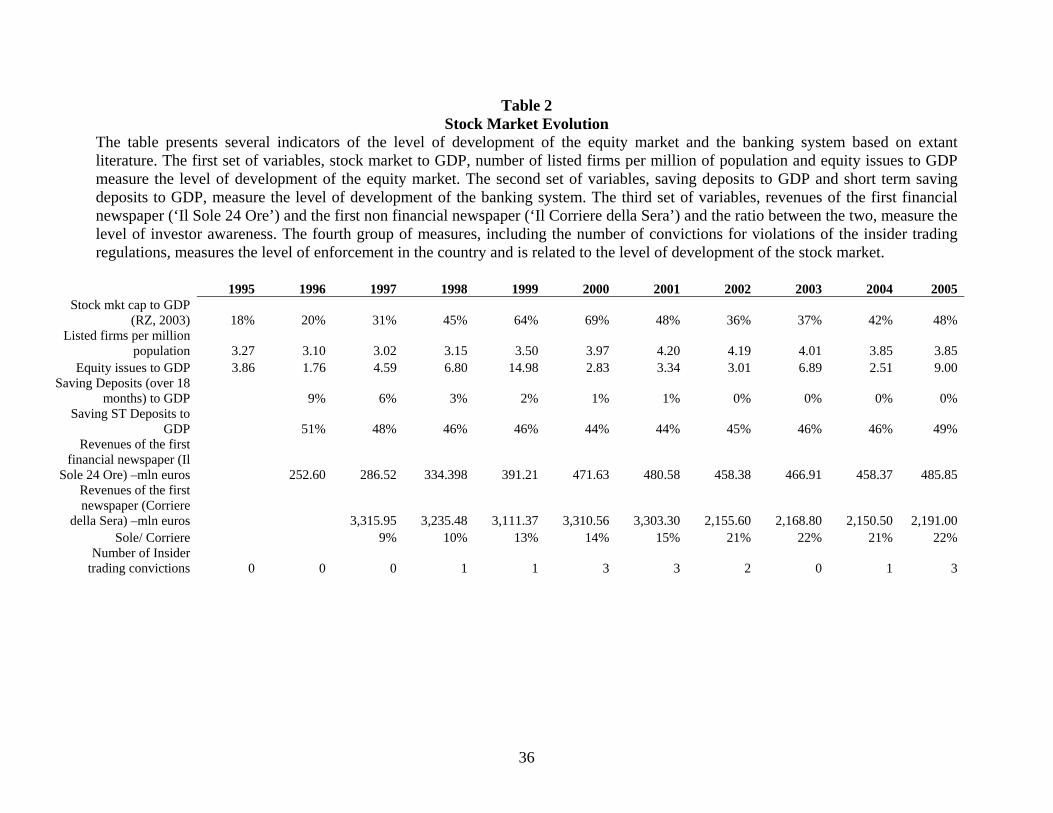
Table 2 Stock Market Evolution
The table presents several indicators of the level of development of the equity market and the banking system based on extant literature. The first set of variables, stock market to GDP, number of listed firms per million of population and equity issues to GDP measure the level of development of the equity market. The second set of variables, saving deposits to GDP and short term saving deposits to GDP, measure the level of development of the banking system. The third set of variables, revenues of the first financial newspaper (‘Il Sole 24 Ore’) and the first non financial newspaper (‘Il Corriere della Sera’) and the ratio between the two, measure the level of investor awareness. The fourth group of measures, including the number of convictions for violations of the insider trading regulations, measures the level of enforcement in the country and is related to the level of development of the stock market.
1995 1996 1997 1998 1999 2000 2001 2002 2003 2004 2005
Stock mkt cap to GDP (RZ, 2003) 18% 20% 31% 45% 64% 69% 48% 36% 37% 42% 48%
Listed firms per million population 3.27 3.10 3.02 3.15 3.50 3.97 4.20 4.19 4.01 3.85 3.85
Equity issues to GDP 3.86 1.76 4.59 6.80 14.98 2.83 3.34 3.01 6.89 2.51 9.00 Saving Deposits (over 18
months) to GDP 9% 6% 3% 2% 1% 1% 0% 0% 0% 0% Saving ST Deposits to
GDP 51% 48% 46% 46% 44% 44% 45% 46% 46% 49% Revenues of the first
financial newspaper (Il Sole 24 Ore) –mln euros 252.60 286.52 334.398 391.21 471.63 480.58 458.38 466.91 458.37 485.85
Revenues of the first newspaper (Corriere
della Sera) –mln euros 3,315.95 3,235.48 3,111.37 3,310.56 3,303.30 2,155.60 2,168.80 2,150.50 2,191.00 Sole/ Corriere 9% 10% 13% 14% 15% 21% 22% 21% 22%
Number of Insider trading convictions 0 0 0 1 1 3 3 2 0 1 3
36

Figure 1
Ownership Structure of the Ultimate shareholder in Unicem (Fiat Group) The figure illustrates the ownership structure of the Agnelli Family in Unicem, trough pyramiding, multiple control chains and limited-voting shares. Ownership is calculated using the methodology developed by Faccio and Lang (2002) and implemented calculating ownership of each firm in the group from the top towards the bottom using an automatic VBA top-down routine developed by the authors.
Agnelli Fam ily
G iovanni Agnelli & C . (A )
IF I (B )50% o50% no
Ifil (D )62.97% o37.03% no
U nicem (F )78.88% o21.12% no
T oro (E )71.61% o28.39% no
62.35% o
82.45% o
100.00% o
14.81% o
0.16% o
0.23% o
C am fin (C )100% o
37.65% o 14.60% o
32.83% o2.96% o
1.07% o
1.18% o
37

Table 3 Descriptive statistics
The table presents descriptive statistics for firms in our sample over the period 1995-2005. The second column illustrates the distribution of number of firms in our sample by year. The third column presents the number of IPOs by year. The fourth column contains the number of firms that were included in the sample in year t and delisted in t+1.
Year All Ipo in t Delisted in year t+1 1995 186 10 22 1996 176 12 17 1997 172 12 12 1998 179 17 3 1999 199 24 17 2000 226 45 6 2001 239 18 14 2002 240 9 16 2003 232 6 6 2004 225 9 5 2005 226 16 Total 2300 178 118
38
39
Table 4 Evolution of Corporate Ownership Structure in Italy: 1995 – 2005
The table presents summary statistics for the ownership structure of Italian firms listed on the Milan Stock Exchange (MSE) over the period 1995-2005. Following previous studies (Faccio and Lang, 2002), ownership structure is measured in terms of ownership rights (O), control rights (C) ownership-control ratio (OC). Ownership rights are calculated using the methodology developed by Faccio and Lang (2002) and implemented calculating using an automatic VBA top-down routine developed by the authors. Control rights are calculated using the methodology proposed by Brioschi, Buzzacchi, and Colombo (1990), while the Ownership-control ratio is calculated at the ratio of the ownership rights and control rights held by the ultimate shareholder. Data is obtained from “Edizioni Speciali - Bollettino Consob” N. 4/96, N. 4/97, and N. 4/98 for the years before 1998, and the Consob web site for the remaining years. Firms’ equity structure was checked with “Il Calepino dell’azionista”.
O C OC
Year Mean Median Mean Median Mean Median 1995 42.68% 44.12% 52.06% 52.12% 0.784 0.952 1996 41.56% 43.47% 50.16% 51.08% 0.787 0.979 1997 42.66% 46.81% 50.00% 51.01% 0.807 0.981 1998 42.82% 48.45% 48.55% 51.19% 0.842 1.000 1999 44.57% 50.08% 50.08% 51.58% 0.849 1.000 2000 45.19% 49.85% 49.53% 51.01% 0.892 95 96*** 97** 1.000 2001 46.36% 50.30% 50.34% 51.99% 0.898 95 96 97 *** 1.000 2002 46.84% 51.00% 50.44% 52.98% 0.904 95 96 97 *** 1.000 2003 46.46% 51.23% 49.36% 52.92% 0.916 95 96 97 *** 1.000 2004 46.54% 51.69% 49.09% 53.15% 0.918 95 96 97 *** 1.000 2005 44.71% 49.99% 48.10% 51.82% 0.912 95 96 97 *** 1.000 Total 44.79% 50.01% 49.77% 51.65% 0.870 1.000
Statistical tests Test F 1.983** 0.475 9.407*** Test Kruskal-Wallis 20.297** 3.588 114.455***Equality of medians 21.860*** 6.988
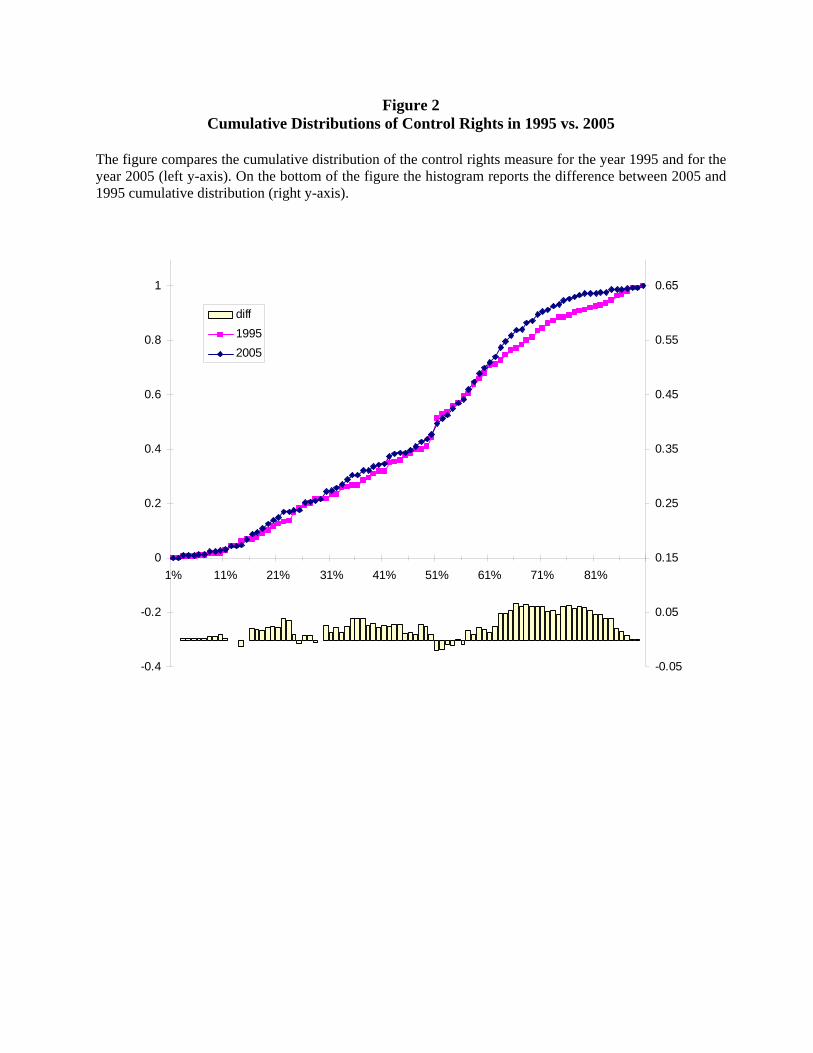
Figure 2 Cumulative Distributions of Control Rights in 1995 vs. 2005
The figure compares the cumulative distribution of the control rights measure for the year 1995 and for the year 2005 (left y-axis). On the bottom of the figure the histogram reports the difference between 2005 and 1995 cumulative distribution (right y-axis).
-0.4
-0.2
0
0.2
0.4
0.6
0.8
1
1% 11% 21% 31% 41% 51% 61% 71% 81%
-0.05
0.05
0.15
0.25
0.35
0.45
0.55
0.65
diff19952005

Table 5 Pyramiding and Dual-Class Shares
The table presents the evolution in the number and the percentage of firms that present pyramiding structures and dual classes of shares over the period 1995-2005.
Year Obs. Controlled through pyramiding
Firms with non voting shares Non voting/All #non voting/
#pyramiding) # # % # % %
1995 186 58 (31%) 72 (39%) 17% 1.24 1996 176 51 (29%) 67 (38%) 18% 1.31 1997 172 49 (28%) 68 (40%) 16% 1.39 1998 179 47 (26%) 58 (32%) 15% 1.23 1999 199 48 (24%) 59 (29%) 13% 1.23 2000 226 39 (17%) 48 (21%) 14% 1.23 2001 239 38 (16%) 45 (19%) 13% 1.18 2002 240 38 (16%) 39 (16%) 14% 1.03 2003 232 32 (14%) 33 (14%) 12% 1.03 2004 225 33 (15%) 29 (13%) 12% 0.88 2005 226 31 (14%) 28 (12%) 11% 0.90 Total 2300 464 (20%) 546 (24%) 15% 1.18
- 41 -
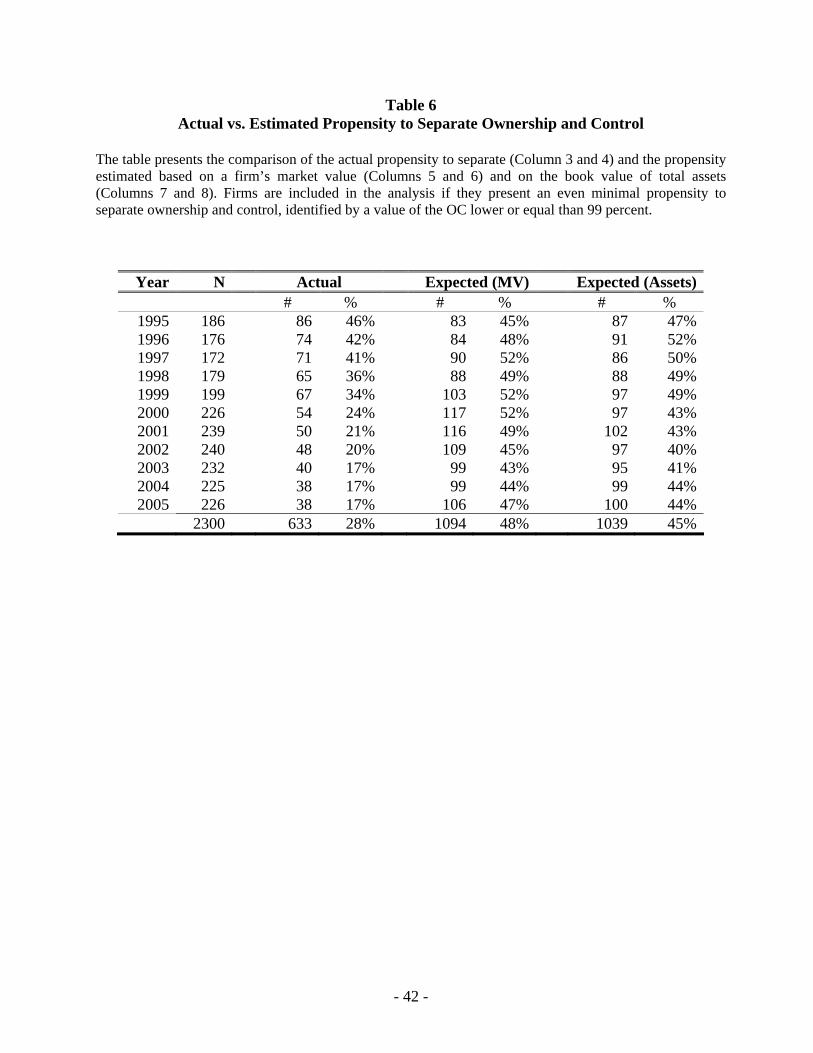
Table 6 Actual vs. Estimated Propensity to Separate Ownership and Control
The table presents the comparison of the actual propensity to separate (Column 3 and 4) and the propensity estimated based on a firm’s market value (Columns 5 and 6) and on the book value of total assets (Columns 7 and 8). Firms are included in the analysis if they present an even minimal propensity to separate ownership and control, identified by a value of the OC lower or equal than 99 percent.
Year N Actual Expected (MV) Expected (Assets) # % # % # %
1995 186 86 46% 83 45% 87 47%1996 176 74 42% 84 48% 91 52%1997 172 71 41% 90 52% 86 50%1998 179 65 36% 88 49% 88 49%1999 199 67 34% 103 52% 97 49%2000 226 54 24% 117 52% 97 43%2001 239 50 21% 116 49% 102 43%2002 240 48 20% 109 45% 97 40%2003 232 40 17% 99 43% 95 41%2004 225 38 17% 99 44% 99 44%2005 226 38 17% 106 47% 100 44%
2300 633 28% 1094 48% 1039 45%
- 42 -
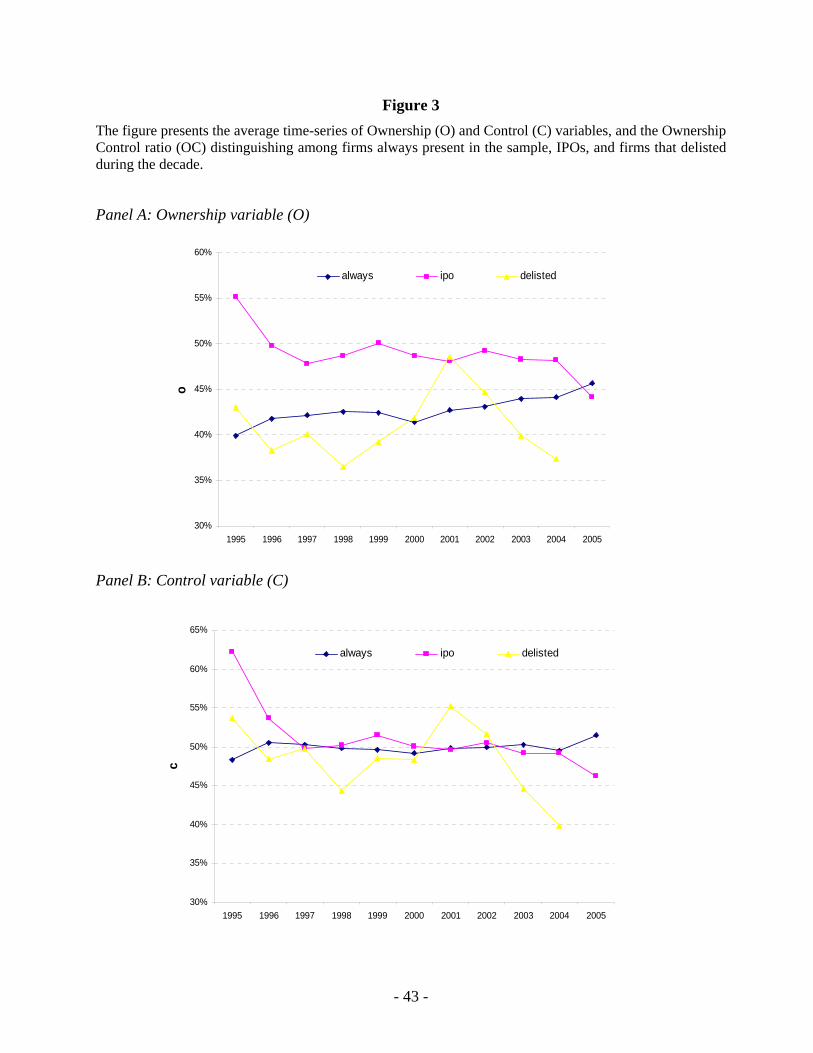
Figure 3 The figure presents the average time-series of Ownership (O) and Control (C) variables, and the Ownership Control ratio (OC) distinguishing among firms always present in the sample, IPOs, and firms that delisted during the decade.
Panel A: Ownership variable (O)
30%
35%
40%
45%
50%
55%
60%
1995 1996 1997 1998 1999 2000 2001 2002 2003 2004 2005
o
always ipo delisted
Panel B: Control variable (C)
30%
35%
40%
45%
50%
55%
60%
65%
1995 1996 1997 1998 1999 2000 2001 2002 2003 2004 2005
c
always ipo delisted
- 43 -
Panel C: Ownership-control ratio (OC)
70%
75%
80%
85%
90%
95%
100%
1995 1996 1997 1998 1999 2000 2001 2002 2003 2004 2005
oc
always ipo delisted
- 44 -