irrigation guide - canr.msu.edu · irrigation guide contents: chapter 1 introduction chapter 2...
TRANSCRIPT
(210-vi-NEH, September 1997) v
Part 652Irrigation Guide
Irrigation Guide
United StatesDepartment ofAgriculture
NaturalResourcesConservationService
NationalEngineeringHandbook

(210-vi-NEH, September 1997)vi
Part 652Irrigation Guide
Issued September 1997
The United States Department of Agriculture (USDA) prohibits discrimina-tion in its programs on the basis of race, color, national origin, sex, religion,age, disability, political beliefs, and marital or familial status. (Not all pro-hibited bases apply to all programs.) Persons with disabilities who requirealternative means for communication of program information (Braille, largeprint, audiotape, etc.) should contact USDA’s TARGET Center at (202) 720-2600 (voice and TDD).
To file a complaint, write the Secretary of Agriculture, U.S. Department ofAgriculture, Washington, DC 20250, or call 1-800-245-6340 (voice) or (202)720-1127 (TDD). USDA is an equal employment opportunity employer.
(210-vi-NEH, September 1997) i
Part 652Irrigation GuidePreface
Irrigation is vital to produce acceptable quality and yield of crops on aridclimate croplands. Supplemental irrigation is also vital to produce accept-able quality and yield of crops on croplands in semi-arid and subhumidclimates during seasonal droughty periods. The complete management ofirrigation water by the user is a necessary activity in our existence as asociety. Competition for a limited water supply for other uses by the publicrequire the irrigation water user to provide much closer control than everbefore. The importance of irrigated crops is extremely vital to the public'ssubsistence.
Today's management of irrigation water requires using the best informationand techniques that current technology can provide in the planning, design,evaluation, and management of irrigation systems. Support for many of thevalues included in this chapter come from field research, established designprocesses, and many system designs and evaluations over many years. Fieldevaluations must always be used to further refine the planning, design,evaluation, and management process. This design guide in the NaturalResources Conservation Service (NRCS), National Engineering Handbookseries provides that current technology.
Irrigation Guide, Part 652, is a guide. It describes the basics and process forplanning, designing, evaluating, and managing irrigation systems. It pro-vides the process for states to supplement the guide with local soils, crops,and irrigation water requirement information needed to plan, design, evalu-ate, and manage irrigation systems.
Irrigation Guide, Part 652, is a new handbook to the family of references inthe NRCS, National Engineering Handbook series. It is written for NRCSemployees who provide technical assistance to the water user with con-cerns for both water quantity and quality. Other technical personnel forFederal, State, private, and local agencies will also find the guide useful as abasic reference when providing technical assistance relating to planning,designing, evaluating, and managing irrigation systems. College and univer-sity instructors will also find the guide useful as a classroom reference.
In addition to the irrigation Guide (part 652), chapters in the NationalEngineering Handbook irrigation section (now part 623) describe:
• Soil-plant relationships and soil water properties that affect move-ment, retention, and release of water in soil
• Irrigation water requirements• Planning farm irrigation systems• Measurement of irrigation water• Design of pumping plants• Design criteria and design procedures for surface, sprinkler, and
micro irrigation methods and the variety of systems for each methodthat can be adaptable to meet local crop, water, and site conditionsand irrigation concerns
(210-vi-NEH, September 1997)ii
Part 652Irrigation GuideAcknowledgments
Part 652, Irrigation Guide, is an addition to the National Engineering Hand-book series. The document was initially prepared by Elwin A. Ross, irriga-tion engineer, NRCS, Engineering Division, Washington, DC, (retired) withprimary input and review from Leland A. Hardy, irrigation engineer,Midwest National Technical Center, NRCS, Lincoln, Nebraska, (retired).
Principal NRCS staff who contributed to the development and review ofthis publication were:John Brenner, irrigation engineer, North Platt, NebraskaJerry Walker, irrigation engineer, Temple, TexasCarl Gustafson, state conservation engineer, Amherst, MassachusettsDavid Nelson, assistant state conservation engineer, Amherst,MassachusettsJohn Dalton, agricultural engineer, Bozeman, Montana (retired)Jim Suit, state conservation engineer, Bozeman, Montana
State conservation engineers coordinated a multidiscipline (representingsoils, agronomy, water quality, and water management) review in all states.
William J. Carmack, national water management engineer, (retired),Ronald L. Marlow, water management engineer, NRCS, Washington, DC,and Thomas L. Spofford, irrigation engineer, NRCS, National Water andClimate Center, Portland, Oregon provided leadership and coordination.
Editing and publication production assistance were provided by the Techni-cal Publishing Team, NRCS, National Cartography and Geospatial Center,Fort Worth, Texas. Final technical review was provided by Elwin A. Rossand Leland A. Hardy.
(210-vi-NEH, September 1997) iii
Part 652Irrigation GuideIrrigation Guide
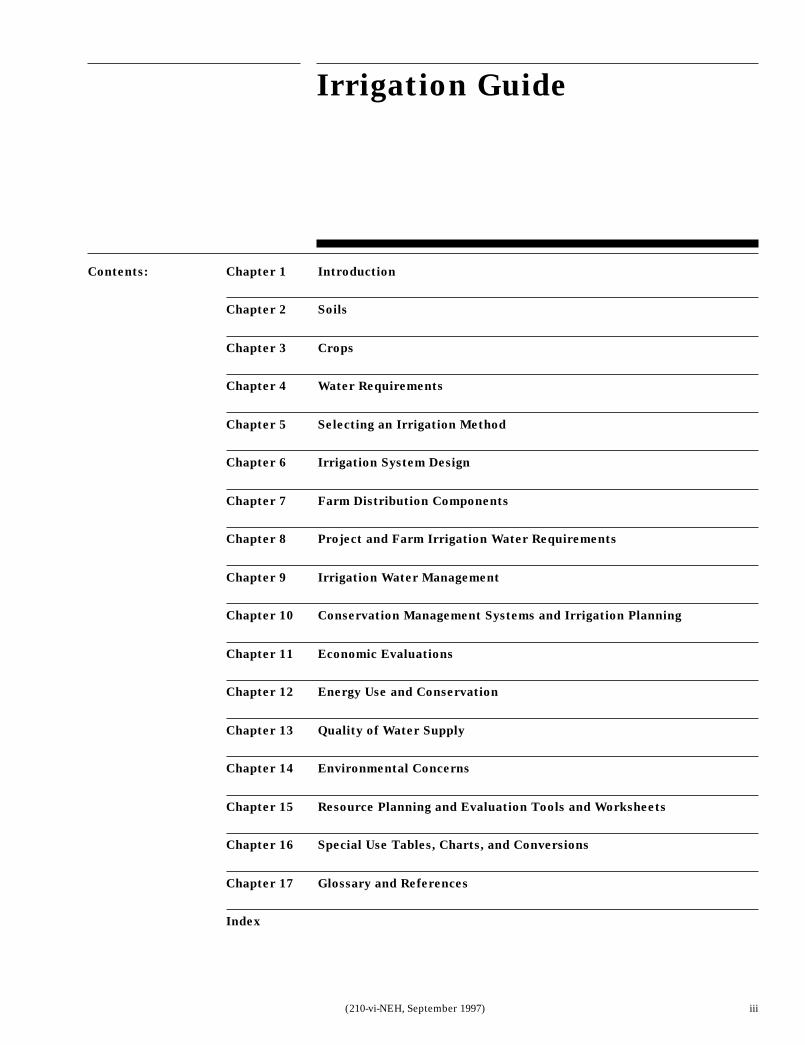
Contents: Chapter 1 Introduction
Chapter 2 Soils
Chapter 3 Crops
Chapter 4 Water Requirements
Chapter 5 Selecting an Irrigation Method
Chapter 6 Irrigation System Design
Chapter 7 Farm Distribution Components
Chapter 8 Project and Farm Irrigation Water Requirements
Chapter 9 Irrigation Water Management
Chapter 10 Conservation Management Systems and Irrigation Planning
Chapter 11 Economic Evaluations
Chapter 12 Energy Use and Conservation
Chapter 13 Quality of Water Supply
Chapter 14 Environmental Concerns
Chapter 15 Resource Planning and Evaluation Tools and Worksheets
Chapter 16 Special Use Tables, Charts, and Conversions
Chapter 17 Glossary and References
Index
Part 652Irrigation Guide
Resource Planning and Evaluation
Tools and Worksheets
Chapter 15
15–111(210-vi-NEH, September 1997)
Chapter 15 Resource Planning andEvaluation Tools andWorksheets
Contents:
15–i
652.1500 General 15–1
652.1501 Water quality, water management, and irrigation evaluation tools 15–1
652.1502 Irrigation system selection, design, costs, and evaluation tools 15–2
652.1503 Irrigation system planning, design, and evaluation worksheets 15–3
652.1504 Blank worksheets 15–5
Irrigation Planning Worksheet .......................................................................... 15–7
Irrigation System Inventory Worksheet .......................................................... 15–9
Sprinkler Irrigation System Planning/Design Worksheet ............................ 15–15
Irrigation Water Management Plan–Sprinkler Irrigation System ............... 15–21
Soil Water Holding Worksheet ........................................................................ 15–25
Worksheet, Soil-Water Content ...................................................................... 15–26
Determination of Soil Moisture and Bulk Density (dry) Using Eley .......... 15–27
Volumeter and Carbide Moisture Tester
Typical Water Balance Irrigation Scheduling Worksheet ........................... 15–28
Surface Irrigation System Detailed Evaluation Graded Border ................. 15–29
Worksheet
Profile and Cross Section ................................................................................ 15–37
Cylinder Infiltrometer Curves ......................................................................... 15–38
Cylinder Infiltrometer Test Data .................................................................... 15–39
Advance and recession curves ........................................................................ 15–40
Cylinder Infiltrometer Curves ......................................................................... 15–41
Depth infiltrated curve..................................................................................... 15–42
Surface Irrigation System Detailed Evaluation Level Border ..................... 15–43
and Basins Worksheet
Soil Water Intake Curves ................................................................................. 15–49
Surface Irrigation System Detailed Evaluation Graded .............................. 15–51
Furrow Worksheet
Surface Irrigation System Detailed Evaluation Furrow Worksheet .......... 15–57
Advance and recession curves ........................................................................ 15–61
Flow volume curves ......................................................................................... 15–62
Soil water intake curves .................................................................................. 15–63
Surface Irrigation System Detailed Evaluation Contour Ditch .................. 15–65
Irrigation System Worksheet
Part 652Irrigation Guide
Resource Planning and Evaluation
Tools and Worksheets
Chapter 15
15–112 (210-vi-NEH, September 1997)15–ii
Soil Water Intake Curves ................................................................................. 15–71
Cylinder Infiltrometer Test Data .................................................................... 15–72
Sprinkler Irrigation System Detailed Evaluation Periodic Move and ........ 15–73
Fixed Set Sprinkler System
Lateral move system catch can data .............................................................. 15–79
Sprinkler Irrigation System Detailed Evaluation Center Pivot ................... 15–81
Lateral Worksheet
Center pivot lateral evaluation, distribution profile of catch ..................... 15–88
Sprinkler Irrigation System Detailed Evaluation Contonuous Move, ........ 15–89
Large Sprinkler Gun Type
Micro Irrigation System Detailed Evaluation Worksheet ............................ 15–95
Pumping Plant Detailed Evaluation Worksheet ........................................... 15–99
Pump performance curve .............................................................................. 15–104
Soil Description .............................................................................................. 15–105
Cylinder Infiltrometer Test Data .................................................................. 15–106
Soil water intake curves ................................................................................ 15–107
Intake curve overlay....................................................................................... 15–108
Accumulated intake vs. time ......................................................................... 15–109
Intake families as used with furrow irrigation ........................................... 15–110
652.1505 Estimating Soil Moisture by Feel and Appearance 15–111
Part 652Irrigation Guide
Resource Planning and Evaluation
Tools and Worksheets
Chapter 15
15–1(210-vi-NEH, September 1997)
Chapter 15 Resource Planning and EvaluationTools and Worksheets
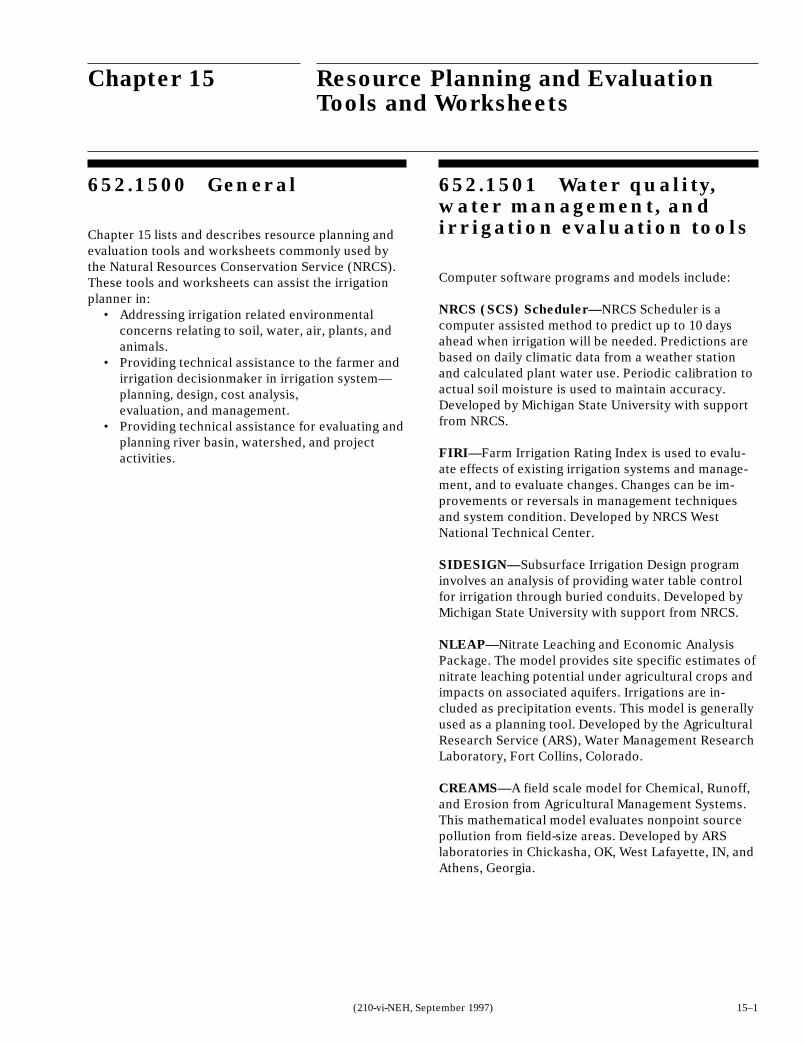
652.1500 General
Chapter 15 lists and describes resource planning andevaluation tools and worksheets commonly used bythe Natural Resources Conservation Service (NRCS).These tools and worksheets can assist the irrigationplanner in:
• Addressing irrigation related environmentalconcerns relating to soil, water, air, plants, andanimals.
• Providing technical assistance to the farmer andirrigation decisionmaker in irrigation system—planning, design, cost analysis,evaluation, and management.
• Providing technical assistance for evaluating andplanning river basin, watershed, and projectactivities.
652.1501 Water quality,water management, andirrigation evaluation tools
Computer software programs and models include:
NRCS (SCS) Scheduler—NRCS Scheduler is acomputer assisted method to predict up to 10 daysahead when irrigation will be needed. Predictions arebased on daily climatic data from a weather stationand calculated plant water use. Periodic calibration toactual soil moisture is used to maintain accuracy.Developed by Michigan State University with supportfrom NRCS.
FIRI—Farm Irrigation Rating Index is used to evalu-ate effects of existing irrigation systems and manage-ment, and to evaluate changes. Changes can be im-provements or reversals in management techniquesand system condition. Developed by NRCS WestNational Technical Center.
SIDESIGN—Subsurface Irrigation Design programinvolves an analysis of providing water table controlfor irrigation through buried conduits. Developed byMichigan State University with support from NRCS.
NLEAP—Nitrate Leaching and Economic AnalysisPackage. The model provides site specific estimates ofnitrate leaching potential under agricultural crops andimpacts on associated aquifers. Irrigations are in-cluded as precipitation events. This model is generallyused as a planning tool. Developed by the AgriculturalResearch Service (ARS), Water Management ResearchLaboratory, Fort Collins, Colorado.
CREAMS—A field scale model for Chemical, Runoff,and Erosion from Agricultural Management Systems.This mathematical model evaluates nonpoint sourcepollution from field-size areas. Developed by ARSlaboratories in Chickasha, OK, West Lafayette, IN, andAthens, Georgia.
Part 652Irrigation Guide
Resource Planning and Evaluation
Tools and Worksheets
Chapter 15
15–2 (210-vi-NEH, September 1997)
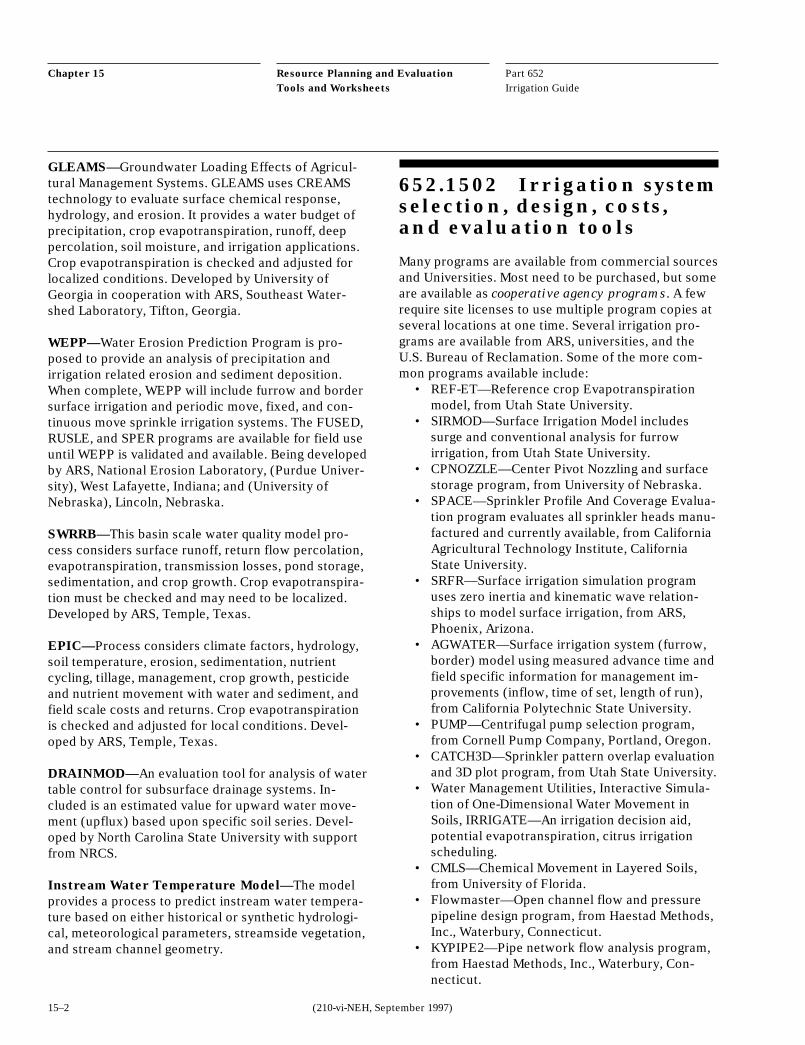
GLEAMS—Groundwater Loading Effects of Agricul-tural Management Systems. GLEAMS uses CREAMStechnology to evaluate surface chemical response,hydrology, and erosion. It provides a water budget ofprecipitation, crop evapotranspiration, runoff, deeppercolation, soil moisture, and irrigation applications.Crop evapotranspiration is checked and adjusted forlocalized conditions. Developed by University ofGeorgia in cooperation with ARS, Southeast Water-shed Laboratory, Tifton, Georgia.
WEPP—Water Erosion Prediction Program is pro-posed to provide an analysis of precipitation andirrigation related erosion and sediment deposition.When complete, WEPP will include furrow and bordersurface irrigation and periodic move, fixed, and con-tinuous move sprinkle irrigation systems. The FUSED,RUSLE, and SPER programs are available for field useuntil WEPP is validated and available. Being developedby ARS, National Erosion Laboratory, (Purdue Univer-sity), West Lafayette, Indiana; and (University ofNebraska), Lincoln, Nebraska.
SWRRB—This basin scale water quality model pro-cess considers surface runoff, return flow percolation,evapotranspiration, transmission losses, pond storage,sedimentation, and crop growth. Crop evapotranspira-tion must be checked and may need to be localized.Developed by ARS, Temple, Texas.
EPIC—Process considers climate factors, hydrology,soil temperature, erosion, sedimentation, nutrientcycling, tillage, management, crop growth, pesticideand nutrient movement with water and sediment, andfield scale costs and returns. Crop evapotranspirationis checked and adjusted for local conditions. Devel-oped by ARS, Temple, Texas.
DRAINMOD—An evaluation tool for analysis of watertable control for subsurface drainage systems. In-cluded is an estimated value for upward water move-ment (upflux) based upon specific soil series. Devel-oped by North Carolina State University with supportfrom NRCS.
Instream Water Temperature Model—The modelprovides a process to predict instream water tempera-ture based on either historical or synthetic hydrologi-cal, meteorological parameters, streamside vegetation,and stream channel geometry.
652.1502 Irrigation systemselection, design, costs,and evaluation tools
Many programs are available from commercial sourcesand Universities. Most need to be purchased, but someare available as cooperative agency programs. A fewrequire site licenses to use multiple program copies atseveral locations at one time. Several irrigation pro-grams are available from ARS, universities, and theU.S. Bureau of Reclamation. Some of the more com-mon programs available include:
• REF-ET—Reference crop Evapotranspirationmodel, from Utah State University.
• SIRMOD—Surface Irrigation Model includessurge and conventional analysis for furrowirrigation, from Utah State University.
• CPNOZZLE—Center Pivot Nozzling and surfacestorage program, from University of Nebraska.
• SPACE—Sprinkler Profile And Coverage Evalua-tion program evaluates all sprinkler heads manu-factured and currently available, from CaliforniaAgricultural Technology Institute, CaliforniaState University.
• SRFR—Surface irrigation simulation programuses zero inertia and kinematic wave relation-ships to model surface irrigation, from ARS,Phoenix, Arizona.
• AGWATER—Surface irrigation system (furrow,border) model using measured advance time andfield specific information for management im-provements (inflow, time of set, length of run),from California Polytechnic State University.
• PUMP—Centrifugal pump selection program,from Cornell Pump Company, Portland, Oregon.
• CATCH3D—Sprinkler pattern overlap evaluationand 3D plot program, from Utah State University.
• Water Management Utilities, Interactive Simula-tion of One-Dimensional Water Movement inSoils, IRRIGATE—An irrigation decision aid,potential evapotranspiration, citrus irrigationscheduling.
• CMLS—Chemical Movement in Layered Soils,from University of Florida.
• Flowmaster—Open channel flow and pressurepipeline design program, from Haestad Methods,Inc., Waterbury, Connecticut.
• KYPIPE2—Pipe network flow analysis program,from Haestad Methods, Inc., Waterbury, Con-necticut.
Part 652Irrigation Guide
Resource Planning and Evaluation
Tools and Worksheets
Chapter 15
15–3(210-vi-NEH, September 1997)
652.1503 Irrigation sys-tem planning, design, andevaluation worksheets
Example evaluations and blank worksheets are in-cluded at the back of this chapter. They may be copiedand used as needed. They include:
Irrigation Planning
Irrigation PlanningIrrigation System Inventory
Irrigation System Design
Sprinkler Irrigation System Planning/Design
Irrigation System Evaluation
Walk Through Sprinkler Irrigation System Analysis
Sprinkler Irrigation Systems EvaluationPeriodic Move Sprinkler—Side Wheel-roll,
Lateral Tow, Hand Move and Fixed (Solid)Set Systems
Continuous/Self Move Sprinkler—PivotSystem
Pumping Plant EvaluationElectric Motor PoweredNatural Gas Engine Powered
Micro Irrigation Systems Evaluation
Surface Irrigation Systems EvaluationGraded BordersBasins, Level BorderGraded FurrowsLevel furrows
Irrigation Water Management
Irrigation Water Management PlanSoil Moisture—Feel and Appearance Method,
Speedy Moisture Meter and Eley VolumeterCrop and Soil Data for Irrigation Water
ManagementCheckbook Method of Irrigation SchedulingPan Evaporation Method of Irrigation Scheduling

Part 652Irrigation Guide
Resource Planning and Evaluation
Tools and Worksheets
Chapter 15
15–4 (210-vi-NEH, September 1997)

Part 652Irrigation Guide
Resource Planning and Evaluation
Tools and Worksheets
Chapter 15
15–5(210-vi-NEH, September 1997)
652.1504 Blank worksheets

Part 652Irrigation Guide
Resource Planning and Evaluation
Tools and Worksheets
Chapter 15
15–6 (210-vi-NEH, September 1997)
Part 652Irrigation Guide
Resource Planning and Evaluation
Tools and Worksheets
Chapter 15
15–7(210-vi-NEH, September 1997)
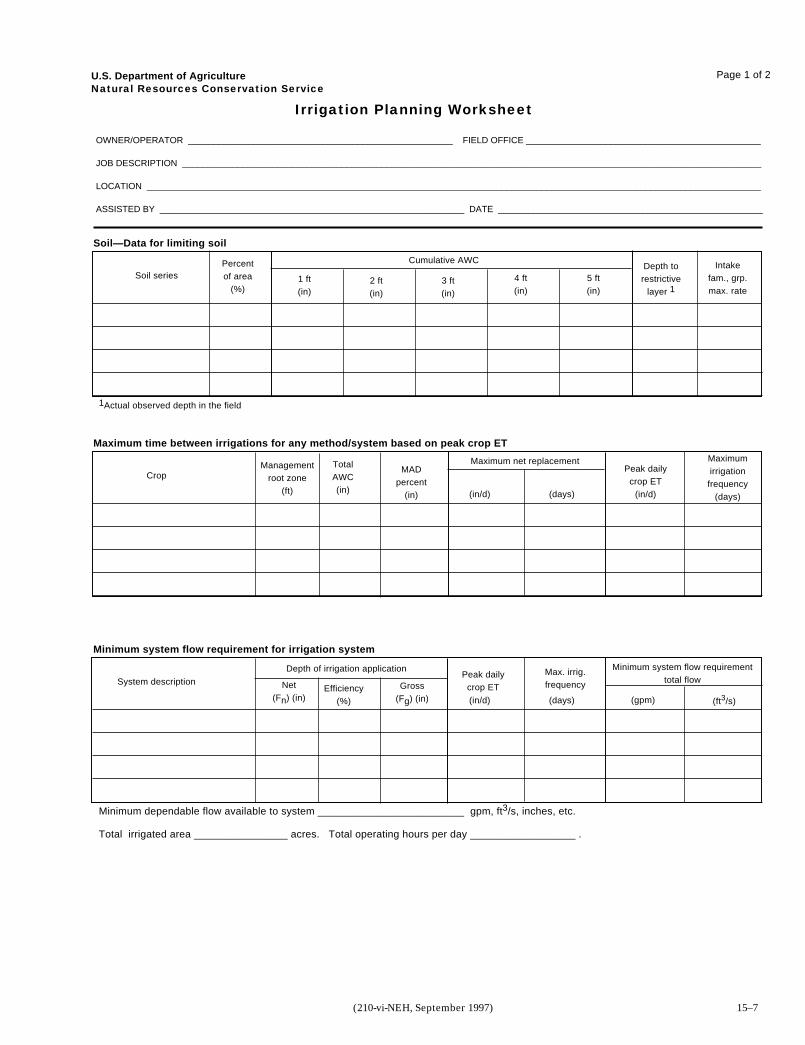
U.S. Department of AgricultureNatural Resources Conservation Service
Irrigation Planning Worksheet
OWNER/OPERATOR _____________________________________________________ FIELD OFFICE _______________________________________________
JOB DESCRIPTION ____________________________________________________________________________________________________________________
LOCATION ___________________________________________________________________________________________________________________________
ASSISTED BY _____________________________________________________________ DATE _____________________________________________________
Soil—Data for limiting soil
Page 1 of 2
Soil seriesPercentof area
(%)
Cumulative AWC
1 ft(in)
2 ft(in)
5 ft(in)
4 ft(in)
3 ft(in)
Depth torestrictive
layer 1
Intakefam., grp.max. rate
1Actual observed depth in the field
Maximum time between irrigations for any method/system based on peak crop ET
CropManagement
root zone(ft)
Maximum net replacementTotalAWC(in)
MADpercent
(in) (days)(in/d)
Peak dailycrop ET
(in/d)
Maximumirrigationfrequency
(days)
Minimum system flow requirement for irrigation system
System description Net(Fn) (in)
Depth of irrigation application
Efficiency(%)
Gross(Fg) (in) (days)(in/d) (gpm) (ft3/s)
Minimum dependable flow available to system _________________________ gpm, ft3/s, inches, etc.
Total irrigated area ________________ acres. Total operating hours per day __________________ .
Peak dailycrop ET
Max. irrig.frequency
Minimum system flow requirementtotal flow
Part 652Irrigation Guide
Resource Planning and Evaluation
Tools and Worksheets
Chapter 15
15–8 (210-vi-NEH, September 1997)
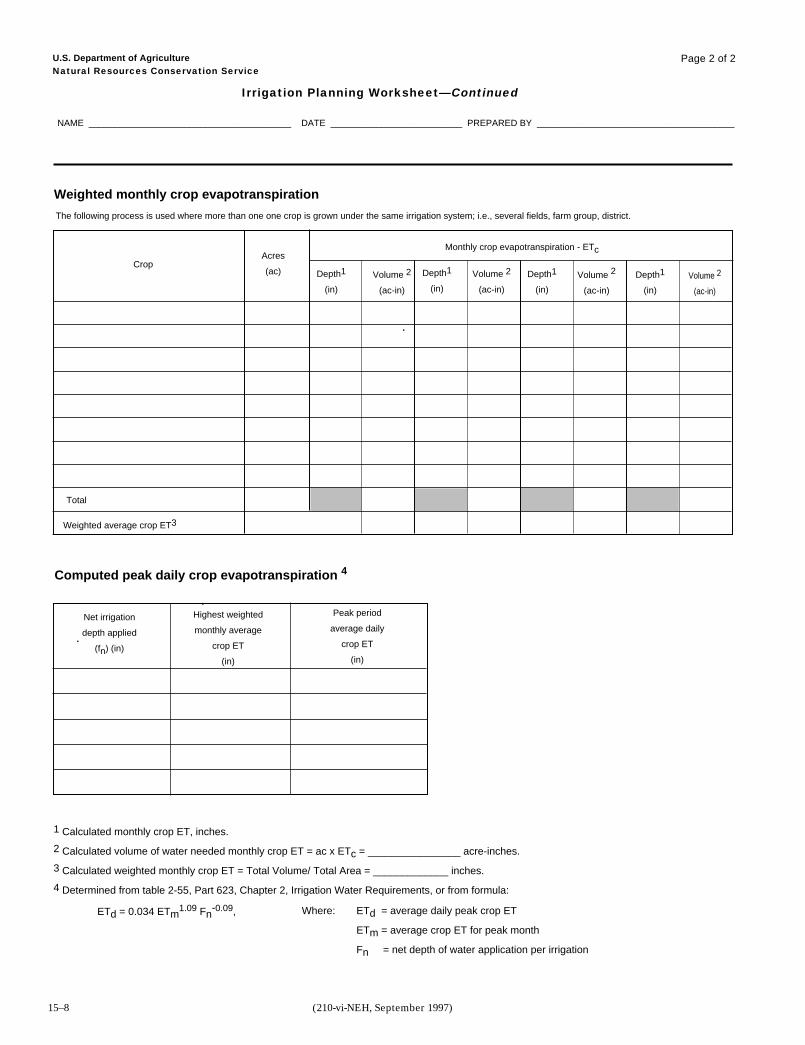
U.S. Department of AgricultureNatural Resources Conservation Service
Irrigation Planning Worksheet—Continued
NAME ________________________________________ DATE __________________________ PREPARED BY _______________________________________
Page 2 of 2
Weighted monthly crop evapotranspiration
CropAcres
(ac) Depth1
(in)
Volume 2
(ac-in)
The following process is used where more than one one crop is grown under the same irrigation system; i.e., several fields, farm group, district.
Monthly crop evapotranspiration - ETc
Depth1
(in)
Volume 2
(ac-in)
Depth1
(in)
Volume 2
(ac-in)
Depth1
(in)
Volume 2
(ac-in)
Total
Weighted average crop ET3
Computed peak daily crop evapotranspiration 4
Net irrigation
depth applied
(fn) (in)
Highest weighted
monthly average
crop ET
(in)
Peak period
average daily
crop ET
(in)
1 Calculated monthly crop ET, inches.
2 Calculated volume of water needed monthly crop ET = ac x ETc = ________________ acre-inches.
3 Calculated weighted monthly crop ET = Total Volume/ Total Area = _____________ inches.
4 Determined from table 2-55, Part 623, Chapter 2, Irrigation Water Requirements, or from formula:
ETd = 0.034 ETm1.09 Fn
-0.09, Where: ETd = average daily peak crop ET
ETm = average crop ET for peak month
Fn = net depth of water application per irrigation
Part 652Irrigation Guide
Resource Planning and Evaluation
Tools and Worksheets
Chapter 15
15–9(210-vi-NEH, September 1997)
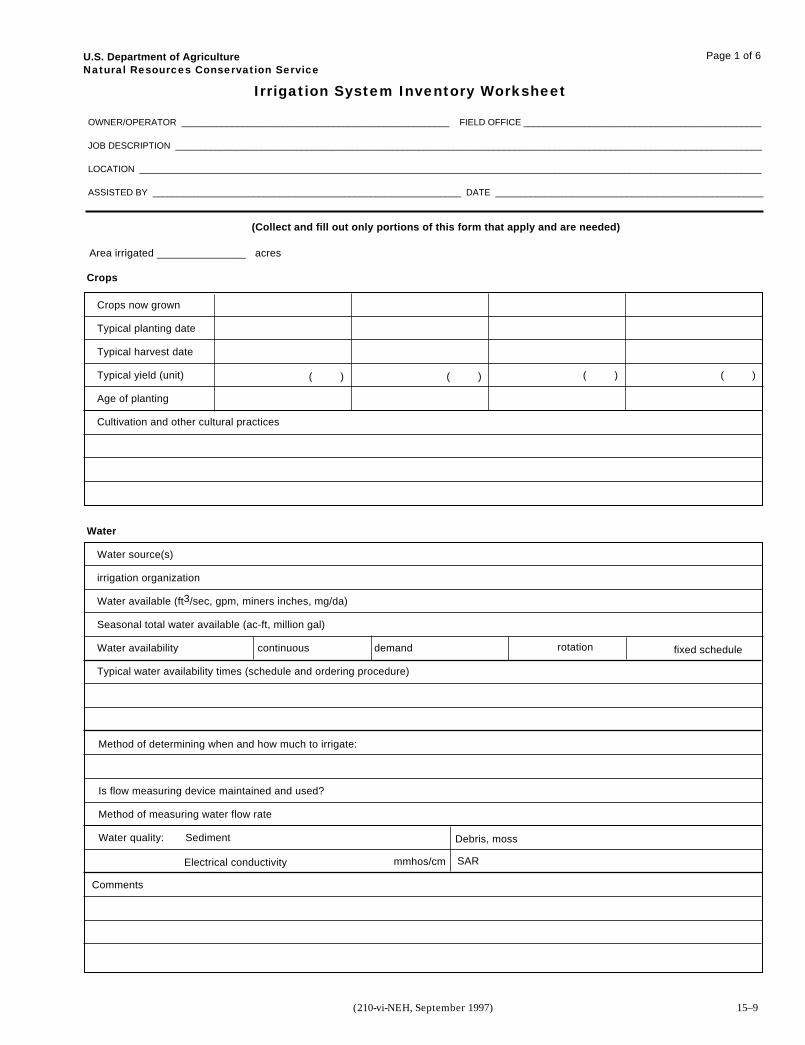
U.S. Department of AgricultureNatural Resources Conservation Service
Irrigation System Inventory Worksheet
OWNER/OPERATOR _____________________________________________________ FIELD OFFICE _______________________________________________
JOB DESCRIPTION ____________________________________________________________________________________________________________________
LOCATION ___________________________________________________________________________________________________________________________
ASSISTED BY _____________________________________________________________ DATE _____________________________________________________
Crops
Page 1 of 6
(Collect and fill out only portions of this form that apply and are needed)
Area irrigated _______________ acres
Crops now grown
Typical planting date
Typical harvest date
Typical yield (unit)
Age of planting
Cultivation and other cultural practices
( ) ( ) ( ) ( )
Water
Water source(s)
irrigation organization
Water available (ft3/sec, gpm, miners inches, mg/da)
Seasonal total water available (ac-ft, million gal)
Water availability continuous
Typical water availability times (schedule and ordering procedure)
fixed scheduledemand rotation
Method of determining when and how much to irrigate:
Is flow measuring device maintained and used?
Method of measuring water flow rate
Water quality: Sediment
Electrical conductivity
Comments
Debris, moss
mmhos/cm SAR
Part 652Irrigation Guide
Resource Planning and Evaluation
Tools and Worksheets
Chapter 15
15–10 (210-vi-NEH, September 1997)
U.S. Department of AgricultureNatural Resources Conservation Service
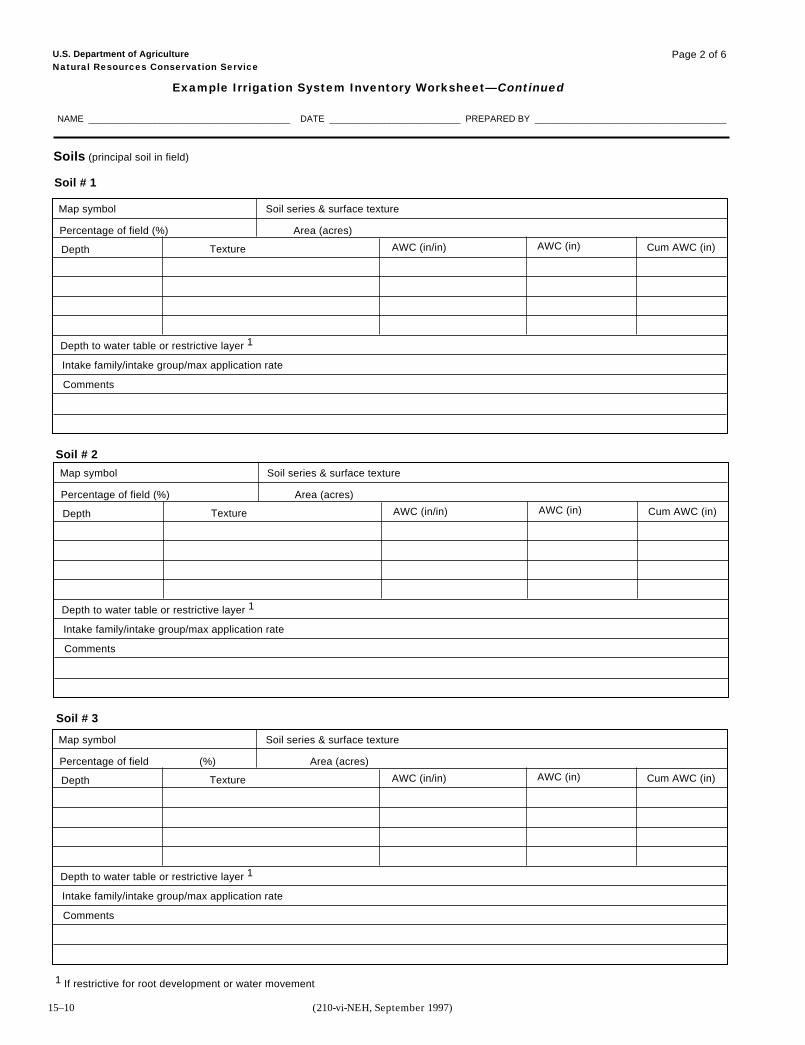
Example Irrigation System Inventory Worksheet—Continued
NAME ________________________________________ DATE __________________________ PREPARED BY ______________________________________
Page 2 of 6
1 If restrictive for root development or water movement
Soils (principal soil in field)
Soil # 1
Map symbol Soil series & surface texture
Percentage of field (%) Area (acres)
Depth Texture AWC (in/in) AWC (in) Cum AWC (in)
Depth to water table or restrictive layer 1
Intake family/intake group/max application rate
Comments
Soil # 2
Soil # 3
Map symbol Soil series & surface texture
Percentage of field (%) Area (acres)
Depth Texture AWC (in/in) AWC (in) Cum AWC (in)
Depth to water table or restrictive layer 1
Intake family/intake group/max application rate
Comments
Map symbol Soil series & surface texture
Percentage of field (%) Area (acres)
Depth Texture AWC (in/in) AWC (in) Cum AWC (in)
Depth to water table or restrictive layer 1
Intake family/intake group/max application rate
Comments
Part 652Irrigation Guide
Resource Planning and Evaluation
Tools and Worksheets
Chapter 15
15–11(210-vi-NEH, September 1997)
U.S. Department of AgricultureNatural Resources Conservation Service
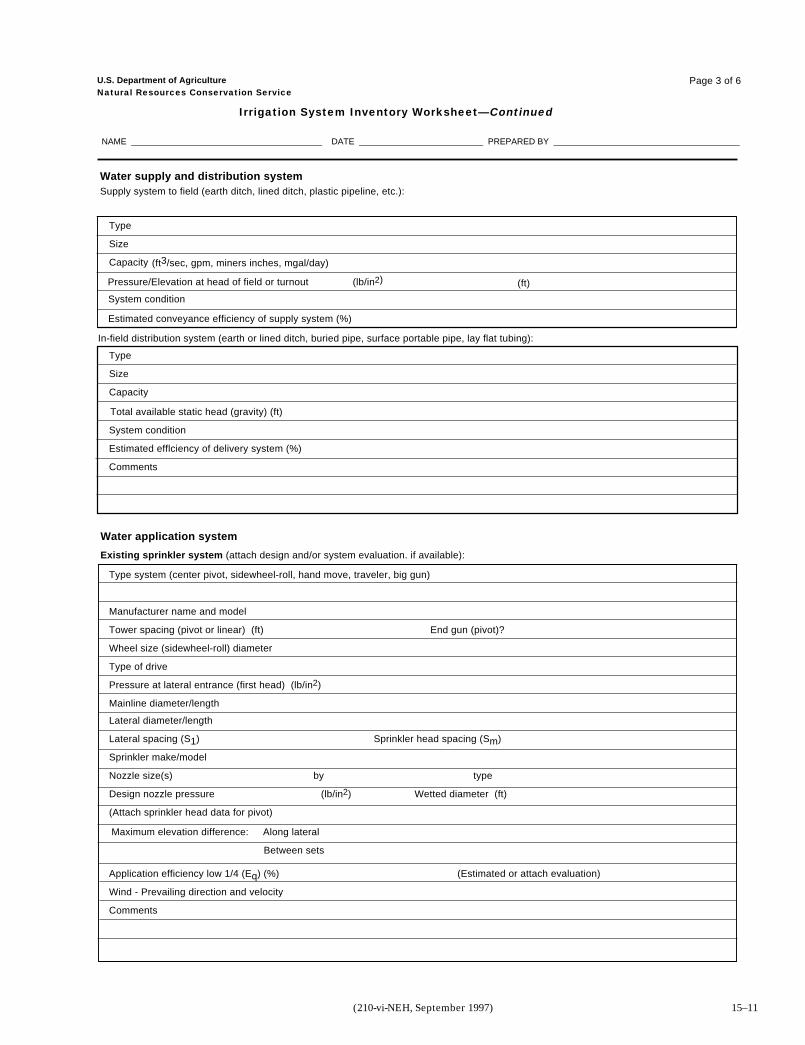
Irrigation System Inventory Worksheet—Continued
NAME ________________________________________ DATE __________________________ PREPARED BY _______________________________________
Page 3 of 6
Water supply and distribution systemSupply system to field (earth ditch, lined ditch, plastic pipeline, etc.):
Type
Size
Capacity (ft3/sec, gpm, miners inches, mgal/day)
Pressure/Elevation at head of field or turnout (lb/in2) (ft)
System condition
Estimated conveyance efficiency of supply system (%)
In-field distribution system (earth or lined ditch, buried pipe, surface portable pipe, lay flat tubing):
Type
Size
Capacity
Total available static head (gravity) (ft)
System condition
Estimated efflciency of delivery system (%)
Comments
Water application system
Existing sprinkler system (attach design and/or system evaluation. if available):
Type system (center pivot, sidewheel-roll, hand move, traveler, big gun)
Manufacturer name and model
Tower spacing (pivot or linear) (ft) End gun (pivot)?
Wheel size (sidewheel-roll) diameter
Type of drive
Pressure at lateral entrance (first head) (lb/in2)
Mainline diameter/length
Lateral diameter/length
Lateral spacing (S1) Sprinkler head spacing (Sm)
Sprinkler make/model
Nozzle size(s) by type
Design nozzle pressure (lb/in2) Wetted diameter (ft)
(Attach sprinkler head data for pivot)
Maximum elevation difference: Along lateral
Between sets
Application efficiency low 1/4 (Eq) (%) (Estimated or attach evaluation)
Wind - Prevailing direction and velocity
Comments
Part 652Irrigation Guide
Resource Planning and Evaluation
Tools and Worksheets
Chapter 15
15–12 (210-vi-NEH, September 1997)
U.S. Department of AgricultureNatural Resources Conservation Service
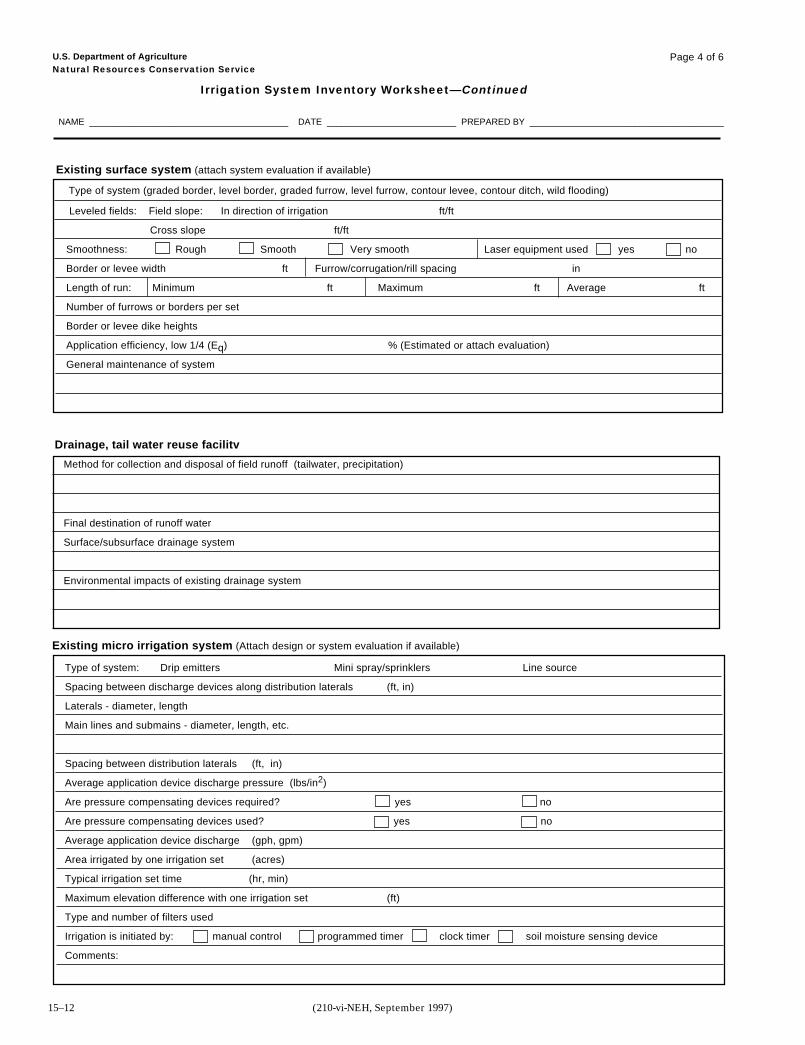
Irrigation System Inventory Worksheet—Continued
Page 4 of 6
NAME ________________________________________ DATE __________________________ PREPARED BY _______________________________________
Existing surface system (attach system evaluation if available)
Type of system (graded border, level border, graded furrow, level furrow, contour levee, contour ditch, wild flooding)
Leveled fields: Field slope: In direction of irrigation ft/ft
Cross slope ft/ft
Smoothness: Rough Smooth Very smooth Laser equipment used yes no
Border or levee width ft Furrow/corrugation/rill spacing in
Length of run: Minimum ft Maximum ft Average ft
Number of furrows or borders per set
Border or levee dike heights
Application efficiency, low 1/4 (Eq) % (Estimated or attach evaluation)
General maintenance of system
Drainage, tail water reuse facilitv
Method for collection and disposal of field runoff (tailwater, precipitation)
Final destination of runoff water
Surface/subsurface drainage system
Environmental impacts of existing drainage system
Type of system: Drip emitters Mini spray/sprinklers Line source
Spacing between discharge devices along distribution laterals (ft, in)
Laterals - diameter, length
Main lines and submains - diameter, length, etc.
Spacing between distribution laterals (ft, in)
Average application device discharge pressure (lbs/in2)
Are pressure compensating devices required? yes no
Are pressure compensating devices used? yes no
Average application device discharge (gph, gpm)
Area irrigated by one irrigation set (acres)
Typical irrigation set time (hr, min)
Maximum elevation difference with one irrigation set (ft)
Type and number of filters used
Irrigation is initiated by: manual control programmed timer clock timer soil moisture sensing device
Comments:
Existing micro irrigation system (Attach design or system evaluation if available)
Part 652Irrigation Guide
Resource Planning and Evaluation
Tools and Worksheets
Chapter 15
15–13(210-vi-NEH, September 1997)
U.S. Department of AgricultureNatural Resources Conservation Service
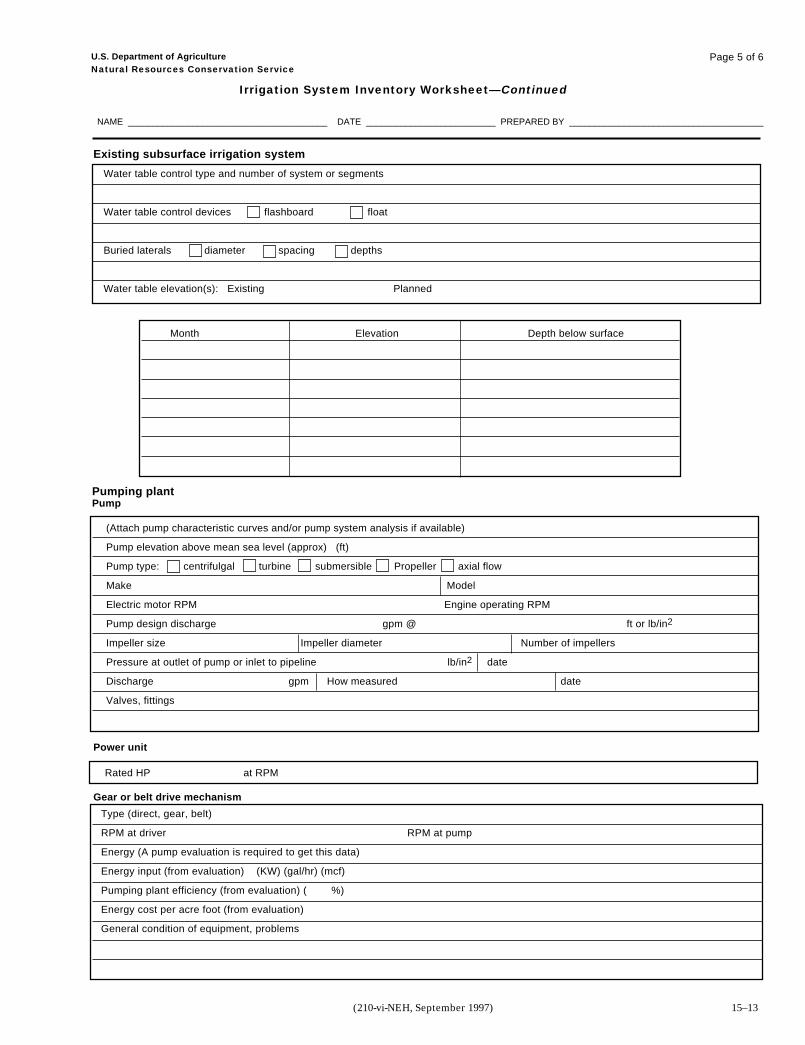
Irrigation System Inventory Worksheet—Continued
Page 5 of 6
NAME ________________________________________ DATE __________________________ PREPARED BY _______________________________________
Type (direct, gear, belt)
RPM at driver RPM at pump
Energy (A pump evaluation is required to get this data)
Energy input (from evaluation) (KW) (gal/hr) (mcf)
Pumping plant efficiency (from evaluation) ( %)
Energy cost per acre foot (from evaluation)
General condition of equipment, problems
Existing subsurface irrigation system
Water table control type and number of system or segments
Water table control devices flashboard float
Buried laterals diameter spacing depths
Water table elevation(s): Existing Planned
Month Elevation Depth below surface
Pumping plantPump
(Attach pump characteristic curves and/or pump system analysis if available)
Pump elevation above mean sea level (approx) (ft)
Pump type: centrifulgal turbine submersible Propeller axial flow
Make Model
Electric motor RPM Engine operating RPM
Pump design discharge gpm @ ft or lb/in2
Impeller size Impeller diameter Number of impellers
Pressure at outlet of pump or inlet to pipeline lb/in2 date
Discharge gpm How measured date
Valves, fittings
Power unit
Gear or belt drive mechanism
Rated HP at RPM
Part 652Irrigation Guide
Resource Planning and Evaluation
Tools and Worksheets
Chapter 15
15–14 (210-vi-NEH, September 1997)
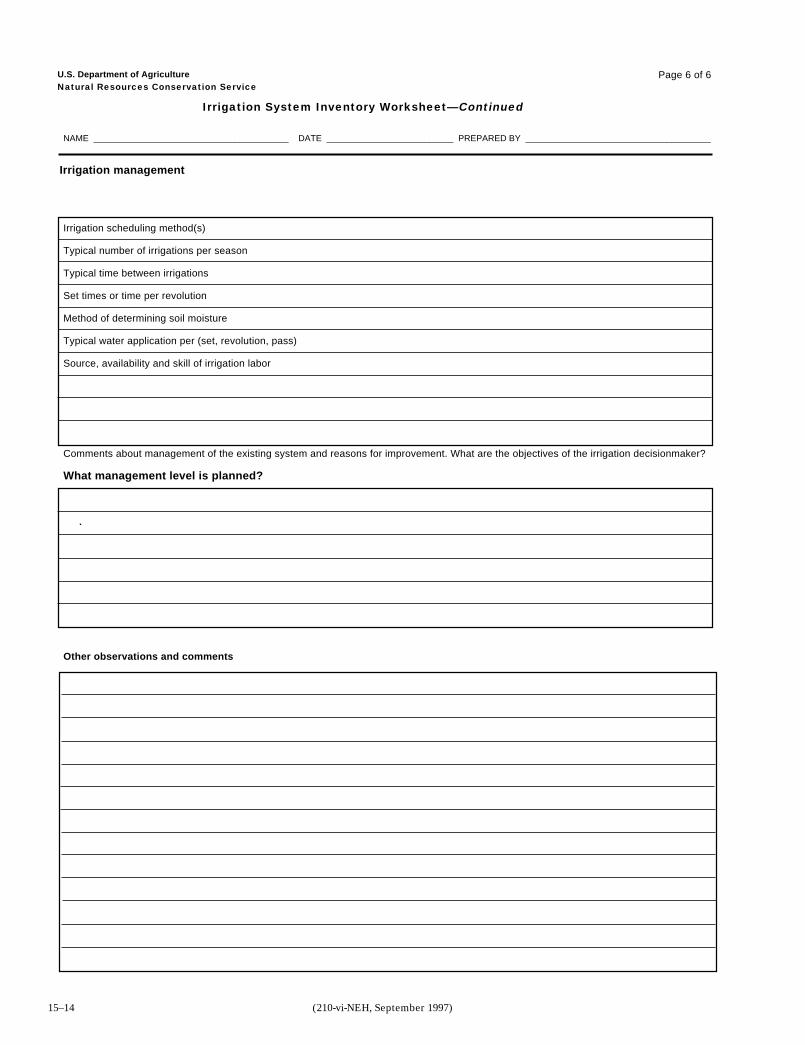
U.S. Department of AgricultureNatural Resources Conservation Service
Irrigation System Inventory Worksheet—Continued
Page 6 of 6
NAME ________________________________________ DATE __________________________ PREPARED BY ______________________________________
Irrigation management
Irrigation scheduling method(s)
Typical number of irrigations per season
Typical time between irrigations
Set times or time per revolution
Method of determining soil moisture
Typical water application per (set, revolution, pass)
Source, availability and skill of irrigation labor
Comments about management of the existing system and reasons for improvement. What are the objectives of the irrigation decisionmaker?
What management level is planned?
Other observations and comments
Part 652Irrigation Guide
Resource Planning and Evaluation
Tools and Worksheets
Chapter 15
15–15(210-vi-NEH, September 1997)
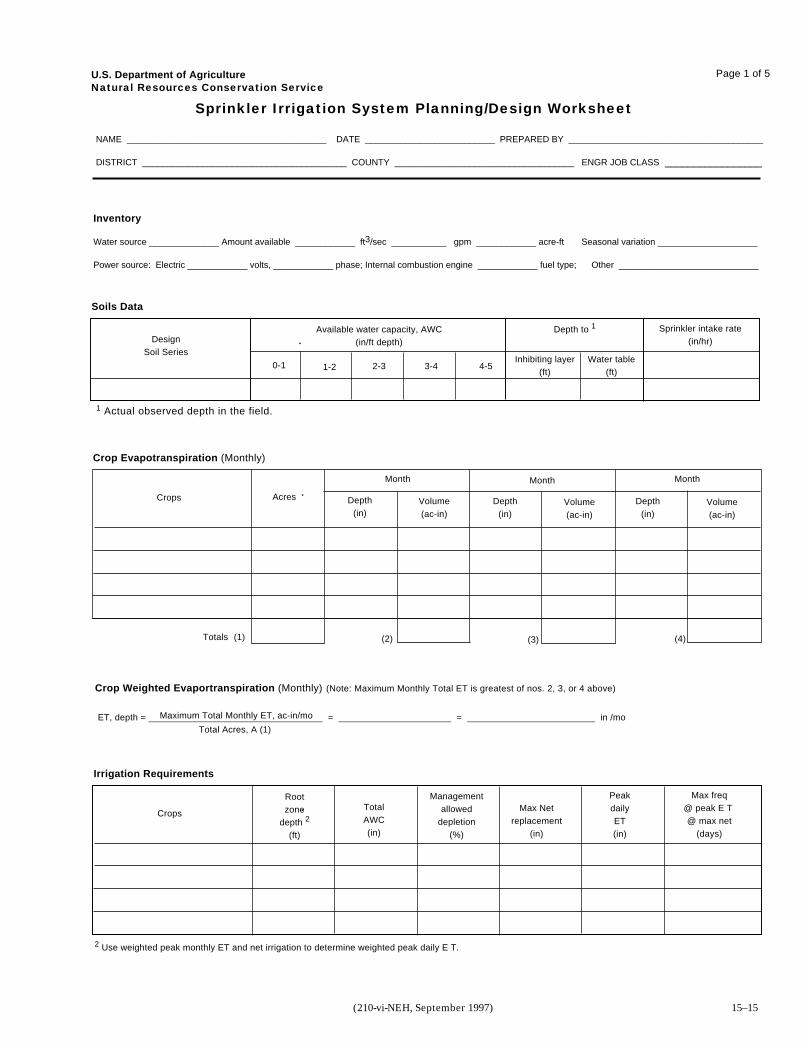
U.S. Department of AgricultureNatural Resources Conservation Service
Sprinkler Irrigation System Planning/Design Worksheet
NAME ________________________________________ DATE __________________________ PREPARED BY _______________________________________
DISTRICT _________________________________________ COUNTY ____________________________________ ENGR JOB CLASS _________________
Inventory
Water source ______________ Amount available ____________ ft3/sec ___________ gpm ____________ acre-ft Seasonal variation ____________________
Power source: Electric ____________ volts, ____________ phase; Internal combustion engine ____________ fuel type; Other ____________________________
Soils Data
Available water capacity, AWC(in/ft depth)
Depth to 1
Inhibiting layer(ft)
Water table(ft)
Sprinkler intake rate(in/hr)
0-1 1-2 2-3 3-4 4-5
DesignSoil Series
1 Actual observed depth in the field.
Crop Evapotranspiration (Monthly)
Acres Depth(in)
Month
Volume(ac-in)
Crops
Month Month
Depth(in)
Volume(ac-in)
Depth(in)
Volume(ac-in)
Crop Weighted Evaportranspiration (Monthly) (Note: Maximum Monthly Total ET is greatest of nos. 2, 3, or 4 above)
(1)Totals
Maximum Total Monthly ET, ac-in/mo
Total Acres, A (1)ET, depth = __________________________________ = ______________________ = _________________________ in /mo
Irrigation Requirements
Rootzone
depth 2
(ft)
TotalAWC(in)
Managementallowed
depletion(%)
CropsMax Net
replacement(in)
PeakdailyET(in)
Max freq@ peak E T @ max net
(days)
(2) (3) (4)
Page 1 of 5
2 Use weighted peak monthly ET and net irrigation to determine weighted peak daily E T.
Part 652Irrigation Guide
Resource Planning and Evaluation
Tools and Worksheets
Chapter 15
15–16 (210-vi-NEH, September 1997)
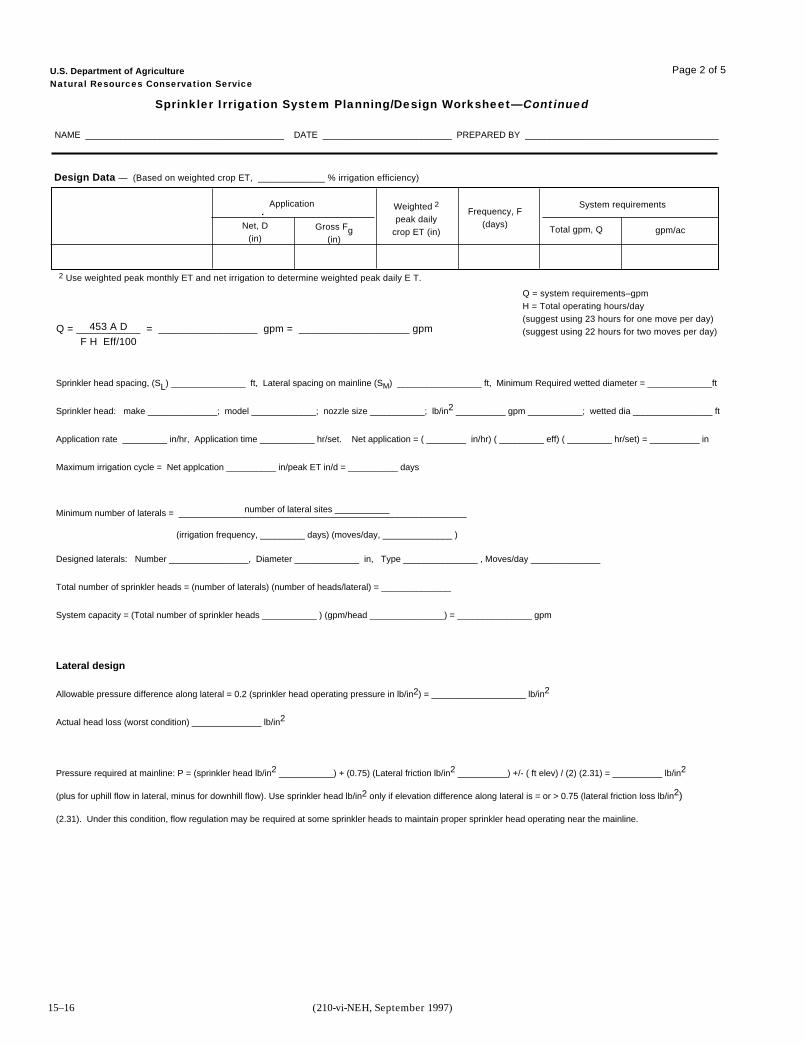
U.S. Department of AgricultureNatural Resources Conservation Service
Sprinkler Irrigation System Planning/Design Worksheet—Continued
NAME ________________________________________ DATE __________________________ PREPARED BY _______________________________________
Sprinkler head spacing, (SL) _______________ ft, Lateral spacing on mainline (SM) _________________ ft, Minimum Required wetted diameter = _____________ft
Sprinkler head: make ______________; model _____________; nozzle size ___________; lb/in2 __________ gpm ___________; wetted dia ________________ ft
Application rate _________ in/hr, Application time ___________ hr/set. Net application = ( ________ in/hr) ( _________ eff) ( _________ hr/set) = __________ in
Maximum irrigation cycle = Net applcation __________ in/peak ET in/d = __________ days
Minimum number of laterals = __________________________________________________________
Designed laterals: Number ________________, Diameter _____________ in, Type _______________ , Moves/day ______________
Total number of sprinkler heads = (number of laterals) (number of heads/lateral) = ______________
System capacity = (Total number of sprinkler heads ___________ ) (gpm/head _______________) = _______________ gpm
Lateral design
Allowable pressure difference along lateral = 0.2 (sprinkler head operating pressure in lb/in2) = ___________________ lb/in2
Actual head loss (worst condition) ______________ lb/in2
Pressure required at mainline: P = (sprinkler head lb/in2 ___________) + (0.75) (Lateral friction lb/in2 __________) +/- ( ft elev) / (2) (2.31) = __________ lb/in2
(plus for uphill flow in lateral, minus for downhill flow). Use sprinkler head lb/in2 only if elevation difference along lateral is = or > 0.75 (lateral friction loss lb/in2)
(2.31). Under this condition, flow regulation may be required at some sprinkler heads to maintain proper sprinkler head operating near the mainline.
Page 2 of 5
Design Data — (Based on weighted crop ET, _____________ % irrigation efficiency)
Net, D(in)
Gross Fg(in)
Weighted 2
peak dailycrop ET (in)
Frequency, F(days)
Total gpm, Q gpm/ac
2 Use weighted peak monthly ET and net irrigation to determine weighted peak daily E T.
System requirementsApplication
453 A D
F H Eff/100Q = ___________ = _________________ gpm = ___________________ gpm
Q = system requirements–gpmH = Total operating hours/day(suggest using 23 hours for one move per day)(suggest using 22 hours for two moves per day)
number of lateral sites ___________
(irrigation frequency, _________ days) (moves/day, ______________ )
Part 652Irrigation Guide
Resource Planning and Evaluation
Tools and Worksheets
Chapter 15
15–17(210-vi-NEH, September 1997)
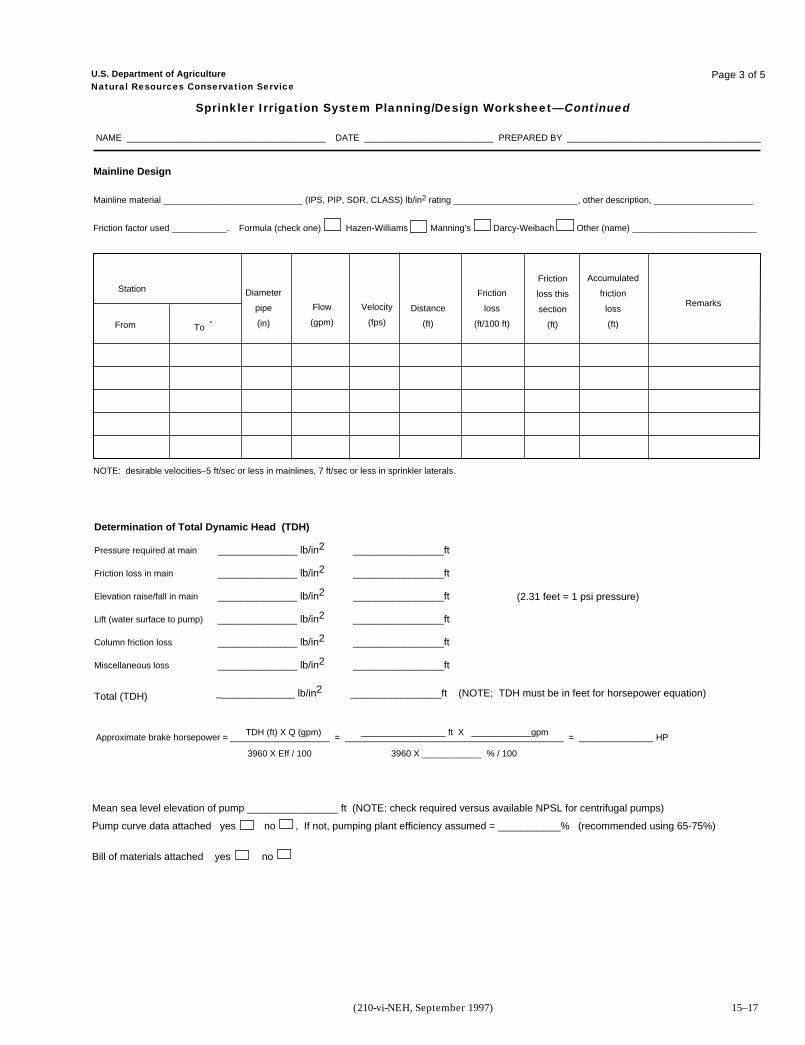
U.S. Department of AgricultureNatural Resources Conservation Service
Sprinkler Irrigation System Planning/Design Worksheet—Continued
NAME ________________________________________ DATE __________________________ PREPARED BY _______________________________________
Page 3 of 5
Determination of Total Dynamic Head (TDH)
Pressure required at main
Friction loss in main
Elevation raise/fall in main
Lift (water surface to pump)
Column friction loss
Miscellaneous loss
______________ lb/in2 ________________ft
______________ lb/in2 ________________ft
______________ lb/in2 ________________ft
______________ lb/in2 ________________ft
______________ lb/in2 ________________ft
______________ lb/in2 ________________ft
Total (TDH) ______________ lb/in2 ________________ft (NOTE; TDH must be in feet for horsepower equation)
TDH (ft) X Q (gpm) _________________ ft X ____________gpm
3960 X Eff / 100 3960 X ____________ % / 100
Approximate brake horsepower = ____________________ = ____________________________________________ = _______________ HP
Mainline Design
Mainline material ____________________________ (IPS, PIP, SDR, CLASS) lb/in2 rating _________________________, other description, ____________________
Friction factor used ___________. Formula (check one) Hazen-Williams Manning's Darcy-Weibach Other (name) _________________________
Station
From To
Diameter
pipe
(in)
Flow
(gpm)
Velocity
(fps)
Distance
(ft)
Friction
loss
(ft/100 ft)
Friction
loss this
section
(ft)
Accumulated
friction
loss
(ft)
NOTE: desirable velocities–5 ft/sec or less in mainlines, 7 ft/sec or less in sprinkler laterals.
Mean sea level elevation of pump ________________ ft (NOTE: check required versus available NPSL for centrifugal pumps)
Pump curve data attached yes no , If not, pumping plant efficiency assumed = ___________% (recommended using 65-75%)
Bill of materials attached yes no
Remarks
(2.31 feet = 1 psi pressure)
Part 652Irrigation Guide
Resource Planning and Evaluation
Tools and Worksheets
Chapter 15
15–18 (210-vi-NEH, September 1997)
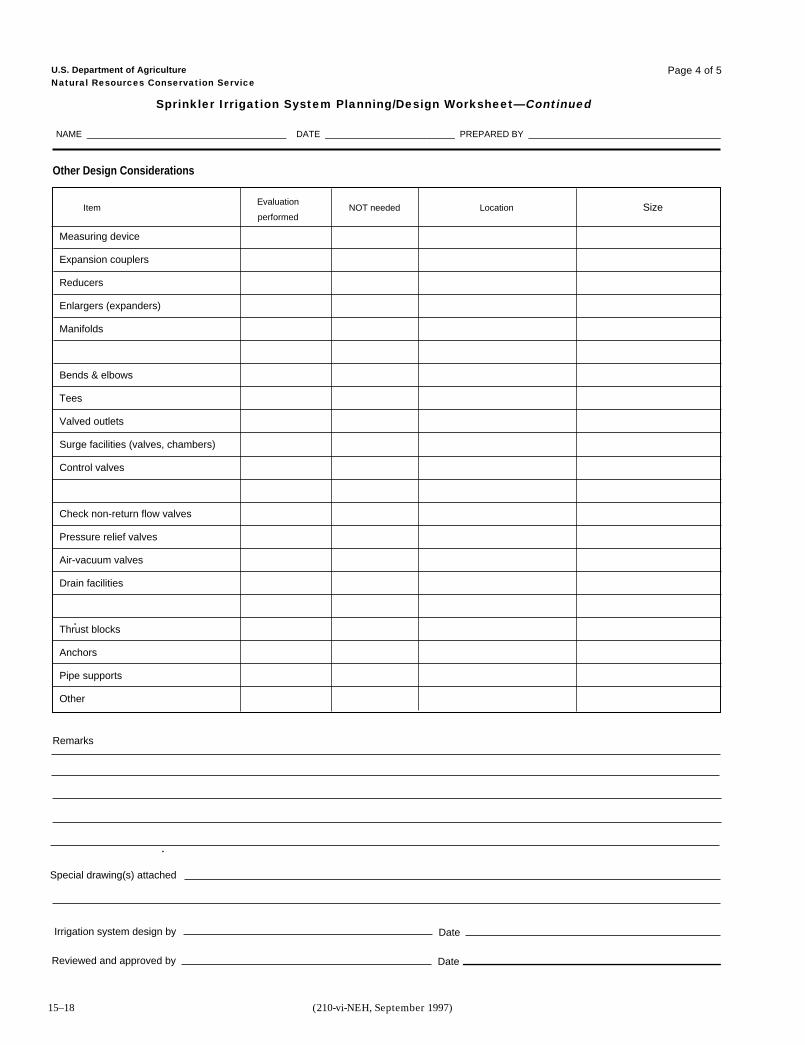
U.S. Department of AgricultureNatural Resources Conservation Service
Sprinkler Irrigation System Planning/Design Worksheet—Continued
NAME ________________________________________ DATE __________________________ PREPARED BY _______________________________________
Page 4 of 5
ItemEvaluation
performedNOT needed Location Size
Measuring device
Expansion couplers
Reducers
Enlargers (expanders)
Manifolds
Bends & elbows
Tees
Valved outlets
Surge facilities (valves, chambers)
Control valves
Check non-return flow valves
Pressure relief valves
Air-vacuum valves
Drain facilities
Thrust blocks
Anchors
Pipe supports
Other
Other Design Considerations
Remarks
Special drawing(s) attached
Irrigation system design by
Reviewed and approved by
Date
Date
Part 652Irrigation Guide
Resource Planning and Evaluation
Tools and Worksheets
Chapter 15
15–19(210-vi-NEH, September 1997)
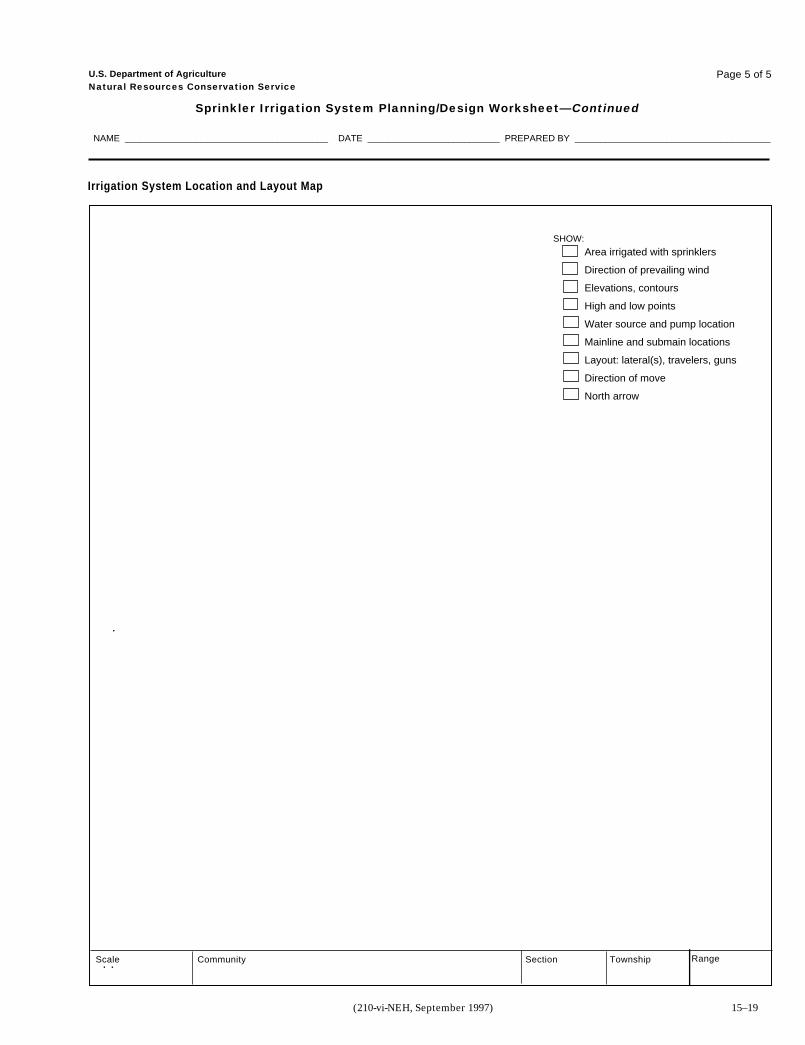
U.S. Department of AgricultureNatural Resources Conservation Service
Sprinkler Irrigation System Planning/Design Worksheet—Continued
NAME ________________________________________ DATE __________________________ PREPARED BY _______________________________________
Page 5 of 5
Irrigation System Location and Layout Map
Area irrigated with sprinklers
Direction of prevailing wind
Elevations, contours
High and low points
Water source and pump location
Mainline and submain locations
Layout: lateral(s), travelers, guns
Direction of move
North arrow
SHOW:
Scale Community Section Township Range

Part 652Irrigation Guide
Resource Planning and Evaluation
Tools and Worksheets
Chapter 15
15–20 (210-vi-NEH, September 1997)
Part 652Irrigation Guide
Resource Planning and Evaluation
Tools and Worksheets
Chapter 15
15–21(210-vi-NEH, September 1997)
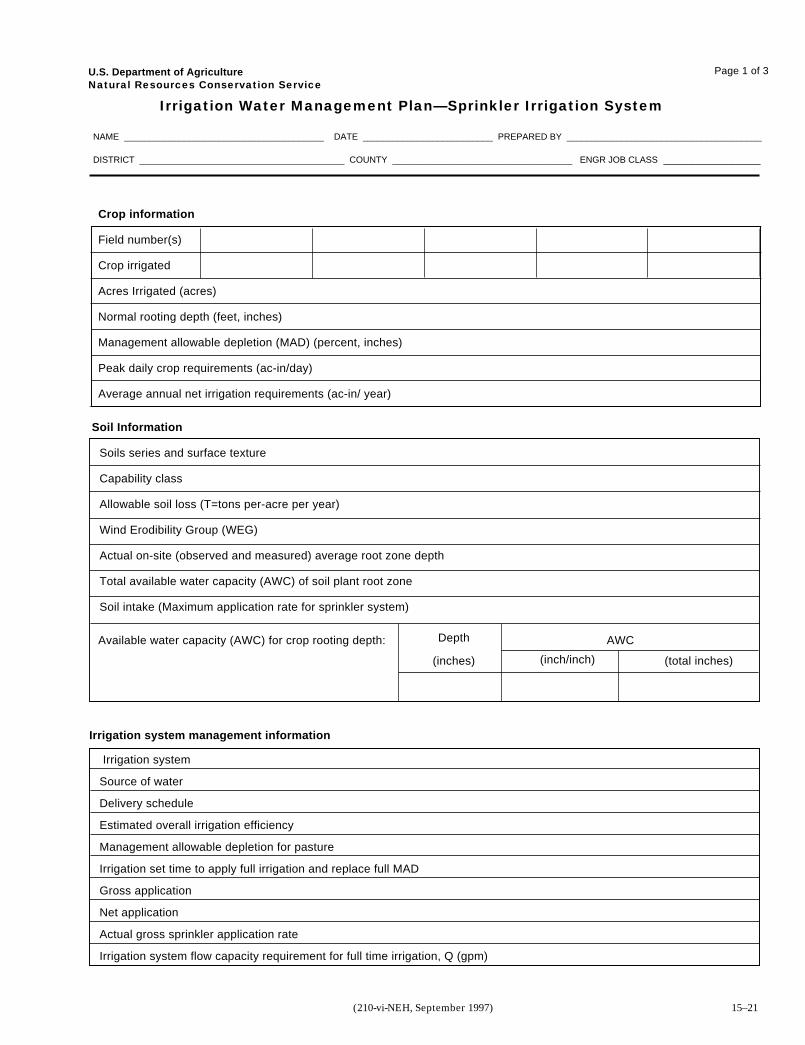
U.S. Department of AgricultureNatural Resources Conservation Service
Irrigation Water Management Plan—Sprinkler Irrigation System
NAME ________________________________________ DATE __________________________ PREPARED BY _______________________________________
DISTRICT _________________________________________ COUNTY ____________________________________ ENGR JOB CLASS _________________
Page 1 of 3
Irrigation system
Source of water
Delivery schedule
Estimated overall irrigation efficiency
Management allowable depletion for pasture
Irrigation set time to apply full irrigation and replace full MAD
Gross application
Net application
Actual gross sprinkler application rate
Irrigation system flow capacity requirement for full time irrigation, Q (gpm)
Soil Information
Depth
(inches)
AWC
(inch/inch) (total inches)
Irrigation system management information
Available water capacity (AWC) for crop rooting depth:
Soils series and surface texture
Capability class
Allowable soil loss (T=tons per-acre per year)
Wind Erodibility Group (WEG)
Actual on-site (observed and measured) average root zone depth
Total available water capacity (AWC) of soil plant root zone
Soil intake (Maximum application rate for sprinkler system)
Crop information
Field number(s)
Crop irrigated
Acres Irrigated (acres)
Normal rooting depth (feet, inches)
Management allowable depletion (MAD) (percent, inches)
Peak daily crop requirements (ac-in/day)
Average annual net irrigation requirements (ac-in/ year)
Part 652Irrigation Guide
Resource Planning and Evaluation
Tools and Worksheets
Chapter 15
15–22 (210-vi-NEH, September 1997)
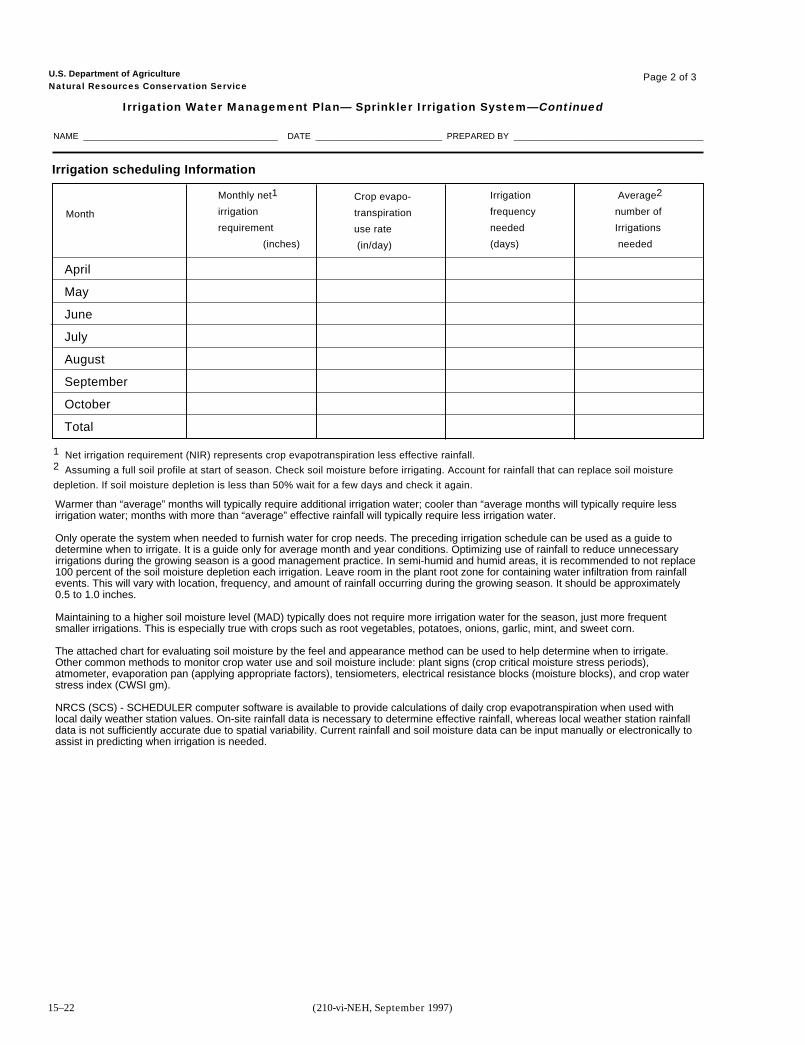
Warmer than “average” months will typically require additional irrigation water; cooler than “average months will typically require lessirrigation water; months with more than “average” effective rainfall will typically require less irrigation water.
Only operate the system when needed to furnish water for crop needs. The preceding irrigation schedule can be used as a guide todetermine when to irrigate. It is a guide only for average month and year conditions. Optimizing use of rainfall to reduce unnecessaryirrigations during the growing season is a good management practice. In semi-humid and humid areas, it is recommended to not replace100 percent of the soil moisture depletion each irrigation. Leave room in the plant root zone for containing water infiltration from rainfallevents. This will vary with location, frequency, and amount of rainfall occurring during the growing season. It should be approximately0.5 to 1.0 inches.
Maintaining to a higher soil moisture level (MAD) typically does not require more irrigation water for the season, just more frequentsmaller irrigations. This is especially true with crops such as root vegetables, potatoes, onions, garlic, mint, and sweet corn.
The attached chart for evaluating soil moisture by the feel and appearance method can be used to help determine when to irrigate.Other common methods to monitor crop water use and soil moisture include: plant signs (crop critical moisture stress periods),atmometer, evaporation pan (applying appropriate factors), tensiometers, electrical resistance blocks (moisture blocks), and crop waterstress index (CWSI gm).
NRCS (SCS) - SCHEDULER computer software is available to provide calculations of daily crop evapotranspiration when used withlocal daily weather station values. On-site rainfall data is necessary to determine effective rainfall, whereas local weather station rainfalldata is not sufficiently accurate due to spatial variability. Current rainfall and soil moisture data can be input manually or electronically toassist in predicting when irrigation is needed.
U.S. Department of AgricultureNatural Resources Conservation Service
Irrigation Water Management Plan— Sprinkler Irrigation System—Continued
NAME ________________________________________ DATE __________________________ PREPARED BY _______________________________________
Page 2 of 3
Irrigation scheduling Information
Month
Monthly net1
irrigation
requirement
(inches)
Crop evapo-
transpiration
use rate
(in/day)
Irrigation
frequency
needed
(days)
Average2
number of
Irrigations
needed
April
May
June
July
August
September
October
Total
1 Net irrigation requirement (NIR) represents crop evapotranspiration less effective rainfall.2 Assuming a full soil profile at start of season. Check soil moisture before irrigating. Account for rainfall that can replace soil moisture
depletion. If soil moisture depletion is less than 50% wait for a few days and check it again.
Part 652Irrigation Guide
Resource Planning and Evaluation
Tools and Worksheets
Chapter 15
15–23(210-vi-NEH, September 1997)
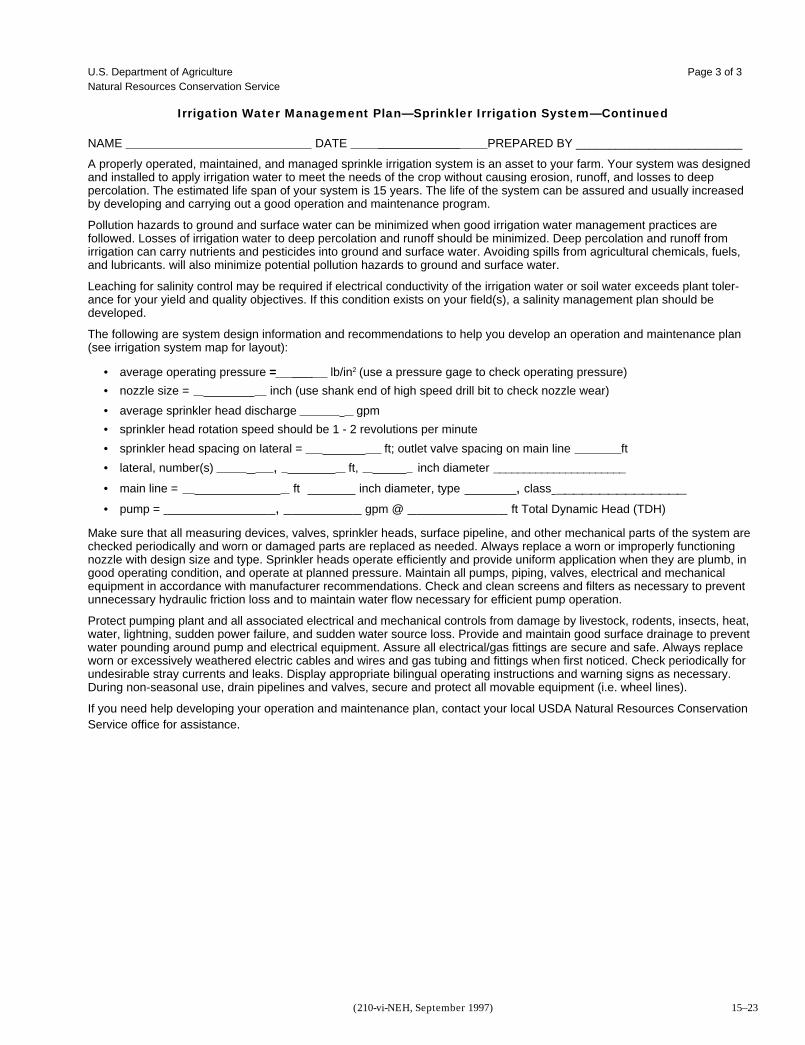
A properly operated, maintained, and managed sprinkle irrigation system is an asset to your farm. Your system was designedand installed to apply irrigation water to meet the needs of the crop without causing erosion, runoff, and losses to deeppercolation. The estimated life span of your system is 15 years. The life of the system can be assured and usually increasedby developing and carrying out a good operation and maintenance program.
Pollution hazards to ground and surface water can be minimized when good irrigation water management practices arefollowed. Losses of irrigation water to deep percolation and runoff should be minimized. Deep percolation and runoff fromirrigation can carry nutrients and pesticides into ground and surface water. Avoiding spills from agricultural chemicals, fuels,and lubricants. will also minimize potential pollution hazards to ground and surface water.
Leaching for salinity control may be required if electrical conductivity of the irrigation water or soil water exceeds plant toler-ance for your yield and quality objectives. If this condition exists on your field(s), a salinity management plan should bedeveloped.
The following are system design information and recommendations to help you develop an operation and maintenance plan(see irrigation system map for layout):
• average operating pressure = lb/in2 (use a pressure gage to check operating pressure)
• nozzle size = inch (use shank end of high speed drill bit to check nozzle wear)
• average sprinkler head discharge gpm
• sprinkler head rotation speed should be 1 - 2 revolutions per minute
• sprinkler head spacing on lateral = ft; outlet valve spacing on main line ft
• lateral, number(s) , ft, inch diameter ______________________
• main line = ft inch diameter, type , class _______________• pump = , gpm @ ft Total Dynamic Head (TDH)
Make sure that all measuring devices, valves, sprinkler heads, surface pipeline, and other mechanical parts of the system arechecked periodically and worn or damaged parts are replaced as needed. Always replace a worn or improperly functioningnozzle with design size and type. Sprinkler heads operate efficiently and provide uniform application when they are plumb, ingood operating condition, and operate at planned pressure. Maintain all pumps, piping, valves, electrical and mechanicalequipment in accordance with manufacturer recommendations. Check and clean screens and filters as necessary to preventunnecessary hydraulic friction loss and to maintain water flow necessary for efficient pump operation.
Protect pumping plant and all associated electrical and mechanical controls from damage by livestock, rodents, insects, heat,water, lightning, sudden power failure, and sudden water source loss. Provide and maintain good surface drainage to preventwater pounding around pump and electrical equipment. Assure all electrical/gas fittings are secure and safe. Always replaceworn or excessively weathered electric cables and wires and gas tubing and fittings when first noticed. Check periodically forundesirable stray currents and leaks. Display appropriate bilingual operating instructions and warning signs as necessary.During non-seasonal use, drain pipelines and valves, secure and protect all movable equipment (i.e. wheel lines).
If you need help developing your operation and maintenance plan, contact your local USDA Natural Resources ConservationService office for assistance.
U.S. Department of Agriculture Page 3 of 3Natural Resources Conservation Service
Irrigation Water Management Plan—Sprinkler Irrigation System—Continued
NAME DATE PREPARED BY _________________________

Part 652Irrigation Guide
Resource Planning and Evaluation
Tools and Worksheets
Chapter 15
15–24 (210-vi-NEH, September 1997)
Part 652Irrigation Guide
Resource Planning and Evaluation
Tools and Worksheets
Chapter 15
15–25(210-vi-NEH, September 1997)
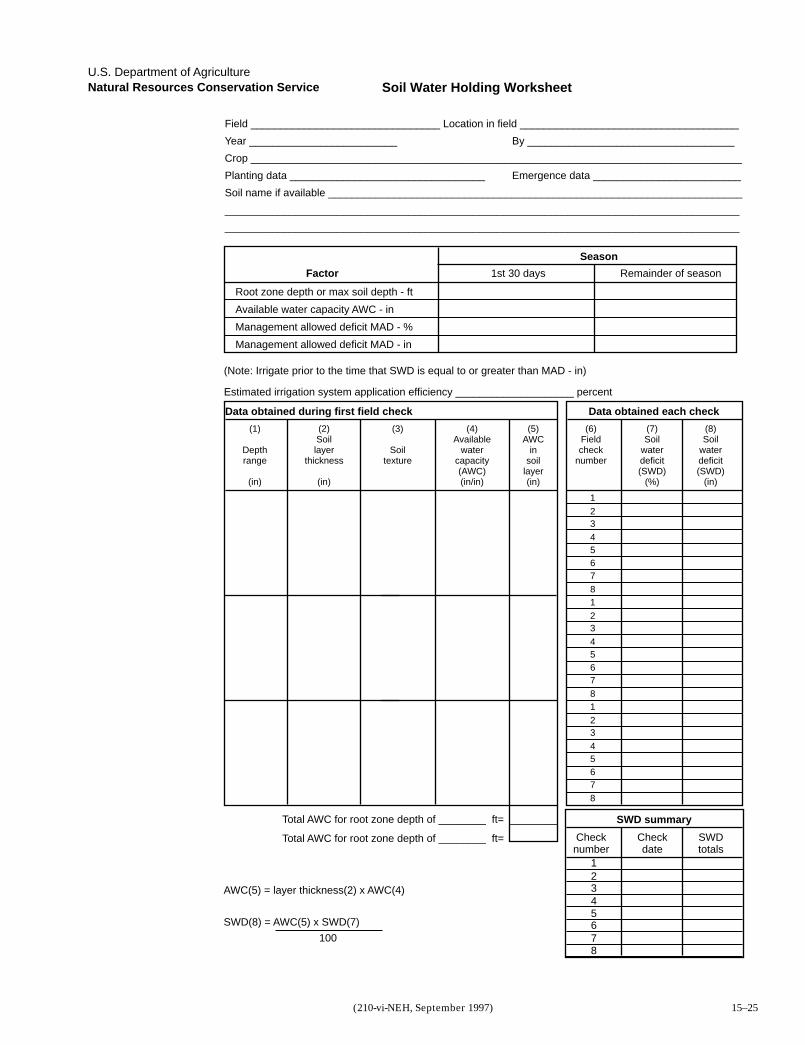
Field ________________________________ Location in field _____________________________________
Year _________________________ By ___________________________________
Crop ___________________________________________________________________________________
Planting data _________________________________ Emergence data _________________________
Soil name if available ______________________________________________________________________
_______________________________________________________________________________________
_______________________________________________________________________________________
Factor 1st 30 days Remainder of season
Season
Root zone depth or max soil depth - ft
Available water capacity AWC - in
Management allowed deficit MAD - %
Management allowed deficit MAD - in
(Note: Irrigate prior to the time that SWD is equal to or greater than MAD - in)
Estimated irrigation system application efficiency ____________________ percent
Total AWC for root zone depth of ________ ft= ________
Total AWC for root zone depth of ________ ft=
AWC(5) = layer thickness(2) x AWC(4)
SWD(8) = AWC(5) x SWD(7)
100
(6)Fieldcheck
number
(7)Soil
waterdeficit(SWD)
(%)
(8)Soil
waterdeficit(SWD)
(in)
(1)
Depthrange
(in)
(2)Soillayer
thickness
(in)
(3)
Soiltexture
(4)Available
watercapacity(AWC)(in/in)
(5)AWC
insoil
layer(in)
Data obtained during first field check Data obtained each check
1
23
456781
23
456781
23
45678
Checknumber
Checkdate
SWDtotals
SWD summary
12345678
U.S. Department of AgricultureNatural Resources Conservation Service Soil Water Holding Worksheet
Part 652
Irrigation Guide
Reso
urce P
lan
nin
g a
nd
Evalu
atio
n
To
ols
an
d W
ork
sh
eets
Ch
ap
ter 1
5
15–26(210-vi-N
EH
, September 1997)
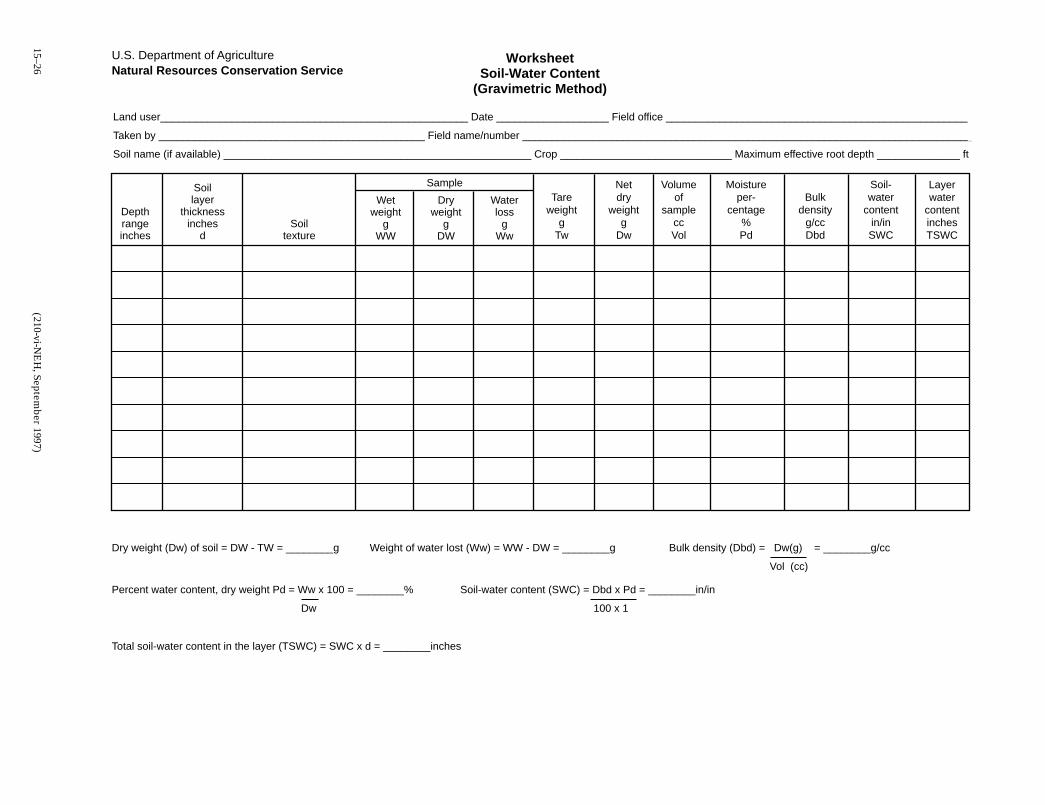
Land user____________________________________________________ Date ___________________ Field office ___________________________________________________
Taken by _____________________________________________ Field name/number ____________________________________________________________________________
Soil name (if available) ____________________________________________________ Crop _____________________________ Maximum effective root depth ______________ ft
Layerwater
contentinchesTSWC
Depthrangeinches
Soillayer
thicknessinches
dSoil
texture
Tareweight
gTw
Netdry
weightg
Dw
Volumeof
sampleccVol
Moistureper-
centage%Pd
Bulkdensity
g/ccDbd
Soil-water
contentin/inSWC
Sample
Dryweight
gDW
Wetweight
gWW
Waterloss
gWw
WorksheetSoil-Water Content
(Gravimetric Method)
U.S. Department of AgricultureNatural Resources Conservation Service
Dry weight (Dw) of soil = DW - TW = ________g Weight of water lost (Ww) = WW - DW = ________g Bulk density (Dbd) = Dw(g) = ________g/cc
Vol (cc)
Total soil-water content in the layer (TSWC) = SWC x d = ________inches
Percent water content, dry weight Pd = Ww x 100 = ________% Soil-water content (SWC) = Dbd x Pd = ________in/in
Dw 100 x 1
Part 652
Irrigation Guide
Reso
urce P
lan
nin
g a
nd
Evalu
atio
n
To
ols
an
d W
ork
sh
eets
Ch
ap
ter 1
5
15–27(210-vi-N
EH
, September 1997)
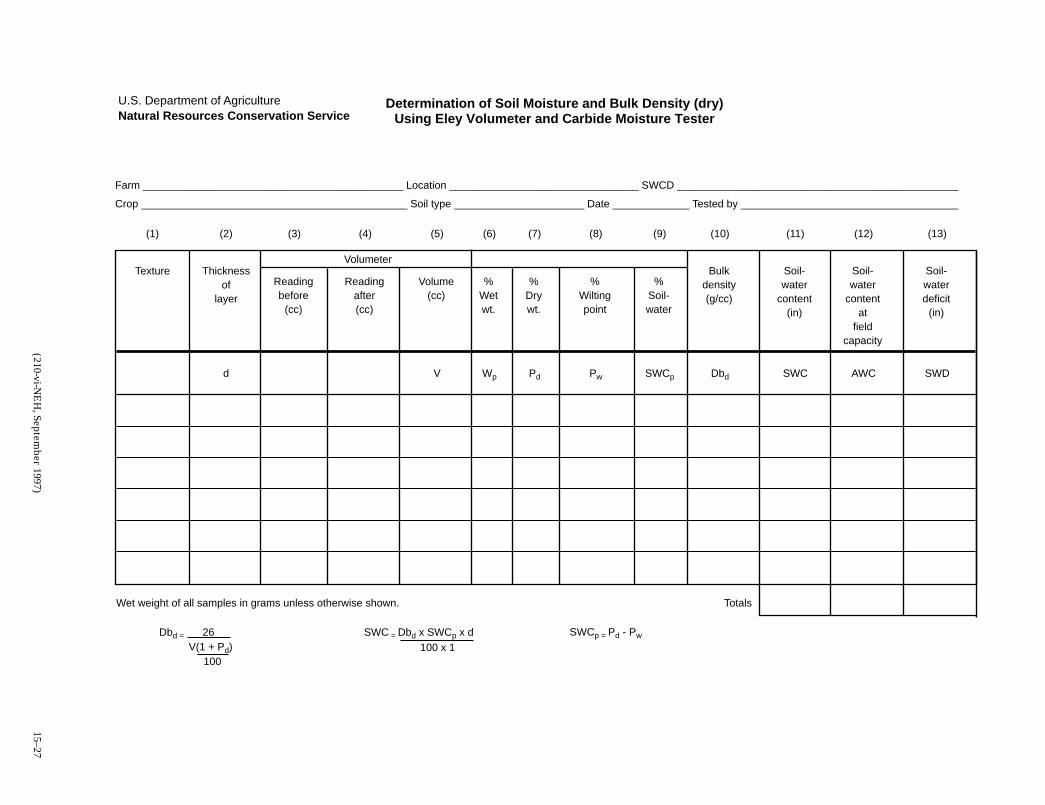
Farm ____________________________________________ Location ________________________________ SWCD ________________________________________________
Crop _____________________________________________ Soil type ______________________ Date _____________ Tested by _____________________________________
Determination of Soil Moisture and Bulk Density (dry)Using Eley Volumeter and Carbide Moisture Tester
U.S. Department of AgricultureNatural Resources Conservation Service
(1) (2) (3) (4) (5) (6) (7) (8) (9) (10) (11) (12) (13)
d V Wp Pd Pw SWCp Dbd
TotalsWet weight of all samples in grams unless otherwise shown.
SWC AWC SWD
Texture Thicknessof
layer
Readingbefore
(cc)
Readingafter(cc)
Volume(cc)
Volumeter
%Wetwt.
%Drywt.
%Wiltingpoint
%Soil-water
Bulkdensity(g/cc)
Soil-water
content(in)
Soil-water
contentat
fieldcapacity
Soil-waterdeficit
(in)
Dbd = 26 V(1 + Pd) 100
SWC = Dbd x SWCp x d 100 x 1
SWCp = Pd - Pw
Part 652Irrigation Guide
Resource Planning and Evaluation
Tools and Worksheets
Chapter 15
15–28 (210-vi-NEH, September 1997)
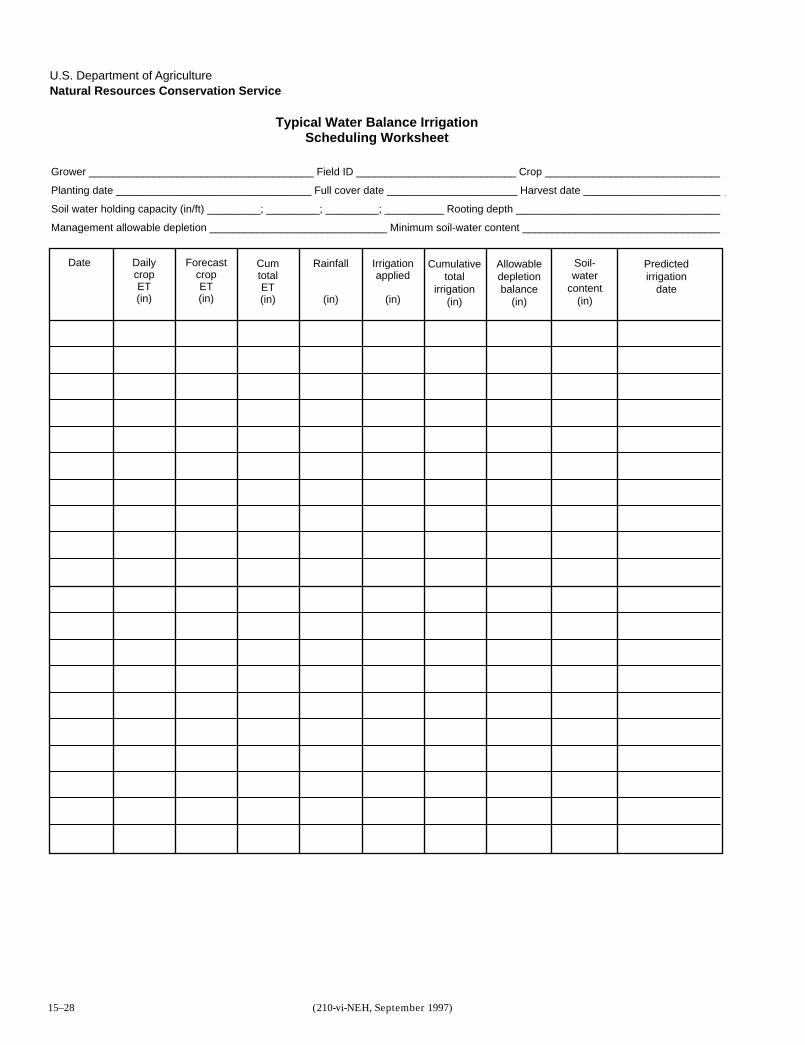
Grower ______________________________________ Field ID ___________________________ Crop ______________________________
Planting date _________________________________ Full cover date ______________________ Harvest date ________________________
Soil water holding capacity (in/ft) _________; _________; _________; __________ Rooting depth ___________________________________
Management allowable depletion ______________________________ Minimum soil-water content __________________________________
Date DailycropET(in)
ForecastcropET(in)
Cumulativetotal
irrigation(in)
Allowabledepletionbalance
(in)
Soil-water
content(in)
Predictedirrigation
date
Rainfall
(in)
CumtotalET(in)
Irrigationapplied
(in)
Typical Water Balance IrrigationScheduling Worksheet
U.S. Department of AgricultureNatural Resources Conservation Service
Part 652Irrigation Guide
Resource Planning and Evaluation
Tools and Worksheets
Chapter 15
15–29(210-vi-NEH, September 1997)
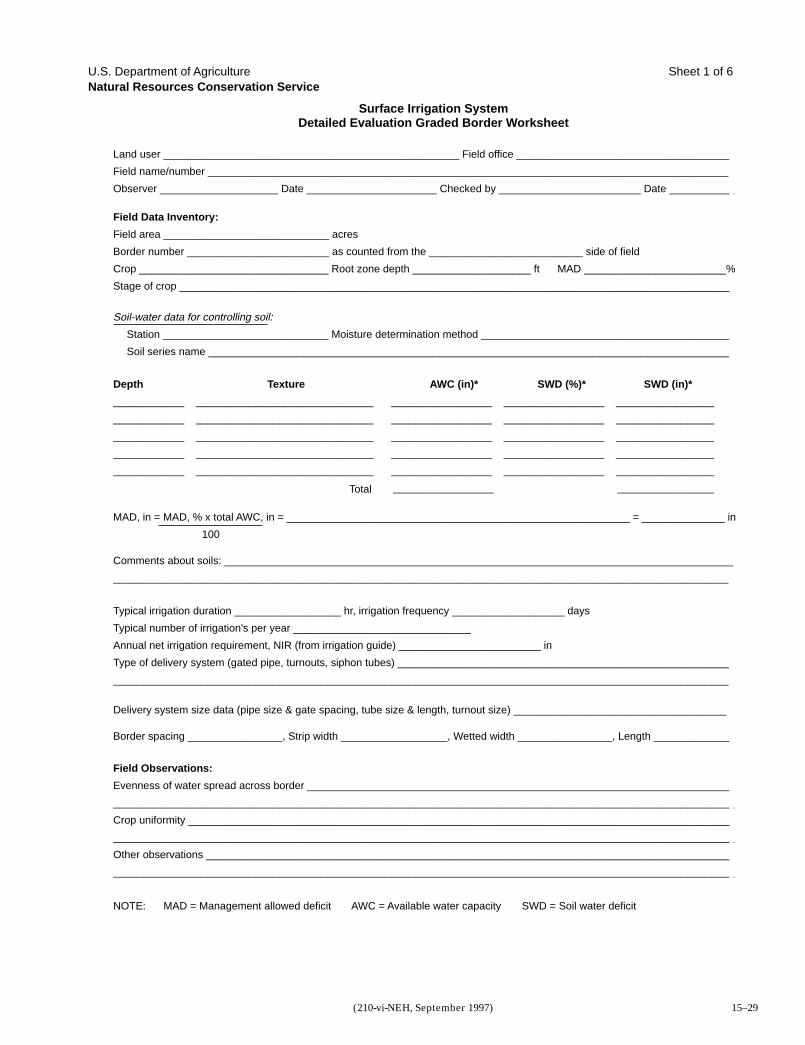
Land user __________________________________________________ Field office ____________________________________
Field name/number ________________________________________________________________________________________
Observer ____________________ Date ______________________ Checked by ________________________ Date ___________
MAD, in = MAD, % x total AWC, in = __________________________________________________________ = ______________ in
100
Comments about soils: ______________________________________________________________________________________
________________________________________________________________________________________________________
Typical irrigation duration __________________ hr, irrigation frequency ___________________ days
Typical number of irrigation's per year ______________________________
Annual net irrigation requirement, NIR (from irrigation guide) ________________________ in
Type of delivery system (gated pipe, turnouts, siphon tubes) ________________________________________________________
________________________________________________________________________________________________________
Delivery system size data (pipe size & gate spacing, tube size & length, turnout size) ____________________________________
Border spacing ________________, Strip width __________________, Wetted width ________________, Length _____________
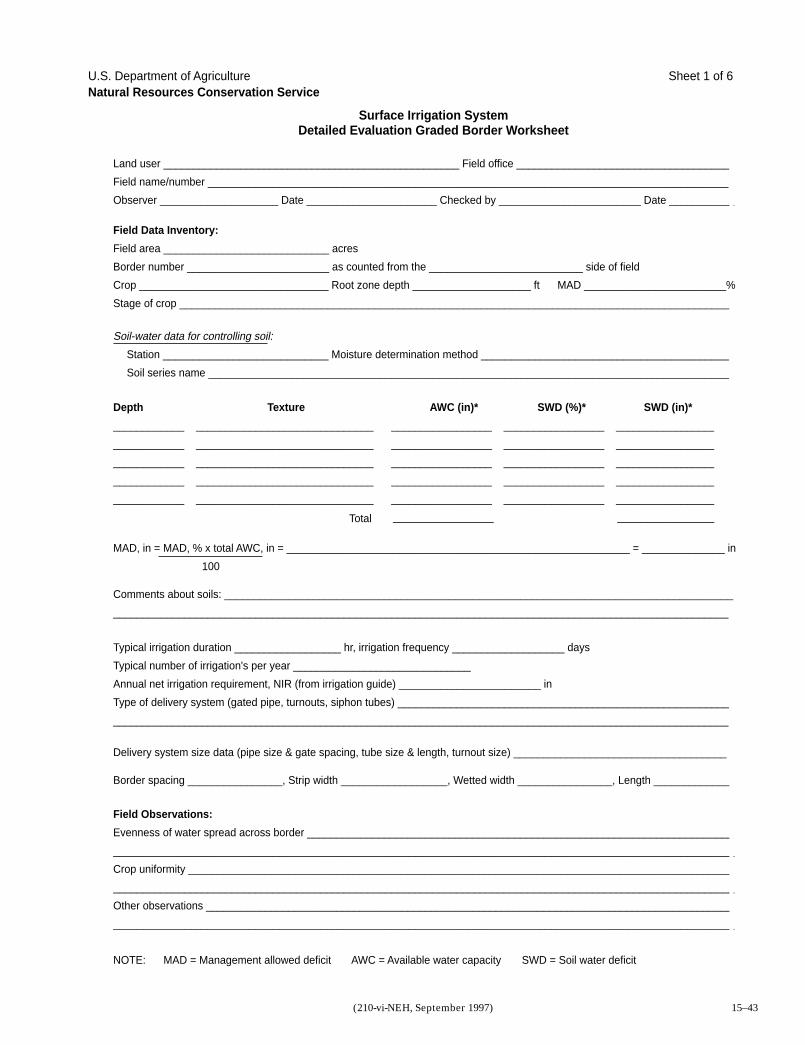
NOTE: MAD = Management allowed deficit AWC = Available water capacity SWD = Soil water deficit
Soil-water data for controlling soil:
Station ____________________________ Moisture determination method __________________________________________
Soil series name ________________________________________________________________________________________
Depth Texture AWC (in)* SWD (%)* SWD (in)*
____________ ______________________________ _________________ _________________ _________________
____________ ______________________________ _________________ _________________ _________________
____________ ______________________________ _________________ _________________ _________________
____________ ______________________________ _________________ _________________ _________________
____________ ______________________________ _________________ _________________ _________________
_________________ _________________
U.S. Department of AgricultureNatural Resources Conservation Service
Sheet 1 of 6
Field Data Inventory:
Field area ____________________________ acres
Border number ________________________ as counted from the __________________________ side of field
Crop ________________________________ Root zone depth ____________________ ft MAD ________________________%
Stage of crop _____________________________________________________________________________________________
Field Observations:
Evenness of water spread across border ________________________________________________________________________
_________________________________________________________________________________________________________
Crop uniformity ____________________________________________________________________________________________
_________________________________________________________________________________________________________
Other observations _________________________________________________________________________________________
_________________________________________________________________________________________________________
Total
Surface Irrigation SystemDetailed Evaluation Graded Border Worksheet
Part 652Irrigation Guide
Resource Planning and Evaluation
Tools and Worksheets
Chapter 15
15–30 (210-vi-NEH, September 1997)
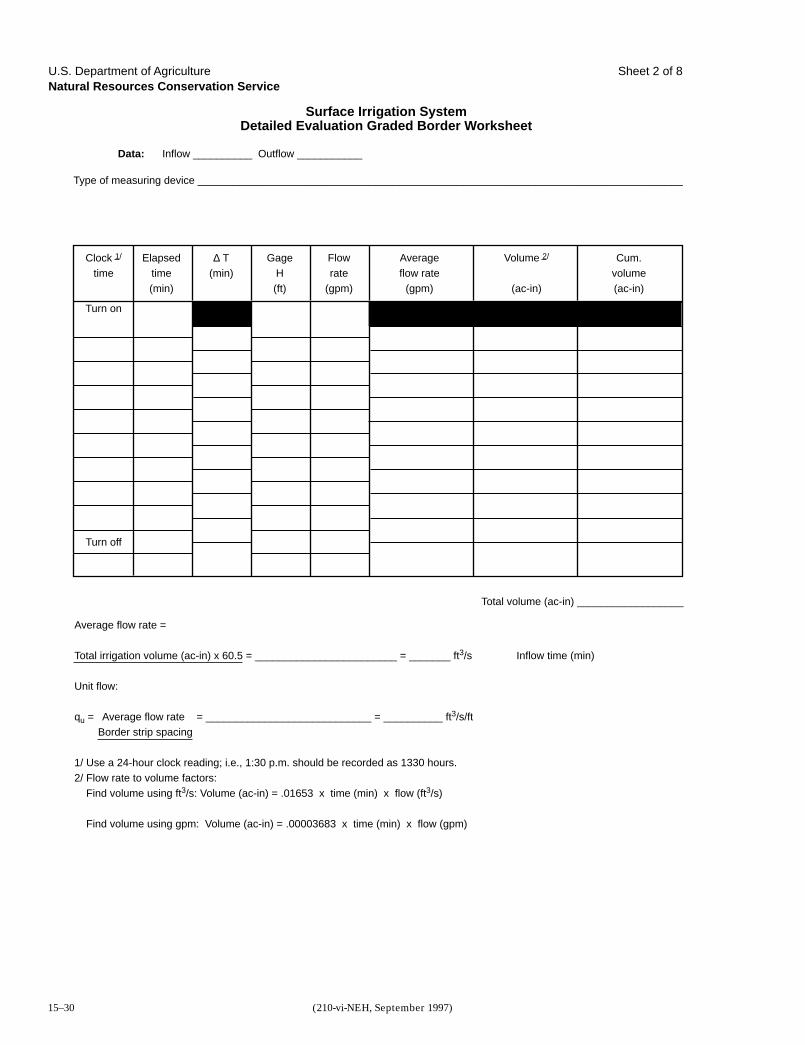
Data: Inflow __________ Outflow ___________
Type of measuring device __________________________________________________________________________________
Surface Irrigation SystemDetailed Evaluation Graded Border Worksheet
U.S. Department of AgricultureNatural Resources Conservation Service
Clock 1/
time
Turn on
Turn off
Average flow rate =
Total irrigation volume (ac-in) x 60.5 = ________________________ = _______ ft3/s Inflow time (min)
Unit flow:
qu = Average flow rate = ____________________________ = __________ ft3/s/ft Border strip spacing
1/ Use a 24-hour clock reading; i.e., 1:30 p.m. should be recorded as 1330 hours.2/ Flow rate to volume factors: Find volume using ft3/s: Volume (ac-in) = .01653 x time (min) x flow (ft3/s)
Find volume using gpm: Volume (ac-in) = .00003683 x time (min) x flow (gpm)
Total volume (ac-in) __________________
Elapsedtime(min)
∆ T(min)
GageH(ft)
Flowrate
(gpm)
Averageflow rate
(gpm)
Volume 2/
(ac-in)
Cum.volume(ac-in)
Sheet 2 of 8
Part 652Irrigation Guide
Resource Planning and Evaluation
Tools and Worksheets
Chapter 15
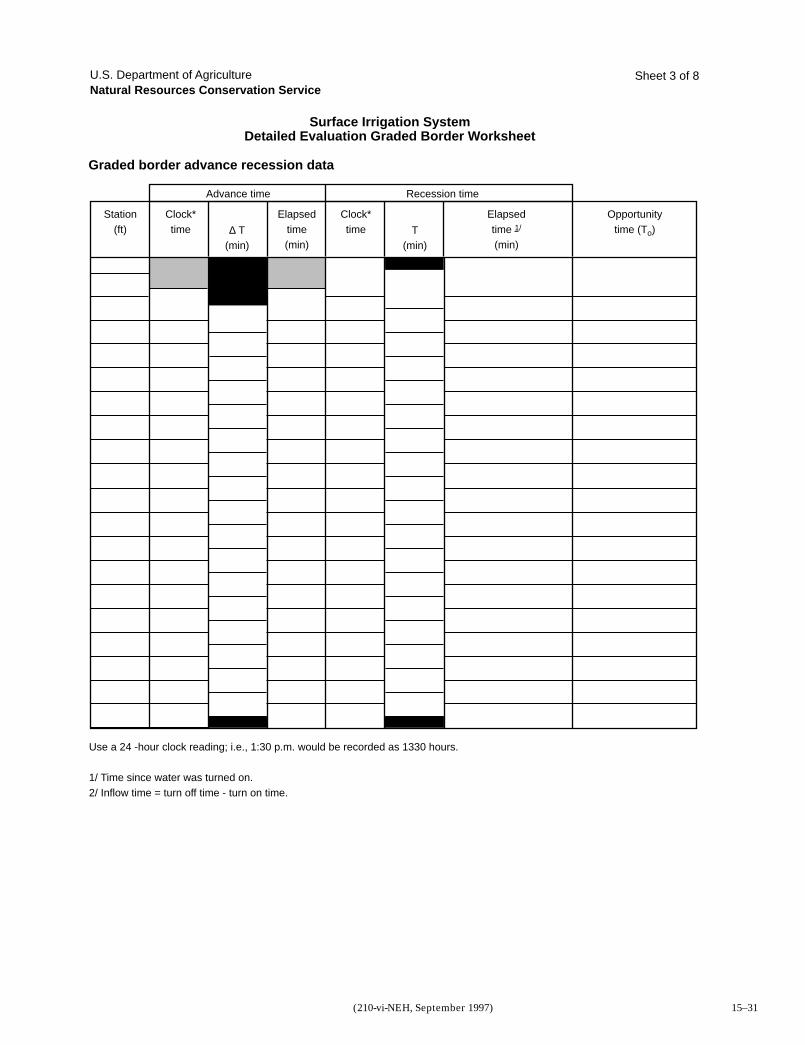
15–31(210-vi-NEH, September 1997)
Graded border advance recession data
Surface Irrigation SystemDetailed Evaluation Graded Border Worksheet
U.S. Department of AgricultureNatural Resources Conservation Service
Elapsedtime(min)
∆ T(min)
Station(ft)
Clock*time
Clock*time
Advance time Recession time
Opportunitytime (To)
Elapsedtime 1/
(min)T
(min)
Use a 24 -hour clock reading; i.e., 1:30 p.m. would be recorded as 1330 hours.
1/ Time since water was turned on.2/ Inflow time = turn off time - turn on time.
Sheet 3 of 8
Part 652Irrigation Guide
Resource Planning and Evaluation
Tools and Worksheets
Chapter 15
15–32 (210-vi-NEH, September 1997)
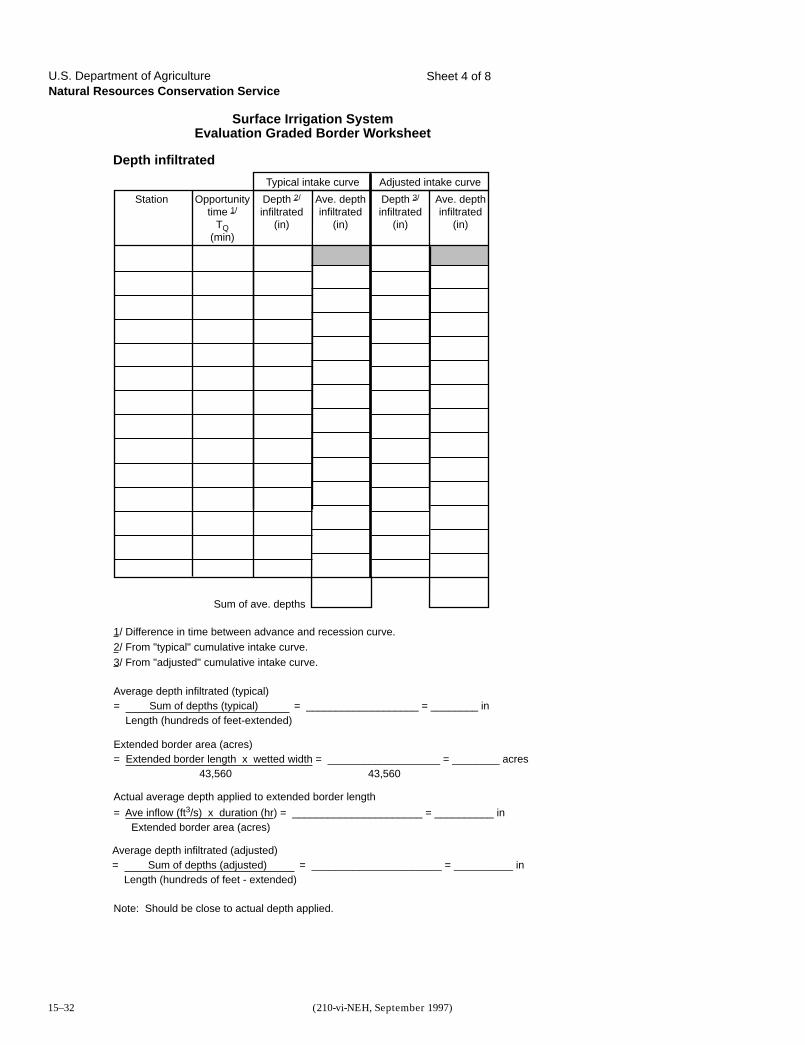
Depth infiltrated
Surface Irrigation SystemEvaluation Graded Border Worksheet
U.S. Department of AgricultureNatural Resources Conservation Service
Ave. depthinfiltrated
(in)
Ave. depthinfiltrated
(in)
Depth 2/
infiltrated(in)
Station Opportunitytime 1/
TQ(min)
Typical intake curve Adjusted intake curve
1/ Difference in time between advance and recession curve.2/ From "typical" cumulative intake curve.3/ From "adjusted" cumulative intake curve.
Note: Should be close to actual depth applied.
Average depth infiltrated (typical)= Sum of depths (typical) = ___________________ = ________ in Length (hundreds of feet-extended)
Sum of ave. depths
Depth 3/
infiltrated(in)
Actual average depth applied to extended border length
= Ave inflow (ft3/s) x duration (hr) = ______________________ = __________ in Extended border area (acres)
Average depth infiltrated (adjusted)= Sum of depths (adjusted) = ______________________ = __________ in Length (hundreds of feet - extended)
Extended border area (acres)= Extended border length x wetted width = ___________________ = ________ acres 43,560 43,560
Sheet 4 of 8
Part 652Irrigation Guide
Resource Planning and Evaluation
Tools and Worksheets
Chapter 15
15–33(210-vi-NEH, September 1997)
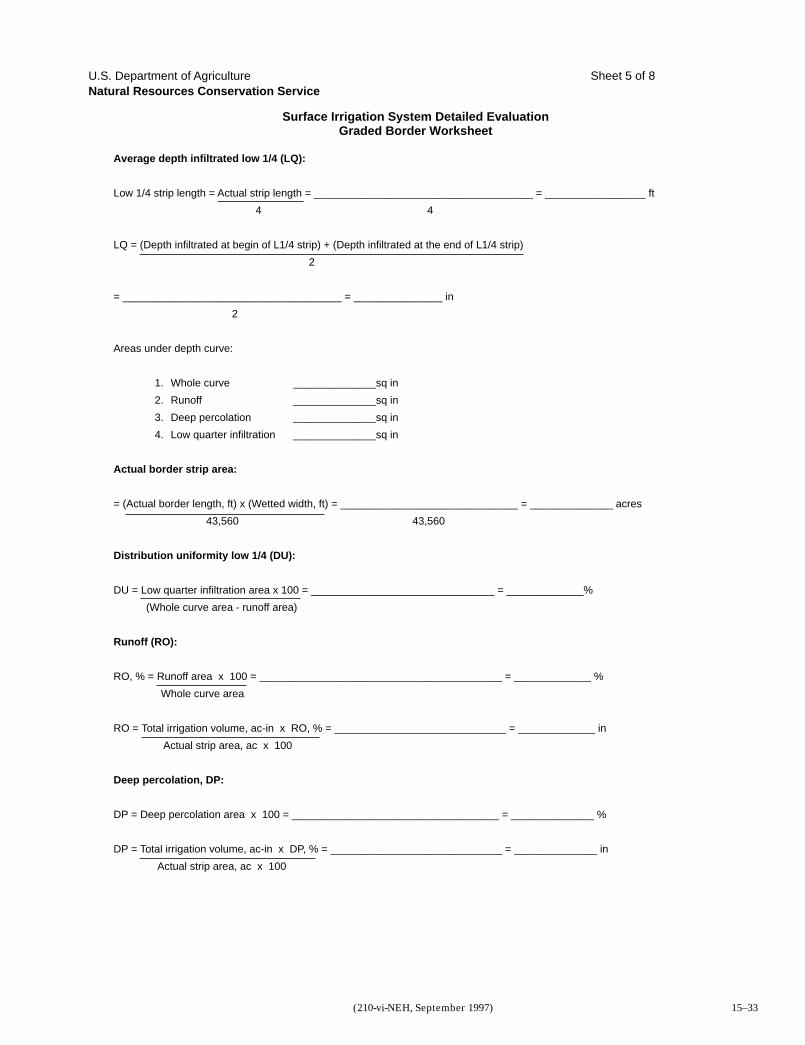
Average depth infiltrated low 1/4 (LQ):
Low 1/4 strip length = Actual strip length = _____________________________________ = _________________ ft
4 4
LQ = (Depth infiltrated at begin of L1/4 strip) + (Depth infiltrated at the end of L1/4 strip)
2
= _____________________________________ = _______________ in
2
Areas under depth curve:
1. Whole curve ______________sq in
2. Runoff ______________sq in
3. Deep percolation ______________sq in
4. Low quarter infiltration ______________sq in
Actual border strip area:
= (Actual border length, ft) x (Wetted width, ft) = ______________________________ = ______________ acres
43,560 43,560
Distribution uniformity low 1/4 (DU):
DU = Low quarter infiltration area x 100 = _______________________________ = _____________%
(Whole curve area - runoff area)
Runoff (RO):
RO, % = Runoff area x 100 = _________________________________________ = _____________ %
Whole curve area
RO = Total irrigation volume, ac-in x RO, % = _____________________________ = _____________ in
Actual strip area, ac x 100
Deep percolation, DP:
DP = Deep percolation area x 100 = ___________________________________ = ______________ %
DP = Total irrigation volume, ac-in x DP, % = _____________________________ = ______________ in
Actual strip area, ac x 100
Surface Irrigation System Detailed EvaluationGraded Border Worksheet
U.S. Department of AgricultureNatural Resources Conservation Service
Sheet 5 of 8
Part 652Irrigation Guide
Resource Planning and Evaluation
Tools and Worksheets
Chapter 15
15–34 (210-vi-NEH, September 1997)
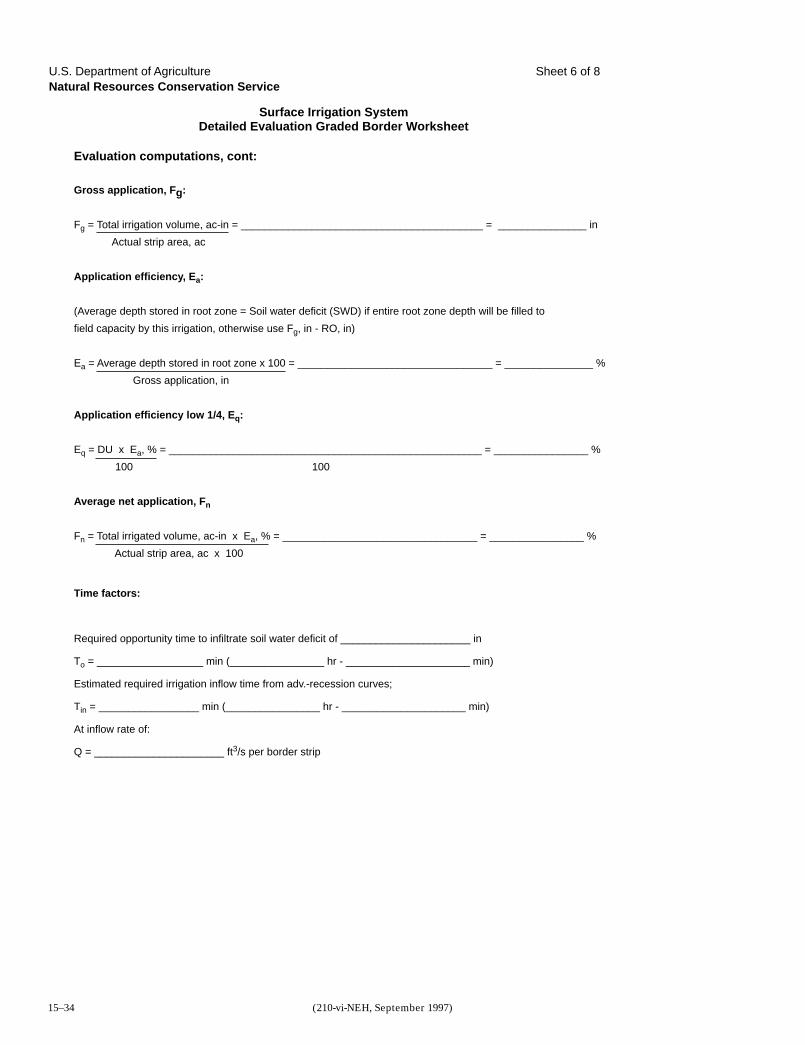
Gross application, Fg:
Fg = Total irrigation volume, ac-in = _________________________________________ = _______________ in
Actual strip area, ac
Application efficiency, Ea:
(Average depth stored in root zone = Soil water deficit (SWD) if entire root zone depth will be filled to
field capacity by this irrigation, otherwise use Fg, in - RO, in)
Ea = Average depth stored in root zone x 100 = _________________________________ = _______________ %
Gross application, in
Application efficiency low 1/4, Eq:
Eq = DU x Ea, % = _____________________________________________________ = ________________ %
100 100
Average net application, Fn
Fn = Total irrigated volume, ac-in x Ea, % = _________________________________ = ________________ %
Actual strip area, ac x 100
Time factors:
Required opportunity time to infiltrate soil water deficit of ______________________ in
To = __________________ min (________________ hr - _____________________ min)
Estimated required irrigation inflow time from adv.-recession curves;
Tin = _________________ min (________________ hr - _____________________ min)
At inflow rate of:
Q = ______________________ ft3/s per border strip
Evaluation computations, cont:
Surface Irrigation SystemDetailed Evaluation Graded Border Worksheet
U.S. Department of AgricultureNatural Resources Conservation Service
Sheet 6 of 8
Part 652Irrigation Guide
Resource Planning and Evaluation
Tools and Worksheets
Chapter 15
15–35(210-vi-NEH, September 1997)
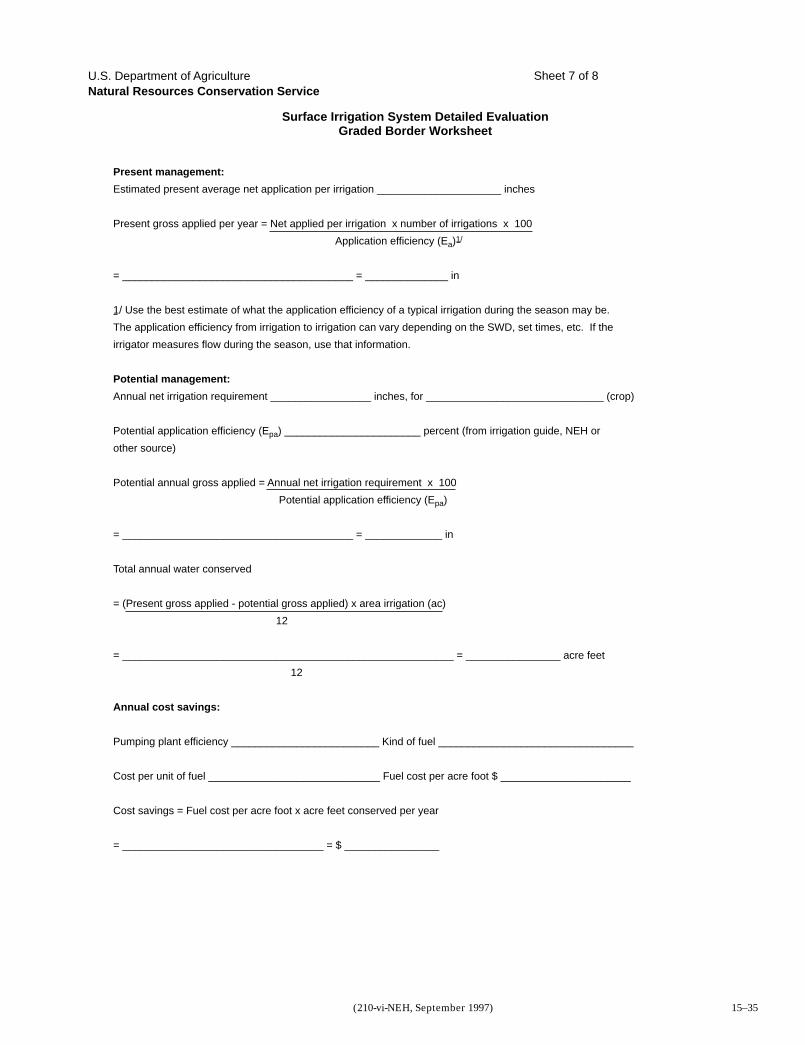
Present management:
Estimated present average net application per irrigation _____________________ inches
Present gross applied per year = Net applied per irrigation x number of irrigations x 100
Application efficiency (Ea)1/
= _______________________________________ = ______________ in
1/ Use the best estimate of what the application efficiency of a typical irrigation during the season may be.
The application efficiency from irrigation to irrigation can vary depending on the SWD, set times, etc. If the
irrigator measures flow during the season, use that information.
Potential management:
Annual net irrigation requirement _________________ inches, for ______________________________ (crop)
Potential application efficiency (Epa) _______________________ percent (from irrigation guide, NEH or
other source)
Potential annual gross applied = Annual net irrigation requirement x 100
Potential application efficiency (Epa)
= _______________________________________ = _____________ in
Total annual water conserved
= (Present gross applied - potential gross applied) x area irrigation (ac)
12
= ________________________________________________________ = ________________ acre feet
12
Annual cost savings:
Pumping plant efficiency _________________________ Kind of fuel _________________________________
Cost per unit of fuel _____________________________ Fuel cost per acre foot $ ______________________
Cost savings = Fuel cost per acre foot x acre feet conserved per year
= __________________________________ = $ ________________
Surface Irrigation System Detailed EvaluationGraded Border Worksheet
U.S. Department of AgricultureNatural Resources Conservation Service
Sheet 7 of 8
Part 652Irrigation Guide
Resource Planning and Evaluation
Tools and Worksheets
Chapter 15
15–36 (210-vi-NEH, September 1997)
Potential water and cost savings, cont.
Water purchase cost
= Cost per acre foot x acre feet saved per year = ____________________________
= $ _______________________
Cost savings = pumping cost + water cost = __________________________________ = $ _______________________
Recommendations
________________________________________________________________________________________________
________________________________________________________________________________________________
________________________________________________________________________________________________
________________________________________________________________________________________________
________________________________________________________________________________________________
________________________________________________________________________________________________
________________________________________________________________________________________________
________________________________________________________________________________________________
________________________________________________________________________________________________
________________________________________________________________________________________________
________________________________________________________________________________________________
________________________________________________________________________________________________
________________________________________________________________________________________________
________________________________________________________________________________________________
________________________________________________________________________________________________
Surface Irrigation SystemDetailed Evaluation Graded Border Worksheet
U.S. Department of AgricultureNatural Resources Conservation Service
Sheet 8 of 8
Part 652Irrigation Guide
Resource Planning and Evaluation
Tools and Worksheets
Chapter 15
15–37(210-vi-NEH, September 1997)
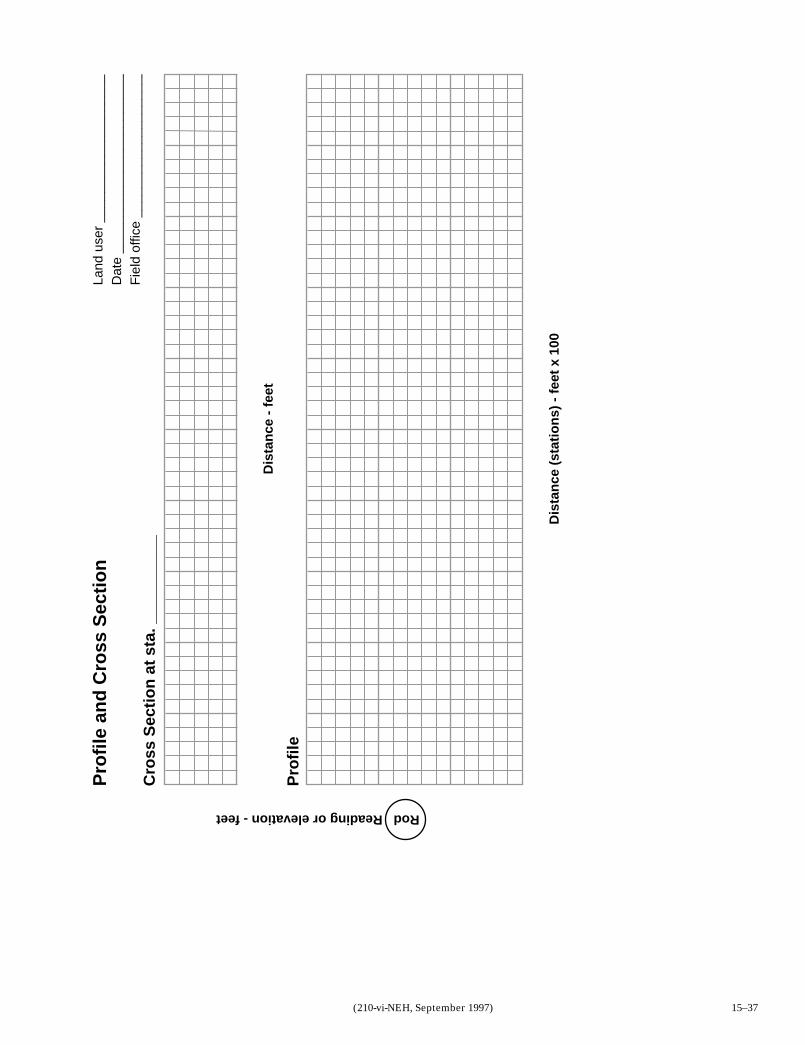
Pro
file
an
d C
ross
Sec
tio
n
Cro
ss S
ecti
on
at
sta.
___
____
___
Pro
file
Dis
tan
ce -
fee
t
Dis
tan
ce (
stat
ion
s) -
fee
t x
100
Rod Reading or elevation - feet
Land
use
r __
____
____
____
____
__D
ate
____
____
____
____
____
____
_F
ield
offi
ce _
____
____
____
____
___
Part 652Irrigation Guide
Resource Planning and Evaluation
Tools and Worksheets
Chapter 15
15–38 (210-vi-NEH, September 1997)
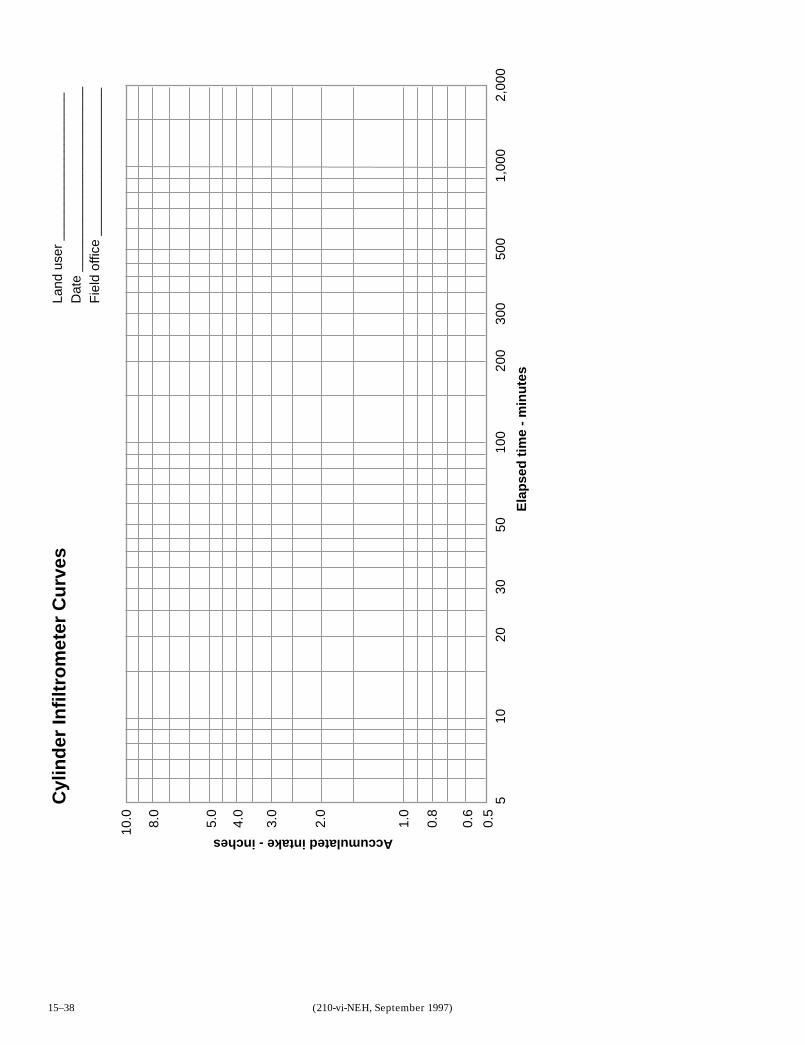
Cyl
ind
er In
filt
rom
eter
Cu
rves
Ela
pse
d t
ime
- m
inu
tes
Accumulated intake - inches
Land
use
r __
____
____
____
____
__D
ate
____
____
____
____
____
____
_F
ield
offi
ce _
____
____
____
____
___
10.0 8.0
5.0
4.0
3.0
2.0
1.0
0.8
0.6
0.5
510
2030
5010
020
030
050
01,
000
2,00
0
Part 652
Irrigation Guide
Reso
urce P
lan
nin
g a
nd
Evalu
atio
n
To
ols
an
d W
ork
sh
eets
Ch
ap
ter 1
5
15–39(210-vi-N
EH
, September 1997)
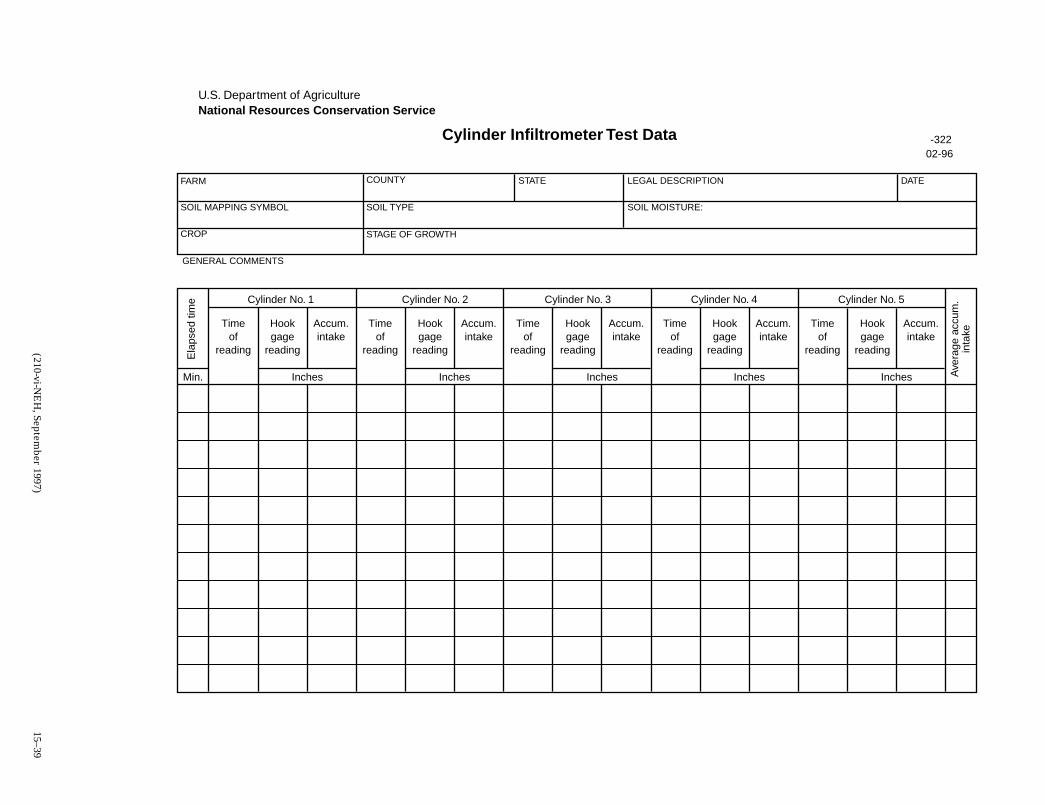
Cylinder Infiltrometer Test Data
U.S. Department of AgricultureNational Resources Conservation Service
FARM
SOIL MAPPING SYMBOL
CROP
GENERAL COMMENTS
COUNTY STATE
SOIL TYPE
LEGAL DESCRIPTION DATE
-32202-96
SOIL MOISTURE:
STAGE OF GROWTH
Cylinder No. 1 Cylinder No. 2 Cylinder No. 3 Cylinder No. 4 Cylinder No. 5
InchesMin. Inches Inches Inches Inches
Ela
psed
tim
e
Ave
rage
acc
um.
inta
ke
Timeof
reading
Timeof
reading
Hookgage
reading
Accum.intake
Hookgage
reading
Accum.intake
Timeof
reading
Hookgage
reading
Accum.intake
Timeof
reading
Hookgage
reading
Accum.intake
Timeof
reading
Hookgage
reading
Accum.intake
Part 652Irrigation Guide
Resource Planning and Evaluation
Tools and Worksheets
Chapter 15
15–40 (210-vi-NEH, September 1997)
Ad
van
ce a
nd
rec
essi
on
cu
rves
Dis
tan
ce (
stat
ion
s) -
fee
t x
100
Elapsed time - minutes
12
0050100
150
200
250
34
68
105
79
Land
use
r __
____
____
____
____
__D
ate
____
____
____
____
____
____
Fie
ld o
ffice
___
____
____
____
____
Part 652Irrigation Guide
Resource Planning and Evaluation
Tools and Worksheets
Chapter 15
15–41(210-vi-NEH, September 1997)
Cyl
ind
er in
filt
rom
eter
Cu
rves
Ela
pse
d t
ime
- m
inu
tes
Accumulated intake - inches
Land
use
r __
____
____
____
____
__D
ate
____
____
____
____
____
____
_F
ield
offi
ce _
____
____
____
____
___
10.0 8.0
5.0
4.0
3.0
2.0
1.0
0.8
0.6
0.5
510
2030
5010
020
030
050
01,
000
2,00
0
Part 652Irrigation Guide
Resource Planning and Evaluation
Tools and Worksheets
Chapter 15
15–42 (210-vi-NEH, September 1997)
Dep
th in
filt
rate
d c
urv
e
Dis
tan
ce (
stat
ion
s) -
fee
t x
100
Depth infiltrated - inches
12
0654321
34
68
105
79
Land
use
r __
____
____
____
____
__D
ate
____
____
____
____
____
____
Fie
ld o
ffice
___
____
____
____
____
Part 652Irrigation Guide
Resource Planning and Evaluation
Tools and Worksheets
Chapter 15
15–43(210-vi-NEH, September 1997)
Land user __________________________________________________ Field office ____________________________________
Field name/number ________________________________________________________________________________________
Observer ____________________ Date ______________________ Checked by ________________________ Date ___________
MAD, in = MAD, % x total AWC, in = __________________________________________________________ = ______________ in
100
Comments about soils: ______________________________________________________________________________________
________________________________________________________________________________________________________
Typical irrigation duration __________________ hr, irrigation frequency ___________________ days
Typical number of irrigation's per year ______________________________
Annual net irrigation requirement, NIR (from irrigation guide) ________________________ in
Type of delivery system (gated pipe, turnouts, siphon tubes) ________________________________________________________
________________________________________________________________________________________________________
Delivery system size data (pipe size & gate spacing, tube size & length, turnout size) ____________________________________
Border spacing ________________, Strip width __________________, Wetted width ________________, Length _____________
NOTE: MAD = Management allowed deficit AWC = Available water capacity SWD = Soil water deficit
Soil-water data for controlling soil:
Station ____________________________ Moisture determination method __________________________________________
Soil series name ________________________________________________________________________________________
Depth Texture AWC (in)* SWD (%)* SWD (in)*
____________ ______________________________ _________________ _________________ _________________
____________ ______________________________ _________________ _________________ _________________
____________ ______________________________ _________________ _________________ _________________
____________ ______________________________ _________________ _________________ _________________
____________ ______________________________ _________________ _________________ _________________
_________________ _________________
U.S. Department of AgricultureNatural Resources Conservation Service
Sheet 1 of 6
Field Data Inventory:
Field area ____________________________ acres
Border number ________________________ as counted from the __________________________ side of field
Crop ________________________________ Root zone depth ____________________ ft MAD ________________________%
Stage of crop _____________________________________________________________________________________________
Field Observations:
Evenness of water spread across border ________________________________________________________________________
_________________________________________________________________________________________________________
Crop uniformity ____________________________________________________________________________________________
_________________________________________________________________________________________________________
Other observations _________________________________________________________________________________________
_________________________________________________________________________________________________________
Total
Surface Irrigation SystemDetailed Evaluation Graded Border Worksheet
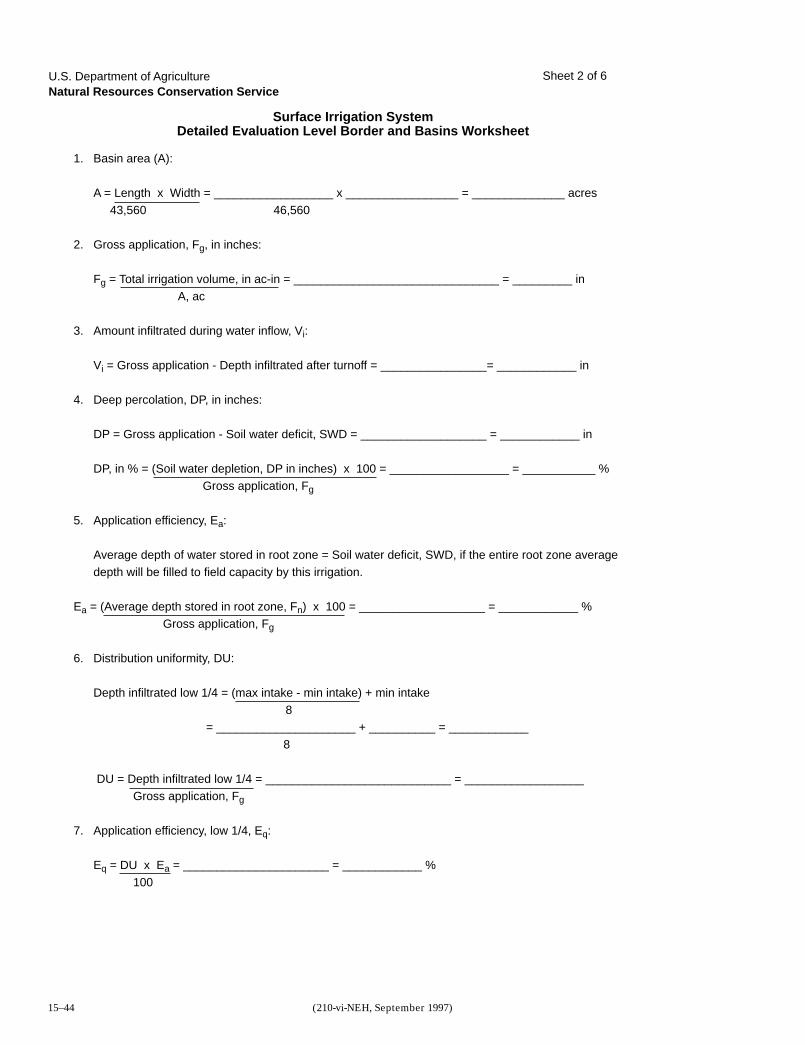
Part 652Irrigation Guide
Resource Planning and Evaluation
Tools and Worksheets
Chapter 15
15–44 (210-vi-NEH, September 1997)
1. Basin area (A):
A = Length x Width = __________________ x _________________ = ______________ acres 43,560 46,560
2. Gross application, Fg, in inches:
Fg = Total irrigation volume, in ac-in = _______________________________ = _________ in A, ac
3. Amount infiltrated during water inflow, Vi:
Vi = Gross application - Depth infiltrated after turnoff = ________________= ____________ in
4. Deep percolation, DP, in inches:
DP = Gross application - Soil water deficit, SWD = ___________________ = ____________ in
DP, in % = (Soil water depletion, DP in inches) x 100 = __________________ = ___________ % Gross application, Fg
5. Application efficiency, Ea:
Average depth of water stored in root zone = Soil water deficit, SWD, if the entire root zone averagedepth will be filled to field capacity by this irrigation.
Ea = (Average depth stored in root zone, Fn) x 100 = ___________________ = ____________ % Gross application, Fg
6. Distribution uniformity, DU:
Depth infiltrated low 1/4 = (max intake - min intake) + min intake 8= _____________________ + __________ = ____________
8
DU = Depth infiltrated low 1/4 = ____________________________ = __________________ Gross application, Fg
7. Application efficiency, low 1/4, Eq:
Eq = DU x Ea = ______________________ = ____________ % 100
Surface Irrigation SystemDetailed Evaluation Level Border and Basins Worksheet
U.S. Department of AgricultureNatural Resources Conservation Service
Sheet 2 of 6
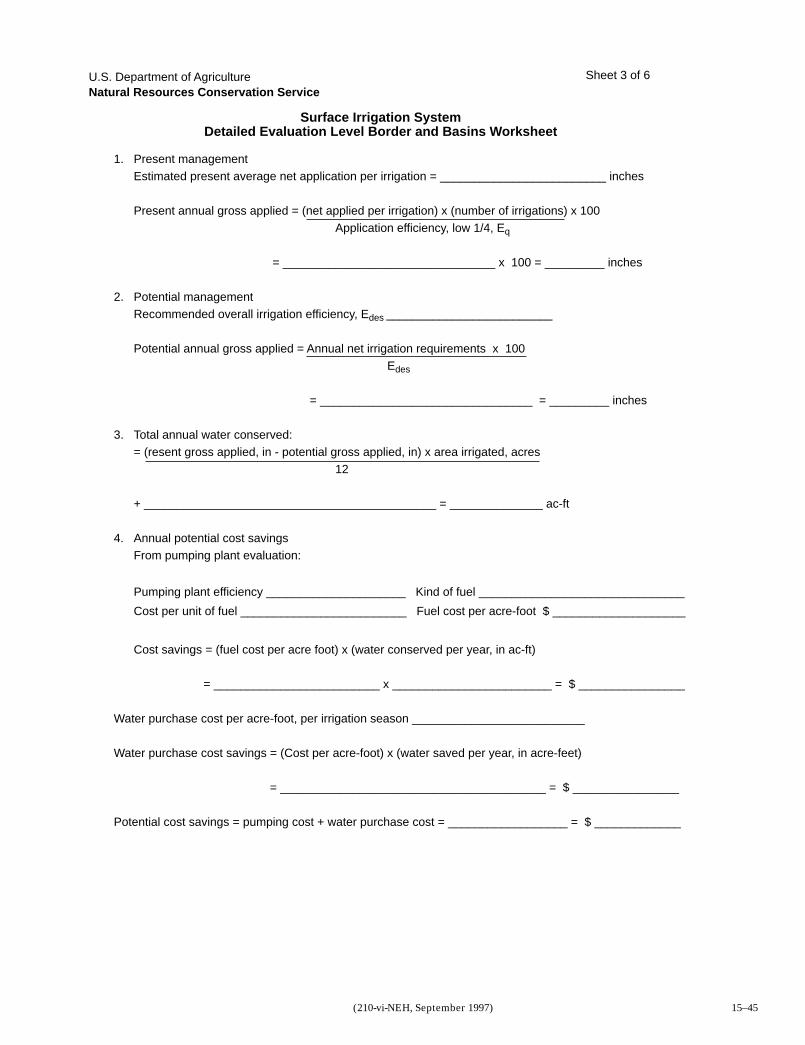
Part 652Irrigation Guide
Resource Planning and Evaluation
Tools and Worksheets
Chapter 15
15–45(210-vi-NEH, September 1997)
1. Present managementEstimated present average net application per irrigation = _________________________ inches
Present annual gross applied = (net applied per irrigation) x (number of irrigations) x 100Application efficiency, low 1/4, Eq
= ________________________________ x 100 = _________ inches
2. Potential managementRecommended overall irrigation efficiency, Edes _________________________
Potential annual gross applied = Annual net irrigation requirements x 100 Edes
= ________________________________ = _________ inches
3. Total annual water conserved:= (resent gross applied, in - potential gross applied, in) x area irrigated, acres
12
+ ____________________________________________ = ______________ ac-ft
4. Annual potential cost savingsFrom pumping plant evaluation:
Pumping plant efficiency _____________________ Kind of fuel _______________________________
Cost per unit of fuel _________________________ Fuel cost per acre-foot $ ____________________
Cost savings = (fuel cost per acre foot) x (water conserved per year, in ac-ft)
= _________________________ x ________________________ = $ ________________
Water purchase cost per acre-foot, per irrigation season __________________________
Water purchase cost savings = (Cost per acre-foot) x (water saved per year, in acre-feet)
= ________________________________________ = $ ________________
Potential cost savings = pumping cost + water purchase cost = __________________ = $ _____________
Surface Irrigation SystemDetailed Evaluation Level Border and Basins Worksheet
U.S. Department of AgricultureNatural Resources Conservation Service
Sheet 3 of 6
Part 652Irrigation Guide
Resource Planning and Evaluation
Tools and Worksheets
Chapter 15
15–46 (210-vi-NEH, September 1997)
Recommendations:________________________________________________________________________________________________________________________________________________________________________________________________________________________________________________________________________________________________________________________________________________________________________________________________________________________________________________________________________________________________________________________________________________________________________________________________________________________________________________________________________________________________________________________________________________________________________________________________________________________________________________________________________________________________________________________________________________________________________________________________________________________________________________________________________________________________________________________________________________________________________________________________________________________________________________________________________________________________________________________________________________________________________________________________________________________________________________________________________________________________________________________________________________________________________________________________________________________________________________________________________________________________________________________________________________________________________________________________________________________________________________________________________________________________________________
Surface Irrigation SystemDetailed Evaluation Level Border and Basins Worksheet
U.S. Department of AgricultureNatural Resources Conservation Service
Sheet 4 of 6
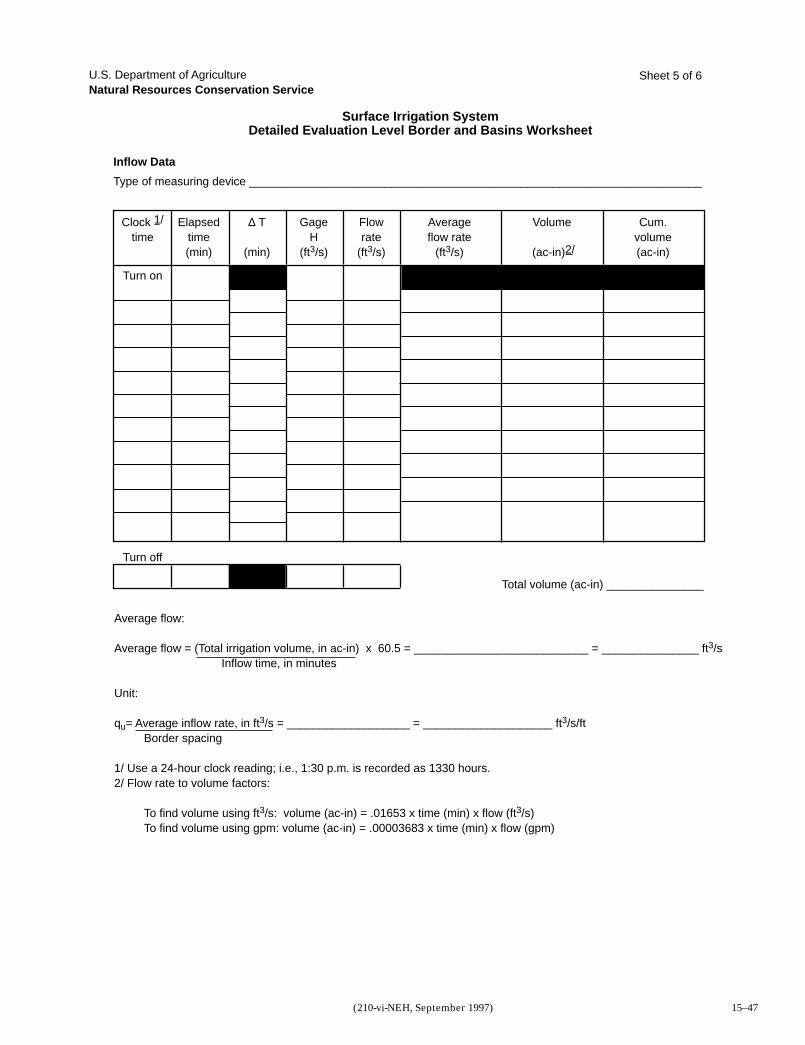
Part 652Irrigation Guide
Resource Planning and Evaluation
Tools and Worksheets
Chapter 15
15–47(210-vi-NEH, September 1997)
Inflow Data
Type of measuring device ______________________________________________________________________
Surface Irrigation SystemDetailed Evaluation Level Border and Basins Worksheet
U.S. Department of AgricultureNatural Resources Conservation Service
Clock 1/
time
Turn on
Turn off
Average flow:
Average flow = (Total irrigation volume, in ac-in) x 60.5 = ___________________________ = _______________ ft3/s Inflow time, in minutes
Unit:
qu= Average inflow rate, in ft3/s = ___________________ = ____________________ ft3/s/ftBorder spacing
1/ Use a 24-hour clock reading; i.e., 1:30 p.m. is recorded as 1330 hours.2/ Flow rate to volume factors:
To find volume using ft3/s: volume (ac-in) = .01653 x time (min) x flow (ft3/s)To find volume using gpm: volume (ac-in) = .00003683 x time (min) x flow (gpm)
Total volume (ac-in) _______________
Elapsedtime(min)
∆ T
(min)
GageH
(ft3/s)
Flowrate
(ft3/s)
Averageflow rate
(ft3/s)
Volume
(ac-in)2/
Cum.volume(ac-in)
Sheet 5 of 6
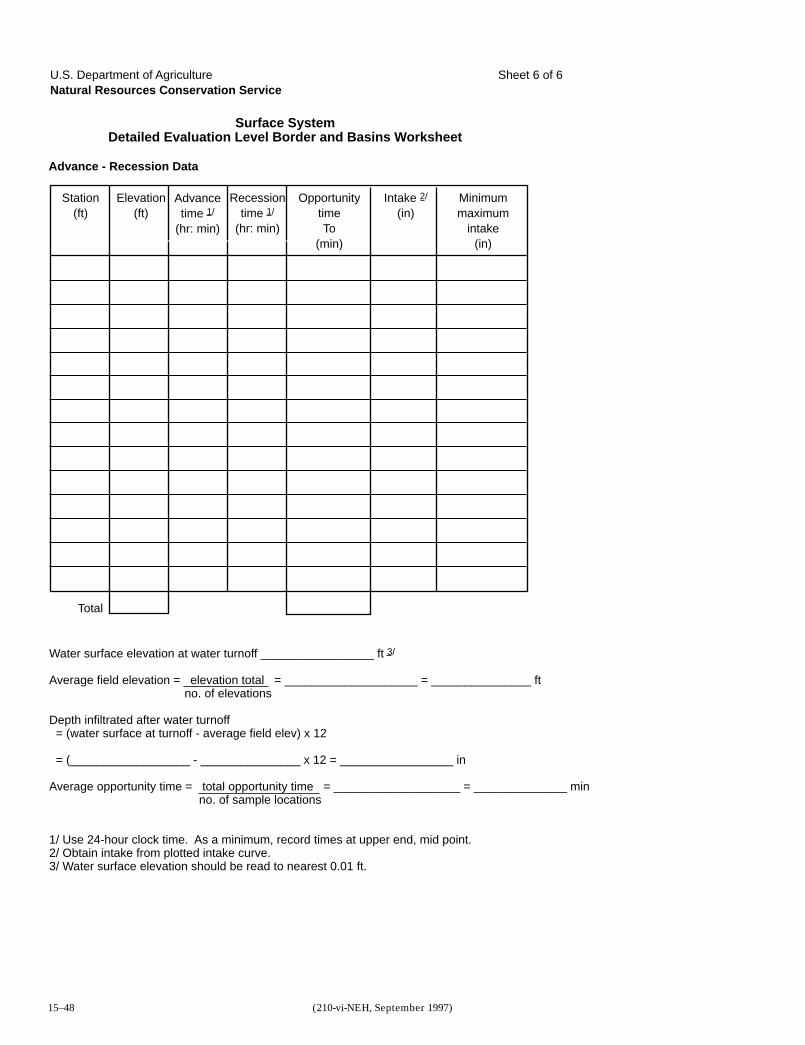
Part 652Irrigation Guide
Resource Planning and Evaluation
Tools and Worksheets
Chapter 15
15–48 (210-vi-NEH, September 1997)
Advance - Recession Data
Surface SystemDetailed Evaluation Level Border and Basins Worksheet
U.S. Department of AgricultureNatural Resources Conservation Service
Recessiontime 1/
(hr: min)
Advancetime 1/
(hr: min)
Station(ft)
OpportunitytimeTo
(min)
Elevation(ft)
Minimummaximum
intake(in)
Intake 2/
(in)
Total
Water surface elevation at water turnoff _________________ ft 3/
Average field elevation = elevation total = ____________________ = _______________ ft no. of elevations
Depth infiltrated after water turnoff = (water surface at turnoff - average field elev) x 12 = (__________________ - _______________ x 12 = _________________ in
Average opportunity time = total opportunity time = ___________________ = ______________ min no. of sample locations
1/ Use 24-hour clock time. As a minimum, record times at upper end, mid point.2/ Obtain intake from plotted intake curve.3/ Water surface elevation should be read to nearest 0.01 ft.
Sheet 6 of 6
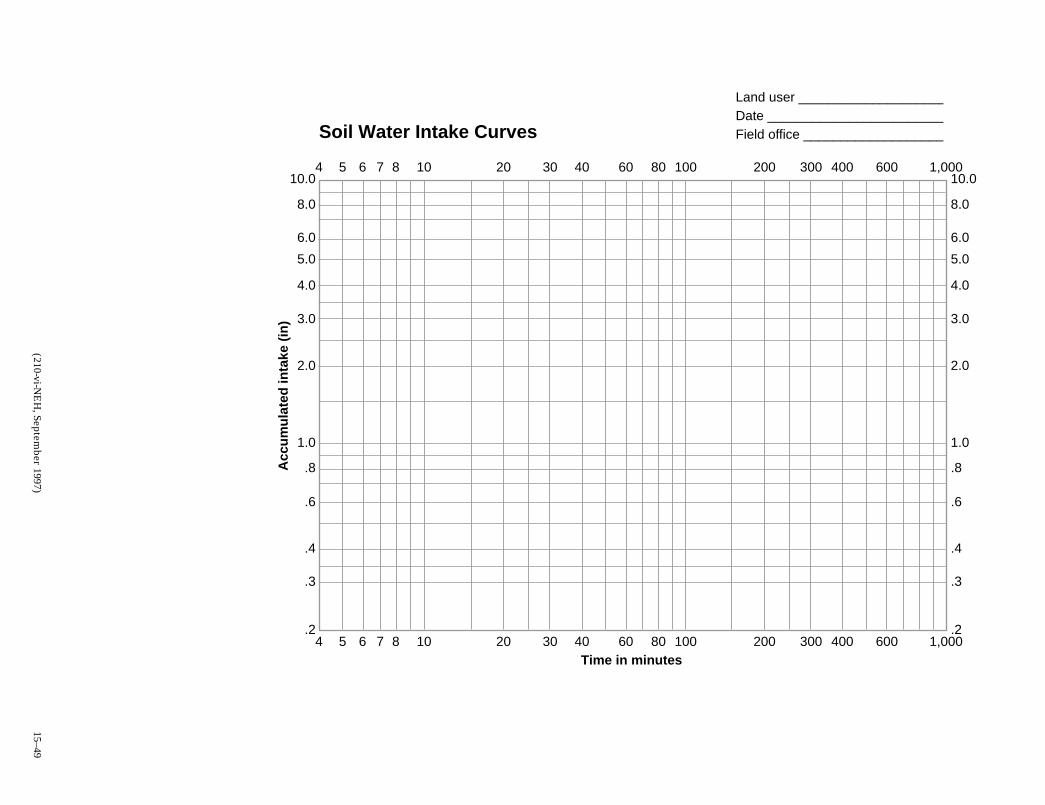
Part 652
Irrigation Guide
Reso
urce P
lan
nin
g a
nd
Evalu
atio
n
To
ols
an
d W
ork
sh
eets
Ch
ap
ter 1
5
15–49(210-vi-N
EH
, September 1997)
10.04 5 6 7 8 10 20 30 40 60 80 100 200 300 400 600 1,000
4 5 6 7 8 10 20 30 40 60 80 100 200 300 400 600 1,000
8.0
6.0
5.0
4.0
3.0
2.0
1.0
.8
.6
.4
.3
.2
10.0
8.0
6.0
5.0
4.0
3.0
2.0
1.0
.8
.6
.4
.3
.2
Time in minutes
Acc
um
ula
ted
inta
ke (
in)
Soil Water Intake Curves
Land user ____________________Date ________________________Field office ___________________

Part 652Irrigation Guide
Resource Planning and Evaluation
Tools and Worksheets
Chapter 15
15–50 (210-vi-NEH, September 1997)
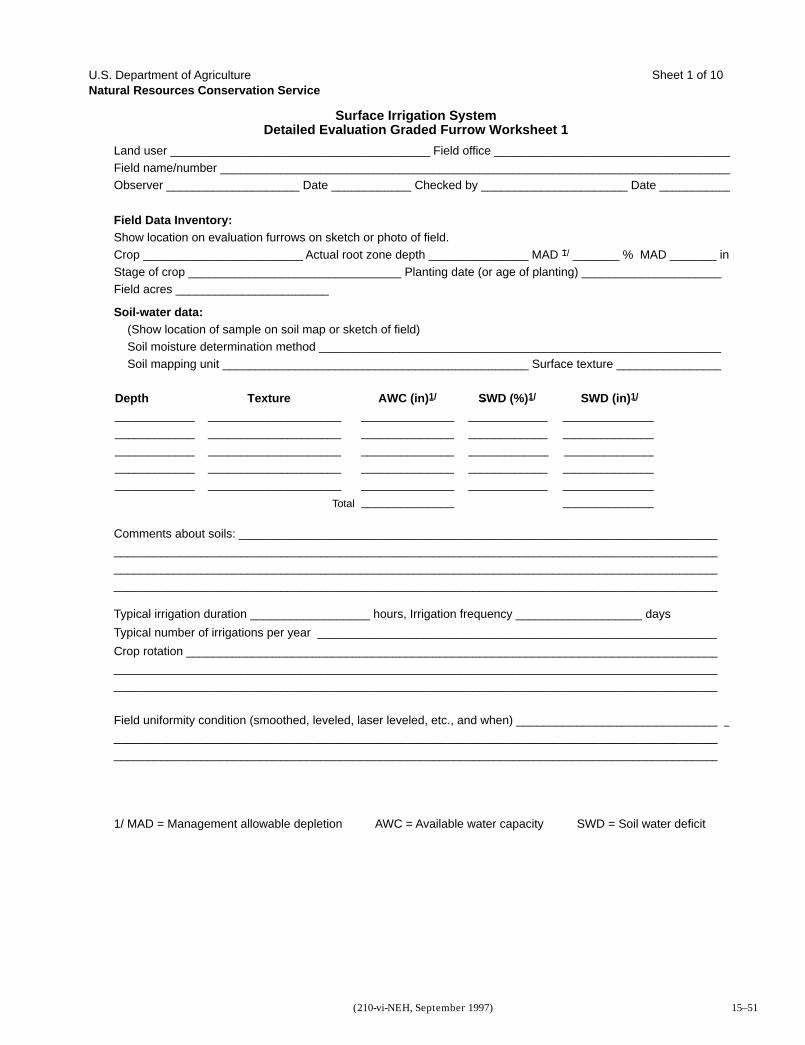
Part 652Irrigation Guide
Resource Planning and Evaluation
Tools and Worksheets
Chapter 15
15–51(210-vi-NEH, September 1997)
Land user _______________________________________ Field office ____________________________________ Field name/number _____________________________________________________________________________Observer ____________________ Date ____________ Checked by ______________________ Date ___________
Comments about soils: _________________________________________________________________________________________________________________________________________________________________________________________________________________________________________________________________________________________________________________________________________________________
Typical irrigation duration __________________ hours, Irrigation frequency ___________________ days
Typical number of irrigations per year ____________________________________________________________
Crop rotation ______________________________________________________________________________________________________________________________________________________________________________________________________________________________________________________________________
Field uniformity condition (smoothed, leveled, laser leveled, etc., and when) ______________________________________________________________________________________________________________________________________________________________________________________________________________________
1/ MAD = Management allowable depletion AWC = Available water capacity SWD = Soil water deficit
Soil-water data:(Show location of sample on soil map or sketch of field)Soil moisture determination method _____________________________________________________________Soil mapping unit ______________________________________________ Surface texture ________________
Surface Irrigation SystemDetailed Evaluation Graded Furrow Worksheet 1
U.S. Department of AgricultureNatural Resources Conservation Service
Field Data Inventory:Show location on evaluation furrows on sketch or photo of field.Crop ________________________ Actual root zone depth _______________ MAD 1/ _______ % MAD _______ inStage of crop ________________________________ Planting date (or age of planting) _____________________Field acres _______________________
Depth Texture AWC (in)1/ SWD (%)1/ SWD (in)1/
____________ ____________________ ______________ ____________ __________________________ ____________________ ______________ ____________ __________________________ ____________________ ______________ _____________ __________________________ ____________________ ______________ ____________ __________________________ ____________________ ______________ ____________ ______________
______________ ______________Total
Sheet 1 of 10
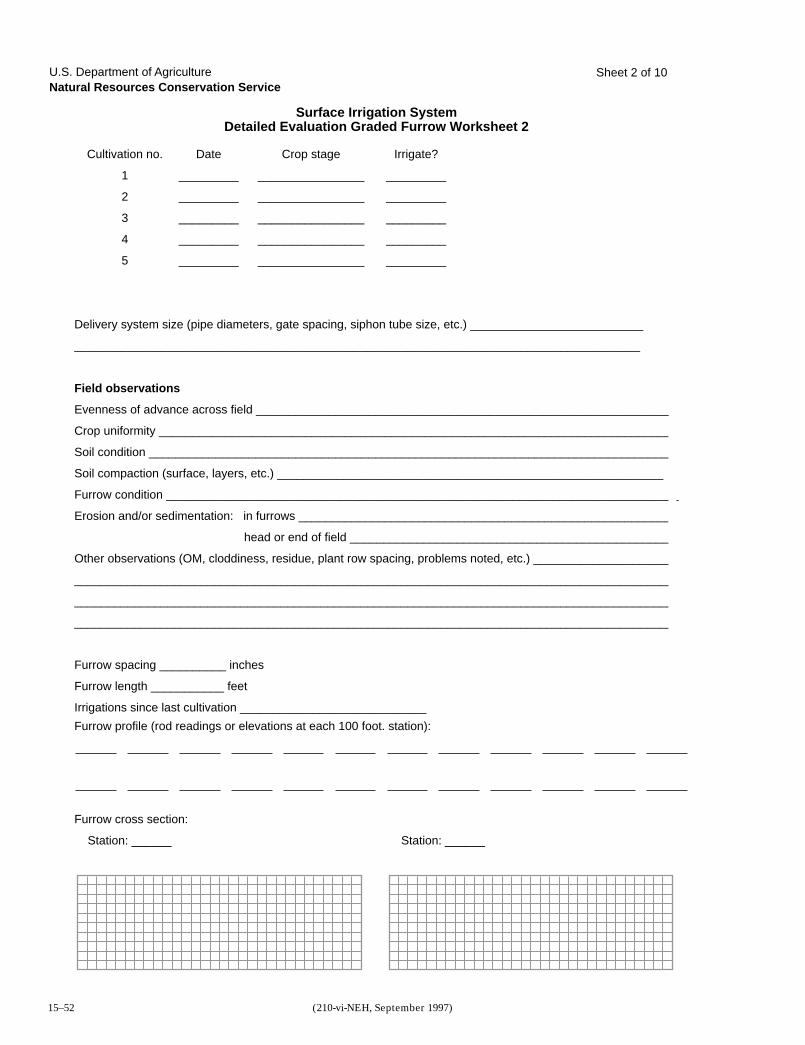
Part 652Irrigation Guide
Resource Planning and Evaluation
Tools and Worksheets
Chapter 15
15–52 (210-vi-NEH, September 1997)
Cultivation no. Date Crop stage Irrigate?
1 _________ ________________ _________
2 _________ ________________ _________
3 _________ ________________ _________
4 _________ ________________ _________
5 _________ ________________ _________
Delivery system size (pipe diameters, gate spacing, siphon tube size, etc.) __________________________
_____________________________________________________________________________________
Field observations
Evenness of advance across field ______________________________________________________________
Crop uniformity _____________________________________________________________________________
Soil condition _______________________________________________________________________________
Soil compaction (surface, layers, etc.) __________________________________________________________
Furrow condition _____________________________________________________________________________
Erosion and/or sedimentation: in furrows ________________________________________________________
head or end of field _________________________________________________
Other observations (OM, cloddiness, residue, plant row spacing, problems noted, etc.) _____________________
__________________________________________________________________________________________
__________________________________________________________________________________________
__________________________________________________________________________________________
Furrow spacing __________ inches
Furrow length ___________ feet
Irrigations since last cultivation ____________________________
Furrow profile (rod readings or elevations at each 100 foot. station):
Furrow cross section:
Station: ______ Station: ______
Surface Irrigation SystemDetailed Evaluation Graded Furrow Worksheet 2
U.S. Department of AgricultureNatural Resources Conservation Service
Sheet 2 of 10
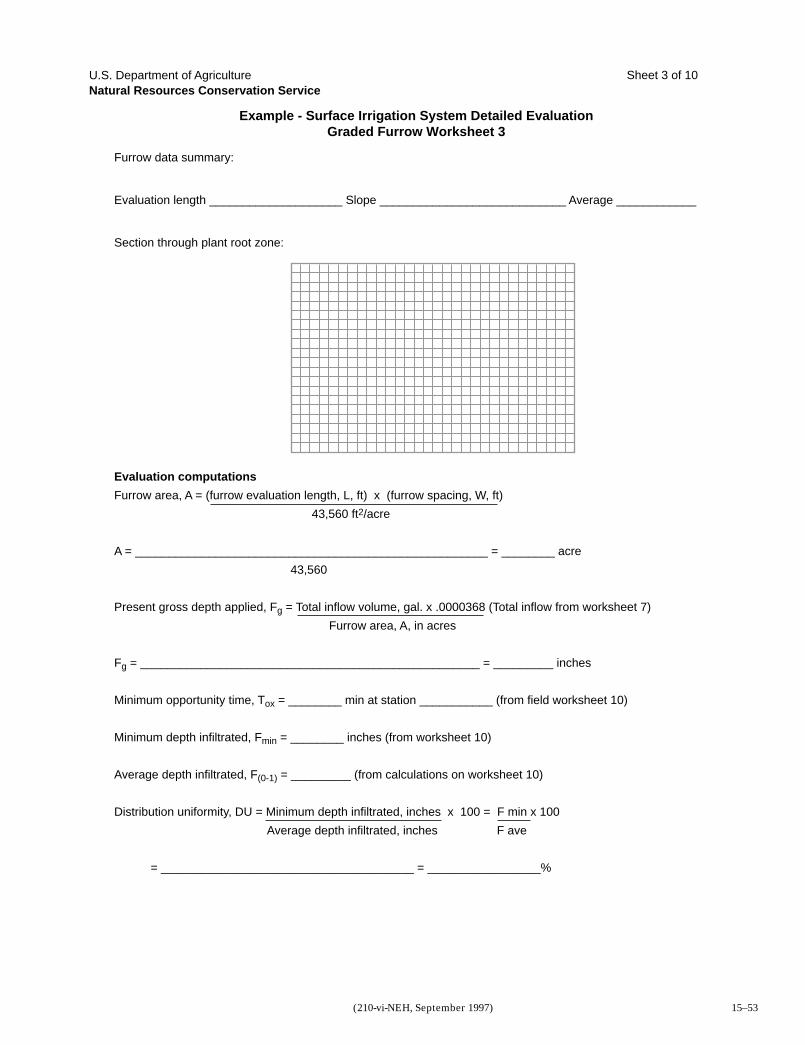
Part 652Irrigation Guide
Resource Planning and Evaluation
Tools and Worksheets
Chapter 15
15–53(210-vi-NEH, September 1997)
Furrow data summary:
Evaluation length ____________________ Slope ____________________________ Average ____________
Section through plant root zone:
Evaluation computations
Furrow area, A = (furrow evaluation length, L, ft) x (furrow spacing, W, ft)
43,560 ft2/acre
A = _____________________________________________________ = ________ acre
43,560
Present gross depth applied, Fg = Total inflow volume, gal. x .0000368 (Total inflow from worksheet 7)
Furrow area, A, in acres
Fg = ___________________________________________________ = _________ inches
Minimum opportunity time, Tox = ________ min at station ___________ (from field worksheet 10)
Minimum depth infiltrated, Fmin = ________ inches (from worksheet 10)
Average depth infiltrated, F(0-1) = _________ (from calculations on worksheet 10)
Distribution uniformity, DU = Minimum depth infiltrated, inches x 100 = F min x 100
Average depth infiltrated, inches F ave
= ______________________________________ = _________________%
Example - Surface Irrigation System Detailed EvaluationGraded Furrow Worksheet 3
U.S. Department of AgricultureNatural Resources Conservation Service
Sheet 3 of 10
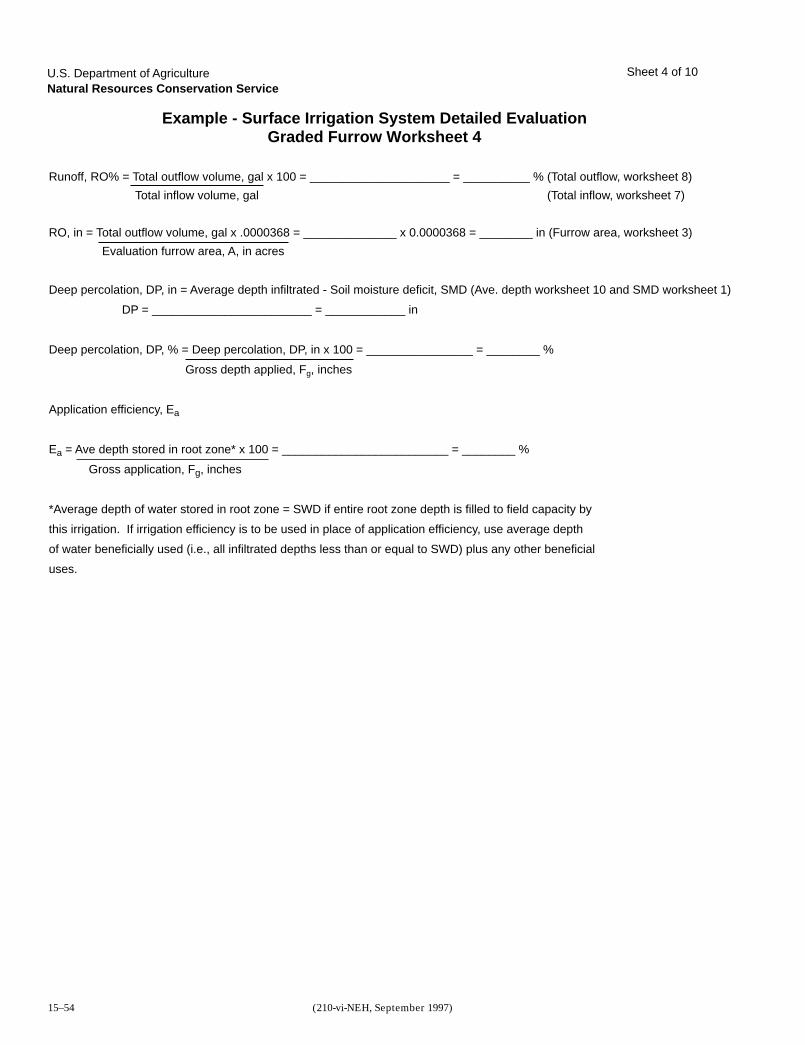
Part 652Irrigation Guide
Resource Planning and Evaluation
Tools and Worksheets
Chapter 15
15–54 (210-vi-NEH, September 1997)
Sheet 4 of 10
Example - Surface Irrigation System Detailed EvaluationGraded Furrow Worksheet 4
U.S. Department of AgricultureNatural Resources Conservation Service
Runoff, RO% = Total outflow volume, gal x 100 = _____________________ = __________ % (Total outflow, worksheet 8)
Total inflow volume, gal (Total inflow, worksheet 7)
RO, in = Total outflow volume, gal x .0000368 = ______________ x 0.0000368 = ________ in (Furrow area, worksheet 3)
Evaluation furrow area, A, in acres
Deep percolation, DP, in = Average depth infiltrated - Soil moisture deficit, SMD (Ave. depth worksheet 10 and SMD worksheet 1)
DP = ________________________ = ____________ in
Deep percolation, DP, % = Deep percolation, DP, in x 100 = ________________ = ________ %
Gross depth applied, Fg, inches
Application efficiency, Ea
Ea = Ave depth stored in root zone* x 100 = _________________________ = ________ %
Gross application, Fg, inches
*Average depth of water stored in root zone = SWD if entire root zone depth is filled to field capacity by
this irrigation. If irrigation efficiency is to be used in place of application efficiency, use average depth
of water beneficially used (i.e., all infiltrated depths less than or equal to SWD) plus any other beneficial
uses.
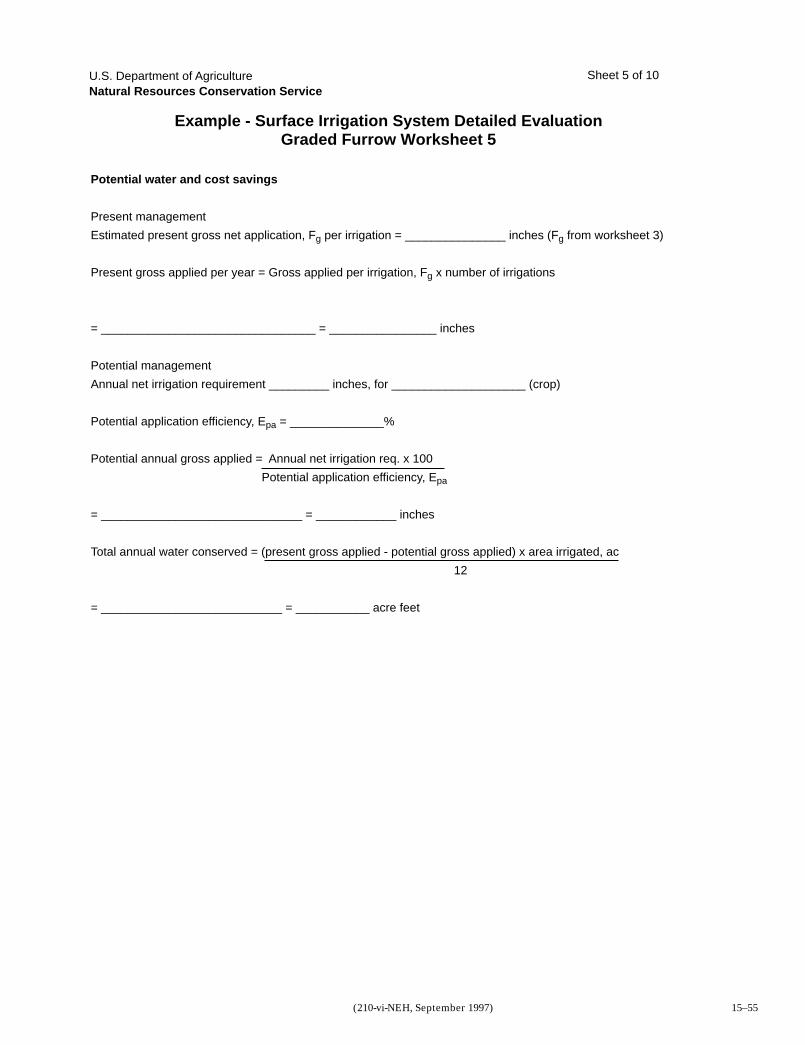
Part 652Irrigation Guide
Resource Planning and Evaluation
Tools and Worksheets
Chapter 15
15–55(210-vi-NEH, September 1997)
Sheet 5 of 10
Example - Surface Irrigation System Detailed EvaluationGraded Furrow Worksheet 5
U.S. Department of AgricultureNatural Resources Conservation Service
Potential water and cost savings
Present management
Estimated present gross net application, Fg per irrigation = _______________ inches (Fg from worksheet 3)
Present gross applied per year = Gross applied per irrigation, Fg x number of irrigations
= ________________________________ = ________________ inches
Potential management
Annual net irrigation requirement _________ inches, for ____________________ (crop)
Potential application efficiency, Epa = ______________%
Potential annual gross applied = Annual net irrigation req. x 100
Potential application efficiency, Epa
= ______________________________ = ____________ inches
Total annual water conserved = (present gross applied - potential gross applied) x area irrigated, ac
12
= ___________________________ = ___________ acre feet
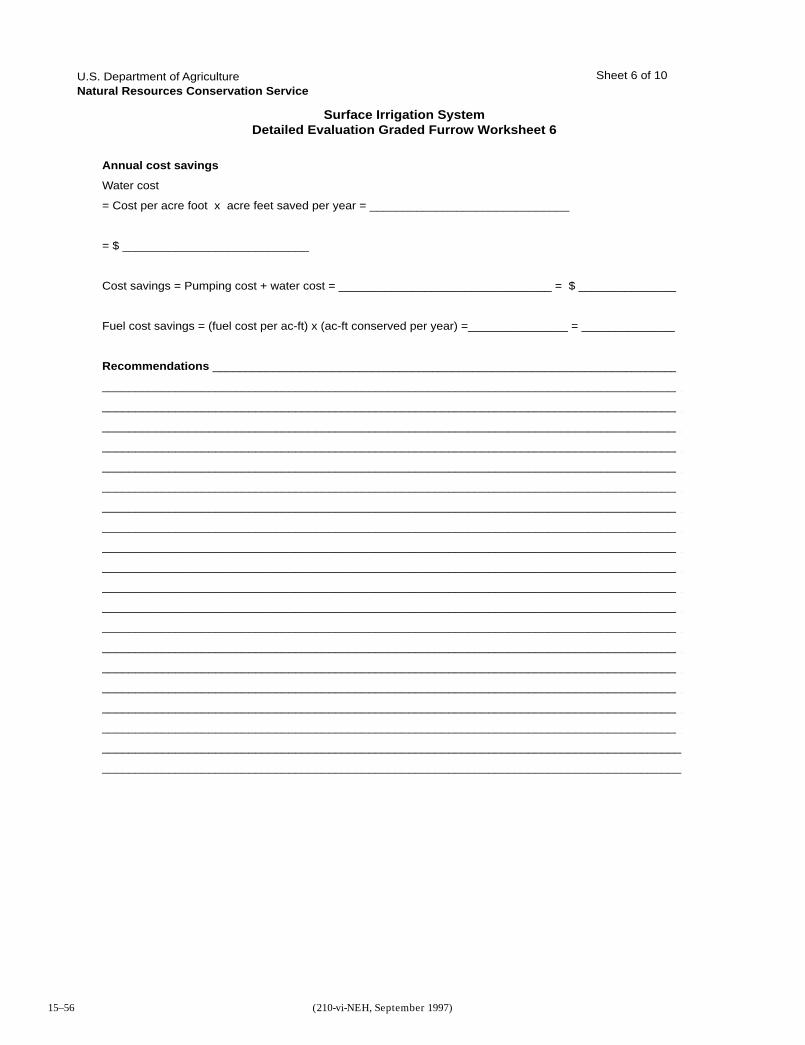
Part 652Irrigation Guide
Resource Planning and Evaluation
Tools and Worksheets
Chapter 15
15–56 (210-vi-NEH, September 1997)
Annual cost savings
Water cost
= Cost per acre foot x acre feet saved per year = ______________________________
= $ ____________________________
Cost savings = Pumping cost + water cost = ________________________________ = $ _______________
Fuel cost savings = (fuel cost per ac-ft) x (ac-ft conserved per year) =_______________ = ______________
Recommendations ______________________________________________________________________
_______________________________________________________________________________________
_______________________________________________________________________________________
_______________________________________________________________________________________
_______________________________________________________________________________________
_______________________________________________________________________________________
_______________________________________________________________________________________
_______________________________________________________________________________________
_______________________________________________________________________________________
_______________________________________________________________________________________
_______________________________________________________________________________________
_______________________________________________________________________________________
_______________________________________________________________________________________
_______________________________________________________________________________________
_______________________________________________________________________________________
_______________________________________________________________________________________
_______________________________________________________________________________________
_______________________________________________________________________________________
_______________________________________________________________________________________
_______________________________________________________________________________________
_______________________________________________________________________________________
Surface Irrigation SystemDetailed Evaluation Graded Furrow Worksheet 6
U.S. Department of AgricultureNatural Resources Conservation Service
Sheet 6 of 10
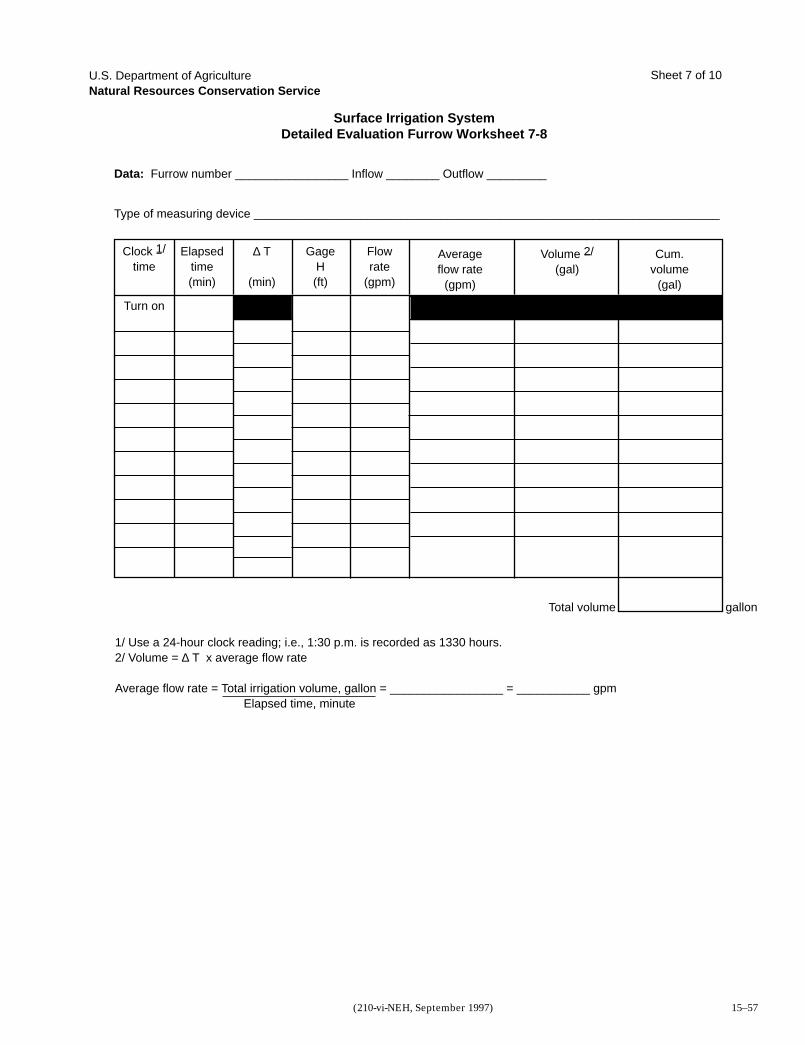
Part 652Irrigation Guide
Resource Planning and Evaluation
Tools and Worksheets
Chapter 15
15–57(210-vi-NEH, September 1997)
Data: Furrow number _________________ Inflow ________ Outflow _________
Type of measuring device ______________________________________________________________________
Surface Irrigation SystemDetailed Evaluation Furrow Worksheet 7-8
U.S. Department of AgricultureNatural Resources Conservation Service
Clock 1/
time
Turn on
1/ Use a 24-hour clock reading; i.e., 1:30 p.m. is recorded as 1330 hours.2/ Volume = ∆ T x average flow rate
Average flow rate = Total irrigation volume, gallon = _________________ = ___________ gpm Elapsed time, minute
Total volume gallon
Elapsedtime(min)
∆ T
(min)
GageH(ft)
Flowrate
(gpm)
Averageflow rate
(gpm)
Volume 2/
(gal)Cum.
volume(gal)
Sheet 7 of 10
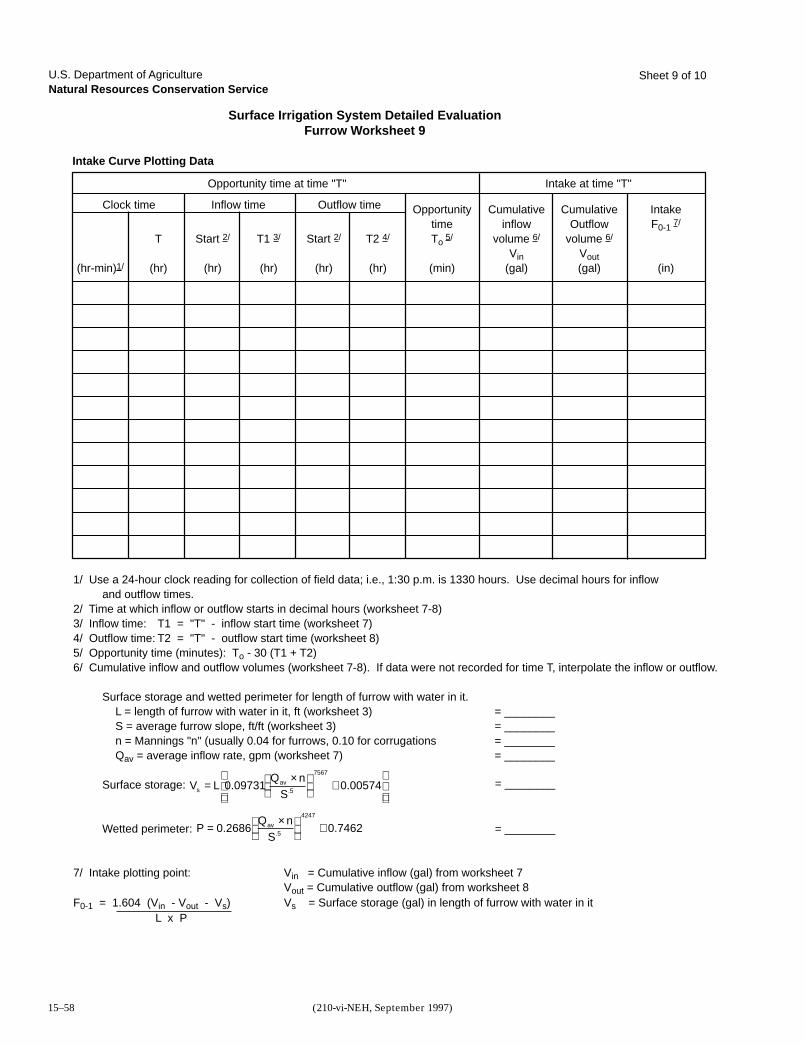
Part 652Irrigation Guide
Resource Planning and Evaluation
Tools and Worksheets
Chapter 15
15–58 (210-vi-NEH, September 1997)
Sheet 9 of 10
Intake Curve Plotting Data
Surface Irrigation System Detailed EvaluationFurrow Worksheet 9
U.S. Department of AgricultureNatural Resources Conservation Service
Clock time Inflow time
Opportunity time at time "T" Intake at time "T"
Outflow time
(hr-min)1/
T
(hr)
Start 2/
(hr)
T1 3/
(hr)
1/ Use a 24-hour clock reading for collection of field data; i.e., 1:30 p.m. is 1330 hours. Use decimal hours for inflowand outflow times.
2/ Time at which inflow or outflow starts in decimal hours (worksheet 7-8)3/ Inflow time: T1 = "T" - inflow start time (worksheet 7)4/ Outflow time: T2 = "T" - outflow start time (worksheet 8)5/ Opportunity time (minutes): To - 30 (T1 + T2)6/ Cumulative inflow and outflow volumes (worksheet 7-8). If data were not recorded for time T, interpolate the inflow or outflow.
Surface storage and wetted perimeter for length of furrow with water in it.L = length of furrow with water in it, ft (worksheet 3) = ________S = average furrow slope, ft/ft (worksheet 3) = ________n = Mannings "n" (usually 0.04 for furrows, 0.10 for corrugations = ________Qav = average inflow rate, gpm (worksheet 7) = ________
Surface storage:
Wetted perimeter:
7/ Intake plotting point: Vin = Cumulative inflow (gal) from worksheet 7Vout = Cumulative outflow (gal) from worksheet 8
F0-1 = 1.604 (Vin - Vout - Vs) Vs = Surface storage (gal) in length of furrow with water in it L x P
OpportunitytimeTo 5/
(min)
Cumulativeinflow
volume 6/
Vin(gal)
CumulativeOutflow
volume 6/
Vout(gal)
IntakeF0-1 7/
(in)
Start 2/
(hr)
T2 4/
(hr)
PQ n
Sav=
×
+0 2686 0 74625
4247
. ..
.
V LQ n
Ssav=
×
+
0 09731 0 005745
7567
. ..
.
= ________
= ________
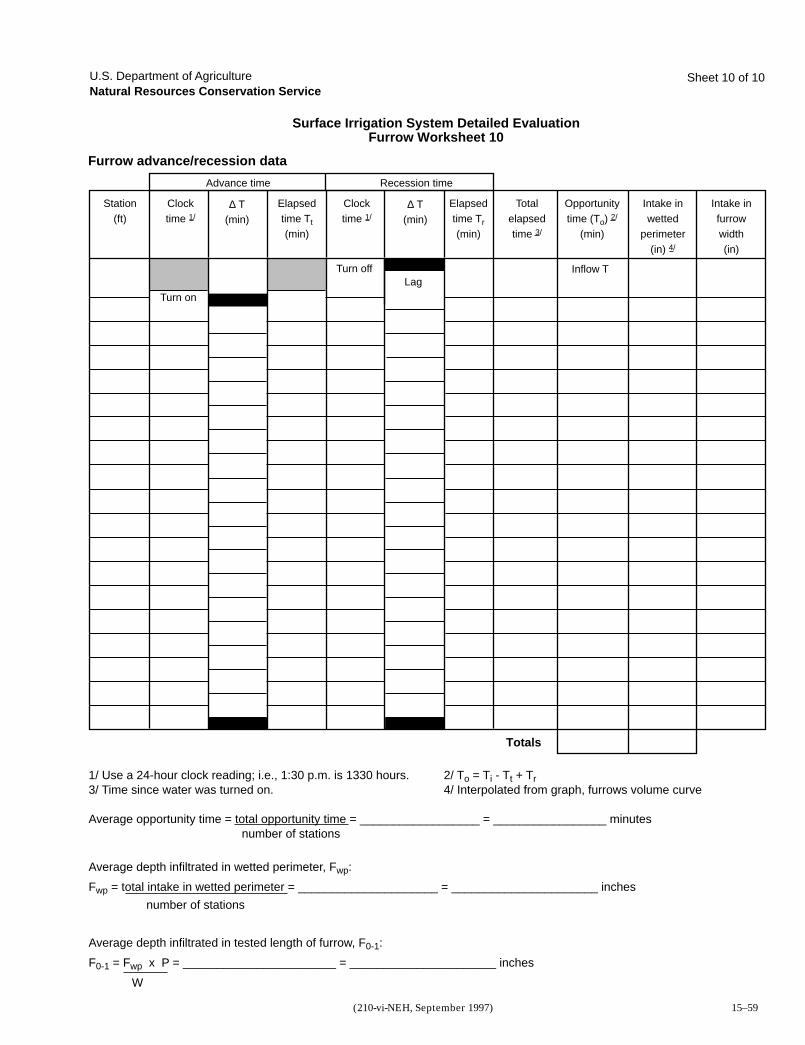
Part 652Irrigation Guide
Resource Planning and Evaluation
Tools and Worksheets
Chapter 15
15–59(210-vi-NEH, September 1997)
Sheet 10 of 10
Furrow advance/recession data
Surface Irrigation System Detailed EvaluationFurrow Worksheet 10
U.S. Department of AgricultureNatural Resources Conservation Service
Elapsedtime Tt
(min)
∆ T(min)
Station(ft)
Turn off Inflow T
Turn on
Lag
Clocktime 1/
Advance time Recession time
Opportunitytime (To) 2/
(min)
Intake inwetted
perimeter(in) 4/
Intake infurrowwidth(in)
Elapsedtime Tr
(min)
∆ T(min)
Totals
Clocktime 1/
Totalelapsedtime 3/
1/ Use a 24-hour clock reading; i.e., 1:30 p.m. is 1330 hours. 2/ To = Ti - Tt + Tr3/ Time since water was turned on. 4/ Interpolated from graph, furrows volume curve
Average opportunity time = total opportunity time = __________________ = _________________ minutes number of stations
Average depth infiltrated in wetted perimeter, Fwp:
Fwp = total intake in wetted perimeter = _____________________ = ______________________ inches
number of stations
Average depth infiltrated in tested length of furrow, F0-1:
F0-1 = Fwp x P = _______________________ = ______________________ inches
W
Part 652Irrigation Guide
Resource Planning and Evaluation
Tools and Worksheets
Chapter 15
15–60 (210-vi-NEH, September 1997)
Surface Irrigation System Detailed EvaluationFurrow Worksheet 11
U.S. Department of AgricultureNational Resources Conservation Service
Part 652
Irrigation Guide
Reso
urce P
lan
nin
g a
nd
Evalu
atio
n
To
ols
an
d W
ork
sh
eets
Ch
ap
ter 1
5
15–61(210-vi-N
EH
, September 1997)
Advance and recession curves
Distance (stations) - feet x 100
Tim
e -
min
ute
s
Land user ____________________Date ________________________Field office ___________________
Part 652Irrigation Guide
Resource Planning and Evaluation
Tools and Worksheets
Chapter 15
15–62 (210-vi-NEH, September 1997)
Flow volume curves
Land user ____________________Date ________________________Field office ___________________
Real time (hours)
Vo
lum
e -
Gallo
ns
12,000
14,000
10,000
8000
6000
4000
2000
0 100 200 300 400 500 600 700
Part 652
Irrigation Guide
Reso
urce P
lan
nin
g a
nd
Evalu
atio
n
To
ols
an
d W
ork
sh
eets
Ch
ap
ter 1
5
15–63(210-vi-N
EH
, September 1997)
10.04 5 6 7 8 10 20 30 40 60 80 100 200 300 400 600 1,000
4 5 6 7 8 10 20 30 40 60 80 100 200 300 400 600 1,000
8.0
6.0
5.0
4.0
3.0
2.0
1.0
.8
.6
.4
.3
.2
10.0
8.0
6.0
5.0
4.0
3.0
2.0
1.0
.8
.6
.4
.3
.2
Time in minutes, To
Inta
ke in
ches
F 0
-1
Soil water intake curves
Land user ____________________Date ________________________Field office ___________________

Part 652Irrigation Guide
Resource Planning and Evaluation
Tools and Worksheets
Chapter 15
15–64 (210-vi-NEH, September 1997)
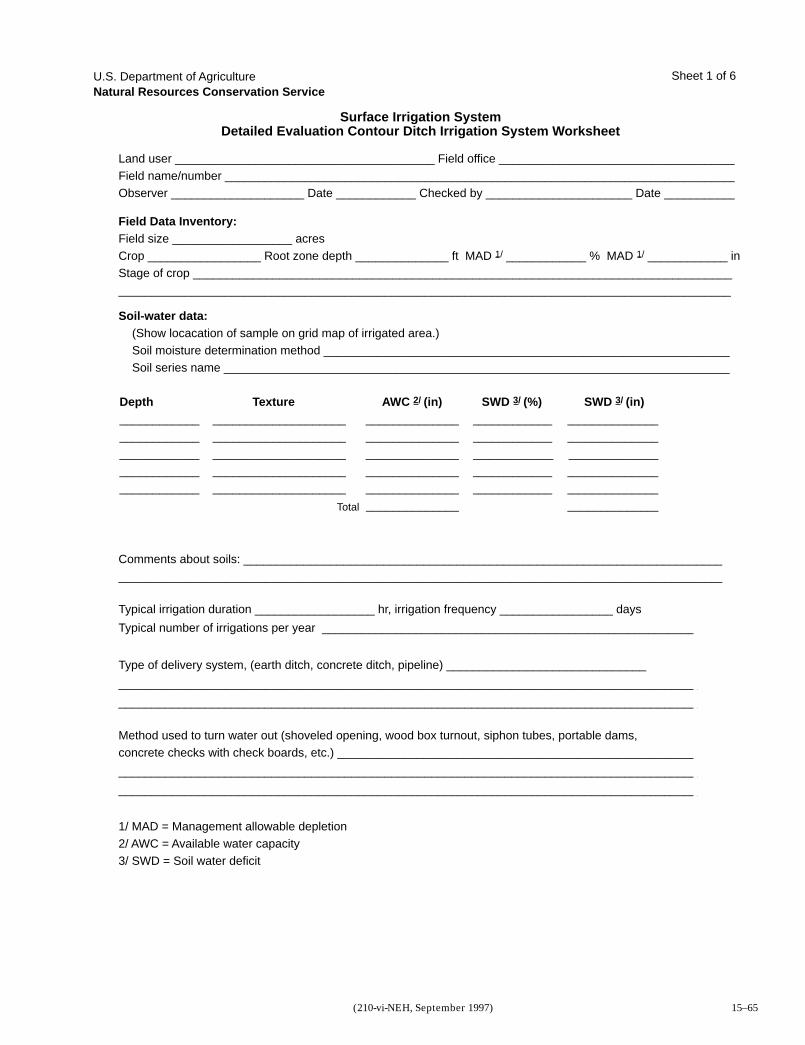
Part 652Irrigation Guide
Resource Planning and Evaluation
Tools and Worksheets
Chapter 15
15–65(210-vi-NEH, September 1997)
Land user _______________________________________ Field office ____________________________________ Field name/number _____________________________________________________________________________Observer ____________________ Date ____________ Checked by ______________________ Date ___________
Comments about soils: ___________________________________________________________________________________________________________________________________________________________________
Typical irrigation duration __________________ hr, irrigation frequency _________________ days
Typical number of irrigations per year ________________________________________________________
Type of delivery system, (earth ditch, concrete ditch, pipeline) ______________________________
_______________________________________________________________________________________
_______________________________________________________________________________________
1/ MAD = Management allowable depletion2/ AWC = Available water capacity3/ SWD = Soil water deficit
Soil-water data:(Show locacation of sample on grid map of irrigated area.)Soil moisture determination method _____________________________________________________________Soil series name ____________________________________________________________________________
Surface Irrigation SystemDetailed Evaluation Contour Ditch Irrigation System Worksheet
U.S. Department of AgricultureNatural Resources Conservation Service
Field Data Inventory:Field size __________________ acresCrop _________________ Root zone depth ______________ ft MAD 1/ ____________ % MAD 1/ ____________ inStage of crop _____________________________________________________________________________________________________________________________________________________________________________
Method used to turn water out (shoveled opening, wood box turnout, siphon tubes, portable dams,concrete checks with check boards, etc.) ______________________________________________________
_______________________________________________________________________________________
_______________________________________________________________________________________
Depth Texture AWC 2/ (in) SWD 3/ (%) SWD 3/ (in)____________ ____________________ ______________ ____________ __________________________ ____________________ ______________ ____________ __________________________ ____________________ ______________ _____________ __________________________ ____________________ ______________ ____________ __________________________ ____________________ ______________ ____________ ______________
______________ ______________Total
Sheet 1 of 6
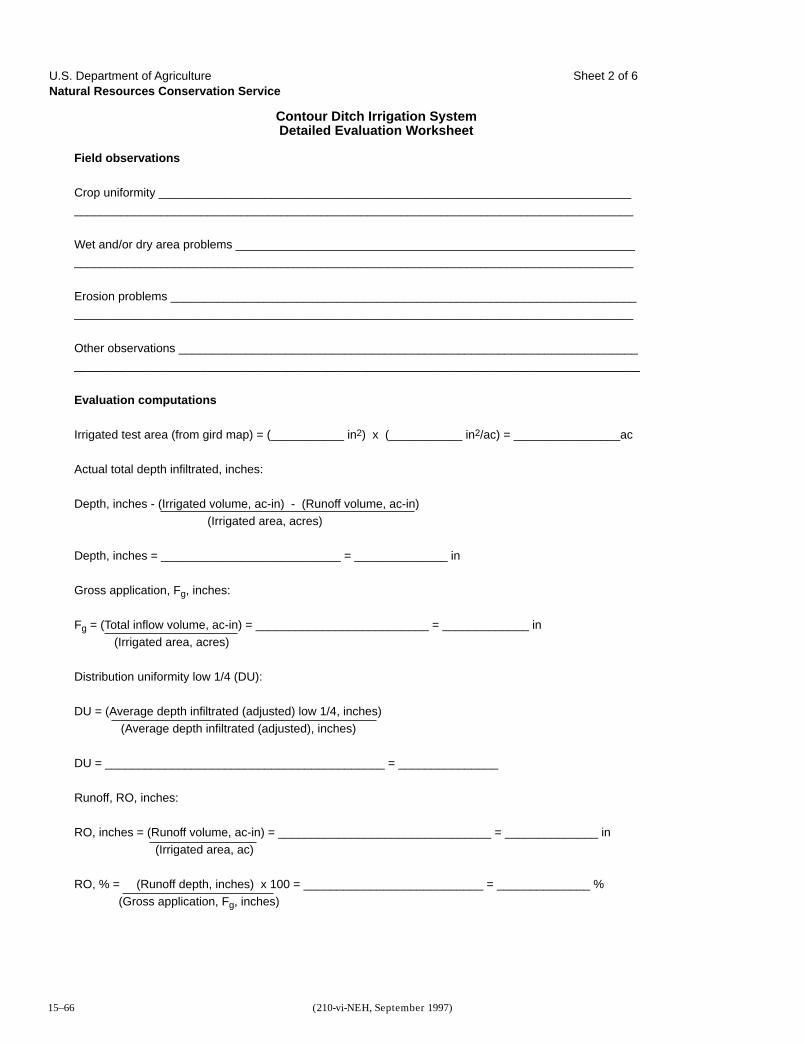
Part 652Irrigation Guide
Resource Planning and Evaluation
Tools and Worksheets
Chapter 15
15–66 (210-vi-NEH, September 1997)
Field observations
Crop uniformity ___________________________________________________________________________________________________________________________________________________________
Wet and/or dry area problems ________________________________________________________________________________________________________________________________________________
Erosion problems __________________________________________________________________________________________________________________________________________________________
Other observations __________________________________________________________________________________________________________________________________________________________
Evaluation computations
Irrigated test area (from gird map) = (___________ in2) x (___________ in2/ac) = ________________ac
Actual total depth infiltrated, inches:
Depth, inches - (Irrigated volume, ac-in) - (Runoff volume, ac-in)(Irrigated area, acres)
Depth, inches = ___________________________ = ______________ in
Gross application, Fg, inches:
Fg = (Total inflow volume, ac-in) = __________________________ = _____________ in (Irrigated area, acres)
Distribution uniformity low 1/4 (DU):
DU = (Average depth infiltrated (adjusted) low 1/4, inches) (Average depth infiltrated (adjusted), inches)
DU = __________________________________________ = _______________
Runoff, RO, inches:
RO, inches = (Runoff volume, ac-in) = ________________________________ = ______________ in (Irrigated area, ac)
RO, % = (Runoff depth, inches) x 100 = ___________________________ = ______________ %(Gross application, Fg, inches)
Contour Ditch Irrigation SystemDetailed Evaluation Worksheet
U.S. Department of AgricultureNatural Resources Conservation Service
Sheet 2 of 6
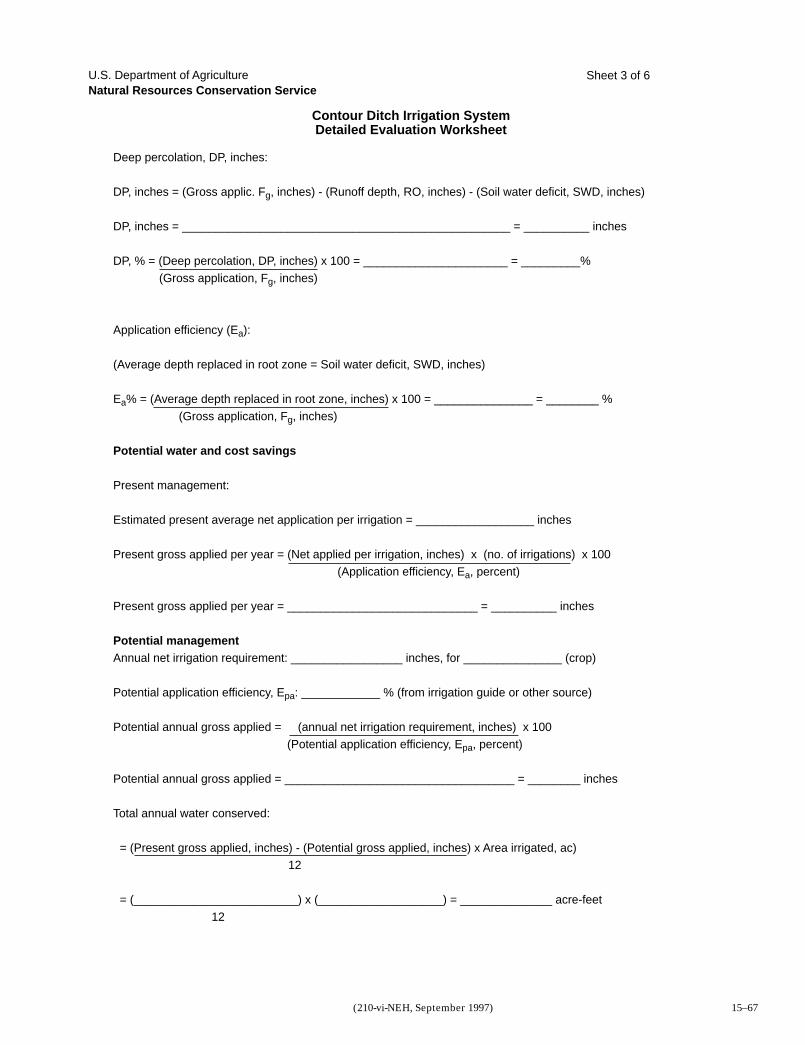
Part 652Irrigation Guide
Resource Planning and Evaluation
Tools and Worksheets
Chapter 15
15–67(210-vi-NEH, September 1997)
Deep percolation, DP, inches:
DP, inches = (Gross applic. Fg, inches) - (Runoff depth, RO, inches) - (Soil water deficit, SWD, inches)
DP, inches = __________________________________________________ = __________ inches
DP, % = (Deep percolation, DP, inches) x 100 = ______________________ = _________% (Gross application, Fg, inches)
Application efficiency (Ea):
(Average depth replaced in root zone = Soil water deficit, SWD, inches)
Ea% = (Average depth replaced in root zone, inches) x 100 = _______________ = ________ % (Gross application, Fg, inches)
Potential water and cost savings
Present management:
Estimated present average net application per irrigation = __________________ inches
Present gross applied per year = (Net applied per irrigation, inches) x (no. of irrigations) x 100 (Application efficiency, Ea, percent)
Present gross applied per year = _____________________________ = __________ inches
Potential managementAnnual net irrigation requirement: _________________ inches, for _______________ (crop)
Potential application efficiency, Epa: ____________ % (from irrigation guide or other source)
Potential annual gross applied = (annual net irrigation requirement, inches) x 100 (Potential application efficiency, Epa, percent)
Potential annual gross applied = ___________________________________ = ________ inches
Total annual water conserved:
= (Present gross applied, inches) - (Potential gross applied, inches) x Area irrigated, ac)12
= (_________________________) x (___________________) = ______________ acre-feet 12
Contour Ditch Irrigation SystemDetailed Evaluation Worksheet
U.S. Department of AgricultureNatural Resources Conservation Service
Sheet 3 of 6
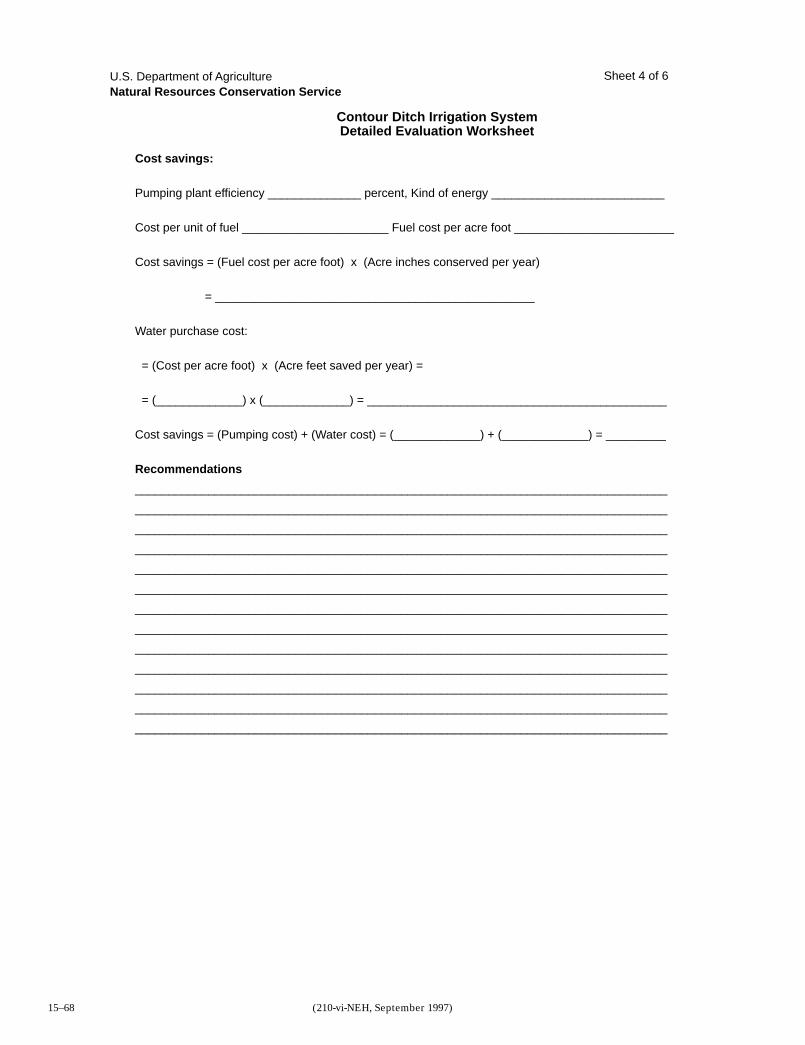
Part 652Irrigation Guide
Resource Planning and Evaluation
Tools and Worksheets
Chapter 15
15–68 (210-vi-NEH, September 1997)
Cost savings:
Pumping plant efficiency ______________ percent, Kind of energy __________________________
Cost per unit of fuel ______________________ Fuel cost per acre foot ________________________
Cost savings = (Fuel cost per acre foot) x (Acre inches conserved per year)
= ________________________________________________
Water purchase cost:
= (Cost per acre foot) x (Acre feet saved per year) =
= (_____________) x (_____________) = _____________________________________________
Cost savings = (Pumping cost) + (Water cost) = (_____________) + (_____________) = _________
Recommendations
________________________________________________________________________________
________________________________________________________________________________
________________________________________________________________________________
________________________________________________________________________________
________________________________________________________________________________
________________________________________________________________________________
________________________________________________________________________________
________________________________________________________________________________
________________________________________________________________________________
________________________________________________________________________________
________________________________________________________________________________
________________________________________________________________________________
________________________________________________________________________________
Contour Ditch Irrigation SystemDetailed Evaluation Worksheet
U.S. Department of AgricultureNatural Resources Conservation Service
Sheet 4 of 6
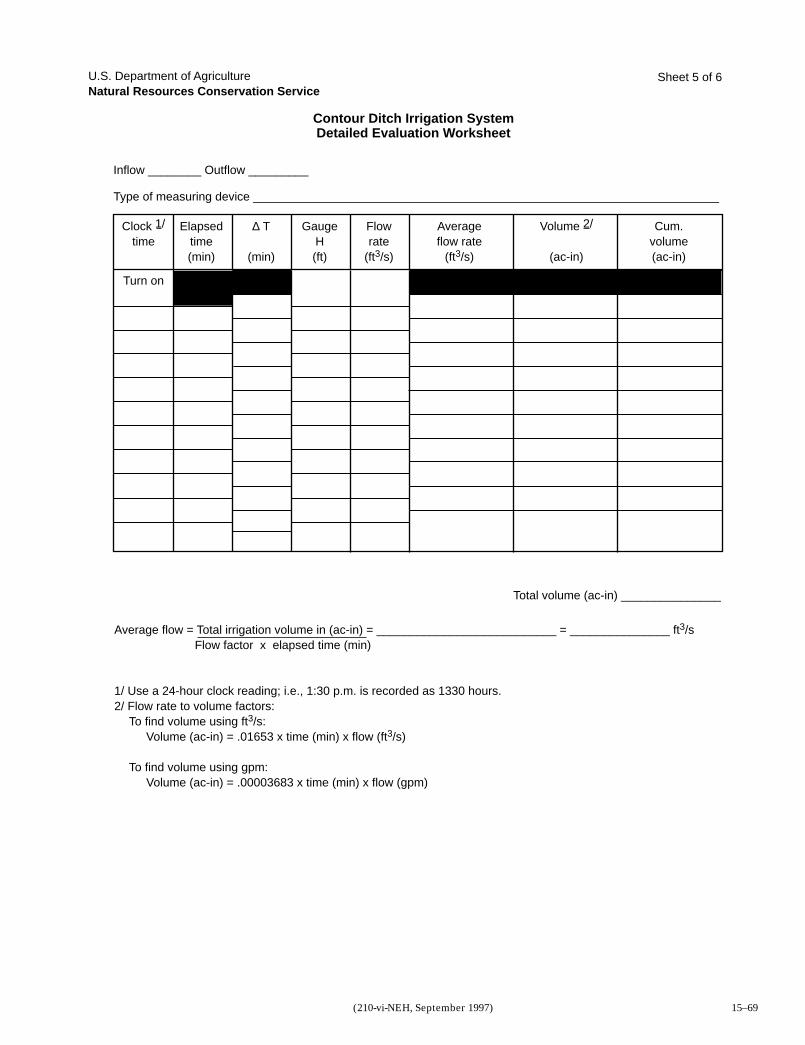
Part 652Irrigation Guide
Resource Planning and Evaluation
Tools and Worksheets
Chapter 15
15–69(210-vi-NEH, September 1997)
Inflow ________ Outflow _________
Type of measuring device ______________________________________________________________________
Contour Ditch Irrigation SystemDetailed Evaluation Worksheet
U.S. Department of AgricultureNatural Resources Conservation Service
Clock 1/
time
Turn on
Average flow = Total irrigation volume in (ac-in) = ___________________________ = _______________ ft3/s Flow factor x elapsed time (min)
1/ Use a 24-hour clock reading; i.e., 1:30 p.m. is recorded as 1330 hours.2/ Flow rate to volume factors:
To find volume using ft3/s:Volume (ac-in) = .01653 x time (min) x flow (ft3/s)
To find volume using gpm:Volume (ac-in) = .00003683 x time (min) x flow (gpm)
Total volume (ac-in) _______________
Elapsedtime(min)
∆ T
(min)
GaugeH(ft)
Flowrate
(ft3/s)
Averageflow rate
(ft3/s)
Volume 2/
(ac-in)
Cum.volume(ac-in)
Sheet 5 of 6
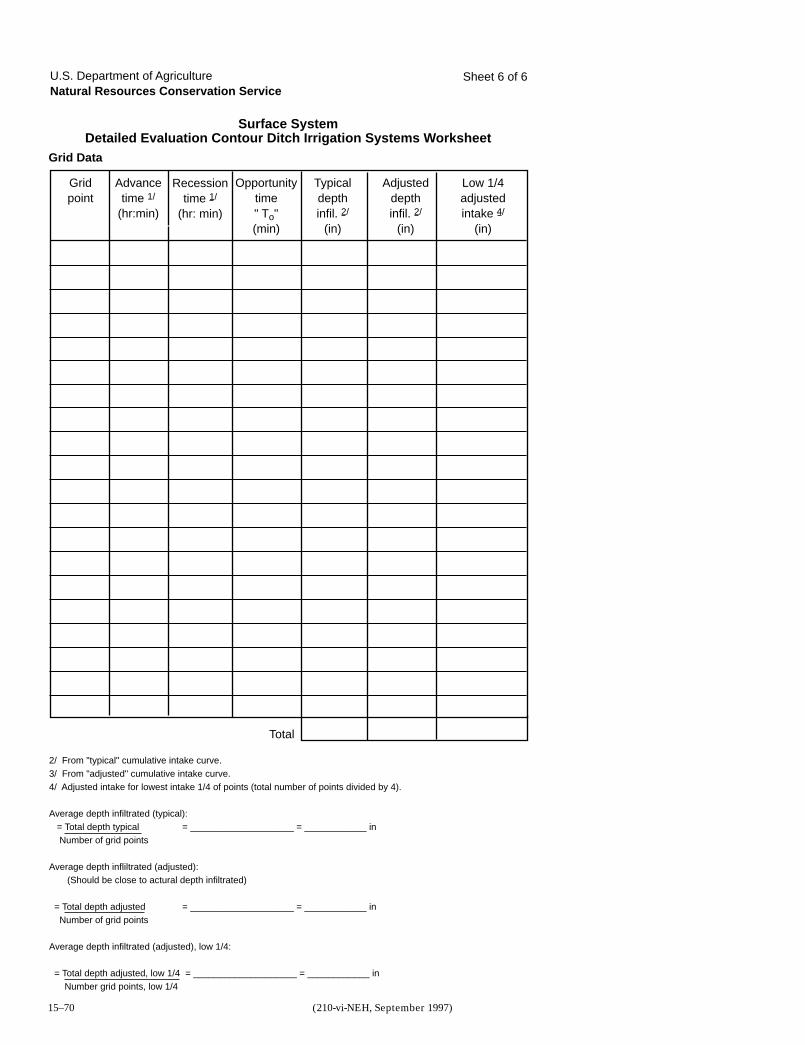
Part 652Irrigation Guide
Resource Planning and Evaluation
Tools and Worksheets
Chapter 15
15–70 (210-vi-NEH, September 1997)
Grid Data
Surface SystemDetailed Evaluation Contour Ditch Irrigation Systems Worksheet
U.S. Department of AgricultureNatural Resources Conservation Service
Opportunitytime" To"(min)
Recessiontime 1/
(hr: min)
Gridpoint
Typicaldepthinfil. 2/
(in)
Advancetime 1/
(hr:min)
Low 1/4adjustedintake 4/
(in)
Adjusteddepthinfil. 2/
(in)
Total
2/ From "typical" cumulative intake curve.3/ From "adjusted" cumulative intake curve.4/ Adjusted intake for lowest intake 1/4 of points (total number of points divided by 4).
Average depth infiltrated (typical): = Total depth typical = ____________________ = ____________ in Number of grid points
Average depth infliltrated (adjusted): (Should be close to actural depth infiltrated)
= Total depth adjusted = ____________________ = ____________ in Number of grid points
Average depth infiltrated (adjusted), low 1/4:
= Total depth adjusted, low 1/4 = ____________________ = ____________ in Number grid points, low 1/4
Sheet 6 of 6

Part 652
Irrigation Guide
Reso
urce P
lan
nin
g a
nd
Evalu
atio
n
To
ols
an
d W
ork
sh
eets
Ch
ap
ter 1
5
15–71(210-vi-N
EH
, September 1997)
10.04 5 6 7 8 10 20 30 40 60 80 100 200 300 400 600 1,000
4 5 6 7 8 10 20 30 40 60 80 100 200 300 400 600 1,000
8.0
6.0
5.0
4.0
3.0
2.0
1.0
.8
.6
.4
.3
.2
10.0
8.0
6.0
5.0
4.0
3.0
2.0
1.0
.8
.6
.4
.3
.2
Time in minutes
Acc
um
ula
ted
inta
ke (
in)
Soil Water Intake Curves
Land user ____________________Date ________________________Field office ___________________
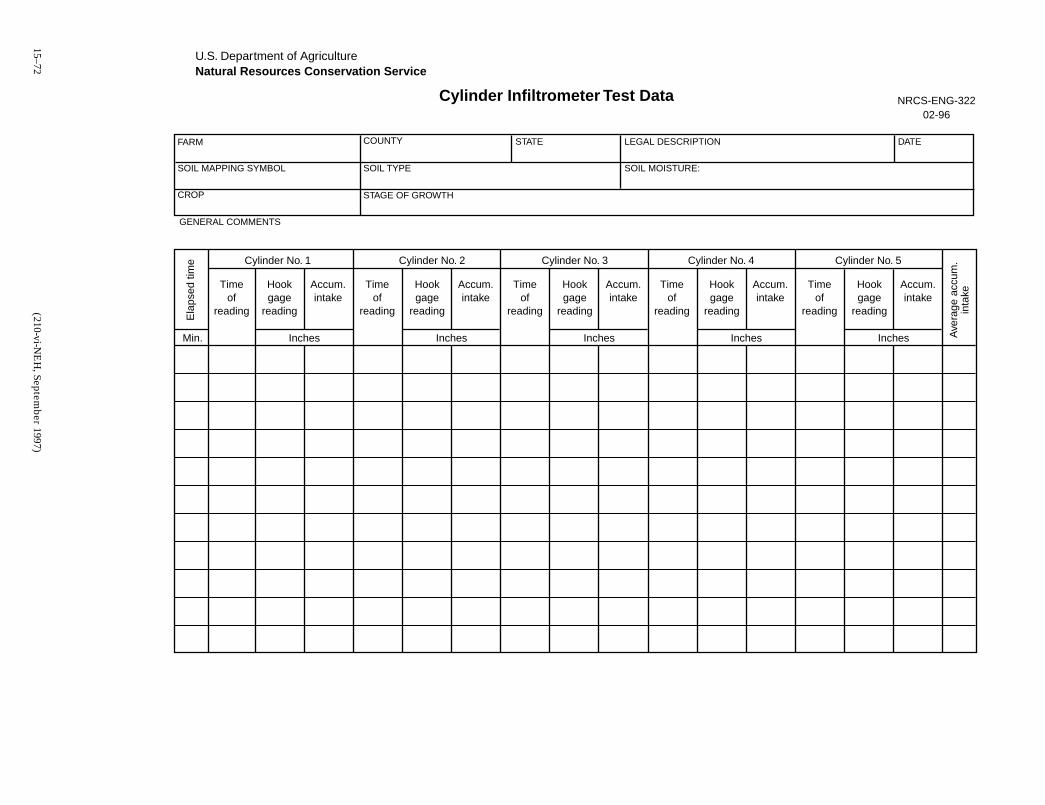
Part 652
Irrigation Guide
Reso
urce P
lan
nin
g a
nd
Evalu
atio
n
To
ols
an
d W
ork
sh
eets
Ch
ap
ter 1
5
15–72(210-vi-N
EH
, September 1997)
Cylinder Infiltrometer Test Data
U.S. Department of AgricultureNatural Resources Conservation Service
FARM
SOIL MAPPING SYMBOL
CROP
GENERAL COMMENTS
COUNTY STATE
SOIL TYPE
LEGAL DESCRIPTION DATE
NRCS-ENG-32202-96
SOIL MOISTURE:
STAGE OF GROWTH
Cylinder No. 1 Cylinder No. 2 Cylinder No. 3 Cylinder No. 4 Cylinder No. 5
InchesMin. Inches Inches Inches Inches
Ela
psed
tim
e
Ave
rage
acc
um.
inta
ke
Timeof
reading
Timeof
reading
Hookgage
reading
Accum.intake
Hookgage
reading
Accum.intake
Timeof
reading
Hookgage
reading
Accum.intake
Timeof
reading
Hookgage
reading
Accum.intake
Timeof
reading
Hookgage
reading
Accum.intake
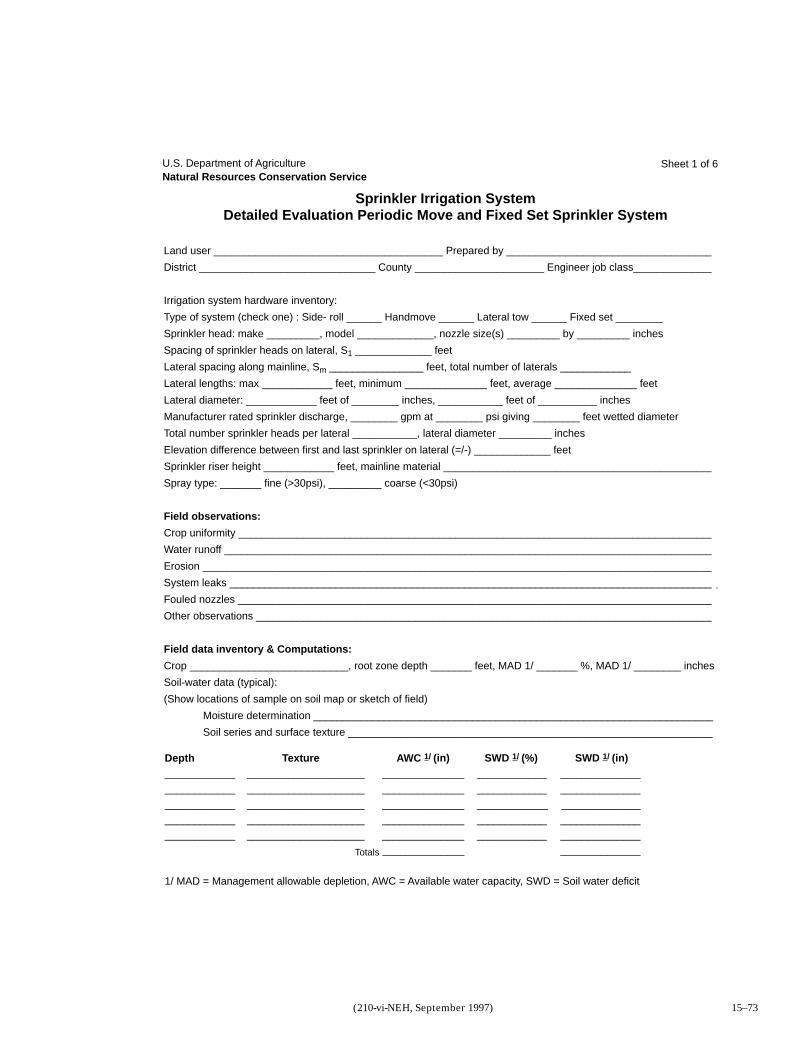
Part 652Irrigation Guide
Resource Planning and Evaluation
Tools and Worksheets
Chapter 15
15–73(210-vi-NEH, September 1997)
Sprinkler Irrigation SystemDetailed Evaluation Periodic Move and Fixed Set Sprinkler System
U.S. Department of AgricultureNatural Resources Conservation Service
Land user _______________________________________ Prepared by ___________________________________
District ______________________________ County ______________________ Engineer job class______________
Irrigation system hardware inventory:
Type of system (check one) : Side- roll ______ Handmove ______ Lateral tow ______ Fixed set ________
Sprinkler head: make _________, model _____________, nozzle size(s) _________ by _________ inches
Spacing of sprinkler heads on lateral, S1 _____________ feet
Lateral spacing along mainline, Sm ________________ feet, total number of laterals ____________
Lateral lengths: max ____________ feet, minimum ______________ feet, average ______________ feet
Lateral diameter: ____________ feet of ________ inches, ___________ feet of __________ inches
Manufacturer rated sprinkler discharge, ________ gpm at ________ psi giving ________ feet wetted diameter
Total number sprinkler heads per lateral ___________, lateral diameter _________ inches
Elevation difference between first and last sprinkler on lateral (=/-) _____________ feet
Sprinkler riser height ____________ feet, mainline material ______________________________________________
Spray type: _______ fine (>30psi), _________ coarse (<30psi)
Field observations:
Crop uniformity _________________________________________________________________________________
Water runoff ___________________________________________________________________________________
Erosion _______________________________________________________________________________________
System leaks ___________________________________________________________________________________
Fouled nozzles _________________________________________________________________________________
Other observations ______________________________________________________________________________
Field data inventory & Computations:
Crop ___________________________, root zone depth _______ feet, MAD 1/ _______ %, MAD 1/ ________ inches
Soil-water data (typical):
(Show locations of sample on soil map or sketch of field)
Moisture determination ____________________________________________________________________
Soil series and surface texture ______________________________________________________________
Depth Texture AWC 1/ (in) SWD 1/ (%) SWD 1/ (in)____________ ____________________ ______________ ____________ __________________________ ____________________ ______________ ____________ __________________________ ____________________ ______________ _____________ __________________________ ____________________ ______________ ____________ __________________________ ____________________ ______________ ____________ ______________
______________ ______________
1/ MAD = Management allowable depletion, AWC = Available water capacity, SWD = Soil water deficit
Totals
Sheet 1 of 6
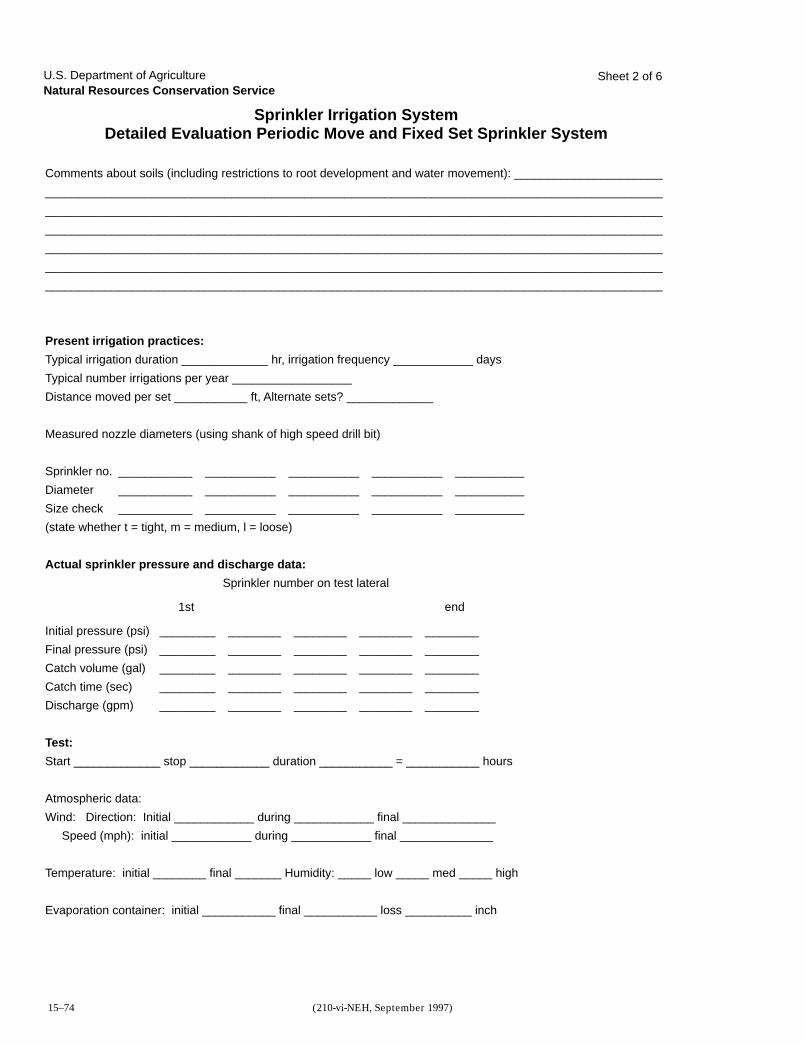
Part 652Irrigation Guide
Resource Planning and Evaluation
Tools and Worksheets
Chapter 15
15–74 (210-vi-NEH, September 1997)
Sprinkler Irrigation SystemDetailed Evaluation Periodic Move and Fixed Set Sprinkler System
U.S. Department of AgricultureNatural Resources Conservation Service
Comments about soils (including restrictions to root development and water movement): _______________________
_____________________________________________________________________________________________
_____________________________________________________________________________________________
_____________________________________________________________________________________________
_____________________________________________________________________________________________
_____________________________________________________________________________________________
_____________________________________________________________________________________________
Present irrigation practices:
Typical irrigation duration _____________ hr, irrigation frequency ____________ days
Typical number irrigations per year __________________
Distance moved per set ___________ ft, Alternate sets? _____________
Measured nozzle diameters (using shank of high speed drill bit)
Sprinkler no. _____________________________________________________________
Diameter _____________________________________________________________
Size check _____________________________________________________________
(state whether t = tight, m = medium, l = loose)
Actual sprinkler pressure and discharge data:
Sprinkler number on test lateral
1st end
Initial pressure (psi) ________________________________________________
Final pressure (psi) ________________________________________________
Catch volume (gal) ________________________________________________
Catch time (sec) ________________________________________________
Discharge (gpm) ________________________________________________
Test:
Start _____________ stop ____________ duration ___________ = ___________ hours
Atmospheric data:
Wind: Direction: Initial ____________ during ____________ final ______________
Speed (mph): initial ____________ during ____________ final ______________
Temperature: initial ________ final _______ Humidity: _____ low _____ med _____ high
Evaporation container: initial ___________ final ___________ loss __________ inch
Sheet 2 of 6
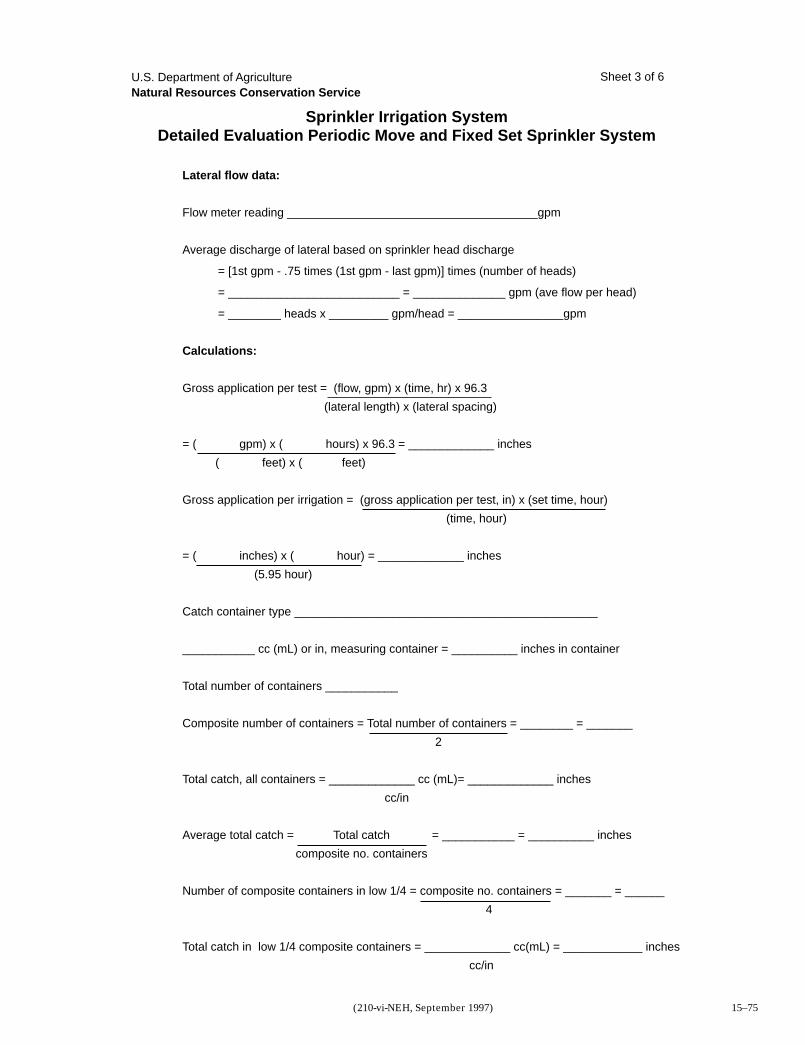
Part 652Irrigation Guide
Resource Planning and Evaluation
Tools and Worksheets
Chapter 15
15–75(210-vi-NEH, September 1997)
Sprinkler Irrigation SystemDetailed Evaluation Periodic Move and Fixed Set Sprinkler System
U.S. Department of AgricultureNatural Resources Conservation Service
Lateral flow data:
Flow meter reading ______________________________________gpm
Average discharge of lateral based on sprinkler head discharge
= [1st gpm - .75 times (1st gpm - last gpm)] times (number of heads)
= __________________________ = ______________ gpm (ave flow per head)
= ________ heads x _________ gpm/head = ________________gpm
Calculations:
Gross application per test = (flow, gpm) x (time, hr) x 96.3
(lateral length) x (lateral spacing)
= ( gpm) x ( hours) x 96.3 = _____________ inches
( feet) x ( feet)
Gross application per irrigation = (gross application per test, in) x (set time, hour)
(time, hour)
= ( inches) x ( hour) = _____________ inches
(5.95 hour)
Catch container type ______________________________________________
___________ cc (mL) or in, measuring container = __________ inches in container
Total number of containers ___________
Composite number of containers = Total number of containers = ________ = _______
2
Total catch, all containers = _____________ cc (mL)= _____________ inches
cc/in
Average total catch = Total catch = ___________ = __________ inches
composite no. containers
Number of composite containers in low 1/4 = composite no. containers = _______ = ______
4
Total catch in low 1/4 composite containers = _____________ cc(mL) = ____________ inches
cc/in
Sheet 3 of 6
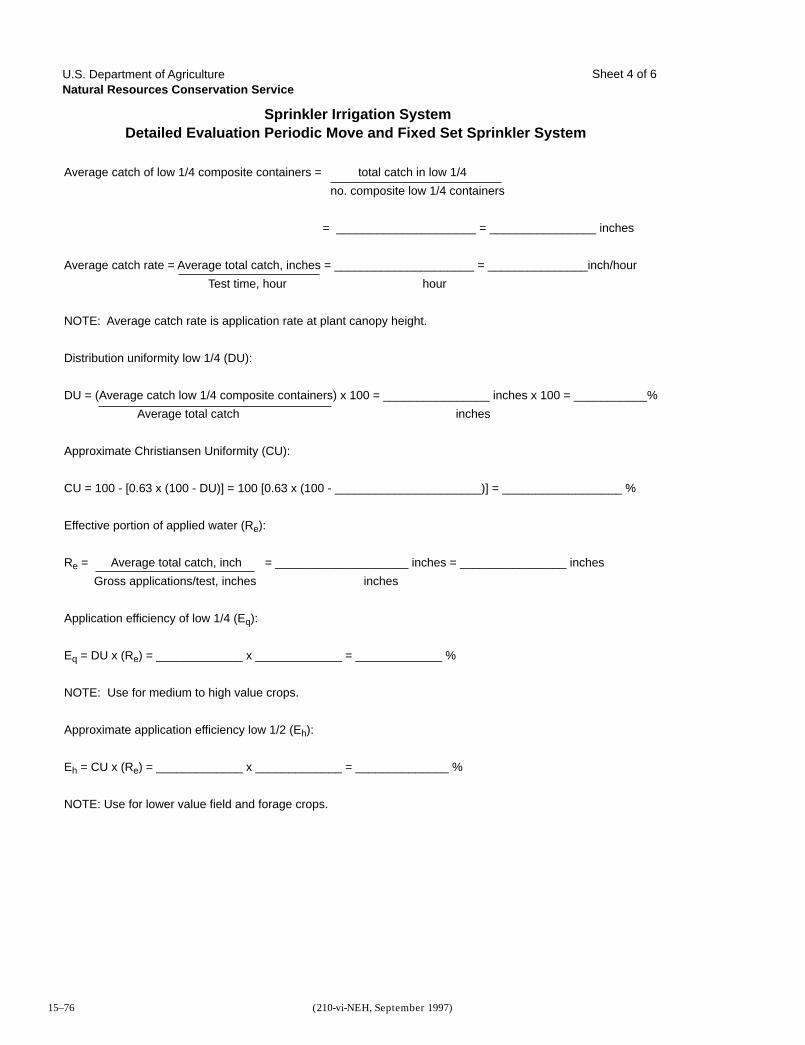
Part 652Irrigation Guide
Resource Planning and Evaluation
Tools and Worksheets
Chapter 15
15–76 (210-vi-NEH, September 1997)
Sprinkler Irrigation SystemDetailed Evaluation Periodic Move and Fixed Set Sprinkler System
U.S. Department of AgricultureNatural Resources Conservation Service
Average catch of low 1/4 composite containers = total catch in low 1/4
no. composite low 1/4 containers
= _____________________ = ________________ inches
Average catch rate = Average total catch, inches = _____________________ = _______________inch/hour
Test time, hour hour
NOTE: Average catch rate is application rate at plant canopy height.
Distribution uniformity low 1/4 (DU):
DU = (Average catch low 1/4 composite containers) x 100 = ________________ inches x 100 = ___________%
Average total catch inches
Approximate Christiansen Uniformity (CU):
CU = 100 - [0.63 x (100 - DU)] = 100 [0.63 x (100 - ______________________)] = __________________ %
Effective portion of applied water (Re):
Re = Average total catch, inch = ____________________ inches = ________________ inches
Gross applications/test, inches inches
Application efficiency of low 1/4 (Eq):
Eq = DU x (Re) = _____________ x _____________ = _____________ %
NOTE: Use for medium to high value crops.
Approximate application efficiency low 1/2 (Eh):
Eh = CU x (Re) = _____________ x _____________ = ______________ %
NOTE: Use for lower value field and forage crops.
Sheet 4 of 6
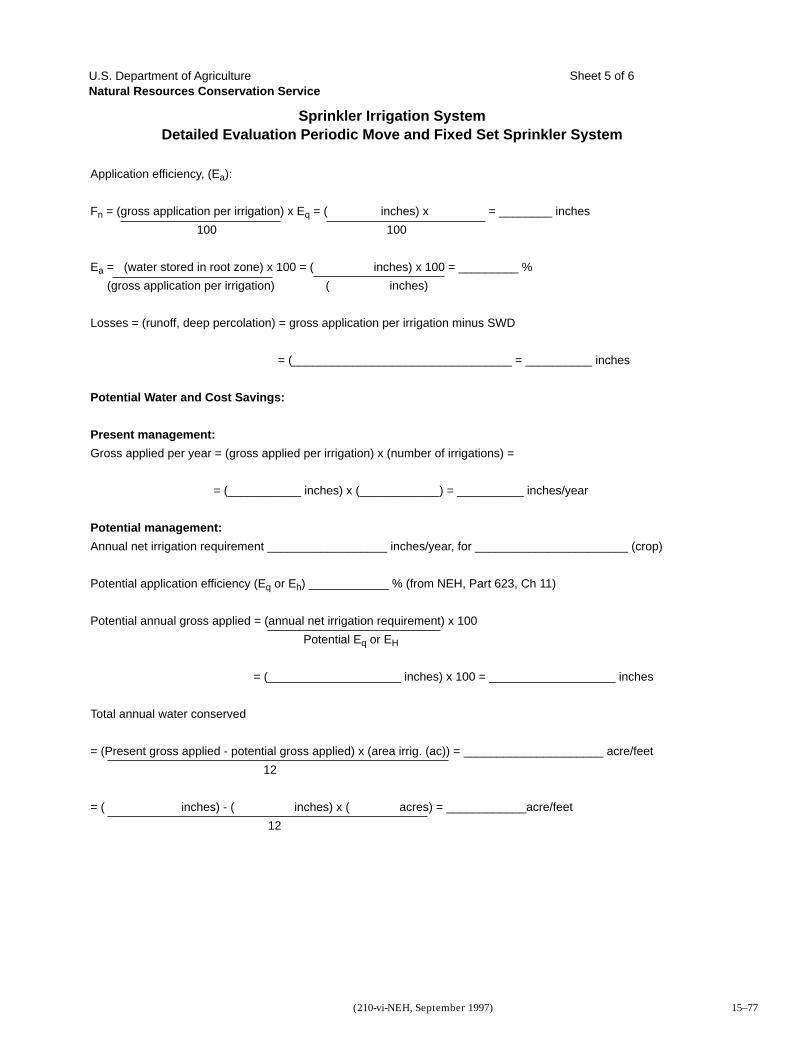
Part 652Irrigation Guide
Resource Planning and Evaluation
Tools and Worksheets
Chapter 15
15–77(210-vi-NEH, September 1997)
Sprinkler Irrigation SystemDetailed Evaluation Periodic Move and Fixed Set Sprinkler System
U.S. Department of AgricultureNatural Resources Conservation Service
Application efficiency, (Ea):
Fn = (gross application per irrigation) x Eq = ( inches) x = ________ inches
100 100
Ea = (water stored in root zone) x 100 = ( inches) x 100 = _________ %
(gross application per irrigation) ( inches)
Losses = (runoff, deep percolation) = gross application per irrigation minus SWD
= (_________________________________ = __________ inches
Potential Water and Cost Savings:
Present management:
Gross applied per year = (gross applied per irrigation) x (number of irrigations) =
= (___________ inches) x (____________) = __________ inches/year
Potential management:
Annual net irrigation requirement __________________ inches/year, for _______________________ (crop)
Potential application efficiency (Eq or Eh) ____________ % (from NEH, Part 623, Ch 11)
Potential annual gross applied = (annual net irrigation requirement) x 100
Potential Eq or EH
= (____________________ inches) x 100 = ___________________ inches
Total annual water conserved
= (Present gross applied - potential gross applied) x (area irrig. (ac)) = _____________________ acre/feet
12
= ( inches) - ( inches) x ( acres) = ____________acre/feet
12
Sheet 5 of 6
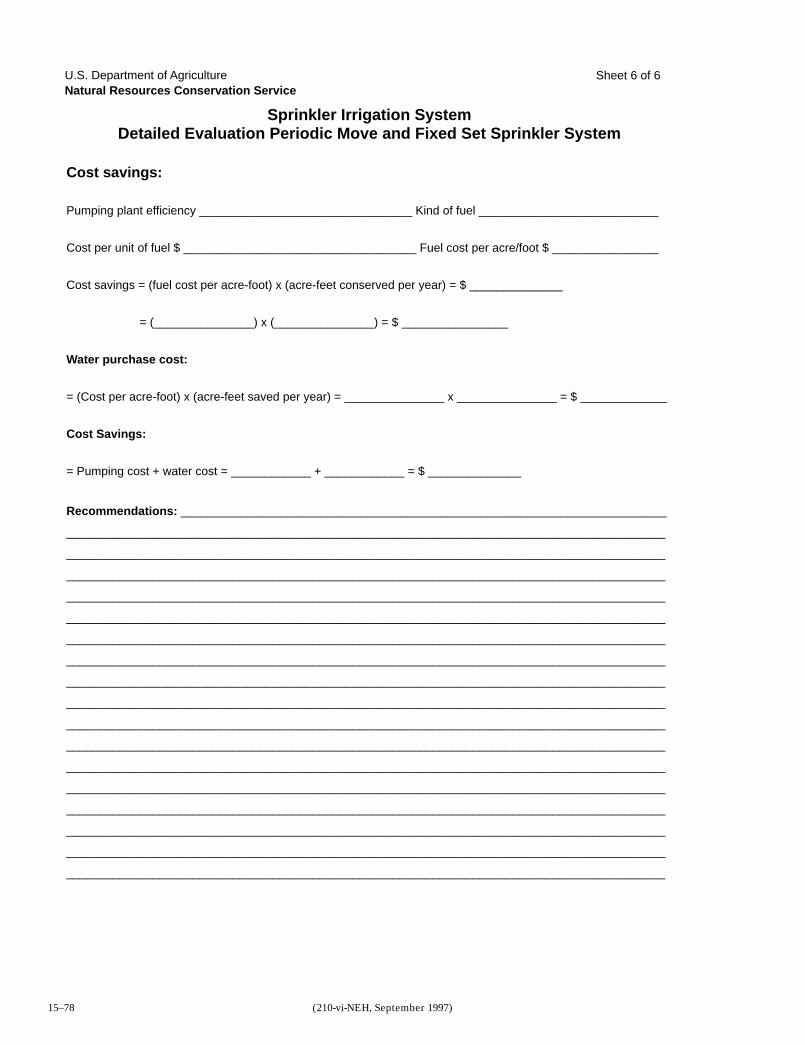
Part 652Irrigation Guide
Resource Planning and Evaluation
Tools and Worksheets
Chapter 15
15–78 (210-vi-NEH, September 1997)
Sprinkler Irrigation SystemDetailed Evaluation Periodic Move and Fixed Set Sprinkler System
U.S. Department of AgricultureNatural Resources Conservation Service
Cost savings:
Pumping plant efficiency ________________________________ Kind of fuel ___________________________
Cost per unit of fuel $ ___________________________________ Fuel cost per acre/foot $ ________________
Cost savings = (fuel cost per acre-foot) x (acre-feet conserved per year) = $ ______________
= (_______________) x (_______________) = $ ________________
Water purchase cost:
= (Cost per acre-foot) x (acre-feet saved per year) = _______________ x _______________ = $ _____________
Cost Savings:
= Pumping cost + water cost = ____________ + ____________ = $ ______________
Recommendations: _________________________________________________________________________
__________________________________________________________________________________________
__________________________________________________________________________________________
__________________________________________________________________________________________
__________________________________________________________________________________________
__________________________________________________________________________________________
__________________________________________________________________________________________
__________________________________________________________________________________________
__________________________________________________________________________________________
__________________________________________________________________________________________
__________________________________________________________________________________________
__________________________________________________________________________________________
__________________________________________________________________________________________
__________________________________________________________________________________________
__________________________________________________________________________________________
__________________________________________________________________________________________
__________________________________________________________________________________________
__________________________________________________________________________________________
Sheet 6 of 6
Part 652Irrigation Guide
Resource Planning and Evaluation
Tools and Worksheets
Chapter 15
15–79(210-vi-NEH, September 1997)
Lateral flow
Lateral move systemcatch can data
Land user ____________________Date ________________________Field office ___________________

Part 652Irrigation Guide
Resource Planning and Evaluation
Tools and Worksheets
Chapter 15
15–80 (210-vi-NEH, September 1997)
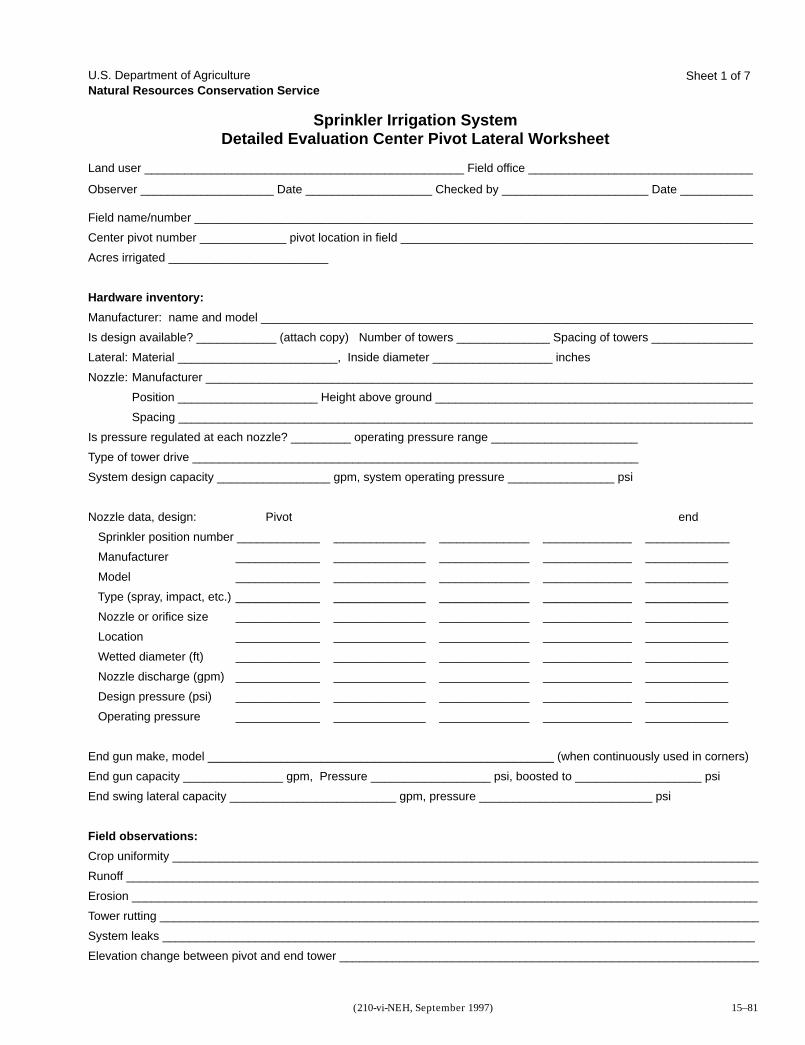
Part 652Irrigation Guide
Resource Planning and Evaluation
Tools and Worksheets
Chapter 15
15–81(210-vi-NEH, September 1997)
Land user ________________________________________________ Field office __________________________________
Observer ____________________ Date ___________________ Checked by ______________________ Date ___________
Sprinkler Irrigation SystemDetailed Evaluation Center Pivot Lateral Worksheet
U.S. Department of AgricultureNatural Resources Conservation Service
Field name/number ____________________________________________________________________________________
Center pivot number _____________ pivot location in field _____________________________________________________
Acres irrigated ________________________
Hardware inventory:
Manufacturer: name and model __________________________________________________________________________
Is design available? ____________ (attach copy) Number of towers ______________ Spacing of towers ________________
Lateral: Material ________________________, Inside diameter __________________ inches
Nozzle: Manufacturer ___________________________________________________________________________________
Position _____________________ Height above ground ________________________________________________
Spacing _______________________________________________________________________________________
Is pressure regulated at each nozzle? _________ operating pressure range ______________________
Type of tower drive ___________________________________________________________________
System design capacity _________________ gpm, system operating pressure ________________ psi
Nozzle data, design: Pivot end
Sprinkler position number __________________________________________________________________________
Manufacturer __________________________________________________________________________
Model __________________________________________________________________________
Type (spray, impact, etc.) __________________________________________________________________________
Nozzle or orifice size __________________________________________________________________________
Location __________________________________________________________________________
Wetted diameter (ft) __________________________________________________________________________
Nozzle discharge (gpm) __________________________________________________________________________
Design pressure (psi) __________________________________________________________________________
Operating pressure __________________________________________________________________________
End gun make, model ____________________________________________________ (when continuously used in corners)
End gun capacity _______________ gpm, Pressure __________________ psi, boosted to ___________________ psi
End swing lateral capacity _________________________ gpm, pressure __________________________ psi
Field observations:
Crop uniformity ________________________________________________________________________________________
Runoff _______________________________________________________________________________________________
Erosion ______________________________________________________________________________________________
Tower rutting __________________________________________________________________________________________
System leaks _________________________________________________________________________________________
Elevation change between pivot and end tower _______________________________________________________________
Sheet 1 of 7
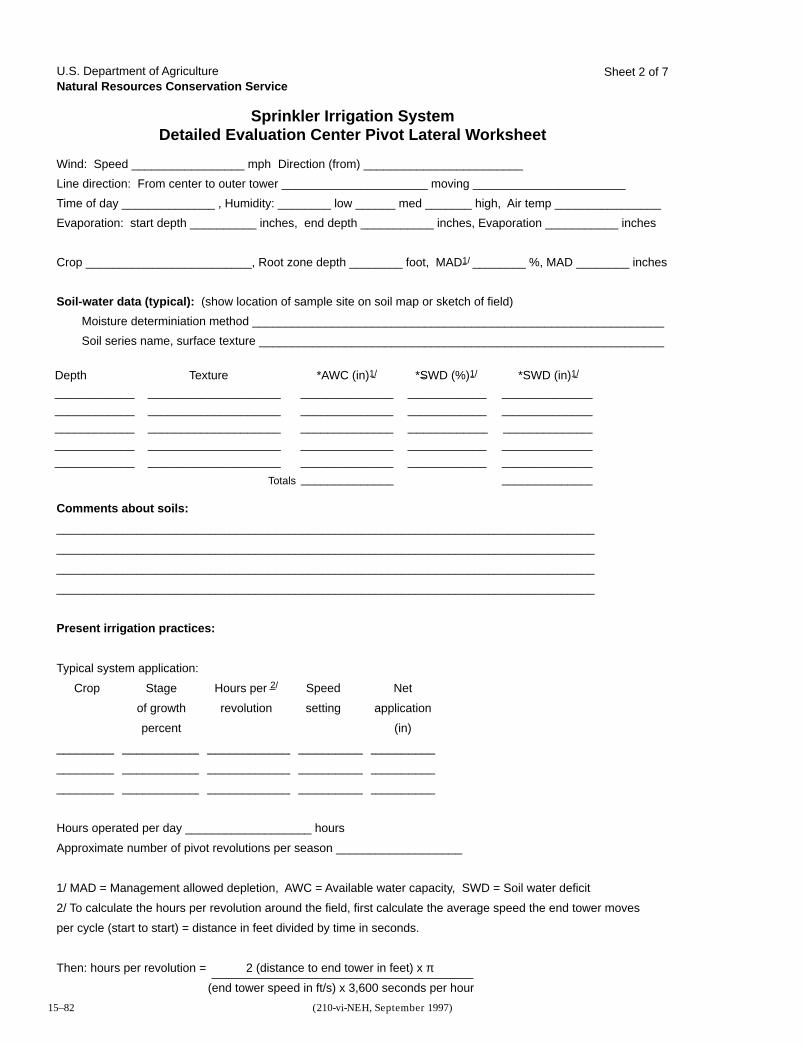
Part 652Irrigation Guide
Resource Planning and Evaluation
Tools and Worksheets
Chapter 15
15–82 (210-vi-NEH, September 1997)
Wind: Speed _________________ mph Direction (from) ________________________
Line direction: From center to outer tower ______________________ moving _______________________
Time of day ______________ , Humidity: ________ low ______ med _______ high, Air temp ________________
Evaporation: start depth __________ inches, end depth ___________ inches, Evaporation ___________ inches
Crop _________________________, Root zone depth ________ foot, MAD1/ ________ %, MAD ________ inches
Soil-water data (typical): (show location of sample site on soil map or sketch of field)
Moisture determiniation method ______________________________________________________________
Soil series name, surface texture _____________________________________________________________
Comments about soils:
_________________________________________________________________________________
_________________________________________________________________________________
_________________________________________________________________________________
_________________________________________________________________________________
Present irrigation practices:
Typical system application:
Crop Stage Hours per 2/ Speed Net
of growth revolution setting application
percent (in)
_________________________________________________________
_________________________________________________________
_________________________________________________________
Hours operated per day ___________________ hours
Approximate number of pivot revolutions per season ___________________
1/ MAD = Management allowed depletion, AWC = Available water capacity, SWD = Soil water deficit
2/ To calculate the hours per revolution around the field, first calculate the average speed the end tower moves
per cycle (start to start) = distance in feet divided by time in seconds.
Then: hours per revolution = 2 (distance to end tower in feet) x π
(end tower speed in ft/s) x 3,600 seconds per hour
Sprinkler Irrigation SystemDetailed Evaluation Center Pivot Lateral Worksheet
U.S. Department of AgricultureNatural Resources Conservation Service
Depth Texture *AWC (in)1/ *SWD (%)1/ *SWD (in)1/
____________ ____________________ ______________ ____________ __________________________ ____________________ ______________ ____________ __________________________ ____________________ ______________ _____________ __________________________ ____________________ ______________ ____________ __________________________ ____________________ ______________ ____________ ______________
______________ ______________Totals
Sheet 2 of 7
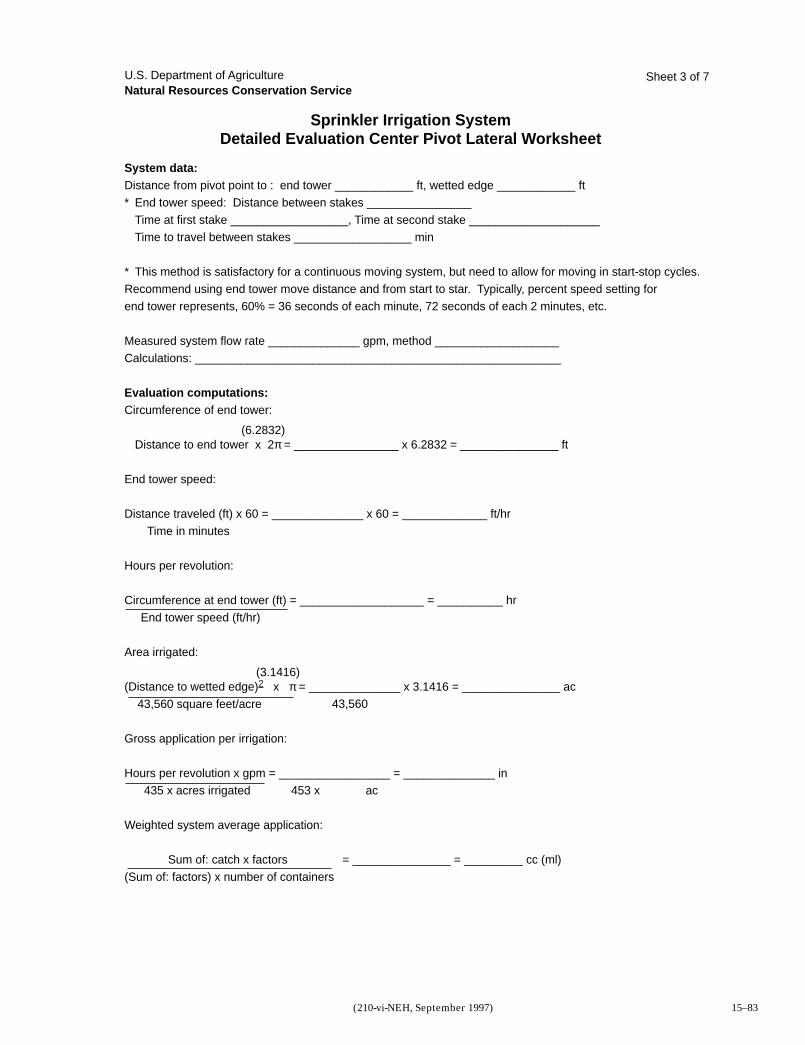
Part 652Irrigation Guide
Resource Planning and Evaluation
Tools and Worksheets
Chapter 15
15–83(210-vi-NEH, September 1997)
System data:Distance from pivot point to : end tower ____________ ft, wetted edge ____________ ft* End tower speed: Distance between stakes ________________
Time at first stake __________________, Time at second stake ____________________Time to travel between stakes __________________ min
* This method is satisfactory for a continuous moving system, but need to allow for moving in start-stop cycles.Recommend using end tower move distance and from start to star. Typically, percent speed setting forend tower represents, 60% = 36 seconds of each minute, 72 seconds of each 2 minutes, etc.
Measured system flow rate ______________ gpm, method ___________________Calculations: ________________________________________________________
Evaluation computations:Circumference of end tower:
Distance to end tower x 2π = ________________ x 6.2832 = _______________ ft
End tower speed:
Distance traveled (ft) x 60 = ______________ x 60 = _____________ ft/hr Time in minutes Hours per revolution:
Circumference at end tower (ft) = ___________________ = __________ hr End tower speed (ft/hr)
Area irrigated:
(Distance to wetted edge)2 x π = ______________ x 3.1416 = _______________ ac 43,560 square feet/acre
Gross application per irrigation:
Hours per revolution x gpm = _________________ = ______________ in 435 x acres irrigated 453 x ac
Weighted system average application:
Sum of: catch x factors = _______________ = _________ cc (ml)(Sum of: factors) x number of containers
Sprinkler Irrigation SystemDetailed Evaluation Center Pivot Lateral Worksheet
U.S. Department of AgricultureNatural Resources Conservation Service
(6.2832)
(3.1416)
43,560
Sheet 3 of 7
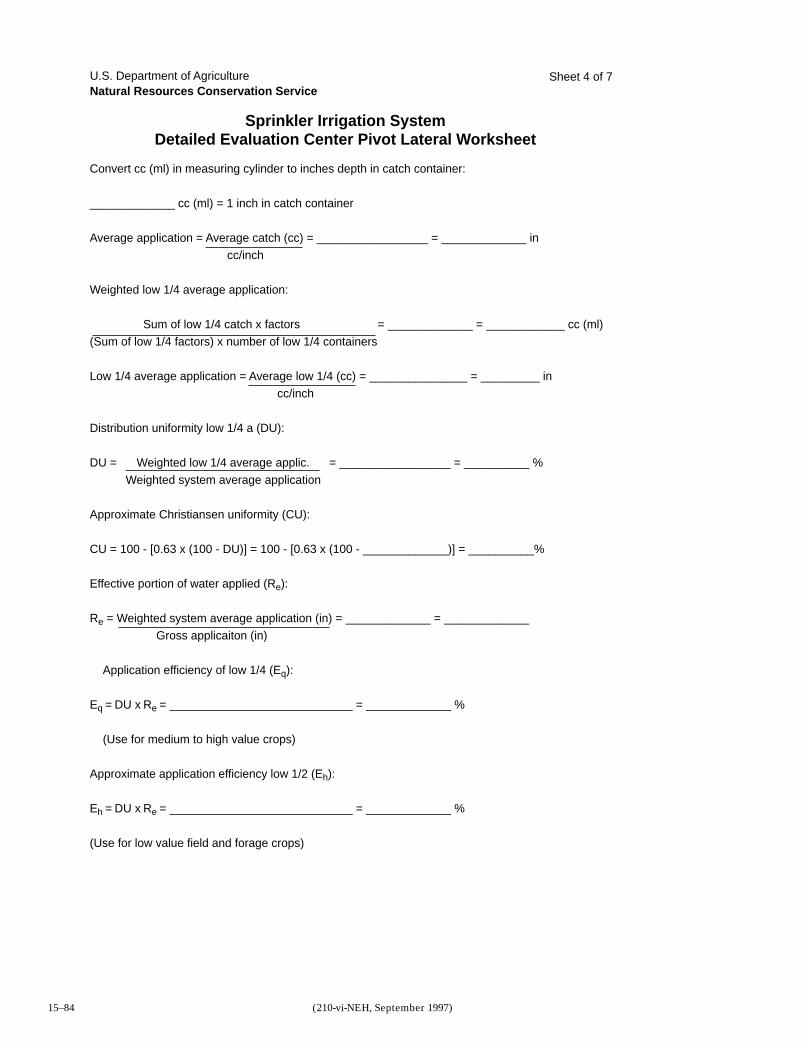
Part 652Irrigation Guide
Resource Planning and Evaluation
Tools and Worksheets
Chapter 15
15–84 (210-vi-NEH, September 1997)
Convert cc (ml) in measuring cylinder to inches depth in catch container:
_____________ cc (ml) = 1 inch in catch container
Average application = Average catch (cc) = _________________ = _____________ in cc/inch
Weighted low 1/4 average application:
Sum of low 1/4 catch x factors = _____________ = ____________ cc (ml)(Sum of low 1/4 factors) x number of low 1/4 containers
Low 1/4 average application = Average low 1/4 (cc) = _______________ = _________ in cc/inch
Distribution uniformity low 1/4 a (DU):
DU = Weighted low 1/4 average applic. = _________________ = __________ % Weighted system average application
Approximate Christiansen uniformity (CU):
CU = 100 - [0.63 x (100 - DU)] = 100 - [0.63 x (100 - _____________)] = __________%
Effective portion of water applied (Re):
Re = Weighted system average application (in) = _____________ = _____________ Gross applicaiton (in)
Application efficiency of low 1/4 (Eq):
Eq = DU x Re = ____________________________ = _____________ %
(Use for medium to high value crops)
Approximate application efficiency low 1/2 (Eh):
Eh = DU x Re = ____________________________ = _____________ %
(Use for low value field and forage crops)
Sprinkler Irrigation SystemDetailed Evaluation Center Pivot Lateral Worksheet
U.S. Department of AgricultureNatural Resources Conservation Service
Sheet 4 of 7
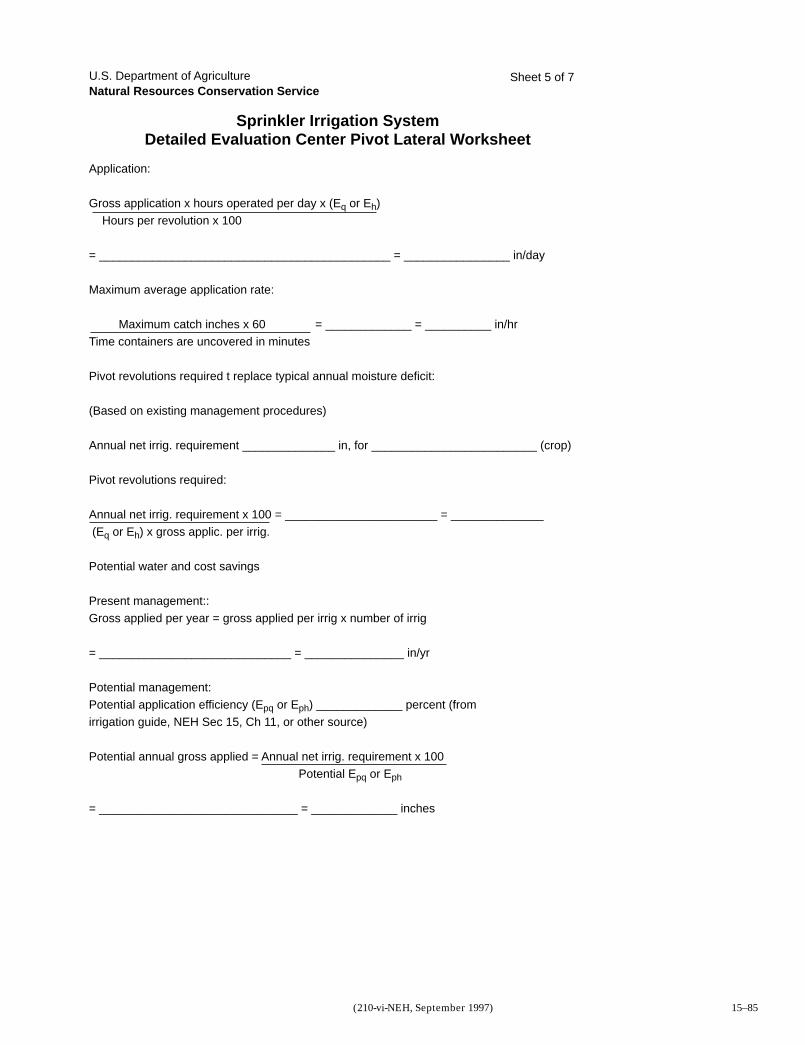
Part 652Irrigation Guide
Resource Planning and Evaluation
Tools and Worksheets
Chapter 15
15–85(210-vi-NEH, September 1997)
Application:
Gross application x hours operated per day x (Eq or Eh)Hours per revolution x 100
= ____________________________________________ = ________________ in/day
Maximum average application rate:
Maximum catch inches x 60 = _____________ = __________ in/hrTime containers are uncovered in minutes
Pivot revolutions required t replace typical annual moisture deficit:
(Based on existing management procedures)
Annual net irrig. requirement ______________ in, for _________________________ (crop)
Pivot revolutions required:
Annual net irrig. requirement x 100 = _______________________ = ______________ (Eq or Eh) x gross applic. per irrig.
Potential water and cost savings
Present management::Gross applied per year = gross applied per irrig x number of irrig
= _____________________________ = _______________ in/yr
Potential management:Potential application efficiency (Epq or Eph) _____________ percent (fromirrigation guide, NEH Sec 15, Ch 11, or other source)
Potential annual gross applied = Annual net irrig. requirement x 100 Potential Epq or Eph
= ______________________________ = _____________ inches
Sprinkler Irrigation SystemDetailed Evaluation Center Pivot Lateral Worksheet
U.S. Department of AgricultureNatural Resources Conservation Service
Sheet 5 of 7
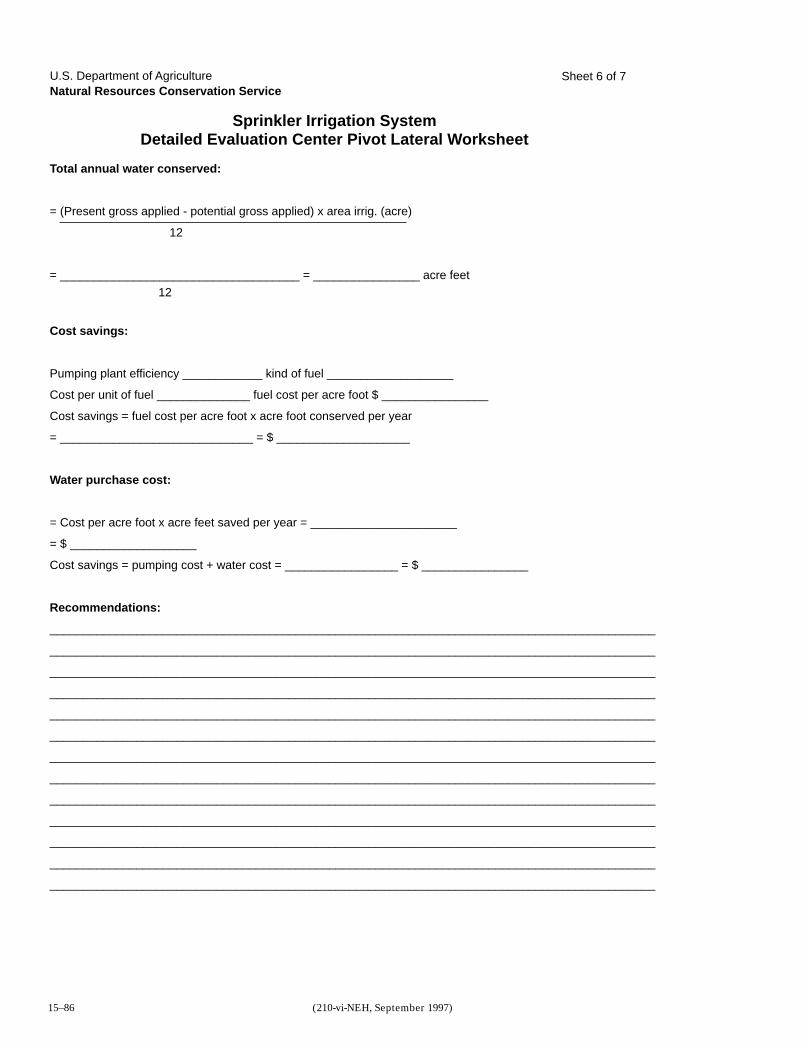
Part 652Irrigation Guide
Resource Planning and Evaluation
Tools and Worksheets
Chapter 15
15–86 (210-vi-NEH, September 1997)
Total annual water conserved:
= (Present gross applied - potential gross applied) x area irrig. (acre)
12
= ____________________________________ = ________________ acre feet 12
Cost savings:
Pumping plant efficiency ____________ kind of fuel ___________________
Cost per unit of fuel ______________ fuel cost per acre foot $ ________________
Cost savings = fuel cost per acre foot x acre foot conserved per year
= _____________________________ = $ ____________________
Water purchase cost:
= Cost per acre foot x acre feet saved per year = ______________________
= $ ___________________
Cost savings = pumping cost + water cost = _________________ = $ ________________
Recommendations:
___________________________________________________________________________________________
___________________________________________________________________________________________
___________________________________________________________________________________________
___________________________________________________________________________________________
___________________________________________________________________________________________
___________________________________________________________________________________________
___________________________________________________________________________________________
___________________________________________________________________________________________
___________________________________________________________________________________________
___________________________________________________________________________________________
___________________________________________________________________________________________
___________________________________________________________________________________________
___________________________________________________________________________________________
Sprinkler Irrigation SystemDetailed Evaluation Center Pivot Lateral Worksheet
U.S. Department of AgricultureNatural Resources Conservation Service
Sheet 6 of 7
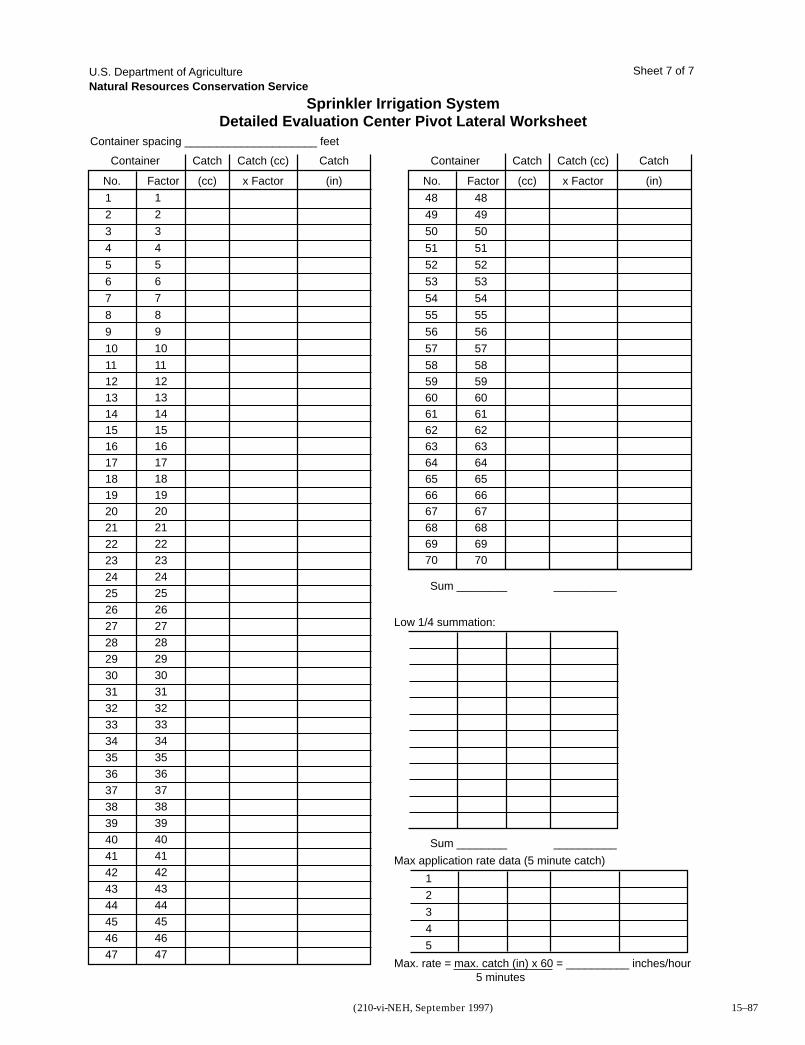
Part 652Irrigation Guide
Resource Planning and Evaluation
Tools and Worksheets
Chapter 15
15–87(210-vi-NEH, September 1997)
Container spacing _____________________ feet
No. Factor
Container Catch CatchCatch (cc)
(cc) (in)x Factor
Sprinkler Irrigation SystemDetailed Evaluation Center Pivot Lateral Worksheet
U.S. Department of AgricultureNatural Resources Conservation Service
1
2
3
4
5
6
7
8
9
10
11121314151617181920212223242526272829303132333435363738394041424344454647
1
2
3
4
5
6
7
8
9
10
11121314151617181920212223242526272829303132333435363738394041424344454647
No. Factor
Container Catch CatchCatch (cc)
(cc) (in)x Factor
48
49
50
51
52
53
54
55
56
57
58596061626364656667686970
48
49
50
51
52
53
54
55
56
57
58596061626364656667686970
1
2
3
4
5
Sum ________
Low 1/4 summation:
Max application rate data (5 minute catch)
Max. rate = max. catch (in) x 60 = __________ inches/hour 5 minutes
__________
Sum ________ __________
Sheet 7 of 7
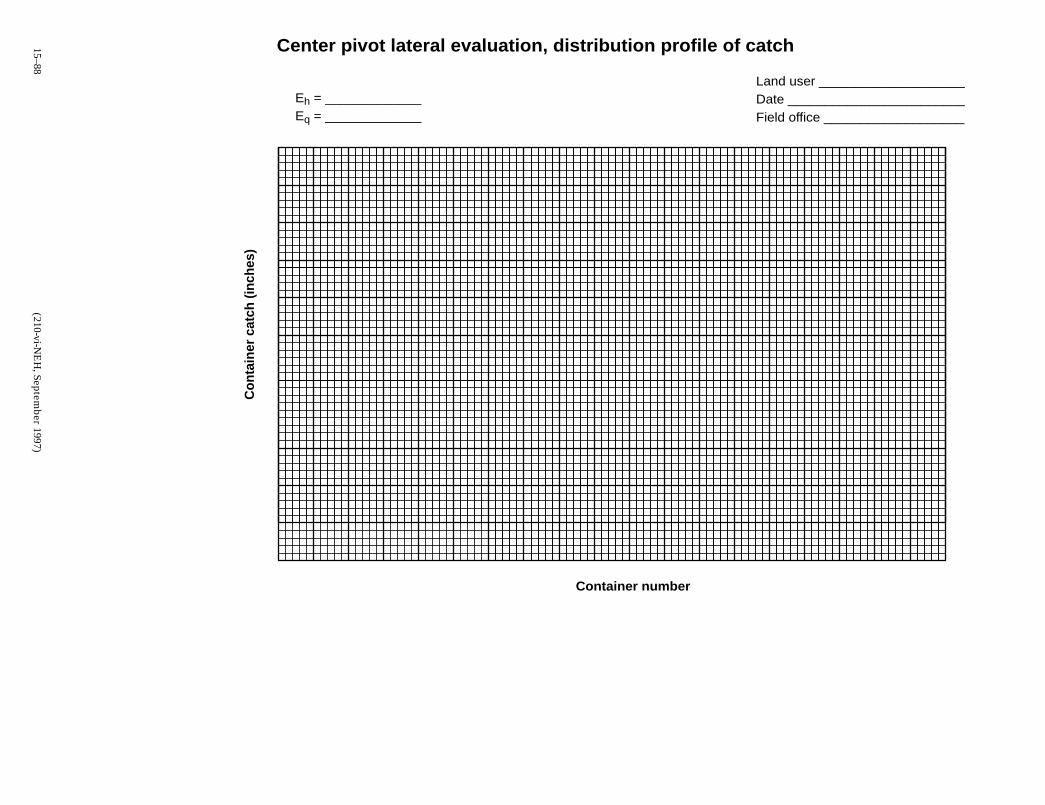
Part 652
Irrigation Guide
Reso
urce P
lan
nin
g a
nd
Evalu
atio
n
To
ols
an
d W
ork
sh
eets
Ch
ap
ter 1
5
15–88(210-vi-N
EH
, September 1997)
Center pivot lateral evaluation, distribution profile of catch
Eh = _____________Eq = _____________
Container number
Con
tain
er c
atch
(inc
hes)
Land user ____________________Date ________________________Field office ___________________
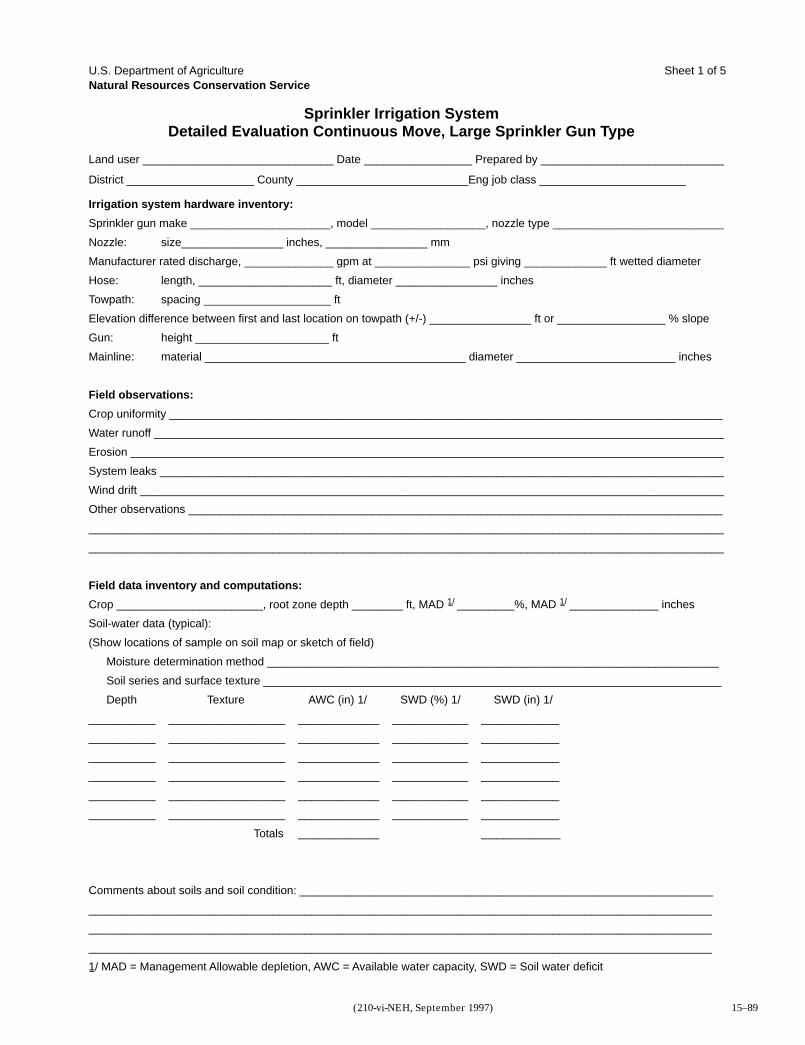
Part 652Irrigation Guide
Resource Planning and Evaluation
Tools and Worksheets
Chapter 15
15–89(210-vi-NEH, September 1997)
Land user ______________________________ Date _________________ Prepared by _____________________________
District ____________________ County ___________________________Eng job class _______________________
Sprinkler Irrigation SystemDetailed Evaluation Continuous Move, Large Sprinkler Gun Type
U.S. Department of AgricultureNatural Resources Conservation Service
Irrigation system hardware inventory:
Sprinkler gun make ______________________, model __________________, nozzle type ___________________________
Nozzle: size________________ inches, ________________ mm
Manufacturer rated discharge, ______________ gpm at _______________ psi giving _____________ ft wetted diameter
Hose: length, _____________________ ft, diameter ________________ inches
Towpath: spacing ____________________ ft
Elevation difference between first and last location on towpath (+/-) ________________ ft or _________________ % slope
Gun: height _____________________ ft
Mainline: material _________________________________________ diameter _________________________ inches
Field observations:
Crop uniformity _______________________________________________________________________________________
Water runoff __________________________________________________________________________________________
Erosion ______________________________________________________________________________________________
System leaks _________________________________________________________________________________________
Wind drift ____________________________________________________________________________________________
Other observations ____________________________________________________________________________________
____________________________________________________________________________________________________
____________________________________________________________________________________________________
Field data inventory and computations:
Crop _______________________, root zone depth ________ ft, MAD 1/ _________%, MAD 1/ ______________ inches
Soil-water data (typical):
(Show locations of sample on soil map or sketch of field)
Moisture determination method _______________________________________________________________________
Soil series and surface texture ________________________________________________________________________
Depth Texture AWC (in) 1/ SWD (%) 1/ SWD (in) 1/
__________________________________________________________________________
__________________________________________________________________________
__________________________________________________________________________
__________________________________________________________________________
__________________________________________________________________________
__________________________________________________________________________
______________ _____________
Comments about soils and soil condition: _________________________________________________________________
__________________________________________________________________________________________________
__________________________________________________________________________________________________
__________________________________________________________________________________________________
1/ MAD = Management Allowable depletion, AWC = Available water capacity, SWD = Soil water deficit
Totals
Sheet 1 of 5
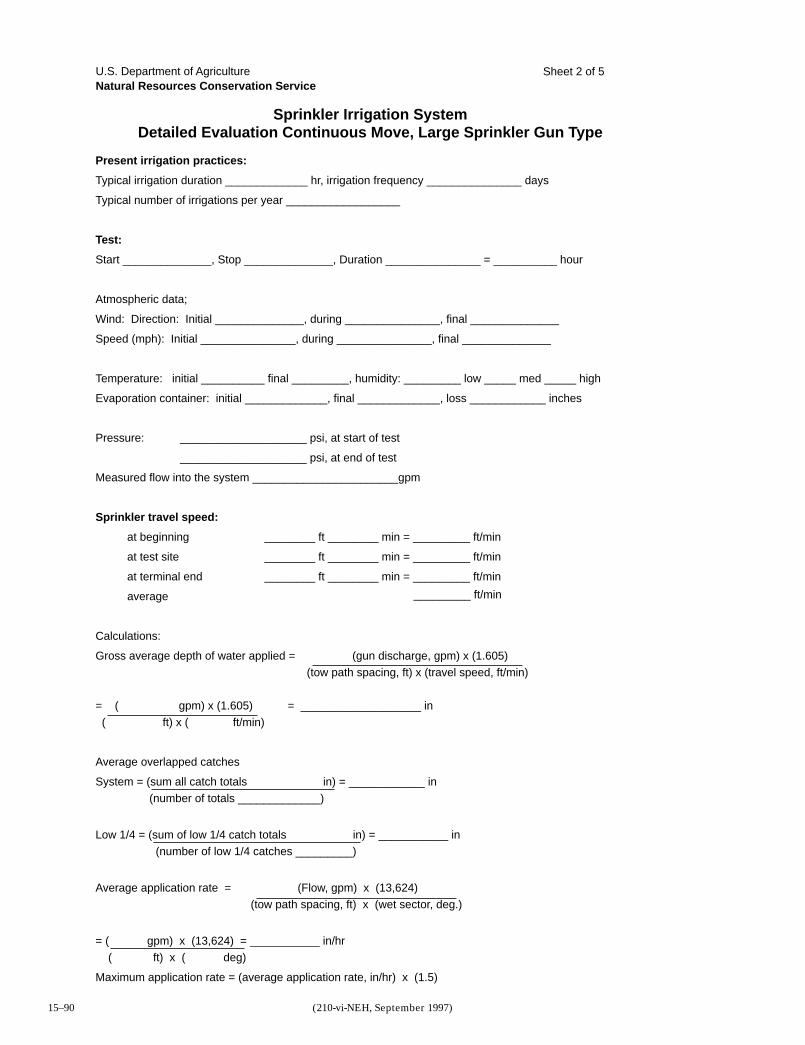
Part 652Irrigation Guide
Resource Planning and Evaluation
Tools and Worksheets
Chapter 15
15–90 (210-vi-NEH, September 1997)
Present irrigation practices:
Typical irrigation duration _____________ hr, irrigation frequency _______________ days
Typical number of irrigations per year __________________
Test:
Start ______________, Stop ______________, Duration _______________ = __________ hour
Atmospheric data;
Wind: Direction: Initial ______________, during _______________, final ______________
Speed (mph): Initial _______________, during _______________, final ______________
Temperature: initial __________ final _________, humidity: _________ low _____ med _____ high
Evaporation container: initial _____________, final _____________, loss ____________ inches
Pressure: ____________________ psi, at start of test
____________________ psi, at end of test
Measured flow into the system _______________________gpm
Sprinkler travel speed:
at beginning ________ ft ________ min = _________ ft/min
at test site ________ ft ________ min = _________ ft/min
at terminal end ________ ft ________ min = _________ ft/min
average
Calculations:
Gross average depth of water applied = (gun discharge, gpm) x (1.605)(tow path spacing, ft) x (travel speed, ft/min)
= ( gpm) x (1.605) = ___________________ in ( ft) x ( ft/min)
Average overlapped catches
System = (sum all catch totals in) = ____________ in (number of totals _____________)
Low 1/4 = (sum of low 1/4 catch totals in) = ___________ in (number of low 1/4 catches _________)
Average application rate = (Flow, gpm) x (13,624) (tow path spacing, ft) x (wet sector, deg.)
= ( gpm) x (13,624) = ___________ in/hr ( ft) x ( deg)
Maximum application rate = (average application rate, in/hr) x (1.5)
Sprinkler Irrigation SystemDetailed Evaluation Continuous Move, Large Sprinkler Gun Type
U.S. Department of AgricultureNatural Resources Conservation Service
_________ ft/min
Sheet 2 of 5
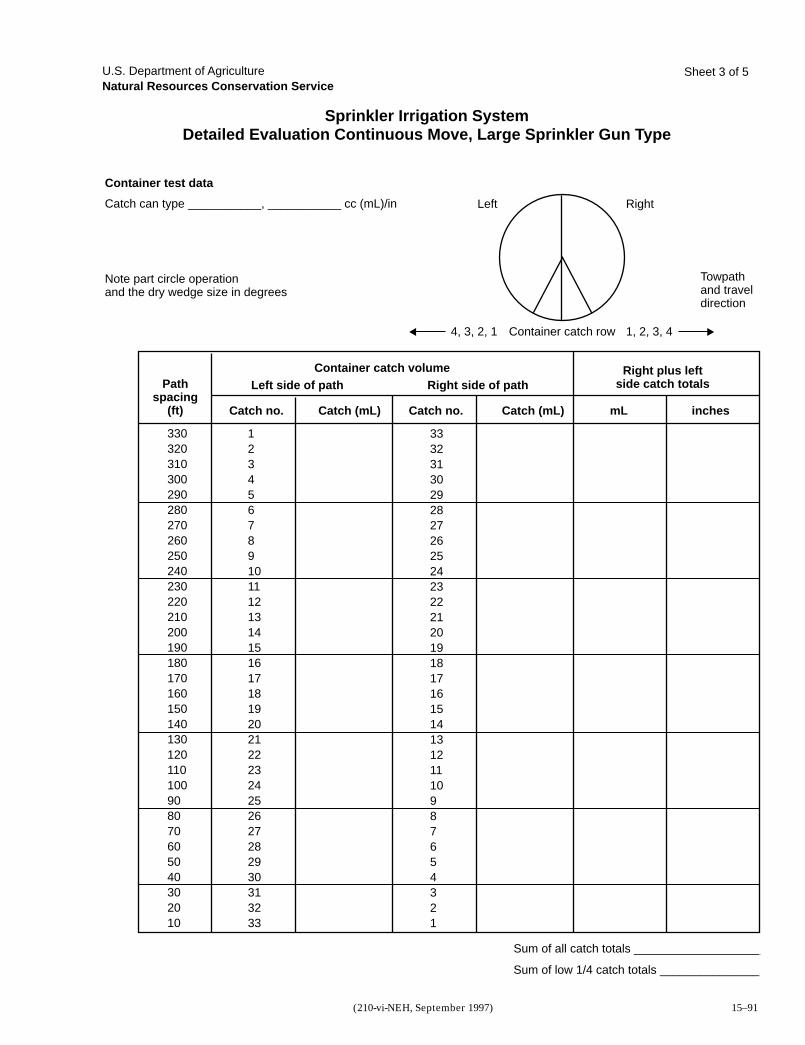
Part 652Irrigation Guide
Resource Planning and Evaluation
Tools and Worksheets
Chapter 15
15–91(210-vi-NEH, September 1997)
Sprinkler Irrigation SystemDetailed Evaluation Continuous Move, Large Sprinkler Gun Type
U.S. Department of AgricultureNatural Resources Conservation Service
Container test data
Catch can type ___________, ___________ cc (mL)/in
Note part circle operationand the dry wedge size in degrees
Left Right
4, 3, 2, 1 1, 2, 3, 4
Towpath and traveldirection
Container catch row
Pathspacing
(ft)
Container catch volume Right plus leftside catch totals Left side of path Right side of path
330320310300290280270260250240230220210200190180170160150140130120110100908070605040302010
123456789101112131415161718192021222324252627282930313233
333231302928272625242322212019181716151413121110987654321
Catch no. Catch (mL) Catch (mL) mL inchesCatch no.
Sum of all catch totals ___________________
Sum of low 1/4 catch totals _______________
Sheet 3 of 5
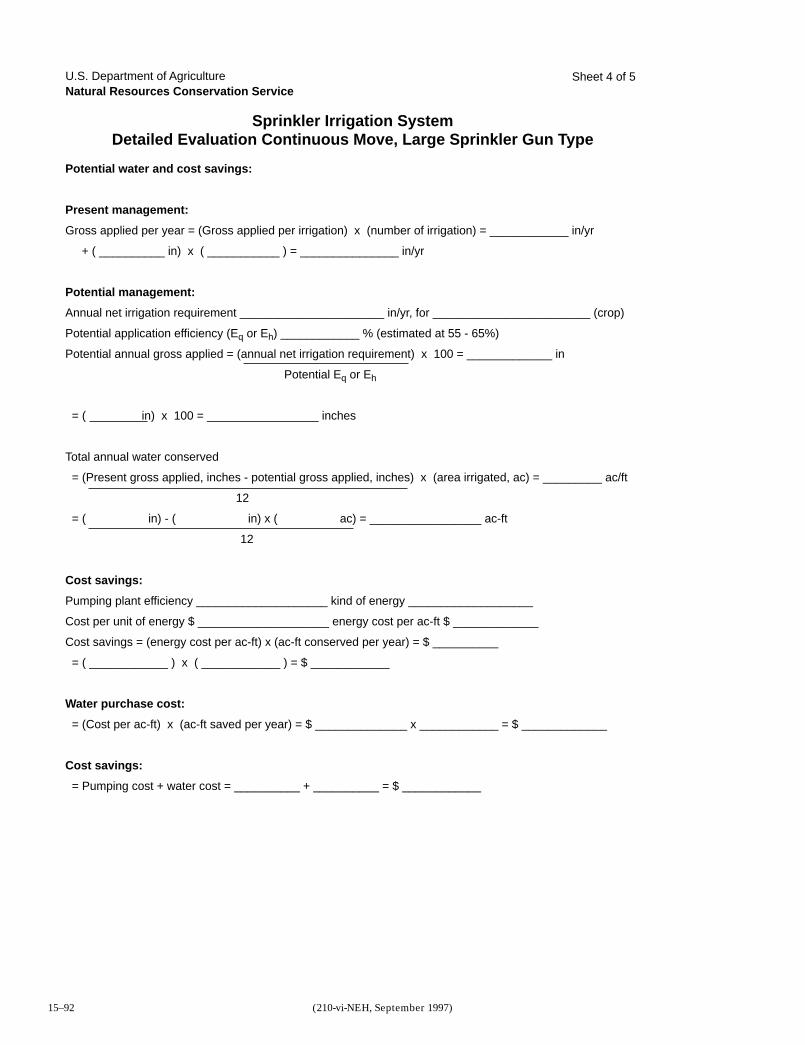
Part 652Irrigation Guide
Resource Planning and Evaluation
Tools and Worksheets
Chapter 15
15–92 (210-vi-NEH, September 1997)
Potential water and cost savings:
Present management:
Gross applied per year = (Gross applied per irrigation) x (number of irrigation) = ____________ in/yr
+ ( __________ in) x ( ___________ ) = _______________ in/yr
Potential management:
Annual net irrigation requirement ______________________ in/yr, for ________________________ (crop)
Potential application efficiency (Eq or Eh) ____________ % (estimated at 55 - 65%)
Potential annual gross applied = (annual net irrigation requirement) x 100 = _____________ in
Potential Eq or Eh
= ( in) x 100 = _________________ inches
Total annual water conserved
= (Present gross applied, inches - potential gross applied, inches) x (area irrigated, ac) = _________ ac/ft
12
= ( in) - ( in) x ( ac) = _________________ ac-ft
12
Cost savings:
Pumping plant efficiency ____________________ kind of energy ___________________
Cost per unit of energy $ ____________________ energy cost per ac-ft $ _____________
Cost savings = (energy cost per ac-ft) x (ac-ft conserved per year) = $ __________
= ( ____________ ) x ( ____________ ) = $ ____________
Water purchase cost:
= (Cost per ac-ft) x (ac-ft saved per year) = $ ______________ x ____________ = $ _____________
Cost savings:
= Pumping cost + water cost = __________ + __________ = $ ____________
Sprinkler Irrigation SystemDetailed Evaluation Continuous Move, Large Sprinkler Gun Type
U.S. Department of AgricultureNatural Resources Conservation Service
Sheet 4 of 5
Part 652Irrigation Guide
Resource Planning and Evaluation
Tools and Worksheets
Chapter 15
15–93(210-vi-NEH, September 1997)
Recommendations:
________________________________________________________________________________________________________
________________________________________________________________________________________________________
________________________________________________________________________________________________________
________________________________________________________________________________________________________
________________________________________________________________________________________________________
________________________________________________________________________________________________________
________________________________________________________________________________________________________
________________________________________________________________________________________________________
________________________________________________________________________________________________________
________________________________________________________________________________________________________
________________________________________________________________________________________________________
________________________________________________________________________________________________________
________________________________________________________________________________________________________
________________________________________________________________________________________________________
________________________________________________________________________________________________________
________________________________________________________________________________________________________
________________________________________________________________________________________________________
________________________________________________________________________________________________________
________________________________________________________________________________________________________
________________________________________________________________________________________________________
________________________________________________________________________________________________________
________________________________________________________________________________________________________
________________________________________________________________________________________________________
________________________________________________________________________________________________________
________________________________________________________________________________________________________
________________________________________________________________________________________________________
________________________________________________________________________________________________________
________________________________________________________________________________________________________
________________________________________________________________________________________________________
Example - Sprinkler Irrigation SystemDetailed Evaluation Continuous Move, Large Sprinkler Gun Type
U.S. Department of AgricultureNatural Resources Conservation Service
Sheet 5 of 5

Part 652Irrigation Guide
Resource Planning and Evaluation
Tools and Worksheets
Chapter 15
15–94 (210-vi-NEH, September 1997)
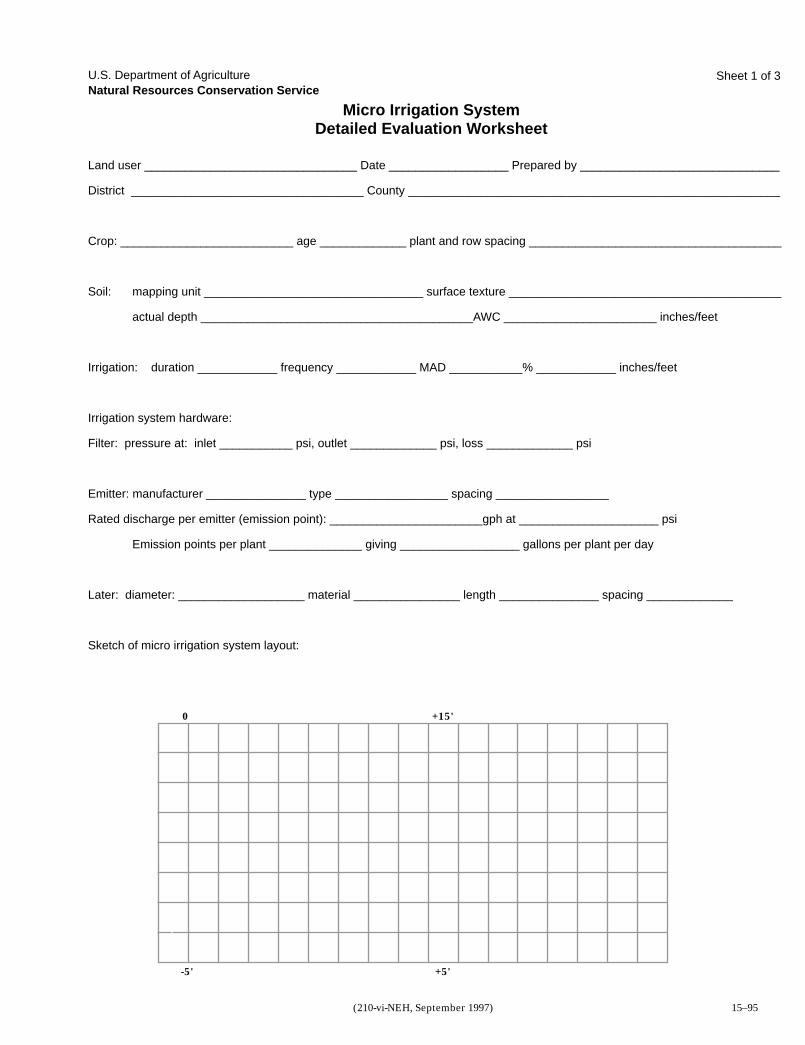
Part 652Irrigation Guide
Resource Planning and Evaluation
Tools and Worksheets
Chapter 15
15–95(210-vi-NEH, September 1997)
Land user ________________________________ Date __________________ Prepared by ______________________________
District ___________________________________ County ________________________________________________________
Crop: __________________________ age _____________ plant and row spacing ______________________________________
Soil: mapping unit _________________________________ surface texture _________________________________________
actual depth _________________________________________AWC _______________________ inches/feet
Irrigation: duration ____________ frequency ____________ MAD ___________% ____________ inches/feet
Irrigation system hardware:
Filter: pressure at: inlet ___________ psi, outlet _____________ psi, loss _____________ psi
Emitter: manufacturer _______________ type _________________ spacing _________________
Rated discharge per emitter (emission point): _______________________gph at _____________________ psi
Emission points per plant ______________ giving __________________ gallons per plant per day
Later: diameter: ___________________ material ________________ length _______________ spacing _____________
Sketch of micro irrigation system layout:
Micro Irrigation SystemDetailed Evaluation Worksheet
U.S. Department of AgricultureNatural Resources Conservation Service
0 +15'
+5'-5'
Sheet 1 of 3
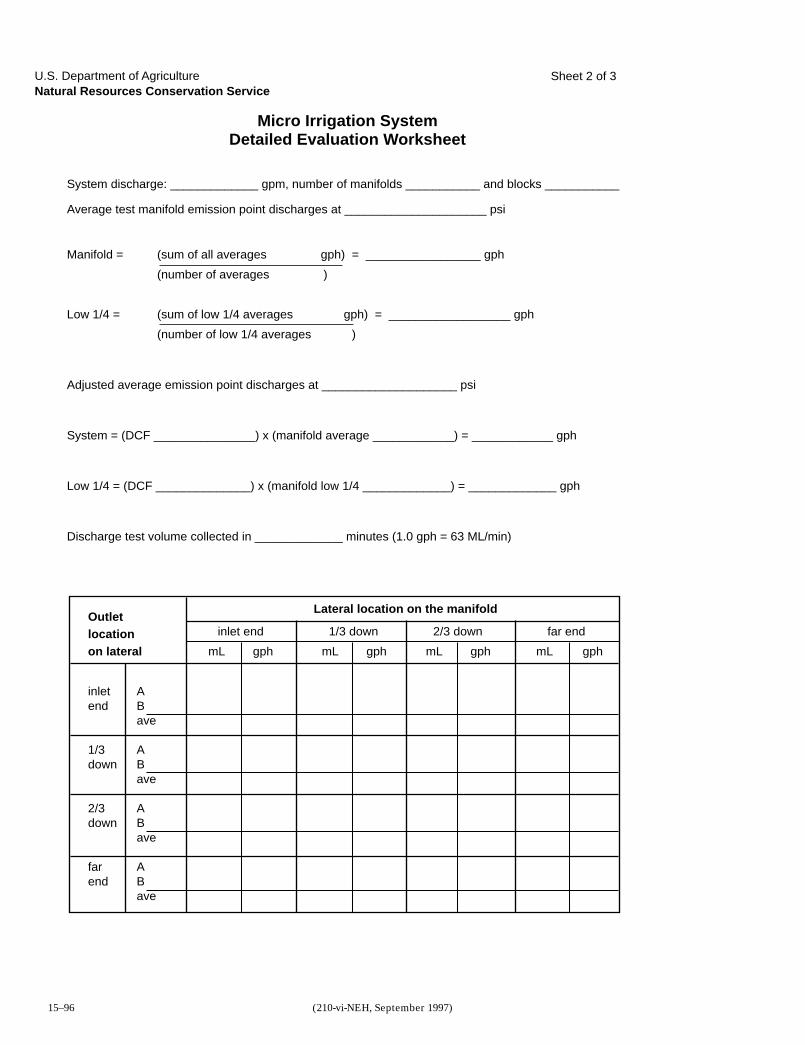
Part 652Irrigation Guide
Resource Planning and Evaluation
Tools and Worksheets
Chapter 15
15–96 (210-vi-NEH, September 1997)
System discharge: _____________ gpm, number of manifolds ___________ and blocks ___________
Average test manifold emission point discharges at _____________________ psi
Manifold = (sum of all averages gph) = _________________ gph
(number of averages )
Low 1/4 = (sum of low 1/4 averages gph) = __________________ gph
(number of low 1/4 averages )
Adjusted average emission point discharges at ____________________ psi
System = (DCF _______________) x (manifold average ____________) = ____________ gph
Low 1/4 = (DCF ______________) x (manifold low 1/4 _____________) = _____________ gph
Discharge test volume collected in _____________ minutes (1.0 gph = 63 ML/min)
Micro Irrigation SystemDetailed Evaluation Worksheet
U.S. Department of AgricultureNatural Resources Conservation Service
Outletlocationon lateral mL gph
inlet end
mL gph
1/3 down
mL gph
2/3 down
mL gph
far end
inletend
1/3down
2/3down
farend
ABave
ABave
ABave
ABave
Lateral location on the manifold
Sheet 2 of 3
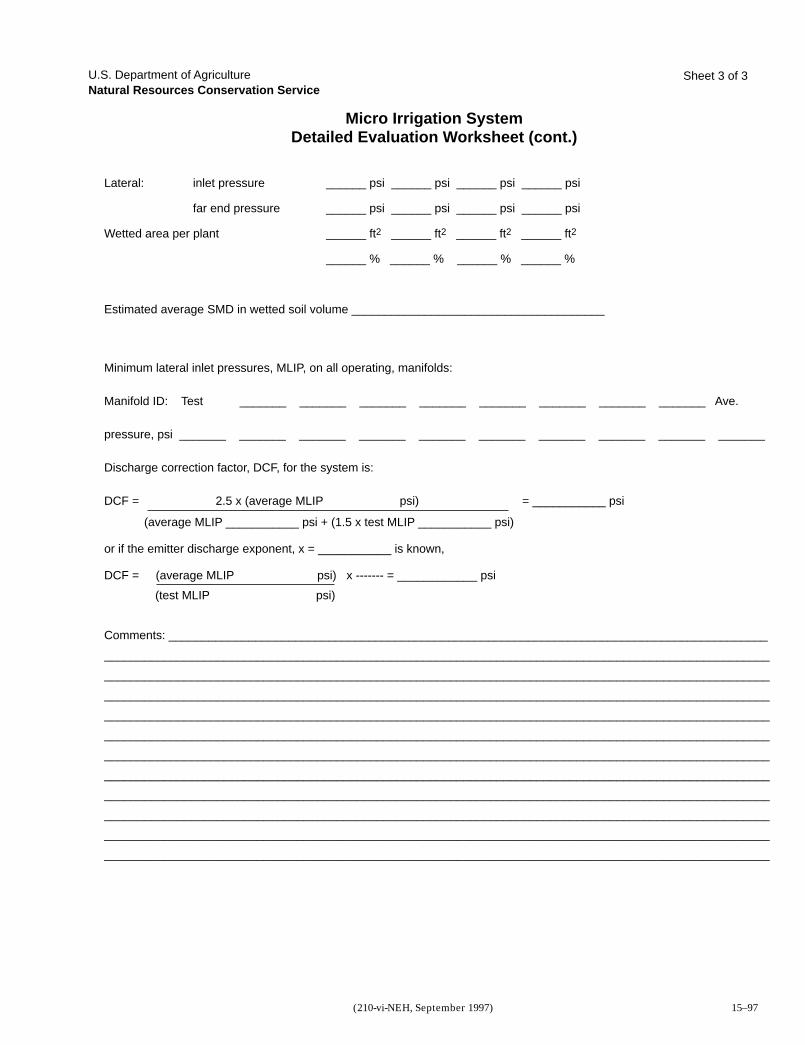
Part 652Irrigation Guide
Resource Planning and Evaluation
Tools and Worksheets
Chapter 15
15–97(210-vi-NEH, September 1997)
Lateral: inlet pressure ______ psi ______ psi ______ psi ______ psi
far end pressure ______ psi ______ psi ______ psi ______ psi
Wetted area per plant ______ ft2 ______ ft2 ______ ft2 ______ ft2
______ % ______ % ______ % ______ %
Estimated average SMD in wetted soil volume ______________________________________
Minimum lateral inlet pressures, MLIP, on all operating, manifolds:
Manifold ID: Test _______ _______ _______ _______ _______ _______ _______ _______ Ave.
pressure, psi _______ _______ _______ _______ _______ _______ _______ _______ _______ _______
Discharge correction factor, DCF, for the system is:
DCF = 2.5 x (average MLIP psi) = ___________ psi
(average MLIP ___________ psi + (1.5 x test MLIP ___________ psi)
or if the emitter discharge exponent, x = ___________ is known,
DCF = (average MLIP psi) x ------- = ____________ psi
(test MLIP psi)
Comments: __________________________________________________________________________________________
____________________________________________________________________________________________________
____________________________________________________________________________________________________
____________________________________________________________________________________________________
____________________________________________________________________________________________________
____________________________________________________________________________________________________
____________________________________________________________________________________________________
____________________________________________________________________________________________________
____________________________________________________________________________________________________
____________________________________________________________________________________________________
____________________________________________________________________________________________________
____________________________________________________________________________________________________
Micro Irrigation SystemDetailed Evaluation Worksheet (cont.)
U.S. Department of AgricultureNatural Resources Conservation Service
Sheet 3 of 3

Part 652Irrigation Guide
Resource Planning and Evaluation
Tools and Worksheets
Chapter 15
15–98 (210-vi-NEH, September 1997)
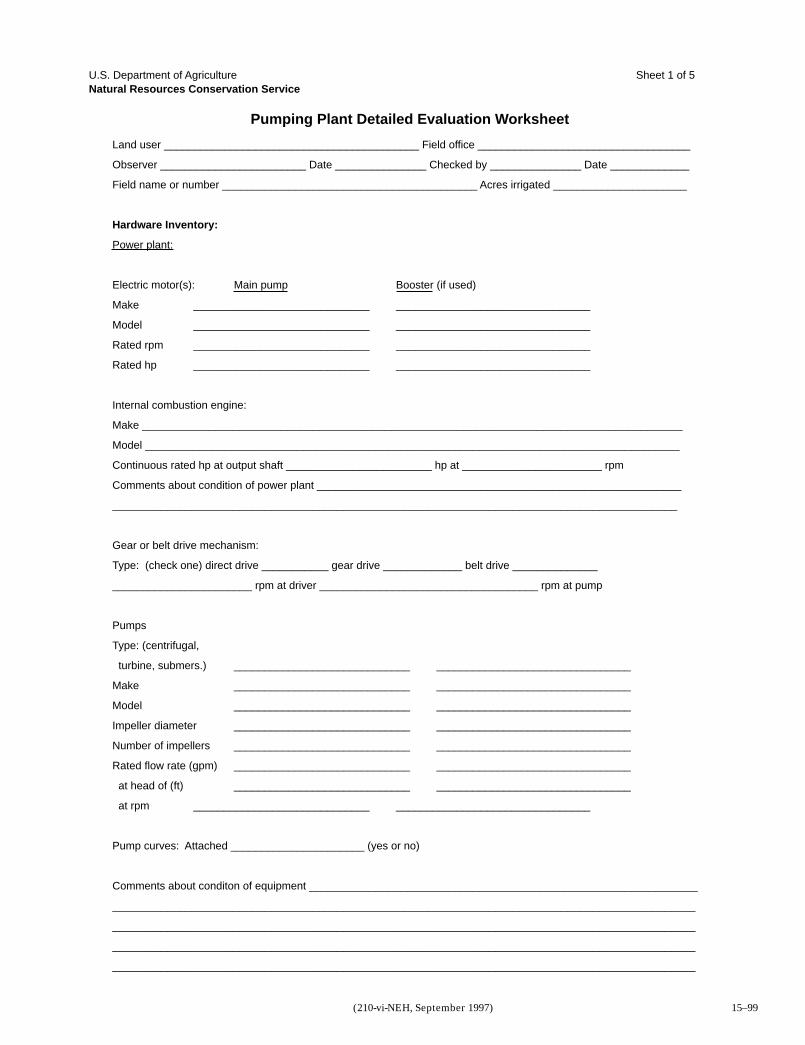
Part 652Irrigation Guide
Resource Planning and Evaluation
Tools and Worksheets
Chapter 15
15–99(210-vi-NEH, September 1997)
Land user __________________________________________ Field office ___________________________________
Observer ________________________ Date _______________ Checked by _______________ Date _____________
Field name or number __________________________________________ Acres irrigated ______________________
Hardware Inventory:
Power plant:
Electric motor(s): Main pump Booster (if used)
Make _____________________________ ________________________________
Model _____________________________ ________________________________
Rated rpm _____________________________ ________________________________
Rated hp _____________________________ ________________________________
Internal combustion engine:
Make _________________________________________________________________________________________
Model ________________________________________________________________________________________
Continuous rated hp at output shaft ________________________ hp at _______________________ rpm
Comments about condition of power plant ____________________________________________________________
_____________________________________________________________________________________________
Gear or belt drive mechanism:
Type: (check one) direct drive ___________ gear drive _____________ belt drive ______________
_______________________ rpm at driver ____________________________________ rpm at pump
Pumps
Type: (centrifugal,
turbine, submers.) _____________________________ ________________________________
Make _____________________________ ________________________________
Model _____________________________ ________________________________
Impeller diameter _____________________________ ________________________________
Number of impellers _____________________________ ________________________________
Rated flow rate (gpm) _____________________________ ________________________________
at head of (ft) _____________________________ ________________________________
at rpm _____________________________ ________________________________
Pump curves: Attached ______________________ (yes or no)
Comments about conditon of equipment ________________________________________________________________
________________________________________________________________________________________________
________________________________________________________________________________________________
________________________________________________________________________________________________
________________________________________________________________________________________________
Pumping Plant Detailed Evaluation Worksheet
U.S. Department of AgricultureNatural Resources Conservation Service
Sheet 1 of 5
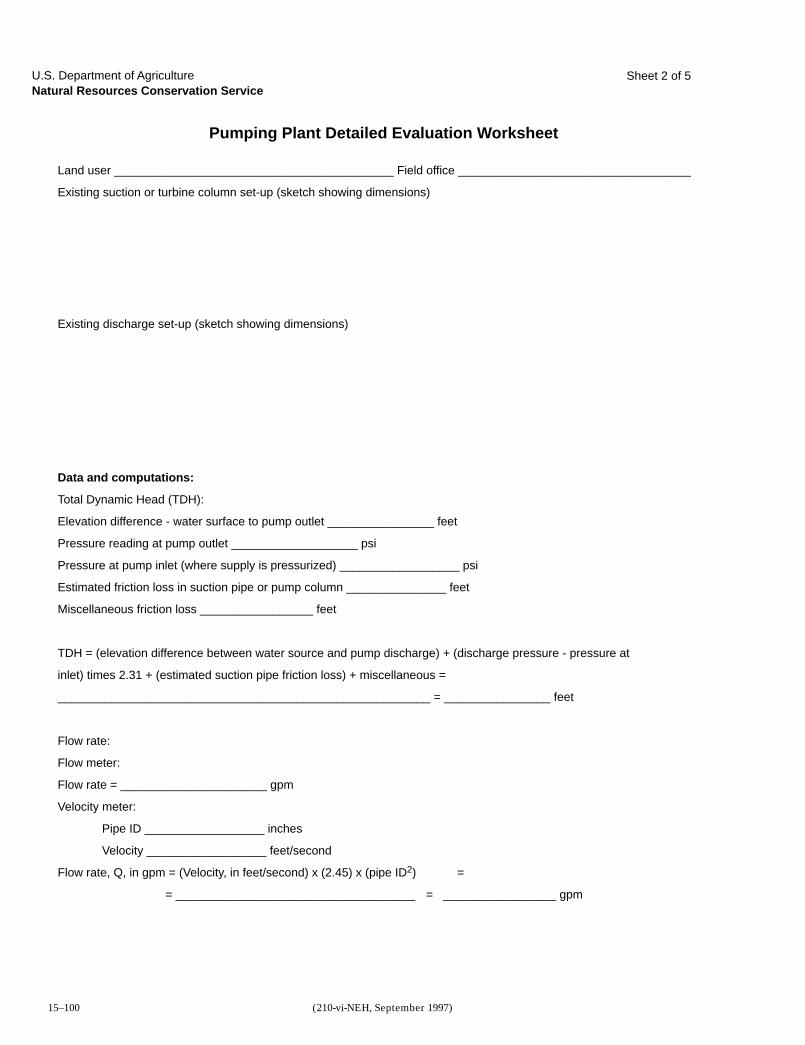
Part 652Irrigation Guide
Resource Planning and Evaluation
Tools and Worksheets
Chapter 15
15–100 (210-vi-NEH, September 1997)
Land user __________________________________________ Field office ___________________________________
Existing suction or turbine column set-up (sketch showing dimensions)
Existing discharge set-up (sketch showing dimensions)
Data and computations:
Total Dynamic Head (TDH):
Elevation difference - water surface to pump outlet ________________ feet
Pressure reading at pump outlet ___________________ psi
Pressure at pump inlet (where supply is pressurized) __________________ psi
Estimated friction loss in suction pipe or pump column _______________ feet
Miscellaneous friction loss _________________ feet
TDH = (elevation difference between water source and pump discharge) + (discharge pressure - pressure at
inlet) times 2.31 + (estimated suction pipe friction loss) + miscellaneous =
________________________________________________________ = ________________ feet
Flow rate:
Flow meter:
Flow rate = ______________________ gpm
Velocity meter:
Pipe ID __________________ inches
Velocity __________________ feet/second
Flow rate, Q, in gpm = (Velocity, in feet/second) x (2.45) x (pipe ID2) =
= ____________________________________ = _________________ gpm
Pumping Plant Detailed Evaluation Worksheet
U.S. Department of AgricultureNatural Resources Conservation Service
Sheet 2 of 5
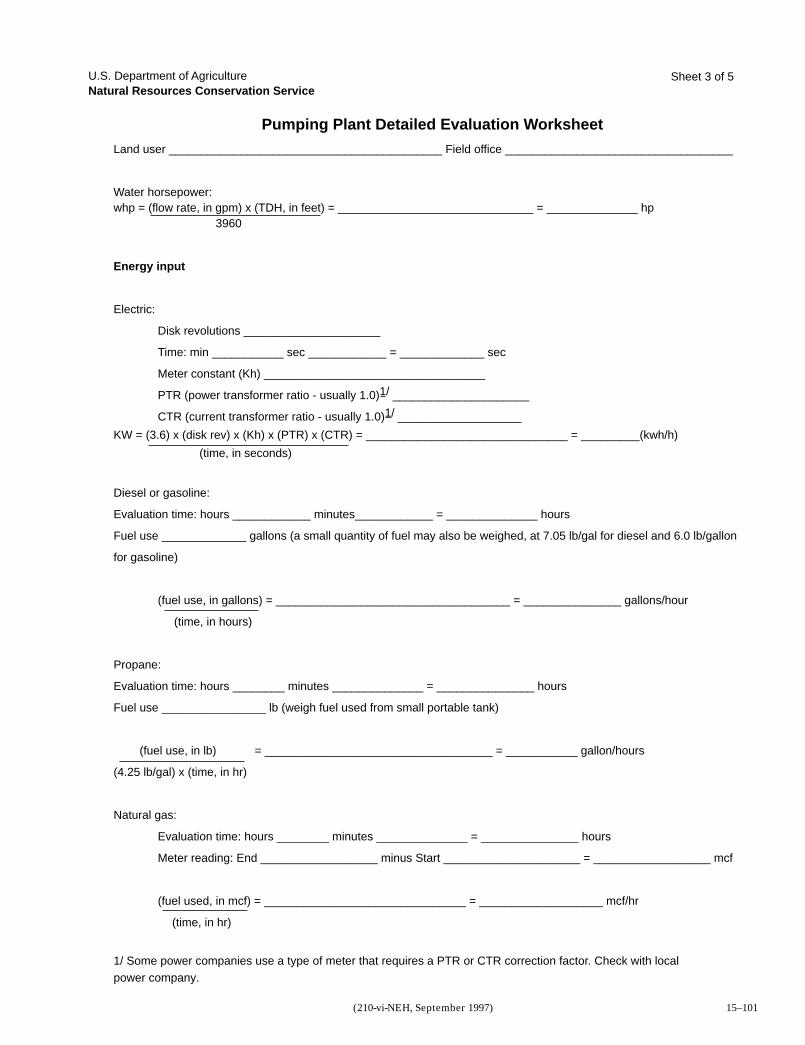
Part 652Irrigation Guide
Resource Planning and Evaluation
Tools and Worksheets
Chapter 15
15–101(210-vi-NEH, September 1997)
Land user __________________________________________ Field office ___________________________________
Water horsepower:whp = (flow rate, in gpm) x (TDH, in feet) = ______________________________ = ______________ hp
3960
Energy input
Electric:
Disk revolutions _____________________
Time: min ___________ sec ____________ = _____________ sec
Meter constant (Kh) __________________________________
PTR (power transformer ratio - usually 1.0)1/ _____________________
CTR (current transformer ratio - usually 1.0)1/ ___________________
KW = (3.6) x (disk rev) x (Kh) x (PTR) x (CTR) = _______________________________ = _________(kwh/h)
(time, in seconds)
Diesel or gasoline:
Evaluation time: hours ____________ minutes____________ = ______________ hours
Fuel use _____________ gallons (a small quantity of fuel may also be weighed, at 7.05 lb/gal for diesel and 6.0 lb/gallon
for gasoline)
(fuel use, in gallons) = ____________________________________ = _______________ gallons/hour
(time, in hours)
Propane:
Evaluation time: hours ________ minutes ______________ = _______________ hours
Fuel use ________________ lb (weigh fuel used from small portable tank)
(fuel use, in lb) = ___________________________________ = ___________ gallon/hours
(4.25 lb/gal) x (time, in hr)
Natural gas:
Evaluation time: hours ________ minutes ______________ = _______________ hours
Meter reading: End __________________ minus Start _____________________ = __________________ mcf
(fuel used, in mcf) = _______________________________ = ___________________ mcf/hr
(time, in hr)
1/ Some power companies use a type of meter that requires a PTR or CTR correction factor. Check with localpower company.
Pumping Plant Detailed Evaluation Worksheet
U.S. Department of AgricultureNatural Resources Conservation Service
Sheet 3 of 5
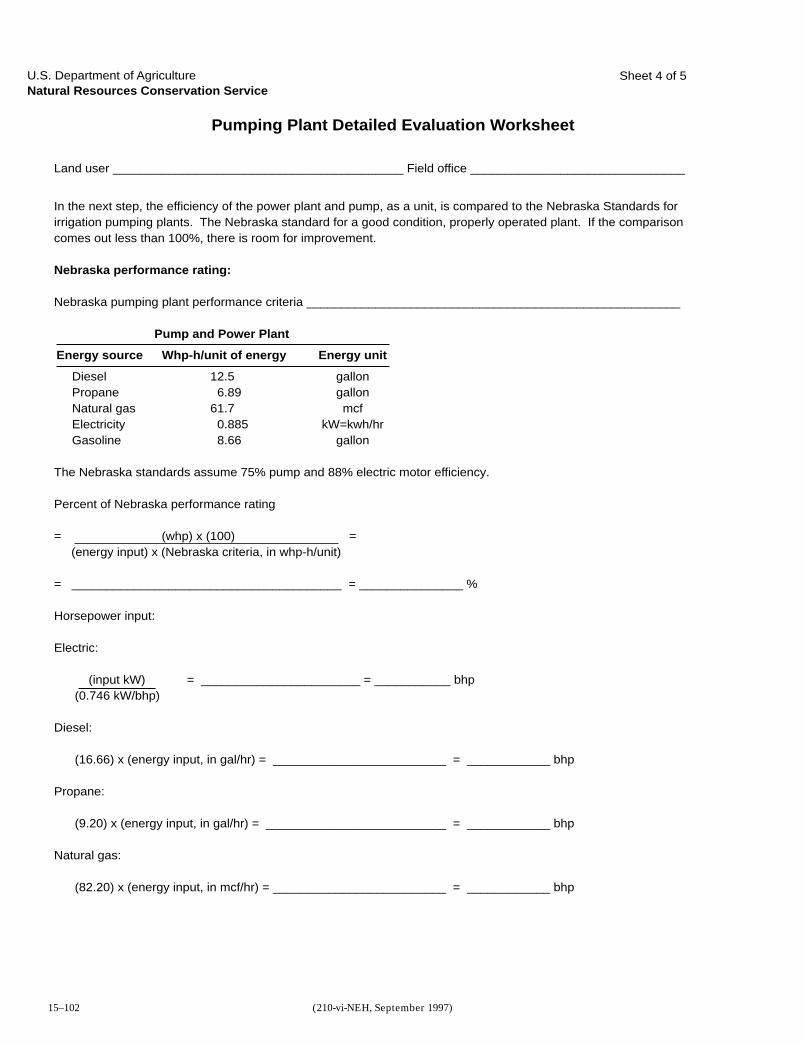
Part 652Irrigation Guide
Resource Planning and Evaluation
Tools and Worksheets
Chapter 15
15–102 (210-vi-NEH, September 1997)
Land user __________________________________________ Field office _______________________________
In the next step, the efficiency of the power plant and pump, as a unit, is compared to the Nebraska Standards forirrigation pumping plants. The Nebraska standard for a good condition, properly operated plant. If the comparisoncomes out less than 100%, there is room for improvement.
Nebraska performance rating:
Nebraska pumping plant performance criteria ______________________________________________________
Pump and Power Plant
Energy source Whp-h/unit of energy Energy unit
Diesel 12.5 gallonPropane 6.89 gallonNatural gas 61.7 mcfElectricity 0.885 kW=kwh/hrGasoline 8.66 gallon
The Nebraska standards assume 75% pump and 88% electric motor efficiency.
Percent of Nebraska performance rating
= (whp) x (100) = (energy input) x (Nebraska criteria, in whp-h/unit)
= _______________________________________ = _______________ %
Horsepower input:
Electric:
(input kW) = _______________________ = ___________ bhp (0.746 kW/bhp)
Diesel:
(16.66) x (energy input, in gal/hr) = _________________________ = ____________ bhp
Propane:
(9.20) x (energy input, in gal/hr) = __________________________ = ____________ bhp
Natural gas:
(82.20) x (energy input, in mcf/hr) = _________________________ = ____________ bhp
Pumping Plant Detailed Evaluation Worksheet
U.S. Department of AgricultureNatural Resources Conservation Service
Sheet 4 of 5
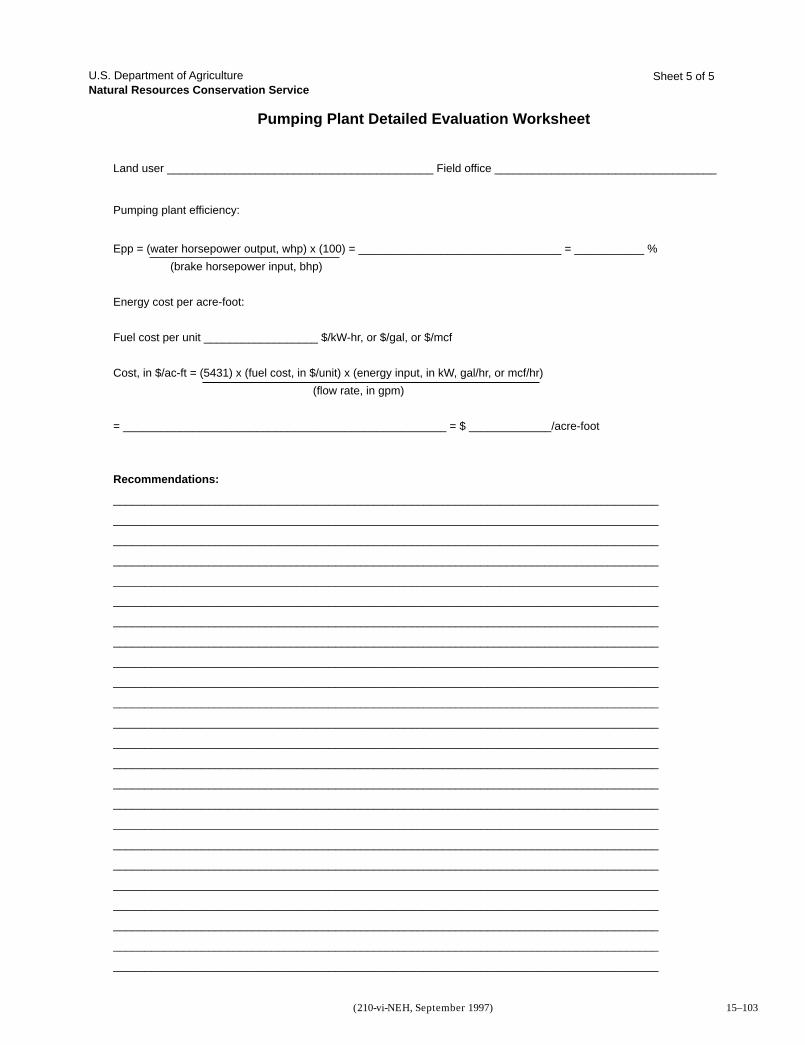
Part 652Irrigation Guide
Resource Planning and Evaluation
Tools and Worksheets
Chapter 15
15–103(210-vi-NEH, September 1997)
Land user __________________________________________ Field office ___________________________________
Pumping plant efficiency:
Epp = (water horsepower output, whp) x (100) = ________________________________ = ___________ %
(brake horsepower input, bhp)
Energy cost per acre-foot:
Fuel cost per unit __________________ $/kW-hr, or $/gal, or $/mcf
Cost, in $/ac-ft = (5431) x (fuel cost, in $/unit) x (energy input, in kW, gal/hr, or mcf/hr)
(flow rate, in gpm)
= ___________________________________________________ = $ _____________/acre-foot
Recommendations:
______________________________________________________________________________________
______________________________________________________________________________________
______________________________________________________________________________________
______________________________________________________________________________________
______________________________________________________________________________________
______________________________________________________________________________________
______________________________________________________________________________________
______________________________________________________________________________________
______________________________________________________________________________________
______________________________________________________________________________________
______________________________________________________________________________________
______________________________________________________________________________________
______________________________________________________________________________________
______________________________________________________________________________________
______________________________________________________________________________________
______________________________________________________________________________________
______________________________________________________________________________________
______________________________________________________________________________________
______________________________________________________________________________________
______________________________________________________________________________________
______________________________________________________________________________________
______________________________________________________________________________________
______________________________________________________________________________________
______________________________________________________________________________________
Pumping Plant Detailed Evaluation Worksheet
U.S. Department of AgricultureNatural Resources Conservation Service
Sheet 5 of 5
Part 652Irrigation Guide
Resource Planning and Evaluation
Tools and Worksheets
Chapter 15
15–104 (210-vi-NEH, September 1997)
Case: Material C.I. Patt. No. H-689 Mach. No. H-689 3600 NOMINAL R.P.M. 60 Cycles
T.D.B.L. for fresh water atsea level 80° F max. M-1 M-2
Impeller: Material BRZ Patt. No. M-3380 Mach. No. M-3380 Dia. 9" FULL
MAXIMUM WORKING PRESSURE 215 PSI
C-5006 10-30-64T-3184Based on Dated 5-19-71Date MODELB3ZPLSuperaades
800750700650600550500450400CAPACITY IN U.S. GALLONS PER MINUTE
N.P
.S.H
. IN
FE
ET
TO
TA
L D
YN
AM
IC H
EA
D IN
FE
ET
350300250200150100500
50
100
150
200
250
300
350
0
10
20
30
TDSL
Pump performance curve
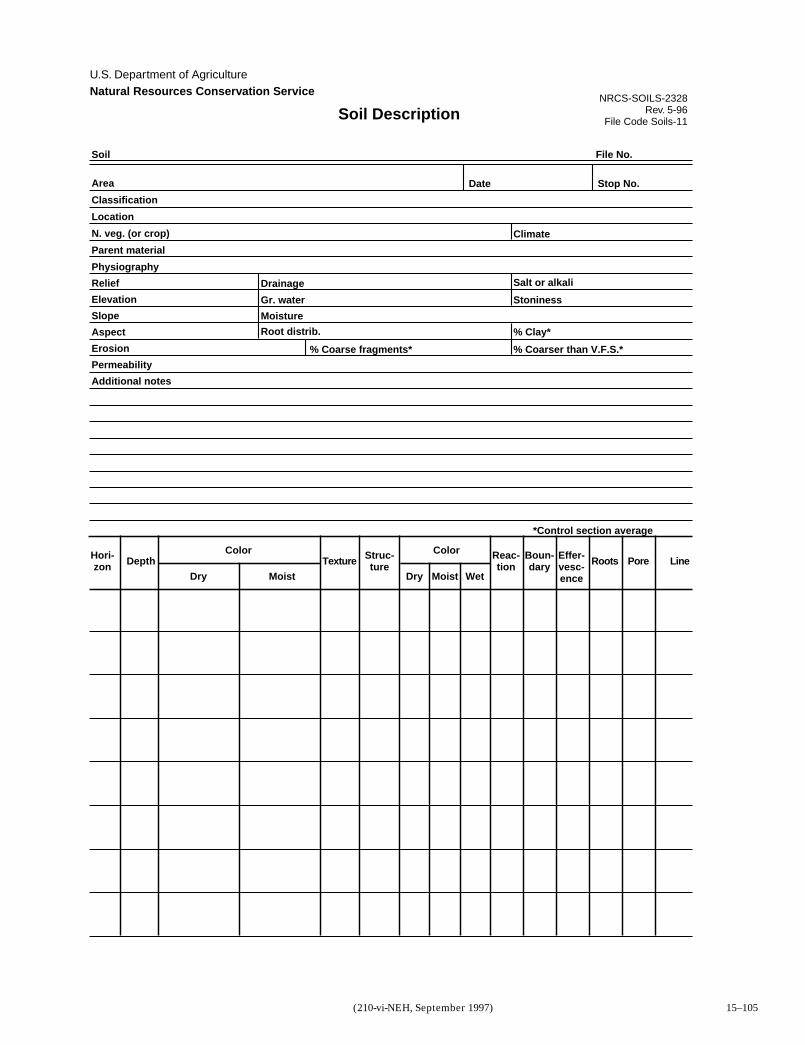
Part 652Irrigation Guide
Resource Planning and Evaluation
Tools and Worksheets
Chapter 15
15–105(210-vi-NEH, September 1997)
Soil File No.
Stop No.Date
Climate
Salt or alkali
StoninessGr. water
Drainage
Moisture
Root distrib.
% Coarse fragments*
Hori-zon Depth Struc-
tureReac-tion
Boun-dary
Effer-vesc-ence
Texture Roots Pore Line
Dry Moist Dry Moist Wet
Color Color
*Control section average
% Clay*
% Coarser than V.F.S.*
Area
Classification
Location
N. veg. (or crop)
Parent material
Physiography
Relief
Elevation
Slope
Aspect
Erosion
Permeability
Additional notes
Soil Description
U.S. Department of AgricultureNatural Resources Conservation Service
NRCS-SOILS-2328Rev. 5-96
File Code Soils-11
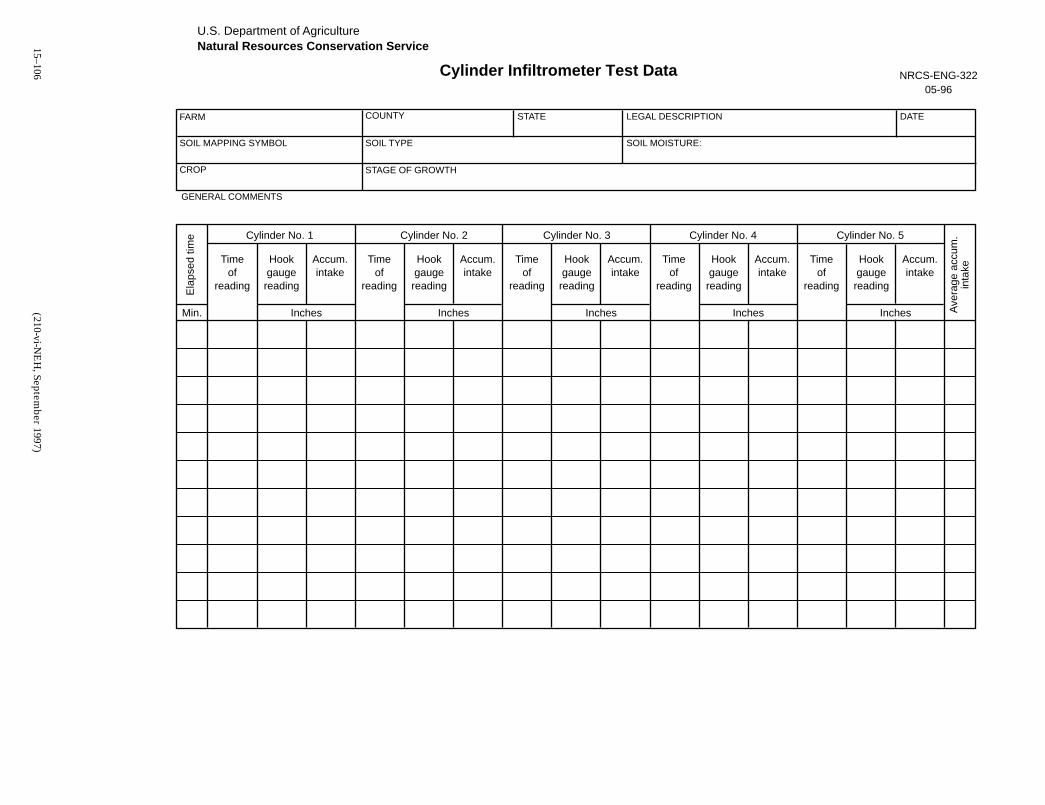
Part 652
Irrigation Guide
Reso
urce P
lan
nin
g a
nd
Evalu
atio
n
To
ols
an
d W
ork
sh
eets
Ch
ap
ter 1
5
15–106(210-vi-N
EH
, September 1997)
Cylinder Infiltrometer Test Data
U.S. Department of AgricultureNatural Resources Conservation Service
FARM
SOIL MAPPING SYMBOL
CROP
GENERAL COMMENTS
COUNTY STATE
SOIL TYPE
LEGAL DESCRIPTION DATE
NRCS-ENG-32205-96
SOIL MOISTURE:
STAGE OF GROWTH
Cylinder No. 1 Cylinder No. 2 Cylinder No. 3 Cylinder No. 4 Cylinder No. 5
InchesMin. Inches Inches Inches Inches
Ela
psed
tim
e
Ave
rage
acc
um.
inta
ke
Timeof
reading
Timeof
reading
Hookgaugereading
Accum.intake
Hookgaugereading
Accum.intake
Timeof
reading
Hookgaugereading
Accum.intake
Timeof
reading
Hookgaugereading
Accum.intake
Timeof
reading
Hookgaugereading
Accum.intake
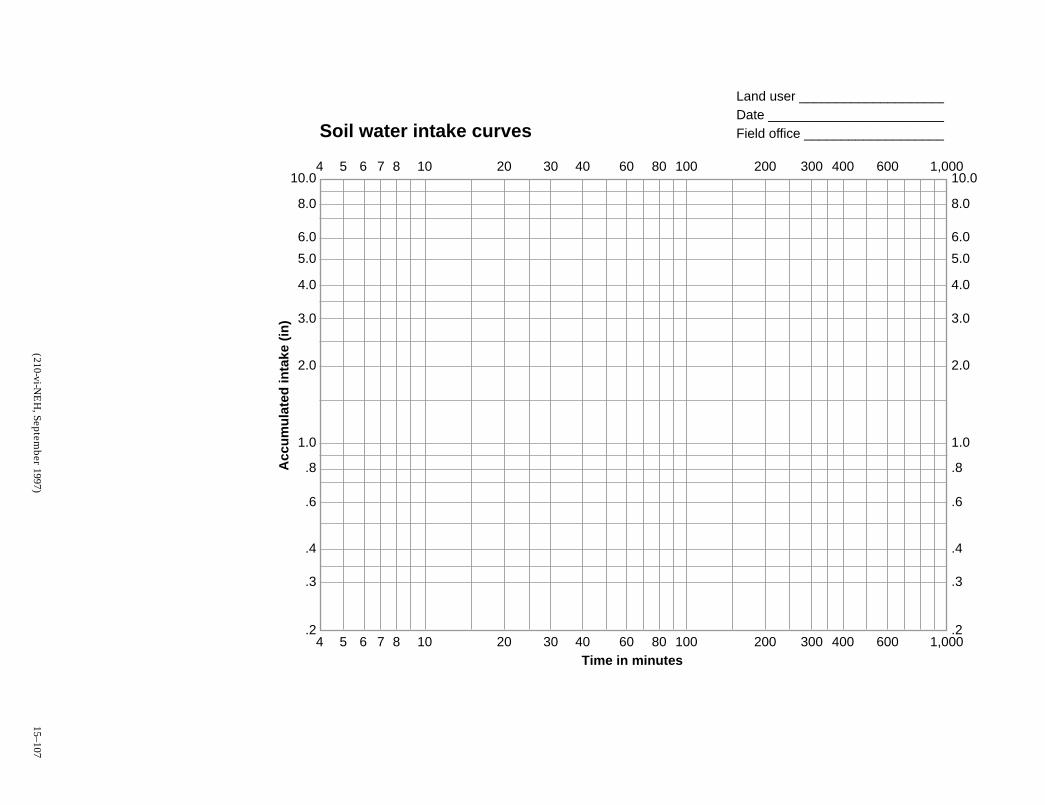
Part 652
Irrigation Guide
Reso
urce P
lan
nin
g a
nd
Evalu
atio
n
To
ols
an
d W
ork
sh
eets
Ch
ap
ter 1
5
15–107(210-vi-N
EH
, September 1997)
10.04 5 6 7 8 10 20 30 40 60 80 100 200 300 400 600 1,000
4 5 6 7 8 10 20 30 40 60 80 100 200 300 400 600 1,000
8.0
6.0
5.0
4.0
3.0
2.0
1.0
.8
.6
.4
.3
.2
10.0
8.0
6.0
5.0
4.0
3.0
2.0
1.0
.8
.6
.4
.3
.2
Time in minutes
Acc
um
ula
ted
inta
ke (
in)
Soil water intake curves
Land user ____________________Date ________________________Field office ___________________
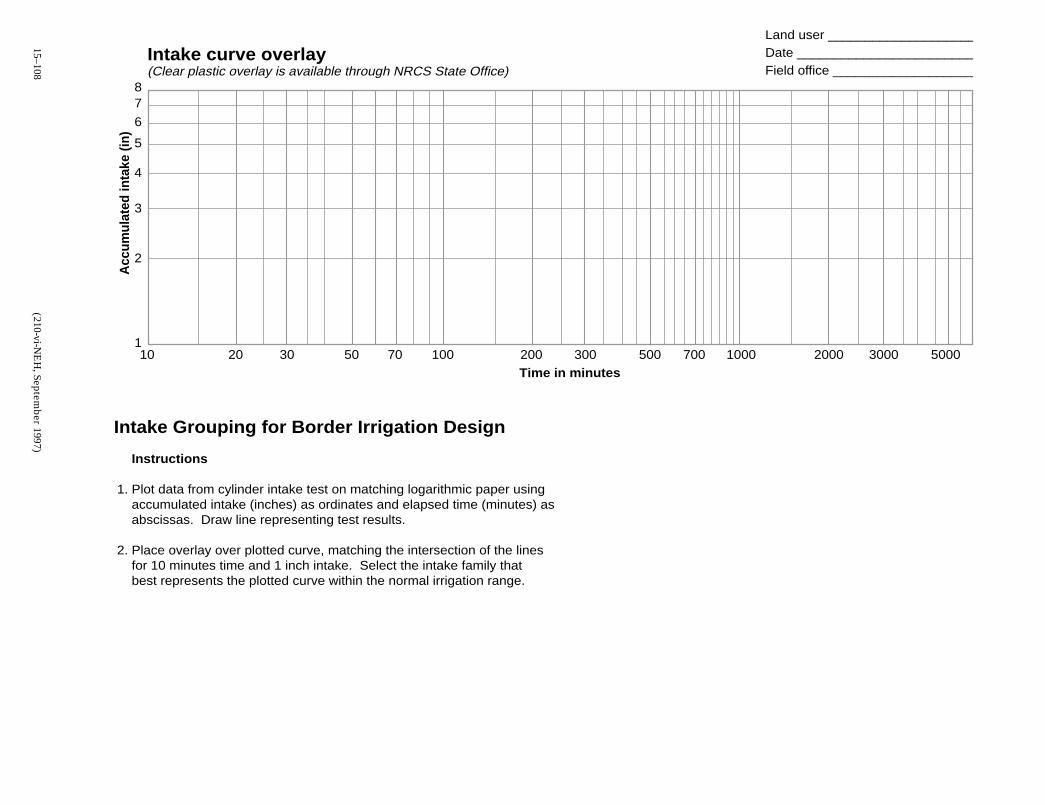
Part 652
Irrigation Guide
Reso
urce P
lan
nin
g a
nd
Evalu
atio
n
To
ols
an
d W
ork
sh
eets
Ch
ap
ter 1
5
15–108(210-vi-N
EH
, September 1997)
10
2
1
3
4
5
6
78
30 50 70 100 200 300 500 700 1000 2000 3000 500020
Land user ____________________Date ________________________Field office ___________________
Intake curve overlay(Clear plastic overlay is available through NRCS State Office)
Acc
umul
ated
inta
ke (i
n)
Time in minutes
Intake Grouping for Border Irrigation Design
Instructions
1. Plot data from cylinder intake test on matching logarithmic paper usingaccumulated intake (inches) as ordinates and elapsed time (minutes) asabscissas. Draw line representing test results.
2. Place overlay over plotted curve, matching the intersection of the linesfor 10 minutes time and 1 inch intake. Select the intake family thatbest represents the plotted curve within the normal irrigation range.
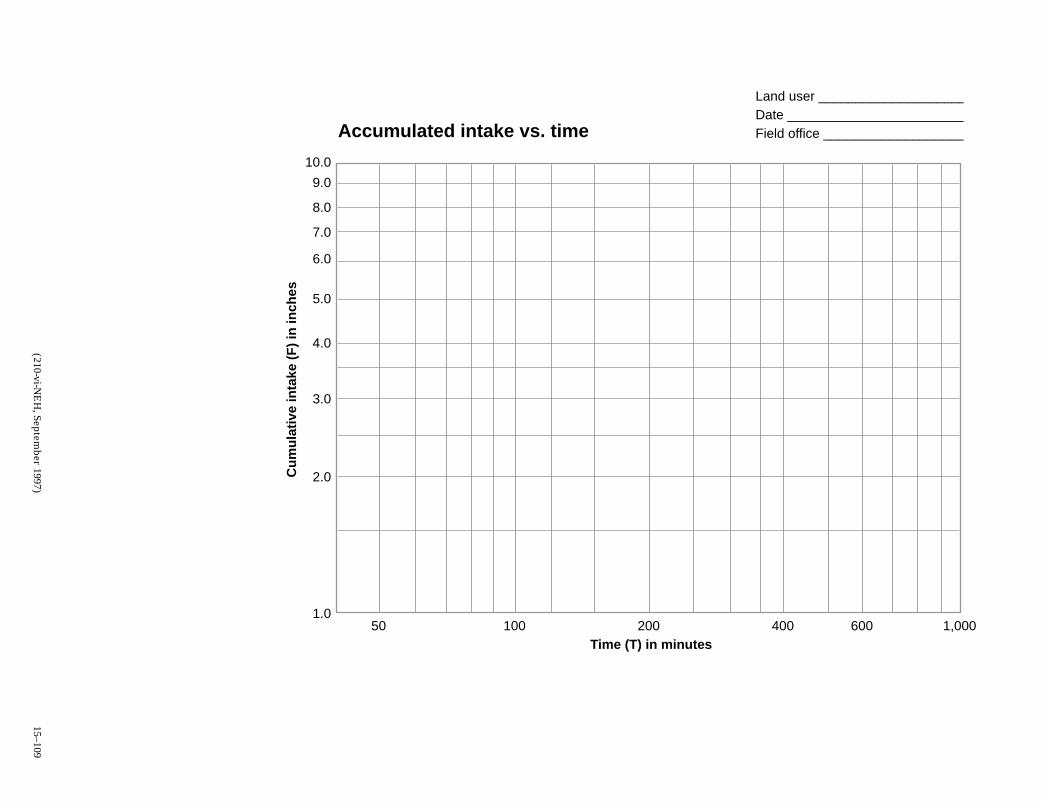
Part 652
Irrigation Guide
Reso
urce P
lan
nin
g a
nd
Evalu
atio
n
To
ols
an
d W
ork
sh
eets
Ch
ap
ter 1
5
15–109(210-vi-N
EH
, September 1997)
100 200 400 600 1,00050
5.0
4.0
3.0
2.0
1.0
6.0
7.0
8.0
9.0
10.0
Time (T) in minutes
Cu
mu
lati
ve in
take
(F
) in
inch
es
Accumulated intake vs. time
Land user ____________________Date ________________________Field office ___________________
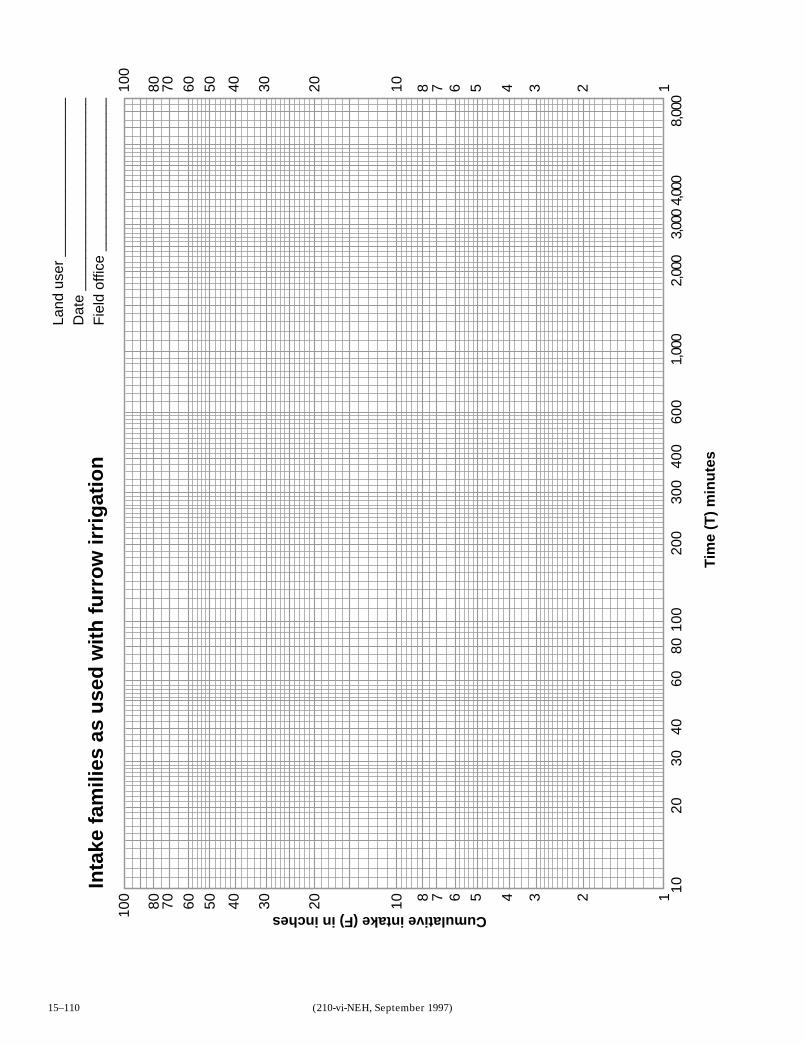
Part 652Irrigation Guide
Resource Planning and Evaluation
Tools and Worksheets
Chapter 15
15–110 (210-vi-NEH, September 1997)
10
100
80 70 60 50 40 30 20 10 8 7 6 5 4 3 2 1
100 80 70 60 50 40 30 20 10 8 7 6 5 4 3 2 1
Tim
e (T
) m
inu
tes
2030
4060
8010
020
030
040
060
01,
000
2,00
03,
000
4,00
08,
000
Cumulative intake (F) in inches
Inta
ke f
amili
es a
s u
sed
wit
h f
urr
ow
irri
gat
ion
Land
use
r __
____
____
____
____
__D
ate
____
____
____
____
____
____
Fie
ld o
ffice
___
____
____
____
____
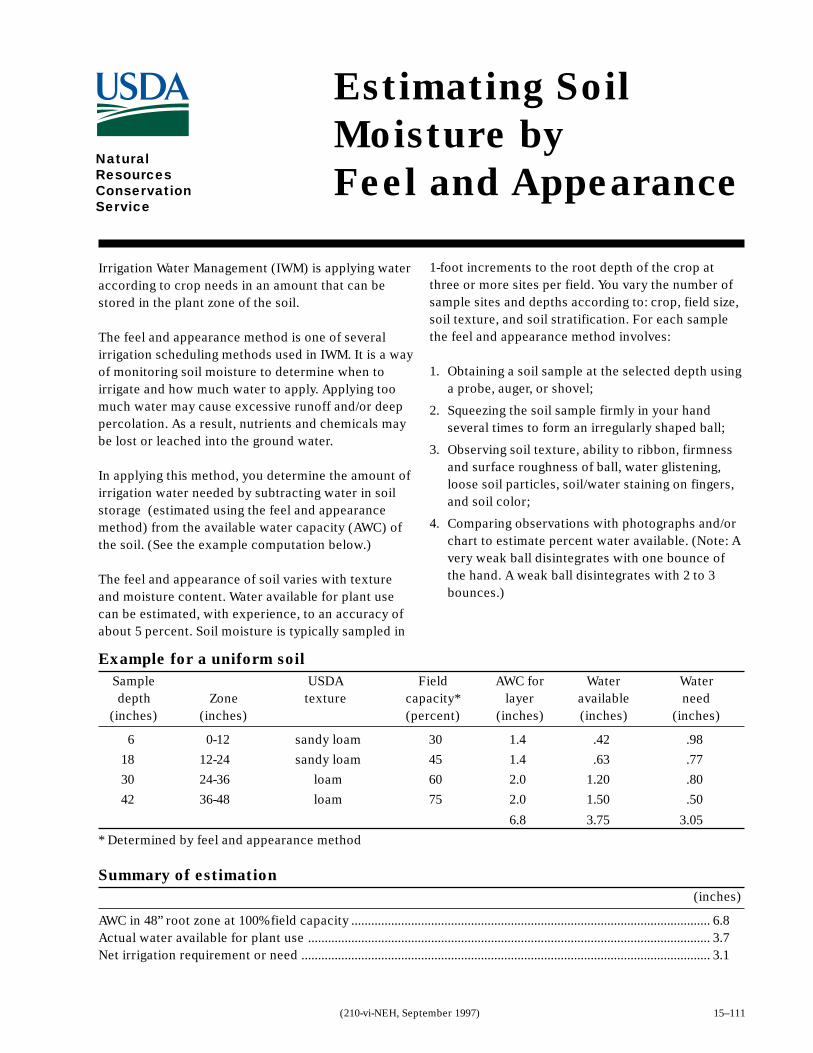
15–111(210-vi-NEH, September 1997)
Estimating Soil
Moisture by
Feel and AppearanceNaturalResourcesConservationService
Irrigation Water Management (IWM) is applying wateraccording to crop needs in an amount that can bestored in the plant zone of the soil.
The feel and appearance method is one of severalirrigation scheduling methods used in IWM. It is a wayof monitoring soil moisture to determine when toirrigate and how much water to apply. Applying toomuch water may cause excessive runoff and/or deeppercolation. As a result, nutrients and chemicals maybe lost or leached into the ground water.
In applying this method, you determine the amount ofirrigation water needed by subtracting water in soilstorage (estimated using the feel and appearancemethod) from the available water capacity (AWC) ofthe soil. (See the example computation below.)
The feel and appearance of soil varies with textureand moisture content. Water available for plant usecan be estimated, with experience, to an accuracy ofabout 5 percent. Soil moisture is typically sampled in
1-foot increments to the root depth of the crop atthree or more sites per field. You vary the number ofsample sites and depths according to: crop, field size,soil texture, and soil stratification. For each samplethe feel and appearance method involves:
1. Obtaining a soil sample at the selected depth usinga probe, auger, or shovel;
2. Squeezing the soil sample firmly in your handseveral times to form an irregularly shaped ball;
3. Observing soil texture, ability to ribbon, firmnessand surface roughness of ball, water glistening,loose soil particles, soil/water staining on fingers,and soil color;
4. Comparing observations with photographs and/orchart to estimate percent water available. (Note: Avery weak ball disintegrates with one bounce ofthe hand. A weak ball disintegrates with 2 to 3bounces.)
Example for a uniform soil
Sample USDA Field AWC for Water Waterdepth Zone texture capacity* layer available need
(inches) (inches) (percent) (inches) (inches) (inches)
6 0-12 sandy loam 30 1.4 .42 .98
18 12-24 sandy loam 45 1.4 .63 .77
30 24-36 loam 60 2.0 1.20 .80
42 36-48 loam 75 2.0 1.50 .50
6.8 3.75 3.05
* Determined by feel and appearance method
Summary of estimation
(inches)
AWC in 48” root zone at 100% field capacity ............................................................................................................ 6.8Actual water available for plant use ......................................................................................................................... 3.7Net irrigation requirement or need ........................................................................................................................... 3.1
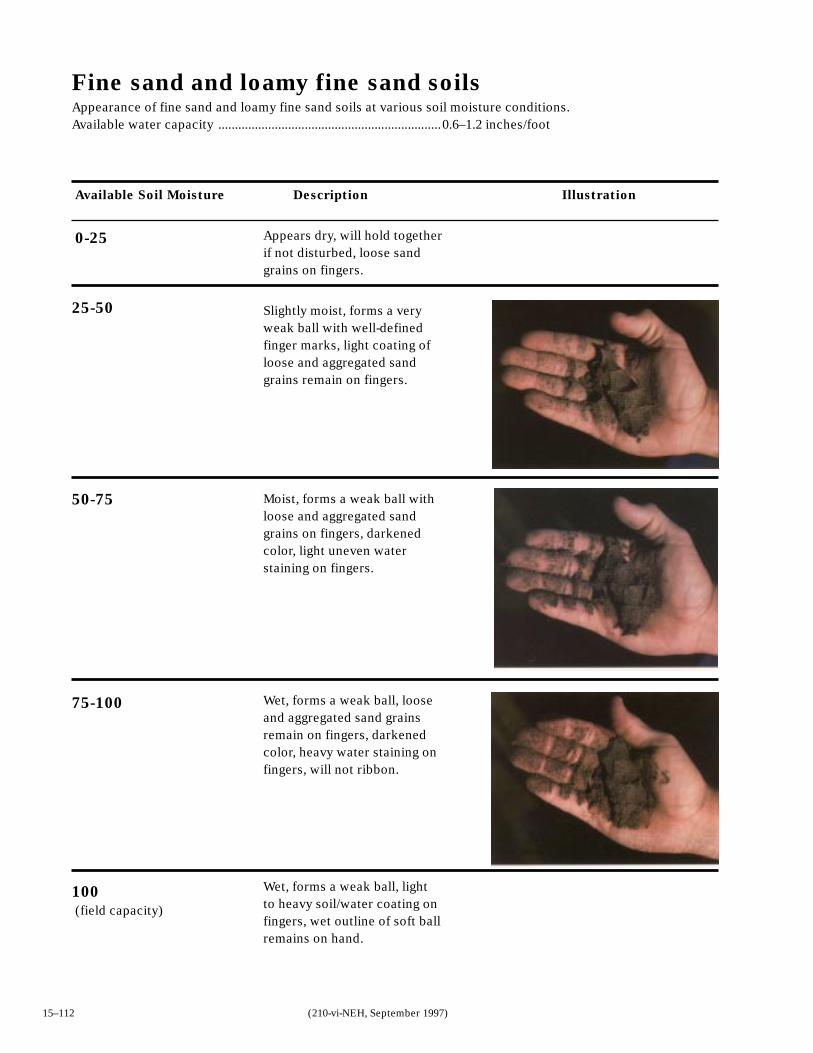
15–112 (210-vi-NEH, September 1997)
Fine sand and loamy fine sand soilsAppearance of fine sand and loamy fine sand soils at various soil moisture conditions.Available water capacity ...................................................................0.6–1.2 inches/foot
0-25 Appears dry, will hold togetherif not disturbed, loose sandgrains on fingers.
25-50 Slightly moist, forms a veryweak ball with well-definedfinger marks, light coating ofloose and aggregated sandgrains remain on fingers.
50-75 Moist, forms a weak ball withloose and aggregated sandgrains on fingers, darkenedcolor, light uneven waterstaining on fingers.
75-100 Wet, forms a weak ball, looseand aggregated sand grainsremain on fingers, darkenedcolor, heavy water staining onfingers, will not ribbon.
100
(field capacity)
Wet, forms a weak ball, lightto heavy soil/water coating onfingers, wet outline of soft ballremains on hand.
Description IllustrationAvailable Soil Moisture
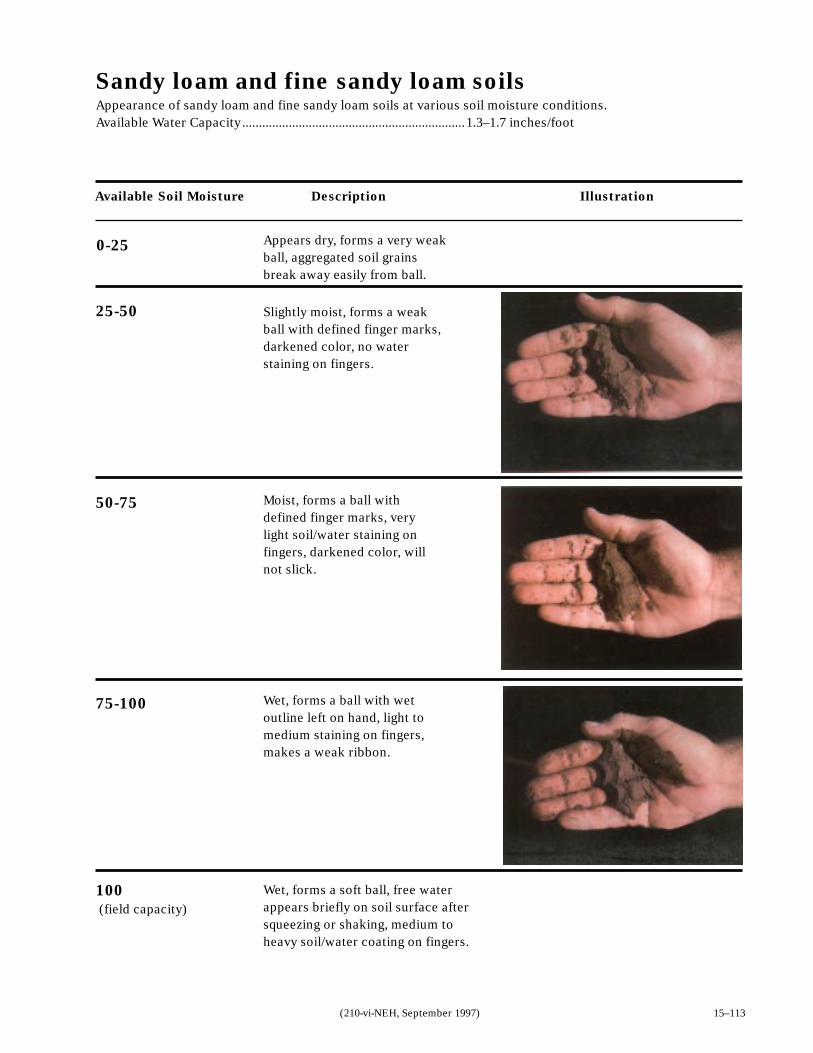
15–113(210-vi-NEH, September 1997)
Sandy loam and fine sandy loam soilsAppearance of sandy loam and fine sandy loam soils at various soil moisture conditions.Available Water Capacity...................................................................1.3–1.7 inches/foot
0-25
25-50
50-75
75-100
Appears dry, forms a very weakball, aggregated soil grainsbreak away easily from ball.
Slightly moist, forms a weakball with defined finger marks,darkened color, no waterstaining on fingers.
Moist, forms a ball withdefined finger marks, verylight soil/water staining onfingers, darkened color, willnot slick.
Wet, forms a ball with wetoutline left on hand, light tomedium staining on fingers,makes a weak ribbon.
Wet, forms a soft ball, free waterappears briefly on soil surface aftersqueezing or shaking, medium toheavy soil/water coating on fingers.
100
(field capacity)
Description IllustrationAvailable Soil Moisture
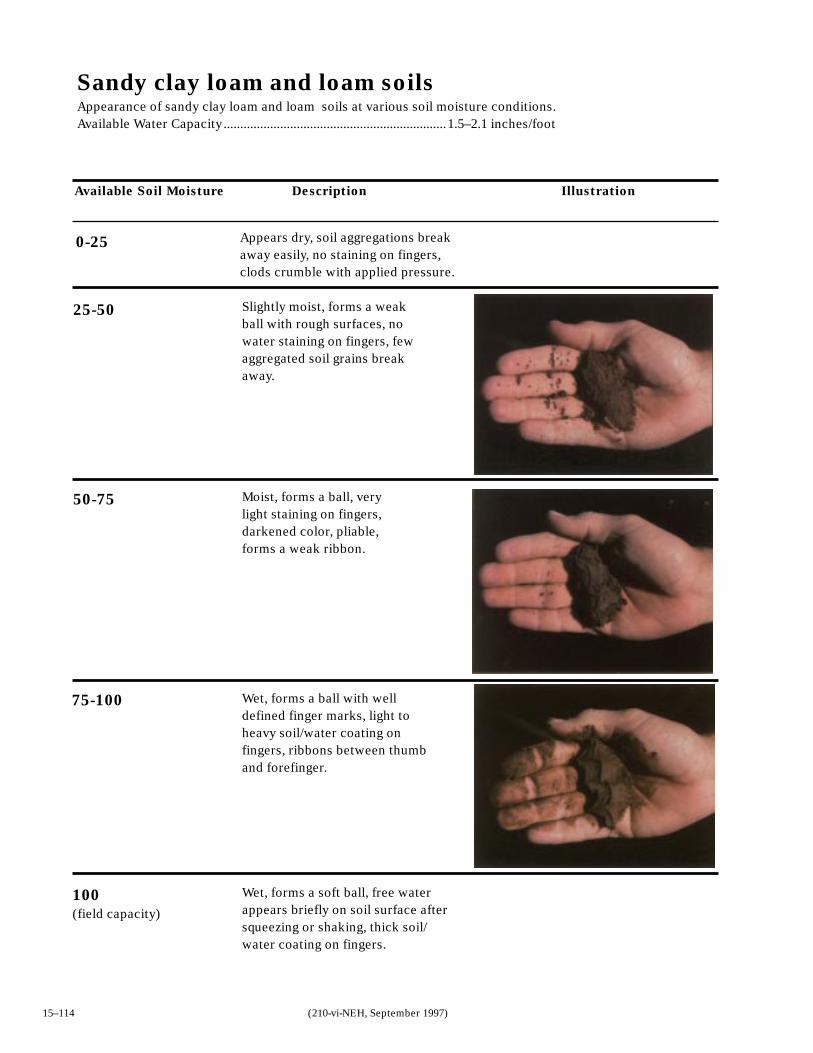
15–114 (210-vi-NEH, September 1997)
Sandy clay loam and loam soilsAppearance of sandy clay loam and loam soils at various soil moisture conditions.Available Water Capacity...................................................................1.5–2.1 inches/foot
Description Illustration
0-25
25-50
50-75
75-100
Appears dry, soil aggregations breakaway easily, no staining on fingers,clods crumble with applied pressure.
Slightly moist, forms a weakball with rough surfaces, nowater staining on fingers, fewaggregated soil grains breakaway.
Moist, forms a ball, verylight staining on fingers,darkened color, pliable,forms a weak ribbon.
Wet, forms a ball with welldefined finger marks, light toheavy soil/water coating onfingers, ribbons between thumband forefinger.
Wet, forms a soft ball, free waterappears briefly on soil surface aftersqueezing or shaking, thick soil/water coating on fingers.
100
(field capacity)
Available Soil Moisture
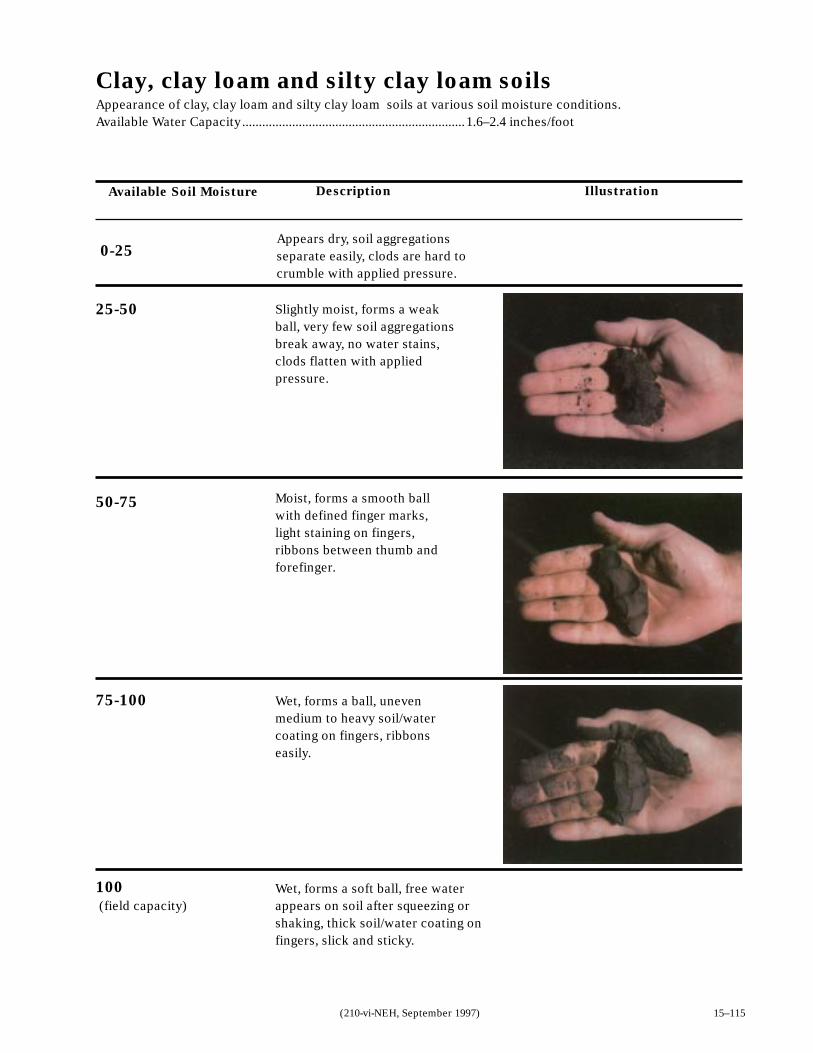
15–115(210-vi-NEH, September 1997)
Clay, clay loam and silty clay loam soilsAppearance of clay, clay loam and silty clay loam soils at various soil moisture conditions.Available Water Capacity...................................................................1.6–2.4 inches/foot
Description Illustration
0-25
25-50
50-75
75-100
Appears dry, soil aggregationsseparate easily, clods are hard tocrumble with applied pressure.
Slightly moist, forms a weakball, very few soil aggregationsbreak away, no water stains,clods flatten with appliedpressure.
Moist, forms a smooth ballwith defined finger marks,light staining on fingers,ribbons between thumb andforefinger.
Wet, forms a ball, unevenmedium to heavy soil/watercoating on fingers, ribbonseasily.
Wet, forms a soft ball, free waterappears on soil after squeezing orshaking, thick soil/water coating onfingers, slick and sticky.
100
(field capacity)
Available Soil Moisture
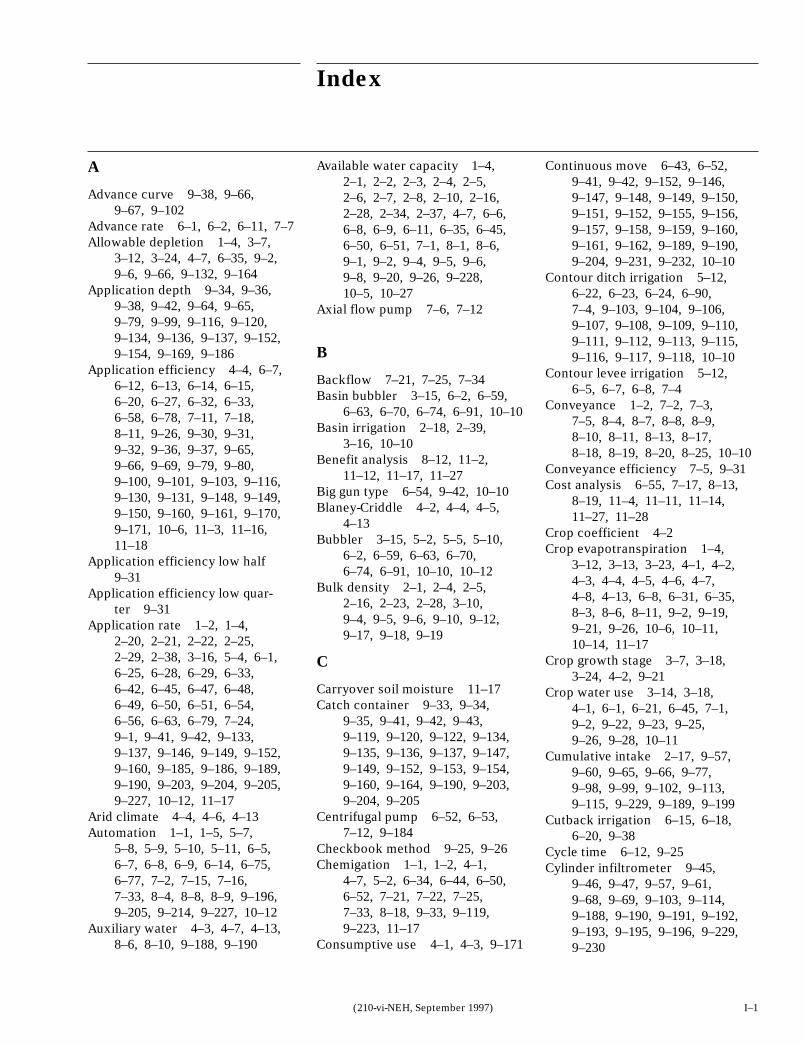
Part 652Irrigation Guide
Index
I–1(210-vi-NEH, September 1997)
Index
A
Advance curve 9–38, 9–66,9–67, 9–102
Advance rate 6–1, 6–2, 6–11, 7–7Allowable depletion 1–4, 3–7,
3–12, 3–24, 4–7, 6–35, 9–2,9–6, 9–66, 9–132, 9–164
Application depth 9–34, 9–36,9–38, 9–42, 9–64, 9–65,9–79, 9–99, 9–116, 9–120,9–134, 9–136, 9–137, 9–152,9–154, 9–169, 9–186
Application efficiency 4–4, 6–7,6–12, 6–13, 6–14, 6–15,6–20, 6–27, 6–32, 6–33,6–58, 6–78, 7–11, 7–18,8–11, 9–26, 9–30, 9–31,9–32, 9–36, 9–37, 9–65,9–66, 9–69, 9–79, 9–80,9–100, 9–101, 9–103, 9–116,9–130, 9–131, 9–148, 9–149,9–150, 9–160, 9–161, 9–170,9–171, 10–6, 11–3, 11–16,11–18
Application efficiency low half9–31
Application efficiency low quar-ter 9–31
Application rate 1–2, 1–4,2–20, 2–21, 2–22, 2–25,2–29, 2–38, 3–16, 5–4, 6–1,6–25, 6–28, 6–29, 6–33,6–42, 6–45, 6–47, 6–48,6–49, 6–50, 6–51, 6–54,6–56, 6–63, 6–79, 7–24,9–1, 9–41, 9–42, 9–133,9–137, 9–146, 9–149, 9–152,9–160, 9–185, 9–186, 9–189,9–190, 9–203, 9–204, 9–205,9–227, 10–12, 11–17
Arid climate 4–4, 4–6, 4–13Automation 1–1, 1–5, 5–7,
5–8, 5–9, 5–10, 5–11, 6–5,6–7, 6–8, 6–9, 6–14, 6–75,6–77, 7–2, 7–15, 7–16,7–33, 8–4, 8–8, 8–9, 9–196,9–205, 9–214, 9–227, 10–12
Auxiliary water 4–3, 4–7, 4–13,8–6, 8–10, 9–188, 9–190
Available water capacity 1–4,2–1, 2–2, 2–3, 2–4, 2–5,2–6, 2–7, 2–8, 2–10, 2–16,2–28, 2–34, 2–37, 4–7, 6–6,6–8, 6–9, 6–11, 6–35, 6–45,6–50, 6–51, 7–1, 8–1, 8–6,9–1, 9–2, 9–4, 9–5, 9–6,9–8, 9–20, 9–26, 9–228,10–5, 10–27
Axial flow pump 7–6, 7–12
B
Backflow 7–21, 7–25, 7–34Basin bubbler 3–15, 6–2, 6–59,
6–63, 6–70, 6–74, 6–91, 10–10Basin irrigation 2–18, 2–39,
3–16, 10–10Benefit analysis 8–12, 11–2,
11–12, 11–17, 11–27Big gun type 6–54, 9–42, 10–10Blaney-Criddle 4–2, 4–4, 4–5,
4–13Bubbler 3–15, 5–2, 5–5, 5–10,
6–2, 6–59, 6–63, 6–70,6–74, 6–91, 10–10, 10–12
Bulk density 2–1, 2–4, 2–5,2–16, 2–23, 2–28, 3–10,9–4, 9–5, 9–6, 9–10, 9–12,9–17, 9–18, 9–19
C
Carryover soil moisture 11–17Catch container 9–33, 9–34,
9–35, 9–41, 9–42, 9–43,9–119, 9–120, 9–122, 9–134,9–135, 9–136, 9–137, 9–147,9–149, 9–152, 9–153, 9–154,9–160, 9–164, 9–190, 9–203,9–204, 9–205
Centrifugal pump 6–52, 6–53,7–12, 9–184
Checkbook method 9–25, 9–26Chemigation 1–1, 1–2, 4–1,
4–7, 5–2, 6–34, 6–44, 6–50,6–52, 7–21, 7–22, 7–25,7–33, 8–18, 9–33, 9–119,9–223, 11–17
Consumptive use 4–1, 4–3, 9–171
Continuous move 6–43, 6–52,9–41, 9–42, 9–152, 9–146,9–147, 9–148, 9–149, 9–150,9–151, 9–152, 9–155, 9–156,9–157, 9–158, 9–159, 9–160,9–161, 9–162, 9–189, 9–190,9–204, 9–231, 9–232, 10–10
Contour ditch irrigation 5–12,6–22, 6–23, 6–24, 6–90,7–4, 9–103, 9–104, 9–106,9–107, 9–108, 9–109, 9–110,9–111, 9–112, 9–113, 9–115,9–116, 9–117, 9–118, 10–10
Contour levee irrigation 5–12,6–5, 6–7, 6–8, 7–4
Conveyance 1–2, 7–2, 7–3,7–5, 8–4, 8–7, 8–8, 8–9,8–10, 8–11, 8–13, 8–17,8–18, 8–19, 8–20, 8–25, 10–10
Conveyance efficiency 7–5, 9–31Cost analysis 6–55, 7–17, 8–13,
8–19, 11–4, 11–11, 11–14,11–27, 11–28
Crop coefficient 4–2Crop evapotranspiration 1–4,
3–12, 3–13, 3–23, 4–1, 4–2,4–3, 4–4, 4–5, 4–6, 4–7,4–8, 4–13, 6–8, 6–31, 6–35,8–3, 8–6, 8–11, 9–2, 9–19,9–21, 9–26, 10–6, 10–11,10–14, 11–17
Crop growth stage 3–7, 3–18,3–24, 4–2, 9–21
Crop water use 3–14, 3–18,4–1, 6–1, 6–21, 6–45, 7–1,9–2, 9–22, 9–23, 9–25,9–26, 9–28, 10–11
Cumulative intake 2–17, 9–57,9–60, 9–65, 9–66, 9–77,9–98, 9–99, 9–102, 9–113,9–115, 9–229, 9–189, 9–199
Cutback irrigation 6–15, 6–18,6–20, 9–38
Cycle time 6–12, 9–25Cylinder infiltrometer 9–45,
9–46, 9–47, 9–57, 9–61,9–68, 9–69, 9–103, 9–114,9–188, 9–190, 9–191, 9–192,9–193, 9–195, 9–196, 9–229,9–230
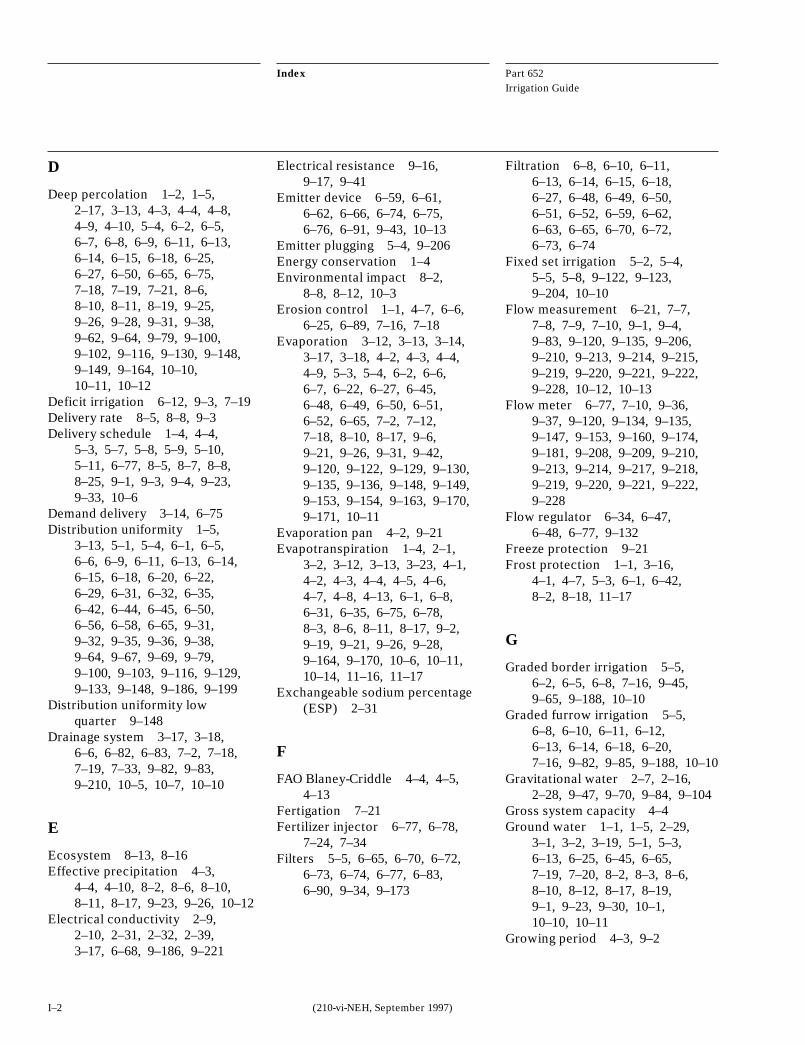
Part 652Irrigation Guide
Index
I–2 (210-vi-NEH, September 1997)
D
Deep percolation 1–2, 1–5,2–17, 3–13, 4–3, 4–4, 4–8,4–9, 4–10, 5–4, 6–2, 6–5,6–7, 6–8, 6–9, 6–11, 6–13,6–14, 6–15, 6–18, 6–25,6–27, 6–50, 6–65, 6–75,7–18, 7–19, 7–21, 8–6,8–10, 8–11, 8–19, 9–25,9–26, 9–28, 9–31, 9–38,9–62, 9–64, 9–79, 9–100,9–102, 9–116, 9–130, 9–148,9–149, 9–164, 10–10,10–11, 10–12
Deficit irrigation 6–12, 9–3, 7–19Delivery rate 8–5, 8–8, 9–3Delivery schedule 1–4, 4–4,
5–3, 5–7, 5–8, 5–9, 5–10,5–11, 6–77, 8–5, 8–7, 8–8,8–25, 9–1, 9–3, 9–4, 9–23,9–33, 10–6
Demand delivery 3–14, 6–75Distribution uniformity 1–5,
3–13, 5–1, 5–4, 6–1, 6–5,6–6, 6–9, 6–11, 6–13, 6–14,6–15, 6–18, 6–20, 6–22,6–29, 6–31, 6–32, 6–35,6–42, 6–44, 6–45, 6–50,6–56, 6–58, 6–65, 9–31,9–32, 9–35, 9–36, 9–38,9–64, 9–67, 9–69, 9–79,9–100, 9–103, 9–116, 9–129,9–133, 9–148, 9–186, 9–199
Distribution uniformity lowquarter 9–148
Drainage system 3–17, 3–18,6–6, 6–82, 6–83, 7–2, 7–18,7–19, 7–33, 9–82, 9–83,9–210, 10–5, 10–7, 10–10
E
Ecosystem 8–13, 8–16Effective precipitation 4–3,
4–4, 4–10, 8–2, 8–6, 8–10,8–11, 8–17, 9–23, 9–26, 10–12
Electrical conductivity 2–9,2–10, 2–31, 2–32, 2–39,3–17, 6–68, 9–186, 9–221
Electrical resistance 9–16,9–17, 9–41
Emitter device 6–59, 6–61,6–62, 6–66, 6–74, 6–75,6–76, 6–91, 9–43, 10–13
Emitter plugging 5–4, 9–206Energy conservation 1–4Environmental impact 8–2,
8–8, 8–12, 10–3Erosion control 1–1, 4–7, 6–6,
6–25, 6–89, 7–16, 7–18Evaporation 3–12, 3–13, 3–14,
3–17, 3–18, 4–2, 4–3, 4–4,4–9, 5–3, 5–4, 6–2, 6–6,6–7, 6–22, 6–27, 6–45,6–48, 6–49, 6–50, 6–51,6–52, 6–65, 7–2, 7–12,7–18, 8–10, 8–17, 9–6,9–21, 9–26, 9–31, 9–42,9–120, 9–122, 9–129, 9–130,9–135, 9–136, 9–148, 9–149,9–153, 9–154, 9–163, 9–170,9–171, 10–11
Evaporation pan 4–2, 9–21Evapotranspiration 1–4, 2–1,
3–2, 3–12, 3–13, 3–23, 4–1,4–2, 4–3, 4–4, 4–5, 4–6,4–7, 4–8, 4–13, 6–1, 6–8,6–31, 6–35, 6–75, 6–78,8–3, 8–6, 8–11, 8–17, 9–2,9–19, 9–21, 9–26, 9–28,9–164, 9–170, 10–6, 10–11,10–14, 11–16, 11–17
Exchangeable sodium percentage(ESP) 2–31
F
FAO Blaney-Criddle 4–4, 4–5,4–13
Fertigation 7–21Fertilizer injector 6–77, 6–78,
7–24, 7–34Filters 5–5, 6–65, 6–70, 6–72,
6–73, 6–74, 6–77, 6–83,6–90, 9–34, 9–173
Filtration 6–8, 6–10, 6–11,6–13, 6–14, 6–15, 6–18,6–27, 6–48, 6–49, 6–50,6–51, 6–52, 6–59, 6–62,6–63, 6–65, 6–70, 6–72,6–73, 6–74
Fixed set irrigation 5–2, 5–4,5–5, 5–8, 9–122, 9–123,9–204, 10–10
Flow measurement 6–21, 7–7,7–8, 7–9, 7–10, 9–1, 9–4,9–83, 9–120, 9–135, 9–206,9–210, 9–213, 9–214, 9–215,9–219, 9–220, 9–221, 9–222,9–228, 10–12, 10–13
Flow meter 6–77, 7–10, 9–36,9–37, 9–120, 9–134, 9–135,9–147, 9–153, 9–160, 9–174,9–181, 9–208, 9–209, 9–210,9–213, 9–214, 9–217, 9–218,9–219, 9–220, 9–221, 9–222,9–228
Flow regulator 6–34, 6–47,6–48, 6–77, 9–132
Freeze protection 9–21Frost protection 1–1, 3–16,
4–1, 4–7, 5–3, 6–1, 6–42,8–2, 8–18, 11–17
G
Graded border irrigation 5–5,6–2, 6–5, 6–8, 7–16, 9–45,9–65, 9–188, 10–10
Graded furrow irrigation 5–5,6–8, 6–10, 6–11, 6–12,6–13, 6–14, 6–18, 6–20,7–16, 9–82, 9–85, 9–188, 10–10
Gravitational water 2–7, 2–16,2–28, 9–47, 9–70, 9–84, 9–104
Gross system capacity 4–4Ground water 1–1, 1–5, 2–29,
3–1, 3–2, 3–19, 5–1, 5–3,6–13, 6–25, 6–45, 6–65,7–19, 7–20, 8–2, 8–3, 8–6,8–10, 8–12, 8–17, 8–19,9–1, 9–23, 9–30, 10–1,10–10, 10–11
Growing period 4–3, 9–2
Part 652Irrigation Guide
Index
I–3(210-vi-NEH, September 1997)
H
Humid climate 3–1, 3–12,3–14, 5–7, 5–9, 5–10, 5–12,6–1, 6–9, 6–48, 6–83, 7–2,9–96, 9–100
Humidity 3–12, 3–16, 4–1,4–2, 4–3, 4–8, 5–3, 6–42,8–10, 8–17, 9–20, 9–21,9–28, 9–122, 9–130, 9–136,9–149, 9–153
Hydraulic conductivity 6–81,6–82, 6–83
Hygroscopic water 2–4
I
Impermeable layers 6–22, 7–19Infiltration 2–2, 2–17, 2–20,
2–22, 2–28, 3–1, 3–14, 4–9,5–4, 5–3, 5–7, 5–8, 5–9,5–10, 5–11, 6–2, 6–3, 6–6,6–8, 9–39, 9–45, 9–46,9–47, 9–60, 9–62, 9–69,9–77, 9–82, 9–84, 9–115,9–132, 9–137, 9–173, 9–185,9–186, 9–187, 9–188, 9–189,9–190, 9–193, 9–196, 9–198,9–199, 9–202, 9–203, 9–227,9–230
Infiltrometers 9–46, 9–47,9–57, 9–60, 9–103, 9–104,9–115, 9–188, 9–193, 9–196
Infrared 7–16, 9–10, 9–20,9–21, 9–23, 9–25, 9–207
Injection 6–67, 6–68, 7–2,7–21, 7–22, 7–23, 7–24,7–25, 7–26, 7–27, 7–28,7–30, 7–34
Intake families 2–18, 2–19,2–22, 2–39, 9–185, 9–196,9–197, 9–201, 9–230
Irrigation efficiency 3–13, 5–4,6–6, 6–7, 6–22, 7–11, 7–15,8–2, 8–6, 8–10, 8–11, 9–2,9–31, 9–32, 9–35, 9–66,9–100, 9–102, 9–227, 10–11
Irrigation frequency 3–12,3–23, 4–7, 6–33
Irrigation scheduling 1–1, 1–5,2–9, 3–2, 3–4, 3–12, 3–14,4–2, 4–9, 6–5, 6–35, 6–50,6–63, 6–75, 6–77, 6–78,7–15, 8–4, 8–5, 8–18, 9–1,9–2, 9–3, 9–4, 9–22, 9–23,9–24, 9–25, 9–26, 9–27,9–28, 9–30, 9–65, 9–68,9–80, 9–81, 9–101, 9–116,9–131, 9–150, 9–151, 9–161,9–162, 9–164, 9–205, 9–206,9–227, 9–229, 10–2, 10–3,10–12, 10–13, 11–2, 11–14,11–18
Irrigation season 2–17, 2–25,4–8, 5–4, 6–18, 6–47, 6–48,6–51, 6–52, 7–3, 8–11,8–18, 9–2, 9–30, 9–67,9–82, 9–163, 9–164, 9–205,10–12
Irrigation system evaluation7–12, 9–33, 9–35, 9–36,9–45, 9–227
Irrigation water management1–5, 2–11, 2–16, 3–2, 3–12,3–13, 3–18, 5–4, 6–5, 6–9,6–35, 7–9, 7–12, 7–15,7–18, 8–7, 8–8, 9–1, 9–2,9–3, 9–4, 9–19, 9–21, 9–22,9–25, 9–30, 9–34, 9–151,9–162, 9–205, 9–206, 9–217,9–227, 10–2, 10–10, 10–11,10–12, 10–13, 10–14,10–24, 11–1
Irrigation water requirement1–1, 1–4, 1–5, 2–31, 3–11,3–12, 3–13, 3–16, 3–17, 3–19,4–1, 4–2, 4–3, 4–4, 4–7, 4–8,4–9, 4–13, 8–1, 8–2, 8–4,8–6, 8–7, 8–10, 8–23, 8–25
L
Lag time 9–67, 9–102Laser controlled leveling 6–6,
10–13Leaching requirement 3–18, 4–7level basin 2–3, 9–193Level basin irrigation 2–3, 6–2,
6–5, 6–6, 6–7, 7–16, 9–68,9–79, 9–193, 10–10
Level furrow irrigation 5–5,6–8, 7–16, 9–37, 10–10
Line-source emitter 5–4, 6–62,6–74, 9–43
Lined ditches 6–15, 7–5, 7–4,7–5, 7–33, 9–212
Long-throated flume 9–210,9–212, 9–213, 9–214, 9–216,9–217, 9–220, 9–230
Low energy precision application(LEPA) 5–2, 5–9, 6–27,6–44, 6–47, 6–48, 6–49, 6–51,6–52, 9–42, 9–134, 9–189
Lysimeter 4–1
M
Management allowableDepletion 1–4, 3–7, 3–12,3–24, 4–7, 6–35, 9–2, 9–6,9–66, 9–102, 9–132, 9–164
Manifold 6–73, 6–76, 6–77,9–164, 9–165, 9–170, 9–172,9–173
Measuring device 6–35, 6–36,6–66, 6–74, 6–77, 6–78,6–82, 7–2, 7–5, 7–6, 7–7,7–9, 8–4, 8–8, 8–17, 8–20,9–3, 9–5, 9–7, 9–23, 9–26,9–30, 9–33, 9–35, 9–37,9–46, 9–82, 9–83, 9–103,9–105, 9–198, 9–205, 9–206,9–207, 9–210, 9–212, 9–213,9–214, 9–218, 9–223, 9–228,9–229, 10–10
Measuring flume 7–6, 7–9,9–83, 9–188, 9–202, 9–212,9–213
Measuring weir 6–22, 7–7Micro irrigation 6–25, 6–59,
6–62, 6–63, 6–65, 6–67,6–68, 6–69, 6–70, 6–72,6–73, 6–74, 6–75, 6–76,6–80, 6–89, 7–2, 7–3, 7–15,7–16, 7–21, 8–7, 9–32,9–33, 9–34, 9–35, 9–43,9–163, 9–164, 9–165, 9–166,9–167, 9–168, 9–169, 9–170,9–171, 9–172, 9–173, 9–206,9–230, 9–231, 9–232, 11–1,11–2
Part 652Irrigation Guide
Index
I–4 (210-vi-NEH, September 1997)
Microspray 5–2, 5–10, 6–74, 6–76Miners inches 7–9, 8–1, 9–219Minispray 10–10Moisture stress 1–4, 2–5, 2–9,
2–28, 3–2, 3–3, 3–4, 3–5,3–7, 3–12, 3–14, 3–16,3–24, 9–1, 9–2, 9–20, 9–21,9–22, 9–23, 9–25
N
Net irrigation requirement3–12, 3–23, 4–3, 4–4, 6–56,8–2, 9–65, 9–80, 9–101,9–117, 9–149, 9–150,9–161, 10–6
Net system capacity 4–4Net water application 6–9Non-saline 5–10Nonpoint source 7–20
O
Opportunity time 2–17, 2–29,6–6, 6–11, 6–13, 9–37, 9–45,9–47, 9–60, 9–65, 9–66,9–67, 9–68, 9–69, 9–77,9–79, 9–81, 9–96, 9–99,9–100, 9–102, 9–103, 9–104,9–115, 9–137, 9–186, 9–188,9–199, 9–202
P
Parshall flume 7–10, 9–36,9–37, 9–206, 9–211, 9–212
Peak daily evapotranspiration 6–1Penman method 4–2Penman-Monteith method 4–2Perched water table 2–28
Percolation 1–2, 1–5, 2–17,3–13, 4–3, 4–4, 4–8, 4–9,4–10, 5–4, 6–2, 6–5, 6–7,6–8, 6–9, 6–11, 6–13, 6–14,6–15, 6–18, 6–25, 6–27,6–50, 6–65, 6–75, 7–18,7–19, 7–21, 8–6, 8–10,8–11, 8–19, 9–25, 9–26,9–28, 9–31, 9–38, 9–62,9–64, 9–79, 9–100, 9–102,9–116, 9–130, 9–148, 9–149,9–164, 10–10, 10–11, 10–12
Periodic move 2–17, 2–22,2–38, 6–27, 6–28, 6–30,6–31, 6–42, 6–44, 6–89,7–16, 9–40, 9–119, 9–122,9–123, 9–124, 9–125, 9–126,9–127, 9–128, 9–129, 9–130,9–131, 9–132, 9–133, 9–165,9–190, 9–204, 9–231
Permeability 2–2, 2–3, 2–4,2–7, 2–16, 2–17, 2–28,2–29, 2–32, 2–39, 3–1, 5–11
Piston pump 9–213Pollution 1–1, 1–2, 1–4, 1–9,
6–13, 6–20, 6–45, 6–81,7–21, 7–25, 9–23, 9–30,9–31, 10–7
Precipitation 2–1, 3–1, 3–17,4–3, 4–4, 4–8, 4–9, 4–10,5–7, 6–1, 6–6, 6–14, 6–48,6–49, 6–50, 6–51, 6–65,6–68, 6–74, 6–80, 7–11,7–12, 7–18, 7–19, 7–20,7–33, 8–2, 8–3, 8–6, 8–10,8–11, 8–17, 9–23, 9–26,9–28, 9–40, 9–186, 9–203,10–7, 10–10, 10–11, 10–12
Preferential flow paths 2–17Pressure plate 9–5Pressure regulator 6–33, 6–36,
6–50, 6–52, 6–65, 6–66, 6–77Project water requirement 6–1,
8–2, 8–7Puddling 6–30, 6–55, 6–56,
9–186, 9–190Pump characteristic curves 6–34,
7–17Pump impeller 7–9, 7–17, 9–184Pump performance curves 6–34,
7–17, 9–181
Pump sump 6–20, 9–189, 9–202Pumpback system 6–20, 7–11,
7–12Pumping plant efficiency 9–66,
9–80, 9–101, 9–117, 9–132,9–183
Pumping plants 1–1, 5–3, 6–1,7–2, 7–17, 7–33, 9–174,9–181, 9–182, 9–183, 9–185,9–231, 10–7, 10–10
R
Radiation method 4–2Recession curve 9–36, 9–37,
9–59, 9–60, 9–65, 9–66,9–67, 9–69, 9–96, 9–97,9–101, 9–102, 9–229
Recession rate 6–2Reference crop evapotranspira-
tion 4–1, 4–2Relative humidity 4–1, 4–2,
4–3, 4–8, 9–20, 9–28Replogle flume 7–9, 7–10,
9–36, 9–37, 9–206, 9–211,9–212, 9–214, 9–223
Retardance 6–10Rill irrigation 10–10Riparian areas 6–80Root zone 1–2, 1–5, 2–1, 2–3,
3–1, 3–2, 3–7, 3–8, 3–10,3–11, 3–12, 3–13, 3–19,4–3, 4–7, 4–8, 4–9, 5–4,6–2, 6–6, 6–9, 6–11, 6–15,6–48, 6–50, 6–63, 6–65,6–66, 6–68, 6–73, 6–75,6–81, 7–18, 7–19, 8–10,8–11, 9–2, 9–5, 9–6, 9–7,9–17, 9–20, 9–22, 9–23,9–26, 9–30, 9–31, 9–32,9–37, 9–38, 9–43, 9–46,9–65, 9–69, 9–79, 9–83,9–96, 9–100, 9–102, 9–116,9–119, 9–130, 9–134, 9–148,9–153, 9–160, 9–163, 9–170,9–171, 9–199, 10–5, 10–10,10–11
Rooting depth 1–4, 2–4, 2–28,3–8, 3–23, 4–9, 6–6, 6–33,6–45, 6–75, 9–1, 9–2, 9–7,9–14, 9–34, 10–5
Part 652Irrigation Guide
Index
I–5(210-vi-NEH, September 1997)
Runoff 1–2, 1–5, 2–3, 2–17,2–20, 2–21, 2–25, 2–26,2–27, 2–29, 2–38, 3–1,3–13, 3–14, 4–3, 4–4, 4–8,4–9, 5–1, 5–3, 5–7, 5–12,6–2, 6–3, 6–5, 6–6, 6–7,6–8, 6–9, 6–11, 6–12, 6–13,6–14, 6–15, 6–18, 6–20,6–21, 6–22, 6–27, 6–44,6–45, 6–46, 6–47, 6–48,6–49, 6–50, 6–51, 6–52,6–65, 6–69, 7–11, 7–12,7–13, 7–18, 7–19, 7–20,7–21, 7–33, 7–34, 8–3, 8–6,8–7, 8–10, 8–11, 8–18,9–25, 9–31, 9–33, 9–34,9–36, 9–38, 9–39, 9–41,9–42, 9–46, 9–47, 9–59,9–60, 9–62, 9–64, 9–65,9–66, 9–67, 9–82, 9–84,9–100, 9–102, 9–103, 9–104,9–116, 9–130, 9–133, 9–134,9–137, 9–148, 9–149, 9–151,9–152, 9–160, 9–162, 9–186,9–189, 9–202, 9–204,9–205, 10–6, 10–10, 10–11,10–12
S
Saline soil 2–31, 3–1, 7–19Salinity 1–1, 1–4, 2–1, 2–3,
2–4, 2–5, 2–7, 2–9, 2–10,2–23, 2–24, 2–31, 2–37,2–39, 3–1, 3–17, 3–18,3–19, 3–23, 4–7, 5–7, 5–8,5–9, 5–10, 5–11, 6–33,6–65, 6–66, 6–68, 6–81,8–1, 8–6, 8–10, 8–17, 9–16,9–18, 9–20, 9–28, 9–31,9–39, 9–41, 9–42, 9–43,9–46, 9–69, 9–82, 9–83,9–119, 9–134, 9–152,9–164, 10–3, 10–5
Salinity management 3–18,4–7, 9–31, 9–82
Salt tolerance 3–17Screening device 7–2
Sediment 1–2, 2–17, 2–23,5–3, 5–7, 6–1, 6–9, 6–11,6–20, 6–21, 6–25, 6–26,6–45, 6–63, 6–65, 6–66,6–70, 6–73, 6–74, 7–4, 7–6,7–7, 7–12, 7–13, 7–19, 8–7,8–12, 8–17, 8–18, 8–19,9–31, 9–33, 9–34, 9–38,9–41, 9–46, 9–82, 9–83,9–135, 9–153, 9–165, 9–172,9–186, 9–213, 9–214, 9–215,9–217, 9–221
Seepage losses 6–8, 7–5, 7–33,8–8, 9–31, 9–213
Semiarid climate 3–1, 5–7,5–9, 5–10, 5–12, 6–1, 6–9,6–15, 6–42, 6–48, 6–79
Sideroll wheel line 5–2, 5–4,7–16, 9–40, 9–119, 10–6
Siphon tube 6–12, 6–20, 6–22,6–25, 7–4, 7–7, 7–8, 9–33,9–37, 9–38, 9–82, 9–207, 9–223
Sodic soil 2–31, 2–37, 3–1,7–19, 9–16
Sodicity 1–4, 2–1, 2–3, 2–4,2–5, 2–7, 2–17, 2–23, 2–24,2–31, 3–1, 3–17, 3–18,3–19, 3–23, 4–7, 5–7, 5–8,5–9, 5–10, 5–11, 7–18,8–17, 10–5
Sodium adsorption ratio (SAR)2–31, 2–32, 2–39, 3–17
Soil erodibility 2–4, 2–29,2–30, 2–37, 2–38, 8–1
Soil horizon 2–12Soil properties 1–4, 2–1, 2–2,
2–3, 2–4, 2–29, 2–34, 2–37,2–38, 2–39, 6–83
Soil survey 1–4, 2–1, 2–2,2–34, 8–1, 9–46, 9–68, 10–5
Soil water 2–4, 2–9, 2–28, 3–1,3–2, 3–5, 3–7, 3–8, 3–10,3–13, 3–24, 4–4, 4–8, 6–5,6–42, 6–65, 6–66, 6–83,7–15, 9–2, 9–7, 9–8, 9–10,9–14, 9–17, 9–19, 9–21,9–23, 9–24, 9–26, 9–28,9–46, 9–47, 9–57, 9–62,9–65, 9–66, 9–69, 9–70,9–79, 9–81, 9–83, 9–84,9–96, 9–100, 9–102, 9–103,9–104, 9–113, 9–116, 9–118,9–188, 9–206, 9–229,10–11, 10–12, 10–27
Soil-water deficit 3–7, 3–12,9–6, 9–26, 9–31, 9–36,9–37, 9–38, 9–40, 9–41,9–42, 9–43, 9–119, 9–132,9–134, 9–148, 9–151, 9–153,9–162
Soil-water potential 3–8, 3–17Solar radiation 4–1, 4–2, 4–3,
4–8, 5–3, 8–17Solid set irrigation 5–2, 5–5,
5–8, 6–27, 6–42, 10–10Specific gravity 2–16Spray heads 2–20, 3–13, 3–15,
5–2, 5–5, 5–12, 6–30, 6–44,6–46, 6–48, 6–52, 6–59,6–63, 6–70, 6–74, 9–43,9–122, 9–134, 9–163, 9–165,9–189, 9–190, 9–203, 10–13
Sprinkler irrigation 2–17, 4–9,5–6, 5–8, 5–9, 5–12, 5–17,6–1, 6–27, 6–28, 6–33,6–34, 6–35, 6–42, 6–43,6–45, 6–52, 6–89, 7–8,7–15, 7–21, 9–33, 9–119,9–122, 9–123, 9–124, 9–125,9–126, 9–127, 9–128, 9–129,9–130, 9–131, 9–132, 9–133,9–137, 9–138, 9–139, 9–140,9–141, 9–142, 9–143, 9–144,9–145, 9–151, 9–152, 9–155,9–156, 9–157, 9–158, 9–159,9–164, 9–231, 9–232, 10–6,10–14, 10–24, 10–25, 10–26
Static head 9–181Subhumid climate 4–4, 4–6Subirrigation 5–2, 5–11, 5–17,
6–83, 8–18, 9–45, 10–10
Part 652Irrigation Guide
Index
I–6 (210-vi-NEH, September 1997)
Supplemental irrigation 6–56,7–18
Surface irrigation 1–2, 5–1,5–7, 5–12, 5–17, 6–2, 6–3,6–5, 6–6, 6–7, 6–8, 6–10,6–12, 6–18, 6–22, 6–27,6–44, 6–83, 6–89, 6–91,7–4, 7–15, 7–16, 7–19, 8–4,8–6, 8–7, 9–33, 9–47, 9–48,9–49, 9–50, 9–51, 9–52, 9–53,9–54, 9–55, 9–71, 9–72,9–73, 9–74, 9–75, 9–76,9–84, 9–85, 9–86, 9–87,9–88, 9–89, 9–90, 9–91,9–92, 9–93, 9–94, 9–35,9–100, 9–106, 9–107, 9–108,9–109, 9–110, 9–111, 9–112,9–185, 9–186, 9–227,9–231, 10–6
Surface sealing 2–23, 9–186Surface storage 2–20, 2–21,
2–22, 2–25, 2–26, 2–27,2–28, 2–29, 2–38, 2–39,3–14, 6–2, 6–9, 6–27, 6–44,6–45, 6–46, 6–47, 6–48,6–50, 6–51, 6–52, 9–42,9–137, 9–151, 9–162, 9–189,9–203, 9–204
Surge irrigation 6–10, 6–14,6–16, 6–18, 6–91, 9–38
System capacity 2–1, 4–4, 6–1,6–28, 6–33, 6–46, 6–49,6–50, 6–51, 6–75, 6–78,6–89, 8–3, 8–19, 8–25,9–147, 9–160, 10–14
T
Tailwater recovery 6–20, 6–21,6–91, 7–2, 7–11, 7–12,7–13, 7–14, 7–19, 7–33,10–6, 10–10
Tensiometer 9–14, 9–15, 9–16,9–228, 9–229
Total available water 3–7Toxicity 3–18, 3–19, 5–3
Translocation 2–20, 2–25,3–13, 6–27, 6–44, 6–45,6–46, 6–47, 6–48, 6–49,6–50, 6–51, 6–52, 6–56,7–19, 9–31, 9–34, 9–39,9–41, 9–42, 9–133, 9–134,9–137, 9–151, 9–152, 9–160,9–161, 9–186, 9–189
Transpiration 2–1, 3–12, 3–17,3–18, 4–1, 6–7, 6–65, 9–19,9–20
Traveling gun sprinkler 5–2,5–5, 6–27, 6–54, 6–55,6–56, 6–57, 9–42, 10–6
Trickle irrigation 6–34, 6–59,6–85, 9–163
Turbine pump 6–34
U
Unsaturated 2–20, 6–5Upflux 2–1, 4–8, 6–81, 7–19,
9–22, 9–227Upward flow 4–8, 6–83, 9–22
V
Vacuum pump 7–6, 9–14Volumetric water content 3–17
W
Wastewater 6–20, 6–26, 7–19,8–18
Water balance 8–11, 9–1, 9–4,9–22, 9–25, 9–26, 9–27,9–28, 9–227, 9–229, 10–10,10–11
Water brake 6–20Water budget 1–4, 1–5, 8–10,
8–11, 8–19, 8–25, 8–26, 9–1,9–4, 10–10
Water duty 5–4Water holding capacity 2–4,
2–37, 9–4, 9–5Water measurement 1–4, 2–16,
3–14, 6–1, 7–2, 7–9, 7–33,8–8, 8–19, 9–4, 9–25,9–202, 9–205, 9–206, 9–207,9–228, 9–229
Water quality 2–1, 2–17, 3–1,6–2, 6–9, 6–67, 6–70, 6–81,7–18, 7–20, 7–21, 8–1,8–10, 8–11, 8–12, 8–19,8–20, 9–1, 9–2, 9–16, 9–22,9–45, 9–68, 9–82, 9–135,9–153, 10–1, 10–5, 10–6
Water right 5–1, 5–3, 7–9, 8–1,8–8, 8–12, 8–17
Water table 2–1, 2–3, 2–4,2–28, 2–29, 2–34, 2–37,2–39, 3–10, 5–2, 5–3, 5–11,6–33, 6–80, 6–81, 6–82,6–83, 6–84, 6–85, 6–92,7–18, 7–19, 7–20, 8–1, 8–6,8–17, 9–1, 9–17, 9–22,9–26, 9–34, 9–46, 9–69,9–83, 9–104, 9–119, 9–134,9–153, 10–5, 10–6, 10–10
Water table management 6–81,6–82, 6–83, 6–85, 6–92
Weather station 9–26, 9–28Weir 6–22, 6–81, 6–82, 7–5,
7–7, 7–9, 7–16, 8–10, 9–36,9–37, 9–68, 9–82, 9–103,9–188, 9–198, 9–206, 9–207,9–209, 9–210, 9–211, 9–212,9–213, 9–214, 9–215, 9–216,9–217, 9–223, 9–228, 9–230
Wetted bulb 6–65, 9–38, 9–199Wetted front 9–47, 9–70,Wetted perimeter 9–99, 9–100,
9–101Wheel line 6–29, 6–35, 6–36,
6–52, 6–92, 9–40, 9–41,9–119, 10–6
Wilting point 2–4, 2–5, 2–9,9–4, 9–5, 9–7, 9–10, 9–18,9–20
Wind drift 3–13, 4–4, 5–4,6–27, 6–50, 6–51, 7–21,9–40, 9–129, 9–135, 9–153,9–171
Wind movement 4–2, 4–8