irrigation drip system design for a vineyard
TRANSCRIPT

IRRIGATION DRIP SYSTEM DESIGN FOR A VINEYARD
By
Riley Way
Agricultural Systems Management
BioResource and Agricultural Engineering Department
California Polytechnic State University
San Luis Obispo
2014
TITLE:
AUTHOR:
DATE SUBMITED:
Dr. Franklin Gaudi Senior Project Advisor
Dr. Art MacCarley Department Head
Vineyard Layout and Irrigation Design
Riley Way
December 10, 2014
Date
~__) re
Date tJ?P~
11

ACKNOWLEDGMENTS
I would like to acknowledge Dr. Franklin Gaudi my senior project advisor for his extensive assistance and encouragement throughout the entirety of the project. Dr. Gaudi kept me focused and on track making sure I was properly designing the system in the most effective way. Dr. Gaudi's extensive knowledge greatly helped me better understand the fundamentals of designing a drip system and helped me apply that knowledge to this project.
I would also like to thank Mr. Ned Hill my sponsor for his knowledge and cooperation with helping me identify the parameters for the project. We worked together to develop a design that we both agreed upon and were satisfied with.
111
ABSTRACT
This project encompasses the design and evaluation of an irrigation system for a new plot of land. The field was recently purchased by a winery by the name of Roche, and the vineyard manager in charge of the field has asked for a design and cost analysis for an irrigation system. The analysis includes recommendations about good irrigation practices, as well as potential improvements that could be made to obtain higher yields of crop. The project has a set of guideline that must be followed, but beyond this, the designer was encouraged to make decisions. Completing the project required knowledge about irrigation systems and basic design considerations. The result is a design plan that the grower can install to irrigate several different blocks based on soil conditions and plant needs.
IV

DISCLAIMER STATEMENT
The university makes it clear that the information forwarded herewith is a project resulting from a class assignment and has been graded and accepted only as a fulfillment of a course requirement. Acceptance by the university does not imply technical accuracy or reliability. Any use of the information in this report is made by the user(s) at his/her own risk, which may include catastrophic failure of the device or infringement of patent or copyright laws.
Therefore, the recipient and/or user of the information contained in this report agrees to indemnify, defend and save harmless the State its officers, agents and employees from any and all claims and losses accruing or resulting to any person, firm, or corporation who may be injured or damaged as a result of the use of this report.
v
TABLE OF CONTENTS
Page SIGNATURE PAGE ......... .. ...... .. .... ...... ... ..... ... ........ .......... .. .. ...... .. ....... ........ ...... .ii ACKNOWLEDGEMENTS ... ............ ..... .... ..... ................ ..... ...... ... ............. ... ... .. iii ABSTRACT .... ........ ..... ..... ..... .... ......... .............. .. .. ......... ...... ......... .. ....... ....... .... ... iv DISCLAIMER STATEMENT ... ... .... ....... ... ............. ... ...... .......... .. .... ... ... ..... ...... .. v LIST OF FIGURES .. ............ ........ .... .. ...... ... ... ...... ....... ...... ..... ... .. ..... ... ... ..... ....... vii LIST OF TABLES .... ...... ...... ............. ........... .. ........... .. ...... .......... ...... ...... ......... viii INTRODUCTION .............. ..... ........... ....... ...... ....... ..... ....... ... .... ... ... ........ ... .. .... .... 1
Background ...... ...... .. ........... ........ .... ..... ..... ................ ...... ... ..... ..... ...... ........ .... .... 1 Justification .... ........... ...... .... ... ......... .. ....... .... .... ......... ........ .. .... ... .................... .... 2 Objective ...................... ..... .. ... ................. ...... ...... ...... .............. ..... ..... ................. 3
LITERATURE REVIEW .. .. .. ... ................ .... ..... ... ....... ........ ........... ............ .. .... ... . 4 Chardonnay Grapes ............. ......... .......... .. .... ...... ... .. ... ... .... ........ ..... .. ..... ......... .... 4 Irrigation Systems Used to Water Vines ......... ....... ... ....... ... ...... .. ... ... ....... ......... .4
Flood .. .. ....... ....... ................ ............ ...... ......... ... ..... .. ............... .... ..... ..... ..... .. .... . 4 Sprinklers ............. ............. ..... .. ........ .................... ... ........ ......... ............ .... .. ... ... 4 Drip .... .............. ........ ........ ...... .... .......... .... ...... ....... .. ................. .. .................. .... 5
Drip Components .... ... .................. .. ......... ...... ..... .... ... .... .. ............. ... .... .... .... .... ... 6 Drip Emitters ... ........... ....... ... ..... .... ....... ..... .. ......... .... ... ............ .. ... ......... ..... ... ... 6 Laterals ........ ................. ..... .......... .. ......... ........... .... .... ... ........ ......... .. ... .... ....... ... 7 Manifold Systems ..... ... ............ ...... ... ......... ........ ...... ... .... ..... ..... ..... ...... ........ .... 7 Filtration ... ..... ...... ... ....... .... ..... ... .................. ... ...... ... .. .. ......... .. .... .. ....... .. ..... ... ... 7 Soils ..... ................... ....... .... ........... .......... .. ........ ..... ... ... .. .... .......... .... ... ... ..... .. ... 7
Irrigation Scheduling for Wine Grapes .. ............. ...... ... ..... ..... ...... ................. .... . 8 ETo Estimates for Sonoma and Napa ..... ................ ......... .......... ........ ........... ... 8 Kc Values for Wine Grapes in Sonoma and Napa ..... ................. ............ ........ . 9 ETc Estimates for Sonoma and Napa .. ........ ..... ...... ........ .... ... .... .......... ...... .. .. 10
PROCEDURES AND METHODS .. .. .... ... .. ................ ..... ............... ...... ... ...... ... . 12 Laying Out the Field .... ................ ... ...... ........... ......... ................. .. ...... ........ ..... . 12
Different Types of Soil ... ... ........... .. .. .... ..... .... ... ... ........ ... ... ...... .. ....... ...... .... ... 12 Laying out the Vine Position .. .... ......... ........... ...... .. ....... ......... ... ........ ........... . 13 Pipe Size Considerations ... ... ... ... ..... .... .... .... ........ ... ..... ........ .. ........ ...... .. ........ 14 Filter Sizing ... ..... .............. .. ........ ..... ..... .... .. .. ...... .... ..... .... ..... ....... ........ ... ... ..... 15 Drip Line Design ........ .... ... ...... .......... ... ..... ............... .. ............... ... ...... .......... . 17 Manifold Line Design ... .. ... ...... ......... .. ......... ....... .... ........ .... ........ .. .... .... ... ... ... 20 Sub-Main Line Design ... ... ...... ....... ...... .... ....... ....... ... .... ..... ......... ... .... ........ .. .. 22 Main Line Calculation .. .. ... ............. ...... ... .... ...... .... .. .. .. .......................... ... .. ... 23
RESULTS ....... .... ... .. .. ..... .......... .. ...... ... ... .. .... .............. .. .. ............. ....... ........ .... .... 24 Cost Analysis .... ........ ...... ...... ........... ..... ......... ... .... .... ............ .. ... ...... ........ ..... . 24
Vl

Drip Line Costs ... ..... .. ...... ....... ........... ................ ......... ........... ... ...... ..... .......... 24 Manifold Line Costs .... ............... ............ ........... .... ..... ... .... .... ... ... .......... .... ... . 24 Sub-Main Line Costs .. ... .. ...... .... ......... ................. ... ..... ............. ....... .............. 25 Main Line Costs ... ... .......... ... ..... ...... ..... .. ............. .... ... ............ ... ....... ..... .... ... .. 26 Total Pipe Costs ............ .............. ........ ..... ........ ..... ....... .. ......... .. ....... ....... ..... .. 26 Filter Costs ..... ... .......... ..................... ... ................................ ... ..... ........ ...... ... .. 26 Labor Costs .... ... .. ....... ...................... ... .......... ......... ..................... .............. .... . 27 Total Project Costs ... .. .... ... ...... .......... ... ...... .................................. ............. ..... 27 System Efficiency .... ................... ...... ... .... ................. ......... ... ... .. ... ..... ...... ...... 27
DISCUSSION ..... ......................................... .. ........... .. ......... ...... ... ........ .............. 28 RECOMMENDATIONS ..... .. ... .............................. ......... ............ ... ........ .... ........ 29 REFERENCES ............................................................................ ... .... ......... .... ... 30 APPENDICES .......... ............................ ............... ............. ............. ... .......... ........ 31
Appendix A: Senior Project Contract ... ............ ............... ......... .. ... ........... ....... 32 Appendix B: Example Design Calculations ... .......... ........ ... ....... .. .. .. .... .... .... ... 36 Appendix C: Costs Spreadsheet ... ....... .... ........ ............. .............. ...... ................ 39
Vll

LIST OF FIGURES
Page
1. Picture of a Vineyard with a Drip System Installed .. ... ......... ... ... .. .. .. . ... ...... 1
2. Graph Showing the Relation between Depth of Water and Soil Moisture .. ...... ...... 2
3. Overhead Sprinklers on a Vineyard Used for Frost Protection ... . . .. .... .. .... . . . .... 5
4. Netafim .5 gal!hr Pressure Compensating Emitter. .. ..... ........... .. . ..... . .. .. .. .... 6
5. Graph Showing Relative ETo Values of the Sonoma and Napa Region .. . . . . ... . . . 9
6. Chart Graphing Soil Tension versus Water Applied .. .... .......... .... ........ .. .. .. 11
7. Picture of Field to Have Irrigation System Installed .. ............ .. .................. 14
8. Picture of Different Filters that could be Used to Filter Water. .. ....... . ........ ... 16
9. Head Loss of Different Netafim Disc Filters ...... . . .. ...... .... .. ... . .. . ...... ... ..... 17
10. Equation for Hazen Williams Formula . . . . ....... . . .... .. ....... . ........ . ..... .... . .... 18
11. Picture of Completed Irrigation System Design ... .. ...... .... .... . . . .. . . .. . . . . ... . . .. 25
vm
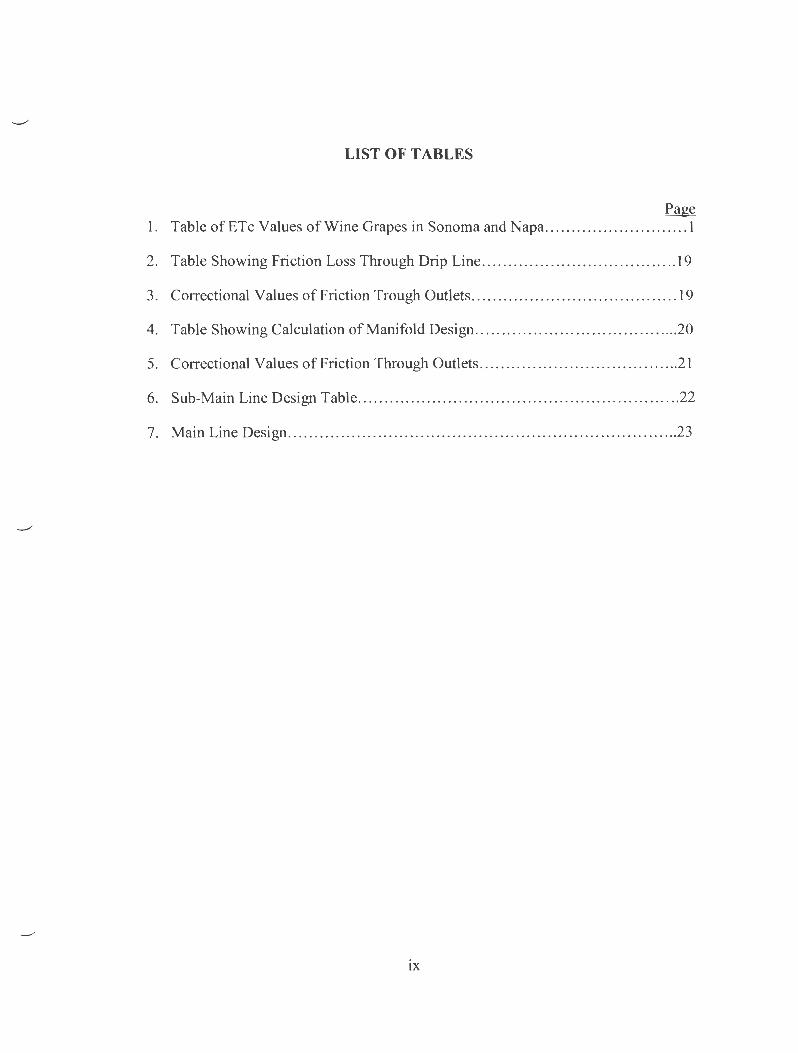
LIST OF TABLES
Page 1. Table of ETc Values of Wine Grapes in Sonoma and Napa ... .. .... . . ....... .. ..... . . 1
2. Table Showing Friction Loss Through Drip Line .. .. . .. .. . . ......... ...... .. . .. . .. ... 19
3. Correctional Values of Friction Trough Outlets .... .. .... .... .. .. .................... . 19
4. Table Showing Calculation of Manifold Design . ............ ....... ...... . .... .... .. .. 20
5. Correctional Values of Friction Through Outlets ........ .. .......... ........ .......... 21
6. Sub-Main Line Design Table .. .. . ........... .... ... .... . .. ....... ... . .. .. .. ...... ..... .. .22
7. Main Line Design . ... .. ..... ... ... ...... . .... ....... . . . . .. .. .. . ....... . .. ...... . . .. . . ... ... 23
IX

. _,;
INTRODUCTION
Background
In recent years, vineyards have been becoming more popular in areas like the central coast due to the ideal climate. Growing grapes is something that takes time and a lot of practice to manage a vineyard properly. Grapes are sensitive to drought like conditions, which makes the need for an effective irrigation system essential. Having an irrigation system that will work properly and be reliable will make running a vineyard, and controlling the irrigation schedule much more manageable for the irrigator. In order to manage a vineyard, the manager needs to be knowledgeable about how to maintain and operate the irrigation system .. There is a lot to know about grapes and how to make wine out of them.
Figure 1. Above is a picture of a vineyard with a drip irrigation system.
1
There are many processes that are involved to tum grapes into wine and it all starts with the irrigation system. Many vineyard managers are most concerned when the grapes are in their young phases. Grapes are most sensitive to disease and chance of dying during the first few months, so am efficient and properly working irrigation system should be in place by the time the vines are planted, almost all vineyards are using the drip system to irrigate their crop because it is efficient and easy to regulate how much water is able to be applied to the field.
When designing the layout of the system, it is important to pay attention to detail and consider all factors that are necessary. Factors that need to be considered include amount of pressure and gallons per minute from the pump, water quality, and size of field needed to be irrigated. All these factors can have a big impact on the design for the system, and
2
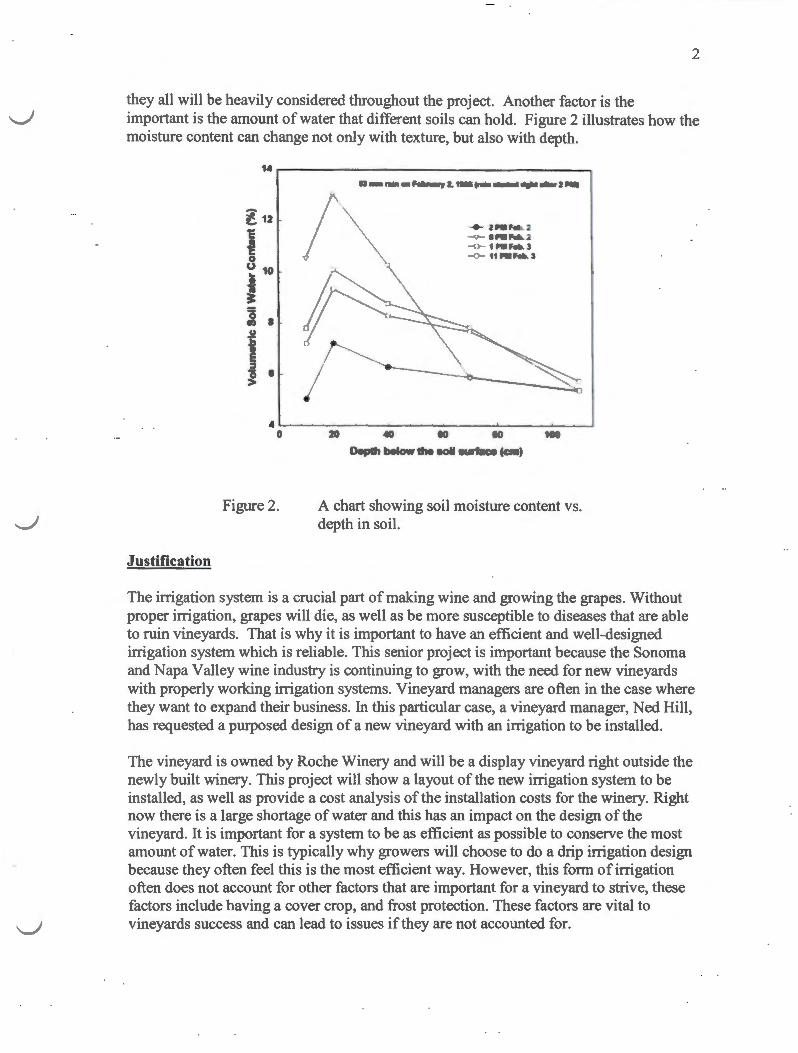
they all will be heavily considered throughout the project. Another factor is the important is the amount of water that different soils can hold. Figure 2 illustrates how the moisture content can change not only with texture, but also with depth.
14
~ 12
c a c 0 0 10 CD' .. ~ 0
8 tn (J
'E .. E. :I 0 e. >
" 0
Figure 2.
Justification
S3
A chart showing soil moisture content vs. depth in soil.
The irrigation system is a crucial part of making wine and growing the grapes. Without proper irrigation, grapes will die, as well as be more susceptible to diseases that are able to ruin vineyards. That is why it is important to have an efficient and well-designed irrigation system which is reliable. This senior project is important because the Sonoma and Napa Valley wine industry is continuing to grow, with the need for new vineyards with properly working irrigation systems. Vineyard managers are often in the case where they want to expand their business. In this particular case, a vineyard manager, Ned Hill, has requested a purposed design of a new vineyard with an irrigation to be installed.
The vineyard is owned by Roche Winery and will be a display vineyard right outside the newly built winery. This project will show a layout of the new irrigation system to be installed, as well as provide a cost analysis of the installation costs for the winery. Right now there is a large shortage of water and this has an impact on the design of the vineyard. It is important for a system to be as efficient as possible to conserve the most amount of water. This is typically why growers will choose to do a drip irrigation design because they often feel this is the most efficient way. However, this form of irrigation often does not account for other factors that are important for a vineyard to strive, these factors include having a cover crop, and frost protection. These factors are vital to vineyards success and can lead to issues if they are not accounted for.

Drip irrigation puts water solely on the plant and does not contribute to preventing frost protection or growing a cover crop making the grower use two types of systems to account for all the operations. However, if the grower were to choose to use sprinkler irrigation, they would be able to account for crop irrigation and frost protection in one irrigation event. I talked to Greg Mundia a vineyard manager at Gallo wineries and he told me that most designs are based upon making the system structured to your vineyard.
Objective
3
This project is to design and install an irrigation system for a newly started vineyard. The project will provide the winery as design that will be bested suited for the given parameters, and will give them an idea as to how much the project should cost. The client has asked that the project be completed in a timely matter, with decisions being made according to the designer's collaboration with the vineyard manager. There are constraints that have been set which include, amount of water being pulled from the pump which is 40 gallons per minute, the pressure from the pump which is also 40 pounds per square inch. No constraints have been as to how much the project should cost, and the winery owner trusts that the vineyard manager and designer will use best judgment in the decision making process.

4
LITERATURE REVIEW
Chardonnay Grapes
Chardonnay Grapes are a particular type of grape that grow in very specific conditions. Sonoma and Napa area is one of the best regions to grow these types of grapes. In particular, chardonnay grapes grow best in moderate climate with temperatures never reaching extreme highs. These grapes tend to grow best in areas that are rocky, and have high mineral content (Hill2014). Chardonnay grapes are sensitive to any changes that in conditions where they are growing. California Sonoma and Napa valley are known for the high quality chardonnay grapes they grow, and it is largely due to available conditions. One of the most prolific clones of chardonnay is the wente clone. The wente clone is seen as one of the highest profiting clones of chardonnay in this area. The berries are typically very small, but have high concentrations of sugar which gives the wine a sweeter taste. Wineries growing these types of grapes are typically looking to make high quality wine, rather than produce wine in bulk.
Irrigation Systems used to Water Vines
Flood. In some cases of vineyard irrigation, the manager will choose to use flood irrigation. Flood irrigation is when a great volume of water is applied to the field. There are two main types of flood irrigation, however only one is seen in the vineyard world. The two types are level basin flood irrigation and furrow irrigation. Furrow irrigation is the only type seen in vineyard because it the vines are in natural rows which make this type more practical. Furrow irrigation sends water down each row of the vineyard applying a lot of water to the field. The water infiltrates the soil at a slow rate while advancing down the field. The distribution of water with this technique is very high and it will have a high amount of wetted area. The big problem with this technique is that it calls for a lot of water which is not always available to the irrigator which is not always an option. Since there is such a high volume of water, it is often the case that much of the water will run off the field unless the timing is perfect. In this case timing to make the water run just to the edge of the field is very difficult which is why a tail water recovery system is often needed. The tail water recovery system is a drain where the water falls into, and then is pumped to the head of the field. These systems are typically costly and difficult to maintain. With the water shortage in California right now, this type of system is not the best case for new vineyards.
Sprinkler. Sprinkler systems are sometimes crucial for maintaining a vineyard for the vital role they can play. Sprinklers can serve a variety of purposes that may be essential for the success of the grapes. One of the main reasons why they are used is to irrigate the cover crop in the field. A cover crop may be used by the vineyard manager in order to fix plant essential nutrients into the soil. Crops such as grass or legumes will fix nitrogen and other minerals into the soil that will help the vines grow. This technique can be seen as a substitution to using fertilizers and other chemicals to benefit the vines. Grass is a good cover crop because it is easy to maintain and will provide those vital nutrients. The

5
sprinklers will be placed on top of the trellis system, and will shoot out over the entire field. The trellis system is the wire system that is used to train the vines. The sprinklers will irrigate all the cover crop as well as the vines themselves. Another reason why sprinklers are often used in vineyards are for fighting against frost protection. In places where the temperature gets cold enough, the vines can freeze and kill the grapes. This occurrence can be detrimental for the vines and the vineyard manager. Below is a picture showing what overhead sprinklers look like.
Figure 3. Overhead sprinklers in a vineyard.
The sprinkler system can protect against the frost in crucial times during the winter months. The way that the sprinklers can protect is by putting water on the crops during a cold night. And when the water freezes, the act of the water freezing actually releases heat into the air. The heat given off is enough to allow the vines to stay at a temperature that will keep them alive. Sprinklers can provide a huge benefit for many vineyards, and this is why they are often seen used in many different ways.
Drip. Drip systems are the most common type of irrigation system used in respect to vineyards growing grapes used to make wine. The big reason why drip irrigation is so common among these vineyards is due to that fact that drip irrigation has a high irrigation efficiency. Drip irrigation puts the water directly where the irrigator wants it, and does not lose much water to evaporation. Drip systems are typically the most efficient and save a lot of water that other systems might lose to inefficacies. Another reason why many managers prefer to use a drip system is for the versatility it provides. Using a drip systems allows the irrigator to have many different options to irrigate.
There are different types of drip line that can be used. One of which is drip hose, the other being drip tape. Drip tape is commonly used for project that are seasonal where the manager plans to rotate crops and wants to pull the tape out of the ground. Drip tape is much cheaper than the alternative of drip line because it does not last nearly as long and has more maintenance required (Netafim). Most all vineyards used by wineries have used drip irrigation to irrigate their vines. This method of irrigation is preferred because it allows the manager to easily regulate and monitor exactly how much water is being applied. The drip system is effective because it puts the water directly at the base of the plant and does not waste much water. And with the limited supply around the central

6
coast, being efficient with water is a key design issue. Talking with Mr. Hill from Sonoma, there are a few design considerations when dealing with drip emitters. According to him, there are two different ways in which he will layout the emitters in respect to the vine. If there is a considerable slope, he will put the emitters on the uphill side of the vine. However, ifthere is not a considerable slope, he will place the emitters of the west side of the vine. The reasoning behind this is due to the windy conditions that are a possibility in Sonoma. When the wind blows hard enough, it can push the water eight to ten inches away from where the dripper sits. This can affect the distribution uniformity and cause the plant to not receive as much water as what the manager believes he is putting on the plant. And since Sonoma is on the coast, the wind is coming from off shore and typically blowing west to east.
Drip Components
Emitters. As stated above with drip irrigation systems, there is a lot of versatility when dealing with which components the designer is able to use. One of these components is drip emitters, and the varying type available (Netafim). The different types range from on line emitters, where there is an emitter punched into the drip line, to in line emitters that are built into the drip line. In line emitters are a series of outlets inside the drip tape that allow water to pass through small holes. Some in line emitters have been created to be used as pressure compensating emitters. A pressure compensating emitter means that the emitter will provide a consistent amount of water through varying changes in pressure. Below is a picture of a sample emitter.
Figure 4. Netafim .5 gal/hour pressure compensating Drip emitter
The change of pressure can be seen through slopes, and friction loss for different fields. In line emitters are able to be pressure compensated by having a rigorous path that the water must traveling through prior to leaving the drip line. The downside to in line emitters is that the holes where the water comes out are predetermined and cannot be moved. This creates a problem for designers because different fields have different vine spacing's and the water might not be going exactly where the manager would like it to go. On line emitters are commonly seen due to the fact that they are easy to replace if they break or get clogged up with dirt. There are many different types of on line emitters such as the pressure compensated versus the non-compensated as seen with the in line emitters. As well as having pressure compensated emitters, there are emitters that release different amounts of water (Netafim). The standard flow rates that these types of emitters put out are, half gallon, one gallon, and two gallon per hour emitters (Netafim). These

different flow rates as well as different types of emitters give the designer and the manager many options as to how they like their vineyard laid out.
7
Laterals. Lateral lines can be made from two different materials, drip hose, or Polyvinyl chloride (PVC). Depending on what makes more sense to the manger, the decision can be made either way to use one or the other. The PVC laterals are made out of a hard plastic which is typically white or light gray in color. The type of plastic is not flexible and has two different types of systems. The two systems are class and schedule. Class type PVC pipe is rated by the pressure that it is capable ofhandling. The schedule type of PVC rates the pipe based upon wall thickness. Drip hose would be connected to PVC pipe by using PVC pipe fittings for the necessary application. PVC pipe is not supposed to be used in the sunlight, therefore it is often the case where it is buried in the ground. PVC pipe is also not good for environments that have a large range of temperatures. The alternative to PVC is drip hose or Polyethylene tube (Netafim). This type oflateral is used in areas that undertake cold environments, as well as special situations where a more flexible tube is desired. This flexible type oflateral may be used where the soil conditions are rocky and rougher terrain where PVC pipe is not able to be used. The types of fittings that are able to connect this lateral line to the drip tape are push fittings, which make it easy it attach in the field .
Manifold Systems. Manifold systems are what allows the irrigator to choose whether or not a particular block will fill up with water. A manifold is simply a hub of valves that controls water flow through different pipes attached to it. Manifolds can be seen above or below ground. Below ground manifolds are operated electronically with a type of valve that will close or open depending on the function set by the irrigator. Above ground manifolds are typically at the head of each irrigation block to ensure the irrigator understands which block it turns on. These types of manifolds are typically ball valves that can either be hand operated, or set to close and open with a timer.
Filtration. Drip systems require a filter aspect to ensure that the water running through the system is clean enough and able to come out of the drip hose without plugging the line. Sand media filters are typically what is used for vineyards because they are able to filter out the small particles that will plug the system. This class was useful to optimize the efficiency of any given system that deals with irrigation and to be aware of all the factors that determine efficiency. The water quality varies depending on the source on where it is coming from. Ground water typically will have more solids that will need to be filtered out, while well water is clean and less likely to plug the irrigation system. Most all of the Sonoma region water supplies are from wells because the ground water level is to low and needs time to replenish. For this reason, in some cases it is not necessary to have sand media filters for all irrigation systems. If the well water is clean enough, a simple disc filter before the main line will be sufficient to clean the water and ensure no plugging of the drip hose.
Soils. Knowing the type of soil is important because some soils may have easier penetration into the root zone allowing the irrigator to put on less water than a soil that is more compact. Different soils react differently to water that is applied. Sandy soils are

8
light soils that have a high penetration rate of water. This means that the water will enter the soil quickly and reach far down into the root zone. The typical way to irrigate a sandy soils is to irrigate the field in short bursts very frequently. Using this technique will allow the vine to have water where it needs to rather than having the water run through the root zone and become unusable. Another soil type is on the opposite side of the spectrum where the soil is a heavy clay. A clay soil is dense and has a low penetration rate. This means that it takes a long time for the soil to absorb the water. However, when the water gets into the soil, the clay is very good at holding onto the water. For this reason, the technique for irrigating clay soils is to have long irrigation periods that are not frequent. Depending on the soil type in the field choose to do a design, the designer might want to tailor the design to favor short or long irrigation cycles. The slope and topography also are important elements to consider when choosing an irrigation system because some systems will not work with too much slope such as furrow irrigation. Vineyards are usually on hills with changing elevation, which makes drip irrigation with pressure compensating lines ideal.
Irrigation Scheduling for Wine Grapes
Scheduling is an aspect of irrigation that is very important to take into careful consideration. In order to limit the water used on a specific crop, it is important to know a few things about the scheduling. One important factor that can be useful is the ETc value to the crop. ETc values are the evapotranspiration rate at which a plant loses (uses) water. All crops have an ETc value and this value is compared to an ET0 value which is the value of a typical crop. The type of crop that the ET 0 value comes from is grass, and this value is used as a reference to compare to other crops.
The lack of water for crops in the Sonoma and Napa area has caused many wineries to switch deficit irrigation. Deficit irrigation is a technique that farmers and managers use when there is a scarce supply of water (Dandy 1996). It involves applying water only to the crop in essential times or drought sensitive periods where the crop is susceptible to dying. This technique limits the use of water and relies on a source of rain to irrigate the crops. There is of course a repercussion with using deficit irrigation and that is decreased crop yield. The lack of water clearly would decrease the amount and quality of the crop however it is sometimes necessary to use this technique to produce any crop at all when water is in such short supply.
ETo Estimates for Sonoma and Napa. When talking about the ETo of a crop, this is referring to a value that takes the average evapotranspiration of a reference crop into effect. An ETo value is the amount of water that evaporates from the soil on a standard crop. The typical crop that is used for this calculation is grass. Data is collected from areas that are isolated to yield accurate results, and then complied to give an average loss of water due to evapotranspiration. A figure below shows the average value ofETo, for the designated area particular to this project.

Figure 5.
Reference EvapoTranspiration (ETo) Zones
§J==-~A=..::... ........ ___ [!)!~-=:-.:.=.~ (g]!:;~~~~.;w
~::r-E"=~----~::=£~~= ~~,:=~!='~•
The picture above show the different values of ETo for the Sonoma and Napa valley regions
·~· ... .. ~ .. , "' ... .. 7 t.e
It is always important for irrigators to know what the ETo is for their specific areas, because based off of this number, they can get an idea of how much more water they need to apply. ETo values are gathered by CIMIS, an organization operated by the California Department of Water Resources, and distributed over the internet as a reference to be used by the public.
Kc Values for Wine Grapes in Sonoma and Napa. Kc values, or crop coefficient, are the values that give data about specific crops relating them to ETc. If an irrigator knows the ETo and the Kc value of a specific crop, they are then able to determine the ETc. A table below shows the Kc value of wine grapes in the Sonoma and Napa valley region.
9
Table 1. The table shows the evapotranspiration of vines in varying months.
Conditions ( *1) Mar Apr May Jun Jul Aug Sep Oct Nov
1 0 . 50 0 . 55 0 . 60 0 . 60 0 . 60 0 . 60 0 . 50 0 . 40 2 0 . 50 0 . 55 0 . 65 0 . 65 0 . 65 0 . 65 0 . 55 0 . 40 3 0 . 45 0 . 60 0 . 70 0 . 70 0 . 70 0 . 60 0 . 60 0 . 35 4 0 . 45 0 . 65 0 . 75 0 . 75 0 . 75 0 . 75 0 . 65 0 . 35
10
Kc values account for all factors in determining the crops evapotranspiration rate. This includes the canopy cover, row spacing, vine spacing, and percent shaded (CIMIS 2014). The Kc value is very specific to each crop and can change the ETc value drastically.
ETc Estimates for Sonoma and Napa. As stated above, the ETc of a crop can be used to determine when water should be applied to the crop. ETc, or evapotranspiration of a particular crop is the product of the Kc value multiplied by the ETo of the reference crop. Since it is reliant on the Kc and the ETo, is varies throughout the year depending on temperature and canopy cover. ETc's is one of the most useful tools that a manager can use to know when to irrigate his crops.
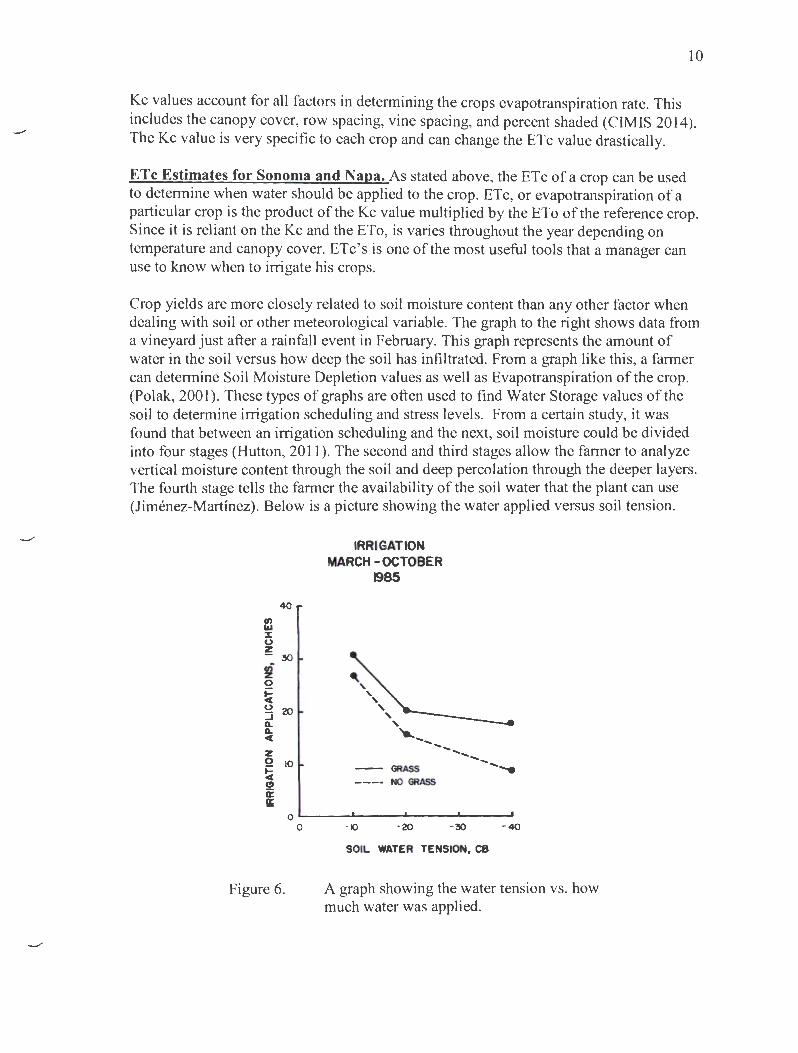
Crop yields are more closely related to soil moisture content than any other factor when dealing with soil or other meteorological variable. The graph to the right shows data from a vineyard just after a rainfall event in February. This graph represents the amount of water in the soil versus how deep the soil has infiltrated. From a graph like this, a farmer can determine Soil Moisture Depletion values as well as Evapotranspiration of the crop. (Polak, 2001). These types of graphs are often used to find Water Storage values of the soil to determine irrigation scheduling and stress levels. From a certain study, it was found that between an irrigation scheduling and the next, soil moisture could be divided into four stages (Hutton, 2011). The second and third stages allow the farmer to analyze vertical moisture content through the soil and deep percolation through the deeper layers. The fourth stage tells the farmer the availability of the soil water that the plant can use (Jimenez-Martinez). Below is a picture showing the water applied versus soil tension.
40
IRRIGATION MARCH -OCTOBER
1985
' ' ' ' ' ' ' .......... ... -... ....... __
- GRASS .............. .._,.
---· NO GRASS
o L-----L-----~----~----~
0
Figure 6.
- 20 -40
SOIL WATER TENSION, CB
A graph showing the water tension vs. how much water was applied.

11
Irrigating at critical times is an important factor when dealing with irrigation scheduling. When dealing with time to irrigate, it is important to know what the soil moisture content at specific times of the growth cycle. One of the biggest factors that cause tension in the soil has to do with the amount of water that is used to irrigate the crop. From a study relating amount of water applied to tension in the soil, (Fares 2000) it is clear that with the more water applied to the plant, the less the tension in the soil will be. The graph to the right from this study gives a good representation of this relationship.
Figure five gives data that shows how with the more inches applied, the less the soil tension will be. This data is important to the farmer because it allows him to know how much he needs to apply in order to obtain and certain tension in the soil. For citrus, a tension value around negative 30 centi-bars will usually end in wilting of the plant. This value could be a target value that they want to get the soil to in order to stress the plant in order to make the plant bloom without killing it (Fernandez).

12
PROCEDURES AND METHODS
Laying out the Field
Different Types of Soil. When starting to design an irrigation system for a newly planted vineyard, there are many different design considerations and factors that need to take place. This project consisted of working with a vineyard managing company designing and performing a cost analysis of a newly planted vineyard.
Initial considerations consisted of determining soil type, as well as the topography of the land to be used. Soil type has a large consideration of how much water needs to be applied, and varying crops will be better fit depending on soil varieties. The project sponsor gave his feedback on which type of grape would work best with the soil provided and his opinion on how much water would be required to apply each week. Determining the amount of water each vine will need is an important detail because it becomes the basis for the size of the well and pump necessary to provide enough water for the entire field. Soil conditions vary throughout the Napa Coast region, so much that five different soil types can be seen in as small an area as six acres. For this reason, it has been determined that many different small irrigation blocks will be designed to allow for separate irrigation for the different soil types. Having specific irrigation blocks will allow the irrigator to apply exactly how much water the vine needs in order to grow without the need to apply a bunch of water to the entire field. The water infiltration rate varies among these different soils, which is why more or less water is required to bring the soil to carrying capacity. A common soil in this area is a heavy clay soil rich with nutrients and water holding capacity. This soil will hold water for long periods of time, meaning it has a slow infiltration rate. The slower the infiltration rate, the less frequent the soil needs to be irrigated. This can be compared to a sandy soil which can also be seen in the Napa region, where this type needs to be irrigated very frequently due to its high infiltration rate. Dealing with different soils in one field can be tricky due to the different requirements of each one.
A common strategy to deal with varying soil types is putting them into separate irrigation blocks. When dealing with the two main different types of soils, sandy and heavy clay, there are different techniques of watering to accommodate for each. Clay heavy soils usually get watered much less frequently than a sandy soil, but will receive a lot of water at one time. An example of an irrigation schedule that would be used for a clay soil with a mature vine would be once a week for eight hours (Hill). On the other hand, a sandy soil with the same level of maturity would typically see an irrigation event of three times a week for around three hours (Hill) . With such a difference in the timing of the irrigation events and how water infiltrates through the two different types of soils, it makes sense to divide the soils into different irrigation blocks. The result will be a better use of water, and allow the irrigator to adjust the water added according to the plants response to the soil.
In order to bury all the irrigation pipes under the field and the ground, the field needs to be prepared in many different ways. One way in which the field needs be prepared is to

13
stake out all the places where the vines will be placed. The way this was done was by taking a transit, and creating a perimeter of straight lines along the edge of the field. Once this step was completed, the workers would take one hundred feet of wire between two people and stretch it out perpendicular to the edge of the field. The hundred feet of wire is marked off with tick marks in increments that are desired by the vineyard manager. For example, if a vineyard manager wanted to have a vine spacing of four feet by eight feet, the tick marks would be spread out along the one hundred foot in increments of four feet. Everywhere there is a tick mark, the workers would stick a plastic knife into the ground marking where the vine will potentially be placed. This gives the vineyard manager a good idea about what the field will look like when the vines have been planted. The workers will go through the entire field marking out a grid specific to the design desired by the manager.
Laying out the Vine Position. After the knifing is done, the big issue with preparing the field is trenching the holes and lines that the irrigation pipes will be put into. Determining how big the holes need to be is an important consideration because time spent trenching is expensive and can slow down the entire process of getting the field ready to install the irrigation system. Determining the size of the holes will vary depending on how many pipes will need to be dropped down into the trench. The pipe sizes will be different sizes according to the different types of pipes used for the field. Some of the pipes will be used as main line, sub-main line, lateral lines, and manifold lines which are all going to be differing in size to accommodate for friction loss through the pipes.
Another method that will be used to dig bigger holes for installing pipes is using a backhoe. Using a backhoe will cut down on time, limiting the number of passes necessary to make a large enough hole. However, finding an operator qualified will increase the cost of the project due to safety regulations. Besides the trench needed for the main line, the trencher will be sufficient to make deep enough and wide enough holes to fit the necessary pipes. It was determined that a mainline trench would run the length of the field containing the necessary pipes to meet pressure and flow rate requirements at the end of the field. This method of trenching was determined to be the cheapest in value as well as being an effective design. Figure six below shows the field that will be used to create a new vineyard with a proper irrigation system.
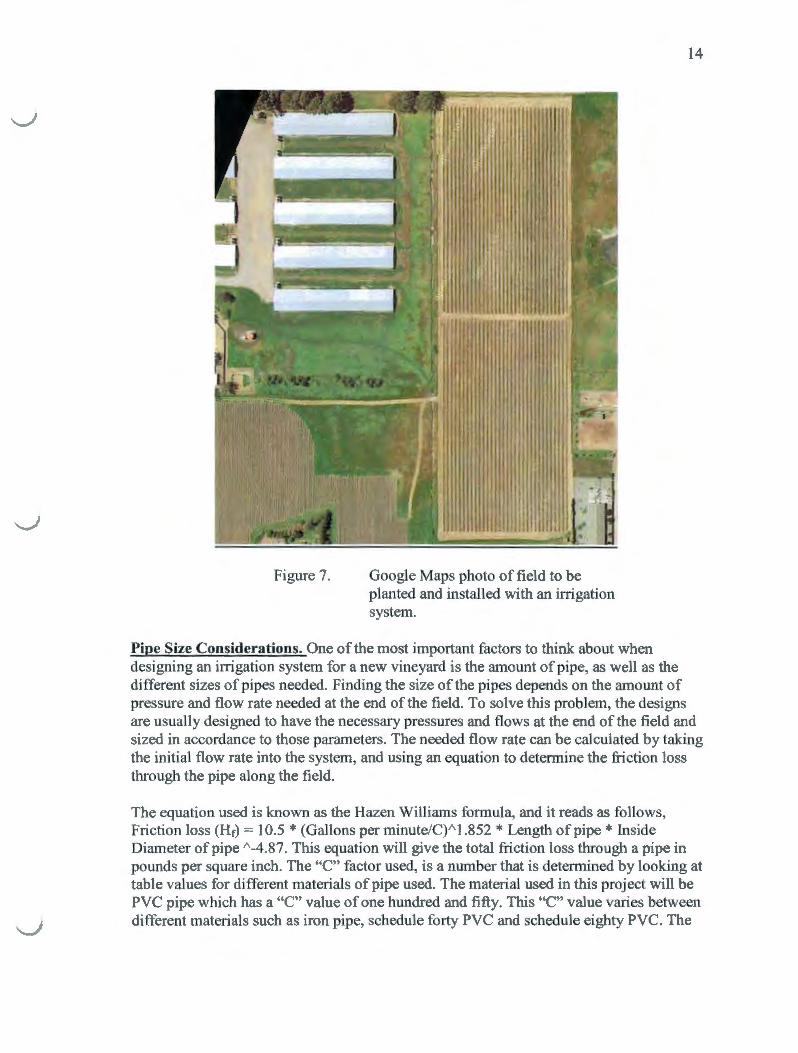
Figure 7. Google Maps photo of field to be planted and installed with an irrigation system.
14
Pipe Size Considerations. One of the most important factors to think about when designing an irrigation system for a new vineyard is the amount of pipe, as well as the different sizes of pipes needed. Finding the size of the pipes depends on the amount of pressure and flow rate needed at the end of the field. To solve this problem, the designs are usually designed to have the necessary pressures and flows at the end of the field and sized in accordance to those parameters. The needed flow rate can be calculated by taking the initial flow rate into the system, and using an equation to determine the friction loss through the pipe along the field.
The equation used is known as the Hazen Williams formula, and it reads as follows, Friction loss (Hr) = 10.5 *(Gallons per minute/C)Al.852 *Length of pipe* Inside Diameter of pipe A-4.87. This equation will give the total friction loss through a pipe in pounds per square inch. The "C" factor used, is a number that is determined by looking at table values for different materials of pipe used. The material used in this project will be PVC pipe which has a "C" value of one hundred and fifty. This "C" value varies between different materials such as iron pipe, schedule forty PVC and schedule eighty PVC. The
15
inside diameter is also a number that is looked up in a table and varies for different materials. This calculation yields a result that is in pounds per square inch for how much the pressure will drop through the pipe. This is one of the most important calculations that is used because it allows the designer to determine what the pressure will be at the end of the field which they can then size the pipes accordingly. Determining the right size pipe is crucial because when buying a lot of it, it can get expensive, so designers often try to find the smallest usable pipe without having the pressure drop too much.
One of the largest factors to consider when developing a design for an irrigation system, is the amount of water that is able to be supplied. The water requirements to irrigate a field are probably one of the most crucial elements to sizing and designing an irrigation system. The number ofblocks that are able to be irrigate at one time, and the size of the pipes all depend upon how much water is able to be acquired from the well or the pump. The sponsor wanted to break the field into many small blocks due to varying soil conditions, which will be ideal for watering because the water from the well is not enough to irrigate the entire field at one time. The field has an available forty gallons per minute capacity to be delivered. This forty gallons per minute has a pressure of forty pounds per square inch.
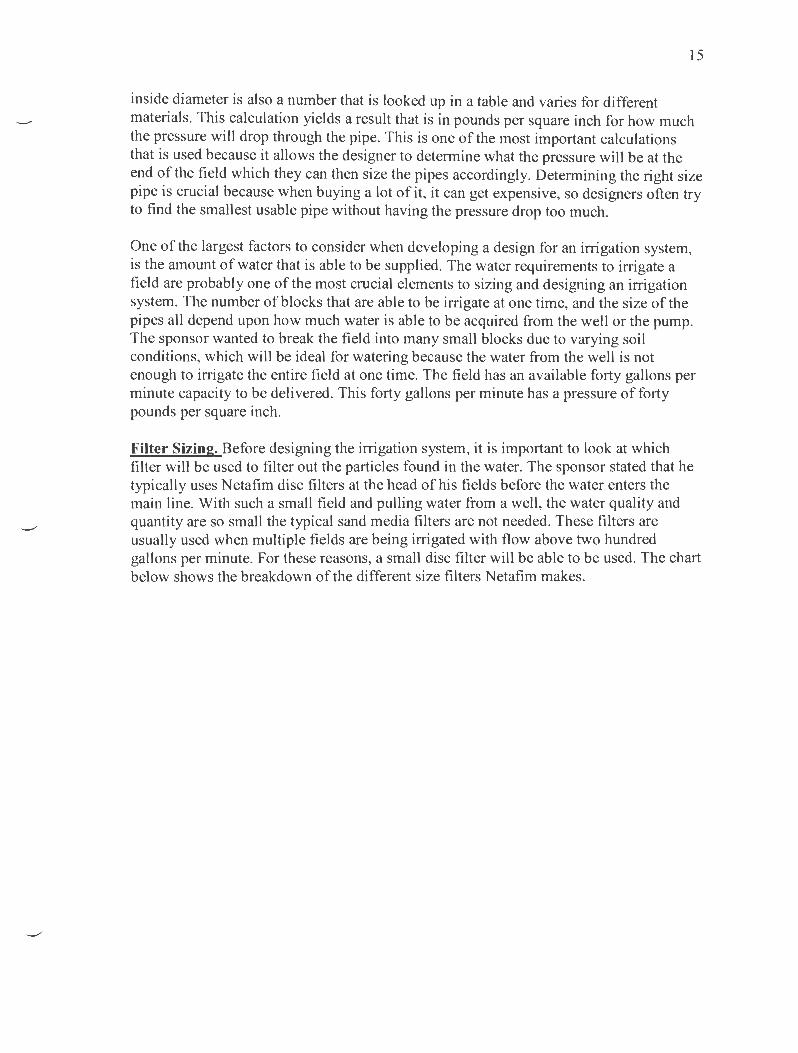
Filter Sizing. Before designing the irrigation system, it is important to look at which filter will be used to filter out the particles found in the water. The sponsor stated that he typically uses Netafim disc filters at the head of his fields before the water enters the main line. With such a small field and pulling water from a well, the water quality and quantity are so small the typical sand media filters are not needed. These filters are usually used when multiple fields are being irrigated with flow above two hundred gallons per minute. For these reasons, a small disc filter will be able to be used. The chart below shows the breakdown of the different size filters Netafim makes.

MANUAL DISC FILTERS
3!4" FI.TER RDWRANGE I 1- 12GPM I loiAICIIUioiPRESSIIII: I ! tij!li I RIIERINGSlJIJiiLI·AIIA I~ RlltRINGVOUJII£ 1 §lm in I 1INt'!H I~ Wlll11l I~ WEIOIIT ~~ DISWICE III£1W!Bj I!ClS I ____£_J 1Nl1El'IDUII£T DIAMElEI I W4" Mola 1 IIOOB.IIIIIID I _... I
R.OWRANGE II 5-lliGI'M I loiAliiiiUIIIPilESSUIE I~
ALTERING SUIIFACEIAA£A ~~
RLTERINGVOWME ~~
LENGTH ~~ W1DTil I~ W!'IGHT ~~ JJISTAI«)EIIffiYEENOOS l__! !!:!!:.._j INIHIOUII£TDIAUE1131 I~ MODaiiUMB<R I 25A41-- I
-4- IN
1" SUPER ALTER FlllWRANGE I 10-l!iGI'M I MAXIMUM PRESS liE I_ __ !! . .!'!...J Rl.TERIHGSl!RFAilEAR£A I~
RLTERIHGYOUJK I 'llcu.in. I lBIIiTl! 1 mw 1 Wlll11l I~ WllGHT I~ lliSTAIIJ{II£T'MBIOOS ~~
INI!T/DUII£TIJIAI.I£1B1 I~ IIODEUWIIIIER I l!iA!S-"' I
"£ DUAL UTI ALTER 3" TWIN UTI fi.TER ruJWAANGE I 41 - 11061'11 1
MAXJMUM'Pli[SSlJRE ~~ rutiiNG liiiiFACEIAIP I Kllq.OI. I rutiiNG YOWK I 15.7 cu. in I IIBIG1H ~~ W10111 I~ WEIGHT 1---..ill!L.J I)!STAIII];II£1W!Bj'!NDS I__!!!!L_l ! ftET.ounETDIAMrnR 1__!::~ UODB.lllUBil1 I 25A2DL-- I
FlllWAANGE MAXIMUM P!1ESSUlE RIJEIIINGSIIII'ACEAREA R!IE1INGVDUJK l.ENG111 'Mimi 'WEIGHT DISTA!a llffiYEEN OOS IM'EI/DUllfTD!AIIrnR IIDDa'NUIIII!R
11- llDGPM 115•poi
l!M5sq.in.
J1.4tu.il.
,!JI:!/4" 114'32" Ilk
unw l'"llaagod
l5\m-"'f
Figure 8. This picture shows the breakdown of different N etafim filters.
16
Knowing that the pump runs at an optimum efficiency of forty gallons per minute producing forty psi, the decision was clear as to which filter would best fit these requirements. The chart shows that both the one inch filters are not within the acceptable ranger of forty gallons per minute, while the three inch filter is much too high. This makes the two inch filter the clear choice, and looking at the pressure capability of up to one hundred and fifteen psi makes this the best of choice of filter. As with all components that water passes through, there is some pressure loss through the filters. The following chart shows the head loss in psi according to flow rate and filter size.

MA'Nt!JAI.. Dm; RlliERS
I FILTER APPUCATION RECOMMENDATIONS
~..!!J__!:_j r Siftl l t t/T II ttJT stml ll r ooAL':i~:~Uif l T lWNIIIE j TAHCt£ 11 nww 11. rl\WI I ~ __j_j_____j_____j____j____j__j__j__j ___!!____] 2.50 • __j_j____j____j___j____j__j__j__j ____!!_j lAO 1.31 __j_j_____j____j____j____j__j__j__j ___!!__j 5.17 2.10 __j_j_____j____j____j____j__j__j__j _____?!_j_j ll( .. __j____j____j____j__j__j__j ___L_j__j__j 151 1.ll __j__j__j__j__j__j _!!_j__j_j 2.11 110 2.11 ____j__j__j__j__j__j ___!_J__j__j 2.50 2.ll 2.50 __j __j__j__j__j ~__j_j__j_j 4.20 ____j__j__j__j __!_j_j_j__j_j_____j ____j__j__j__j ~__j I J__j___j til tll __j__j _!!__J_j I l___j____j w u 1 __j__j ___!Lj_j_j__j_j_____j___j____j __j__j ~_j_j__j_j___j____j____j 1.*1 0.81 __j__j ~__j__j__j__j____l____j__j 228 l.ll! __j__j ~__j__j__j___l___j__j____j__j 1.32 __j__j ~_j_j__j_j___j____j____j____j 1.£1 __j__j ~_j_j__j_j___j____j____j____j__j__j__j ~__j__j___j__j___j____j____j____j__j__j__j
~_j_j___j_j___j____j____j__j__j__j__j ~_j_j___j_j___j____j____j____j__j _!!_j_j_j___j_j___j____j____j____j__j ~_j_j___j_j___j____j__j____j__j 1.£1
_.!!_j_j__j___j__j___j____j____j____j__j ,.. t!ill
~_j_j___j_j___j____j____j____j__j__j 2.110
~_j_j___j_j___j____j____j____j__j__j 1110 ............. -..........
0.110 -·-
Figure 9. Head loss through different disc filters.
17
The filter chosen was the two inch Dual Lite filter, and by looking at the gallons per minute known of eighty eight, pulling from well water the pressure will drop around one psi. The reason the chart shows values for one some of the flow rates, is that the chart is based upon filters that have one hundred and forty mesh. One hundred and forty mesh means that in a one by one square inch, there are one hundred and forty orifices for a particle to pass through. This mesh size is commonly seen in the agriculture world. A pressure drop of only one psi is acceptable for the requirements of the field. This means the pressure at the head of the filed will be equal to thirty nine psi.
Drip Line Design. The first step when to consider when designing an irrigation system, is the critical path of the water as it flows through the irrigation system. What this means is it is the part of the field that is furthest away from the pump, in which the flow and pressure will seemingly be the smallest. If the designer makes sure everything is sized correctly for this part of the field, then the rest of the field will already be sized to match the pressure and flow requirements. Once the critical path was found, the next step is to determine the friction needed at the head of the manifold to supply the section or half section with enough pressure to feed the entire line. Looking at the range the emitters are able to be run, seven to forty five pounds per square inch (psi), (Netafim) a pressure of twenty psi was chosen as an average pressure in which the emitters would run for best uniformity results. With twenty psi as the average pressure needed, the head of each line will need more pressure than this to compensate for the pressure drop through each

18
emitter as it goes through the line. Using the equation, Pin= Pavg+ ( ~ )Total Friction (Hr) + ( 12 ) Elevation change, we are able to determine the inlet pressure (Pin) needed to meet the pressure requirement for each emitter. Solving for Pin is as follows:
1. Determine what psi P avg will be 2. Add ~ of the total friction plus half the elevation change, zero in this case
The friction is found by looking at tables that can be found in the ITRC Basic Hydraulic Book. Table 1-7 gives a "C" value, a constant based upon friction factor through different materials, and a relative friction value of 1.2 psi for drip hose with emitters on the line. Taking ~ of the friction, 1.2, and multiplying that by the correction factor found in table 1-9 in the ITRC Basic Hydraulics Handbook of .3525, the Pin is determined to be 20.3168. The correction factor used from the ITRC handbook is needed to accommodate for the drop in flow rate between each emitter in the drip line.
Since the flow drops between each emitter, this means the friction will not drop as much either. The correction factor is a way to factor in the ever changing flow rate through the line. Knowing that Pin needs to be 20.3168 or greater, it was determined that the pressure should be at least 22 psi at the head of the last drip line on the critical path. Once the friction for the last line was calculated, the flow rate needed to irrigate the field was then found. The calculation was done as follows:
1. Determine the length of the section 2. Number of vines per row in the section 3. How many emitters per vine and vine spacing 4. Determine the spacing of emitters 5. Type of emitter and flow rate
Once all these factors are considered, the GPM needed to irrigate the field is:
. . Sgal lhr 88 emr.:t:ters * - h.- .73 ·GPM per Line
·r 60m.in
Figure 10. The above equation shows the formula for the Hazen Williams equation.
(1)
This equation gave the GPM constraint per line of emitters in the field, which then was used to find the friction loss through each emitter line. The friction loss was determined from the equation written below.
GPM , :;uss;z H(f) = 10.5 *(c-) L * (!0 - 4
·87
)
(2)

19
Table 2. Below is a graph showing the calculation of
Friction Loss Through Drip Line
the friction loss through the drip line
(.73 GPM)t-852
10.5 * 143 *176ft* (.6-4.87)
Total Hf (ft) = 1.27
Total Hf (psi) 0.55
Corrected Hf (psi) = 0.20
The GPM as stated above was .73 , and the "C" factor used was 143 found in the ITRC handbook. The length of the drip line was 176 feet and the inside diameter of the tape was .60 inches. The total friction loss was found for the line which came out to be .55 psi, however this is not the correct friction to be used. Since the flow is dropping after each emitter it passes through, the friction loss will decrease as it goes along the line. In order to compensate for the dropping flow, a table was created relating the number of outlets to a correction factor. The table can be found in the ITRC Basic Hydraulic handbook and is shown below.
Table 3. The table below shows the correctional factors from the BRAE 312 Hydraulics book.
Number of Outlets on Lateral Correction Line Factor (F)
1 1
5 0.457
10 0.402
20 0.38
40 0 .364
100 0.356
The emitter line has a total of 8 8 emitters along the length of it, meaning there water will be coming out in 88 places. Since there are 88 outlets, the flow rate will drop a little bit 88 times. In order to correct for the friction, the chart gives correctional factors which can be applied to the total friction found. By linearly interpolating for 88 outlets, it was

20
concluded that a correctional factor of .3576 would be used to obtain the correct friction value. Multiplying this value by the total friction found from the Hazen Williams equation, which was .55 psi, it was concluded to have a final friction loss of .196 psi per emitter line.
After this calculation, the flow requirement calculation was computed to find the necessary flow for the block. This was done by multiplying the gallons per line needed, . 73 GPM, by the number of lines in the section to be irrigated which is 13 lines, yielding a GPM of9.57. In order to make sure enough water will be supplied, the number was rounded up to 1 0 GPM. The result is the number of GPM needed to run through the pipe for all the drip emitters to operate at the designed pressure. This 10 GPM will be the water needed to run half of the section containing the critical path, meaning the entire block will need to have 20 GPM running into the head of the manifold. The next step is to determine the manifold pipe size, keeping in mind friction loss through the pipe. An excel spreadsheet was made to show the decision process.
Manifold Line Design. The next step in the process of designing a drip irrigation system is to determine the size for the manifold line. Determining the size of this line depends on how much friction loss will exist through the pipe given the flow rate. Knowing the needed flow rate of 10 GPM to irrigate the block, the friction loss was able to be calculated. The chart below was created in excel to make a decision on which pipe size should be used.
Table 4.
Manifold Design
Pipe Diameter
Pipe Diameter (ID)
Total Hf (ft)=
Total Hf (psi)=
Corrected Hf (psi)=
A table was created in Microsoft Excel to compute friction loss.
2 1.5 1.25 1 0.75
2.07 1.61 1.38 1.05 0.82
0.22 0.75 1.65 6.27 20.32
0.10 0.32 0.71 8.80
0.03 0.11 0.25 3.10
As shown above, a chart was created to determine the best size pipe for the manifold line. Various pipe sizes are given with their respected inside diameters for ease of calculation. The Hazen Williams equation was used to find the friction loss through the section of pipe. The Hazen Williams equation is,
(GPM)ul.52
H(f) = 10.5 * · -c * L * (/D - 4·8')
(2)
21
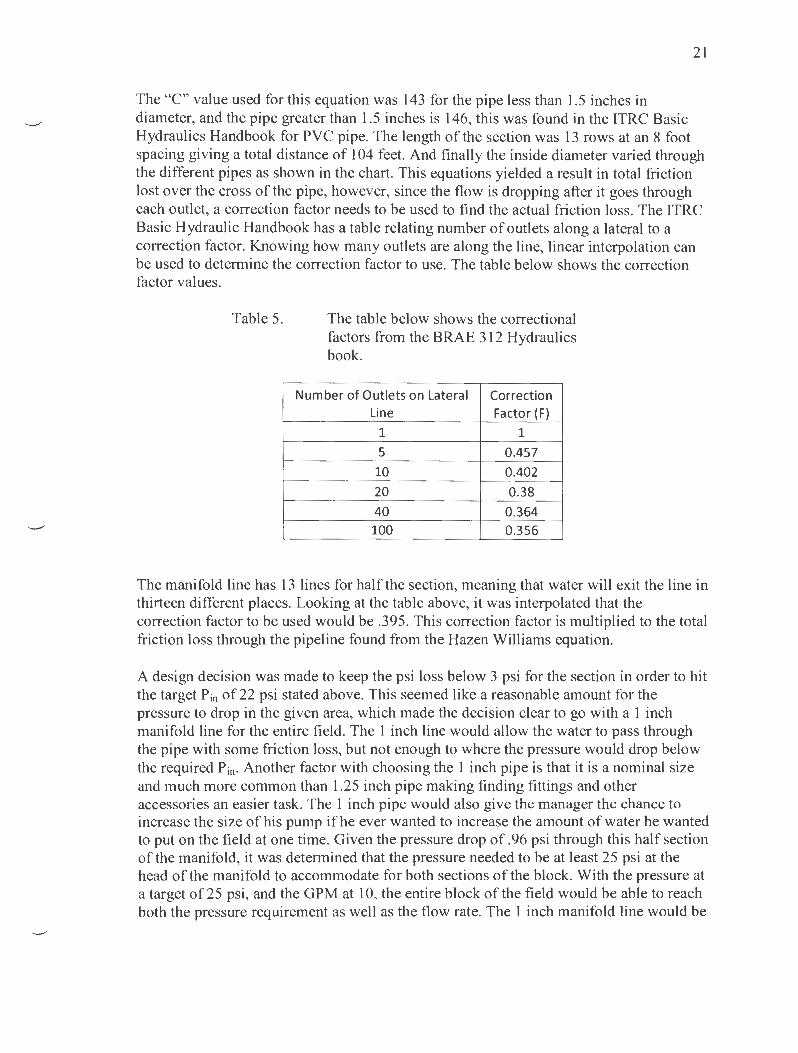
The "C" value used for this equation was 143 for the pipe less than 1.5 inches in diameter, and the pipe greater than 1.5 inches is 146, this was found in the ITRC Basic Hydraulics Handbook for PVC pipe. The length of the section was 13 rows at an 8 foot spacing giving a total distance of 104 feet. And finally the inside diameter varied through the different pipes as shown in the chart. This equations yielded a result in total friction lost over the cross of the pipe, however, since the flow is dropping after it goes through each outlet, a correction factor needs to be used to find the actual friction loss. The ITRC Basic Hydraulic Handbook has a table relating number of outlets along a lateral to a correction factor. Knowing how many outlets are along the line, linear interpolation can be used to determine the correction factor to use. The table below shows the correction factor values.
Table 5. The table below shows the correctional factors from the BRAE 312 Hydraulics book.
Number of Outlets on Lateral Correction Line Factor (F)
1 1
5 0.457
10 0.402
20 0.38
40 0.364 100 0.356
The manifold line has 13 lines for half the section, meaning that water will exit the line in thirteen different places. Looking at the table above, it was interpolated that the correction factor to be used would be .395. This correction factor is multiplied to the total friction loss through the pipeline found from the Hazen Williams equation.
A design decision was made to keep the psi loss below 3 psi for the section in order to hit the target Pin of 22 psi stated above. This seemed like a reasonable amount for the pressure to drop in the given area, which made the decision clear to go with a 1 inch manifold line for the entire field. The 1 inch line would allow the water to pass through the pipe with some friction loss, but not enough to where the pressure would drop below the required Pin· Another factor with choosing the 1 inch pipe is that it is a nominal size and much more common than 1.25 inch pipe making finding fittings and other accessories an easier task. The 1 inch pipe would also give the manager the chance to increase the size of his pump ifhe ever wanted to increase the amount of water he wanted to put on the field at one time. Given the pressure drop of .96 psi through this half section of the manifold, it was determined that the pressure needed to be at least 25 psi at the head of the manifold to accommodate for both sections of the block. With the pressure at a target of25 psi, and the GPM at 10, the entire block of the field would be able to reach both the pressure requirement as well as the flow rate. The 1 inch manifold line would be

22
used for the entire field for ease of ordering, as well as an insurance of pipe sizing for the rest of the blocks.
Sub Main Line Design. The next element in designing the system for this field was to determine the pipe size of the sub-mainline. Knowing that the last block needs at least 25 psi to maintain an average pressure of20 psi for the entire drip line on the critical path. And knowing that the block will require 20 GPM to fill the emitters, using the Hazen Williams equation again, the pipe size of the sub-mainline is able to be determined. The following is a chart computed to show the pressure losses through the sub-mainline pipe.
Table 6.
Sub-Main Design.
Pipe Diameter
Pipe {I D)
Hf (ft)=
Hf (psi)=
The table below was created in Excel to show the friction loss through various pipe sizes for the submain line.
2.00 1.50 1.25 1.00
2.07 1.61 1.38 1.05
2.61 8 .82 18.68 71.02
1.13 8.09 30.74
The above chart was created in excel to best estimate which pipe would be best fit the requirements to bring water to the block. Again, the Hazen Williams equation was used to find the friction loss through the pipe. The results made it clear that the 1.5 inch size pipe would best fit the necessary conditions set by the previous calculations. A pressure drop of only 3.82 psi is a reasonable amount over the distance traveled by the water, therefore the decision was made to use the 1.5 inch pipe. This friction loss is an over estimate because the flow will drop at the outlets. A decision was made to oversize the line in case any future changes will be made, as well as the difference may be negligible. Since the pressure will drop 3.82 psi over the course of the sub-mainline, it was decided that the pressure needed to be at least 29 psi at the intersection of the sub-mainline and the main line. For purpose of consistency, the decision was made to make all submainline pipes uniform in size.
The adjacent block has a smaller area, therefore does not need as many GPM as the block containing the critical path. An equation to find the flow rates necessary for this block are shown below.
(:SS emit:ters) (· 5 gal) ( 1 hr ) . , . * · I * , . . . * r65 .Ltnes = 4.7<6 rGPM
lme · hr <60 mtn ' (3)

23
This 4.76 GPM is the necessary flow for half of the block supplied by the manifold line. This means that a total of9.5 GPM would be needed to irrigate the entire block, which was rounded up to 10 GPM to accommodate for minor losses. Given the constraint of the two blocks, there needs to be at least a total of 30 GPM and 29 psi at the intersection of the main line and the sub main line.
Main Line Calculation. The last step in designing the system based upon the critical path is to size the main line pipe to meet the requirements stated above. The manager has stated that the pump runs most efficiently at a production rate of 40 GPM and 40 psi. Knowing that the pressure needs to be at least 29 psi at the head of the final two blocks, a decision can be made to determine the size pipe needed to keep the friction loss in an acceptable range. Knowing the flow rate, the Hazen Williams equation is able to be used to calculate a friction loss based upon different pipe sizes. The following chart shows the breakdown of possible pipe sizes and their respected friction losses.
Table 7.
M ain Line Design
Pipe Diameter
Pipe (ID)
Hf (ft)=
Hf (psi)=
The below table shows an Excel graphed created comparing the different possible pipe sizes for the main line based on friction.
4 .00 3.00 2.50 2.00
4 .03 3.07 2.47 2.07
1.50
1
1.12 3.80 10.94 26.00 87.81
0.49 4.74 11.26 38.01
The above chart uses the Hazen Williams equation to show the varying losses due to friction. The length used was 900, stretching from the pump to the head ofthe last block in the field, with a flow rate of 40 GPM. Seen in the chart, using a pipe size of 3 inches for the main line results in loss of only 1.65 psi. Since the pressure needs to be at least 29 psi for the last two blocks, a decision was made to use 3 inch pipe for the main line. The difference in price for the larger diameter pipe does not outweigh the loss due to friction, due to the fact that it is always better to oversize a system than to undersize one. A 3 inch main line would allow the last two blocks to have plenty of pressure to run at the designed average pressure of 20 psi per emitter.
24
RESULTS
Cost Analysis. The Sponsor would like to know what the cost of the project would be estimated around. The following are calculations that were used to determine the theoretical costs of varying items. The bulk of the cost in supplies would come from the drip hose necessary to cover the expanse of the field. The next section breaks down the estimated costs for each aspect of the design containing buying pipe for the project.
Drip Line Costs. The way the cost was determined was taking the total length of feet needed for the field, calculated by the number of rows per block multiplied by the length of each block. This process was done for each individual block and then the total number of feet was then added together. After the total number of feet needed to cover every row was then divided by the number of feet in one roll of drip tape. This gave the number of rolls of drip tape to cover the field which was then multiplied by the price per roll . This gave an estimate ofthe total cost of drip tape which was $5,688.14 dollars for all the drip tape necessary.
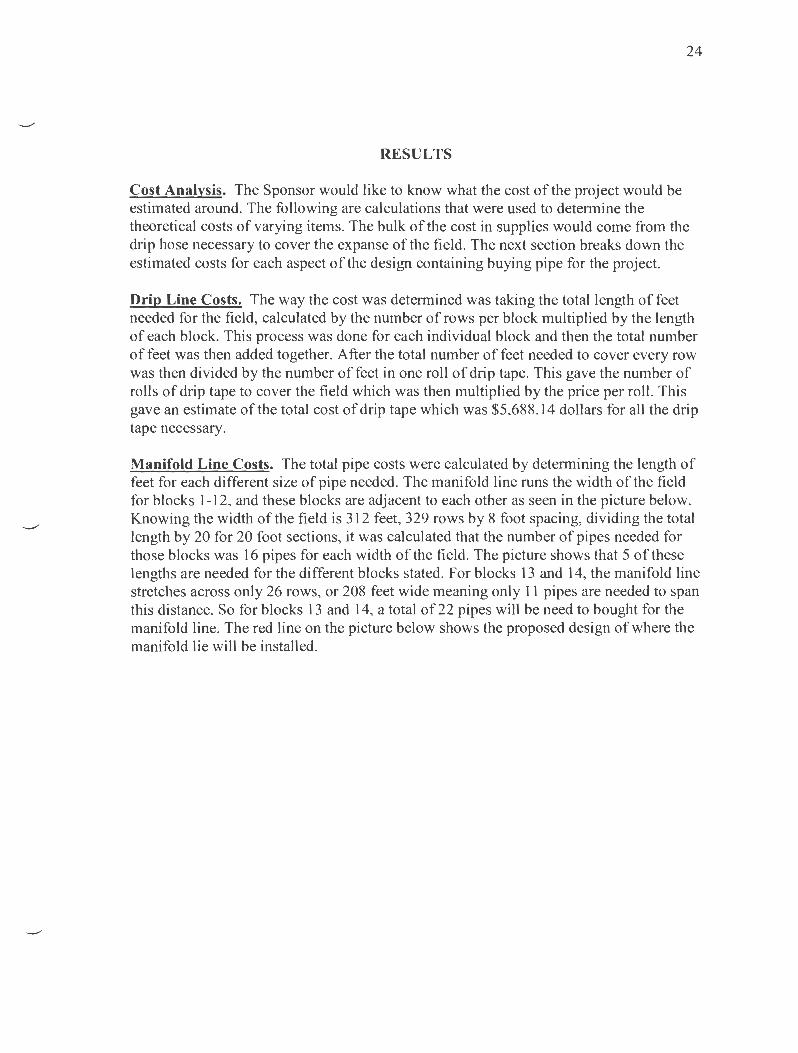
Manifold Line Costs. The total pipe costs were calculated by determining the length of feet for each different size of pipe needed. The manifold line runs the width of the field for blocks 1-12, and these blocks are adjacent to each other as seen in the picture below. Knowing the width of the field is 312 feet, 329 rows by 8 foot spacing, dividing the total length by 20 for 20 foot sections, it was calculated that the number of pipes needed for those blocks was 16 pipes for each width of the field. The picture shows that 5 of these lengths are needed for the different blocks stated. For blocks 13 and 14, the manifold line stretches across only 26 rows, or 208 feet wide meaning only 11 pipes are needed to span this distance. So for blocks 13 and 14, a total of 22 pipes will be need to bought for the manifold line. The red line on the picture below shows the proposed design of where the manifold lie will be installed.

Figure 11. The picture above was created in AutoCAD as a proposed design for the new drip system to be installed.
25
Sub-Main Line Costs. The Sub Main Line costs can be calculated in a similar way to the main line costs. In order for ease of ordering parts, the sponsor decided that he wanted to make all the parts as uniform as possible. This was why the decision was made to use pipe sizes that might be bigger than necessary for some parts of the field. Since the sub main line is all one side, a cost estimate can be made by looking at the final design, and determining distances based upon know measurements. The picture above shows a proposed design of all pipe components in the drip irrigation system. The blue line of the picture represents where the sub main line pipes will be placed to carry water from the main line to the manifold line.

26
The sub main line was over sized a little bit to compensate for friction losses, as well as allowing room for a higher capacity of water that the grower may want in the future. The cost break down for this component of the design was calculated in the same way that was done for the manifold line. Looking at the picture and knowing distances based upon vine and row spacing, an estimate was able to be calculated for how much pipe was needed. As seen in the picture, the sub main line runs across all ofrow two, and halfway across row one. This total span is twenty six rows at a spacing of eight feet between rows, giving a total distance of two hundred and eight feet. Since blocks 3, 4,5,6,7, and 8 are uniform, the sub main line goes across the field the same amount. Each of these blocks are divided into three sections of thirteen rows each.
The line will span across the two blocks closest to the main line, and halfway across the blocks furthest away. The total distance would be thirty three rows of vines, or two hundred and sixty four feet multiplied by two to span the six different irrigation blocks for a total of five hundred and twenty eight. For blocks 9,10,11 and 12, the same process was used and it was determined that the pipe needed to span twenty six rows for each block, making the total distance four hundred and sixteen. Blocks 13, and 14 are a little bit different because block 13 is in the middle of a few blocks. Looking at the picture for block 14, it can be seen that a pipe length of two hundred and eight feet is needed to span to the middle of the block. For block 13, a pipe needs to span the length of the septic area to reach the head of this block.
Knowing that the distance across this area is seventy two feet, and that block 13 is twenty six total rows, is was determined that the pipe needed to stretch across thirteen rows to reach the middle. This gave a calculation of three hundred and eighty four feet total for blocks 13 and 14. Adding up the totals from each block, it was calculated that one thousand five hundred and fifty feet of sub main line to irrigate this field. At a price of twenty three dollars and forty cents per twenty foot length, yielded a result of one thousand eight hundred and thirteen dollars and fifty cents of costs.
Main Line Costs. Calculating the cost of the main line was fairly straight forward due to the fact that it runs the length of the field. The length the main line needs to span is nine hundred feet to the head of the last block of irrigation. At a price per twenty foot length of sixty four dollars and twenty cents, the total price of the main line will be two thousand eight hundred and eighty nine dollars.
Total Pipe Costs. After adding up all the different prices found for ordering pipe, an estimate was made to determine the price of pipe needed to install this irrigation system. Adding up the values of the pipe, it was found to have a total cost of twelve thousand ten dollars, and ninety six cents. This cost will simply cover funds needed to order the pipes without all the fittings. In order to account for the parts and fittings for the rest of the project, an additional fifteen percent was added to the total cost. This came to a total of thirteen thousand eight hundred twelve dollars, and twenty nine cents.
Filter Costs. The water that is being used to irrigate the field is from a well that had been previously drilled. Typically well water is fairly clean and does not need much

27
filtration. For this reason, a simple disc filter from Netafim will be used to filter out any residual sand that may still be in the water. Looking on the Netafim website, it was found that a two inch dual lite disc filter would cost one hundred and seventeen dollars, and seventy five cents. This filter would be sufficient in the filtration needed for the project size and requirements.
Labor Costs. An estimation was computed to determine the cost of labor needed to install the system. Based upon similar sized fields and past experience, the sponsor determined that the project could roughly get completed in six work days (Hill). This estimate goes on the basis that at all times thirty workers will be working on various tasks to complete the project as soon as possible. Mr. Hill pays his workers an average often dollars and fifty cents an hour, for a ten hour day. At this rate, for a six day estimation of installation, the project will roughly cost nineteen thousand dollars in labor.
Total Project Costs. The total project costs can be seen through the simple addition of all the costs previously stated. Adding the total costs of pipe, pipe fittings, labor, and filter costs, yields a result of thirty one thousand eighteen dollars and seventy one cents.
System Efficiency. The theoretical system DU, or distribution uniformity, is a value that many vineyard managers would like to know. In many cases, how efficient the system is the most important factor to know. There is a simple way to calculate the system DU, and the equation is as follows:
System DU= DUcv * DU P
1.27 cv Where Dllcv = l - -----:;-!1. -
n<z) And cv is a value manufactures coefficient of variation.
(4)
(5)
DUp is the Distribution Uniformity of the operating pressure. The design uses emitters that are pressure compensating so there will be little variation in the pressure found . To find the DU of the pressures, the flow rate of the low quarter, Q1q, is divided by the average flow rate Qavg· In this case, the equation to find the flow rate would use the following equation:
Q= flow rate k= is a constant P= pressure of emitter x= constant based upon type of emitter
Q = kiP" (6)
Pressure compensated emitters have a factor of 0, because in an ideal world, they would make the pressure factor equal to 1. Since nothing is perfect, the value ofx is not actually 0. If in fact the value ofx was 0, then the DU due to pressure would be 1, however since it is not the case, we can estimate that the DU due to pressure will roughly be around .96.

28
If this is then multiplied by the DU according to the cv value which yielded a result of .97. Multiplying these two DU' s together results in a system DU of .93. This is a fairly common DU for most drip irrigation systems, so it makes sense logically that this could be possible.

29
DISCUSSION
Completing this project required many design decisions that were made by the designer according to prior knowledge and experience. These decisions were judgment calls that could have affected the outcome of the project. Often the case when a design project like this exists, many opinion based decisions are made in respect to what should be chosen to do. An example of this is the pressure that the drip emitters will operate. The range of the pressures stretches from seven psi to forty five psi, so there is a lot of room for usable pressure. For the ease of computation, the pressure of twenty psi was used in the project, however any value in the range of pressure values would be acceptable. Using a different P average of emitter can entirely change the pipe size necessary to accommodate for friction loss.
Decisions like the one previously stated, were made with all considerations in play and were strictly opinion based due to judgment by the designer and the advisor' s recommendations. The type of decisions like which pipe size to use based upon friction loss are also a big factor in the process because these types of choices are able to affect the cost of the project. A few different combinations of pipe sizes are able to be used, however the project was designed on the conservative side to account for possible expansion later. For this reason, decisions were made to oversize the project elevating costs of pipe by a small margin.
The project costs are only an estimate based upon past projects completed by the company. The sponsor has completed other projects like this in the past, and was able to give feedback about how was expecting the project to look.
30
RECOMMENDATIONS
There are many different ways that this project could have been set up according to how the owner pleased. Going through the project and calculations brought forward some insight as to how the project, or similar projects could be completed in the future. One main difference was the placement of the valves for the separate irrigation blocks. In the design for this project, the valves are at the head of the field. This decision was made to make it clear to the irrigator which valves would be open or closed for different irrigation schedules for the different blocks. However, this design is not the most time efficient and simplistic design.
Another possible design is to have all the valves in one central location of the field. This will make it easy for the irrigator to change the field being irrigated by having all the valves for the entire field right next to each other. The only problem that may arise with this is that it could require much more pipe. Instead of all the lines coming off the main line, sub main line pipe would have to be run all the way down the lengths of the field . The difference in design would strictly be based upon preference of the owner and which method they would prefer in the grand scheme of the project. The project was designed on a conservative basis already, however if the owner plans to expand the capability of the pump, larger pipe could have been chosen. A larger pump with larger pipe would allow the irrigator to water more blocks at a single time, rather than only the two or three that is allowed to be irrigated as of the design right now.
The overall project saw a system DU of .93. This is a relatively common Distribution Uniformity as seen with drip. The project uses two drip emitters per vine. This is a common technique for many vineyard managers. If the vineyard manager uses three emitters per vine, the system DU would increase to .94. This change is not significant to make monetary sense to add a third emitter per vine.

REFERENCES
Basu, Saikat Kumar. "Principles of Irrigation (Second Edition)." Crop Science, 52.4 (2012): 1966.
Battany, Mark C. "Vineyard Frost Protection with Upward-blowing Wind Machines." Agricultural and Forest Meteorology, 157 (2012): 39-48.
31
Bellvert, J, J Marsal, M Mata, and J Girona. "Identifying Irrigation Zones Across a 7.5-ha 'Pinot Noir' Vineyard Based on the Variability of Vine Water Status and Multispectral Images." Irrigation Science, 30.6 (2012): 499-509.
Burt, Charles M., Dr. ITRC Basic Hydraulics. San Luis Obispo: Irrigation Training & Research Center, 2012
Dandy, GC, and AM Hassanli. "Optimum Design and Operation of Multiple Subunit Drip Irrigation Systems." Journal of Irrigation and Drainage Engineering-asce, 122.5 (1996): 265-275.
Gaudi, F. 2014. Personal communication. Franklin Gaudi, Professor, Cal Poly San Luis Obispo, CA.
Heilman, J.L, K.J Mcinnes, R.W Gesch, R.J Lascano, and M.J Savage. "Effects of Trellising on the Energy Balance of a Vineyard." Agricultural and Forest Meteorology, 81.1 (1996): 79-93.
Hill, N. 2014. Personal Communication. Ned Hill, CEO, Owner, La Prenda Vineyard Management, Sonoma CA.
Lopes, Carlos M, Tiago P Santos, Ana Monteiro, M. Lucilia Rodrigues, Joaquim M Costa, and M. Manuela Chaves. "Combining Cover Cropping with Deficit Irrigation in a Mediterranean Low Vigor Vineyard." Scientia Horticulturae, 129.4 (20 11): 603-612.
Provenzano, G; Salvador, G; DIDIO, P. New computational fluid dynamic procedure to estimate friction and local losses in coextruded drip laterals. Journal of irrigation and drainage engineering. 133, 6, 520-527, Nov. 2007
R. Lamm, Freddie, and Carl R. Camp. "13. Subsurface Drip Irrigation." Developments in Agricultural Engineering, 13 (2007): 473-551. Sanders, D.C. "Drip-irrigation System Component and Design Considerations for Vegetable Crops." HortTechnology, 2.1 (1992): 25.
Yildirim, G. Total energy loss assessment for trickle lateral lines equipped with integrated in-line and on-line emitters [electronic resource]. Irrigation science. 28, 4, 341-352, May 2010.
32
APPENDICES

33
Appendix A:
Senior Project Contract

34
California Polytechnic State University December, 2013
Way, Riley BioResource and Agricultural Engineering Department
ASM Senior Project Contract 005479899 ASM
Project Title Design and Cost Analysis of a Drip Irrigation System for a new Vineyard for Cal Poly Vineyard
Background Information With the growing market of the Wine Industry, many companies are expanding or starting new Vineyards to start producing their own wine. With water issues and regulations, is it beginning to become difficult to obtain enough water to irrigate crops and sustain a healthy crop. It is necessary to design an efficient system that will meet the crop needs while considering the availability of water. Price is a large issue when talking about the scale of projects so it is important to design for only what is needed .
Statement of Work The first phase of this senior project will be to determine the size of the vineyard to be designed for, and to determine the type of Irrigation. The second phase will be determining the materials and equipment to be used as well as the costs associated with the project. The third phase will be the construction of the machine. The last phase of the project will be evaluation of the performance and efficiency of the system . The project will be completed for the Cal Poly Vineyard in their new block of grapes.
How Project Meets Requirements for the ASM Major
ASM Project Requirements - The ASM senior project must include a problem solving experience that incorporates the application of technology and the organizational skills of business and management, and quantitative, analytical problem solving.
--------- --------------------------------------------------------------------------------------------------------Application of agricultural technology
Application of business and/or management skills
Quantitative, analytical problem solving
' : The project includes local agriculture needs and design aspects ! necessary for maximum efficiency.
: This project will include making management decisions on what : type of system to use as well as the determining factors in how to : install the system.
! The project will involve cost analysis of materials needed, and : evaluating the yield of crop to make profit.
-------------- --- -----------------~------------------- - ----------------------------------------------------------
Capstone Project Experience- The ASM senior project must incorporate knowledge and skills acquired in earlier coursework (Major, Support and/or GE courses).
Incorporates knowledge/ skills from these key courses
133 Engineering Graphics, 151 AutoCAD, BRAE 236 Irrigation Principles, BRAE 312 Irrigation Hydraulics, BRAE 331 Irrigation Theory, BRAE 440 Irrigation Design, BRAE 418/419 Ag Systems Management, ENGL 149 Technical Writing

35
ASM Approach -Agricultural Systems Management involves the development of solutions to technological, business or management problems associated with agricultural or related industries. A systems approach, interdisciplinary experience, and agricultural training in specialized areas are common features of this type of problem solving . (insert N/A for any area not applicable to this project)
----------------------------------~----------------------------------------- -- -----------------------------------
Systems approach : The project includes the use of design components related to : knowledge of scheduling of irrigation events, necessary measures : to ensure crop growth, size and capabilities of system, and i efficient design for the least cost installation.
----------------------------------~------------------------------------------------------------------------------
Interdisciplinary features : The project touches on aspects of design components, scheduling i factors , and cost analysis.
Specialized agricultural knowledge
Project Parameters
: The project applies specialized knowledge in the areas of : scheduling necessary requirements of specific crops.
1. The system must irrigate entire block of vineyard . 2. The system must be cost efficient and effective. 3. The system must produce a certain amount of crop per year. 4. The system must include all aspects of growing grapes for wine harvest.
List of Tasks and Time Estimate
TASK
Research in library on scheduling for irrigation times and frost protection Visitation to local vineyards for current designs Consultation with Wineries and Vineyard Managers Prepare detailed drawing of design Design of system in Auto Cad Field testing Modification to design Cost Analysis of System Final Evaluation of System Preparation of written report
TOTAL
Financial Responsibility
Preliminary estimate of project costs: $ {insert dollar amount/
Finances approved by (signature of Project Sponsor): [signature of sponsor!
Hours
15 10 4 30 50 30 10 4 10
~
163
Final Report Due: December 12, 2014 I Number of Copies: 3

Approval Signatures
Student: ------------------
Proj . Supervisor: -------------------
Department Head: __________________ _
36
Date

37
APPENDIXB:
Example Design Calculations

length of Critical Block (ft)
176
#Emitters
88
Friction loss Through Drip line
Emitters #Emitters
Spacing (ft)
2
Emitter Flow Rate (gal/hr)
0.5
88
GPM per Drip line
0.733
( 73 GPM)
1.852
10.5 • . • 176ft• (.6- 4·8 7 ) 143
n-otal Hf (ft) =
n-otal Hf (psi)
Corrected Hf (psi) =
Manifold Design
Pipe Diameter
Pipe Diameter (ID)
Total Hf (ft)=
Total Hf (psi)=
Corrected Hf (psi) =
1.27
0.55
0.20
38

Sub-Main Design
Pipe Diameter
Pipe {ID)
Hf {ft)=
Hf (psi) =
Main Line Design
Pipe Diameter
Pipe {ID)
Hf (ft)=
Hf (psi)=
Number of Outlets on Lateral Line
1
5
10
20
40
100
39
Correction Factor {F)
1
0.457
0.402
0 .38
0.364
0.356

40
APPENDIX C:
COST SPREADSHEET

41
Cost Analysis of Parts
Drip Hose
1 roll= 500ft @ $77
Rows Length (ft)
39 176
Blocks 1 & 2 6864 (ft)
Blocks 3,4 & 5 39 168
6552 (ft)
Blocks 6,7& 8 39 196
7644(ft)
Blocks 9 & 10 39 176
6864 (ft)
Blocks 11 24 12
288 (ft)
Block 12 15 268
4020 (ft)
Block 13 24 88
2112 (ft)
Block 14 24 108
2592 (ft)

42
Total Length of Drip Needed 36936 (ft)
Rolls Needed (500ft per roll) 73.872
74rolls@
Manifold Line !sub Main Line Pipe
Pipe Length Needed Pipe Length Needed
Number of sections with full width (Blocks 1-12) 5
Blocks 1 and 2 (ft) 208
Length of each section(ft) 312 Blocks 3,4 and 5 (ft) 264
Total Length of Pipe (ft) for Blocks 1-12 1560
Blocks 6,7 and 8 264
Blocks 9 and 10 208
Length Needed for Blocks Blocks 11 and 12 208
13 and 14 416
Block 13 190
Total Lenth of Manifold Pipe (ft) 1976
Block 14 208
Total feet needed 1550
Number of 20 lengths 78
Price Per 20ft Length 16.4 Price per Length $ 23.40
Number of 20ft Lengths 99 Price= $ 1,813.50
Price= $ 1,620.32

Labor Costs
30!workers
$ 10.50
10hour days
6~ays
$ 18,900.00
$ 31,018.71
1.27 * cv Where DUcv = 1- 1
n Cz)
Main Line Pipe
Pipe Length Needed 900
Price Per 20ft Length 64.2
Number of 20ft Lengths 45
Price = $ 2,889.00
43