iri pulse report personal care · · 2015-11-10iri pulse report personal care ... iri retail...
TRANSCRIPT

PULSE REPORT
IRI Pulse Report Personal Care
Welcome to the Pulse H1 2015 edition for personal care. We hope you
find it useful. Please do not hesitate to contact us if you have any
questions or comments at [email protected].
H1 2015
IRIworldwide.com

PULSE REPORT
About the Report
2
• This personal care report is one of 10 super category reports designed to provide a high-
level comparison and analysis of retail markets across major countries in Europe.
• This report contains data gathered from countries throughout Europe. The market was split
into the following categories: deodorants, hair care, hair dye, body care, insect repellent,
oral care, body cleansing, facial care, sun care, sanitary products, feminine hygiene,
cosmetics, fragrances and shaving/hair removal.
• The report highlights key metrics such as total sales, market trends, category shares, and
winners and losers for Europe as a whole and for individual countries.
• The data has been sourced from IRI retail databases and Eurostat, the statistical branch of
administration for the European Commission.
• The countries included in the report are: France, Germany, Italy, the Netherlands, Spain
and the United Kingdom (UK).
• The market channels used for each country in this report are as follows:
Country Channels used
UK Hypermarkets, supermarkets, drugstores and impulse outlets
ES Hypermarkets, supermarkets, hard discounters, drugstores, including the Canary Islands
DE Hypermarkets, supermarkets, hard discounters and drugstores
NL Hypermarkets, supermarkets, hard discounters and drugstores
IT Hypermarkets, supermarkets, small self-service, hard discounters and drugstores
FR Hypermarkets and supermarkets
• For analytical purposes, the data sourced from available retail databases has been
consolidated to provide consistent results. However, for some countries it has not been
possible to source data pertaining to certain categories. When this has occurred, it has been
documented in the “Notes” section found at the end of the report.

PULSE REPORT
On the Radar
3
ECONOMIC FIGURES INFLUENCING CONSUMER BEHAVIOUR
Source: Eurostat, June 2015
The good news is that the first half of 2015 saw positive growth within the personal care category across Europe: +0.6% in value sales. While Germany and Spain have seen a positive trend, it is not the case for the Netherlands and France, where revenue sales have decreased. Some trends are transversal, strong growth in oral care and feminine hygiene, but each country exhibits its own specificities in terms of price evolution, channel dynamics and promotional activation.
POPULATIO
N IN
MILLIONS
UNEMPLOYMENT
(%)
AVERAGE 12
MONTHS
INFLATION
RATES
GDP IN MILLIONS
(€)
Jan.
2014
Jan.
2015
Avg.
2014
Jun.
2015
Avg.
2014
Jun.
2015 2013 2014
France 65.8 66.3 10.3 10.2 +0.7 +0.2 2 116 565 2 132 449
Germany 80.7 81.1 5.0 4.7 +0.9 +0.4 2 820 820 2 915 650
Italy 60.7 60.7 12.7 12.7 +0.3 +0.0 1 609 462 1 616 253
Netherlands 16.8 16.9 7.4 7.0 +0.5 +0.1 650 857 662 770
Spain 46.5 46.4 24.5 26.6 +0.0 -0.6 1 049 181 1 058 469
United
Kingdom 64.3 64.7 6.1 5.6 +1.7 +0.6 2 017 193 2 222 912

PULSE REPORT
701 787 855 718 719 808
500 570 530 507 487 550
1 083 1 189 1 255
1 099 1 098 1 215
3 012 3 181 3 171 3 438
3 093 3 265
1 516
1 606 1 561 1 442 1 479
1 639
1 637
1 811 1 856 1 724
1 645
1 816
0
1,000
2,000
3,000
4,000
5,000
6,000
7,000
8,000
9,000
10,000
30-mar-14 29-jun-14 28-sep-14 28-dic-14 29-mar-15 28-jun-15
Eu
ro
s, in
millio
ns
Period Ending
UK
France
Germany
Italy
Netherlands
Spain
GLOBAL TRENDS
4
TOTAL EUROPE +0.6%
-0.4%
2.2%
-0.1%
VALUE SALES IN MILLIONS (€)
Total EU 35 972
DE 12 967
FR 6 121
UK 7 041*
ES 3 099
IT 4 667
NL 2 075
TOTAL PERSONAL CARE VALUE SALES AND % CHANGE VERSUS PRIOR YEAR
*based on an exchange rate of €1.27 to the pound
+2.4%
-0.8%
-3.0%
TOTAL PERSONAL CARE VALUE SALES FOR THE LAST SIX QUARTERS
Source: IRI retail databases; period ending 28 June 2015

PULSE REPORT
Europe
5
5 279
4 538 4 206
3 599
2 824 2 787 2 550 2 481
2 237 2 038
Euro Sales
Oral Care Haircare Facial Care Body Cleansing
Shaving / Hair Removal Cosmetics Deodorants Body Care
Fragrances Sanitary Products
Eu
ros,
in m
illi
on
s
CATEGORY SHARE OF VALUE SALES IN THE LAST YEAR
Europe includes: France, Germany, Italy, the Netherlands, Spain and the United Kingdom
Source: IRI retail databases; period ending 28 June 2015
KEY TRENDS
• With a growth of 0.6% in value sales, the
personal care trend is positive in Europe. But,
this category is still underperforming
compared to fast moving consumer goods
(FMCG) which showed slight upward growth.
• However, the 0.6% increase makes it difficult
to identify different situations between
countries.
• In 2015, Germany and Spain saw positive
sales, while Italy and the UK stayed stable.
The Netherlands and France suffered a decline
in sales.
• The following pages will analyze different
trends in each country.
SHARE OF VALUE IN THE YEAR
Oral Care 14.7%
Hair Care 12.6%
Facial Care 11.7%
Body Cleansing 10.0%
Shaving / Hair Removal 7.8%
Cosmetics 7.7%
Deodorants 7.1%
Body Care 6.9%
Fragrances 6.2%
Sanitary Products 5.7%
Hair Dye 3.7%
Feminine Hygiene 3.0%
Sun care 2.5%
Insect Repellent 0.4%

PULSE REPORT
Euros, in millions
Europe
6
Europe includes: France, Germany, Italy, the Netherlands, Spain and the United Kingdom
Source: IRI retail databases; period ending 28 June 2015
TOP LOSERS: VALUE SALES CHANGE VERSUS A YEAR AGO (€)
TOP WINNERS: VALUE SALES CHANGE VERSUS A YEAR AGO (€)
103.3
87.5
77.4
69.4
55.1
0 50 100 150
Oral Care
Cosmetics
Feminine Hygeine
Body Care
Facial Care
Millions
5 279
4 538 4 206
3 599
2 824
2.0 -0.9
1.3 0.8 -2.2
Ora
l Care
Hair C
are
Facia
l Care
Body C
leansin
g
Shavin
g /
Hair
Rem
oval
Euro
s,
in m
illions
Euro Sales % € vs. YA
TOP 5 CATEGORIES: EVOLUTION
Value sales (€) and % change versus a year ago
CATEGORY INSIGHTS
• The slight growth in personal care makes it
difficult to uncover trends among specific
categories.
• Oral care is still the most dynamic
category thanks to multiple marketing
activations (promotion, media and
innovation) and because of its potential for
consumer recruitment across Europe.
• Facial care also managed to increase sales,
specifically in France, Spain and Germany.
• The situation is difficult for one of the
largest categories, hair care, more
specifically in France, Italy and the
Netherlands.
• Shaving and hair removal are declining
with the beard trend being the driving
factor. Without innovation in this market,
sales will continue to decline.
- 34.0
- 39.6
- 40.7
- 49.2
- 62.8
-70 -50 -30 -10
Deodorants
Haircare
Hair Dye
Sun care
Shaving / Hair Removal
Euros, in millions
PULSE REPORT
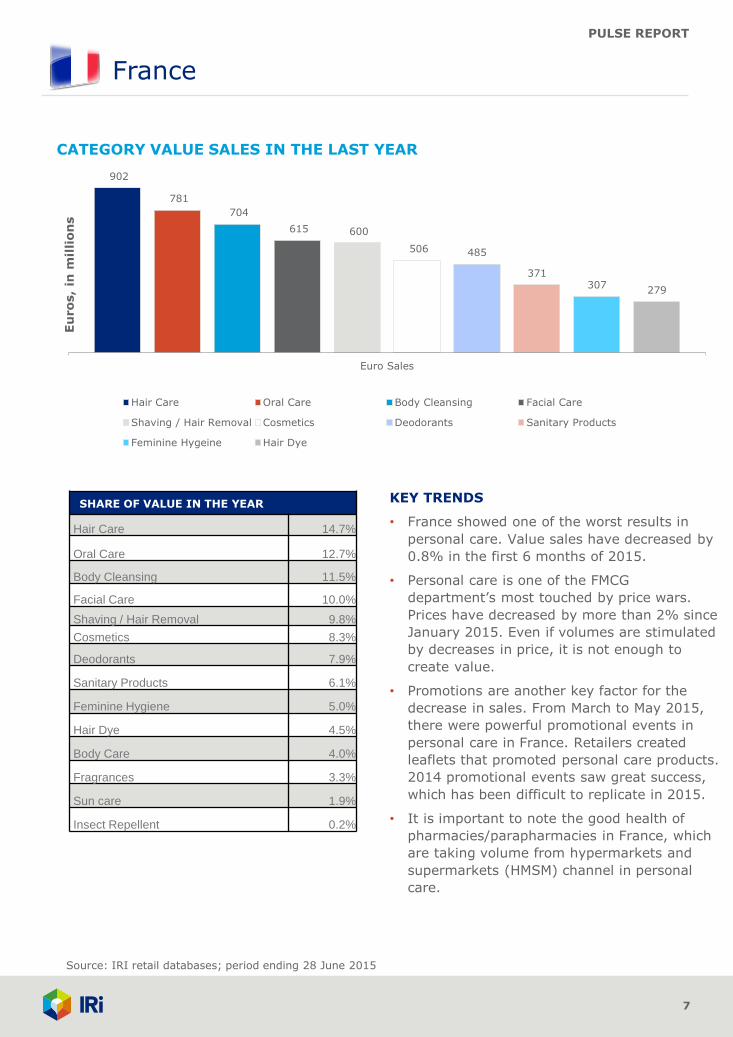
902
781
704
615 600
506 485
371 307
279
Euro Sales
Hair Care Oral Care Body Cleansing Facial Care
Shaving / Hair Removal Cosmetics Deodorants Sanitary Products
Feminine Hygeine Hair Dye
France
7
KEY TRENDS
• France showed one of the worst results in
personal care. Value sales have decreased by
0.8% in the first 6 months of 2015.
• Personal care is one of the FMCG
department’s most touched by price wars.
Prices have decreased by more than 2% since
January 2015. Even if volumes are stimulated
by decreases in price, it is not enough to
create value.
• Promotions are another key factor for the
decrease in sales. From March to May 2015,
there were powerful promotional events in
personal care in France. Retailers created
leaflets that promoted personal care products.
2014 promotional events saw great success,
which has been difficult to replicate in 2015.
• It is important to note the good health of
pharmacies/parapharmacies in France, which
are taking volume from hypermarkets and
supermarkets (HMSM) channel in personal
care.
Source: IRI retail databases; period ending 28 June 2015
Eu
ros,
in m
illi
on
s
CATEGORY VALUE SALES IN THE LAST YEAR
SHARE OF VALUE IN THE YEAR
Hair Care 14.7%
Oral Care 12.7%
Body Cleansing 11.5%
Facial Care 10.0%
Shaving / Hair Removal 9.8%
Cosmetics 8.3%
Deodorants 7.9%
Sanitary Products 6.1%
Feminine Hygiene 5.0%
Hair Dye 4.5%
Body Care 4.0%
Fragrances 3.3%
Sun care 1.9%
Insect Repellent 0.2%

PULSE REPORT
France
8
TOP LOSERS: VALUE SALES CHANGE VERSUS A YEAR AGO (€)
TOP WINNERS: VALUE SALES CHANGE VERSUS A YEAR AGO (€)
22.4
5.4
2.9
0 10 20
Feminine Hygeine
Facial Care
Deodorants
Millions
Source: IRI retail databases; period ending 28 June 2015
Euros, in millions
902
781
704
615 600
-2.4 -0.3 -0.2 0.9
-3.4
Hair C
are
Ora
l Care
Body C
leansin
g
Facia
l Care
Shavin
g /
Hair
Rem
oval
Euro
s,
in m
illions
Euro Sales % € vs. YA
TOP 5 CATEGORIES: EVOLUTION
Value sales (€) and % change versus a year ago
CATEGORY INSIGHTS
• Declining sales for personal care in France
is transversal across categories which has
created a negative trend in sales.
• For example, hair care, which is
particularly impacted by price decreases
(-3.7% on H1 in HMSM). During 2015
there were fewer impactful innovations
versus 2014.
• Value sales in oral care which was one of
the most dynamic categories is now
slightly decreasing, mainly because of
toothpaste.
• The shaving category decline is not new,
but losses are still important in France;
French men are using less shaving
products because of the beard effect.
- 4.3
- 7.8
- 10.8
- 21.3
- 22.2
-25 -15 -5
Sanitary Products
Body Care
Sun Care
Shaving / Hair Removal
Hair Care
Euros, in millions
PULSE REPORT
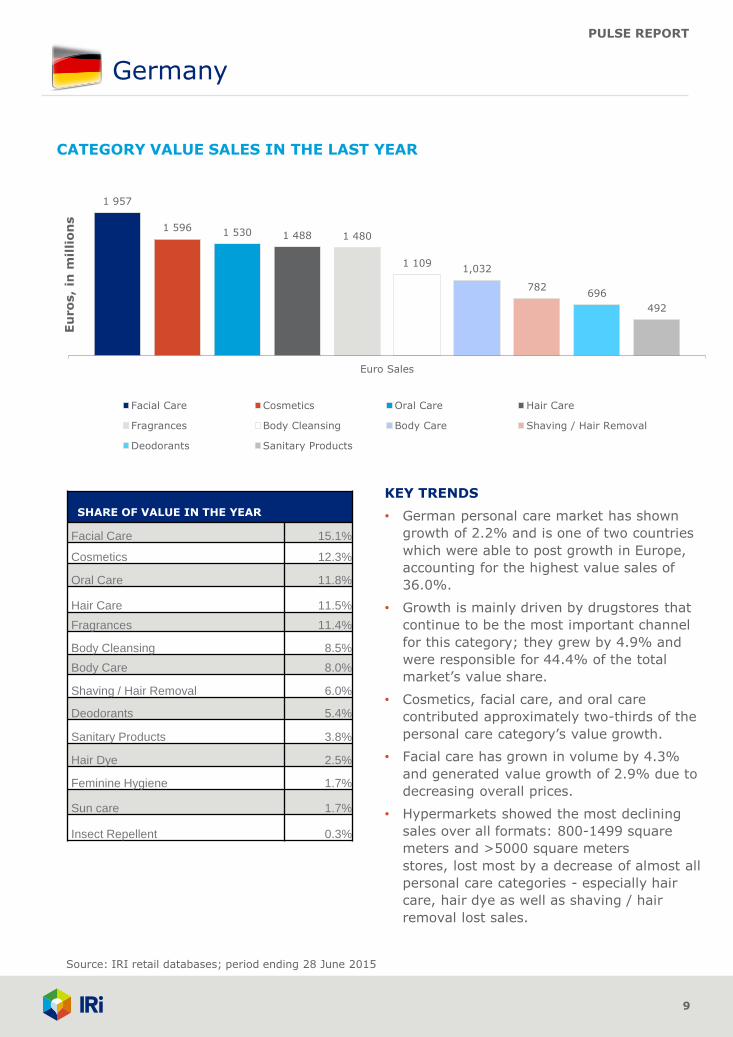
1 957
1 596 1 530 1 488 1 480
1 109 1,032
782 696
492
Euro Sales
Facial Care Cosmetics Oral Care Hair Care
Fragrances Body Cleansing Body Care Shaving / Hair Removal
Deodorants Sanitary Products
Germany
9
Source: IRI retail databases; period ending 28 June 2015
CATEGORY VALUE SALES IN THE LAST YEAR
Eu
ros,
in m
illi
on
s
SHARE OF VALUE IN THE YEAR
Facial Care 15.1%
Cosmetics 12.3%
Oral Care 11.8%
Hair Care 11.5%
Fragrances 11.4%
Body Cleansing 8.5%
Body Care 8.0%
Shaving / Hair Removal 6.0%
Deodorants 5.4%
Sanitary Products 3.8%
Hair Dye 2.5%
Feminine Hygiene 1.7%
Sun care 1.7%
Insect Repellent 0.3%
KEY TRENDS
• German personal care market has shown
growth of 2.2% and is one of two countries
which were able to post growth in Europe,
accounting for the highest value sales of
36.0%.
• Growth is mainly driven by drugstores that
continue to be the most important channel
for this category; they grew by 4.9% and
were responsible for 44.4% of the total
market’s value share.
• Cosmetics, facial care, and oral care
contributed approximately two-thirds of the
personal care category’s value growth.
• Facial care has grown in volume by 4.3%
and generated value growth of 2.9% due to
decreasing overall prices.
• Hypermarkets showed the most declining
sales over all formats: 800-1499 square
meters and >5000 square meters
stores, lost most by a decrease of almost all
personal care categories - especially hair
care, hair dye as well as shaving / hair
removal lost sales.

PULSE REPORT
Germany
10
TOP LOSERS: VALUE SALES CHANGE VERSUS A YEAR AGO (€)
TOP WINNERS: VALUE SALES CHANGE VERSUS A YEAR AGO (€)
Source: IRI retail databases; period ending 28 June 2015
- 1.7
- 3.0
- 8.6
- 10.5
- 15.3
-20 -10 0
Deodorants
Shaving / Hair Removal
Hair Dye
Insect Repellent
Sun Care
63.4
59.4
54.2
37.8
32.6
0 40 80
Cosmetics
Oral Care
Facial Care
Body Care
Body Cleansing
Euros, in millions
1 957
1 596 1 530 1 488 1 480
2.8 4.1
4.0
0.7 1.8
Facia
l C
are
Cosm
etics
Ora
l C
are
Hair C
are
Fra
gra
nce
s
Eu
ros,
in m
illio
ns
Euro Sales % € vs. YA
TOP 5 CATEGORIES: EVOLUTION
Value sales (€) and % change versus a year ago
CATEGORY INSIGHTS
• All top five personal care categories (with a
value share of about 62%) were able to
increase sales and drove personal care’s
market growth.
• Cosmetics’ growth was primarily driven by
drugstores which generated a value growth
of 6.4% (53.4 million €), mainly due to an
increase in non promotional sales.
• Facial, eye and lip drove value growth within
cosmetics while nail cosmetic declined.
• Oral care’s value growth of 4.1% was mainly
driven by dental care products. Growth was
due to increased promotional (+10.2%) and
non promotional (+2.1%) sales – also
toothbrushes' non promotional sales showed
growth by 8.5%.
• Facial care was primarily driven by face
cream which has approximately 70% value
share within facial care, but face cleansing
showed the highest value growth in this
category followed by lip care which showed
the highest change over last year, with
growth of 18.1%.
Euros, in millions

PULSE REPORT
679
617
513
447 437 413
309 309 259 240
Euro Sales
Oral Care Hair Care Body Cleansing Sanitary Products
Facial Care Shaving / Hair Removal Feminine Hygeine Deodorants
Cosmetics Body Care
Italy
11
KEY TRENDS
• In the first half of 2015, food and drinks
departments drove growth. Personal care
showed a positive trend for six consecutive
months, both in terms of value and volume.
• In these first six months of 2015, the
promotional pressure for FMCG remained at
the same level as in 2014; the depth of
discount remained high but did not grow
further.
• In personal care prices decreased even
while FMCG prices increased during the
past six months.
• Although prices for FMCG are still declining
due to strong competition between retail
channels, revenue remains positive.
• Private labels market share for FMCG
remains the same versus 2014 (value share
9.9%).
Source: IRI retail databases; period ending 28 June 2015
CATEGORY VALUE SALES IN THE LAST YEAR
Eu
ros,
in m
illi
on
s
SHARE OF VALUE IN THE YEAR
Oral Care 14.5%
Hair Care 13.2%
Body Cleansing 11.0%
Sanitary Products 9.6%
Facial Care 9.4%
Shaving / Hair Removal 8.9%
Feminine Hygiene 6.6%
Deodorants 6.6%
Cosmetics 5.5%
Body Care 5.1%
Hair Dye 3.6%
Fragrances 3.0%
Sun care 2.0%
Insect Repellent 0.9%

PULSE REPORT
Italy
12
TOP LOSERS: VALUE SALES CHANGE VERSUS A YEAR AGO (€)
TOP WINNERS: VALUE SALES CHANGE VERSUS A YEAR AGO (€)
Source: IRI retail databases; period ending 28 June 2015
- 5.2
- 10.0
- 14.4
- 17.7
- 18.7
-20 -10 0
Deodorants
Sanitary Products
Body Cleansing
Hair Care
Shaving / Hair Removal
18.1
14.4
12.8
10.4
2.3
0 10 20
Cosmetics
Fragrances
Body Care
Feminine Hygeine
Oral Care
Millions Euros, in millions
679
617
513
447 437
0.3 -2.8 -2.7 -2.2 0.3
Ora
l C
are
Hair
Ca
re
Bo
dy C
lea
nsin
g
Sa
nitary
Pro
du
cts
Fa
cia
l C
are
Eu
ros,
in m
illio
ns
Euro Sales % € vs. YA
TOP 5 CATEGORIES: EVOLUTION
Value sales (€) and % change versus a year ago
CATEGORY INSIGHTS
• Categories that are viewed as more of a
commodity such as body care (bath, shower,
soaps, deodorants), hair care (shampoo and
hair conditioner) and oral care (toothpastes
and mouthwashes) are increasing their market
share in the drugstore at the expense of
categories more specialized like make-up and
perfumes.
• Hair care (shampoo, hair conditioner and
styling products) show negative performances
even though promotional activity and price
cuts were higher in 2015 than 2014. In the
hair conditioner sub-category only rinse on
and off are increasing. On the contrary,
traditional conditioners are decreasing.
• Within the body cleansing category, shower is
the only sub-category with a positive trend.
Sales are negative for bath and soaps (bar
and liquid).
• Body care: in body cream not all segments
show negative trends like multipurpose or
fluid cream, but exfoliating and firming are
showing positive performance but their market
share in the total body cream is still low.
Euros, in millions

PULSE REPORT
303
266 264
218
181 160
148 147
123 109
Euro Sales
Hair Care Cosmetics Oral Care Facial Care
Body Cleansing Fragrances Body Care Deodorants
Shaving / Hair Removal Sanitary Products
The Netherlands
13
KEY TRENDS
• The personal care situation is still
negative in the Netherlands. The
economic context there remains tough
despite first encouraging economical
indicators.
• Luxury brands and segments in
personal care show a positive index.
This can be explained by the fact that
consumers are tired of the economic
situation and want to indulge
themselves.
• Sun care is one of the few segments in
personal care that show positive
results, due to the abundant sunny
days the Netherlands had during that
period.
Source: IRI retail databases; period ending 28 June 2015
CATEGORY VALUE SALES IN THE LAST YEAR
Eu
ros,
in m
illi
on
s
SHARE OF VALUE IN THE YEAR
Hair Care 14.6%
Cosmetics 12.8%
Oral Care 12.7%
Facial Care 10.5%
Body Cleansing 8.7%
Fragrances 7.7%
Body Care 7.1%
Deodorants 7.1%
Shaving / Hair Removal 5.9%
Sanitary Products 5.2%
Sun Care 3.1%
Hair Dye 2.9%
Feminine Hygiene 0.9%
Insect Repellent 0.6%

PULSE REPORT
The Netherlands
14
TOP LOSERS: VALUE SALES CHANGE VERSUS A YEAR AGO (€)
TOP WINNERS: VALUE SALES CHANGE VERSUS A YEAR AGO (€)
Source: IRI retail databases; period ending 28 June 2015
2.8
2.7
0.4
0 1 2 3
Body Care
Feminine Hygeine
Insect Repellent
Millions Euros, in millions
303
266 264
218
181
-3.4 -0.9
-1.4 -4.8
-6.7
Hair C
are
Cosm
etics
Ora
l C
are
Facia
l C
are
Bo
dy C
lea
nsin
g
Eu
ros,
in m
illio
ns
Euro Sales % € vs. YA
TOP 5 CATEGORIES: EVOLUTION
Value sales (€) and % change versus a year ago
CATEGORY INSIGHTS
• During the past period, personal care was
losing sales in the Netherlands.
• An explanatory factor for this is the still
growing market of high, and low-end retail
(e.g. budget stores). The developing
market has impacted the performance of
traditional channels.
• Low end retail is growing rapidly in the
Netherlands, because of the low prices
compared to drugstores and
supermarkets.
• In addition, the promotional pressure
within drugstores is still rising, it is around
65% for total personal care. For some
segments there are little base sales to
track, since almost everything is sold on
promotion (e.g. hair coloring).
- 8.1
- 9.1
- 10.7
- 10.9
- 13.1
-15 -10 -5 0
Deodorants
Hair Dye
Hair Care
Facial Care
Body Cleansing
Euros, in millions

PULSE REPORT
Spain
15
KEY TRENDS
• Spain has the best year-over-year
performance in the personal care category
in Europe. It has increased its value sales
versus the previous year by 2.4%.
• Consumption in Spain has been growing
since the beginning of this year, and it has
been a driver for the personal care
category.
• Hair care, the most important category in
personal care in H1 2015, had weak year-
over-year performance. It has decreased in
value sales by 2.8%.
• The three categories with the greatest gain
in value sales were oral care, body
cleansing and fragrances.
Source: IRI retail databases; period ending 28 June 2015
493
370
300 275
259 256 255 216
184 161
Euro Sales
Hair Care Oral Care Body Cleansing Sanitary Products
Facial Care Shaving / Hair Removal Fragrances Deodorants
Body Care Cosmetics
Eu
ros,
in m
illi
on
s
SHARE OF VALUE IN THE YEAR
Hair Care 15.9%
Oral Care 11.9%
Body Cleansing 9.7%
Sanitary Products 8.9%
Facial Care 8.3%
Shaving / Hair Removal 8.3%
Fragrances 8.2%
Deodorants 7.0%
Body Care 5.9%
Cosmetics 5.2%
Hair Dye 4.2%
Sun care 3.9%
Feminine Hygiene 2.4%
Insect Repellent 0.1%
CATEGORY VALUE SALES IN THE LAST YEAR

PULSE REPORT
Spain
16
TOP LOSERS: VALUE SALES CHANGE VERSUS A YEAR AGO (€)
TOP WINNERS: VALUE SALES CHANGE VERSUS A YEAR AGO (€)
Source: IRI retail databases; period ending 28 June 2015
- 1.2
- 2.8
- 6.9
-8 -4 0
Hair Dye
Hair Care
Shaving / Hair Removal
21.7
10.7
10.1
9.6
8.0
0 10 20
Oral Care
Body Cleansing
Fragrances
Cosmetics
Facial Care
Millions Euros, in millions
493
370
300 275
259
-0.6 6.2 3.7 0.8 3.2
Hair C
are
Ora
l C
are
Bo
dy C
lea
nsin
g
Sanitary
Pro
ducts
Fa
cia
l C
are
Eu
ros,
in m
illio
ns
Euro Sales % € vs. YA
TOP 5 CATEGORIES: EVOLUTION
Value sales (€) and % change versus a year ago
CATEGORY INSIGHTS
• There is a positive change in year-over-
year performance the Top 5 categories in
personal care. Only the biggest category,
hair care, is losing value sales.
• Potential growth is still important in Spain
in oral care, the second largest category in
value sales. This category is growing by
6.2% and has the greatest year-over-year
growth versus the other personal care
categories.
• The fragrances category is one of the most
important categories in personal care due
to ‘me too’ brands. This sub-category is
growing, because some manufacturers
have lowered prices and private labels
which have significant position (about the
12% of value market share) are growing.
Euros, in millions

PULSE REPORT
The United Kingdom
17
KEY TRENDS
• Total FMCG (excluding alcohol) fell by
1.3% in value sales during H1 2015 versus
H1 2014. Compared to this, personal care
sales were down 1.2%.
• FMCG through the traditional supermarket,
pharmacist and convenience trade is being
affected by a growing discount sector both
in the shape of Aldi and Lidl as well as the
bargain stores.
• The personal care sector was not helped by
the weather in 2015. Apart from a short
warm spell at the end of June,
temperatures were lower than in 2014.
• Volume on deal for the personal care
sector has not changed substantially. This
is slightly against the overall trend where
we have seen promotion levels falling
slightly for food.
• Volume sales are down in H1 for personal
care, falling faster than other categories,
but value sales have been supported to
some extent by higher prices. The price
war is not as fierce here as it is in food.
Source: IRI retail databases; period ending 28 June 2015
1 656
792 735 721 696 649 635
359 344 268
Euro Sales
Oral Care Body Cleansing Hair Care Facial Care
Deodorants Shaving / Hair Removal Body Care Hair Dye
Sanitary Products Sun care
Eu
ros,
in m
illi
on
s
SHARE OF VALUE IN THE YEAR
Oral Care 23.5%
Body Cleansing 11.2%
Hair Care 10.4%
Facial Care 10.2%
Deodorants 9.9%
Shaving / Hair Removal 9.2%
Body Care 9.0%
Hair Dye 5.1%
Sanitary Products 4.9%
Sun care 3.8%
Feminine Hygiene 2.1%
Insect Repellent 0.5%
CATEGORY VALUE SALES IN THE LAST YEAR

PULSE REPORT
The United Kingdom
18
Source: IRI retail databases; period ending 28 June 2015
TOP LOSERS: VALUE SALES CHANGE VERSUS A YEAR AGO (€)
TOP WINNERS: VALUE SALES CHANGE VERSU A YEAR AGO (€)
- 6.3
- 13.8
- 13.9
- 20.3
- 22.9
-25 -15 -5
Shaving / Hair Removal
Hair Dye
Sanitary Products
Sun care
Deodorants
26.0
16.2
15.8
13.3
2.9
0 10 20 30
Oral Care
Body Care
Feminine Hygeine
Body Cleansing
Haircare
Millions Euros, in millions
1 656
792 735 721 696
1.6 1.7 0.4
-0.4 -3.2
Ora
l C
are
Bo
dy C
lea
nsin
g
Hair
Ca
re
Facia
l C
are
Deo
do
ran
ts
Eu
ros,
in m
illio
ns
Euro Sales % € vs. YA
TOP 5 CATEGORIES: EVOLUTION
Value sales (€) and % change versus a year ago
CATEGORY INSIGHTS
• The category gaining the most in value sales
in H1 2015 was toothbrushes. It was £8
million ahead of H1 2014 as premium
innovations continued to appear strong and
overall market prices have increased.
• The next highest increase came from
incontinence pads, continuing its spectacular
growth, with volume sales up by 10% and a
gain in H1 of £6.5 million.
• Deodorant and body spray were down versus
H1 2014 by 5% in both value and volume.
Percentage volume on deal remains
extraordinarily high at close to 80% and deal
depth has increased to more than 40%, but
the category has still fallen. The weather has
not helped, as value was down by £12.8
versus H1 2014.
• Similarly, sun care has had a bad start to the
year, with value down by 7.1% and volume
by 8.2%, sales were £7.6 million lower.
• Haircare value sales were down by 1.3% with
volume falling faster. Shampoo, styling and
male hair treatments showed small value
gains but volume was down throughout.
Euros, in millions

PULSE REPORT
Final Notes
19
Notes on category definitions for countries
Due to the diverse products found in individual countries across this market, it was necessary
to consolidate the available data into the categories in this report. In some cases, it wasn’t
always possible to align products across all six countries, hence the need to highlight any
anomalies in the report. Those exceptions are listed below.
Facial care
• The France data in this report includes wet wipes for this category, while the other countries
do not.
• The France data in this report does not include lip balm whereas the other countries do.
Feminine hygiene
• The Netherlands data in this report does not include intimate hygiene products, which are
included in body care.
Cosmetics
• The UK data in this report does not include this category.
Fragrance
• The UK data in this report does not include this category.

PULSE REPORT
Resources
20
About IRI. IRI is a leader in delivering powerful market and shopper information, predictive analysis and the foresight
that leads to action. We go beyond the data to ignite extraordinary growth for our clients in the CPG, retail and over-
the-counter healthcare industries by pinpointing what matters and illuminating how it can impact their businesses
across sales and marketing. Move your business forward at IRIworldwide.eu
Arlington Square, Downshire Way, Bracknell, Berkshire RG12 1WA, Tel +44 (0) 1344 746000
Copyright © 2015 Information Resources, Inc. (IRI). All rights reserved. IRI, the IRI logo and the names of IRI products and services
referenced herein are either trademarks or registered trademarks of IRI. All other trademarks are the property of their respective owners.
FOR MORE INFORMATION
Please contact Emily Mayer, Business Unit Director, France,
IRI at [email protected] or
+33 (0)130 06 26 56 with questions or comments about this report.
To gain insight into opportunities across specific categories, segments, channels or retailers,
contact your IRI client service representative regarding custom analyses leveraging the
following resources:
• IRI InfoScan Census® is a syndicated retail tracking service that enables manufacturers
and retailers to acquire industry insights used to make better business decisions. IRI
InfoScan Census utilizes the data that IRI collects from grocery, drug, and mass
merchandise retailers to provide the most comprehensive and accurate syndicated data
offering in the FMCG sector. With access to accurate, granular detail by category, geography,
measure, and time period, clients have the tools needed to develop marketing and sales
strategies based on product performance, distribution, and promotion responsiveness. All
data about personal care comes from IRI InfoScan Census.
• IRI Consulting provides strategic insights and advice leveraging a variety of data sources,
predictive analytics, enabling technologies, and business analyses to help FMCG
manufacturers and retailers address significant sales and marketing issues effectively.