ip management company (rf) proprietary limited …
TRANSCRIPT

IP MANAGEMENT COMPANY (RF) PROPRIETARY LIMITED
ANNUAL REPORT
31 MARCH 2021

INDEX
Page
Managing Director’s Report 3
Directors’ Statement 4
Trustees Report 5
Independent Auditor’s Report 6
Portfolios 10

Page 3
Managing Director’s Report
I am pleased to present the Annual Report for IP Management Company (RF) Proprietary Limited (the “IP Management Company”) and the IP Collective Investment Scheme (the “Scheme”) for the year ended 31 March 2021. It is a statutory requirement that each investor receive an abridged copy of the annual financial statements. Kindly note that performance and other figures reflect the position at the year end of the Scheme and thus may not be the most recent figures available. The year ending March 2021 saw assets under management end the year at R23.4bn. The year-on- year growth figure of 21% is an excellent result, demonstrating a combination of improved market performance and investor inflows based on solid performance across the fund range. That said the economic environment remains uncertain as the progress of the pandemic and vaccine rollouts continue and I encourage investors to engage with their Financial Advisor or Investment Manager to assist in addressing any questions and concerns they may have regarding their investments. I would again like to take this opportunity to congratulate our award-winning funds and fund managers at the 2020 Raging Bull Awards: Emperor Asset Management: IP Global Momentum Equity Fund
Best (SA-Domiciled) Global Equity General Fund (Straight Performance Over Three Years)
MiPlan: MiPlan IP Global Macro Fund
Best (SA-Domiciled) Global Multi-Asset Flexible Fund Best (SA-Domiciled) Global Multi-Asset Flexible Fund on a Risk- Adjusted Basis
MiPlan, second place in the Manager of the Year Award, to back up its win in 2019 and 3rd place in 2018. Our ongoing objective is to provide excellent administration for investors, asset managers and advisors. This year we draw your attention to the implementation of the Protection of Personal Information Act (POPI) and request that you please take note of the Privacy Policy and the Terms and Conditions, as amended from time to time and published on our website, http://www.ipmc.co.za, as these apply to your investment. Kindly note that investors can access their portfolio details and investment statements via the secure web access portal on our website: http://www.ipmc.co.za. Please contact our client services team at [email protected] in order to register. If you have any queries, please don’t hesitate to contact us or consult your Investment Manager or Financial Advisor. Thank you for your on-going support. I wish you all the best for the remainder of 2021 – stay safe.
_______________ Brett Paton Managing Director

Page 4
SECTION ONE
IP COLLECTIVE INVESTMENT SCHEME PORTFOLIOS
Directors’ Statement
The annual financial statements are the responsibility of the directors of IP Management Company (RF) Proprietary
Limited (the “IP Management Company”). The IP Collective Investment Scheme (the “Scheme”) financial statements,
prepared in accordance with the accounting policies as set out on pages 11 to 15 give a fair reflection of the Scheme
portfolios’ financial position and the results of their operations.
The directors are satisfied that an adequate system of internal control exists and that it is maintained on a continuous
basis to ensure the completeness and the accuracy of the accounting records, to safeguard the assets and to ensure
the integrity and reliability of the financial statements with reasonable assurance. In the directors’ opinion, the Scheme
portfolios are financially sound and will continue to operate as going concerns.
The annual financial statements set out on pages 10 to 69 were approved by the board of directors of IP Management
Company and are signed on their behalf by:
BRETT PATON
MANAGING DIRECTOR
20 July 2021

REPORT OF THE TRUSTEE FOR THE IP COLLECTIVE INVESTMENT SCHEME We, the Standard Bank of South Africa Limited, in our capacity as Trustee of the IP Collective Investment Scheme (“the Scheme”) have prepared a report in terms of Section 70(1)(f) of the Collective Investment Schemes Control Act, 45 of 2002, as amended (“the Act”), for the financial year ended 31 March 2021. In support of our report we have adopted certain processes and procedures that allow us to form a reasonable conclusion on whether the Manager has administered the Scheme in accordance with the Act and the Scheme Deed. As Trustees of the Scheme we are also obliged to in terms of Section 70(3) of the Act to satisfy ourselves that every statement of comprehensive income, statement of financial position or other return prepared by the Manager of the Scheme as required by Section 90 of the Act fairly represents the assets and liabilities, as well as the income and distribution of income, of every portfolio of the Scheme. The Manager is responsible for maintaining the accounting records and preparing the annual financial statements of the Scheme in conformity with Generally Accepted Accounting Principles. This responsibility also includes appointing an external auditor to the Scheme to ensure that the financial statements are properly drawn up so as too fairly represent the financial position of every portfolio of its collective investment scheme are in accordance with Generally Accepted Accounting Principles and in the manner required by the Act. Our enquiry into the administration of the Scheme by the Manager does not cover a review of the annual financial statements and hence we do not provide an opinion thereon. Based on our records, internal processes and procedures we report that nothing has come to our attention that causes us to believe that the accompanying financial statements do not fairly represent the assets and liabilities, as well as the income and distribution of income, of every portfolio of the Scheme administered by the Manager. We confirm that according to the records available to us, no losses were suffered in the portfolios and no investor was prejudiced as a result thereof. We conclude our report by stating that we reasonably believe that the Manager has administered the Scheme in accordance with:
(i) the limitations imposed on the investment and borrowing powers of the manager by this Act;
(ii) and the provisions of this Act and the deed;
Melinda Mostert Seggie Moodley Standard Bank of South Africa Limited Standard Bank of South Africa Limited
14 July 2021

Tel: +27 011 488 1700
Fax: +27 010 060 7000
www.bdo.co.za
6th Floor, 119 – 123 Hertzog Boulevard Foreshore Cape Town, 8001 PO Box 2275 Cape Town, 8000
6 BDO South Africa Incorporated
Registration number: 1995/002310/21
Practice number: 905526
VAT number: 4910148685
Chief Executive Officer: ME Stewart A full list of all company directors is available on www.bdo.co.za The company’s principal place of business is at The Wanderers Office Park, 52 Corlett Drive, Illovo, Johannesburg where a list of directors’ names is available for inspection. BDO South Africa Incorporated, a South African personal liability company, is a member of BDO International Limited, a UK company limited by guarantee, and forms part of the international BDO network of independent member firms.
Independent Auditor’s Report
To the directors of
IP Management Company (RF) Proprietary Limited
Opinion We have audited the financial statements of IP Collective Investment Scheme (“the Scheme”) managed by IP Management Company (RF) Proprietary Limited (“the Manager”) as set out on pages 10 to 69. The Scheme comprises the following unit portfolios (collectively “the Portfolios” or individually “each Portfolio”): Flagship IP Balanced Fund
Flagship IP Worldwide Flexible Fund
IP Flexible Fund of Funds
IP Prudential Fund of Funds
IP Worldwide Flexible Fund of Funds
IP Interest Plus Fund
IP Foreign Flexible Feeder Fund
Flagship IP Flexible Value Fund
IP High Conviction Equity Fund
FG IP International Flexible Fund of Funds
FG IP Jupiter Income Fund of Funds
FG IP Mercury Equity Fund of Funds
FG IP Saturn Flexible Fund of Funds
FG IP Venus Cautious Fund of Funds
True North IP Flexible Equity Fund
IP Active Beta Fund
FG IP Neptune Growth Fund of Funds
IP Balanced Fund
Rock Capital IP Worldwide Flexible Fund
Prosperity IP Worldwide Flexible Fund of Funds
True North IP Enhanced Property Fund
IP Global Momentum Equity Fund
IP Prudential Equity Fund
SouthChester IP Optimum Income Fund
Engelberg IP Global Feeder Fund
Engelberg IP Income Fund
Engelberg IP Balanced Fund
Thyme Wealth IP Multi-Asset Income Fund
Thyme Wealth IP Global Fund
Flagship IP Global Flexible Equity Fund
True North IP Global Flexible Equity Fund
IP Worldwide Active Beta Fund
Flagship IP Global Icon Feeder Fund

7 BDO South Africa Incorporated
Registration number: 1995/002310/21
Practice number: 905526
VAT number: 4910148685
Chief Executive Officer: ME Stewart A full list of all company directors is available on www.bdo.co.za The company’s principal place of business is at The Wanderers Office Park, 52 Corlett Drive, Illovo, Johannesburg where a list of directors’ names is available for inspection. BDO South Africa Incorporated, a South African personal liability company, is a member of BDO International Limited, a UK company limited by guarantee, and forms part of the international BDO network of independent member firms.
Triathlon IP Global Feeder Fund
Financial Fitness Stable IP Fund of Funds
Financial Fitness Balanced IP Fund of Funds
Financial Fitness Flexible IP Fund of Funds
Financial Fitness Diversified Income IP Fund of Funds
Mi-Plan IP Sarasin EquiSar Feeder Fund
Mi-Plan IP Beta Equity Fund
Mi-Plan IP Inflation Plus 3 Fund
Mi-Plan IP Inflation Plus 5 Fund
Mi-Plan IP Inflation Plus 7 Fund
Mi-Plan IP Global AI Opportunity Fund
Mi-Plan IP Enhanced Income Fund
Mi-Plan IP Global Macro Fund
Mi-Plan IP Global Property Feeder Fund
Global IP Opportunity Fund
Global Marathon IP Fund
Multi Asset IP Balanced Plus Fund
Multi Asset IP Balanced Defensive Fund
Multi Asset IP Balanced Fund Each Portfolio’s financial statements comprise the statement of financial position as at 31 March 2021, the statement of comprehensive income and statement of changes in equity for the year then ended and notes to the financial statements, including a summary of significant accounting policies.
In our opinion, each Portfolio’s financial statements present fairly, in all material respects, the financial position of each Portfolio as at 31 March 2021, and it’s financial performance and cash flows for the year then ended in accordance with basis of accounting described in note 1 of the financial statements on pages 10 to 14, and in accordance with the requirements of the Trust Deed of each Portfolio and the Collective Investments Schemes Control Act (Act No.45 of 2002) (CISCA). Basis for opinion We conducted our audit in accordance with International Standards on Auditing (ISAs). Our responsibilities under those standards are further described in the Auditor’s Responsibilities for the Audit of the Financial Statements section of our report. We are independent of the company in accordance with the Independent Regulatory Board for Auditors’ Code of Professional Conduct for Registered Auditors (IRBA Code) and other independence requirements applicable to performing audits of financial statements in South Africa. We have fulfilled our other ethical responsibilities in accordance with the IRBA Code and in accordance with other ethical requirements applicable to performing audits in South Africa. The IRBA Code is consistent with the corresponding sections of the International Ethics Standards Board for Accountants’ International Code of Ethics for Professional Accountants (including International Independence Standards). We believe that the audit evidence we have obtained is sufficient and appropriate to provide a basis for our opinion. Other Information The directors of IP Management Company (RF) (Pty) Ltd are responsible for the other information. The other information comprises the information included in the document titled “IP Management Company (RF) Proprietary Limited Annual Report 31 March 2021”, which includes the Managing Directors Report, the Directors’ Statement, the Report of the Trustees and the individual Portfolios Fund Composition graph and Fund Performance tables included on pages 15 to 69 as required by the Collective Investment Schemes
8 BDO South Africa Incorporated
Registration number: 1995/002310/21
Practice number: 905526
VAT number: 4910148685
Chief Executive Officer: ME Stewart A full list of all company directors is available on www.bdo.co.za The company’s principal place of business is at The Wanderers Office Park, 52 Corlett Drive, Illovo, Johannesburg where a list of directors’ names is available for inspection. BDO South Africa Incorporated, a South African personal liability company, is a member of BDO International Limited, a UK company limited by guarantee, and forms part of the international BDO network of independent member firms.
Control Act No.45 of 2002. The other information does not include the financial statements and our auditor’s report thereon.
Our opinion on the financial statements does not cover the other information and we do not express an audit opinion or any form of assurance conclusion thereon.
In connection with our audit of the financial statements, our responsibility is to read the other information and, in doing so, consider whether the other information is materially inconsistent with the financial statements or our knowledge obtained in the audit, or otherwise appears to be materially misstated. If, based on the work we have performed, we conclude that there is a material misstatement of this other information, we are required to report that fact. We have nothing to report in this regard. Responsibilities of the Directors for the Financial Statements The directors of the Manager are responsible for the preparation and fair presentation of each Portfolio’s financial statements in accordance with basis of accounting described in note 1 of the financial statements on pages 10 to 14 and in accordance with the requirements of the Trust Deed of each Portfolio and the Collective Investment Schemes Control Act (Act No. 45 of 2002), and for such internal control as the directors determine is necessary to enable the preparation of each Portfolio’s financial statements that are free from material misstatement, whether due to fraud or error.
In preparing each Portfolio’s financial statements, the directors are responsible for assessing the ability of the Scheme and each Portfolio to continue as a going concern, disclosing, as applicable, matters related to going concern and using the going concern basis of accounting unless the directors either intend to liquidate the Portfolio or to cease operations, or have no realistic alternative but to do so.
Auditor’s Responsibilities for the Audit of the Financial Statements Our objectives are to obtain reasonable assurance about whether each Portfolio’s financial statements as a whole are free from material misstatement, whether due to fraud or error, and to issue an auditor’s report that includes our opinion. Reasonable assurance is a high level of assurance, but is not a guarantee that an audit conducted in accordance with ISAs will always detect a material misstatement when it exists. Misstatements can arise from fraud or error and are considered material if, individually or in the aggregate, they could reasonably be expected to influence the economic decisions of users taken on the basis of these financial statements.
As part of an audit in accordance with ISAs, we exercise professional judgement and maintain professional scepticism throughout the audit. We also:
Identify and assess the risks of material misstatement of each Portfolio’s the financial statements, whether due to fraud or error, design and perform audit procedures responsive to those risks, and obtain audit evidence that is sufficient and appropriate to provide a basis for our opinion. The risk of not detecting a material misstatement resulting from fraud is higher than for one resulting from error, as fraud may involve collusion, forgery, intentional omissions, misrepresentations, or the override of internal control.
Obtain an understanding of internal control relevant to the audit in order to design audit procedures that are appropriate in the circumstances, but not for the purpose of expressing an opinion on the effectiveness of the Scheme’s internal control.
Evaluate the appropriateness of accounting policies used and the reasonableness of accounting estimates and related disclosures made by the directors of the Manager.
Conclude on the appropriateness of the directors of the Manager’s use of the going concern basis of accounting and based on the audit evidence obtained, whether a material uncertainty exists related to events or conditions that may cast significant doubt on the Portfolio’s or the Scheme’s ability to continue as a going concern. If we conclude that a material uncertainty exists, we are required to draw attention in our auditor’s report to the related disclosures in the financial statements or, if such disclosures are inadequate,

9 BDO South Africa Incorporated
Registration number: 1995/002310/21
Practice number: 905526
VAT number: 4910148685
Chief Executive Officer: ME Stewart A full list of all company directors is available on www.bdo.co.za The company’s principal place of business is at The Wanderers Office Park, 52 Corlett Drive, Illovo, Johannesburg where a list of directors’ names is available for inspection. BDO South Africa Incorporated, a South African personal liability company, is a member of BDO International Limited, a UK company limited by guarantee, and forms part of the international BDO network of independent member firms.
to modify our opinion. Our conclusions are based on the audit evidence obtained up to the date of our auditor’s report. However, future events or conditions may cause the Scheme or a Portfolio to cease to continue as a going concern.
Evaluate the overall presentation, structure and content of each Portfolio’s financial statements, including the disclosures, and whether the financial statements represent the underlying transactions and events in a manner that achieves fair presentation.
We communicate with the directors regarding, among other matters, the planned scope and timing of the audit and significant audit findings, including any significant deficiencies in internal control that we identify during our audit.
BDO South Africa Incorporated Registered Auditors Terri Weston Director Registered Auditor 26 July 2021 119-123 Hertzog Boulevard Foreshore Cape Town 8001
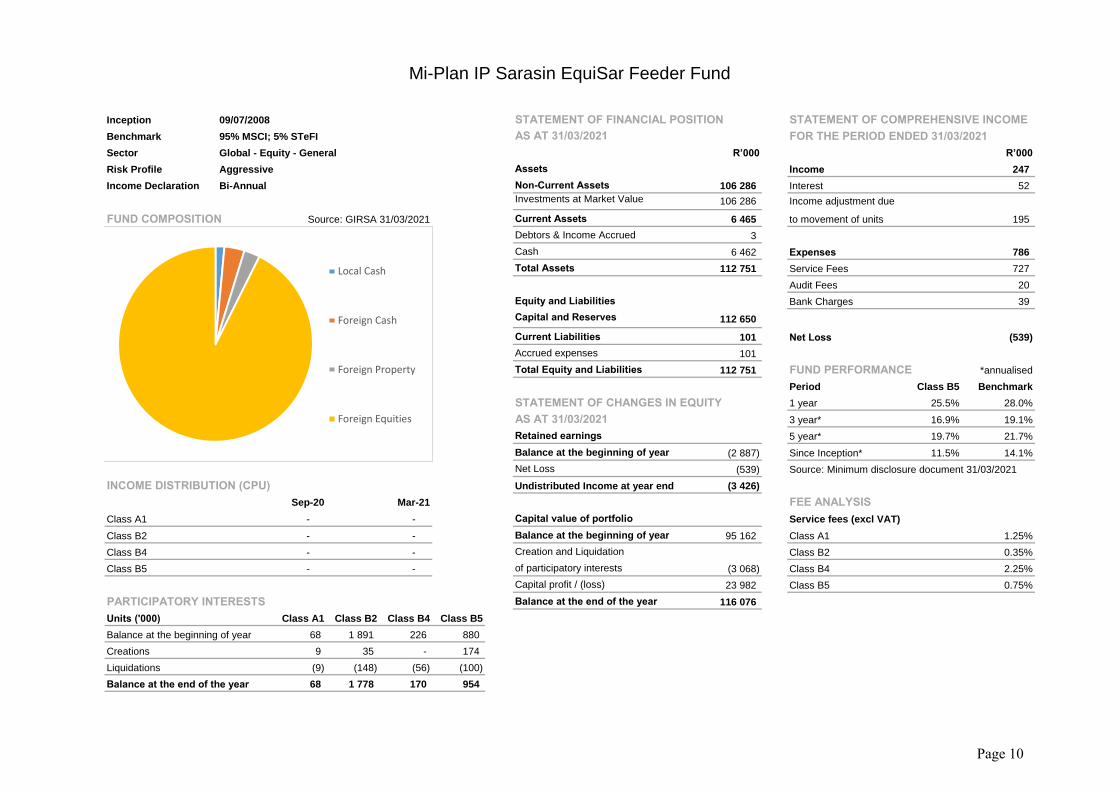
Inception
Benchmark 95% MSCI; 5% STeFI AS AT 31/03/2021
Sector Global - Equity - General R’000 R’000
Risk Profile Assets Income 247
Income Declaration Non-Current Assets 106 286 Interest 52
Investments at Market Value 106 286 Income adjustment due
FUND COMPOSITION Source: GIRSA 31/03/2021 Current Assets 6 465 to movement of units 195
Debtors & Income Accrued 3
Cash 6 462 Expenses 786
Total Assets 112 751 Service Fees 727
Audit Fees 20
Equity and Liabilities Bank Charges 39
Capital and Reserves 112 650
Current Liabilities 101 Net Loss (539)
Accrued expenses 101
Total Equity and Liabilities 112 751 FUND PERFORMANCE *annualised
Period Class B5 Benchmark
1 year 25.5% 28.0%
AS AT 31/03/2021 3 year* 16.9% 19.1%
Retained earnings 5 year* 19.7% 21.7%
Balance at the beginning of year (2 887) Since Inception* 11.5% 14.1%
Net Loss (539) Source: Minimum disclosure document 31/03/2021
INCOME DISTRIBUTION (CPU) Undistributed Income at year end (3 426)
Sep-20 Mar-21 FEE ANALYSIS
Class A1 - - Capital value of portfolio Service fees (excl VAT)
Class B2 - - Balance at the beginning of year 95 162 Class A1 1.25%
Class B4 - - Creation and Liquidation Class B2 0.35%
Class B5 - - of participatory interests (3 068) Class B4 2.25%
Capital profit / (loss) 23 982 Class B5 0.75%
PARTICIPATORY INTERESTS Balance at the end of the year 116 076
Units ('000) Class A1 Class B2 Class B4 Class B5
Balance at the beginning of year 68 1 891 226 880
Creations 9 35 - 174
Liquidations (9) (148) (56) (100)
Balance at the end of the year 68 1 778 170 954
-
STATEMENT OF CHANGES IN EQUITY
Mi-Plan IP Sarasin EquiSar Feeder Fund
09/07/2008 STATEMENT OF FINANCIAL POSITION STATEMENT OF COMPREHENSIVE INCOME
FOR THE PERIOD ENDED 31/03/2021
Aggressive
Bi-Annual
Local Cash
Foreign Cash
Foreign Property
Foreign Equities
Page 10

Inception
Benchmark SA Equity General Sector Ave AS AT 31/03/2021
Sector South African - Equity - General R’000 R’000
Risk Profile Assets Income 2 585
Income Declaration Non-Current Assets 73 128 Dividends 1 839
Investments at Market Value 73 128 Interest 475
FUND COMPOSITION Source: GIRSA 31/03/2021 Current Assets 19 074 Income adjustment due
Debtors & Income Accrued 229 to movement of units 271
Cash 18 845
Total Assets 92 202 Expenses 434
Service Fees 343
Equity and Liabilities Audit Fees 20
Capital and Reserves 91 087 Bank Charges 68
Current Liabilities 1 115 Other expenses 3
Accrued expenses 68
Distributions payable 1 047 Net Income 2 151
Total Equity and Liabilities 92 202
FUND PERFORMANCE *annualised
Period Class B2 Benchmark
AS AT 31/03/2021 1 year 46.7% 48.1%
Retained earnings 3 year* 7.1% 5.5%
Balance at the beginning - 5 year* 6.0% 4.4%
INCOME DISTRIBUTION (CPU) Net Income 2 151 Since Inception* 9.8% 8.9%
Sep-20 Mar-21 Income Distribution (2 151) Source: Minimum disclosure document 31/03/2021
Class B2 31.85 29.18 Undistributed Income at year end -
Class D 32.66 30.07 FEE ANALYSIS
Capital value of portfolio Service fees (excl VAT)
PARTICIPATORY INTERESTS Balance at the beginning of year 29 130 Class B2 0.45%
Units ('000) Class B2 Class D Creation and Liquidation Class D 0.39%
Balance at the beginning of year 724 880 of participatory interests 39 106
Creations 658 1 815 Capital profit / (loss) 22 851
Liquidations (408) (159) Balance at the end of the year 91 087
Balance at the end of the year 974 2 536
STATEMENT OF CHANGES IN EQUITY
Mi-Plan IP Beta Equity Fund
31/01/2006 STATEMENT OF FINANCIAL POSITION STATEMENT OF COMPREHENSIVE INCOME
FOR THE PERIOD ENDED 31/03/2021
Aggressive
Bi-Annual
Local Cash
Local Property
Foreign Property
Local Equities
Foreign Equities
Page 11

Inception
Benchmark CPI+3% AS AT 31/03/2021
Sector South African - Multi Asset - Low Equity R’000 R’000
Risk Profile Assets Income 4 920
Income Declaration Non-Current Assets 85 778 Dividends 657
Investments at Market Value 85 778 Interest 4 225
FUND COMPOSITION Source: GIRSA 31/03/2021 Current Assets 24 253 Income adjustment due
Debtors & Income Accrued 5 925 to movement of units 38
Cash 18 328
Total Assets 110 031 Expenses 905
Service Fees 834
Equity and Liabilities Audit Fees 20
Capital and Reserves 103 192 Bank Charges 51
Current Liabilities 6 839
Accrued expenses 5 795 Net Income 4 015
Distributions payable 1 044
Total Equity and Liabilities 110 031 FUND PERFORMANCE *annualised
Period Class B5 Benchmark
1 year 16.4% 6.0%
AS AT 31/03/2021 3 year* 7.2% 7.0%
Retained earnings 5 year* 6.1% 7.4%
Balance at the beginning - Since Inception* 8.8% 8.6%
INCOME DISTRIBUTION (CPU) Net Income 4 015 Source: Minimum disclosure document 31/03/2021
Jun-20 Sep-20 Dec-20 Mar-21 Income Distribution (4 015)
Class A1 18.93 15.62 15.21 16.89 Undistributed Income at year end - FEE ANALYSIS
Class B2 22.41 19.22 18.83 20.57 Service fees (excl VAT)
Class B4 13.58 10.10 9.65 11.27 Capital value of portfolio Class A1 1.25%
Class B5 21.58 18.36 17.97 19.70 Balance at the beginning of year 87 334 Class B2 0.60%
Creation and Liquidation Class B4 2.25%
PARTICIPATORY INTERESTS of participatory interests 5 459 Class B5 0.75%
Units ('000) Class A1 Class B2 Class B4 Class B5 Capital profit / (loss) 10 399
Balance at the beginning of year 304 1 325 22 3 347 Balance at the end of the year 103 192
Creations 29 59 1 1 291
Liquidations (87) (6) (3) (999)
Balance at the end of the year 246 1 378 20 3 639
STATEMENT OF CHANGES IN EQUITY
Mi-Plan IP Inflation Plus 3 Fund
31/05/2004 STATEMENT OF FINANCIAL POSITION STATEMENT OF COMPREHENSIVE INCOME
FOR THE PERIOD ENDED 31/03/2021
Conservative
Quarterly
Local Cash
Foreign Cash
Local Bonds
Local Property
Foreign Property
Local Equities
Foreign Equities
Other
Page 12

Inception
Benchmark CPI+5% AS AT 31/03/2021
Sector South African - Multi Asset - Medium Equity R’000 R’000
Risk Profile Assets Income 13 234
Income Declaration Non-Current Assets 245 913 Dividends 2 114
Investments at Market Value 245 913 Interest 11 141
FUND COMPOSITION Source: GIRSA 31/03/2021 Current Assets 36 519 Income adjustment due
Debtors & Income Accrued 15 589 to movement of units (21)
Cash 20 930
Total Assets 282 432 Expenses 2 308
Service Fees 2 136
Equity and Liabilities Audit Fees 39
Capital and Reserves 267 202 Bank Charges 62
Current Liabilities 15 230 Performance Fees 71
Accrued expenses 12 456 Other expenses -
Distributions payable 2 774 Net Income 10 926
Total Equity and Liabilities 282 432
FUND PERFORMANCE *annualised
Period Class B5 Benchmark
AS AT 31/03/2021 1 year 18.7% 8.0%
Retained earnings 3 year* 6.8% 9.0%
Balance at the beginning - 5 year* 5.3% 9.5%
Distribution of opening earnings - Since Inception* 9.6% 10.7%
INCOME DISTRIBUTION (CPU) Net Income 10 926 Source: Minimum disclosure document 31/03/2021
Jun-20 Sep-20 Dec-20 Mar-21 Income Distribution (10 926)
Class A1 23.96 19.07 18.46 21.76 Undistributed Income at year end - FEE ANALYSIS
Class B2 28.12 23.39 22.83 26.22 Service fees (excl VAT)
Class B4 17.51 12.39 11.72 14.88 Capital value of portfolio Class A1 1.25%
Class B5 27.16 22.40 21.82 25.19 Balance at the beginning of year 235 002 Class B2 0.60%
Class B6 27.49 22.73 22.18 12.81 Creation and Liquidation Class B4 2.25%
of participatory interests (828) Class B5 0.75%
PARTICIPATORY INTERESTS Capital profit / (loss) 33 028 Class B6 0.70%
Units ('000) Class A1 Class B2 Class B4 Class B5 Class B6 Balance at the end of the year 267 202
Balance at the beginning of year 312 4 196 57 6 006 613
Creations 10 434 1 1 568 43
Liquidations (85) (462) (6) (1 426) (94)
Balance at the end of the year 237 4 168 52 6 148 562
STATEMENT OF CHANGES IN EQUITY
Mi-Plan IP Inflation Plus 5 Fund
31/05/2004 STATEMENT OF FINANCIAL POSITION STATEMENT OF COMPREHENSIVE INCOME
FOR THE PERIOD ENDED 31/03/2021
Moderate
Quarterly
Local Cash
Foreign Cash
Local Bonds
Local Property
Foreign Property
Local Equities
Foreign Equities
Other
Page 13

Inception
Benchmark CPI+7% AS AT 31/03/2021
Sector South African - Multi Asset - Medium Equity R’000 R’000
Risk Profile Assets Income 17 408
Income Declaration Non-Current Assets 378 629 Dividends 3 981
Investments at Market Value 378 629 Interest 13 524
FUND COMPOSITION Source: GIRSA 31/03/2021 Current Assets 67 666 Income adjustment due
Debtors & Income Accrued 45 035 to movement of units (97)
Cash 22 631
Total Assets 446 295 Expenses 3 746
Service Fees 3 612
Equity and Liabilities Audit Fees 54
Capital and Reserves 401 593 Bank Charges 80
Current Liabilities 44 702
Accrued expenses 41 318 Net Income 13 662
Distributions payable 3 384
Total Equity and Liabilities 446 295
FUND PERFORMANCE *annualised
AS AT 31/03/2021 Period Class B5 Benchmark
Retained earnings 1 year 19.9% 10.1%
Balance at the beginning - 3 year* 6.9% 11.1%
Net Income 13 662 5 year* 5.8% 11.6%
INCOME DISTRIBUTION (CPU) Income Distribution (13 662) Since Inception* 11.1% 12.8%
Jun-20 Sep-20 Dec-20 Mar-21 Undistributed Income at year end - Source: Minimum disclosure document 31/03/2021
Class A1 29.84 20.42 18.63 23.25
Class B2 35.54 26.45 24.59 29.36 Capital value of portfolio FEE ANALYSIS
Class B4 21.06 11.30 9.44 13.86 Balance at the beginning of year 361 380 Service fees (excl VAT)
Class B5 34.20 24.99 23.22 27.94 Creation and Liquidation Class A1 1.25%
of participatory interests (16 607) Class B2 0.60%
Capital profit / (loss) 56 820 Class B4 2.25%
PARTICIPATORY INTERESTS Balance at the end of the year 401 593 Class B5 0.75%
Units ('000) Class A1 Class B2 Class B4 Class B5
Balance at the beginning of year 482 394 233 11 642
Creations 58 103 5 2 543
Liquidations (166) (174) (66) (2 802)
Balance at the end of the year 374 323 172 11 383
STATEMENT OF CHANGES IN EQUITY
Mi-Plan IP Inflation Plus 7 Fund
31/05/2004 STATEMENT OF FINANCIAL POSITION STATEMENT OF COMPREHENSIVE INCOME
FOR THE PERIOD ENDED 31/03/2021
Aggressive
Quarterly
Local Cash
Foreign Cash
Local Bonds
Foreign Bonds
Local Property
Foreign Property
Local Equities
Foreign Equities
Other
Page 14

Inception
Benchmark 95% MSCI World Equity Index & 5% STeFI AS AT 31/03/2021
Sector Global - Equity - General R’000 R’000
Risk Profile Assets Income 320
Income Declaration Non-Current Assets 27 139 Dividends 254
Investments at Market Value 27 139 Interest 71
FUND COMPOSITION Source: GIRSA 31/03/2021 Current Assets 3 946 Income adjustment due
Debtors & Income Accrued 20 to movement of units (5)
Cash 3 926
Total Assets 31 085
Expenses 404
Equity and Liabilities Service Fees 300
Capital and Reserves 31 034 Audit Fees 20
Current Liabilities 51 Bank Charges 79
Accrued expenses 51 Other expenses 5
Total Equity and Liabilities 31 085
Net loss (84)
AS AT 31/03/2021 FUND PERFORMANCE *annualised
Retained earnings Period Class B2 Benchmark
Balance at the beginning - 1 year 15.0% 28.0%
Net loss (84) 3 year* n/a n/a
INCOME DISTRIBUTION (CPU) Undistributed Income at year end (84) 5 year* n/a n/a
Sep-20 Mar-21 Since Inception* 10.0% 12.6%
Class B2 - - Capital value of portfolio Source: Minimum disclosure document 31/03/2021
Class B6 - - Balance at the beginning of year 14 689
Creation and Liquidation FEE ANALYSIS
PARTICIPATORY INTERESTS of participatory interests 14 187 Service fees (excl VAT)
Units ('000) Class B2 Class B6 Capital profit / (loss) 2 242 Class B2 0.95%
Balance at the beginning of year 417 363 Balance at the end of the year 31 118 Class B6 0.95%
Creations 1 103 16
Liquidations (458) (7)
Balance at the end of the year 1 062 372
STATEMENT OF CHANGES IN EQUITY
Mi-Plan IP Global AI Opportunity Fund
10/09/2018 STATEMENT OF FINANCIAL POSITION STATEMENT OF COMPREHENSIVE INCOME
FOR THE PERIOD ENDED 31/03/2021
Aggressive
Bi-Annual
Local Cash
Foreign Cash
Foreign Bonds
Foreign Property
Local Equities
Foreign Equities
Page 15

Inception
Benchmark Stefi (Short Term Fixed Interest Index) AS AT 31/03/2021
Sector South African - Multi Asset - Income R’000 R’000
Risk Profile Assets Income 289 814
Income Declaration Non-Current Assets 4 654 997 Dividends 1 583
Investments at Market Value 4 654 997 Interest 266 865
FUND COMPOSITION Source: GIRSA 31/03/2021 Current Assets 185 698 Other income 2 862
Debtors & Income Accrued 68 373 Income adjustment due
Cash 117 325 to movement of units 18 504
Total Assets 4 840 695
Expenses 25 696
Equity and Liabilities Service Fees 25 021
Capital and Reserves 4 753 722 Audit Fees 79
Current Liabilities 86 973 Bank Charges 596
Accrued expenses 2 941
Distributions payable 84 032 Net Income 264 118
Total Equity and Liabilities 4 840 695
FUND PERFORMANCE *annualised
Period Class A1 Benchmark
AS AT 31/03/2021 1 year 10.5% 4.6%
Retained earnings 3 year* 9.7% 6.4%
Balance at the beginning - 5 year* 9.6% 6.8%
Net Income 264 118 Since Inception* 8.2% 6.4%
INCOME DISTRIBUTION (CPU) Income Distribution (264 118) Source: Minimum disclosure document 31/03/2021
Jun-20 Sep-20 Dec-20 Mar-21 Undistributed Income at year end -
Class A1 19.60 17.86 16.32 17.89 FEE ANALYSIS
Class B1 20.29 18.60 17.03 18.60 Capital value of portfolio Service fees (excl VAT)
Class B2 21.36 19.68 18.15 19.69 Balance at the beginning of year 2 418 616 Class A1 0.75%
Class B6 19.88 18.16 16.63 18.18 Creation and Liquidation Class B1 0.50%
Class B7 20.78 19.08 17.55 19.09 of participatory interests 2 241 723 Class B2 0.15%
Class C 17.05 13.25 14.30 17.29 Capital profit / (loss) 93 383 Class B6 0.65%
Balance at the end of the year 4 753 722 Class B7 0.35%
PARTICIPATORY INTERESTS Class C 0.95%
Units ('000) Class A1 Class B1 Class B2 Class B6 Class B7 Class C
Balance at the beginning of year 127 270 56 903 1 100 29 432 26 443 -
Creations 126 998 132 060 698 64 566 11 823 24
Liquidations (62 260) (30 743) (566) (18 798) (6 252) -
Balance at the end of the year 192 008 158 220 1 232 75 200 32 014 24
STATEMENT OF CHANGES IN EQUITY
Mi-Plan IP Enhanced Income Fund
26/03/2012 STATEMENT OF FINANCIAL POSITION
FOR THE PERIOD ENDED 31/03/2021
Conservative
Quarterly
STATEMENT OF COMPREHENSIVE
INCOME
Local Cash
Foreign Cash
Local Bonds
Local Property
ForeignPropertyLocal Equities
Foreign Equities
Page 16
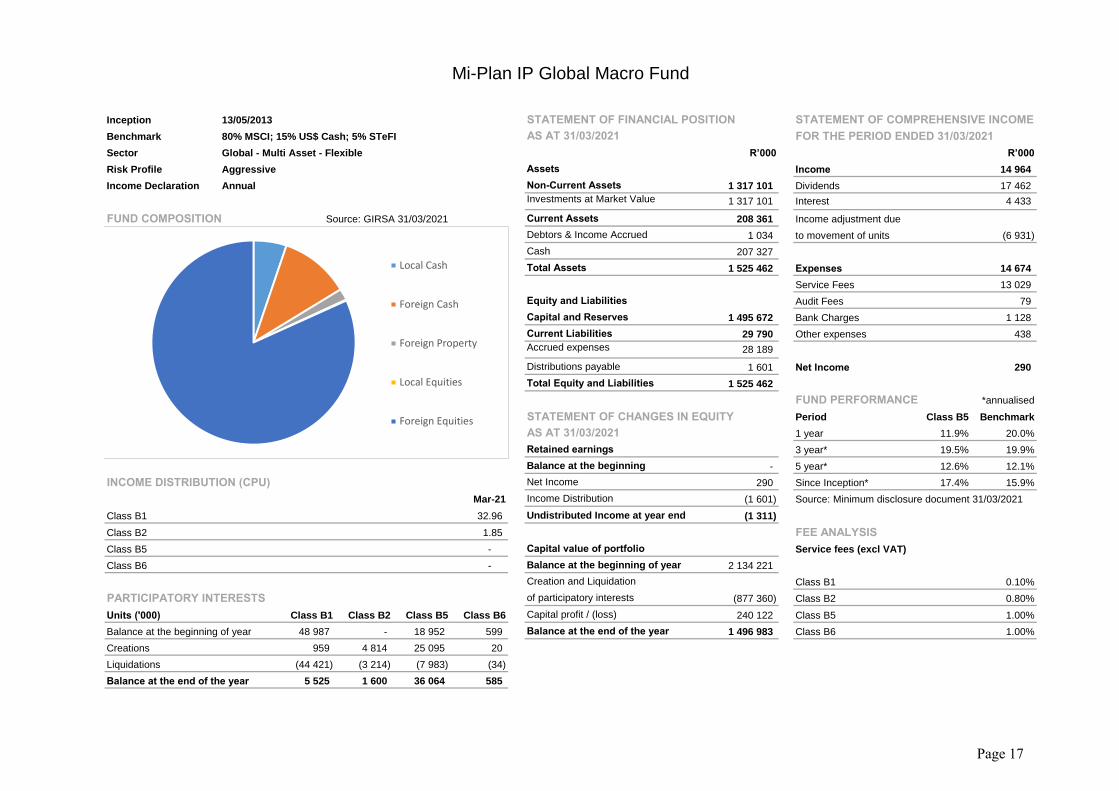
Inception
Benchmark 80% MSCI; 15% US$ Cash; 5% STeFI AS AT 31/03/2021
Sector Global - Multi Asset - Flexible R’000 R’000
Risk Profile Assets Income 14 964
Income Declaration Non-Current Assets 1 317 101 Dividends 17 462
Investments at Market Value 1 317 101 Interest 4 433
FUND COMPOSITION Source: GIRSA 31/03/2021 Current Assets 208 361 Income adjustment due
Debtors & Income Accrued 1 034 to movement of units (6 931)
Cash 207 327
Total Assets 1 525 462 Expenses 14 674
Service Fees 13 029
Equity and Liabilities Audit Fees 79
Capital and Reserves 1 495 672 Bank Charges 1 128
Current Liabilities 29 790 Other expenses 438
Accrued expenses 28 189
Distributions payable 1 601 Net Income 290
Total Equity and Liabilities 1 525 462
FUND PERFORMANCE *annualised
Period Class B5 Benchmark
AS AT 31/03/2021 1 year 11.9% 20.0%
Retained earnings 3 year* 19.5% 19.9%
Balance at the beginning - 5 year* 12.6% 12.1%
INCOME DISTRIBUTION (CPU) Net Income 290 Since Inception* 17.4% 15.9%
Mar-21 Income Distribution (1 601) Source: Minimum disclosure document 31/03/2021
Class B1 32.96 Undistributed Income at year end (1 311)
Class B2 1.85 FEE ANALYSIS
Class B5 - Capital value of portfolio Service fees (excl VAT)
Class B6 - Balance at the beginning of year 2 134 221
Creation and Liquidation Class B1 0.10%
PARTICIPATORY INTERESTS of participatory interests (877 360) Class B2 0.80%
Units ('000) Class B1 Class B2 Class B5 Class B6 Capital profit / (loss) 240 122 Class B5 1.00%
Balance at the beginning of year 48 987 - 18 952 599 Balance at the end of the year 1 496 983 Class B6 1.00%
Creations 959 4 814 25 095 20
Liquidations (44 421) (3 214) (7 983) (34)
Balance at the end of the year 5 525 1 600 36 064 585
STATEMENT OF CHANGES IN EQUITY
Mi-Plan IP Global Macro Fund
13/05/2013 STATEMENT OF FINANCIAL POSITION STATEMENT OF COMPREHENSIVE INCOME
FOR THE PERIOD ENDED 31/03/2021
Aggressive
Annual
Local Cash
Foreign Cash
Foreign Property
Local Equities
Foreign Equities
Page 17

Inception
Benchmark AS AT 31/03/2021
R’000 R’000
Sector Global - Real Estate - General Assets Income 403
Risk Profile Aggressive Non-Current Assets 71 626 Interest 63
Income Declaration Bi-Annual Investments at Market Value 71 626 Income adjustment due
Current Assets 4 386 to movement of units 340
FUND COMPOSITION Source: GIRSA 31/03/2021 Debtors & Income Accrued 6
Cash 4 380 Expenses 431
Total Assets 76 012 Service Fees 371
Audit Fees 20
Equity and Liabilities Bank Charges 40
Capital and Reserves 75 954
Current Liabilities 58 Net Loss (28)
Accrued expenses 58
Total Equity and Liabilities 76 012 FUND PERFORMANCE *annualised
Period Class B5 Benchmark
1 year 3.7% 11.9%
AS AT 31/03/2021 3 year* 8.5% 13.9%
Retained earnings 5 year* 1.6% 5.1%
Balance at the beginning (1 898) Since Inception* 7.7% 10.4%
Net Loss (28) Source: Minimum disclosure document 31/03/2021
Undistributed Income at year end (1 926)
INCOME DISTRIBUTION (CPU) FEE ANALYSIS
Sep-20 Mar-21 Capital value of portfolio Service fees (excl VAT)
Class B1 - - Balance at the beginning of year 89 356 Class B1 0.35%
Class B5 - - Creation and Liquidation Class B5 0.50%
of participatory interests (15 535)
PARTICIPATORY INTERESTS Capital profit / (loss) 4 059
Units ('000) Class B1 Class B5 Balance at the end of the year 77 880
Balance at the beginning of year 3 750 1 351
Creations 1 092 100
Liquidations (1 688) (339)
Balance at the end of the year 3 154 1 112
STATEMENT OF CHANGES IN EQUITY
Mi-Plan IP Global Property Feeder Fund
31/05/2013 STATEMENT OF FINANCIAL POSITION STATEMENT OF COMPREHENSIVE INCOME
FOR THE PERIOD ENDED 31/03/20215% Cash & 95% S&P Developed Property Net
Total Return
Local Cash
Foreign Cash
Foreign Bonds
Local Property
Foreign Property
Page 18
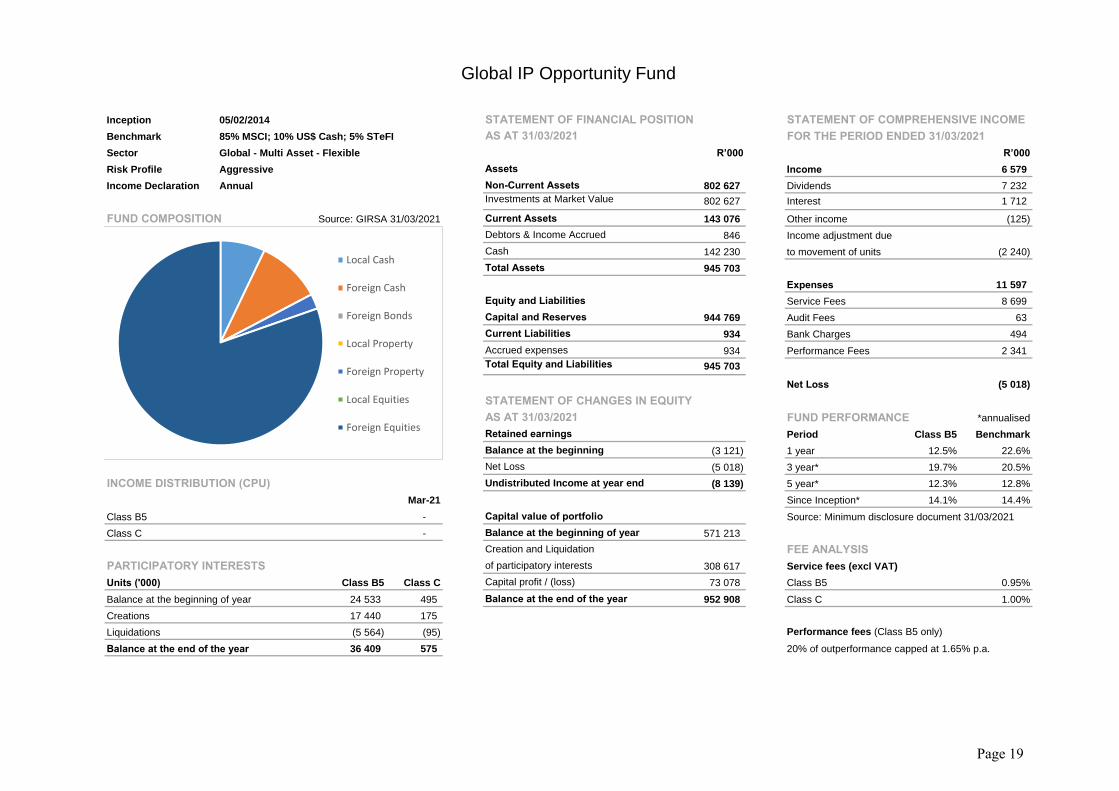
Inception
Benchmark 85% MSCI; 10% US$ Cash; 5% STeFI AS AT 31/03/2021
Sector Global - Multi Asset - Flexible R’000 R’000
Risk Profile Assets Income 6 579
Income Declaration Non-Current Assets 802 627 Dividends 7 232
Investments at Market Value 802 627 Interest 1 712
FUND COMPOSITION Source: GIRSA 31/03/2021 Current Assets 143 076 Other income (125)
Debtors & Income Accrued 846 Income adjustment due
Cash 142 230 to movement of units (2 240)
Total Assets 945 703
Expenses 11 597
Equity and Liabilities Service Fees 8 699
Capital and Reserves 944 769 Audit Fees 63
Current Liabilities 934 Bank Charges 494
Accrued expenses 934 Performance Fees 2 341
Total Equity and Liabilities 945 703
Net Loss (5 018)
AS AT 31/03/2021 FUND PERFORMANCE *annualised
Retained earnings Period Class B5 Benchmark
Balance at the beginning (3 121) 1 year 12.5% 22.6%
Net Loss (5 018) 3 year* 19.7% 20.5%
INCOME DISTRIBUTION (CPU) Undistributed Income at year end (8 139) 5 year* 12.3% 12.8%
Mar-21 Since Inception* 14.1% 14.4%
Class B5 - Capital value of portfolio Source: Minimum disclosure document 31/03/2021
Class C - Balance at the beginning of year 571 213
Creation and Liquidation FEE ANALYSIS
PARTICIPATORY INTERESTS of participatory interests 308 617 Service fees (excl VAT)
Units ('000) Class B5 Class C Capital profit / (loss) 73 078 Class B5 0.95%
Balance at the beginning of year 24 533 495 Balance at the end of the year 952 908 Class C 1.00%
Creations 17 440 175
Liquidations (5 564) (95) Performance fees (Class B5 only)
Balance at the end of the year 36 409 575 20% of outperformance capped at 1.65% p.a.
STATEMENT OF CHANGES IN EQUITY
Global IP Opportunity Fund
05/02/2014 STATEMENT OF FINANCIAL POSITION STATEMENT OF COMPREHENSIVE INCOME
FOR THE PERIOD ENDED 31/03/2021
Aggressive
Annual
Local Cash
Foreign Cash
Foreign Bonds
Local Property
Foreign Property
Local Equities
Foreign Equities
Page 19
Inception
Benchmark AS AT 31/03/2021
R’000 R’000
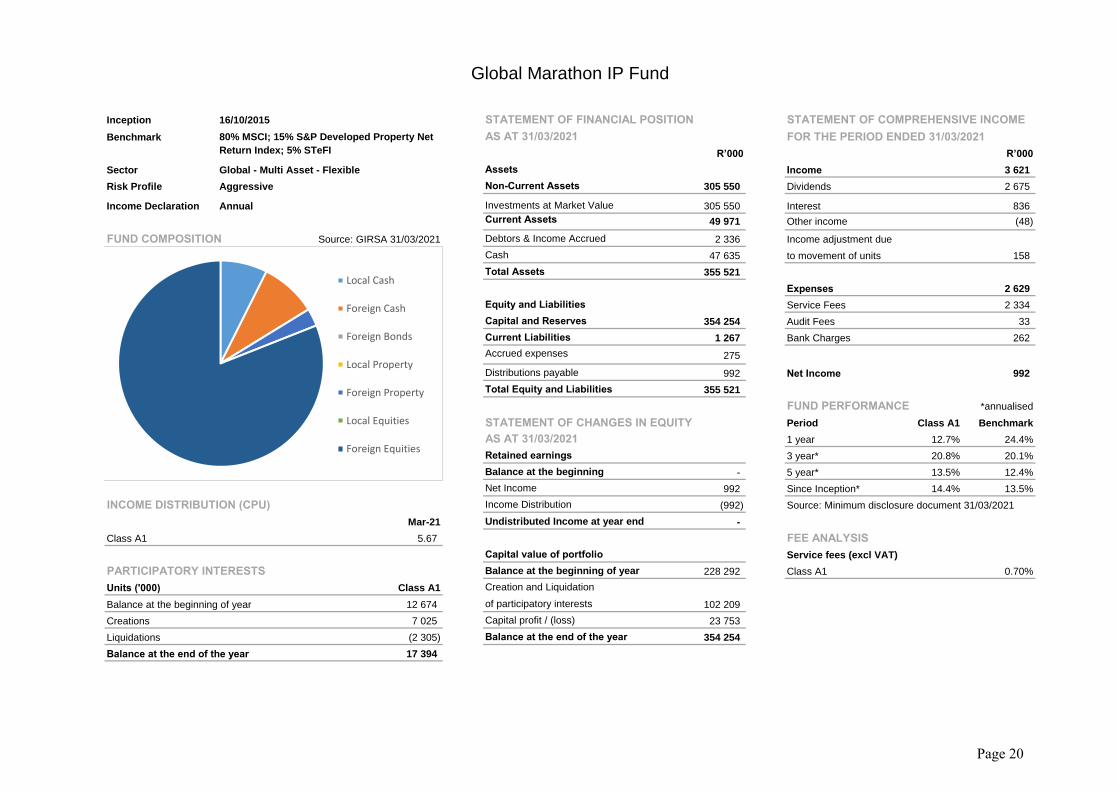
Sector Global - Multi Asset - Flexible Assets Income 3 621
Risk Profile Non-Current Assets 305 550 Dividends 2 675
Income Declaration Investments at Market Value 305 550 Interest 836
Current Assets 49 971 Other income (48)
FUND COMPOSITION Source: GIRSA 31/03/2021 Debtors & Income Accrued 2 336 Income adjustment due
Cash 47 635 to movement of units 158
Total Assets 355 521
Expenses 2 629
Equity and Liabilities Service Fees 2 334
Capital and Reserves 354 254 Audit Fees 33
Current Liabilities 1 267 Bank Charges 262
Accrued expenses 275
Distributions payable 992 Net Income 992
Total Equity and Liabilities 355 521
FUND PERFORMANCE *annualised
Period Class A1 Benchmark
AS AT 31/03/2021 1 year 12.7% 24.4%
Retained earnings 3 year* 20.8% 20.1%
Balance at the beginning - 5 year* 13.5% 12.4%
Net Income 992 Since Inception* 14.4% 13.5%
INCOME DISTRIBUTION (CPU) Income Distribution (992) Source: Minimum disclosure document 31/03/2021
Mar-21 Undistributed Income at year end -
Class A1 5.67 FEE ANALYSIS
Capital value of portfolio Service fees (excl VAT)
PARTICIPATORY INTERESTS Balance at the beginning of year 228 292 Class A1 0.70%
Units ('000) Class A1 Creation and Liquidation
Balance at the beginning of year 12 674 of participatory interests 102 209
Creations 7 025 Capital profit / (loss) 23 753
Liquidations (2 305) Balance at the end of the year 354 254
Balance at the end of the year 17 394
STATEMENT OF CHANGES IN EQUITY
Global Marathon IP Fund
16/10/2015 STATEMENT OF FINANCIAL POSITION STATEMENT OF COMPREHENSIVE INCOME
FOR THE PERIOD ENDED 31/03/2021
Aggressive
Annual
80% MSCI; 15% S&P Developed Property Net
Return Index; 5% STeFI
Local Cash
Foreign Cash
Foreign Bonds
Local Property
Foreign Property
Local Equities
Foreign Equities
Page 20

CONTACT DETAILS
IP MANAGEMENT COMPANY
Physical: 1st Floor, Mariendahl House Newlands on Main Main Road Newlands 7700
Postal: PO Box 23271
Claremont 7735
Telephone: 021 673 1340 Fax: 086 557 4848 Email: [email protected]
MIPLAN
Physical: 1st Floor, Mariendahl House Newlands on Main Main Road Newlands 7700
Postal: PO Box 23271
Claremont 7735
Telephone: 021 657 5960 Fax: 021 657 5960 Email: [email protected]
Copies of the audited Annual Financial Statements of IP Management Company and all the portfolios of the IP Collective Investment Scheme are available, free of charge, on request. This abridged report only includes the abridged financial statements for the specific portfolios in which you are invested. For the latest terms and conditions applicable to your investment, kindly consult the most recent application form.