iowa department of education 2013 condition of education report
DESCRIPTION
The annual report on the status of Iowa's K-12 schools.TRANSCRIPT

Iowa Department of Education
2013
The Annual
Condition of Education
Report

State of Iowa Department of Education
Grimes State Office Building 400 E. 14th St.
Des Moines, IA 50319-0146
State Board of EducationRosie Hussey, President, Clear LakeCharles C. Edwards, Jr., Vice President, Des MoinesDiane Crookham-Johnson, OskaloosaSister Jude Fitzpatrick, West Des MoinesMichael L. Knedler, Council BluffsValorie J. Kruse, Sioux CityMike May, Spirit LakeMax Phillips, WoodwardLaMetta Wynn, ClintonEdgar Thornton, Student Member, Iowa City
AdministrationBrad Buck, Director and Executive Officer of the State Board of Education
It is the policy of the Iowa Department of Education not to discriminate on the basis of race, creed, color, sex, sexual orientation, gender identity, national origin, gender, disability, religion, age, political party af-filiation, or actual or potential parental, family or marital status in its programs, activities, or employment practices as required by the Iowa Code sections 216.9 and 256.10(2), Titles VI and VII of the Civil Rights Act of 1964 (42 U.S.C. § 2000d and 2000e), the Equal Pay Act of 1973 (29 U.S.C. § 206, et seq.), Title IX (Educational Amendments, 20 U.S.C. §§ 1681 – 1688) Section 504 (Rehabilitation Act of 1973, 29 U.S.C. § 794), and the Americans with Disabilities Act (42 U.S.C. § 12101, et seq.).
If you have questions or grievances related to compliance with this policy by the Iowa Department of Education, please contact the legal counsel for the Iowa Department of Education, Grimes State Office Building, 400 E 14th St, Des Moines IA 50319-0146, telephone number 515/281-5295, or the Director of the Office for Civil Rights, U.S. Department of Education, 111 N. Canal Street, Suite 1053, Chicago, IL 60606-7204.
State Board of Education iii

Iowa Department of Education
Division of Learning and ResultsDavid Tilly, Deputy Director
Bureau of Educator Quality
Bryon Darnall, ChiefPenny Milburn, Consultant
Bureau of Information and Analysis Services
Jay Pennington, ChiefDianne Chadwick, Administrative ConsultantXiaoping Wang, Administrative ConsultantXia Chen, ConsultantMarlene Dorenkamp, ConsultantTom Deeter, Lead ConsultantKim Wilson, Secretary
Bureau of Learner Strategies and Supports
Sarah Brown, ChiefLauraBelle Sherman-Proehl, Administrative Consultant
Bureau of School Improvement
Amy Williamson, ChiefJanell Brandhorst, Administrative ConsultantMeredith MacQuigg, ConsultantJennifer Adkins, Consultant
Division of School Finance and Support ServicesJeff Berger, Deputy DirectorMarcia Krieger, Executive Officer
Bureau of Finance, Facilities, Operation and Transportation Services
Su McCurdy, Administrative ConsultantJanice Evans, ConsultantJoyce Thomsen, ConsultantDenise Ragias, ConsultantGary Schwartz, Consultant
The Annual Condition of Education Report 2013iv

Dear Citizens of Iowa:
Our focus as an education system has been to pave the best path forward for Iowa’s schools and students.
We know we must look beyond making sure all students get a high school diploma and ensure they are prepared with the knowledge and skills they need to succeed in postsecondary education and training.
Today’s students must be ready to meet the demands of a competitive global marketplace, which empha-sizes innovation, problem-solving and practical application of knowledge. This reality has been at the heart of recent efforts to significantly improve our school system in Iowa.
While we work to prepare our students and our state for the future, we also must take a look back to understand where we are and where we want to go – to find out what works and where improvements are needed.
The Annual Condition of Education report helps us do just that, with valuable information on student populations and demographics, teacher salaries and characteristics, student achievement results, and school financial data.
In addition to the typical information provided each year, this year’s report highlights achievement data for 4-year-old children in the Statewide Voluntary Preschool Program (page 27), as well as teacher retention patterns (page 71).
We strive to provide the most useful data each year and will continue to do so in the years ahead. The An-nual Condition of Education report is one resource that will help us work together to provide all students the best education possible.
Thanks for all you do for your schools and students every day.
Sincerely,
Brad A. Buck, Director
Iowa Department of Education
State Board of Education v

AcknowledgmentsThe authors of the Annual Condition of Education Report wish to thank the staff of the Iowa Department of Education who contributed to the production of this report. A special acknowledgement is extended to individuals outside the Department of Education who made important contributions in sharing their data and thoughts with us. They are: Dr. Steve Dunbar and Dr. Catherine Welch, Iowa Testing Programs.
The Annual Condition of Education Report 2013vi

IntroductionThe 2013 edition of The Annual Condition of Education Report provides a rich tapestry of information about Iowa’s education system. The data presented in the report examines longitudinal trends about our students, our teachers, and our schools from many perspectives. Information such as demographic characteristics, assessment results, college readiness measures, courses taken, and financial health are just a few examples. Below are highlights from the 24th edition of the report. Please take the time to explore the expansive information in this report.
Enrollment• Iowa continues to change and become more diverse. • The number of minority students in public schools has doubled since 2000 and now is at an all-time
high (95,673). Minority students are 20.2 percent of the student body. • The percentage of students living in poverty continues to grow and now covers over 41 percent of
the student body. In the 2012-2013 school year, 41 percent of students were eligible for free or reduced priced lunch.
• The number of students who are English language learners (ELL) has also doubled since 2000. In the 2012-2013 school year, 5 percent of students were reported as ELL.
Iowa Educators• Iowa’s average teacher salary of $50,240 ranks just under the midpoint compared with other states.
Iowa’s average teacher salary is 26th in national rankings and 7th compared to Midwest states.• There is a clear association between teacher mobility and student achievement. Over a five-year
period, schools with higher achievement were able to retain a larger percentage of their teaching workforce than schools with below average performance.
• There were 34,226 teachers in the state in 2011-2012, which is up slightly from 2000-2001 (33,610).
Student Performance• For the 2011-13 biennium, there were notable differences in student performance for both read-
ing and mathematics across grades 4, 8 and 11 from the prior year. The differences are due to the introduction of new Iowa Assessment forms.
• A decrease can be found in fourth grade Iowa Assessment results in reading and mathematics proficiency percentages in the 2011-2013 biennium.
• Decreases in student performance are seen in eighth grade Iowa Assessment proficiency results in both mathematics and reading for the 2011-2013 biennium.
• Increases in student performance can be found in 11th grade Iowa Assessment proficiency for both reading and mathematics during the 2011-2013 biennium.
• National Assessment of Educational Progress (NAEP) results remain unchanged. Iowa fourth and eighth grade NAEP results in mathematics and reading are also similar from the prior years, with no significant gains in either content area or grade level.
• 40.2 percent of the graduating class of 2013 reported taking a high-level mathematics course.
The Annual Condition of Education Report 2013vii
• Two-thirds (66.4 percent) of the class of 2013 reported taking chemistry, while 26.6 percent took physics.
Highlights can be found in several key areas: graduation rate, ACT performance, and Advanced Placement (AP) opportunities.
• The four-year cohort graduation rate for the class of 2012 was 89.3 percent. Iowa continues to have one of the highest graduation rates in the nation.
• The percentage of Iowa students taking the ACT was 66 percent for the class of 2013. The national percentage of students taking the ACT continues to increase and was 54 percent in 2013.
• Iowa students continue to score well on the ACT. Among 28 states for which ACT is the primary college entrance exam (greater than 50 percent), Iowa’s average composite score (22.1) continues to rank second. The average composite score remains unchanged from 2012.
• The number of Iowa students taking AP courses continues to climb in 2013 (17,628). There were also 11,084 AP exams taken in 2013 which increased by over 1,200 from 2012.
Technology Readiness• Iowa districts spent $174.40 per student for hardware and software during the 2011-2012 school
year. Up from $86.20 per student in 2000-2001. • The number of computers available to Iowa students continues to increase. In 2012-2013, there
were approximately 1.7 students per computer. • Iowa schools have a need for high-speed bandwidth for digital learning. • Statewide, most high schools are equipped with 50 MB or less of bandwidth (67.3 percent).
This compares to 54.7 percent of middle schools and 51.5 percent of elementary schools.
Sincerely,
Jay Pennington, ChiefBureau of Information and Analysis
The Annual Condition of Education Report 2013viii
The Annual Condition of Education Report 2013ix

Contents
Enrollment � � � � � � � � � � � � � � � � � � � � � � � � � � � � � � � � � � � � � � � � � � � � � � � � � � � � � � � � � � � � � � � � � � � � � � � � � � � � �1Enrollment Trends � � � � � � � � � � � � � � � � � � � � � � � � � � � � � � � � � � � � � � � � � � � � � � � � � � � � �3Projected Enrollment � � � � � � � � � � � � � � � � � � � � � � � � � � � � � � � � � � � � � � � � � � � � � � � � �4 K-12 Enrollments by District Size Category � � � � � � � � � � � � � � � � � � � � � � � � �5Enrollment in Iowa’s Area Education Agencies (AEAs) � � � � � � � � � � � �6Open Enrollment � � � � � � � � � � � � � � � � � � � � � � � � � � � � � � � � � � � � � � � � � � � � � � � � � � � � � �6Subgroup Enrollments � � � � � � � � � � � � � � � � � � � � � � � � � � � � � � � � � � � � � � � � � � � � � � � �8
Students Eligible for Free or Reduced Price Lunch � � � � � � � � � � � � � � � � � � � � � � � � � � � � � � � � � 8Special Education Enrollment � � � � � � � � � � � � � � � � � � � � � � � � � � � � � � � � � � � � � � � � � � � � � � � � � 9Enrollment by Race and Ethnicity � � � � � � � � � � � � � � � � � � � � � � � � � � � � � � � � � � � � � � � � � � � � � � 9Enrollment of English Language Learners (ELL) � � � � � � � � � � � � � � � � � � � � � � � � � � � � � � � � � � 11Migrant Student Enrollment � � � � � � � � � � � � � � � � � � � � � � � � � � � � � � � � � � � � � � � � � � � � � � � � � 13
Early Childhood Education � � � � � � � � � � � � � � � � � � � � � � � � � � � � � � � � � � � � � � � � � � � � � � � � � � � � �15Preschool Programs � � � � � � � � � � � � � � � � � � � � � � � � � � � � � � � � � � � � � � � � � � � � � � � � 15
Preschool Enrollment � � � � � � � � � � � � � � � � � � � � � � � � � � � � � � � � � � � � � � � � � � � � � � � � � � � � � � � 15
Statewide Voluntary Preschool Program for Four-Year-Old Children � � � � � � � � � � � � � � � � � � � � � � � � � � � � � � � � � � � � � � � � � � � � � � � � � � � � � � � � � � � � � � 18Kindergarten � � � � � � � � � � � � � � � � � � � � � � � � � � � � � � � � � � � � � � � � � � � � � � � � � � � � � � � � 22Preschool Attendance (Parent Perception) � � � � � � � � � � � � � � � � � � � � � � � 25Evaluation of the Effectiveness of the Statewide Voluntary Preschool Program (SWVPP) Second Cohort (2008-2009) � � � � � � 27
Staff � � � � � � � � � � � � � � � � � � � � � � � � � � � � � � � � � � � � � � � � � � � � � � � � � � � � � � � � � � � � � � � � � � � � � � � � � � � � � � � � � � � �37Teachers � � � � � � � � � � � � � � � � � � � � � � � � � � � � � � � � � � � � � � � � � � � � � � � � � � � � � � � � � � � � � � 38Principals � � � � � � � � � � � � � � � � � � � � � � � � � � � � � � � � � � � � � � � � � � � � � � � � � � � � � � � � � � � � 51Superintendents � � � � � � � � � � � � � � � � � � � � � � � � � � � � � � � � � � � � � � � � � � � � � � � � � � � � � 55Teacher, Principal, and Superintendent Salary Comparison � � � � 59Public School Guidance Counselors � � � � � � � � � � � � � � � � � � � � � � � � � � � � � � � 61Public School Library/Media Staff � � � � � � � � � � � � � � � � � � � � � � � � � � � � � � � � � 65Area Education Agency (AEA) Licensed Staff � � � � � � � � � � � � � � � � � � � � � 67Licensed Staff State Totals � � � � � � � � � � � � � � � � � � � � � � � � � � � � � � � � � � � � � � � � � 69Public School Nurses � � � � � � � � � � � � � � � � � � � � � � � � � � � � � � � � � � � � � � � � � � � � � � � � 70
Contents ix

The Relationship Between Student Achievement and Teacher Retention in Iowa Schools � � � � � � � � � � � � � � � � � � � � � � � � � � � � � � � � � � � � � � � � � � 71
Program � � � � � � � � � � � � � � � � � � � � � � � � � � � � � � � � � � � � � � � � � � � � � � � � � � � � � � � � � � � � � � � � � � � � � � � � � � � � � �76Districts and Schools � � � � � � � � � � � � � � � � � � � � � � � � � � � � � � � � � � � � � � � � � � � � � � � � 76Carnegie Unit Taught � � � � � � � � � � � � � � � � � � � � � � � � � � � � � � � � � � � � � � � � � � � � � � � 77Enrollments in Foreign Language, Algebra II, Higher-Level Mathematics, and Higher-Level Science Courses � � � � � � � � � � � � � � � � 79Senior Year Plus � � � � � � � � � � � � � � � � � � � � � � � � � � � � � � � � � � � � � � � � � � � � � � � � � � � � � 86
Advanced Placement (AP) Courses � � � � � � � � � � � � � � � � � � � � � � � � � � � � � � � � � � � � � � � � � � � � 86Concurrent Enrollment � � � � � � � � � � � � � � � � � � � � � � � � � � � � � � � � � � � � � � � � � � � � � � � � � � � � � � 89Postsecondary Enrollment Options (PSEO) Act � � � � � � � � � � � � � � � � � � � � � � � � � � � � � � � � � � � 92
Class Size � � � � � � � � � � � � � � � � � � � � � � � � � � � � � � � � � � � � � � � � � � � � � � � � � � � � � � � � � � � � � 95Overview � � � � � � � � � � � � � � � � � � � � � � � � � � � � � � � � � � � � � � � � � � � � � � � � � � � � � � � � � � � � � � � � � 95Trends � � � � � � � � � � � � � � � � � � � � � � � � � � � � � � � � � � � � � � � � � � � � � � � � � � � � � � � � � � � � � � � � � � � 95Class Size vs. District Size � � � � � � � � � � � � � � � � � � � � � � � � � � � � � � � � � � � � � � � � � � � � � � � � � � �100Class Size Funding and Expenditures � � � � � � � � � � � � � � � � � � � � � � � � � � � � � � � � � � � � � � � � � �101
Technology � � � � � � � � � � � � � � � � � � � � � � � � � � � � � � � � � � � � � � � � � � � � � � � � � � � � � � � � � �102Expenditures for Computer Hardware and Software � � � � � � � � � � � � � � � � � � � � � � � � � � � � �102Availability of Computers � � � � � � � � � � � � � � � � � � � � � � � � � � � � � � � � � � � � � � � � � � � � � � � � � � �105Bandwidth � � � � � � � � � � � � � � � � � � � � � � � � � � � � � � � � � � � � � � � � � � � � � � � � � � � � � � � � � � � � � � � 109
Student Performance � � � � � � � � � � � � � � � � � � � � � � � � � � � � � � � � � � � � � � � � � � � � � � � � � � � � � � � � � 113State Indicators of Student Success � � � � � � � � � � � � � � � � � � � � � � � � � � � � � �113
Iowa Student Counts for Iowa Assessment Reading, Mathematics, and Science Test-Takers Including Subgroups � � � � � � � � � � � � � � � � � � � � � � � � � � � � � � � � � � � � � � � � � � � � � � � � �114Reading � � � � � � � � � � � � � � � � � � � � � � � � � � � � � � � � � � � � � � � � � � � � � � � � � � � � � � � � � � � � � � � � � 119Mathematics � � � � � � � � � � � � � � � � � � � � � � � � � � � � � � � � � � � � � � � � � � � � � � � � � � � � � � � � � � � � � 139Science � � � � � � � � � � � � � � � � � � � � � � � � � � � � � � � � � � � � � � � � � � � � � � � � � � � � � � � � � � � � � � � � � � 157Dropouts � � � � � � � � � � � � � � � � � � � � � � � � � � � � � � � � � � � � � � � � � � � � � � � � � � � � � � � � � � � � � � � � 169High School Graduation Rates � � � � � � � � � � � � � � � � � � � � � � � � � � � � � � � � � � � � � � � � � � � � � � �171Postsecondary Education/Training Intententions � � � � � � � � � � � � � � � � � � � � � � � � � � � � � � �172Probable Postsecondary Success � � � � � � � � � � � � � � � � � � � � � � � � � � � � � � � � � � � � � � � � � � � � �173
Student Performance by Tests and Areas � � � � � � � � � � � � � � � � � � � � � � � �175Iowa Assessments � � � � � � � � � � � � � � � � � � � � � � � � � � � � � � � � � � � � � � � � � � � � � � � � � �175
Iowa Assessment Achievement Level Distributions � � � � � � � � � � � � � � � � � � � � � � � � � � � � � �175
The Annual Condition of Education Report 2013x

Achievement Levels for Reading � � � � � � � � � � � � � � � � � � � � � � � � � � � � � � � � � � � � � � � � � � � � �176Achievement Levels for Mathematics � � � � � � � � � � � � � � � � � � � � � � � � � � � � � � � � � � � � � � � � �179Achievement Levels for Science � � � � � � � � � � � � � � � � � � � � � � � � � � � � � � � � � � � � � � � � � � � � � �182
National Assessment of Educational Progress (NAEP) � � � � � � � � �184Average Scale Scores � � � � � � � � � � � � � � � � � � � � � � � � � � � � � � � � � � � � � � � � � � � � � � � � � � � � � �184
ACT � � � � � � � � � � � � � � � � � � � � � � � � � � � � � � � � � � � � � � � � � � � � � � � � � � � � � � � � � � � � � � � � � �190ACT Score Comparisons for English, Mathematics, Reading, and Science for Iowa and the Nation � � � � � � � � � � � � � � � � � � � � � � � � � � � � � � � � � � � � � � � � � � � � � � � � � � � � � � � � � � � � � � � � � � 192ACT Scores for Core and Less-than-Core Students � � � � � � � � � � � � � � � � � � � � � � � � � � � � � � �193ACT Composite Score Distributions � � � � � � � � � � � � � � � � � � � � � � � � � � � � � � � � � � � � � � � � � � �196ACT Scores by Enrollment Category � � � � � � � � � � � � � � � � � � � � � � � � � � � � � � � � � � � � � � � � � �198ACT Scores by Gender � � � � � � � � � � � � � � � � � � � � � � � � � � � � � � � � � � � � � � � � � � � � � � � � � � � � � �201ACT Composite Scores by Student Planned Educational Majors � � � � � � � � � � � � � � � � � � � �202
SAT � � � � � � � � � � � � � � � � � � � � � � � � � � � � � � � � � � � � � � � � � � � � � � � � � � � � � � � � � � � � � � � � � � �203Advanced Placement (AP) � � � � � � � � � � � � � � � � � � � � � � � � � � � � � � � � � � � � � � � �209Pursuit of Postsecondary Education/Training � � � � � � � � � � � � � � � � � � �213Dropouts � � � � � � � � � � � � � � � � � � � � � � � � � � � � � � � � � � � � � � � � � � � � � � � � � � � � � � � � � � � �217High School Graduates and Graduation Rates � � � � � � � � � � � � � � � � � �222
High School Graduates � � � � � � � � � � � � � � � � � � � � � � � � � � � � � � � � � � � � � � � � � � � � � � � � � � � � �222High School Graduation Rates � � � � � � � � � � � � � � � � � � � � � � � � � � � � � � � � � � � � � � � � � � � � � � �223
Suspensions and Expulsions � � � � � � � � � � � � � � � � � � � � � � � � � � � � � � � � � � � � � � �228Evaluating School Performance in the Context of Academic Challenge � � � � � � � � � � � � � � � � � � � � � � � � � � � � � � � � � � � � � � � � � � � � � � � � � � � � � � � � � � �236
Special Education � � � � � � � � � � � � � � � � � � � � � � � � � � � � � � � � � � � � � � � � � � � � � � � � � � � � � � � � � � � � � � � 244Context of Special Education in Iowa � � � � � � � � � � � � � � � � � � � � � � � � � � � �244
Identification Rates � � � � � � � � � � � � � � � � � � � � � � � � � � � � � � � � � � � � � � � � � � � � � � � � � � � � � � � �244Placement � � � � � � � � � � � � � � � � � � � � � � � � � � � � � � � � � � � � � � � � � � � � � � � � � � � � � � � � � � � � � � � 245Disproportionality � � � � � � � � � � � � � � � � � � � � � � � � � � � � � � � � � � � � � � � � � � � � � � � � � � � � � � � � �247
Are Students Coming to School Ready to Learn? � � � � � � � � � � � � � � �248Dynamic Indicators of Basic Early Literacy Skills (DIBELS) � � � � � � � � � � � � � � � � � � � � � � � � �248
Are Students Going to School in Safe and Caring Environments? � � � � � � � � � � � � � � � � � � � � � � � � � � � � � � � � � � � � � � � � � � � � �249
Positive Behavioral Interventions and Supports (PBIS) � � � � � � � � � � � � � � � � � � � � � � � � � � �249Discipline � � � � � � � � � � � � � � � � � � � � � � � � � � � � � � � � � � � � � � � � � � � � � � � � � � � � � � � � � � � � � � � � 249
Are Students Achieving at High Levels? � � � � � � � � � � � � � � � � � � � � � � � � �251National Assessment of Educational Progress (NAEP) � � � � � � � � � � � � � � � � � � � � � � � � � � �251Iowa Assessments � � � � � � � � � � � � � � � � � � � � � � � � � � � � � � � � � � � � � � � � � � � � � � � � � � � � � � � � �253
Are Students Leaving School Ready for Life? � � � � � � � � � � � � � � � � � � � �256Graduation Rates � � � � � � � � � � � � � � � � � � � � � � � � � � � � � � � � � � � � � � � � � � � � � � � � � � � � � � � � � � � 256
Contents xi

Finance� � � � � � � � � � � � � � � � � � � � � � � � � � � � � � � � � � � � � � � � � � � � � � � � � � � � � � � � � � � � � � � � � � � � � � � � � � � � � 258Function Category Expenditures � � � � � � � � � � � � � � � � � � � � � � � � � � � � � � � � � �258Object Category Expenditures � � � � � � � � � � � � � � � � � � � � � � � � � � � � � � � � � � � �259Revenues � � � � � � � � � � � � � � � � � � � � � � � � � � � � � � � � � � � � � � � � � � � � � � � � � � � � � � � � � � � �261Taxable Valuation � � � � � � � � � � � � � � � � � � � � � � � � � � � � � � � � � � � � � � � � � � � � � � � � � �264Expenditures Per Pupil � � � � � � � � � � � � � � � � � � � � � � � � � � � � � � � � � � � � � � � � � � � � �267State Aid � � � � � � � � � � � � � � � � � � � � � � � � � � � � � � � � � � � � � � � � � � � � � � � � � � � � � � � � � � � �270Property Taxes � � � � � � � � � � � � � � � � � � � � � � � � � � � � � � � � � � � � � � � � � � � � � � � � � � � � � �271Income Surtaxes � � � � � � � � � � � � � � � � � � � � � � � � � � � � � � � � � � � � � � � � � � � � � � � � � � � �275Instructional Support � � � � � � � � � � � � � � � � � � � � � � � � � � � � � � � � � � � � � � � � � � � � � �276Budget Adjustment � � � � � � � � � � � � � � � � � � � � � � � � � � � � � � � � � � � � � � � � � � � � � � � �279Bond Elections � � � � � � � � � � � � � � � � � � � � � � � � � � � � � � � � � � � � � � � � � � � � � � � � � � � � � �281Physical Plant and Equipment Elections � � � � � � � � � � � � � � � � � � � � � � � � �281Secure an Advanced Vision for Education (SAVE)--Formerly Known as Local Option Sales and Services Tax for School Infrastructure � � � � � � � � � � � � � � � � � � � � � � � � � � � � � � � � � � � � � � � � � � � � � � � � � � � � � � �282Total Elementary and Secondary Education Budgets� � � � � � � � � � �284
The Annual Condition of Education Report 2013xii

EnrollmentThe public and nonpublic enrollment trends in Iowa, by district size and area education agency (AEA) are presented in this chapter. Data on student characteristics such as race/ethnicity, English language learner (ELL), percent of students eligible for free or reduced price lunch, special education enrollment, and mi-grant enrollment are included in this chapter. Data from this chapter comes from the Basic Educational Data Survey (BEDS), certified enrollment, Student Reporting in Iowa (SRI, formerly known as EASIER), and Iowa special education records.
Certified enrollment counts are used for the Iowa School Finance Formula calculation, and include resident students, supplemental weightings for sharing programs, weighting for ELL students, nonpublic school assistance, and dual enrollments. Enrollment data by grade and race/ethnicity comes from BEDS and is calculated by the attending district.
Enrollment in 2012-2013 increased after a 14-year decline since 1997-1998. The public school enrollment projection shows an enrollment increase in the next five years, while the nonpublic school enrollment trend remained the same (Figure 1-1). More than two-thirds of Iowa public school districts in 2000-2001 had district enrollments less than 1,000 and these districts served about 28 percent of K-12 students. Over two-thirds of the districts in 2012-2013 had less than 1,000 students and served 26 percent of K-12 public school students (Table 1-3). There are nine AEAs in Iowa that serve students. The largest is Heartland AEA which serves 26.8 percent of Iowa students (Table 1-4).
The Open Enrollment Act (Iowa Code 282.18) of 1989-1990 states, “It’s the goal of the general assembly to permit a wide range of educational choices for children enrolled in schools in this state and to maximize ability to use those choices…,[To] maximize parental choices and access to educational opportunities that are not available to children because of where they live.” The number and percent of students taking ad-vantage of the Open Enrollment Act continues to increase (Table 1-5). The smallest and largest enrollment categories in 2012-2013 had more students open-enrolling out than open-enrolling in. The 1,000-2,499 enrollment category gained the most students from the open enrollment legislation (Table 1-6).
Children from families with incomes at or below 130 percent of the poverty level are eligible for free lunch and children from families with incomes between 130 percent and 185 percent of the poverty level are eligible for reduced lunch, according to the National School Lunch Program. In 2012-2013, the percent of students eligible for free or reduced lunch continued to increase (Figure 1-2). Districts in the largest and smallest enrollment categories had the highest percentage of students eligible for free or reduced price lunch (Table 1-7).
Children requiring special education are “Persons under 21 years of age, including children under five years of age, who have a disability in obtaining an education because of a head injury, autism, behavior disorder, or physical, mental, communication, or learning disability, as defined by the rules of the depart-ment of education” (Iowa Code 256.2). The special education students in Iowa public schools accounted for 13 percent of the total certified enrollment for each year before and the percent reduced to 12.1 in 2012-2013 (Table 1-8).
The percent of minority students in public and nonpublic schools continued to increase in 2012-2013 (Table 1-9, Table 1-10, and Figure 1-3). The largest enrollment category had the highest percent of minority students while the two smallest enrollment categories had the lowest percent of minority students (Table 1-11). The percent of English Language Learner (ELL) students in public and nonpublic schools increased in 2012-2013 (Figure 1-4). The majority of ELL students spoke Spanish in all three years presented (Table 1-12). An ELL student is eligible for 0.22 weighted funding for four years. Districts with more students had more weighted ELL students in all years presented in Table 1-13.
Enrollment 1

The U.S. Department of Education defines a “migratory child” as a child who is (or whose parent or spouse is) a migratory agricultural worker or migratory fisher. A migratory agricultural worker or migratory fisher is one who has moved from one school district to another in the preceding 36 months in order to obtain temporary or seasonal employment in agricultural or fishing work. Migrant student data collected by the Iowa Department of Education includes migrant students in federally funded and non-federally funded programs. The percent of migrant students decreased slightly in 2012-2013 (Table 1-14).
The Annual Condition of Education Report 20132

Enrollment TrendsFigure 1-1t
Iowa’s Public and Nonpublic School K-12 Enrollments 1972-1973, 1988-1989, 1993-1994, 1998-1999, 2003-2004 to 2012-2013 and
Projected Enrollments 2013-2014 to 2017-2018
-
100,000
200,000
300,000
400,000
500,000
600,000
700,000
800,000
Enro
llmen
t
School Year
Total Public Nonpublic
Source: Iowa Department of Education, Bureau of Information and Analysis.
Enrollment 3

Projected EnrollmentTable 1-1
Iowa’s Public School K-12 Enrollments 2011-2012 to 2012-2013 and Projected Enrollments 2013-2014 to 2017-2018 by Grade
Source: Iowa Department of Education, Bureau of Information and Analysis.Notes: PKIEP: prekindergarten individualized education programs. Figures may not total due to rounding.
Enrollment Projected EnrollmentGrade 2011-
20122012-2013
2013-2014
2014-2015
2015-2016
2016-2017
2017-2018
K 39,877 40,908 40,302 39,717 38,773 38,190 38,0871 35,960 36,878 37,301 36,748 36,214 35,353 34,8222 35,541 36,035 36,889 37,311 36,758 36,224 35,3633 35,508 35,609 36,178 37,035 37,459 36,904 36,3684 35,127 35,644 35,696 36,266 37,125 37,550 36,9945 35,302 35,296 35,772 35,824 36,397 37,259 37,6866 35,705 35,637 35,499 35,978 36,031 36,606 37,4747 35,670 36,213 36,126 35,986 36,472 36,525 37,1098 35,730 35,859 36,367 36,279 36,138 36,626 36,6809 36,929 36,946 37,183 37,711 37,619 37,473 37,979
10 36,518 36,417 36,306 36,540 37,058 36,968 36,82511 35,637 35,722 35,431 35,323 35,550 36,054 35,96712 37,076 36,451 36,466 36,168 36,058 36,290 36,804
PKIEP 2,923 2,631 2,617 2,573 2,532 2,485 2,439State 473,504 476,245 478,130 479,458 480,183 480,509 480,596
The Annual Condition of Education Report 20134
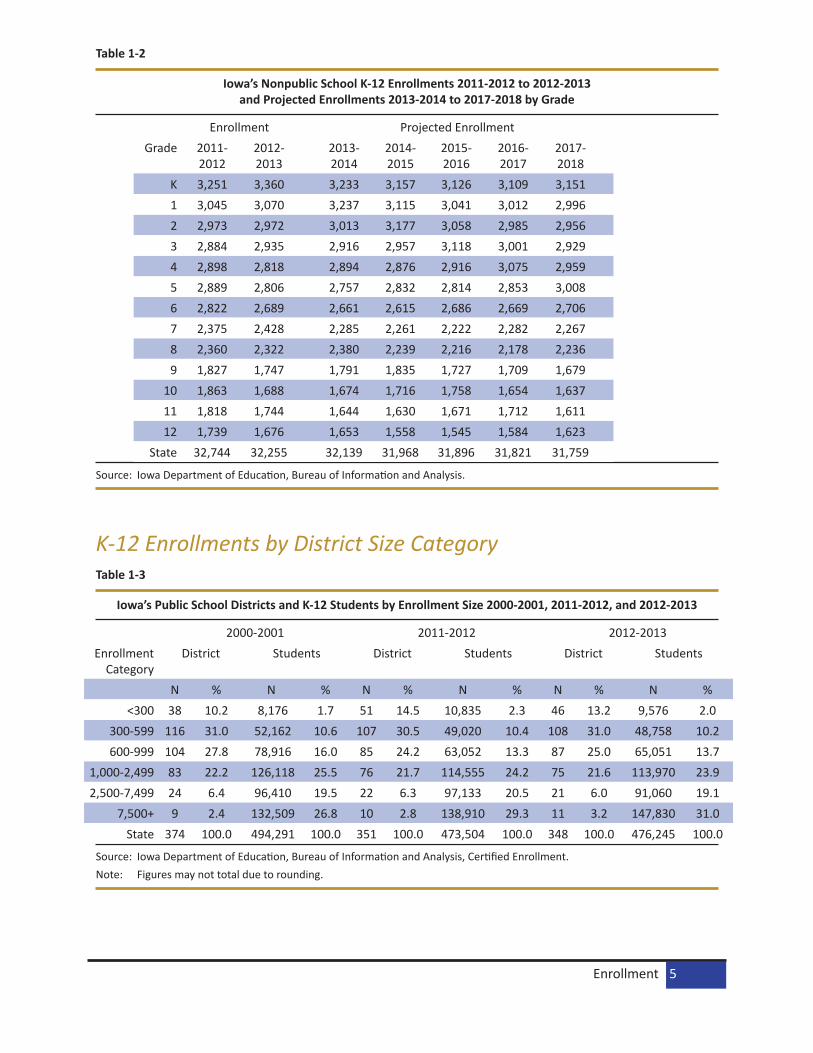
Table 1-2
Iowa’s Nonpublic School K-12 Enrollments 2011-2012 to 2012-2013 and Projected Enrollments 2013-2014 to 2017-2018 by Grade
Source: Iowa Department of Education, Bureau of Information and Analysis.
K-12 Enrollments by District Size CategoryTable 1-3
Iowa’s Public School Districts and K-12 Students by Enrollment Size 2000-2001, 2011-2012, and 2012-2013
Source: Iowa Department of Education, Bureau of Information and Analysis, Certified Enrollment.Note: Figures may not total due to rounding.
Enrollment Projected EnrollmentGrade 2011-
20122012-2013
2013-2014
2014-2015
2015-2016
2016-2017
2017-2018
K 3,251 3,360 3,233 3,157 3,126 3,109 3,1511 3,045 3,070 3,237 3,115 3,041 3,012 2,9962 2,973 2,972 3,013 3,177 3,058 2,985 2,9563 2,884 2,935 2,916 2,957 3,118 3,001 2,9294 2,898 2,818 2,894 2,876 2,916 3,075 2,9595 2,889 2,806 2,757 2,832 2,814 2,853 3,0086 2,822 2,689 2,661 2,615 2,686 2,669 2,7067 2,375 2,428 2,285 2,261 2,222 2,282 2,2678 2,360 2,322 2,380 2,239 2,216 2,178 2,2369 1,827 1,747 1,791 1,835 1,727 1,709 1,679
10 1,863 1,688 1,674 1,716 1,758 1,654 1,63711 1,818 1,744 1,644 1,630 1,671 1,712 1,61112 1,739 1,676 1,653 1,558 1,545 1,584 1,623
State 32,744 32,255 32,139 31,968 31,896 31,821 31,759
2000-2001 2011-2012 2012-2013Enrollment
CategoryDistrict Students District Students District Students
N % N % N % N % N % N %<300 38 10.2 8,176 1.7 51 14.5 10,835 2.3 46 13.2 9,576 2.0
300-599 116 31.0 52,162 10.6 107 30.5 49,020 10.4 108 31.0 48,758 10.2600-999 104 27.8 78,916 16.0 85 24.2 63,052 13.3 87 25.0 65,051 13.7
1,000-2,499 83 22.2 126,118 25.5 76 21.7 114,555 24.2 75 21.6 113,970 23.92,500-7,499 24 6.4 96,410 19.5 22 6.3 97,133 20.5 21 6.0 91,060 19.1
7,500+ 9 2.4 132,509 26.8 10 2.8 138,910 29.3 11 3.2 147,830 31.0State 374 100.0 494,291 100.0 351 100.0 473,504 100.0 348 100.0 476,245 100.0
Enrollment 5

Enrollment in Iowa’s Area Education Agencies (AEAs)Table 1-4
Total Iowa Public and Nonpublic K-12 Students by AEA 2012-2013
Source: Iowa Department of Education, Bureau of Information and Analysis, Basic Educational Data Survey and SRI.Note: Figures may not total due to rounding.
Open EnrollmentTable 1-5
Number and Percent of Public School K-12 Open Enrolled Out Students 1990-1991, 1995-1996, 2000-2001, 2003-2004 to 2012-2013
Source: Iowa Department of Education, Bureau of Information and Analysis, Certified Enrollment and SRI.
Public Schools Nonpublic Schools TotalAEA Enrollment Percent Enrollment Percent Enrollment Percent
Keystone 1 29,300 6.2 4,485 13.9 33,785 6.6AEA 267 62,643 13.2 3,104 9.6 65,747 12.9
Prairie Lakes 8 29,923 6.3 2,226 6.9 32,149 6.3Mississippi Bend 9 47,272 9.9 3,001 9.3 50,273 9.9
Grant Wood 10 66,663 14.0 4,432 13.7 71,095 14.0Heartland 11 128,033 26.9 8,007 24.8 136,040 26.8
Northwest 12 38,261 8.0 4,881 15.1 43,142 8.5Green Hills 13 38,435 8.1 1,079 3.3 39,514 7.8
Great Prairie 15 35,716 7.5 1,040 3.2 36,756 7.2State 476,245 100.0 32,255 100.0 508,500 100.0
% Open Enrolled Out # Open Enrolled Out Certified Enrollment1990-1991 0.6 2,757 483,399
1995-1996 2.5 12,502 504,505
2000-2001 3.8 18,554 494,291
2003-2004 4.5 21,605 485,011 2004-2005 4.6 22,085 483,335 2005-2006 4.8 23,155 483,105 2006-2007 5.0 24,251 482,584 2007-2008 5.2 24,882 480,609 2008-2009 5.1 24,411 477,019 2009-2010 5.2 24,884 474,227 2010-2011 5.5 25,831 473,493 2011-2012 5.6 26,743 473,504 2012-2013 5.8 27,651 476,245
The Annual Condition of Education Report 20136

Table 1-6
Open Enrollment in Iowa’s Public Schools by Enrollment Size 2000-2001, 2011-2012, and 2012-2013
Source: Iowa Department of Education, Bureau of Information and Analysis, Certified Enrollment and SRI.Notes: wt indicates with. Figures may not total due to rounding.
Enrollment Category
<300 300-599 600-999 1,000-2,499 2,500-7,499
7,500+ State
2000-2001 Total # Districts 38 116 104 83 24 9 374
# Students 8,176 52,162 78,916 126,118 96,410 132,509 494,291
# Students Open in 398 3,366.6 4,177.9 5,295.4 3,571.6 1,625.4 18,434.9
# Students Open out 1,036.2 3,499.3 3,742.3 3,955.6 3,141.0 3,179.5 18,553.9
Net Gains/Losses -638.2 -132.7 435.6 1,339.8 430.6 -1,554.1
# Districts wt Gains 6 47 49 53 13 0 168
# Districts wt Losses 30 65 54 30 11 9 199
# Districts wt no gain/loss 2 4 1 0 0 0 7
2011-2012 Total # Districts 51 107 85 76 22 10 351
# Students 10,835 49,020 63,052 114,555 97,133 138,910 473,504
# Students Open in 1,013 5,145.7 4,994.7 7,742.1 5,338.9 2,178 26,412.4
# Students Open out 2,010.8 4,538 4,496.8 5,205.6 4,992.2 5,499.1 26,742.5
Net Gains/Losses -997.8 607.7 497.9 2536.5 346.7 -3,321.1
# Districts wt Gains 11 48 44 45 11 1 160
# Districts wt Losses 40 58 41 31 11 9 190
# Districts wt no gain/loss 0 1 0 0 0 0 1
2012-2013 Total # Districts 46 108 87 75 21 11 348
# Students 9,575.7 48,757.9 65,051.0 113,970.5 91,060.1 147,829.8 476,245.0
# Students Open in 876.5 5,828.3 5,348.6 7,821.1 5,344.9 2,431.9 27,651.3
# Students Open out 1,936.9 4,923.4 4,550.9 5,377.4 4,712.4 6,150.3 27,651.3
Net Gains/Losses -1,060.4 904.9 797.7 2,443.7 632.5 -3,718.4 0.0
# Districts wt Gains 7 50 45 45 12 0 159
# Districts wt Losses 37 58 41 30 9 11 186
# Districts wt no gain/loss 2 0 1 0 0 0 3
Enrollment 7

Subgroup EnrollmentsStudents Eligible for Free or Reduced Price LunchFigure 1-2
Percent of Public School K-12 Students Eligible for Free or Reduced Price Meals 2000-2001, 2003-2004 to 2012-2013
27.0%30.0% 31.1% 32.1% 32.2% 33.6% 34.5%
37.4%38.9% 40.1% 41.0%
19.2%22.3% 23.3% 24.4% 24.4% 25.8% 26.3%
29.1%30.9%
32.6%34.2%
7.8% 7.7% 8.2% 8.2% 7.8% 7.9% 8.3% 8.4% 8.1% 7.5% 6.8%
0%
10%
20%
30%
40%
50%
2000-2001 2003-2004 2004-2005 2005-2006 2006-2007 2007-2008 2008-2009 2009-2010 2010-2011 2011-2012 2012-2013
Perc
ent
School Year
Free/Reduced Free Reduced
Source: Iowa Department of Education, Bureau of Information and Analysis, Basic Educational Data Survey and SRI.
Table 1-7
K-12 Public School Students Eligible for Free or Reduced Price Lunch by Enrollment Category 2000-2001, 2011-2012, and 2012-2013
Source: Iowa Department of Education, Bureau of Information and Analysis, Basic Educational Data Survey and SRI.
2000-2001 2011-2012 2012-2013Enrollment
CategoryK-12
Enrollment # Free/
Reduced Eligible
% Free/Reduced Eligible
K-12 Enrollment
# Free/Reduced Eligible
% Free/Reduced Eligible
K-12 Enrollment
# Free/Reduced Eligible
% Free/Reduced Eligible
<300 6,711 2,256 33.6 9,019 4,036 44.7 7,747 3,438 44.4300-599 50,933 13,511 26.5 49,230 17,560 35.7 49,449 17,742 35.9600-999 77,327 17,966 23.2 63,453 22,350 35.2 65,730 24,025 36.6
1,000-2,499 122,830 29,876 24.3 116,159 42,786 36.8 115,555 43,303 37.52,500-7,499 93,322 21,433 23.0 96,812 32,684 33.8 91,180 33,435 36.7
7,500+ 125,804 43,874 34.9 134,426 68,627 51.1 142,947 71,917 50.3State 476,927 128,916 27.0 469,099 188,043 40.1 472,608 193,860 41.0
The Annual Condition of Education Report 20138

Special Education EnrollmentTable 1-8
Iowa’s Public School Special Education Enrollment 2000-2001, 2003-2004 to 2012-2013
Sources: Iowa Department of Education, Bureau of Information and Analysis, Certified Enrollment files and Division of Learning and Results, Bureau of Learner Strategies and Supports, December 1 Special Education files.
Enrollment by Race and EthnicityTable 1-9
Iowa’s Public School K-12 Enrollments by Race/Ethnicity 2000-2001, 2011-2012, and 2012-2013
Source: Iowa Department of Education, Bureau of Information and Analysis, Basic Educational Data Survey and SRI.
School Year Percent Special Education Students Number Special Education Students Certified Enrollment2000-2001 12.8 63,392 494,291
2003-2004 13.4 65,027 485,0112004-2005 13.5 65,065 483,3352005-2006 13.3 64,350 483,1052006-2007 13.1 63,411 482,584
2007-2008 12.9 61,859 480,6092008-2009 12.7 60,581 477,0192009-2010 12.6 59,967 474,2272010-2011 12.7 60,223 473,4932011-2012 12.5 59,104 473,5042012-2013 12.1 57,494 476,245
2000-2001 2011-2012 2012-2013Race/Ethnicity Group N % N % N %
All Minority 46,250 9.7 90,673 19.3 95,370 20.2
African American 18,510 3.9 24,189 5.2 24,621 5.2American Indian 2,447 0.5 2,155 .5 2,034 0.4
Asian 8,274 1.7 9,817 2.1 10,229 2.2Native Hawaiian/Pacific Islander - - 725 .2 806 0.2
Two or More Races - - 12,206 2.6 13,701 2.9Hispanic 17,019 3.6 41,581 8.9 43,979 9.3
White 430,677 90.3 378,426 80.7 377,238 79.8Total 476,927 100.0 469,099 100.0 472,608 100.0
Enrollment 9

Table 1-10
Iowa’s Nonpublic K-12 Enrollments by Race/Ethnicity 2000-2001, 2011-2012, and 2012-2013
Source: Iowa Department of Education, Bureau of Information and Analysis, Basic Educational Data Survey and SRI.
Figure 1-3
Iowa’s Public and Nonpublic Minority Enrollment as a Percentage of Total K-12 Enrollment 2000-2001, 2005-2006 to 2012-2013
9.7%
13.4% 14.0% 14.8% 15.4%
17.6%18.5% 19.3%
20.2%
9.3%
12.9% 13.5% 14.3% 14.9%
17.1% 17.9%18.9% 19.7%
4.7%6.5% 7.0% 7.6% 8.4%
10.2% 10.7% 11.4%12.4%
0%
5%
10%
15%
20%
25%
2000-2001 2005-2006 2006-2007 2007-2008 2008-2009 2009-2010 2010-2011 2011-2012 2012-2013
Perc
ent
School Year
Public Public and Nonpublic Nonpublic
Source: Iowa Department of Education, Bureau of Information and Analysis, Basic Educational Data Survey and SRI.
2000-2001 2011-2012 2012-2013Race/Ethnicity Group N % N % N %
All Minority 1,946 4.7 3,729 11.4 3,989 12.4
African American 492 1.2 588 1.8 574 1.8American Indian 70 0.2 61 0.2 53 0.2
Asian 563 1.4 760 2.3 824 2.6Native Hawaiian/Pacific Islander - - 80 0.2 87 0.3
Two or More Races - - 548 1.7 466 1.5Hispanic 821 2.0 1,692 5.2 1,985 6.2
White 39,118 95.3 29,015 88.6 28,266 87.6Total 41,064 100.0 32,744 100.0 32,255 100.0
The Annual Condition of Education Report 201310
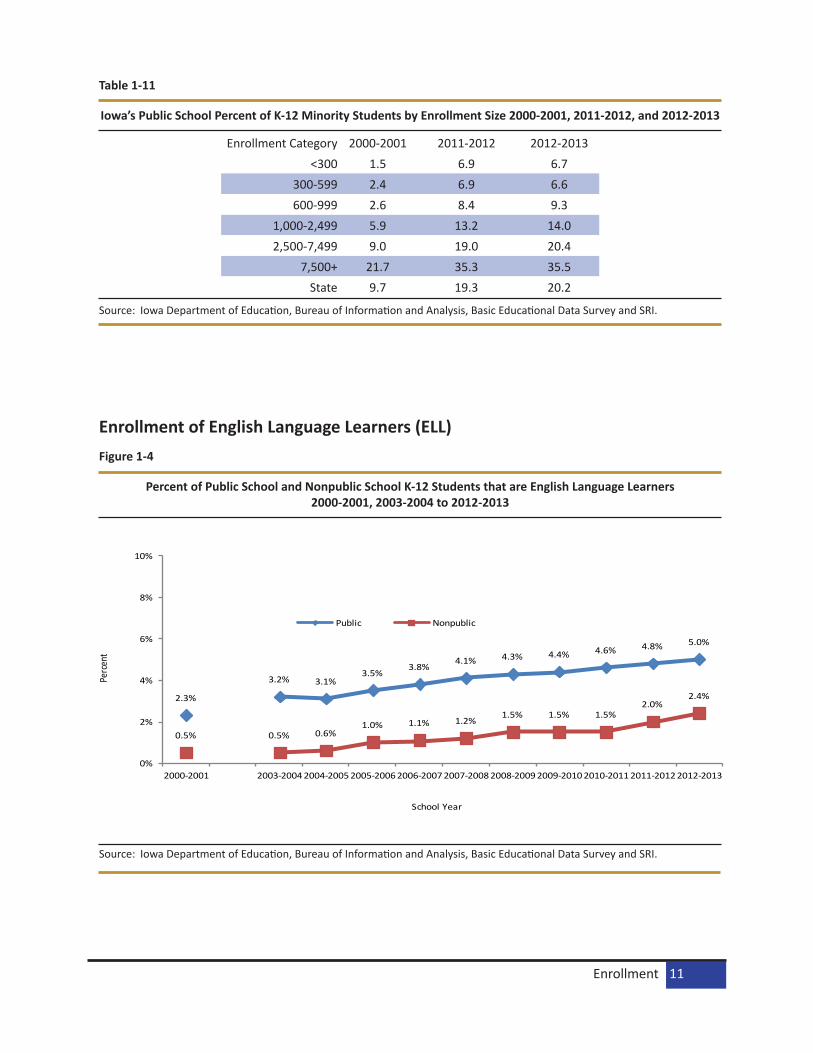
Table 1-11
Iowa’s Public School Percent of K-12 Minority Students by Enrollment Size 2000-2001, 2011-2012, and 2012-2013
Source: Iowa Department of Education, Bureau of Information and Analysis, Basic Educational Data Survey and SRI.
Enrollment of English Language Learners (ELL)Figure 1-4
Percent of Public School and Nonpublic School K-12 Students that are English Language Learners 2000-2001, 2003-2004 to 2012-2013
2.3%
3.2% 3.1%3.5%
3.8%4.1% 4.3% 4.4% 4.6% 4.8% 5.0%
0.5% 0.5% 0.6%1.0% 1.1% 1.2%
1.5% 1.5% 1.5%2.0%
2.4%
0%
2%
4%
6%
8%
10%
2000-2001 2003-2004 2004-2005 2005-2006 2006-2007 2007-2008 2008-2009 2009-2010 2010-2011 2011-2012 2012-2013
Perc
ent
School Year
Public Nonpublic
Source: Iowa Department of Education, Bureau of Information and Analysis, Basic Educational Data Survey and SRI.
Enrollment Category 2000-2001 2011-2012 2012-2013<300 1.5 6.9 6.7
300-599 2.4 6.9 6.6600-999 2.6 8.4 9.3
1,000-2,499 5.9 13.2 14.02,500-7,499 9.0 19.0 20.4
7,500+ 21.7 35.3 35.5State 9.7 19.3 20.2
Enrollment 11

Table 1-12
Iowa’s Public and Nonpublic K-12 English Language Learners’ Primary Language 2000-2001, 2011-2012, and 2012-2013
Note: Languages with less than 50 students are included in Other.Source: Iowa Department of Education, Bureau of Information and Analysis, Basic Educational Data Survey and SRI.
Language 2000-2001 2011-2012 2012-2013Spanish; Castilian 7,014 16,171 16,968
Vietnamese 766 897 921Bosnian 363 807 748
Karen languages 428 577Arabic 81 472 534
Chinese 80 301 348Lao 409 333 312
Swahili 202 234Somali 190 230
Russian 65 211 197Marshallese 149 166
German 153 146 148Hmong 103 138
Rundi 136 133Burmese 85 130
Korean 76 114 128Nepali 95 122Dinka 106 120
Creole/Pidgins, English based 109 120Germanic (Other) 113
Nilo Sahara 104 86French 71 84
Tagalog 67 76Pohnpeian 72 63
Telugu 62Ukranian 57 59
Hindi 57Chuukese 51
Urdu 56 50Serbian;Srpski 434
Serbo-Croation 556Thai Dam 142
Cambodian 101Other 1,024 1,568 1,581Total 11,264 23,050 24,556
The Annual Condition of Education Report 201312

Table 1-13
Iowa’s Public School K-12 Weighted English Language Learners by Enrollment Size 2000-2001, 2011-2012, and 2012-2013
Source: Iowa Department of Education, Bureau of Information and Analysis, Certified Enrollment and SRI.Note: Figures may not total due to rounding.
Migrant Student EnrollmentTable 1-14
Percent of Public School K-12 Migrant Enrollment 2004-2005 to 2012-2013
Source: Iowa Department of Education, Bureau of Information and Analysis, BEDS and SRI.
2000-2001 2011-2012 2012-2013Enrollment
CategoryK-12
Enrollment #
Weighted ELL
K-12 Enrollment
# Weighted
ELL
K-12 Enrollment
# Weighted
ELL<300 8,176 23 10,835 48 9,576 59
300-599 52,162 237 49,020 371 48,758 254600-999 78,916 530 63,052 871 65,051 1,196
1,000-2,499 126,118 1,848 114,555 3,154 113,971 3,3662,500-7,499 96,410 1,348 97,133 2,740 91,060 2,568
7,500+ 132,509 4,165 138,910 7,348 147,830 7,975State 494,291 8,151 473,504 14,532 476,245 15,418
% Migrant Students # Migrant Students K-12 Enrollment2004-2005 0.8 3,615 472,2112005-2006 0.7 3,248 476,6562006-2007 0.6 2,931 474,8672007-2008 0.5 2,362 472,6282008-2009 0.4 1,662 470,5372009-2010 0.3 1,393 468,6732010-2011 0.3 1,439 468,6892011-2012 0.3 1,534 469,0992012-2013 0.2 1,113 472,608
Enrollment 13

The Annual Condition of Education Report 201314

Early Childhood EducationData on Early Childhood Education are reported by school districts through the Basic Educational Data Sur-vey (BEDS) forms and the Student Reporting in Iowa (SRI, formerly EASIER) student level data collection. This chapter describes preschool and kindergarten programs in 2012-2013 and previous school years.
Preschool ProgramsPreschool EnrollmentDistricts throughout the state offer preschool to three- and four-year-old children. Table 2-1 shows the number of districts that offered preschool the past five years and Table 2-2 shows the public school preschool enrollment by enrollment category for the past two years. The number of districts offering pre-school has increased since 2008-2009. Table 2-3 shows the breakdown of preschool students by subgroup for the past two years. The breakdown was about the same for both years.
Early Childhood Education 15

Table 2-1
Iowa Public School Districts Offering Preschool by Enrollment Category 2008-2009 to 2012-2013
Source: Iowa Department of Education, Bureau of Information and Analysis, SRI files.
Enrollment Category Total Districts Districts Offering Preschool Percent of Districts Offering Preschool
2008-2009
<300 54 38 70.4
300-599 111 87 78.4
600-999 87 70 80.5
1,000-2,499 78 76 97.4
2,500-7,499 22 21 95.5
7,500+ 10 10 100.0
State 362 302 83.4
2009-2010
<300 55 44 80.0
300-599 111 99 89.2
600-999 87 76 87.4
1,000-2,499 76 75 98.7
2,500-7,499 22 22 100.0
7,500+ 10 10 100.0
State 361 326 90.3
2010-2011
<300 53 48 90.6
300-599 116 111 95.7
600-999 80 77 96.3
1,000-2,499 78 78 100.0
2,500-7,499 22 22 100.0
7,500+ 10 10 100.0
State 359 346 96.4
2011-2012
<300 51 46 90.2
300-599 107 101 94.4
600-999 85 82 96.5
1,000-2,499 76 76 100.0
2,500-7,499 22 22 100.0
7,500+ 10 10 100.0
State 351 337 96.0
2012-2013
<300 46 38 82.6
300-599 108 101 93.5
600-999 87 85 97.7
1,000-2,499 75 75 100.0
2,500-7,499 21 21 100.0
7,500+ 11 11 100.0
State 348 331 95.1
The Annual Condition of Education Report 201316

Table 2-2
Iowa Public School Preschool Enrollment by Enrollment Category 2011-2012 and 2012-2013
Source: Iowa Department of Education, Bureau of Information and Analysis, SRI files.
Table 2-3
Iowa Public School Preschool Students by Subgroup 2011-2012 and 2012-2013
2011-2012 2012-2013Subgroup N % N %
All Minority 5,385 19.3 5,701 20.6
African American 1,255 4.5 1,275 4.6American Indian 93 0.3 94 0.3
Asian 442 1.6 536 1.9Native Hawaiian/Pacific Islander 34 0.1 42 0.2
Two or More Races 841 3.0 949 3.4Hispanic 2,720 9.8 2,805 10.1
White 22,495 80.7 22,033 79.4ELL 152 0.5 35 0.1
Eligible for Free/Reduced Price Lunch 7,647 27.4 7,687 27.7Male 14,794 53.1 14,498 52.3
Female 13,086 46.9 13,236 47.7Total 27,880 100.0 27,734 100.0
Source: Iowa Department of Education, Bureau of Information and Analysis, SRI files.
Enrollment Category N % N %2011-2012 2012-2013
<300 934 3.4 668 3.4300-599 3,688 13.2 3,527 13.2600-999 3,917 14.0 3,949 14.0
1,000-2,499 7,096 25.5 6,933 25.52,500-7,499 4,887 17.5 4,847 17.5
7,500+ 7,358 26.4 7,810 26.4State 27,880 100.0 27,734 100.0
Early Childhood Education 17

Statewide Voluntary Preschool Program for Four-Year-Old ChildrenThe Statewide Voluntary Preschool Program (SWVPP) for Four-Year-Old Children was established May 10, 2007, with signing of House File (HF) 877. The SWVPP legislation provides an opportunity for all four-year-old children in Iowa to enter school ready to learn by expanding access to research-based preschool curricula and early childhood licensed teaching staff. The allocation of funds for the SWVPP is to improve access to high quality early childhood education through predictable, equitable and sustainable funding to increase the number of children participating in quality programs.
Table 2-4 shows the number of districts that have participated in the SWVPP since 2007-2008. The same table and Figure 2-1 represents the number of four-year-old children funded from 2007-2008 to 2012-2013. Numbers of students served in Table 2-4 include the children who are younger or older (ages 3 and 5) who participate in the quality preschool program (see the last row in Table 2-4).
The Annual Condition of Education Report 201318

Table 2-4
Statewide Voluntary Preschool Program Data, 2007-2008 to 2012-2013
Source: Iowa Department of Education, Statewide Voluntary Preschool Program Application Data.
Figure 2-1
Statewide Voluntary Preschool Program Funded Enrollment Count 2007-2008 to 2012-2013
5,126
9,676
13,666
19,799 19,90021,429
0
5,000
10,000
15,000
20,000
25,000
2007-2008 2008-2009 2009-2010 2010-2011 2011-2012 2012-2013
Num
ber o
f Fou
r-Ye
ar-O
ldCh
ildre
n En
rolle
d
School Year
.
Source: Iowa Department of Education, Bureau of Information and Analysis, SRI, fall files.
The number of SWVPP students by age and Individualized Education Plan (IEP) status is shown in Table 2-5. Instruc-tional IEPs and support-only IEPs are listed separately since they have different funding sources. The number of students receiving special education services (IEP) in SWVPP decreased between 2011-2012 and 2012-2013. Each year of data provided in Tables 2-5 and 2-6 represents an independent cohort of students; however, some children may have participated in the SWVPP both years based on a child’s IEP. Table 2-6 indicates the number of four-year-old children served in the SWVPP by race/ethnicity, gender, and free/reduced price meals. Free/Reduced meals data may be underreported since the SWVPP is only required to meet ten hours per week and preschool students may not receive meals. The numbers of three-year-old children and five-year-old children served in SWVPP decreased between 2011-2012 and 2012-2013 while the number of four-year-old children served in SWVPP increased between the two years. Overall, the numbers of students funded and served in SWVPP increased in 2012-2013.
2007-2008 2008-2009 2009-2010 2010-2011 2011-2012 2012-2013Number Districts
Participated67 119 175 325 317 314
Number of Students Funded
5,126 9,676 13,666 19,799 19,900 21,429
Number of Students Served
5,126 9,769 14,386 24,166 23,163 23,617
Early Childhood Education 19
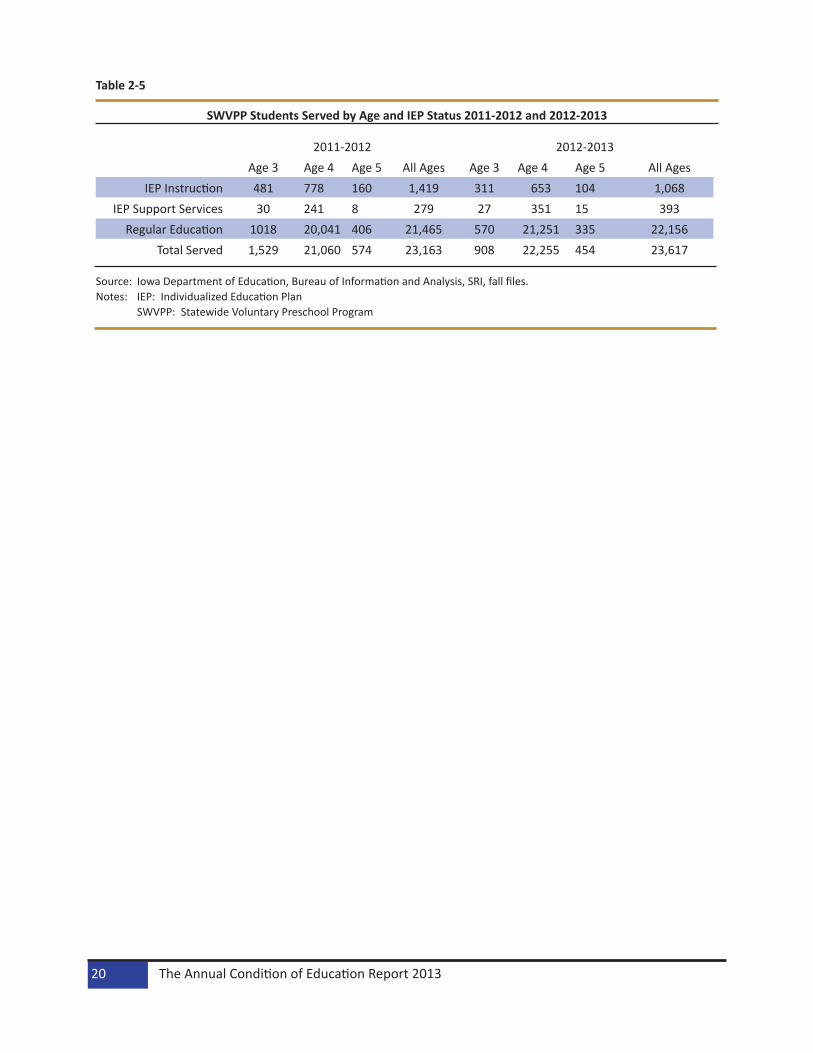
Table 2-5
SWVPP Students Served by Age and IEP Status 2011-2012 and 2012-2013
2011-2012 2012-2013Age 3 Age 4 Age 5 All Ages Age 3 Age 4 Age 5 All Ages
IEP Instruction 481 778 160 1,419 311 653 104 1,068IEP Support Services 30 241 8 279 27 351 15 393
Regular Education 1018 20,041 406 21,465 570 21,251 335 22,156Total Served 1,529 21,060 574 23,163 908 22,255 454 23,617
Source: Iowa Department of Education, Bureau of Information and Analysis, SRI, fall files.Notes: IEP: Individualized Education Plan SWVPP: Statewide Voluntary Preschool Program
The Annual Condition of Education Report 201320

Table 2-6
SWVPP Students Served by Subgroup 2011-2012 and 2012-2013
Source: Iowa Department of Education, Bureau of Information and Analysis, SRI fall files.Note: SWVPP: Statewide Voluntary Preschool Program
2011-2012IEP
Instruction% Age 3 % Age 4 % Age 5 % All %
All Students Served
1,419 1,048 20,282 414 23,163
All Minority 263 18.5% 144 13.7% 3,547 17.5% 24 5.8% 3,978 17.2%African American 54 3.8% 29 2.8% 699 3.4% 2 0.5% 784 3.4%American Indian 9 0.6% 3 0.3% 70 0.3% 0 0.0% 82 0.4%
Asian 25 1.8% 11 1.0% 339 1.7% 3 0.7% 378 1.6%Native Hawaiian/
Pacific Islander2 0.1% 4 0.4% 22 0.1% 0 0.0% 28 0.1%
Two or More Races
53 3.7% 25 2.4% 569 2.8% 4 1.0% 651 2.8%
Hispanic 120 8.5% 72 6.9% 1,848 9.1% 15 3.6% 2,055 8.9%White 1,156 81.5% 904 86.3% 16,735 82.5% 390 94.2% 19,185 82.8%
ELL 3 0.2% 0 0.0% 107 0.5% 1 0.2% 111 0.5%Free/Reduced
Meal647 45.6% 310 29.6% 4,308 21.2% 79 19.1% 5,345 23.1%
Female 441 31.1% 518 49.4% 10,040 49.5% 142 34.3% 11,141 48.1%Male 978 68.9% 530 50.6% 10,242 50.5% 272 65.7% 12,022 51.9%
2012-2013All Students
Served1,068 597 21,602 350 23,617
All Minority 246 23.0% 57 9.5% 4,156 19.2% 30 8.6% 4,490 19.0%African American 65 6.1% 15 2.5% 834 3.9% 5 1.4% 919 3.9%American Indian 10 0.9% 1 0.2% 75 0.3% 2 0.6% 88 0.4%
Asian 14 1.3% 8 1.3% 416 1.9% 3 0.9% 441 1.9%Native Hawaiian/
Pacific Islander2 0.2% 0 0.0% 33 0.2% 0 0.0% 35 0.1%
Two or More Races
44 4.1% 7 1.2% 699 3.2% 8 2.3% 758 3.2%
Hispanic 111 10.4% 26 4.4% 2,099 9.7% 12 3.4% 2,248 9.5%White 822 77.0% 540 90.5% 17,446 80.8% 320 91.4% 19,128 81.0%
ELL 1 0.1% 0 0.0% 23 0.1% 0 0.0% 24 0.1%Free/Reduced
Meal520 48.7% 113 18.9% 4,913 22.7% 59 16.9% 5,605 23.7%
Female 328 30.7% 290 48.6% 10,709 49.6% 133 38.0% 11,460 48.5%Male 740 69.3% 307 51.4% 10,893 50.4% 217 62.0% 12,157 51.5%
Early Childhood Education 21

KindergartenSchool districts report the type of Kindergarten Program offered in their districts on the Spring Basic Educational Data Survey (BEDS). The types of kindergarten program reported include all day every day, half day every day, alternate day, three days a week and other combinations. As shown in Table 2-7, the majority of districts in 2012-2013 offered all day, every day kindergarten.
School districts in Iowa have been required by Iowa Administrative Code 279.60 to administer Dynamic Indicators of Basic Early Literacy Skills (DIBELS) or a kindergarten benchmark assessment adopted by the Iowa Department of Education (DE) to every kindergarten student enrolled in the district no later than October 1. Districts are also required to collect and report information on preschool attendance, other demographics of kindergarten students, and assessment results to the DE no later than January 1 of the school year. This information has been collected from school districts at the student level through EASIER/Student Reporting in Iowa since 2006-2007. The DE has a list of approved assessments that can be used to implement the requirements of IAC 279.60; however, a district may administer an assessment that is not on the list as long as it addresses technical adequacy.
In both years shown in Table 2-8, more than half of all of the buildings in 2011-2012 and 2012-2013 used the DIBELS or DIBELS Next assessment. Table 2-9 and Figure 2-2 display the number and percent of public school kindergarten students by the type of kindergarten literacy assessment taken in the last three years.
Phonemic awareness is measured differently by each kindergarten literacy assessment. The DIBELS Next, First Sound Fluency (FSF) subtest measures if children recognize beginning sounds of words by pointing to the picture matching that sound. The Yopp-Singer full test and the Basic Reading Inventory (BRI) phoneme segmentation subtest measure whether or not a child can break words into sounds. The subtests of the Phonological Awareness Test (PAT) measure whether students can blend sounds, rhyme, or delete sounds from words.
Table 2-10 lists the number of students assessed and the number proficient by assessment. The percent of proficient students increased over the past two years as measured by Yopp-Singer, and PAT Blending and Deletion subtests. The percent of children proficient based on DIBELS decreased. Performance varied for children from year to year based on BRI, BRI & Yopp-Singer combined, and the PAT Rhyming subtest.
Table 2-7
Iowa Public School Kindergarten Program Type 2012-2013
Source: Iowa Department of Education, Bureau of Information and Analysis, SRI File.
Enrollment Category
Number of Districts Number of Districts Offering All-Day Every Day Kindergarten
Percent of Districts Offering All-Day Every Day Kindergarten
<300 46 44 95.7%300-599 108 105 97.2%600-999 87 86 98.9%
1,000-2,499 75 73 97.3%2,500-7,499 21 19 90.5%
7,500+ 11 10 90.9%State 348 337 96.8%
The Annual Condition of Education Report 201322

Table 2-8
Number and Percent of Iowa Public School Buildings by Kindergarten Literacy Assessment Administered 2011-2012 to 2012-2013
Source: Iowa Department of Education, Bureau of Information and Analysis, SRI files.Notes: Only includes buildings that reported offering the kindergarten grade level. Does not include district offices that may
have reported Kindergarten Literacy Assessment (KLA) data. The Yopp-Singer and BRI assessments are considered to be the same assessment and are therefore grouped together in this table.
Districts may offer more than one kind of assessment tool, so percentages don’t add up as 100%.
Table 2-9
Number and Percent of Iowa Public School Kindergarten Students by Kindergarten Literacy Assessment Taken 2010-2011 to 2012-2013
Source: Iowa Department of Education, Bureau of Information and Analysis, Basic Educational Data Survey, Address and Enrollment files.
Notes: Only includes students in buildings that reported offering the kindergarten grade level. The Yopp-Singer and BRI assessments are considered to be the same assessment and are therefore grouped together in this table.
2011-2012 2012-2013Assessment Number Percent Number Percent
DIBELS 222 33.4% 146 22.1%DIBELS Next 192 28.9% 246 37.2%
DRA 14 2.1% 14 2.1%Yopp-Singer + BRI 48 7.2% 45 6.8%
PAT 58 8.7% 54 8.2%PAP 69 10.4% 70 10.6%
Other 138 20.8% 80 12.1%Observation Study 18 2.7% 19 2.9%Total KG buildings 665 662
2010-2011 2011-2012 2012-2013Assessment Number Percent Number Percent Number Percent
DIBELS 18,923 53.7% 10,130 27.2% 7,341 19.2%DIBELS Next 0 0.0% 9,925 26.7% 13,362 35.0%
DRA 0 0.0% 1,108 3.0% 1,128 3.0%Yopp-Singer + BRI 2,052 5.8% 2,161 5.8% 2,209 5.8%
PAT 3,233 9.2% 3,007 8.1% 2,906 7.6%PAP 4,976 14.1% 5,203 14.0% 5,455 14.3%
Observation Study 646 1.8% 1,321 3.5% 1,204 3.2%Other 5,413 15.4% 4,360 11.7% 3,852 10.1%
Total Tested 35,243 100.0% 37,215 100.0% 37,457 98.2%
Total Students Tested 35,243 97.0% 37,215 99.97% 37,457 98.2%Total Not Tested 1,086 3.0% 10 0.03% 686 1.8%
Total Kindergarten Students 36,329 100.0% 37,225 100.0% 38,143 100.0%
Early Childhood Education 23
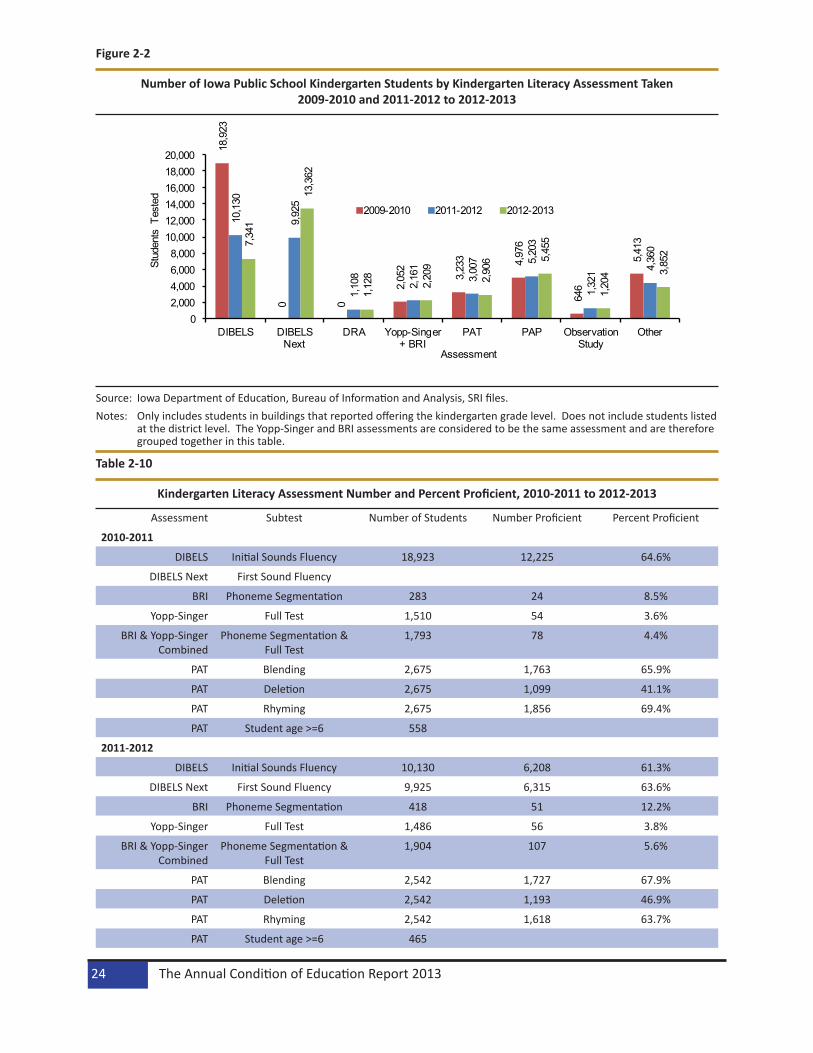
Figure 2-2
Number of Iowa Public School Kindergarten Students by Kindergarten Literacy Assessment Taken 2009-2010 and 2011-2012 to 2012-2013
18,9
23
0 0
2,05
2
3,23
3 4,97
6
646
5,41
3
10,1
30
9,92
5
1,10
8
2,16
1
3,00
7 5,20
3
1,32
1 4,36
07,34
1
13,3
62
1,12
8
2,20
9
2,90
6 5,45
5
1,20
4 3,85
2
02,0004,0006,0008,000
10,00012,00014,00016,00018,00020,000
DIBELS DIBELS Next
DRA Yopp-Singer + BRI
PAT PAP Observation Study
Other
Stud
ents
Tes
ted
Assessment
2009-2010 2011-2012 2012-2013
Source: Iowa Department of Education, Bureau of Information and Analysis, SRI files.Notes: Only includes students in buildings that reported offering the kindergarten grade level. Does not include students listed
at the district level. The Yopp-Singer and BRI assessments are considered to be the same assessment and are therefore grouped together in this table.
Table 2-10
Kindergarten Literacy Assessment Number and Percent Proficient, 2010-2011 to 2012-2013
Assessment Subtest Number of Students Number Proficient Percent Proficient
2010-2011
DIBELS Initial Sounds Fluency 18,923 12,225 64.6%
DIBELS Next First Sound Fluency
BRI Phoneme Segmentation 283 24 8.5%
Yopp-Singer Full Test 1,510 54 3.6%
BRI & Yopp-Singer Combined
Phoneme Segmentation & Full Test
1,793 78 4.4%
PAT Blending 2,675 1,763 65.9%
PAT Deletion 2,675 1,099 41.1%
PAT Rhyming 2,675 1,856 69.4%
PAT Student age >=6 558
2011-2012
DIBELS Initial Sounds Fluency 10,130 6,208 61.3%
DIBELS Next First Sound Fluency 9,925 6,315 63.6%
BRI Phoneme Segmentation 418 51 12.2%
Yopp-Singer Full Test 1,486 56 3.8%
BRI & Yopp-Singer Combined
Phoneme Segmentation & Full Test
1,904 107 5.6%
PAT Blending 2,542 1,727 67.9%
PAT Deletion 2,542 1,193 46.9%
PAT Rhyming 2,542 1,618 63.7%
PAT Student age >=6 465
The Annual Condition of Education Report 201324
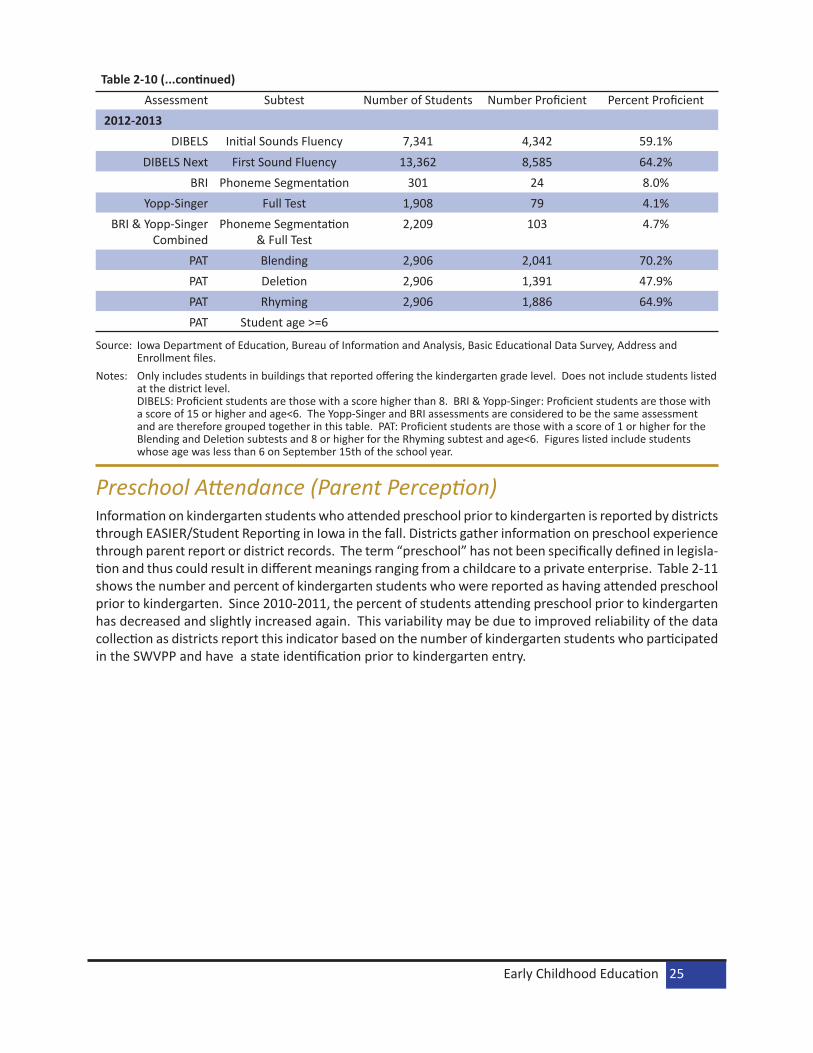
Table 2-10 (...continued) Assessment Subtest Number of Students Number Proficient Percent Proficient
2012-2013DIBELS Initial Sounds Fluency 7,341 4,342 59.1%
DIBELS Next First Sound Fluency 13,362 8,585 64.2%BRI Phoneme Segmentation 301 24 8.0%
Yopp-Singer Full Test 1,908 79 4.1%BRI & Yopp-Singer
CombinedPhoneme Segmentation
& Full Test2,209 103 4.7%
PAT Blending 2,906 2,041 70.2%PAT Deletion 2,906 1,391 47.9%PAT Rhyming 2,906 1,886 64.9%PAT Student age >=6
Source: Iowa Department of Education, Bureau of Information and Analysis, Basic Educational Data Survey, Address and Enrollment files.
Notes: Only includes students in buildings that reported offering the kindergarten grade level. Does not include students listed at the district level. DIBELS: Proficient students are those with a score higher than 8. BRI & Yopp-Singer: Proficient students are those with a score of 15 or higher and age<6. The Yopp-Singer and BRI assessments are considered to be the same assessment and are therefore grouped together in this table. PAT: Proficient students are those with a score of 1 or higher for the Blending and Deletion subtests and 8 or higher for the Rhyming subtest and age<6. Figures listed include students whose age was less than 6 on September 15th of the school year.
Preschool Attendance (Parent Perception)Information on kindergarten students who attended preschool prior to kindergarten is reported by districts through EASIER/Student Reporting in Iowa in the fall. Districts gather information on preschool experience through parent report or district records. The term “preschool” has not been specifically defined in legisla-tion and thus could result in different meanings ranging from a childcare to a private enterprise. Table 2-11 shows the number and percent of kindergarten students who were reported as having attended preschool prior to kindergarten. Since 2010-2011, the percent of students attending preschool prior to kindergarten has decreased and slightly increased again. This variability may be due to improved reliability of the data collection as districts report this indicator based on the number of kindergarten students who participated in the SWVPP and have a state identification prior to kindergarten entry.
Early Childhood Education 25

Table 2-11
Iowa Public School Kindergarten Students Preschool Attendance, 2010-2011 to 2012-2013
2010-2011 2011-2012 2012-2013Number Percent Number Percent Number Percent
K Students who attended Preschool
24,197 66.6% 23,940 62.5% 25,624 64.5%
K Students who did not attend Preschool
12,132 33.4% 14,368 37.5% 14,106 35.5%
Total K Students 36,329 100.0% 38,308 100.0% 39,730 100.0%Source: Iowa Department of Education, Bureau of Information and Analysis, SRI files.Notes: Only includes buildings that reported offering the kindergarten grade level. Does not include students
listed at the district level. The Yopp-Singer and BRI assessments are considered to be the same assessment and are therefore grouped together in this table.
The Annual Condition of Education Report 201326

Evaluation of the Effectiveness of the Statewide Voluntary Pre-school Program (SWVPP) Second Cohort (2008-2009)Background
Over the years, Iowa’s school districts have gone from offering no preschool programs to currently offering a variety of preschool instructional programs. Some preschools have been supported by local or private funds while others have been supported by state and federal funds. Funding has typically driven the type of program standards implemented. The programs offered have ranged in comprehensive services as well as length and frequency of sessions provided.
In 2007, the Statewide Voluntary Preschool Program for Four-Year-Old Children (SWVPP) was adopted by state legislators (IAC 256C) for implementation during the 2007-2008 school year. The SWVPP established a common foundation regarding program standards and personnel requirements. These included an emphasis on meeting quality program standards, employing licensed teachers, and providing a minimum of 10 hours of instruction using research-based curriculum with ongoing assessment to meet children’s learning needs. Districts applied for first year start-up grant funds on a competitive basis each of the first three years of the four-year grant phases of the SWVPP. During the first two years, the applications were rated based on priorities and considerations indicated in the law [IAC 281—16.9 (256C.279)]. Two priori-ties included consideration of districts that did not have an existing preschool as well as districts that had a high percentage of students on free or reduced lunch status. In the first year, 66 of the 364 school districts were awarded grant funds (5,126 children). In the second year (2008-2009), 49 more school districts were awarded grant funds (9,676 children).
The purpose of this study is to examine the second cohort of the SWVPP and the impact for those pre-schoolers’ later academic success. Data analysis was completed by statisticians with review of the program implications provided by early childhood consultants at the Iowa Department of Education. This study examines academic outcomes for the participants of the SWVPP. Specifically, kindergarten literacy and third-grade literacy and math results were examined for the second cohort of preschoolers who partici-pated in the program during the 2008-2009 school year.
Kindergarten Literacy Assessment Results
The first data analysis was completed using the Kindergarten Literacy Assessment (KLA) data for children who participated in the SWVPP in 2008-2009. In 2005, the General Assembly passed legislation requiring local school districts to administer Dynamic Indicators of Basic Early Literacy Skills-6th Edition (DIBELS) or a kindergarten benchmark assessment approved by the Department of Education (DE) to every kindergar-ten student enrolled in the district no later than October 1. This legislation also required school districts to collect, from each parent or guardian of a kindergarten student enrolled in the district, information including but not limited to preschool attendance and demographic factors. School districts report their kindergarten literacy assessment and preschool attendance information to the DE on an annual basis.
Districts submitted data to the DE based on their preschool records or parent report including the number of children who had attended preschool at any time 12 months prior to registering for kindergarten. It should be noted, the term “preschool” was not specifically defined in legislation and thus could have resulted in different meanings for parents ranging from a childcare setting in a home to a public or private enterprise. In addition, the amount of time devoted to instruction may have been interpreted differently by parents. Therefore, the data collected and analyzed should be interpreted with caution. In 2009, 35,960 children entered kindergarten. Districts indicated that based on district records and parent report, 26,673 children attended preschool. This data provides a broad interpretation of “attended preschool.”
Early Childhood Education 27
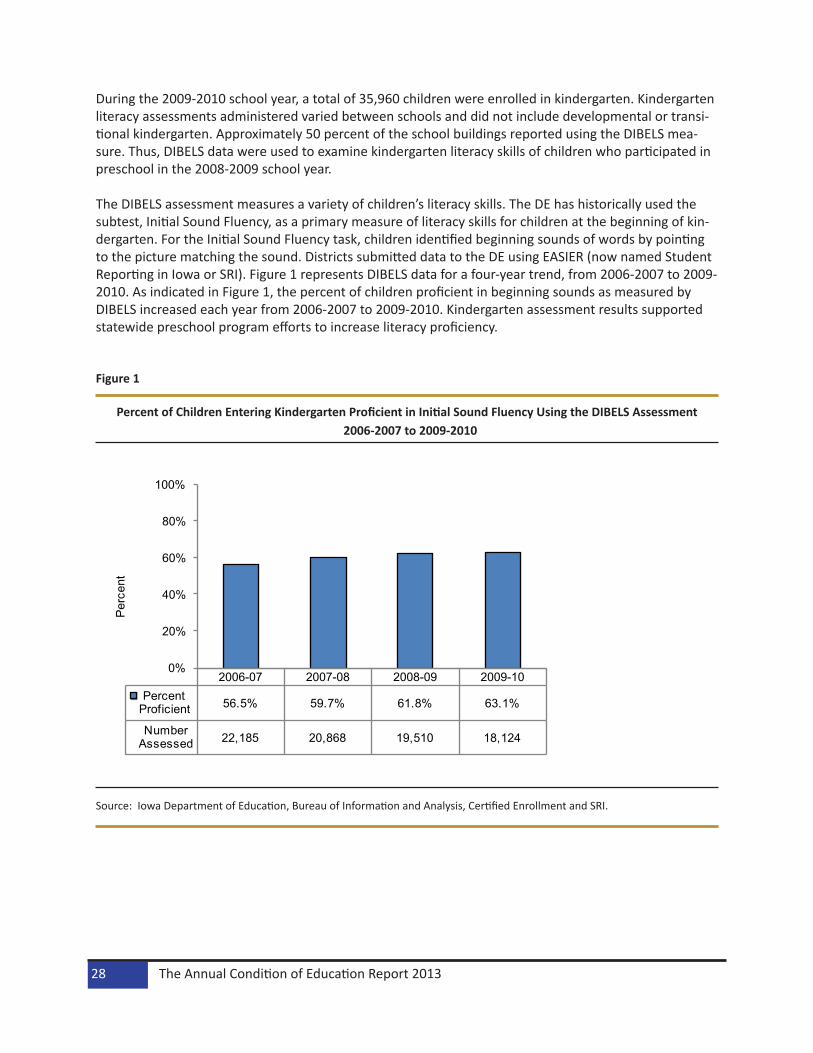
During the 2009-2010 school year, a total of 35,960 children were enrolled in kindergarten. Kindergarten literacy assessments administered varied between schools and did not include developmental or transi-tional kindergarten. Approximately 50 percent of the school buildings reported using the DIBELS mea-sure. Thus, DIBELS data were used to examine kindergarten literacy skills of children who participated in preschool in the 2008-2009 school year.
The DIBELS assessment measures a variety of children’s literacy skills. The DE has historically used the subtest, Initial Sound Fluency, as a primary measure of literacy skills for children at the beginning of kin-dergarten. For the Initial Sound Fluency task, children identified beginning sounds of words by pointing to the picture matching the sound. Districts submitted data to the DE using EASIER (now named Student Reporting in Iowa or SRI). Figure 1 represents DIBELS data for a four-year trend, from 2006-2007 to 2009-2010. As indicated in Figure 1, the percent of children proficient in beginning sounds as measured by DIBELS increased each year from 2006-2007 to 2009-2010. Kindergarten assessment results supported statewide preschool program efforts to increase literacy proficiency.
Figure 1
Percent of Children Entering Kindergarten Proficient in Initial Sound Fluency Using the DIBELS Assessment 2006-2007 to 2009-2010
2006-07 2007-08 2008-09 2009-10Percent
Proficient 56.5% 59.7% 61.8% 63.1%
NumberAssessed 22,185 20,868 19,510 18,124
0%
20%
40%
60%
80%
100%
Per
cent
Source: Iowa Department of Education, Bureau of Information and Analysis, Certified Enrollment and SRI.
The Annual Condition of Education Report 201328

The results of the other kindergarten literacy assessments administered across school buildings in the state also indicated positive trends in proficiency. Between 2007-2008 and 2009-2010, the percentage of children considered proficient on the Rhyming subtests of the Phonological Awareness Test (PAT) increased from 57 percent to 70 percent proficient (Table 2-10). In addition, the percentage of children proficient in blending sounds increased by 6 percent during the same time period.
Third Grade Math and Reading Assessment Results
The data used to examine the second cohort of preschoolers for 3rd grade outcomes in 2012-2013 included:
a. a file of districts that were awarded Statewide Voluntary Preschool Program (SWVPP) grants for 2008-2009; b. a file from the state student reporting system for children enrolled in preschool pro- grams statewide in 2008-2009;c. a file for all students enrolled in 3rd grade in 2012-2013; and d. a file of Iowa Assessments results for all 3rd grade students in 2012-2013.
Using these files, all students in grade 3 actively enrolled in a school district in Iowa in 2012-2013 were divided into four groups:
a. Control group: Children who did not participate in the SWVPP or any other preschool education program;b. Parent-indicated preschool: Children who participated in some kind of preschool program, but were not included in a school district sponsored preschool program or SWVPP;c. Non-SWVPP preschool: Children who participated in a school district sponsored preschool program but not SWVPP; andd. SWVPP: Children who participated in the SWVPP.
Since family income is known to relate to student performance, proficiency information was also disag-gregated by group based on free and reduced lunch status in 3rd grade.
The state’s annual academic and accountability test is the Iowa Assessments Reading and Mathematics subtests. In grade 3, the Reading subtest includes literary and informational passages, with items focus-ing on identifying, interpreting, analyzing, and extending information in passages. The grade 3 math-ematics subtest items are drawn from the areas of number sense and operations, algebraic patterns and connections, data analysis/probability/statistics, geometry, and measurement.
Districts are allowed to administer the Iowa Assessments at the time of their preference. Scores are sorted into three periods (fall, midyear, and spring). Statistical adjustments can be made to produce com-parable standard scores and proficiency ratings. For the purpose of this report, all grade 3 Iowa Assess-ments Reading and Mathematics standard scores for the 2012-2013 school year were adjusted so they would be comparable for the spring period. Mean standard scores, standard deviations (SD) and effect sizes (ES) for reading and mathematics are listed in Tables 1 through Table 4.
Early Childhood Education 29
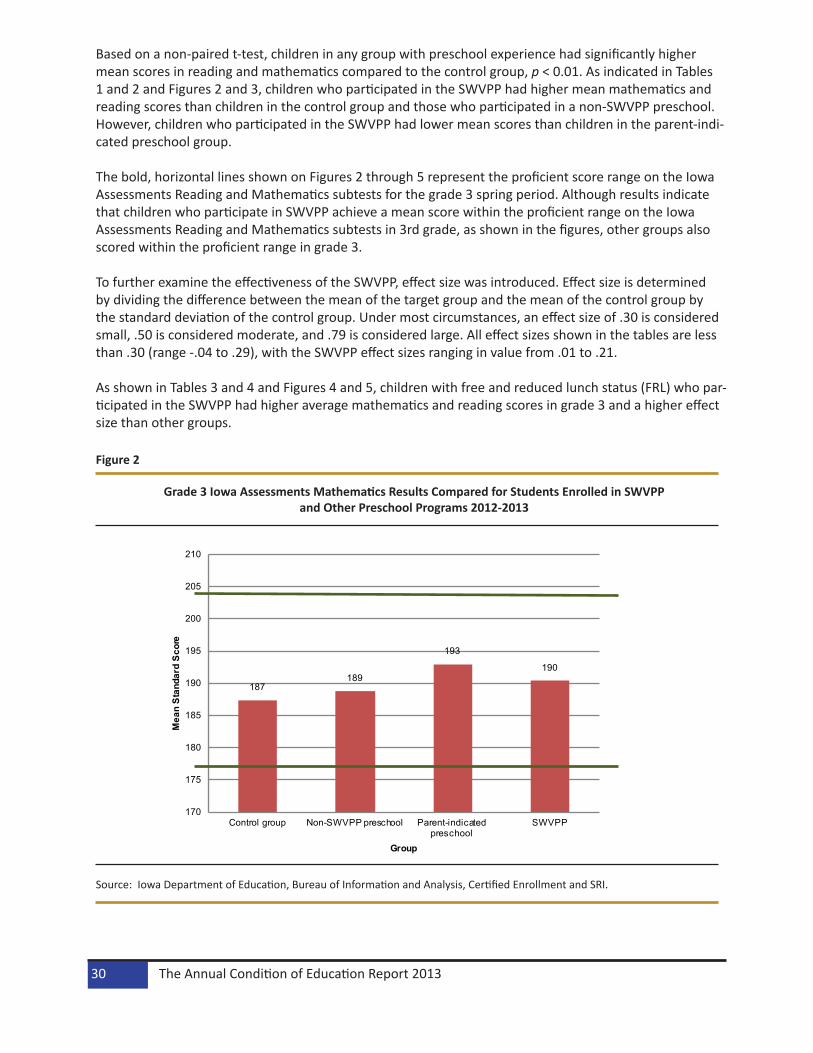
Based on a non-paired t-test, children in any group with preschool experience had significantly higher mean scores in reading and mathematics compared to the control group, p < 0.01. As indicated in Tables 1 and 2 and Figures 2 and 3, children who participated in the SWVPP had higher mean mathematics and reading scores than children in the control group and those who participated in a non-SWVPP preschool. However, children who participated in the SWVPP had lower mean scores than children in the parent-indi-cated preschool group.
The bold, horizontal lines shown on Figures 2 through 5 represent the proficient score range on the Iowa Assessments Reading and Mathematics subtests for the grade 3 spring period. Although results indicate that children who participate in SWVPP achieve a mean score within the proficient range on the Iowa Assessments Reading and Mathematics subtests in 3rd grade, as shown in the figures, other groups also scored within the proficient range in grade 3.
To further examine the effectiveness of the SWVPP, effect size was introduced. Effect size is determined by dividing the difference between the mean of the target group and the mean of the control group by the standard deviation of the control group. Under most circumstances, an effect size of .30 is considered small, .50 is considered moderate, and .79 is considered large. All effect sizes shown in the tables are less than .30 (range -.04 to .29), with the SWVPP effect sizes ranging in value from .01 to .21.
As shown in Tables 3 and 4 and Figures 4 and 5, children with free and reduced lunch status (FRL) who par-ticipated in the SWVPP had higher average mathematics and reading scores in grade 3 and a higher effect size than other groups.
Figure 2
Grade 3 Iowa Assessments Mathematics Results Compared for Students Enrolled in SWVPP and Other Preschool Programs 2012-2013
Source: Iowa Department of Education, Bureau of Information and Analysis, Certified Enrollment and SRI.
187189
193
190
170
175
180
185
190
195
200
205
210
Control group Non-SWVPP preschool Parent-indicated preschool
SWVPP
Mea
n S
tand
ard
Sco
re
Group
The Annual Condition of Education Report 201330

Table 1
Mathematics Performance in Grade 3 by Group 2012-2013 Group N Mean SD ES
Control Group 10,373 187.4 19.4Non-SWVPP
Preschool2,430 188.8 18.0 0.07
Parent Indicated Preschool
16,165 193.0 19.0 0.29
SWVPP 6,246 190.4 18.0 0.16Source: Iowa Department of Education, Bureau of Information and Analysis, Certified Enrollment and SRI.
Figure 3
Grade 3 Iowa Assessments Reading Results Compared for Students Enrolled in SWVPP and Other Preschool Programs 2012-2013
187189
193191
170
175
180
185
190
195
200
205
210
215
220
Control group Non-SWVPP preschool Parent-indicated preschool
SWVPP
Mea
n St
anda
rd S
core
Group
Source: Iowa Department of Education, Bureau of Information and Analysis, Certified Enrollment and SRI.
Early Childhood Education 31
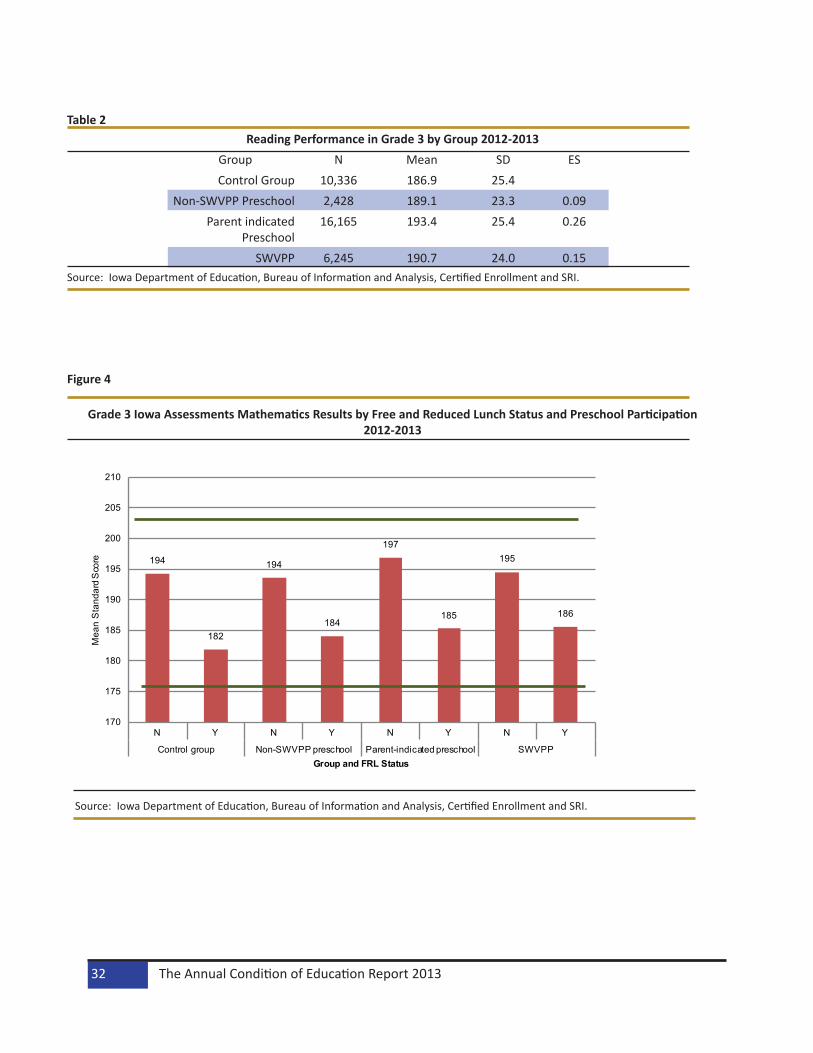
Table 2Reading Performance in Grade 3 by Group 2012-2013
Group N Mean SD ESControl Group 10,336 186.9 25.4
Non-SWVPP Preschool 2,428 189.1 23.3 0.09Parent indicated
Preschool16,165 193.4 25.4 0.26
SWVPP 6,245 190.7 24.0 0.15Source: Iowa Department of Education, Bureau of Information and Analysis, Certified Enrollment and SRI.
Figure 4
Grade 3 Iowa Assessments Mathematics Results by Free and Reduced Lunch Status and Preschool Participation 2012-2013
194
182
194
184
197
185
195
186
170
175
180
185
190
195
200
205
210
N Y N Y N Y N Y
Control group Non-SWVPP preschool Parent-indicated preschool SWVPP
Mea
n S
tand
ard
Sco
re
Group and FRL Status
Source: Iowa Department of Education, Bureau of Information and Analysis, Certified Enrollment and SRI.
The Annual Condition of Education Report 201332
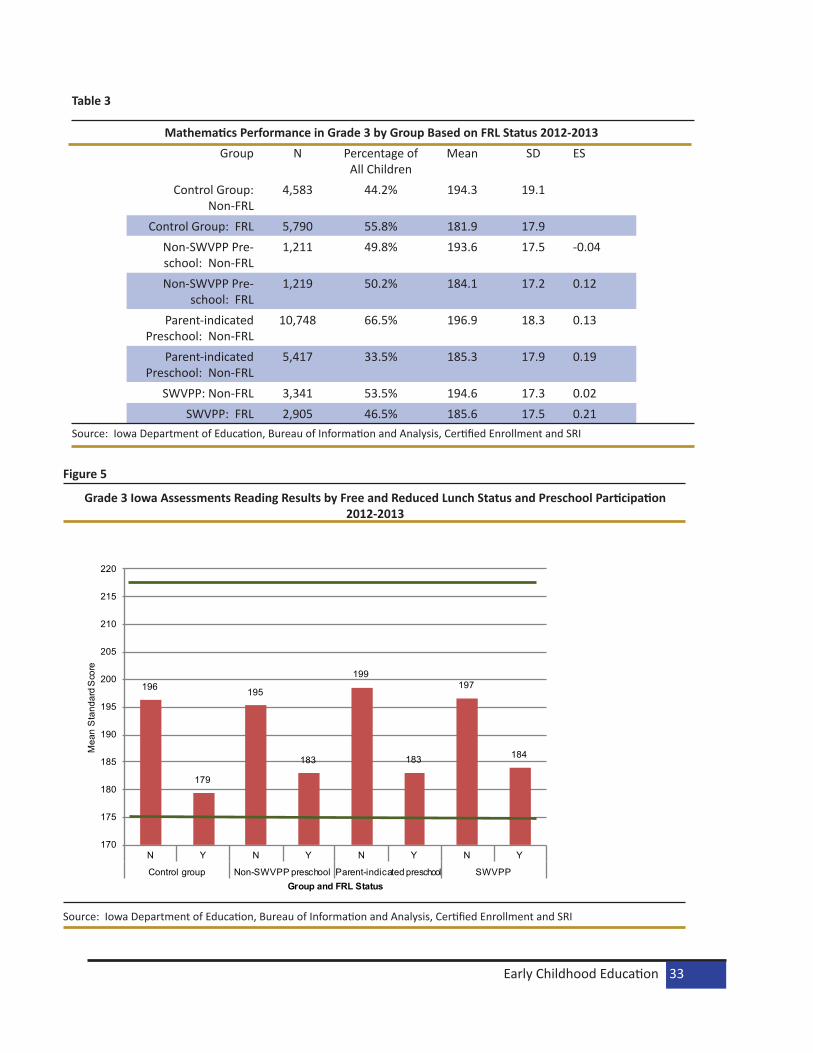
Table 3
Mathematics Performance in Grade 3 by Group Based on FRL Status 2012-2013 Group N Percentage of
All ChildrenMean SD ES
Control Group: Non-FRL
4,583 44.2% 194.3 19.1
Control Group: FRL 5,790 55.8% 181.9 17.9Non-SWVPP Pre-school: Non-FRL
1,211 49.8% 193.6 17.5 -0.04
Non-SWVPP Pre-school: FRL
1,219 50.2% 184.1 17.2 0.12
Parent-indicated Preschool: Non-FRL
10,748 66.5% 196.9 18.3 0.13
Parent-indicated Preschool: Non-FRL
5,417 33.5% 185.3 17.9 0.19
SWVPP: Non-FRL 3,341 53.5% 194.6 17.3 0.02SWVPP: FRL 2,905 46.5% 185.6 17.5 0.21
Source: Iowa Department of Education, Bureau of Information and Analysis, Certified Enrollment and SRI
Figure 5
Grade 3 Iowa Assessments Reading Results by Free and Reduced Lunch Status and Preschool Participation 2012-2013
196
179
195
183
199
183
197
184
170
175
180
185
190
195
200
205
210
215
220
N Y N Y N Y N Y
Control group Non-SWVPP preschool Parent-indicated preschool SWVPP
Mea
n S
tand
ard
Sco
re
Group and FRL Status
Source: Iowa Department of Education, Bureau of Information and Analysis, Certified Enrollment and SRI
Early Childhood Education 33

Table 4
Reading Performance in Grade 3 by Group Based on FRL Status 2012-2013 Group N Percentage of
All ChildrenMean SD ES
Control Group: Non-FRL
4,575 44.3% 196.3 26.2
Control Group: FRL 5,761 55.7% 179.4 22.1Non-SWVPP Pre-school: Non-FRL
1,210 49.8% 195.3 23.6 -0.04
Non-SWVPP Pre-school: FRL
1,218 50.2% 183.0 21.1 0.16
Parent-indicated Preschool: Non-FRL
10,751 66.5% 198.6 24.8 0.09
Parent-indicated Preschool: Non-FRL
5,415 33.5% 183.1 23.3 0.17
SWVPP: Non-FRL 3,341 53.5% 196.6 24.0 0.01SWVPP: FRL 29,04 46.5% 184.0 22.1 0.21
Source: Iowa Department of Education, Bureau of Information and Analysis, Certified Enrollment and SRI.
Discussion
The SWVPP program is in its sixth year of implementation as of 2013-2014; each year, additional districts have applied for access to certified enrollment funding creating a continuous cycle of initial implementation. Data available to evaluate the effectiveness of the SWVPP is limited, as this is only the second cohort of children who are old enough to be assessed in grade 3, specifically, those preschoolers who attended in the 2008-2009 school year. In implementing a program of this magnitude, several components are important to building and reaching desired quality. Considerations for this second cohort of the SWVPP may include the following:
Resources for technical assistance remained constant, while the number of new districts applying and receiving funding increased annually. Regional and state staff resources were focused on developing grant applications, assisting districts in applying for competitive funding, awarding grant contracts, developing and implementing monitoring processes, revising and monitoring data systems, providing technical assis-tance related to program standards and monitoring visits, as well as providing professional development for implementing research-based curriculum and assessment.
The demands placed upon licensed preschool teachers in the preschool programs increased steeply. Teachers were responsible for meeting the requirements of one of the state-approved program standards (National Association for the Education of Young Children [NAEYC] Program Standards and Accreditation Criteria; Head Start Program Performance Standards [HSPPS], or Iowa Quality Preschool Program Stan-dards [IQPPS]) and criteria while implementing research-based curriculum and providing ongoing assess-ment aligned to the Iowa Early Learning Standards. Many preschool teachers had more than one session in which to implement these requirements, increasing the instructional demand to 40 children. The number of available, experienced preschool teachers was limited as the program expanded annually.
The Annual Condition of Education Report 201334

Research indicates a predictable sequence of steps in order to implement programs with fi-delity and increasing quality. It is important to establish the critical inputs prior to measuring the outputs of a program. For example, establishing inputs such as a common foundation of program standards and personnel requirements must occur prior to measuring the outputs or outcomes for the participants. With the initial SWVPP cohorts, districts focused on establishing and implementing the inputs necessary to the program. Once these were established, districts were monitored to ensure fidelity of implementation. This study reflects an early attempt to measure the outputs or outcomes for children during the time when the system was focused on establishing the inputs.
IQPPS monitoring data during the 2009-2010 year identified the standard “Curriculum” as an area of need. Subsequently, districts began developing and implementing their corrective ac-tions to address curriculum, specifically in the area of literacy. As teachers gain knowledge and experience implementing the curriculum, future studies could demonstrate increased Kinder-garten Literacy Assessment scores and improved grade 3 achievement for each cohort of chil-dren who participate in the SWVPP.
Continued data collection and analyses are needed to evaluate the influence of the SWVPP on chil-dren’s later academic achievement. Interpretation at this level of analysis is limited and results should be interpreted with caution. The impact of this program will be realized with each consecutive year of implementation. It is imperative to engage in continuous improvement for the SWVPP. Addition-ally, the system must work to ensure vertical alignment of student standards for children preschool through grade 12 as each year is critical in a child’s learning and academic success.
Authors:
Laurabelle Sherman-Proehl, Administrative Consultant, Bureau of Learner Strategies and SupportsJennifer Adkins, Consultant, Bureau of School ImprovementXia Chen, Consultant, Bureau of Information and Analysis ServicesPenny Milburn, Consultant, Bureau of Educator Quality
Early Childhood Education 35

The Annual Condition of Education Report 201336

StaffThis chapter presents information on licensed and non-licensed staff in Iowa’s schools and area education agencies (AEAs). Data on characteristics such as age, race/ethnicity, gender, experience, and salary for teachers, principals, superintendents, guidance counselors, and library/media specialists are included in this chapter. Information on instructional aides, pupil-teacher ratios, and nurses for public schools is also included. The data are summarized at the state level, by enrollment category (based on district certified enrollment) and by AEA. National and regional state comparative data are also presented where available. Some information is broken out by public and nonpublic schools.
An unlimited number of positions/assignments can be reported for each staff member. Some staff members are reported as serving in multiple positions. For example, a guidance counselor may also be a principal or a teacher. Salary is not reported separately for each position/assignment combination. Therefore, salary reported for staff may be impacted by additional duties. In 2008-2009, data on shared staff were collected on the Fall Basic Educational Data Survey (BEDS). Beginning in 2008-2009, shared staff members were reported in each district they served. However, the district that held the contract was the only district to report salary for the staff. The district that did not hold the contract for shared staff did not report any salary. In 2008-2009 and 2009-2010, the district that held the contract was also the only district to report the staff as full-time if they held a full-time contract. The district that did not hold the contract for shared staff reported the shared staff as having a part-time contract in 2008-2009 and 2009-2010. Beginning in 2010-2011, full-time equivalencies (FTE) were collected for each position. The district that held the contract reported the entire FTE for shared staff. The district that was purchasing services only reported FTE for their district. In all figures presented in this chapter, staff members are reported only once in the district that held the contract.
In previous years, information on licensed staff in Iowa was collected from schools through the Licensed Staff Detail report on the BEDS. The data that were collected included age, gender, race/ethnicity, salary, contract days, contract type, degrees, majors, positions, and the assignments that go along with each position. Beginning in 2010-2011, a new web application was used to collect this same data on licensed and non-licensed staff in Iowa.
Full-time teachers in 2010-2011 to 2012-2013 were defined as staff with at least one teaching position code, a full-time equivalency for licensed positions of 0.8 or higher, base salary (salary paid for regular po-sition responsibilities, excluding professional development) of at least $28,000, and at least 180 contract days. There were 5,191 teachers in 2012-2013 that were reported as serving in other positions, such as administrative (e.g., principal, superintendent) or student support services (e.g., coach, counselor). Salary is not reported separately for each position/assignment combination. Therefore, salary reported for these teachers may be impacted by the additional duties. In each section, minority counts include staff with a reported ethnicity of Hispanic and/or reported race of American Indian/Alaskan Native, African American, Asian, Pacific Islander or multiple races. Teachers and principals with advanced degrees include staff with a master’s, specialist, or doctorate degree.
Salary information collected through the Fall BEDS included base salary, salary paid for professional devel-opment, and extra duty pay. Base salary includes teacher compensation and phase monies. The portion of salary that is paid for regular position responsibilities is called regular salary. It includes base salary and salary for professional development. Extra duty salary includes salary paid for extra duties such as yearbook sponsorship and coaching. Total salary is the sum of the regular salary and extra duty pay.
Staff 37
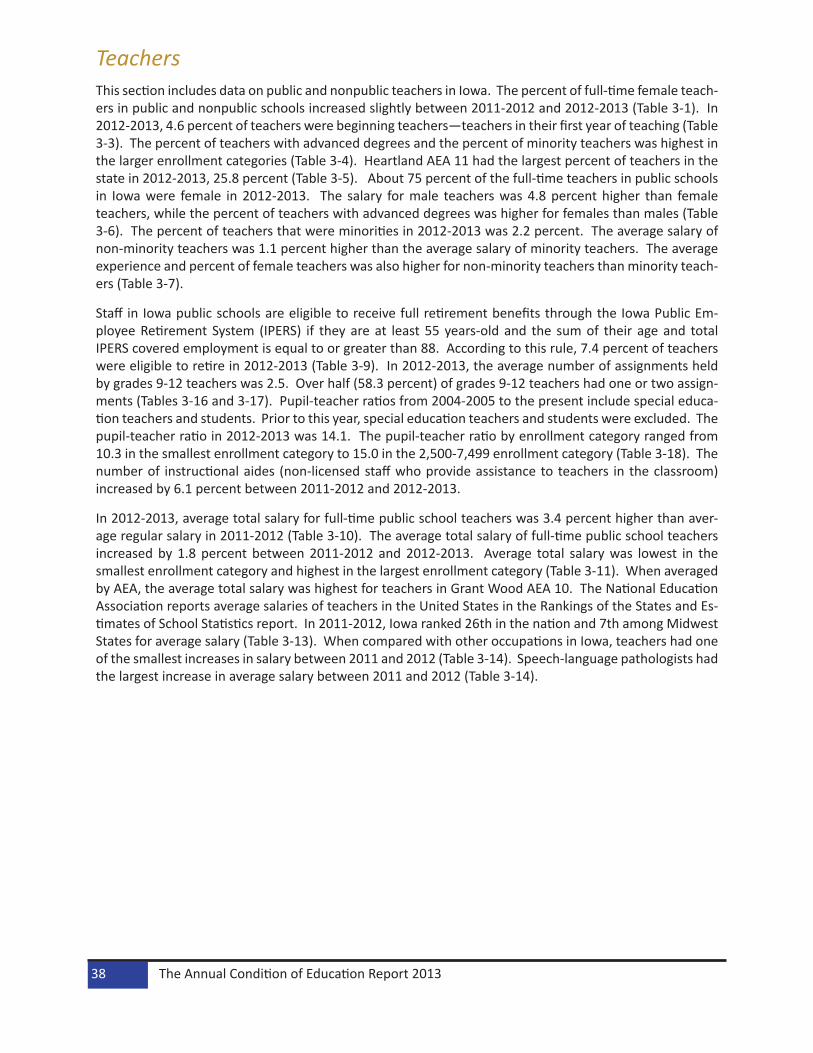
TeachersThis section includes data on public and nonpublic teachers in Iowa. The percent of full-time female teach-ers in public and nonpublic schools increased slightly between 2011-2012 and 2012-2013 (Table 3-1). In 2012-2013, 4.6 percent of teachers were beginning teachers—teachers in their first year of teaching (Table 3-3). The percent of teachers with advanced degrees and the percent of minority teachers was highest in the larger enrollment categories (Table 3-4). Heartland AEA 11 had the largest percent of teachers in the state in 2012-2013, 25.8 percent (Table 3-5). About 75 percent of the full-time teachers in public schools in Iowa were female in 2012-2013. The salary for male teachers was 4.8 percent higher than female teachers, while the percent of teachers with advanced degrees was higher for females than males (Table 3-6). The percent of teachers that were minorities in 2012-2013 was 2.2 percent. The average salary of non-minority teachers was 1.1 percent higher than the average salary of minority teachers. The average experience and percent of female teachers was also higher for non-minority teachers than minority teach-ers (Table 3-7).
Staff in Iowa public schools are eligible to receive full retirement benefits through the Iowa Public Em-ployee Retirement System (IPERS) if they are at least 55 years-old and the sum of their age and total IPERS covered employment is equal to or greater than 88. According to this rule, 7.4 percent of teachers were eligible to retire in 2012-2013 (Table 3-9). In 2012-2013, the average number of assignments held by grades 9-12 teachers was 2.5. Over half (58.3 percent) of grades 9-12 teachers had one or two assign-ments (Tables 3-16 and 3-17). Pupil-teacher ratios from 2004-2005 to the present include special educa-tion teachers and students. Prior to this year, special education teachers and students were excluded. The pupil-teacher ratio in 2012-2013 was 14.1. The pupil-teacher ratio by enrollment category ranged from 10.3 in the smallest enrollment category to 15.0 in the 2,500-7,499 enrollment category (Table 3-18). The number of instructional aides (non-licensed staff who provide assistance to teachers in the classroom) increased by 6.1 percent between 2011-2012 and 2012-2013.
In 2012-2013, average total salary for full-time public school teachers was 3.4 percent higher than aver-age regular salary in 2011-2012 (Table 3-10). The average total salary of full-time public school teachers increased by 1.8 percent between 2011-2012 and 2012-2013. Average total salary was lowest in the smallest enrollment category and highest in the largest enrollment category (Table 3-11). When averaged by AEA, the average total salary was highest for teachers in Grant Wood AEA 10. The National Education Association reports average salaries of teachers in the United States in the Rankings of the States and Es-timates of School Statistics report. In 2011-2012, Iowa ranked 26th in the nation and 7th among Midwest States for average salary (Table 3-13). When compared with other occupations in Iowa, teachers had one of the smallest increases in salary between 2011 and 2012 (Table 3-14). Speech-language pathologists had the largest increase in average salary between 2011 and 2012 (Table 3-14).
The Annual Condition of Education Report 201338

Table 3-1
Characteristics of Iowa Full-Time Teachers 2000-2001, 2011-2012 and 2012-2013
Source: Iowa Department of Education, Bureau of Information and Analysis, Basic Educational Data Survey, Staff files.Notes: State total ‘Number of Teachers’ includes AEA teachers. There were about 5,000 full-time teachers in 2011-2012 and 2012-2013 that reported having administrative or support positions, as well as teaching positions.
Table 3-2
Characteristics of Iowa Beginning Full-Time Teachers 2000-2001, 2011-2012 and 2012-2013
Source: Iowa Department of Education, Bureau of Information and Analysis, Basic Educational Data Survey, Staff files.Note: State total ‘Number of Teachers’ includes AEA teachers..
Public NonpublicCharacteristics 2000-2001 2011-2012 2012-2013 2000-2001 2011-2012 2012-2013
Average Age 42.2 41.8 41.5 40.3 43.0 42.6Percent Female 70.5% 74.9% 75.1% 80.3% 82.0% 82.2%
Percent Minority 1.8% 2.2% 2.2% 0.9% 1.4% 1.7%Percent Advanced Degree 27.0% 33.0% 32.9% 13.1% 15.0% 15.4%Average Total Experience 15.1 14.4 14.1 12.3 15.6 15.3
Average District/AEA Experience 11.9 11.0 10.8 8.8 11.4 11.4
Number of Teachers 33,610 33,938 34,226 2,437 2,356 2,314
Public NonpublicCharacteristics 2000-2001 2011-2012 2012-2013 2000-2001 2011-2012 2012-2013
Average Age 28.5 26.9 27.3 28.5 25.4 26.4Percent Female 71.6% 74.8% 75.4% 83.5% 74.5% 79.5%
Percent Minority 2.8% 2.8% 2.5% 1.5% 2.0% 7.4%Percent Advanced Degree 5.9% 11.5% 9.3% 2.9% 4.9% 4.9%
Number of Teachers 1,660 1,161 1,559 206 102 122
Staff 39
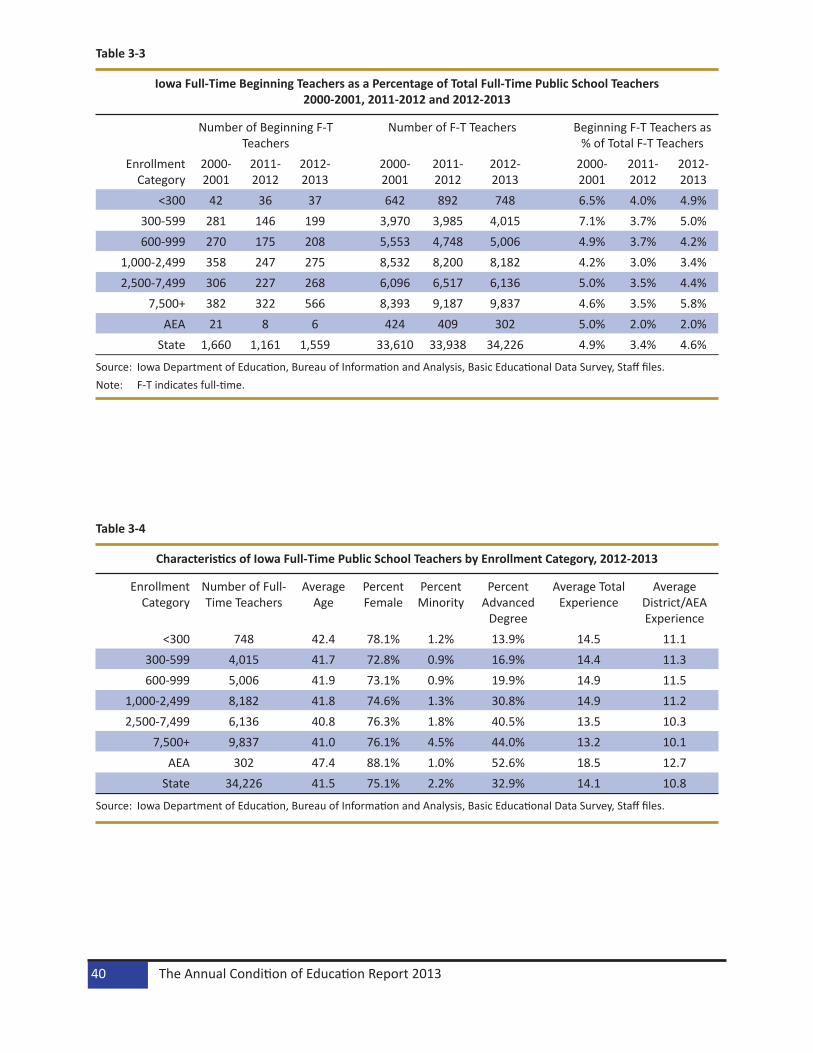
Table 3-3
Iowa Full-Time Beginning Teachers as a Percentage of Total Full-Time Public School Teachers 2000-2001, 2011-2012 and 2012-2013
Source: Iowa Department of Education, Bureau of Information and Analysis, Basic Educational Data Survey, Staff files.Note: F-T indicates full-time.
Table 3-4
Characteristics of Iowa Full-Time Public School Teachers by Enrollment Category, 2012-2013
Source: Iowa Department of Education, Bureau of Information and Analysis, Basic Educational Data Survey, Staff files.
Number of Beginning F-T Teachers
Number of F-T Teachers Beginning F-T Teachers as % of Total F-T Teachers
Enrollment Category
2000-2001
2011-2012
2012-2013
2000-2001
2011-2012
2012-2013
2000-2001
2011-2012
2012-2013
<300 42 36 37 642 892 748 6.5% 4.0% 4.9%300-599 281 146 199 3,970 3,985 4,015 7.1% 3.7% 5.0%600-999 270 175 208 5,553 4,748 5,006 4.9% 3.7% 4.2%
1,000-2,499 358 247 275 8,532 8,200 8,182 4.2% 3.0% 3.4%2,500-7,499 306 227 268 6,096 6,517 6,136 5.0% 3.5% 4.4%
7,500+ 382 322 566 8,393 9,187 9,837 4.6% 3.5% 5.8%AEA 21 8 6 424 409 302 5.0% 2.0% 2.0%
State 1,660 1,161 1,559 33,610 33,938 34,226 4.9% 3.4% 4.6%
Enrollment Category
Number of Full-Time Teachers
Average Age
Percent Female
Percent Minority
Percent Advanced
Degree
Average Total Experience
Average District/AEA Experience
<300 748 42.4 78.1% 1.2% 13.9% 14.5 11.1300-599 4,015 41.7 72.8% 0.9% 16.9% 14.4 11.3600-999 5,006 41.9 73.1% 0.9% 19.9% 14.9 11.5
1,000-2,499 8,182 41.8 74.6% 1.3% 30.8% 14.9 11.22,500-7,499 6,136 40.8 76.3% 1.8% 40.5% 13.5 10.3
7,500+ 9,837 41.0 76.1% 4.5% 44.0% 13.2 10.1AEA 302 47.4 88.1% 1.0% 52.6% 18.5 12.7
State 34,226 41.5 75.1% 2.2% 32.9% 14.1 10.8
The Annual Condition of Education Report 201340

Table 3-5
Characteristics of Iowa Full-Time Public School Teachers by AEA, 2012-2013
Source: Iowa Department of Education, Bureau of Information and Analysis, Basic Educational Data Survey, Staff files.Note: Includes AEA teachers.
Table 3-6
Gender Comparison of Iowa Full-Time Public School Teachers, 2012-2013
Source: Iowa Department of Education, Bureau of Information and Analysis, Basic Educational Data Survey, Staff files.Note: Includes AEA teachers.
AEA Number of Teachers
Percent of Total
Teachers
Average Age
Percent Female
Percent Minority
Percent Advanced
Degree
Average Total
Experience
Average District/AEA Experience
Keystone 1 2,161 6.3% 41.6 74.9% 1.1% 35.2% 14.7 11.4AEA 267 4,719 13.8% 41.4 74.1% 2.3% 25.2% 14.0 10.7
Prairie Lakes 8 2,288 6.7% 42.7 74.6% 1.3% 23.8% 15.5 11.7Mississippi Bend 9 3,320 9.7% 41.6 75.5% 3.9% 33.4% 14.0 11.3
Grant Wood 10 4,619 13.5% 40.7 74.3% 2.0% 38.6% 13.6 10.2Heartland 11 8,816 25.8% 40.5 75.7% 2.6% 37.9% 13.4 9.9
Northwest 12 2,742 8.0% 42.4 73.9% 2.2% 36.0% 15.4 11.9Green Hills 13 2,949 8.6% 42.2 75.8% 1.5% 27.7% 14.6 11.0
Great Prairie 15 2,612 7.6% 42.7 76.8% 1.3% 28.8% 14.3 11.7State 34,226 100.0% 41.5 71.5% 2.2% 32.9% 14.1 10.8
Characteristics Female Male
Average Age 41.6 41.1Percent Minority 2.0% 2.7%
Percent Advanced Degree 33.2% 32.1%Average Total Experience 14.1 14.3
Average District/AEA Experience 10.8 10.6Average Total Salary $52,009 $54,524
Number of Teachers 25,706 8,520
Staff 41
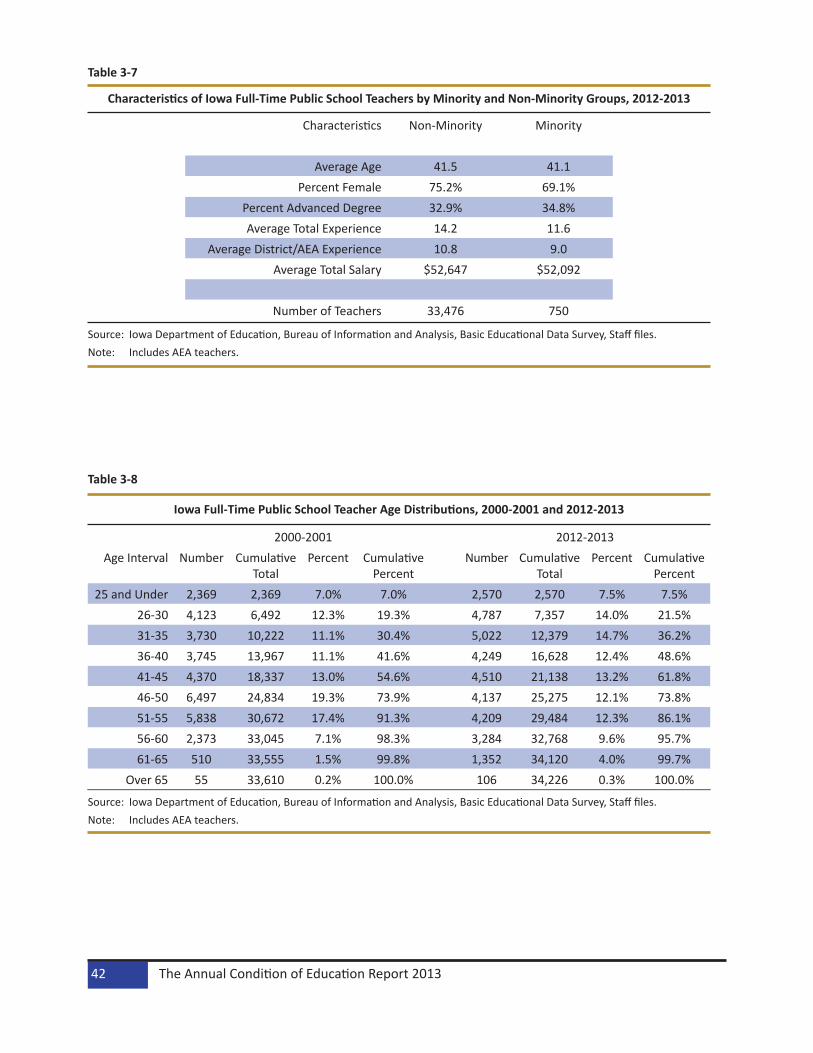
Table 3-7
Characteristics of Iowa Full-Time Public School Teachers by Minority and Non-Minority Groups, 2012-2013
Source: Iowa Department of Education, Bureau of Information and Analysis, Basic Educational Data Survey, Staff files.Note: Includes AEA teachers.
Table 3-8
Iowa Full-Time Public School Teacher Age Distributions, 2000-2001 and 2012-2013
Source: Iowa Department of Education, Bureau of Information and Analysis, Basic Educational Data Survey, Staff files.Note: Includes AEA teachers.
Characteristics Non-Minority Minority
Average Age 41.5 41.1Percent Female 75.2% 69.1%
Percent Advanced Degree 32.9% 34.8%Average Total Experience 14.2 11.6
Average District/AEA Experience 10.8 9.0Average Total Salary $52,647 $52,092
Number of Teachers 33,476 750
2000-2001 2012-2013Age Interval Number Cumulative
TotalPercent Cumulative
PercentNumber Cumulative
TotalPercent Cumulative
Percent25 and Under 2,369 2,369 7.0% 7.0% 2,570 2,570 7.5% 7.5%
26-30 4,123 6,492 12.3% 19.3% 4,787 7,357 14.0% 21.5%31-35 3,730 10,222 11.1% 30.4% 5,022 12,379 14.7% 36.2%36-40 3,745 13,967 11.1% 41.6% 4,249 16,628 12.4% 48.6%41-45 4,370 18,337 13.0% 54.6% 4,510 21,138 13.2% 61.8%46-50 6,497 24,834 19.3% 73.9% 4,137 25,275 12.1% 73.8%51-55 5,838 30,672 17.4% 91.3% 4,209 29,484 12.3% 86.1%56-60 2,373 33,045 7.1% 98.3% 3,284 32,768 9.6% 95.7%61-65 510 33,555 1.5% 99.8% 1,352 34,120 4.0% 99.7%
Over 65 55 33,610 0.2% 100.0% 106 34,226 0.3% 100.0%
The Annual Condition of Education Report 201342
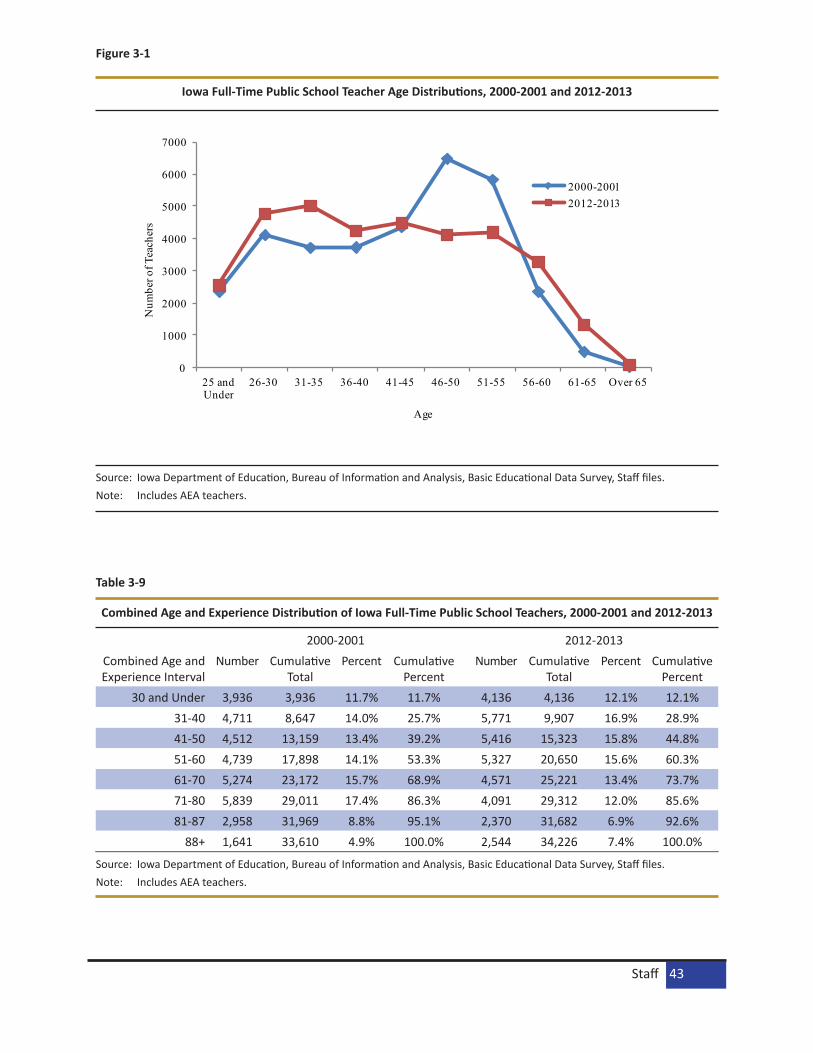
Figure 3-1
Iowa Full-Time Public School Teacher Age Distributions, 2000-2001 and 2012-2013
0
1000
2000
3000
4000
5000
6000
7000
25 and Under
26-30 31-35 36-40 41-45 46-50 51-55 56-60 61-65 Over 65
Num
ber o
f Tea
cher
s
Age
2000-20012012-2013
Source: IowaDepartmentofEducation,BureauofInformationandAnalysis,BasicEducationalDataSurvey,Stafffiles.Note: IncludesAEAteachers.
Table 3-9
Combined Age and Experience Distribution of Iowa Full-Time Public School Teachers, 2000-2001 and 2012-2013
Source: IowaDepartmentofEducation,BureauofInformationandAnalysis,BasicEducationalDataSurvey,Stafffiles.Note: IncludesAEAteachers.
2000-2001 2012-2013CombinedAgeandExperienceInterval
Number CumulativeTotal
Percent CumulativePercent
Number CumulativeTotal
Percent CumulativePercent
30 and Under 3,936 3,936 11.7% 11.7% 4,136 4,136 12.1% 12.1%31-40 4,711 8,647 14.0% 25.7% 5,771 9,907 16.9% 28.9%41-50 4,512 13,159 13.4% 39.2% 5,416 15,323 15.8% 44.8%51-60 4,739 17,898 14.1% 53.3% 5,327 20,650 15.6% 60.3%61-70 5,274 23,172 15.7% 68.9% 4,571 25,221 13.4% 73.7%71-80 5,839 29,011 17.4% 86.3% 4,091 29,312 12.0% 85.6%81-87 2,958 31,969 8.8% 95.1% 2,370 31,682 6.9% 92.6%
88+ 1,641 33,610 4.9% 100.0% 2,544 34,226 7.4% 100.0%
Staff 43
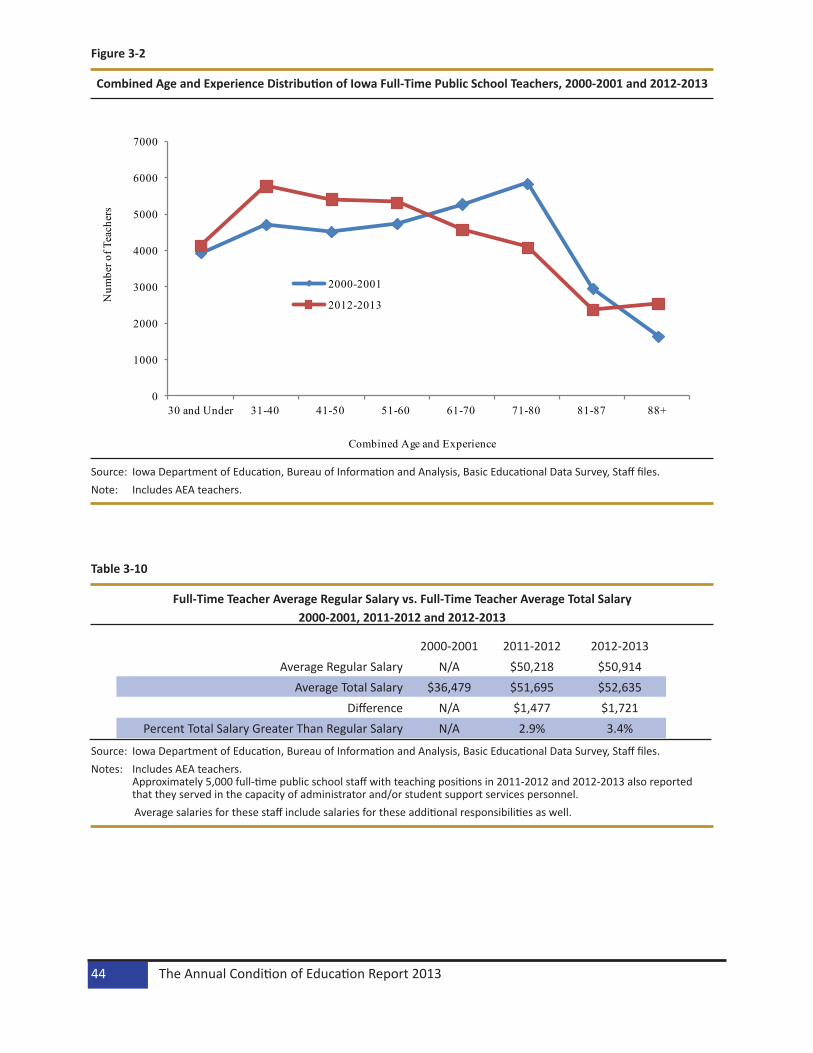
Figure 3-2
Combined Age and Experience Distribution of Iowa Full-Time Public School Teachers, 2000-2001 and 2012-2013
0
1000
2000
3000
4000
5000
6000
7000
30 and Under 31-40 41-50 51-60 61-70 71-80 81-87 88+
Num
ber o
f Tea
cher
s
Combined Age and Experience
2000-2001
2012-2013
Source: Iowa Department of Education, Bureau of Information and Analysis, Basic Educational Data Survey, Staff files.Note: Includes AEA teachers.
Table 3-10
Full-Time Teacher Average Regular Salary vs. Full-Time Teacher Average Total Salary 2000-2001, 2011-2012 and 2012-2013
Source: Iowa Department of Education, Bureau of Information and Analysis, Basic Educational Data Survey, Staff files.Notes: Includes AEA teachers.
Approximately 5,000 full-time public school staff with teaching positions in 2011-2012 and 2012-2013 also reported that they served in the capacity of administrator and/or student support services personnel.
Average salaries for these staff include salaries for these additional responsibilities as well.
2000-2001 2011-2012 2012-2013Average Regular Salary N/A $50,218 $50,914
Average Total Salary $36,479 $51,695 $52,635Difference N/A $1,477 $1,721
Percent Total Salary Greater Than Regular Salary N/A 2.9% 3.4%
The Annual Condition of Education Report 201344

Table 3-11
Average Total Salaries of Iowa Full-Time Public School Teachers by Enrollment Category2000-2001, 2011-2012 and 2012-2013
Source: Iowa Department of Education, Bureau of Information and Analysis, Basic Educational Data Survey, Staff files.Notes: Includes AEA teachers.
Approximately 5,000 full-time public school staff with teaching positions in 2011-2012 and 2012-2013 also reported that they served in the capacity of administrator and/or student support services personnel.
Average total salaries for these staff include salaries for these additional responsibilities as well.
Table 3-12
Average Salaries of Iowa Full-Time Public School Teachers by AEA, 2012-2013
Source: Iowa Department of Education, Bureau of Information and Analysis, Basic Educational Data Survey, Staff files.Notes: Includes AEA teachers.
Approximately 5,000 full-time public school staff with teaching positions in 2011-2012 and 2012-2013 also reported that they served in the capacity of administrator and/or student support services personnel.
Average total salaries for these staff include salaries for these additional responsibilities as well.
Average Total Salary Percent Salary ChangeEnrollment Category 2000-2001 2011-2012 2012-2013 2000-2001 to
2012-20132011-2012 to
2012-2013<300 $28,811 $42,843 $43,305 50.3% 1.1%
300-599 $31,557 $45,953 $46,536 47.5% 1.3%600-999 $33,809 $48,748 $49,320 45.9% 1.2%
1,000-2,499 $35,912 $51,281 $52,146 45.2% 1.7%2,500-7,499 $38,266 $54,149 $55,738 45.7% 2.9%
7,500+ $40,452 $55,060 $55,804 37.9% 1.4%AEA $36,196 $54,814 $58,766 62.4% 7.2%
State $36,479 $51,695 $52,635 44.3% 1.8%
AEA Regular Salary Total SalaryKeystone 1 $49,235 $50,714
AEA 267 $49,603 $51,266Prairie Lakes 8 $48,674 $50,381
Mississippi Bend 9 $50,869 $52,955Grant Wood 10 $53,849 $55,433
Heartland 11 $51,977 $53,757Northwest 12 $52,097 $53,819Green Hills 13 $48,535 $50,387
Great Prairie 15 $49,361 $50,824State $50,914 $52,635
Staff 45

Table 3-13
Average Salaries of Public School Teachers for Iowa, Midwest States, and the Nation, 2010-2011 and 2011-2012
Source: National Education Association, Rankings of the States and Estimates of School Statistics.
Figure 3-3
Average Salaries of Public School Teachers for Iowa and the Nation 1987-1988, 1992-1993 and 2000-2001 to 2011-2012
$0
$10,000
$20,000
$30,000
$40,000
$50,000
$60,000
1988 1993 2001 2002 2003 2004 2005 2006 2007 2008 2009 2010 2011 2012
Sala
ry
Year Ending
Nation Iowa
Source: National Education Association, Rankings of the States and Estimates of School Statistics.
2010-2011 2011-2012Nation and State Salary National Rank Midwest Rank Salary National Rank Midwest Rank
Nation $56,069 $55,418Illinois $63,005 8 1 $57,636 13 2
Indiana $50,407 26 7 $50,516 25 6Iowa $50,634 25 6 $50,240 26 7
Kansas $47,080 42 9 $46,718 41 9Michigan $58,595 12 2 $61,560 11 1
Minnesota $53,215 20 4 $54,959 17 4Missouri $46,411 49 10 $46,406 43 10
Nebraska $47,521 37 8 $48,154 36 8North Dakota $44,266 50 11 $46,058 45 11
Ohio $57,291 14 3 $56,715 16 3South Dakota $35,201 51 12 $38,804 51 12
Wisconsin $52,031 23 5 $53,792 21 5
The Annual Condition of Education Report 201346

Table 3-14
Iowa Salary Comparisons by Occupation, 2011 and 2012
Source: U.S. Bureau of Labor Statistics, State Occupational Employment and Wage Estimates, Iowa, May 2011 and May 2012.Note: Teacher average salaries are average regular salaries based on Iowa Department of Education, Basic Educational Data
Survey, Staff files.
Table 3-15
Distribution of Contract Days for Full-Time Public School Teachers, 2000-2001, 2011-2012 and 2012-2013
Source: Iowa Department of Education, Bureau of Information and Analysis, Basic Educational Data Survey, Staff files.Note: Includes AEA teachers.
Occupation 2011 2012 Percent Change 2011 to 2012Electrical Engineer $77,660 $77,310 -0.5%
Civil Engineer $75,020 $77,220 2.9%Software Developer, Applications $74,730 $74,400 -0.4%
Computer Programmer $64,820 $63,720 -1.7%Accountant & Auditor $61,550 $62,390 1.4%
Speech-Language Pathologist $63,610 $66,200 4.1%Registered Nurse $53,300 $52,540 -1.4%
Teacher $49,794 $50,218 0.9%Child, Family and School Social Worker $37,790 $37,690 -0.3%
Interior Designer $44,900 $44,910 0.0%
Number Percent Cumulative PercentNumber of
Contract Days2000-2001
2011-2012
2012-2013
2000-2001
2011-2012
2012-2013
2000-2001
2011-2012
2012-2013
180-185 2,089 1,528 1,557 6.2% 4.5% 4.6% 6.2% 4.5% 4.6%186-190 16,449 13,595 14,054 49.0% 40.1% 41.1% 55.2% 44.6% 45.6%191-195 13,136 15,372 15,193 39.1% 45.3% 44.4% 94.3% 89.9% 90.0%
196+ 1,932 3,443 3,422 5.8% 10.1% 10.0% 100.0% 100.0% 100.0%
Staff 47

Table 3-16
Average Number of Assignments for Iowa Full-Time Public School Teachers in Grades 9-12 by Enrollment Category, 2000-2001, 2011-2012 and 2012-2013
Source: Iowa Department of Education, Bureau of Information and Analysis, Basic Educational Data Survey, Staff files.Note: Only includes grades 9-12 teaching assignments for 2011-2012 and 2012-2013 for a teacher that has at least one 9-12
assignment.
Table 3-17
Distribution of Assignments for Full-Time Public School Teachers in Grades 9-12, 2012-2013
Source: Iowa Department of Education, Bureau of Information and Analysis, Basic Educational Data Survey, Staff files.Note: Only includes grades 9-12 teaching assignments for a teacher that has at least one 9-12 assignment.
2000-2001 2011-2012 2012-2013Enrollment
CategoryNumber
of Districts
Number of Grade
9-12 Teachers
Average Number of
Assignments
Number of
Districts
Number of Grade
9-12 Teachers
Average Number of
Assignments
Number of
Districts
Number of Grade
9-12 Teachers
Average Number of
Assignments
<300 38 279 3.9 51 346 3.5 46 286 3.4300-599 116 2,084 3.4 107 1,763 3.1 108 1,777 3.1600-999 104 2,587 3.1 85 1,866 2.9 87 1,972 2.8
1,000-2,499 83 3,335 2.7 76 2,739 2.5 75 2,717 2.52,500-7,499 24 2,052 2.2 22 1,916 2.1 21 1,814 2.1
7,500+ 9 2,480 2.1 10 2,581 2.2 11 2,739 2.2State 374 12,817 2.7 351 11,211 2.6 348 11,305 2.5
Number of Unique Assignments
Number of Teachers Percent Cumulative Percent
1 4,350 38.48% 38.48%2 2,240 19.81% 58.29%3 1,919 16.97% 75.27%4 1,267 11.21% 86.48%5 744 6.58% 93.06%6 431 3.81% 96.87%7 205 1.81% 98.68%8 86 0.76% 99.44%9 38 0.34% 99.78%
10 14 0.12% 99.90%11 3 0.03% 99.93%12 5 0.04% 99.97%13 2 0.02% 99.99%14 0 0.00% 99.99%15 0 0.00% 99.99%16 1 0.01% 100.00%
The Annual Condition of Education Report 201348

Figure 3-4
Iowa Public School K-12 Pupil-Teacher Ratios, 2000-2001 to 2012-2013
15.814.9 15.3 15.2
13.5 13.8 13.8 13.7 13.7 13.7 14.2 14.1 14.1
0
2
4
6
8
10
12
14
16
18
20
2001 2002 2003 2004 2005 2006 2007 2008 2009 2010 2011 2012 2013
Pupi
l-Te
ache
r Rat
io
Year Ending
Source: Iowa Department of Education, Bureau of Information and Analysis, Basic Educational Data Survey, Staff files.Notes: Beginning in 2004-2005, all students were reported at a grade level. Students that may have been listed as ungraded in
the past are now included in a grade level. Pupil-teacher ratios include special education students and teachers from 2004-2005 forward.
Figure 3-5
K-12 Pupil-Teacher Ratios for Iowa Public Schools by Enrollment Category, 2011-2012 and 2012-2013
10.1
12.5 13
.6 14.3 14
.9
14.8
14.1
10.3
12.5 13
.4 14.3 15
.0
14.7
14.1
0
2
4
6
8
10
12
14
16
18
20
<300 300-599 600-999 1,000-2,499 2,500-7,499 7,500+ State
Pupi
l-Te
ache
r Rat
io
Enrollment Category
2011-2012 2012-2013
Source: Iowa Department of Education, Bureau of Information and Analysis, Basic Educational Data Survey, Staff files.
Staff 49

Table 3-18
K-12 Pupil-Teacher Ratios for Iowa Public Schools by Enrollment Category, 2012-2013
Source: Iowa Department of Education, Bureau of Information and Analysis, Basic Educational Data Survey, Staff files.Notes: Beginning in 2004-2005, all students were reported at a grade level. Students that may have been listed as ungraded in the past are now included in a grade level. Pupil-teacher ratios include special education students and teachers from
2004-2005 forward.
Table 3-19
Instructional Aides in Iowa Public Schools by Enrollment Category, 2000-2001, 2011-2012 and 2012-2013
Source: Iowa Department of Education, Bureau of Information and Analysis, Basic Educational Data Survey, Staff files.Note: Figures may not total due to rounding.
Enrollment Category Number of Students Number of FTE Teachers Ratio<300 7,752 755.5 10.3
300-599 49,477 3,956.7 12.5600-999 65,769 4,914.6 13.4
1,000-2,499 115,622 8,106.2 14.32,500-7,499 91,226 6,090.1 15.0
7,500+ 143,019 9,732.5 14.7State 472,865 33,555.5 14.1
Number of Full-Time Equivalent (FTE) Aides
Enrollment Category
2000-2001
2011-2012
2012-2013
% Change in FTE Aides 2000-2001 to 2012-2013
% Change in FTE Aides 2011-2012 to 2012-2013
<300 113.4 266.0 219.2 93.3% -17.6%300-599 685.9 1,225.3 1,334.4 94.6% 8.9%600-999 1,054.0 1,529.5 1,689.9 60.3% 10.5%
1,000-2,499 2,023.3 2,660.6 2,865.3 41.6% 7.7%2,500-7,499 1,681.6 1,941.6 1,887.1 12.2% -2.8%
7,500+ 2,204.5 2,833.1 3,098.0 40.5% 9.4%State 7,762.7 10,456.2 11,093.9 42.9% 6.1%
The Annual Condition of Education Report 201350

PrincipalsData on full-time public and nonpublic school principals in Iowa are shown in this section. The percent of female principals increased in public schools between 2011-2012 and 2012-2013 (Table 3-20). The percent of female public school principals and minority public school principals was highest in the largest enrollment category. The percent of principals with advanced degrees was highest in the 2,500-7,499 enrollment category (Table 3-21). The average salary of male principals was 2.4 percent higher than female principals. The percent of principals with advanced degrees was higher for females than males and the average years of experience was higher for female principals than male principals (Table 3-22). In 2012-2013, 11.6 percent of full-time public school principals were eligible to retire with combined age and years of experience of 88 or more (Table 3-24). The average salary of full-time public school principals increased by 2.6 percent between 2011-2012 and 2012-2013. The average salary of principals in the largest enrollment category was 29.1 percent higher than the average salary of principals in the smallest enrollment category (Table 3-25).
Table 3-20
Characteristics of Iowa Full-Time Principals, 2000-2001, 2011-2012 and 2012-2013
Source: Iowa Department of Education, Bureau of Information and Analysis, Basic Educational Data Survey, Staff files.Note: Figures for public school principals include AEA principals.
Table 3-21
Characteristics of Iowa Full-Time Public School Principals by Enrollment Category, 2012-2013
Source: Iowa Department of Education, Bureau of Information and Analysis, Basic Educational Data Survey, Staff files.Note: Includes AEA principals.
Public NonpublicCharacteristics 2000-
20012011-2012
2012-2013
2000-2001
2011-2012
2012-2013
Average Age 47.8 46.4 46.0 49.0 50.0 49.7Percent Female 30.6% 40.7% 41.1% 50.5% 47.8% 45.5%
Percent Minority 3.5% 2.3% 2.4% 1.0% 1.5% 1.5%Percent Advanced Degree 96.0% 86.2% 84.1% 90.5% 91.8% 93.2%Average Total Experience 22.4 20.6 19.8 23.3 24.5 24.7
Average District/AEA Experience 11.8 9.6 9.4 8.7 10.1 11.1Number of Principals 1,124 1,163 1,156 105 134 132
Enrollment Category
Number of Full-Time Principals
Average Age
Percent Female
Percent Minority
Percent Advanced
Degree
Average Total
Experience
Average District/AEA Experience
<300 54 49.9 40.7% 0.0% 88.9% 22.2 9.9300-599 194 44.2 33.5% 0.0% 77.3% 18.9 8.9600-999 214 45.4 31.3% 0.9% 79.0% 20.4 8.5
1,000-2,499 278 46.4 37.4% 0.7% 85.3% 21.0 9.52,500-7,499 169 46.2 40.2% 3.0% 91.1% 20.0 10.0
7,500+ 246 46.5 60.2% 7.7% 87.0% 18.2 10.0AEA 1 38.0 100.0% 0.0% 0.0% 14.0 8.0
State 1,156 46.0 41.1% 2.4% 84.1% 19.8 9.4
Staff 51
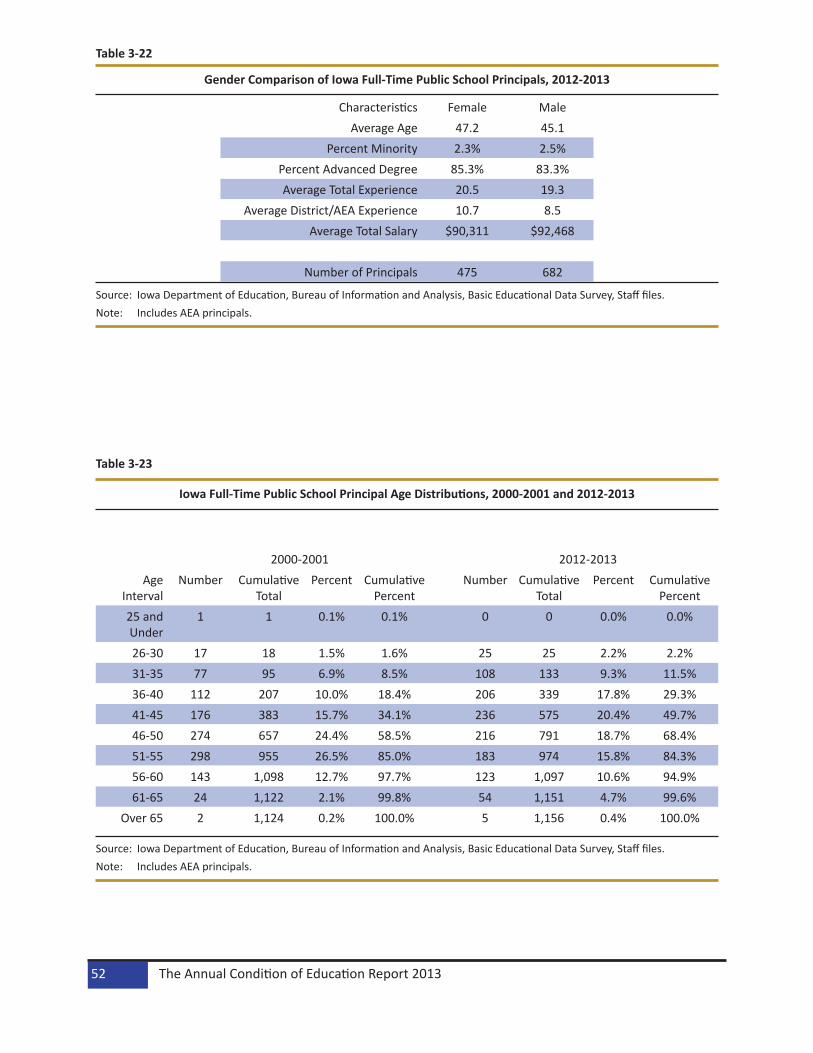
Table 3-22
Gender Comparison of Iowa Full-Time Public School Principals, 2012-2013
Source: Iowa Department of Education, Bureau of Information and Analysis, Basic Educational Data Survey, Staff files.Note: Includes AEA principals.
Table 3-23
Iowa Full-Time Public School Principal Age Distributions, 2000-2001 and 2012-2013
Source: Iowa Department of Education, Bureau of Information and Analysis, Basic Educational Data Survey, Staff files.Note: Includes AEA principals.
Characteristics Female MaleAverage Age 47.2 45.1
Percent Minority 2.3% 2.5%Percent Advanced Degree 85.3% 83.3%Average Total Experience 20.5 19.3
Average District/AEA Experience 10.7 8.5Average Total Salary $90,311 $92,468
Number of Principals 475 682
2000-2001 2012-2013Age
IntervalNumber Cumulative
TotalPercent Cumulative
PercentNumber Cumulative
TotalPercent Cumulative
Percent25 and Under
1 1 0.1% 0.1% 0 0 0.0% 0.0%
26-30 17 18 1.5% 1.6% 25 25 2.2% 2.2%31-35 77 95 6.9% 8.5% 108 133 9.3% 11.5%36-40 112 207 10.0% 18.4% 206 339 17.8% 29.3%41-45 176 383 15.7% 34.1% 236 575 20.4% 49.7%46-50 274 657 24.4% 58.5% 216 791 18.7% 68.4%51-55 298 955 26.5% 85.0% 183 974 15.8% 84.3%56-60 143 1,098 12.7% 97.7% 123 1,097 10.6% 94.9%61-65 24 1,122 2.1% 99.8% 54 1,151 4.7% 99.6%
Over 65 2 1,124 0.2% 100.0% 5 1,156 0.4% 100.0%
The Annual Condition of Education Report 201352

Figure 3-6
Iowa Full-Time Public School Principal Age Distributions, 2000-2001 and 2012-2013
0
50
100
150
200
250
300
350
25 and Under
26-30 31-35 36-40 41-45 46-50 51-55 56-60 61-65 Over 65
Num
ber o
f Pri
ncip
als
Age
2000-2001
2012-2013
Source: Iowa Department of Education, Bureau of Information and Analysis, Basic Educational Data Survey, Staff files.Note: Includes AEA principals.
Table 3-24
Combined Age and Experience Distribution of Iowa Full-Time Public School Principals, 2000-2001 and 2012-2013
Source: Iowa Department of Education, Bureau of Information and Analysis, Basic Educational Data Survey, Staff files.Note: Includes AEA principals.
2000-2001 2012-2013Combined Age and Experience Interval
Number Cumulative Total
Percent Cumulative Percent
Number Cumulative Total
Percent Cumulative Percent
30 and Under 3 3 0.3% 0.3% 0 0 0.0% 0.0%31-40 42 45 3.7% 4.0% 60 60 5.2% 5.2%41-50 100 145 8.9% 12.8% 179 239 15.5% 20.7%51-60 145 290 12.9% 25.6% 234 473 20.2% 40.9%61-70 237 527 21.1% 46.5% 233 706 20.2% 61.1%71-80 303 830 27.0% 73.2% 196 902 17.0% 78.0%81-87 158 988 14.1% 87.1% 120 1,022 10.4% 88.4%
88+ 136 1,124 12.1% 99.1% 134 1,156 11.6% 100.0%
Staff 53
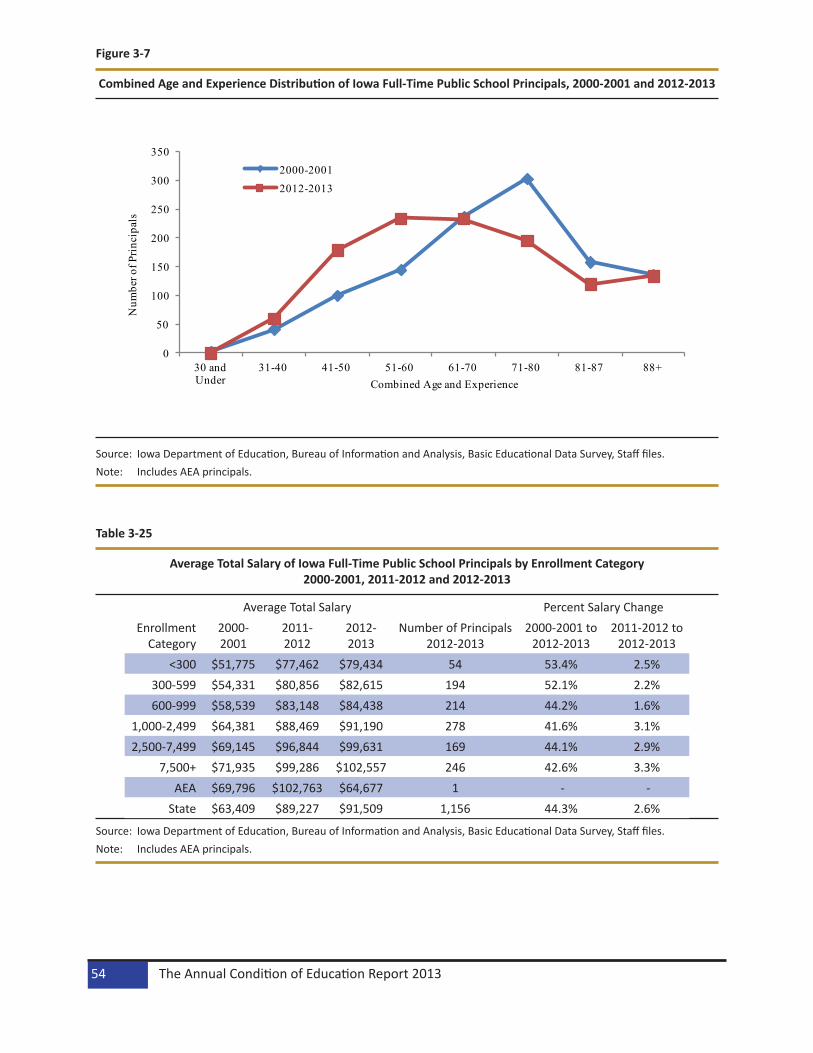
Figure 3-7
Combined Age and Experience Distribution of Iowa Full-Time Public School Principals, 2000-2001 and 2012-2013
0
50
100
150
200
250
300
350
30 and Under
31-40 41-50 51-60 61-70 71-80 81-87 88+
Num
ber o
f Pri
ncip
als
Combined Age and Experience
2000-20012012-2013
Source: Iowa Department of Education, Bureau of Information and Analysis, Basic Educational Data Survey, Staff files.Note: Includes AEA principals.
Table 3-25
Average Total Salary of Iowa Full-Time Public School Principals by Enrollment Category 2000-2001, 2011-2012 and 2012-2013
Source: Iowa Department of Education, Bureau of Information and Analysis, Basic Educational Data Survey, Staff files.Note: Includes AEA principals.
Average Total Salary Percent Salary ChangeEnrollment
Category2000-2001
2011-2012
2012-2013
Number of Principals 2012-2013
2000-2001 to 2012-2013
2011-2012 to 2012-2013
<300 $51,775 $77,462 $79,434 54 53.4% 2.5%300-599 $54,331 $80,856 $82,615 194 52.1% 2.2%600-999 $58,539 $83,148 $84,438 214 44.2% 1.6%
1,000-2,499 $64,381 $88,469 $91,190 278 41.6% 3.1%2,500-7,499 $69,145 $96,844 $99,631 169 44.1% 2.9%
7,500+ $71,935 $99,286 $102,557 246 42.6% 3.3%AEA $69,796 $102,763 $64,677 1 - -
State $63,409 $89,227 $91,509 1,156 44.3% 2.6%
The Annual Condition of Education Report 201354

SuperintendentsThe tables in this section present data on full-time superintendents in Iowa public schools. The percent of superintendents with Specialist/Doctorate degrees decreased between 2011-2012 and 2012-2013. The percent of female superintendents decreased (Table 3-26). The percent of female superintendents was highest in the smallest enrollment category in 2012-2013. The percent of superintendents with Specialist/Doctorate degrees was highest in the largest enrollment category and lowest in the 300-599 enrollment category (Table 3-27). The average salary of male superintendents was 2.5 percent higher than female su-perintendents. The percent of superintendents with Specialist/Doctorate degrees was higher for females than males (Table 3-28). The percent of superintendents with combined age and experience of 88 years or more and therefore eligible to retire in 2012-2013 was 26.7 percent (Table 3-30). The average salary of superintendents increased by 3.4 percent between 2011-2012 and 2012-2013 (Table 3-31).
Table 3-26
Characteristics of Iowa Full-Time Public School Superintendents, 2000-2001, 2011-2012 and 2012-2013
Source: Iowa Department of Education, Bureau of Information and Analysis, Basic Educational Data Survey, Staff files.Note: Every district is required to have a superintendent. There are a number of smaller districts that share superintendents.
Table 3-27
Characteristics of Iowa Full-Time Public School Superintendents by Enrollment Category, 2012-2013
Source: Iowa Department of Education, Bureau of Information and Analysis, Basic Educational Data Survey, Staff files.
Characteristics 2000-2001 2011-2012 2012-2013Average Age 52.1 51.0 51.0
Percent Female 5.8% 15.0% 13.3%Percent Minority 0.9% 1.0% 1.0%
Percent Specialist/Doctorate Degree 59.2% 58.5% 59.0%Average Total Experience 26.9 24.9 24.7
Average District Experience 8.0 7.2 7.5Number of Superintendents 326 301 300
Enrollment Category
Number of Full-Time
Superintendents
Average Age
Percent Female
Percent Minority
Percent Specialist/Doctorate Degree
Average Total
Experience
Average District
Experience<300 25 51.9 24.0% 0.0% 68.0% 27.2 10.1
300-599 87 50.0 9.2% 1.1% 52.9% 24.8 8.3600-999 82 50.4 8.5% 0.0% 58.5% 24.3 6.7
1,000-2,499 74 51.2 18.9% 2.7% 60.8% 25.5 7.02,500-7,499 21 54.1 19.0% 0.0% 61.9% 24.8 7.9
7,500+ 11 54.5 9.1% 0.0% 72.7% 15.5 4.3State 300 51.0 13.3% 1.0% 59.0% 24.7 7.5
Staff 55

Table 3-28
Gender Comparison of Iowa Full-Time Public School Superintendents, 2012-2013
Source: Iowa Department of Education, Bureau of Information and Analysis, Basic Educational Data Survey, Staff files.
Table 3-29
Iowa Full-Time Public School Superintendents Age Distribution, 2000-2001 and 2012-2013
Source: Iowa Department of Education, Bureau of Information and Analysis, Basic Educational Data Survey, Staff files.Note: Every district is required to have a superintendent. There are a number of smaller districts that share superintendents.
Characteristics Female Male
Average Age 53.1 50.7Percent Minority 2.5% 0.8%
Percent Specialist/Doctorate Degree
75.0% 56.5%
Average Total Experience 25.4 24.6Average District Experience 7.1 7.6
Average Total Salary $123,578 $126,622Number of Superintendents 40 260
2000-2001 2012-2013Age
IntervalNumber Cumulative
TotalPercent Cumulative
PercentNumber Cumulative
TotalPercent Cumulative
Percent31-35 0 0 0.0% 0.0% 6 6 2.0% 2.0%36-40 18 18 5.5% 5.5% 24 30 8.0% 10.0%41-45 31 49 9.5% 15.0% 46 76 15.3% 25.3%46-50 71 120 21.8% 36.8% 63 139 21.0% 46.3%51-55 105 225 32.2% 69.0% 65 204 21.7% 68.0%56-60 76 301 23.3% 92.3% 64 268 21.3% 89.3%61-65 20 321 6.1% 98.5% 28 296 9.3% 98.7%
Over 65 5 326 1.5% 100.0% 4 300 1.3% 100.0%
The Annual Condition of Education Report 201356

Figure 3-8
Iowa Full-Time Public School Superintendents Age Distribution, 2000-2001 and 2012-2013
0
20
40
60
80
100
120
31-35 36-40 41-45 46-50 51-55 56-60 61-65 Over 65
Num
ber o
f Sup
erin
tend
ents
Age
2000-2001
2012-2013
Source: Iowa Department of Education, Bureau of Information and Analysis, Basic Educational Data Survey, Staff files.Note: Every district is required to have a superintendent. There are a number of smaller districts that share superintendents.
Table 3-30
Combined Age and Experience Distribution of Iowa Full-Time Public School Superintendents 2000-2001 and 2012-2013
Source: Iowa Department of Education, Bureau of Information and Analysis, Basic Educational Data Survey, Staff files.Note: Every district is required to have a superintendent. There are a number of smaller districts that share superintendents.
2000-2001 2012-2013Combined Age and Experience Interval
Number Cumulative Total
Percent Cumulative Percent
Number Cumulative Total
Percent Cumulative Percent
41-50 4 4 1.2% 1.2% 17 17 5.7% 5.7%51-60 26 30 8.0% 9.2% 43 60 14.3% 20.0%61-70 53 83 16.3% 25.5% 55 115 18.3% 38.3%71-80 89 172 27.3% 52.8% 55 170 18.3% 56.7%81-87 67 239 20.6% 73.3% 50 220 16.7% 73.3%
88+ 87 326 26.7% 100.0% 80 300 26.7% 100.0%
Staff 57

Figure 3-9
Combined Age and Experience Distribution of Iowa Full-Time Public School Superintendents 2000-2001 and 2012-2013
0
10
20
30
40
50
60
70
80
90
100
41-50 51-60 61-70 71-80 81-87 88+
Num
ber o
f Sup
erin
tend
ents
Combined Age and Experience
2000-2001
2012-2013
Source: Iowa Department of Education, Bureau of Information and Analysis, Basic Educational Data Survey, Staff files.Note: Every district is required to have a superintendent. There are a number of smaller districts that share superintendents.
Table 3-31
Average Total Salary of Iowa Full-Time Public School Superintendents by Enrollment Category 2000-2001, 2011-2012 and 2012-2013
Source: Iowa Department of Education, Bureau of Information and Analysis, Basic Educational Data Survey, Staff files.Note: Every district is required to have a superintendent. There are a number of smaller districts that share superintendents.
Average Total Salary Number of Superintendents
2012-2013
Percent Salary ChangeEnrollment
Category2000-2001
2011-2012
2012-2013
2000-2001 to 2012-2013
2011-2012 to 2012-2013
<300 $63,569 $93,846 $95,051 25 49.5% 1.3%300-599 $71,049 $111,649 $115,020 87 61.9% 3.0%600-999 $76,935 $114,369 $118,010 82 53.4% 3.2%
1,000-2,499 $85,772 $130,915 $136,164 74 58.8% 4.0%2,500-7,499 $104,464 $162,273 $169,237 21 62.0% 4.3%
7,500+ $125,036 $197,629 $197,712 11 58.1% 0.0%State $79,836 $122,114 $126,216 300 58.1% 3.4%
The Annual Condition of Education Report 201358
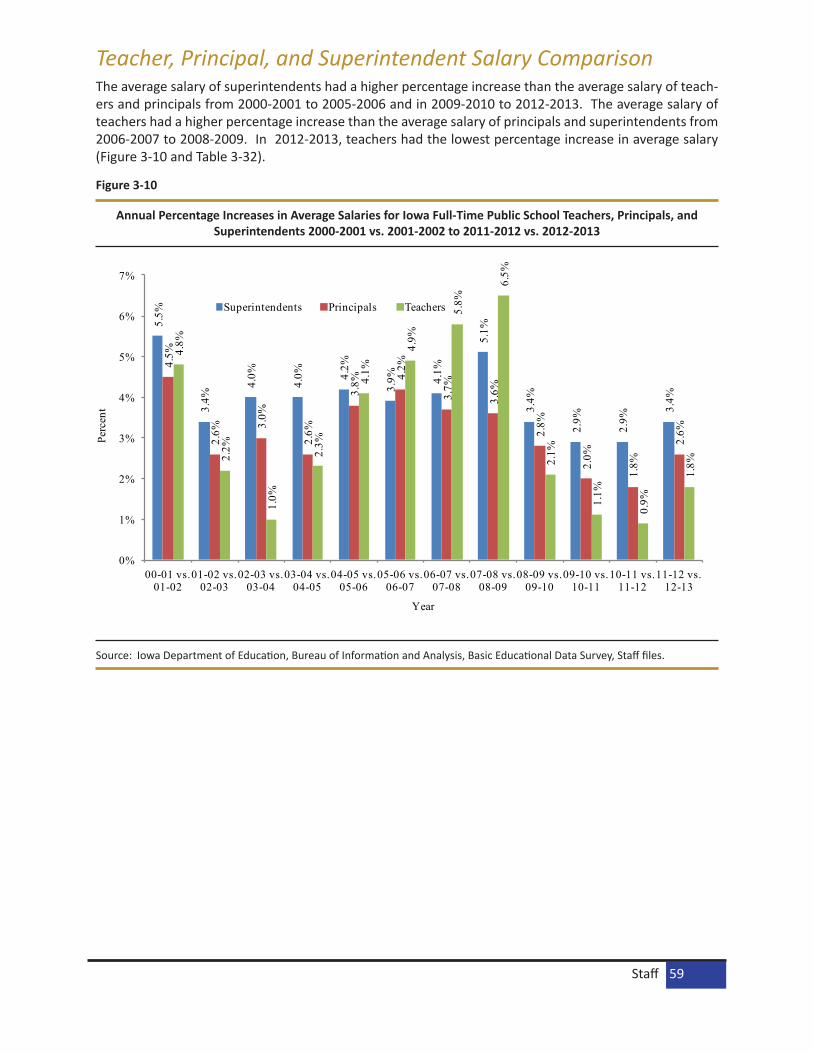
Teacher, Principal, and Superintendent Salary ComparisonThe average salary of superintendents had a higher percentage increase than the average salary of teach-ers and principals from 2000-2001 to 2005-2006 and in 2009-2010 to 2012-2013. The average salary of teachers had a higher percentage increase than the average salary of principals and superintendents from 2006-2007 to 2008-2009. In 2012-2013, teachers had the lowest percentage increase in average salary (Figure 3-10 and Table 3-32).
Figure 3-10
Annual Percentage Increases in Average Salaries for Iowa Full-Time Public School Teachers, Principals, and Superintendents 2000-2001 vs. 2001-2002 to 2011-2012 vs. 2012-2013
5.5%
3.4%
4.0%
4.0% 4.
2%
3.9% 4.
1%
5.1%
3.4%
2.9%
2.9%
3.4%
4.5%
2.6%
3.0%
2.6%
3.8%
4.2%
3.7%
3.6%
2.8%
2.0%
1.8%
2.6%
4.8%
2.2%
1.0%
2.3%
4.1%
4.9%
5.8%
6.5%
2.1%
1.1%
0.9%
1.8%
0%
1%
2%
3%
4%
5%
6%
7%
00-01 vs. 01-02
01-02 vs. 02-03
02-03 vs. 03-04
03-04 vs. 04-05
04-05 vs. 05-06
05-06 vs. 06-07
06-07 vs. 07-08
07-08 vs. 08-09
08-09 vs. 09-10
09-10 vs. 10-11
10-11 vs. 11-12
11-12 vs. 12-13
Perc
ent
Year
Superintendents Principals Teachers
Source: Iowa Department of Education, Bureau of Information and Analysis, Basic Educational Data Survey, Staff files.
Staff 59
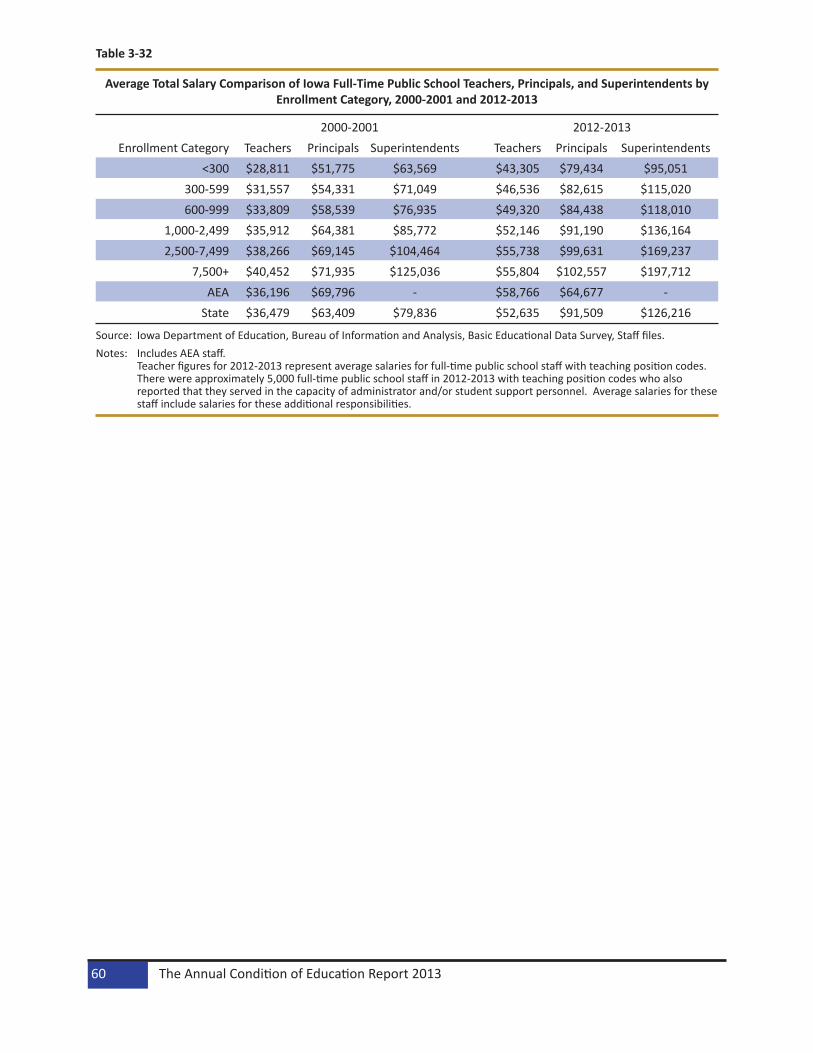
Table 3-32
Average Total Salary Comparison of Iowa Full-Time Public School Teachers, Principals, and Superintendents by Enrollment Category, 2000-2001 and 2012-2013
Source: Iowa Department of Education, Bureau of Information and Analysis, Basic Educational Data Survey, Staff files.Notes: Includes AEA staff.
Teacher figures for 2012-2013 represent average salaries for full-time public school staff with teaching position codes. There were approximately 5,000 full-time public school staff in 2012-2013 with teaching position codes who also reported that they served in the capacity of administrator and/or student support personnel. Average salaries for these staff include salaries for these additional responsibilities.
2000-2001 2012-2013Enrollment Category Teachers Principals Superintendents Teachers Principals Superintendents
<300 $28,811 $51,775 $63,569 $43,305 $79,434 $95,051300-599 $31,557 $54,331 $71,049 $46,536 $82,615 $115,020600-999 $33,809 $58,539 $76,935 $49,320 $84,438 $118,010
1,000-2,499 $35,912 $64,381 $85,772 $52,146 $91,190 $136,1642,500-7,499 $38,266 $69,145 $104,464 $55,738 $99,631 $169,237
7,500+ $40,452 $71,935 $125,036 $55,804 $102,557 $197,712AEA $36,196 $69,796 - $58,766 $64,677 -
State $36,479 $63,409 $79,836 $52,635 $91,509 $126,216
The Annual Condition of Education Report 201360

Public School Guidance CounselorsThe percent of female guidance counselors, the percent of minority guidance counselors, and the percent of guidance counselors with advanced degrees increased slightly between 2011-2012 and 2012-2013 (Table 3-33). All districts are required by Iowa Code (256.11) to have a guidance counselor who is licensed by the Board of Educational Examiners. Districts are able to share guidance counselors with another district. The percent of guidance counselors eligible to retire with combined age and years experience of 88 or more was 10.8 percent in 2012-2013 (Table 3-36). The average salary of guidance counselors increased by 1.4 percent between 2011-2012 and 2012-2013 (Table 3-37).
Table 3-33
Characteristics of Iowa Full-Time Public School Guidance Counselors, 2000-2001, 2011-2012 and 2012-2013
Source: Iowa Department of Education, Bureau of Information and Analysis, Basic Educational Data Survey, Staff files.Note: Does not include AEA staff.
Table 3-34
Full-Time and Part-Time Iowa Public School Guidance Counselors by Enrollment Category 2000-2001, 2011-2012 and 2012-2013
Source: Iowa Department of Education, Bureau of Information and Analysis, Basic Educational Data Survey, Staff files.Note: Does not include AEA staff.
Characteristics 2000-2001 2011-2012 2012-2013Average Age 46.4 44.5 44.1
Percent Female 64.2% 76.1% 77.4%Percent Minority 1.6% 2.5% 2.7%
Percent Advanced Degree 86.9% 85.7% 85.8%Average Total Experience 18.8 16.5 16.2
Average District Experience 12.1 10.4 10.3Number of Guidance Counselors 1,194 1,173 1,171
Number of Districts Full-Time Part-TimeEnrollment
Category2000-2001
2011-2012
2012-2013
2000-2001
2011-2012
2012-2013
2000-2001
2011-2012
2012-2013
<300 38 51 46 13 22 17 5 13 16300-599 116 107 108 129 132 135 15 10 10600-999 104 85 87 189 170 170 14 7 10
1,000-2,499 83 76 75 310 291 288 8 8 62,500-7,499 24 22 21 247 251 232 8 8 8
7,500+ 9 10 11 306 307 329 15 13 15State 374 351 348 1,194 1,173 1,171 65 59 65
Staff 61

Table 3-35
Iowa Full-Time Public School Guidance Counselor Age Distributions, 2000-2001 and 2012-2013
Source: Iowa Department of Education, Bureau of Information and Analysis, Basic Educational Data Survey, Staff files.Note: Does not include AEA staff.
Figure 3-11
Iowa Full-Time Public School Guidance Counselor Age Distributions, 2000-2001 and 2012-2013
0
50
100
150
200
250
300
25 and Under
26-30 31-35 36-40 41-45 46-50 51-55 56-60 61-65 Over 65
Num
ber o
f Gui
danc
e C
ouns
elor
s
Age
2000-20012012-2013
Source: Iowa Department of Education, Bureau of Information and Analysis, Basic Educational Data Survey, Staff files.Note: Does not include AEA staff.
2000-2001 2012-2013Age
IntervalNumber Cumulative
TotalPercent Cumulative
PercentNumber Cumulative
TotalPercent Cumulative
Percent25 and Under
4 4 0.3% 0.3% 21 21 1.8% 1.8%
26-30 80 84 6.7% 7.0% 132 153 11.3% 13.1%
31-35 96 180 8.0% 15.1% 158 311 13.5% 26.6%36-40 136 316 11.4% 26.5% 161 472 13.7% 40.3%41-45 145 461 12.1% 38.6% 180 652 15.4% 55.7%46-50 280 741 23.5% 62.1% 144 796 12.3% 68.0%51-55 283 1,024 23.7% 85.8% 159 955 13.6% 81.6%56-60 135 1,159 11.3% 97.1% 139 1,094 11.9% 93.4%61-65 29 1,188 2.4% 99.5% 67 1,161 5.7% 99.1%
Over 65 6 1,194 0.5% 100.0% 10 1,171 0.9% 100.0%
The Annual Condition of Education Report 201362

Table 3-36
Combined Age and Experience Distribution of Iowa Full-Time Public School Guidance Counselors 2000-2001 and 2012-2013
Source: Iowa Department of Education, Bureau of Information and Analysis, Basic Educational Data Survey, Staff files.Note: Does not include AEA staff.
Figure 3-12
Combined Age and Experience Distribution of Iowa Full-Time Public School Guidance Counselors 2000-2001 and 2012-2013
0
50
100
150
200
250
300
30 and Under 31-40 41-50 51-60 61-70 71-80 81-87 88+
Num
ber o
f Gui
danc
e C
ouns
elor
s
Combined Age and Experience
2000-2001
2012-2013
Source: Iowa Department of Education, Bureau of Information and Analysis, Basic Educational Data Survey, Staff files.Note: Does not include AEA staff.
2000-2001 2012-2013Combined Age and Experience Interval
Number Cumulative Total
Percent Cumulative Percent
Number Cumulative Total
Percent Cumulative Percent
30 and Under 25 25 2.1% 2.1% 77 77 6.6% 6.6%31-40 108 133 9.0% 11.1% 162 239 13.8% 20.4%41-50 135 268 11.3% 22.4% 193 432 16.5% 36.9%51-60 206 474 17.3% 39.7% 174 606 14.9% 51.8%61-70 209 683 17.5% 57.2% 164 770 14.0% 65.8%71-80 240 923 20.1% 77.3% 160 930 13.7% 79.4%81-87 159 1,082 13.3% 90.6% 114 1,044 9.7% 89.2%
88+ 112 1,194 9.4% 100.0% 127 1,171 10.8% 100.0%
Staff 63

Table 3-37
Average Total Salary of Iowa Full-Time Public School Guidance Counselors by Enrollment Category 2000-2001, 2011-2012 and 2012-2013
Source: Iowa Department of Education, Bureau of Information and Analysis, Basic Educational Data Survey, Staff files.Note: Does not include AEA staff.
Average Total Salary Percent Salary ChangeEnrollment Category 2000-2001 2011-2012 2012-2013 2000-2001 to
2012-20132011-2012 to
2012-2013<300 $33,912 $47,814 $47,226 39.3% -1.2%
300-599 $35,907 $50,454 $50,715 41.2% 0.5%600-999 $37,702 $52,614 $53,771 42.6% 2.2%
1,000-2,499 $41,062 $57,128 $57,817 40.8% 1.2%2,500-7,499 $44,628 $60,559 $62,096 39.1% 2.5%
7,500+ $46,886 $61,749 $62,038 32.3% 0.5%State $42,126 $57,492 $58,291 38.4% 1.4%
The Annual Condition of Education Report 201364

Public School Library/Media StaffLibrary/media staff members who are licensed through the Board of Educational Examiners have the posi-tion title of teacher librarian/media specialists. Districts are required by Iowa Code (256.11) to have a licensed library/media specialist. Districts are able to share library/media specialists with another district. There was a slight increase in the percent of minority library/media specialists, the percent of minority library/media specialists and the percent of library/media specialists with advanced degrees between 2011-2012 and 2012-2013 (Table 3-38). The number of full-time and part-time library/media specialists decreased while the number of part-time library/media specialists increased between 2011-2012 and 2012-2013 (Table 3-39). The average salary of library/media specialists increased by 1.8 percent between 2011-2012 and 2012-2013 (Table 3-40). Library/media associates are staff members that support the library/media specialists in the library/media center. Between 2011-2012 and 2012-2013, the number of library/media associates increased by 14.9 percent (Table 3-41).
Table 3-38
Characteristics of Iowa Full-Time Public School Licensed Library/Media Specialists 2000-2001, 2011-2012 and 2012-2013
Source: Iowa Department of Education, Bureau of Information and Analysis, Basic Educational Data Survey, Staff files.Note: Does not include AEA staff.
Table 3-39
Full-Time and Part-Time Iowa Public School Licensed Library/Media Specialists by Enrollment Category 2000-2001, 2011-2012 and 2012-2013
Source: Iowa Department of Education, Bureau of Information and Analysis, Basic Educational Data Survey, Staff files.Note: Does not include AEA staff.
Characteristics 2000-2001 2011-2012 2012-2013Average Age 48.5 48.9 48.1
Percent Female 90.6% 95.2% 94.8%Percent Minority 0.8% 0.4% 0.6%
Percent Advanced Degree 59.6% 59.8% 61.6%Average Total Experience 19.6 18.5 18.0
Average District Experience 14.3 12.7 12.5Number of Library/Media Specialists 636 503 485
Number of Districts Full-Time Part-TimeEnrollment
Category2000-2001
2011-2012
2012-2013
2000-2001
2011-2012
2012-2013
2000-2001
2011-2012
2012-2013
<300 38 51 46 8 17 12 11 12 12300-599 116 107 108 82 68 63 20 26 28600-999 104 85 87 107 64 68 8 9 9
1,000-2,499 83 76 75 174 112 106 9 6 72,500-7,499 24 22 21 134 118 105 3 2 3
7,500+ 9 10 11 131 124 131 7 5 9State 374 351 348 636 503 485 58 60 68
Staff 65
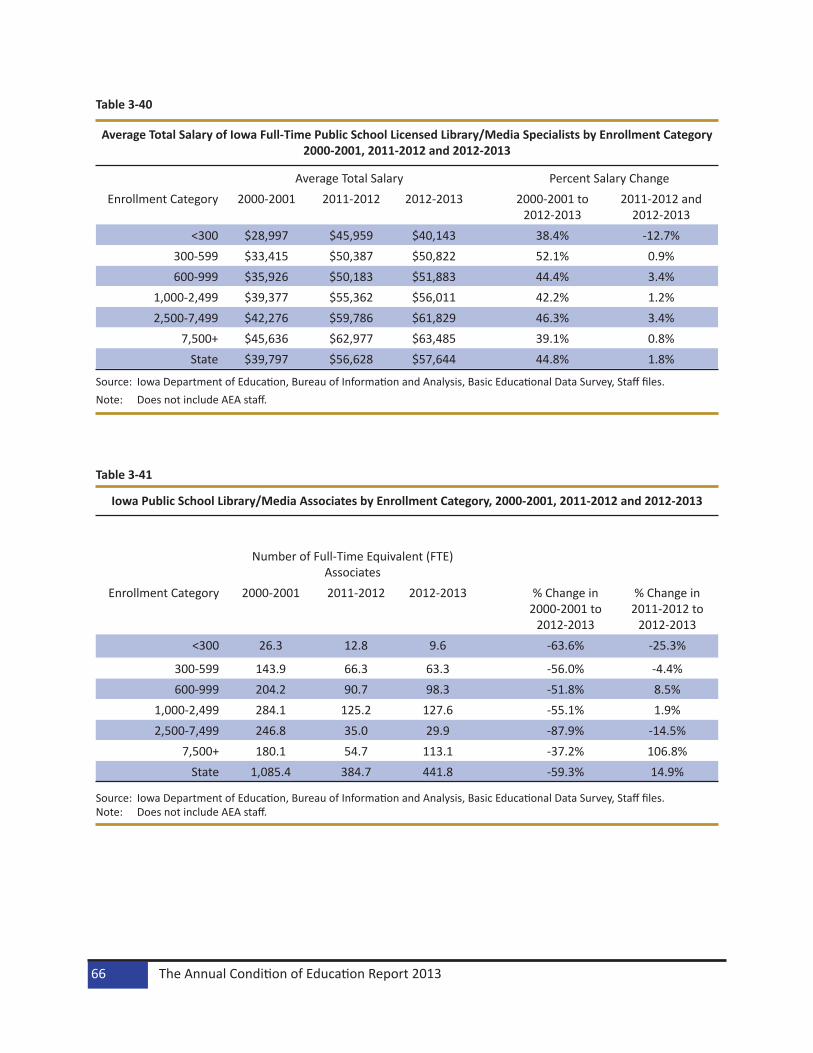
Table 3-40
Average Total Salary of Iowa Full-Time Public School Licensed Library/Media Specialists by Enrollment Category 2000-2001, 2011-2012 and 2012-2013
Source: Iowa Department of Education, Bureau of Information and Analysis, Basic Educational Data Survey, Staff files.Note: Does not include AEA staff.
Table 3-41
Iowa Public School Library/Media Associates by Enrollment Category, 2000-2001, 2011-2012 and 2012-2013
Source: Iowa Department of Education, Bureau of Information and Analysis, Basic Educational Data Survey, Staff files.Note: Does not include AEA staff.
Average Total Salary Percent Salary ChangeEnrollment Category 2000-2001 2011-2012 2012-2013 2000-2001 to
2012-20132011-2012 and
2012-2013<300 $28,997 $45,959 $40,143 38.4% -12.7%
300-599 $33,415 $50,387 $50,822 52.1% 0.9%600-999 $35,926 $50,183 $51,883 44.4% 3.4%
1,000-2,499 $39,377 $55,362 $56,011 42.2% 1.2%2,500-7,499 $42,276 $59,786 $61,829 46.3% 3.4%
7,500+ $45,636 $62,977 $63,485 39.1% 0.8%State $39,797 $56,628 $57,644 44.8% 1.8%
Number of Full-Time Equivalent (FTE) Associates
Enrollment Category 2000-2001 2011-2012 2012-2013 % Change in 2000-2001 to
2012-2013
% Change in 2011-2012 to
2012-2013<300 26.3 12.8 9.6 -63.6% -25.3%
300-599 143.9 66.3 63.3 -56.0% -4.4%600-999 204.2 90.7 98.3 -51.8% 8.5%
1,000-2,499 284.1 125.2 127.6 -55.1% 1.9%2,500-7,499 246.8 35.0 29.9 -87.9% -14.5%
7,500+ 180.1 54.7 113.1 -37.2% 106.8%State 1,085.4 384.7 441.8 -59.3% 14.9%
The Annual Condition of Education Report 201366

Area Education Agency (AEA) Licensed StaffThere were nine area education agencies (AEAs) in Iowa in 2012-2013. The personnel in AEAs develop and provide programs, services, leadership in school improvement, professional development, emerging educational practices, school-community planning, curriculum, special education, school technology, and media services to school districts in the state. As seen in Table 3-42, the percent of female AEA staff and the percent of AEA staff with advanced degrees has increased and the percent of minority AEA staff has increased between 2011-2012 and 2012-2013. The average salary of AEA staff has increased by 3.8 percent between 2011-2012 and 2012-2013. Almost half of the AEA staff in 2012-2013 held a Special Education Support position (Table 3-43).
Table 3-42
Characteristics of Iowa Full-Time Licensed AEA Staff 2000-2001, 2011-2012 and 2012-2013
Source: Iowa Department of Education, Bureau of Information and Analysis, Basic Educational Data Survey, Staff files.
Characteristics 2000-2001 2011-2012 2012-2013Average Age 44.8 46.4 46.2
Percent Female 77.3% 88.0% 88.9%Percent Minority 1.0% 0.0% 1.9%
Percent Advanced Degree 79.4% 85.1% 87.2%Average Total Experience 17.2 18.9 18.7
Average Number of Contract Days
197.3 196.6 197.2
Average Total Salary $44,351 $63,720 $66,173Number of AEA Staff 2,225 2,226 2,164
Staff 67

Table 3-43
Number of Full-Time AEA Licensed Staff by Position, 2012-2013
Source: Iowa Department of Education, Bureau of Information and Analysis, Basic Educational Data Survey, Staff files.Note: Figures may not total 100 percent due to rounding.
Position Number PercentAEA Chief Administrator 9 0.4%
AEA Zone/Regional Coordinator 65 3.0%Content/Curriculum Consultant 194 9.0%Coordinator/Department Head 30 1.4%
Counselor 3 0.1%Early Childhood Special Education 72 3.3%
Home Intervention Teacher 46 2.1%Hospital/Homebound Teacher 1 0.0%
Itinerant Teacher 59 2.7%Nurse (SPR on file with BOEE) 9 0.4%
Other Administrator 22 1.0%Principal 1 0.0%
Regular Education Teacher 17 0.8%School Business Official 5 0.2%
Social Worker 108 5.0%Special Education Support 1,075 49.7%
Special Education Consultant 285 13.2%Special Education Director 7 0.3%Special Education Teacher 123 5.7%
Specialist 16 0.7%Superintendent 1 0.0%
Supervisor 9 0.4%Teacher Librarian/Media Specialist 7 0.3%
Total 2,164 100.0%
The Annual Condition of Education Report 201368

Licensed Staff State TotalsTable 3-44 shows the distribution of public and nonpublic school licensed staff by AEA in 2012-2013. AEA 267 had the highest percent of districts. However, Heartland AEA had the highest percent of public school and nonpublic school licensed staff. Mississippi Bend AEA had the lowest percent of districts. Keystone AEA had the lowest percent of public school licensed staff and Green Hills AEA had the lowest percent of nonpublic school licensed staff.
Table 3-44
Distribution of Iowa Public and Nonpublic School Total Full-Time Licensed Staff by AEA, 2012-2013
Source: Iowa Department of Education, Bureau of Information and Analysis, Basic Educational Data Survey, Staff files.Notes: AEA full-time licensed staff are included.
Figures may not total 100 percent due to rounding.
Districts Public School Licensed Staff Nonpublic School Licensed StaffAEA Number Percent Number Percent Number Percent
Keystone 1 24 6.9% 2,584 6.3% 372 14.7%
AEA 267 57 16.4% 5,600 13.7% 266 10.5%
Prairie Lakes 8 44 12.6% 2,681 6.6% 194 7.6%Mississippi Bend 9 22 6.3% 3,981 9.8% 226 8.9%
Grant Wood 10 32 9.2% 5,525 13.6% 337 13.3%Heartland 11 53 15.2% 10,603 26.0% 558 22.0%
Northwest 12 35 10.1% 3,228 7.9% 402 15.8%Green Hills 13 48 13.8% 3,475 8.5% 87 3.4%
Great Prairie 15 33 9.5% 3,069 7.5% 95 3.7%State 348 100.0% 40,746 100.0% 2,537 100.0%
Staff 69

Public School NursesIowa Code (256.11) requires each school district to have a nurse that is licensed by the Board of Nursing. Some districts share a nurse with another district or contract out for nurses. Registered Nurses are licensed by the Board of Nursing, have a baccalaureate degree, have a statement of professional recogni-tion (SPR) issued by the Board of Educational Examiners (BOEE), and are reported as licensed staff on the Fall BEDS staff collection. Registered Nurses that are licensed by the Board of Nursing have an associate degree or diploma, may practice in a school district, but they do not qualify for a school nurse SPR. These nurses are reported as non-licensed staff on the Fall BEDS staff collection. The nurse full-time equivalent (FTE) counts listed in Table 3-45 include nurses with a SPR and nurses without a SPR. The number of FTE nurses in the smallest and the 2,500-7,499 enrollment categories decreased while the number of FTE nurses in the state increased slightly between 2011-2012 and 2012-2013.
Table 3-45
Iowa Public School Nurse FTE by Enrollment Category, 2011-2012 and 2012-2013
Source: Iowa Department of Education, Bureau of Information and Analysis, Basic Educational Data Survey, Staff file.Note: Does not include AEA staff. Every district is required to have a nurse. Some districts may share with another district.
Does not include nurses contracted out.
Enrollment Category 2011-2012 2012-2013 % Change in FTE Nurses 2011-2012 to 2012-2013<300 18.3 14.2 -22.1%
300-599 76.3 80.5 5.6%600-999 82.3 86.9 5.6%
1,000-2,499 134.6 140.1 4.0%2,500-7,499 112.9 101.5 -10.1%
7,500+ 145.7 154.6 6.1%State 570.1 577.8 1.4%
The Annual Condition of Education Report 201370
The Relationship Between Student Achievement and Teacher Retention in Iowa Schools Abstract – The rewards and challenges that impact teacher choices to stay or leave are filled with con-founding variables. This post-hoc study was implemented to more fully understand the dynamics sur-rounding teacher retention in Iowa schools. The findings promote the need for school improvement efforts to support teachers in improving student achievement.
Background – Educational research about teacher retention is often general rather than focused, as individuals pursue an assortment of questions and hypotheses, using both qualitative and quantitative methods and a variety of concepts and measures. Little empirical evidence for a direct effect of teacher turnover on student achievement is found in the literature. Most existing research on the relationship between teacher turnover and student achievement suggests negative correlations. Such evidence, though, is not necessarily causal, as a third factor (e.g., poverty, working conditions, or poor school leadership) may simultaneously cause both low achievement and higher turnover. Poor district support, unsupportive building leadership, too little time for planning and collaboration, accountability pressures and lack of parent involvement were listed among the top reasons teachers gave for leaving (Futernick, 2007). Even if we assume the relationship is a causal one, its direction is unclear as teachers leaving may cause low achievement, but low achievement may also cause teachers to leave.
Johnson, Berg, and Donaldson (2005) completed a literature review focusing on the issue of teacher re-tention in U.S. public schools. Their research suggests that teacher decisions to remain in a school and in teaching are influenced by a combination of the intrinsic and extrinsic rewards that they receive in their work. They found that teacher preparation programs, hiring practices, compensation, working conditions (facilities, equipment, and supplies, teaching assignments, and curriculum, standards, and accountabil-ity), and school community (colleagues, school leaders, parents and students) are all potential factors in the decision to stay or to leave a particular school or the profession as a whole.
In their study of New York City 4th and 5th grade students over 10 years, Ronfeldt, Loeb, and Wyckoff (2012) found evidence of a direct effect of teacher turnover on student achievement. Results demon-strate that teacher turnover has a significant and negative effect on student achievement in both math-ematics and English language arts (ELA). They also found that teacher turnover is particularly harmful to the achievement of students in schools with large populations of low-performing and black students.Contrast this with Hanushek and Rivkin’s (2010) study in Texas. They found that schools with high con-centrations of low income, low achieving, and heavily minority populations often experience a great deal of teacher turnover, but the evidence does not support the view that teacher exits adversely affect the quality of education in such schools.
Method – This study explores school level teacher retention in Iowa related to school performance on the Iowa Assessments during the five-year period from the 2008-2009 school year through the 2012-2013 school year. While percent at or above proficient is measuring performance only at one cut point on the scale, it was chosen because of its wide use in school improvement efforts across the state. Teacher information was obtained from the Iowa Basic Educational Data Survey (BEDS) from 2008-2009 through 2012-2013. The study only included staff classified as “teachers” for at least part of their annual assignment. Administrators and other staff members were not included. Student performance data were obtained from the Annual Yearly Progress files for 2009 and 2013. Schools were included who assessed more than 10 students with the Iowa Assessments during 2009 and 2013. Twelve hundred Iowa schools met this requirement and were included. Note that the form of the Iowa Assessment administered to students in Iowa changed from 2009 to 2013. The assessment administered in 2009 was Form B and in
Staff 71
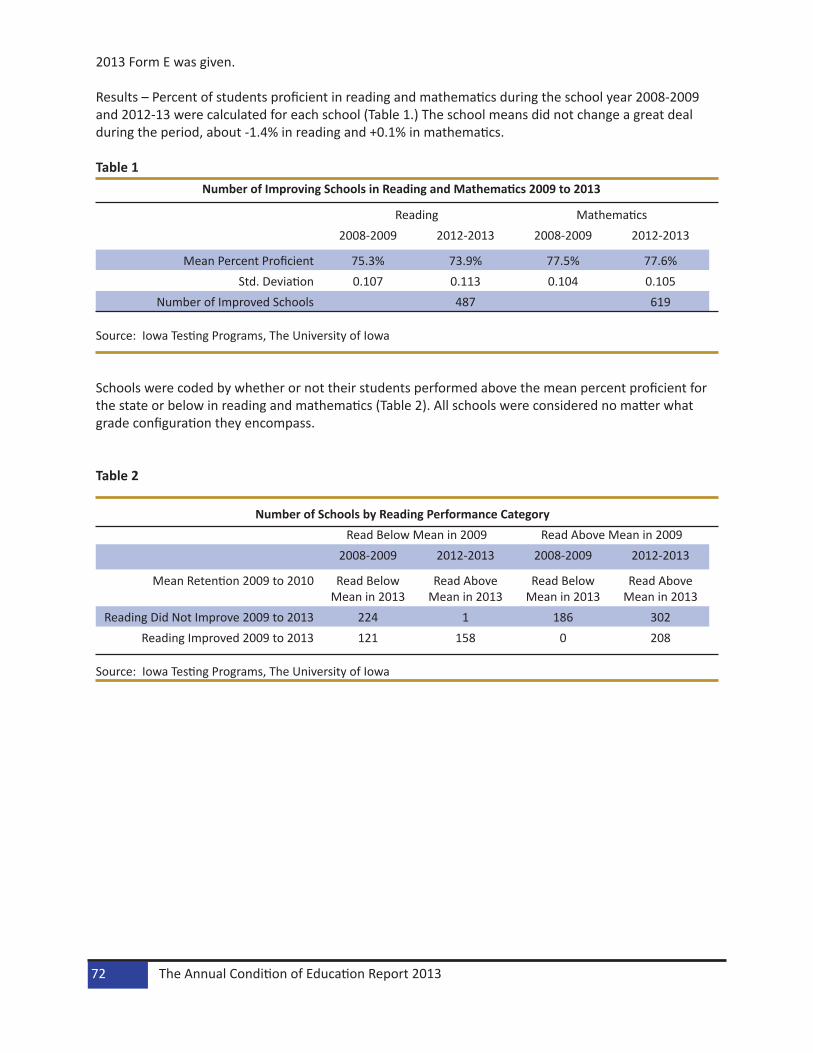
2013 Form E was given.
Results – Percent of students proficient in reading and mathematics during the school year 2008-2009 and 2012-13 were calculated for each school (Table 1.) The school means did not change a great deal during the period, about -1.4% in reading and +0.1% in mathematics.
Table 1Number of Improving Schools in Reading and Mathematics 2009 to 2013
Reading Mathematics2008-2009 2012-2013 2008-2009 2012-2013
Mean Percent Proficient 75.3% 73.9% 77.5% 77.6%Std. Deviation 0.107 0.113 0.104 0.105
Number of Improved Schools 487 619
Source: Iowa Testing Programs, The University of Iowa
Schools were coded by whether or not their students performed above the mean percent proficient for the state or below in reading and mathematics (Table 2). All schools were considered no matter what grade configuration they encompass.
Table 2
Number of Schools by Reading Performance CategoryRead Below Mean in 2009 Read Above Mean in 2009
2008-2009 2012-2013 2008-2009 2012-2013
Mean Retention 2009 to 2010 Read Below Mean in 2013
Read Above Mean in 2013
Read Below Mean in 2013
Read Above Mean in 2013
Reading Did Not Improve 2009 to 2013 224 1 186 302Reading Improved 2009 to 2013 121 158 0 208
Source: Iowa Testing Programs, The University of Iowa
The Annual Condition of Education Report 201372
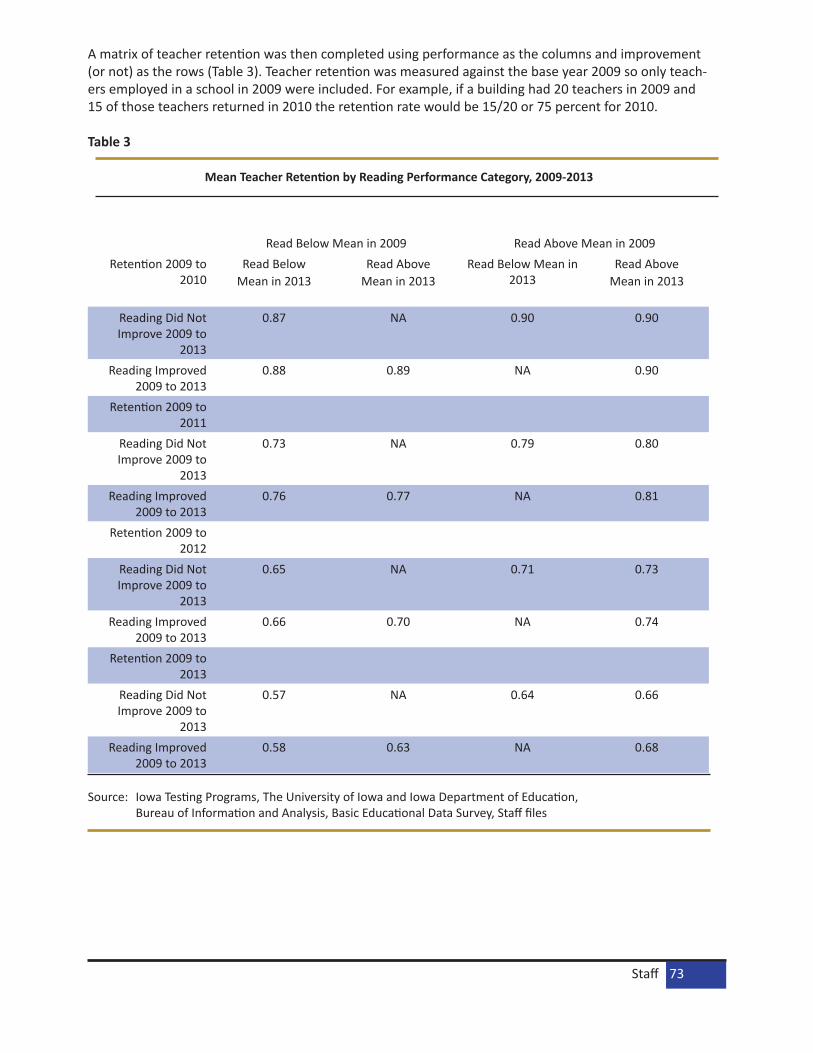
A matrix of teacher retention was then completed using performance as the columns and improvement (or not) as the rows (Table 3). Teacher retention was measured against the base year 2009 so only teach-ers employed in a school in 2009 were included. For example, if a building had 20 teachers in 2009 and 15 of those teachers returned in 2010 the retention rate would be 15/20 or 75 percent for 2010.
Table 3
Mean Teacher Retention by Reading Performance Category, 2009-2013
Read Below Mean in 2009 Read Above Mean in 2009Retention 2009 to
2010Read Below
Mean in 2013Read Above
Mean in 2013Read Below Mean in
2013Read Above
Mean in 2013
Reading Did Not Improve 2009 to
2013
0.87 NA 0.90 0.90
Reading Improved 2009 to 2013
0.88 0.89 NA 0.90
Retention 2009 to 2011
Reading Did Not Improve 2009 to
2013
0.73 NA 0.79 0.80
Reading Improved 2009 to 2013
0.76 0.77 NA 0.81
Retention 2009 to 2012
Reading Did Not Improve 2009 to
2013
0.65 NA 0.71 0.73
Reading Improved 2009 to 2013
0.66 0.70 NA 0.74
Retention 2009 to 2013
Reading Did Not Improve 2009 to
2013
0.57 NA 0.64 0.66
Reading Improved 2009 to 2013
0.58 0.63 NA 0.68
Source: Iowa Testing Programs, The University of Iowa and Iowa Department of Education, Bureau of Information and Analysis, Basic Educational Data Survey, Staff files
Staff 73
Schools that scored above the mean in 2009 and again in 2013 and also improved their percent profi-cient from 2009 to 2013 had the highest teacher retention rate each year (68% over the five-year pe-riod). Conversely, schools that scored below the mean in 2009 and again in 2013 and did not improve their percent proficient from 2009 to 2013 recorded the lowest teacher retention rate (57% over the five years). Schools that improved their mean reading score from 2009 to 2013 had fewer turnovers each year regardless of what the student mean score was in 2009.
Discussion – The data indicate that schools that are improving, especially those that improve or stay above the state average, have less teacher turnover than other schools. This trend persists when high poverty schools with greater than 40 percent of their students eligible for free or reduced price lunch are compared with their more affluent counterparts. The trend also persists at all grade levels: elementary, middle, and high schools all revealed similar results.
The data suggest that school improvement efforts toward student achievement may also improve teach-er retention. While more study is needed, it appears that teacher turnover in Iowa is driven to an extent by student performance, but confounding factors also play a role including poverty level within a school. Additional study is needed including consideration of leadership, professional development, location, and experience levels of teachers.
ReferencesFuternick, K. (2007). A possible dream: Retaining California teachers so all students learn. Retrieved from: http://www.calstate.edu/teacherquality/documents/possible_dream.pdf
Hanushek, E.A. and Rivkin, S.G. (2010). Constrained job matching: Does teacher job search harm disad-vantaged urban schools? National Bureau of Economic Research, Cambridge: MA. Retrieved from: http://www.nctq.org/docs/Hanushek_and_Rivkin_Paper%283%29.pdf
Johnson, S.M., Berg, J.H., & Donaldson, M.L. (2005). Who stays in teaching and why: A review of the literature on teacher retention. Cambridge, MA: Harvard Graduate School of Education. Retrieved December 5, 2010 from http://assets.aarp.org/www.aarp.org_/articles/NRTA/Harvard_report.pdf
Ronfeldt, M., Loeb, S. and Wyckoff, J. (2012). How teacher turnover harms student achievement. Re-trieved from: http://www.caldercenter.org/publications/upload/Ronfeldt-et-al.pdf
Dianne Chadwick, Ed.D., Administrative Consultant Bureau of Information and Analysis Services, Author
The Annual Condition of Education Report 201374

Staff 75
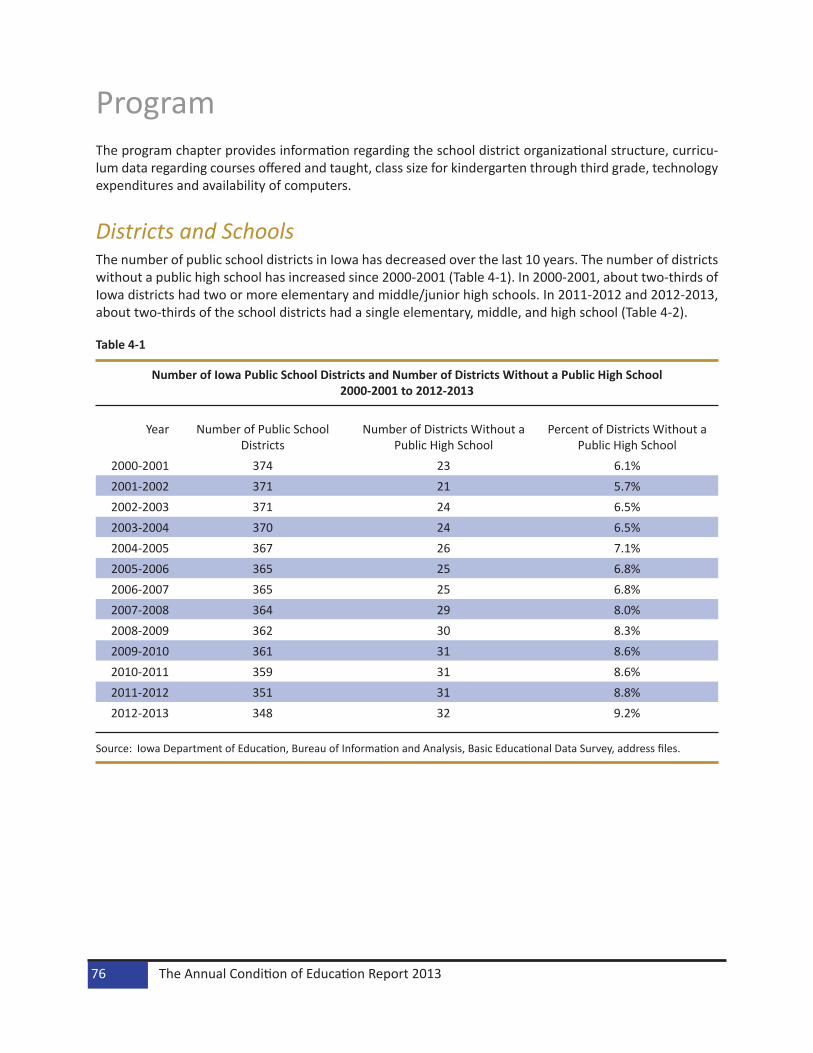
ProgramThe program chapter provides information regarding the school district organizational structure, curricu-lum data regarding courses offered and taught, class size for kindergarten through third grade, technology expenditures and availability of computers.
Districts and SchoolsThe number of public school districts in Iowa has decreased over the last 10 years. The number of districts without a public high school has increased since 2000-2001 (Table 4-1). In 2000-2001, about two-thirds of Iowa districts had two or more elementary and middle/junior high schools. In 2011-2012 and 2012-2013, about two-thirds of the school districts had a single elementary, middle, and high school (Table 4-2).
Table 4-1
Number of Iowa Public School Districts and Number of Districts Without a Public High School 2000-2001 to 2012-2013
Source: Iowa Department of Education, Bureau of Information and Analysis, Basic Educational Data Survey, address files.
Year Number of Public School Districts
Number of Districts Without a Public High School
Percent of Districts Without a Public High School
2000-2001 374 23 6.1%2001-2002 371 21 5.7%2002-2003 371 24 6.5%2003-2004 370 24 6.5%2004-2005 367 26 7.1%2005-2006 365 25 6.8%2006-2007 365 25 6.8%2007-2008 364 29 8.0%2008-2009 362 30 8.3%2009-2010 361 31 8.6%2010-2011 359 31 8.6%2011-2012 351 31 8.8%2012-2013 348 32 9.2%
The Annual Condition of Education Report 201376
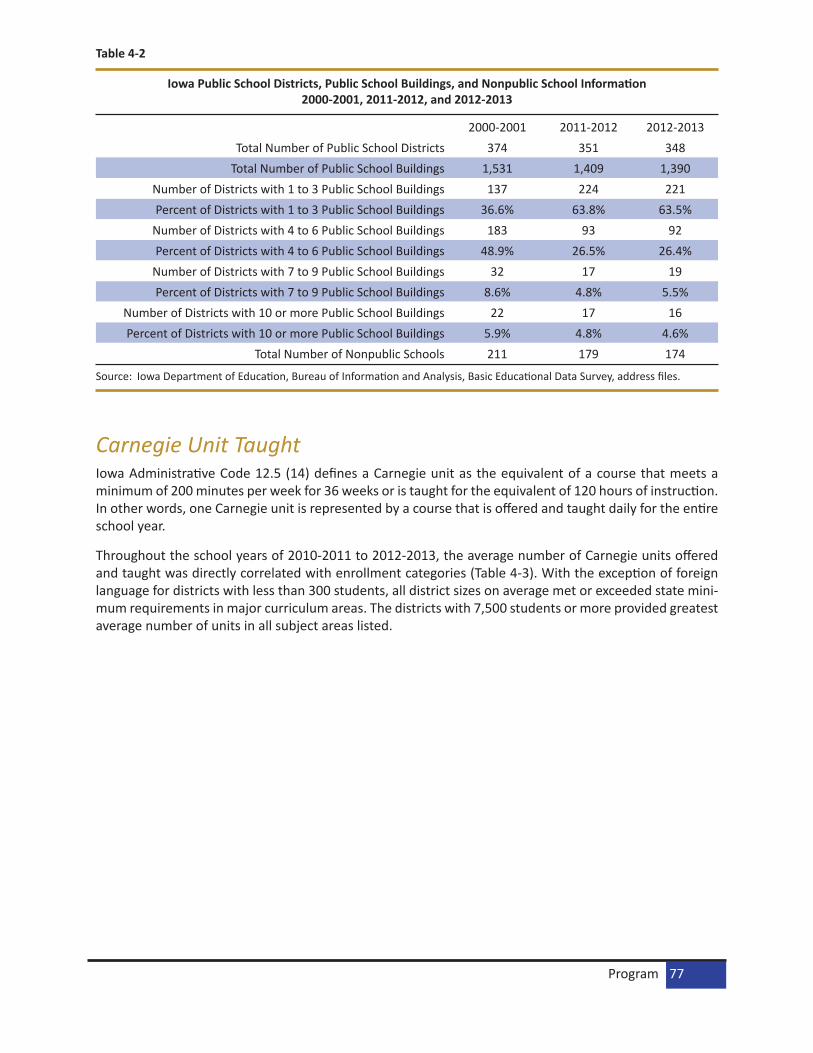
Table 4-2
Iowa Public School Districts, Public School Buildings, and Nonpublic School Information 2000-2001, 2011-2012, and 2012-2013
Source: Iowa Department of Education, Bureau of Information and Analysis, Basic Educational Data Survey, address files.
Carnegie Unit TaughtIowa Administrative Code 12.5 (14) defines a Carnegie unit as the equivalent of a course that meets a minimum of 200 minutes per week for 36 weeks or is taught for the equivalent of 120 hours of instruction. In other words, one Carnegie unit is represented by a course that is offered and taught daily for the entire school year.
Throughout the school years of 2010-2011 to 2012-2013, the average number of Carnegie units offered and taught was directly correlated with enrollment categories (Table 4-3). With the exception of foreign language for districts with less than 300 students, all district sizes on average met or exceeded state mini-mum requirements in major curriculum areas. The districts with 7,500 students or more provided greatest average number of units in all subject areas listed.
2000-2001 2011-2012 2012-2013Total Number of Public School Districts 374 351 348
Total Number of Public School Buildings 1,531 1,409 1,390Number of Districts with 1 to 3 Public School Buildings 137 224 221Percent of Districts with 1 to 3 Public School Buildings 36.6% 63.8% 63.5%
Number of Districts with 4 to 6 Public School Buildings 183 93 92Percent of Districts with 4 to 6 Public School Buildings 48.9% 26.5% 26.4%
Number of Districts with 7 to 9 Public School Buildings 32 17 19Percent of Districts with 7 to 9 Public School Buildings 8.6% 4.8% 5.5%
Number of Districts with 10 or more Public School Buildings 22 17 16Percent of Districts with 10 or more Public School Buildings 5.9% 4.8% 4.6%
Total Number of Nonpublic Schools 211 179 174
Program 77

Table 4-3
Average Curriculum Units Offered and Taught by Accreditation Area and District Enrollment Category 2010-2011 to 2012-2013
Source: Iowa Department of Education, Bureau of Information and Analysis. SRI, Archived Course Group, winter files. Enroll-ment categories are defined by Certified Enrollment.
Enrollment CategoryState
Standards<300 300-599 600-999 1,000-
2,4992,500-7,499
7,500+ State
Minimum Units
2010-2011Number of
Districts32 106 80 77 22 10 327
English/Language Arts
6 6.52 6.92 7.15 8.64 12.64 18.32 8.07
Mathematics 6 7.08 7.52 7.98 8.80 10.81 13.91 8.31 Science 5 5.81 6.22 6.64 7.18 9.90 14.73 7.02
Social Studies 5 5.18 5.31 5.49 6.27 8.74 14.12 6.07 Foreign Language 4 3.48 4.08 4.26 5.41 10.05 15.31 5.12
Fine Arts 3 5.12 5.72 5.57 7.52 12.64 18.79 7.16
2011-2012Number of
Districts27 100 85 76 22 10 320
English/Language Arts
6 6.37 6.89 7.22 8.35 12.45 17.15 7.99
Mathematics 6 6.91 7.50 7.99 8.65 10.04 13.17 8.21 Science 5 5.57 6.22 6.56 7.22 9.42 12.99 6.93
Social Studies 5 5.09 5.29 5.38 6.10 9.31 12.72 6.00 Foreign Language 4 3.50 4.06 4.23 5.47 10.33 15.78 5.19
Fine Arts 3 5.18 5.64 6.53 7.56 12.27 18.23 7.14
2012-2013Number of
Districts23 99 87 75 21 11 316
English/Language Arts
6 6.35 6.96 7.16 8.39 12.19 15.66 7.96
Mathematics 6 6.83 7.39 8.01 8.55 9.73 12.66 8.14 Science 5 5.59 6.31 6.62 7.24 9.63 11.87 6.98
Social Studies 5 4.93 5.50 5.40 6.06 9.30 11.99 6.04 Foreign Language 4 3.59 4.07 4.16 5.36 9.98 15.74 5.16
Fine Arts 3 4.98 5.79 6.43 7.70 11.97 16.80 7.15
The Annual Condition of Education Report 201378
Enrollments in Foreign Language, Algebra II, Higher-Level Mathematics, and Higher-Level Science Courses
The Iowa Department of Education started to collect course-taken data at the student level through SRI (EASIER) in 2004-2005. Along with the Iowa Student State ID System, SRI can track a high school student’s course-taken from 9th grade to 12th grade. A real four-year course-taken pattern has been available for the Annual Condition of Education Report since 2008. Tables 4-4 to 4-9 describe Iowa public high school four-year enrollment in foreign language, Algebra II, higher-level mathematics (pre-calculus, calculus, sta-tistics, trigonometry, advanced placement mathematics, and other specific courses identified as advanced mathematics), and higher-level science (chemistry and physics) courses for the graduating class of 2013. The course enrollments only include the students who enrolled in Iowa public high schools in each of the last four years. Each table shows non-duplicate enrollment at the state level and by district enrollment category. Gender comparisons are reported by subject areas.
Table 4-4 examines foreign language course enrollment in Iowa public high schools for the 2013 graduating class. Overall, 83 percent or more of the students in the graduating class of 2013 took at least one foreign language course between 2009-2010 and 2012-2013. The female enrollment in foreign languages was higher than male enrollment. The percent of students enrolled in foreign language courses was higher for the districts with enrollment above 1,000 than the districts in the smaller enrollment categories.
Over 27,000 of the students in the graduating class of 2013 took at least one foreign language course, more than 23,500 of them took Spanish (Table 4-5). Six other major languages French, German, Japanese, Chinese, Italian, and Russian, along with other foreign languages were taken by 5,352 students in that class. The enrollment in Table 4-5 can be duplicated if a student took courses in more than one language. However, one student is only counted once if his or her course taken was in one language at different levels.
Table 4-6 shows the Algebra II course taken for the graduating class of 2013 by enrollment category. The total percent of the students who took Algebra II was 60.0. The female enrollment in Algebra II was higher than males. The districts with enrollments less than 1,000 had higher enrollment in Algebra II.
Higher–level mathematics courses include pre-calculus, calculus, trigonometry, statistics, advanced place-ment mathematics, and other specific courses identified as advanced mathematics. A total of 13,247 students (40.2 percent) in the 2013 class took one or more higher-level mathematics courses. The female enrollment in higher-level mathematics was about 3.5 percent higher than male enrollment. The percent of students enrolled in higher-level mathematics courses were higher for the districts with enrollment between 1,000 and 7,499 than the districts in other enrollment categories (Table 4-7).
Table 4-8 shows the chemistry course taken data by enrollment category and by gender for the graduat-ing class of 2013. Generally speaking, female students had 10 percent more in chemistry or advanced chemistry enrollment than male students. The data indicate that the greatest percent of students enrolled in chemistry courses are from districts with enrollments of 2,500-7,499.
About 27 percent of the students took physics and advanced physics for the 2013 class (Table 4-9). The highest percentages of physics enrollment were in the districts with enrollment more than 7,500 students. Female physics enrollment was 7.1 percent less than the male enrollment for this class.
Program 79
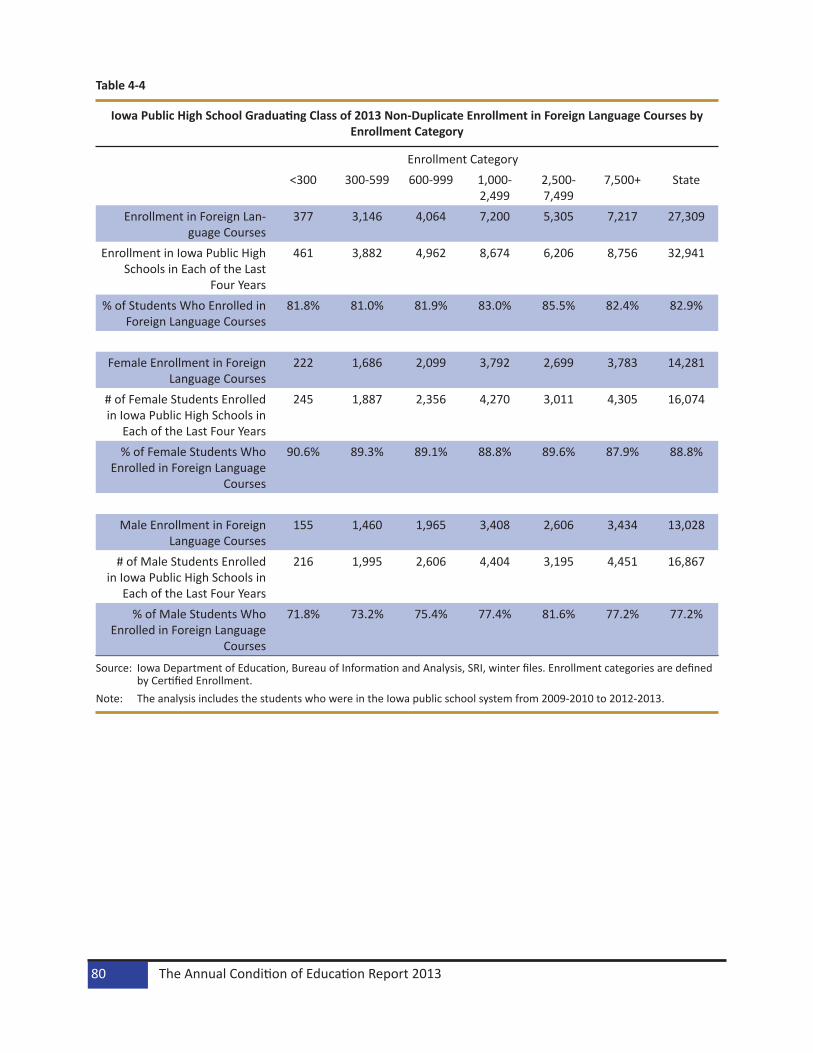
Table 4-4
Iowa Public High School Graduating Class of 2013 Non-Duplicate Enrollment in Foreign Language Courses by Enrollment Category
Source: Iowa Department of Education, Bureau of Information and Analysis, SRI, winter files. Enrollment categories are defined by Certified Enrollment.
Note: The analysis includes the students who were in the Iowa public school system from 2009-2010 to 2012-2013.
Enrollment Category<300 300-599 600-999 1,000-
2,4992,500-7,499
7,500+ State
Enrollment in Foreign Lan-guage Courses
377 3,146 4,064 7,200 5,305 7,217 27,309
Enrollment in Iowa Public High Schools in Each of the Last
Four Years
461 3,882 4,962 8,674 6,206 8,756 32,941
% of Students Who Enrolled in Foreign Language Courses
81.8% 81.0% 81.9% 83.0% 85.5% 82.4% 82.9%
Female Enrollment in Foreign Language Courses
222 1,686 2,099 3,792 2,699 3,783 14,281
# of Female Students Enrolled in Iowa Public High Schools in
Each of the Last Four Years
245 1,887 2,356 4,270 3,011 4,305 16,074
% of Female Students Who Enrolled in Foreign Language
Courses
90.6% 89.3% 89.1% 88.8% 89.6% 87.9% 88.8%
Male Enrollment in Foreign Language Courses
155 1,460 1,965 3,408 2,606 3,434 13,028
# of Male Students Enrolled in Iowa Public High Schools in
Each of the Last Four Years
216 1,995 2,606 4,404 3,195 4,451 16,867
% of Male Students Who Enrolled in Foreign Language
Courses
71.8% 73.2% 75.4% 77.4% 81.6% 77.2% 77.2%
The Annual Condition of Education Report 201380

Table 4-5
Foreign Language Enrollment of Iowa Public High School Graduating Class of 2013 by Language
Source: Iowa Department of Education, Bureau of Information and Analysis, SRI, winter files. Note: A student will be counted once if he/she enrolled in more than one course for the same language and will be counted
more than once if he/she enrolled in courses for different languages in the last four years.
Language Enrollment Percent
Spanish 23,534 81.5%French 2,749 9.5%
German 1,418 4.9%Japanese 202 0.7%
Chinese 153 0.5%Italian 74 0.3%
Russian 11 0.0%Other Foreign Language 745 2.6%
Program 81
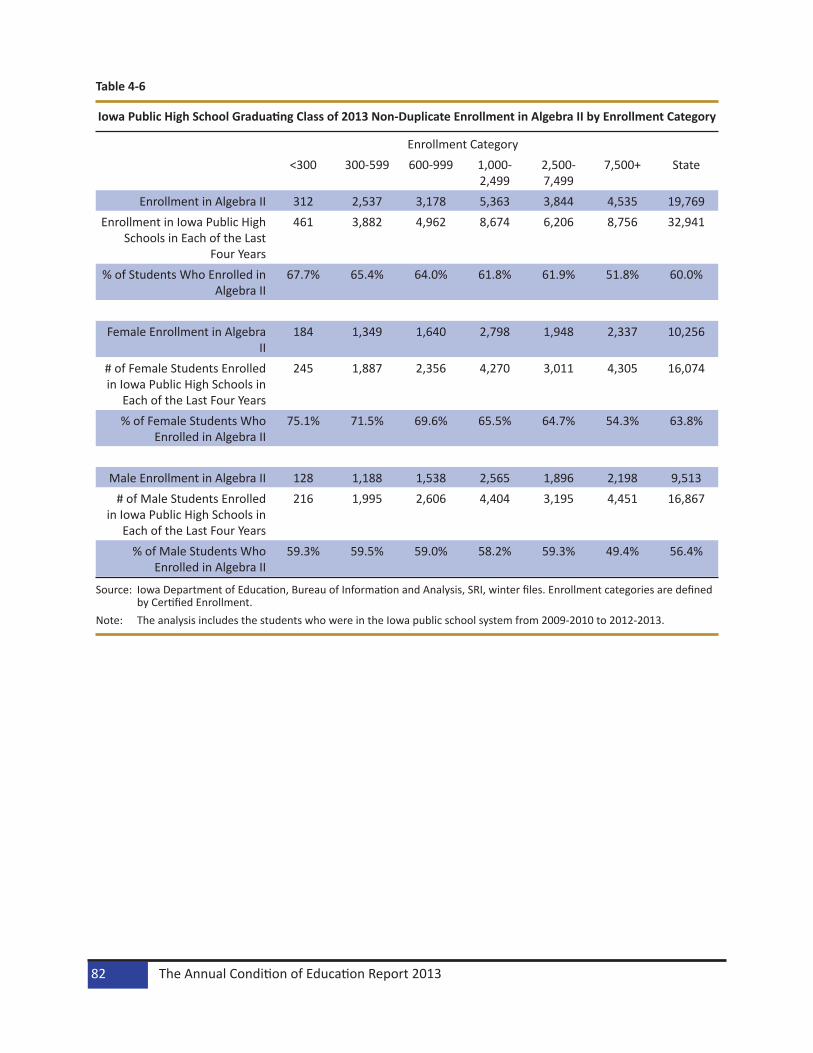
Table 4-6
Iowa Public High School Graduating Class of 2013 Non-Duplicate Enrollment in Algebra II by Enrollment Category
Source: Iowa Department of Education, Bureau of Information and Analysis, SRI, winter files. Enrollment categories are defined by Certified Enrollment.
Note: The analysis includes the students who were in the Iowa public school system from 2009-2010 to 2012-2013.
Enrollment Category<300 300-599 600-999 1,000-
2,4992,500-7,499
7,500+ State
Enrollment in Algebra II 312 2,537 3,178 5,363 3,844 4,535 19,769Enrollment in Iowa Public High
Schools in Each of the Last Four Years
461 3,882 4,962 8,674 6,206 8,756 32,941
% of Students Who Enrolled in Algebra II
67.7% 65.4% 64.0% 61.8% 61.9% 51.8% 60.0%
Female Enrollment in Algebra II
184 1,349 1,640 2,798 1,948 2,337 10,256
# of Female Students Enrolled in Iowa Public High Schools in
Each of the Last Four Years
245 1,887 2,356 4,270 3,011 4,305 16,074
% of Female Students Who Enrolled in Algebra II
75.1% 71.5% 69.6% 65.5% 64.7% 54.3% 63.8%
Male Enrollment in Algebra II 128 1,188 1,538 2,565 1,896 2,198 9,513# of Male Students Enrolled
in Iowa Public High Schools in Each of the Last Four Years
216 1,995 2,606 4,404 3,195 4,451 16,867
% of Male Students Who Enrolled in Algebra II
59.3% 59.5% 59.0% 58.2% 59.3% 49.4% 56.4%
The Annual Condition of Education Report 201382
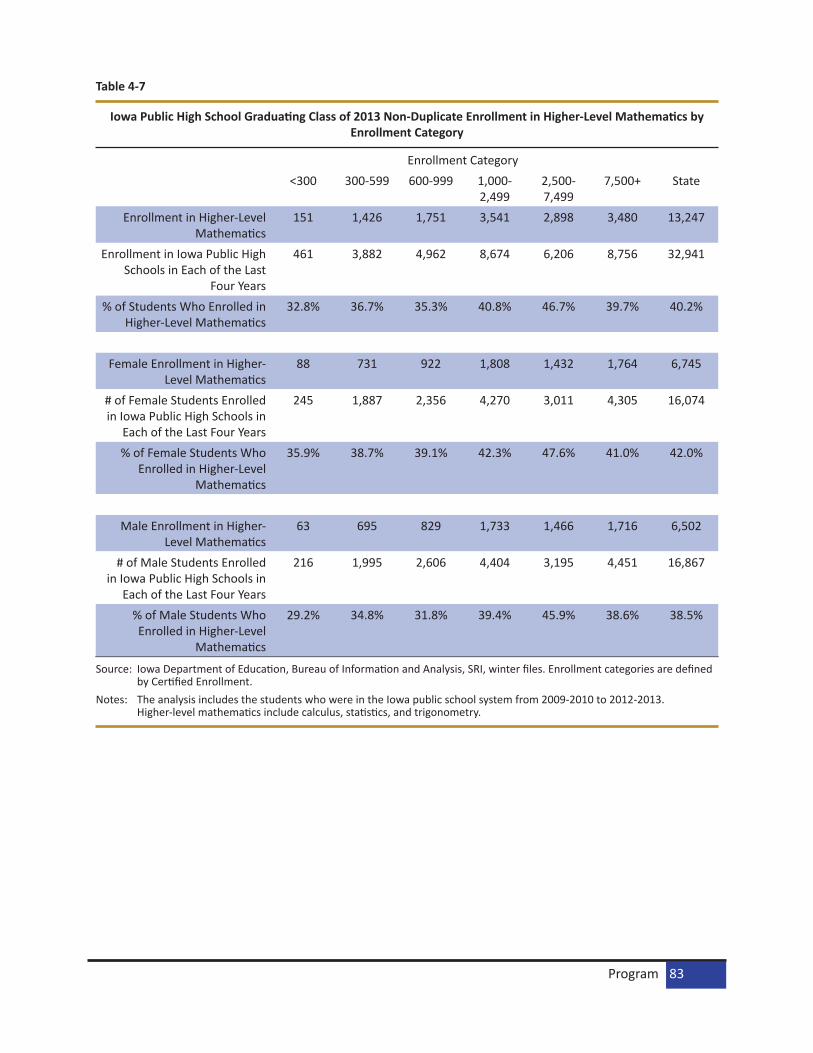
Table 4-7
Iowa Public High School Graduating Class of 2013 Non-Duplicate Enrollment in Higher-Level Mathematics by Enrollment Category
Source: Iowa Department of Education, Bureau of Information and Analysis, SRI, winter files. Enrollment categories are defined by Certified Enrollment.
Notes: The analysis includes the students who were in the Iowa public school system from 2009-2010 to 2012-2013. Higher-level mathematics include calculus, statistics, and trigonometry.
Enrollment Category<300 300-599 600-999 1,000-
2,4992,500-7,499
7,500+ State
Enrollment in Higher-Level Mathematics
151 1,426 1,751 3,541 2,898 3,480 13,247
Enrollment in Iowa Public High Schools in Each of the Last
Four Years
461 3,882 4,962 8,674 6,206 8,756 32,941
% of Students Who Enrolled in Higher-Level Mathematics
32.8% 36.7% 35.3% 40.8% 46.7% 39.7% 40.2%
Female Enrollment in Higher-Level Mathematics
88 731 922 1,808 1,432 1,764 6,745
# of Female Students Enrolled in Iowa Public High Schools in
Each of the Last Four Years
245 1,887 2,356 4,270 3,011 4,305 16,074
% of Female Students Who Enrolled in Higher-Level
Mathematics
35.9% 38.7% 39.1% 42.3% 47.6% 41.0% 42.0%
Male Enrollment in Higher-Level Mathematics
63 695 829 1,733 1,466 1,716 6,502
# of Male Students Enrolled in Iowa Public High Schools in
Each of the Last Four Years
216 1,995 2,606 4,404 3,195 4,451 16,867
% of Male Students Who Enrolled in Higher-Level
Mathematics
29.2% 34.8% 31.8% 39.4% 45.9% 38.6% 38.5%
Program 83

Table 4-8
Iowa Public High School Graduating Class of 2013 Non-Duplicate Enrollment in Chemistry by Enrollment Category
Source: Iowa Department of Education, Bureau of Information and Analysis, SRI, winter files. Enrollment categories are defined by Certified Enrollment.
Note: The analysis includes the students who were in the Iowa public school system from 2009-2010 to 2012-2013.
Enrollment Category<300 300-599 600-999 1,000-
2,4992,500-7,499
7,500+ State
Enrollment in Chemistry 274 2,497 3,154 5,953 4,624 5,364 21,866Enrollment in Iowa Public High
Schools in Each of the Last Four Years
461 3,882 4,962 8,674 6,206 8,756 32,941
% of Students Who Enrolled in Chemistry
59.4% 64.3% 63.6% 68.6% 74.5% 61.3% 66.4%
Female Enrollment in Chemistry
170 1,344 1,655 3,152 2,358 2,833 11,512
# of Female Students Enrolled in Iowa Public High Schools in
Each of the Last Four Years
245 1,887 2,356 4,270 3,011 4,305 16,074
% of Female Students Who Enrolled in Chemistry
69.4% 71.2% 70.2% 73.8% 78.3% 65.8% 71.6%
Male Enrollment in Chemistry 104 1,153 1,499 2,801 2,266 2,531 10,354# of Male Students Enrolled
in Iowa Public High Schools in Each of the Last Four Years
216 1,995 2,606 4,404 3,195 4,451 16,867
% of Male Students Who Enrolled in Chemistry
48.1% 57.8% 57.5% 63.6% 70.9% 56.9% 61.4%
The Annual Condition of Education Report 201384

Table 4-9
Iowa Public High School Graduating Class of 2013 Non-Duplicate Enrollment in Physics by Enrollment Category
Source: Iowa Department of Education, Bureau of Information and Analysis, SRI, winter files. Enrollment categories are defined by Certified Enrollment.
Note: The analysis includes the students who were in the Iowa public school system from 2009-2010 to 2012-2013.
Enrollment Category<300 300-599 600-999 1,000-
2,4992,500-7,499
7,500+ State
Enrollment in Physics 98 919 1,137 2,138 1,742 2,714 8,748Enrollment in Iowa Public High
Schools in Each of the Last Four Years
461 3,882 4,962 8,674 6,206 8,756 32,941
% of Students Who Enrolled in Physics
21.3% 23.7% 22.9% 24.6% 28.1% 31.0% 26.6%
Female Enrollment in Physics 44 409 492 858 672 1,213 3,688# of Female Students Enrolled in Iowa Public High Schools in
Each of the Last Four Years
245 1,887 2,356 4,270 3,011 4,305 16,074
% of Female Students Who Enrolled in Physics
18.0% 21.7% 20.9% 20.1% 22.3% 28.2% 22.9%
Male Enrollment in Physics 54 510 645 1,280 1,070 1,501 5,060# of Male Students Enrolled
in Iowa Public High Schools in Each of the Last Four Years
216 1,995 2,606 4,404 3,195 4,451 16,867
% of Male Students Who Enrolled in Physics
25.0% 25.6% 24.8% 29.1% 33.5% 33.7% 30.0%
Program 85
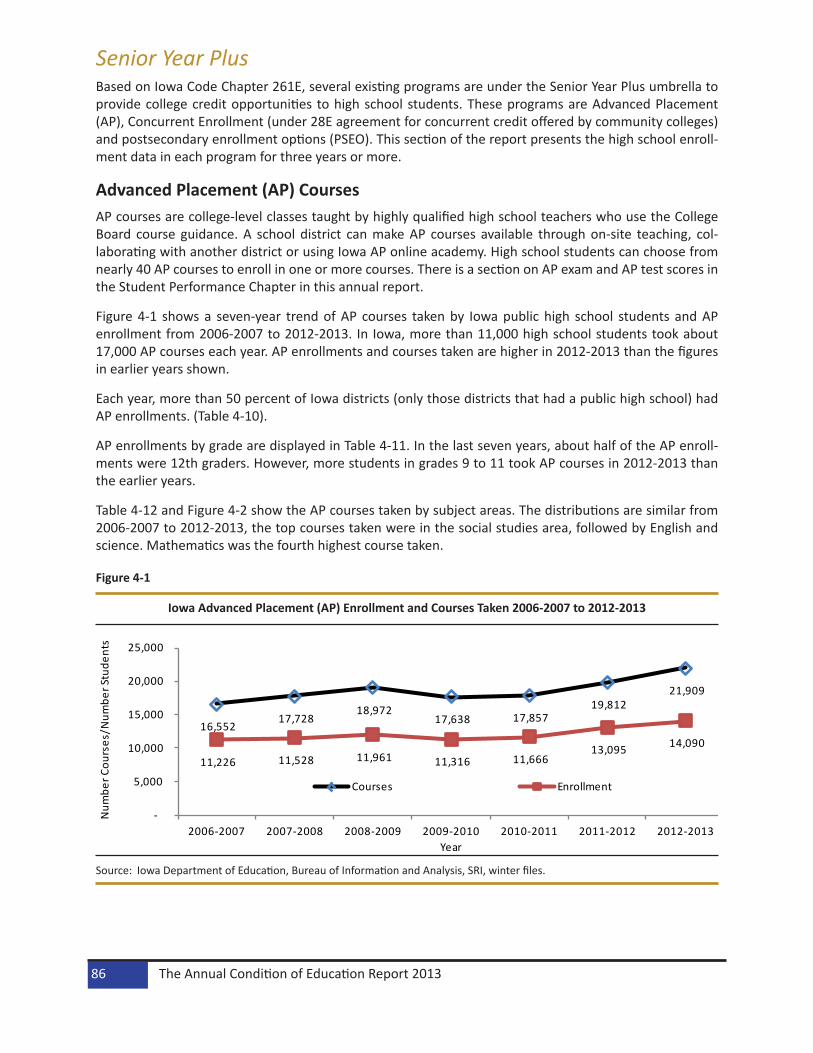
Senior Year PlusBased on Iowa Code Chapter 261E, several existing programs are under the Senior Year Plus umbrella to provide college credit opportunities to high school students. These programs are Advanced Placement (AP), Concurrent Enrollment (under 28E agreement for concurrent credit offered by community colleges) and postsecondary enrollment options (PSEO). This section of the report presents the high school enroll-ment data in each program for three years or more.
Advanced Placement (AP) CoursesAP courses are college-level classes taught by highly qualified high school teachers who use the College Board course guidance. A school district can make AP courses available through on-site teaching, col-laborating with another district or using Iowa AP online academy. High school students can choose from nearly 40 AP courses to enroll in one or more courses. There is a section on AP exam and AP test scores in the Student Performance Chapter in this annual report.
Figure 4-1 shows a seven-year trend of AP courses taken by Iowa public high school students and AP enrollment from 2006-2007 to 2012-2013. In Iowa, more than 11,000 high school students took about 17,000 AP courses each year. AP enrollments and courses taken are higher in 2012-2013 than the figures in earlier years shown.
Each year, more than 50 percent of Iowa districts (only those districts that had a public high school) had AP enrollments. (Table 4-10).
AP enrollments by grade are displayed in Table 4-11. In the last seven years, about half of the AP enroll-ments were 12th graders. However, more students in grades 9 to 11 took AP courses in 2012-2013 than the earlier years.
Table 4-12 and Figure 4-2 show the AP courses taken by subject areas. The distributions are similar from 2006-2007 to 2012-2013, the top courses taken were in the social studies area, followed by English and science. Mathematics was the fourth highest course taken.
Figure 4-1
Iowa Advanced Placement (AP) Enrollment and Courses Taken 2006-2007 to 2012-2013
16,552 17,728
18,972 17,638 17,857
19,812 21,909
11,226 11,528 11,961 11,316 11,666 13,095 14,090
-
5,000
10,000
15,000
20,000
25,000
2006-2007 2007-2008 2008-2009 2009-2010 2010-2011 2011-2012 2012-2013
Num
ber C
ours
es/N
umbe
r Stu
dent
s
Year
Courses Enrollment
Source: Iowa Department of Education, Bureau of Information and Analysis, SRI, winter files.
The Annual Condition of Education Report 201386

Table 4-10
Iowa Districts with AP Enrollment 2006-2007 to 2012-2013
Source: Iowa Department of Education, Bureau of Information and Analysis, SRI, winter files.
Table 4-11
Number of Iowa School Students Taking AP Courses 2006-2007 to 2012-2013
Source: Iowa Department of Education, Bureau of Information and Analysis, SRI, winter files.
Table 4-12
Iowa AP Courses Taken by Subject Areas 2006-2007 to 2012-2013
Source: Iowa Department of Education, Bureau of Information and Analysis, SRI, winter files.
Year Total # of Districts
Districts with High Schools
Districts with AP Enrollment
Percent of Districts w/High Schools that had AP Enrollment
2006-2007 365 340 198 58.2%2007-2008 364 337 198 58.8%2008-2009 362 332 188 56.6%2009-2010 361 330 177 53.6%2010-2011 359 328 179 54.6%2011-2012 351 320 171 53.4%2012-2013 348 316 176 55.7%
Year 9th Graders 10th Graders 11th Graders 12th Graders Total AP Enrollment2006-2007 47 1,148 3,802 6,229 11,226 2007-2008 58 1,446 3,748 6,276 11,528 2008-2009 247 1,777 3,888 6,049 11,961 2009-2010 267 1,689 3,786 5,574 11,316 2010-2011 390 1,719 3,857 5,700 11,666 2011-2012 290 2,699 4,202 5,904 13,095 2012-2013 442 2,794 4,889 5,965 14,090
Subject Area 2006-2007 2007-2008 2008-2009 2009-2010 2010-2011 2011-2012 2012-2013English Language Arts 4,524 4,884 4,735 3,859 3,646 3,690 4,055
Fine & Performance Arts 340 304 343 344 374 335 414 Foreign Language 916 756 818 756 616 578 713
Mathematics 1,970 2,132 2,809 2,386 2,648 2,841 2,920 Computer (Other) 70 46 41 62 69 59 151
Science 2,931 2,882 3,127 2,866 2,912 3,109 3,405 Social Studies 5,801 6,724 7,099 7,365 7,592 9,200 10,251
Total Courses Taken 16,552 17,728 18,972 17,638 17,857 19,812 21,909
Program 87
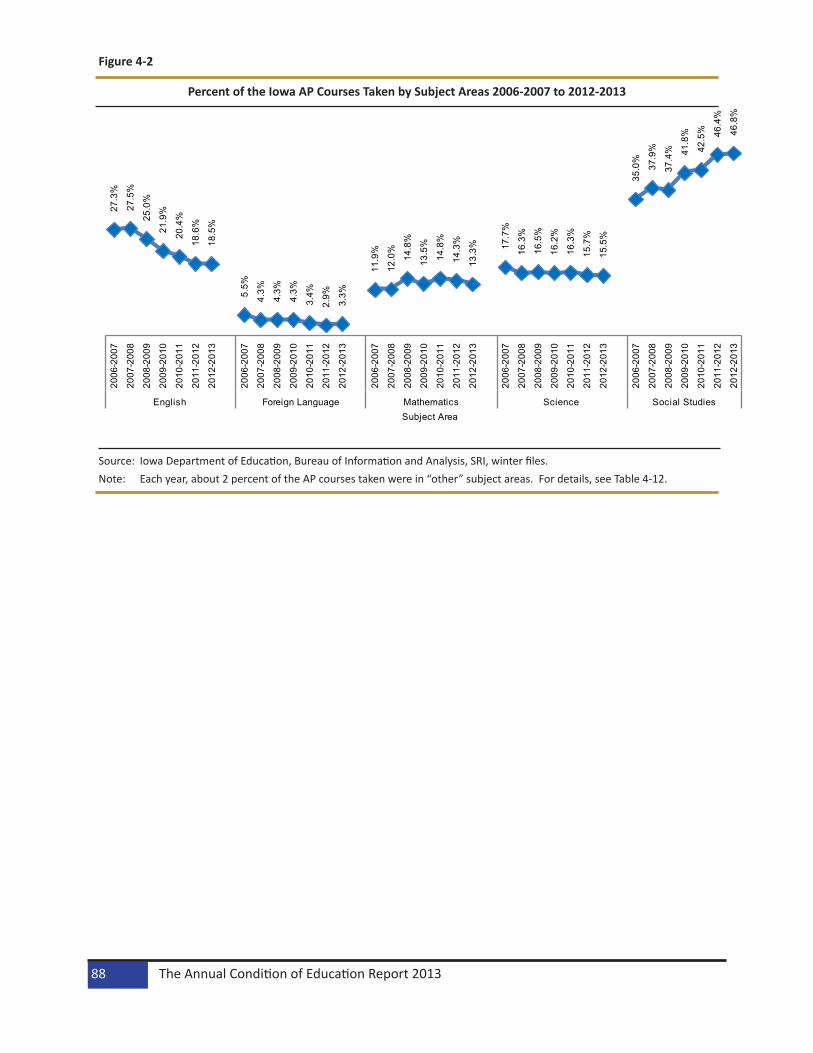
Figure 4-2
Percent of the Iowa AP Courses Taken by Subject Areas 2006-2007 to 2012-2013
27.3
%
27.5
%
25.0
%
21.9
%
20.4
%
18.6
%
18.5
%
5.5%
4.3%
4.3%
4.3%
3.4%
2.9%
3.3%
11.9
%
12.0
%
14.8
%
13.5
%
14.8
%
14.3
%
13.3
% 17.7
%
16.3
%
16.5
%
16.2
%
16.3
%
15.7
%
15.5
%
35.0
%
37.9
%
37.4
% 41.8
%
42.5
% 46.4
%
46.8
%
2006
-200
7
2007
-200
8
2008
-200
9
2009
-201
0
2010
-201
1
2011
-201
2
2012
-201
3
2006
-200
7
2007
-200
8
2008
-200
9
2009
-201
0
2010
-201
1
2011
-201
2
2012
-201
3
2006
-200
7
2007
-200
8
2008
-200
9
2009
-201
0
2010
-201
1
2011
-201
2
2012
-201
3
2006
-200
7
2007
- 200
8
2008
-200
9
2009
-201
0
2010
-201
1
2011
-201
2
2012
-201
3
2006
-200
7
2007
-200
8
2008
-200
9
2009
-201
0
2010
-201
1
2011
-201
2
2012
-201
3
English Foreign Language Mathematics Science Social StudiesSubject Area
Source: Iowa Department of Education, Bureau of Information and Analysis, SRI, winter files.Note: Each year, about 2 percent of the AP courses taken were in “other” subject areas. For details, see Table 4-12.
The Annual Condition of Education Report 201388

Concurrent EnrollmentConcurrent Enrollment courses are offered by community colleges through 28E agreements between school districts and community colleges. The two slightly different designed courses are: one, the courses are designed for both college and high school students for concurrent credit offered by community col-leges and two, the courses are designed for high school students offered by community colleges to bridge high school students to community college programs and typically provide coursework in STEM or other highly technical areas. The second kind of courses through 28E agreements between high school and community college are designed for career academy concurrent credit.
Figure 4-3 shows seven-year trends of concurrent enrollment courses taken by Iowa public high school students and concurrent enrollment from 2006-2007 to 2012-2013. Concurrent enrollment and courses taken are much higher in 2012-2013 than the figures in 2006-2007.
Each year, 80 to 98 percent of Iowa districts (only those districts that had a public high school) had concur-rent enrollments. An upward trend of districts with concurrent enrollment is reported in Table 4-13.
Concurrent enrollments by grade are displayed in Table 4-14. In the last seven years, half of the concurrent enrollments were high school seniors. However, more students in lower grades started to take concurrent enrollment courses in 2009-2010 to 2012-2013 than the earlier years.
Table 4-15 and Figure 4-4 show the concurrent enrollment courses taken by subject areas. The distribu-tions are similar from 2006-2007 to 2012-2013, the highest percentages of courses taken were in career technical/vocational education, followed by English language arts. Social studies and mathematics were the third and fourth highest courses taken respectively.
Figure 4-3
Iowa Concurrent Enrollment and Courses Taken 2006-2007 to 2012-2013
36,330 40,784
51,260 57,931
65,710 69,257
73,834
21,587 23,400 27,346 29,721 32,726 34,513 36,026
-
10,000
20,000
30,000
40,000
50,000
60,000
70,000
80,000
2006-2007 2007-2008 2008-2009 2009-2010 2010-2011 2011-2012 2012-2013
Num
ber C
ours
es/N
umbe
r Stu
dent
s
Year
Courses Enrollment
Source: Iowa Department of Education, Bureau of Information and Analysis, SRI, winter files.
Program 89
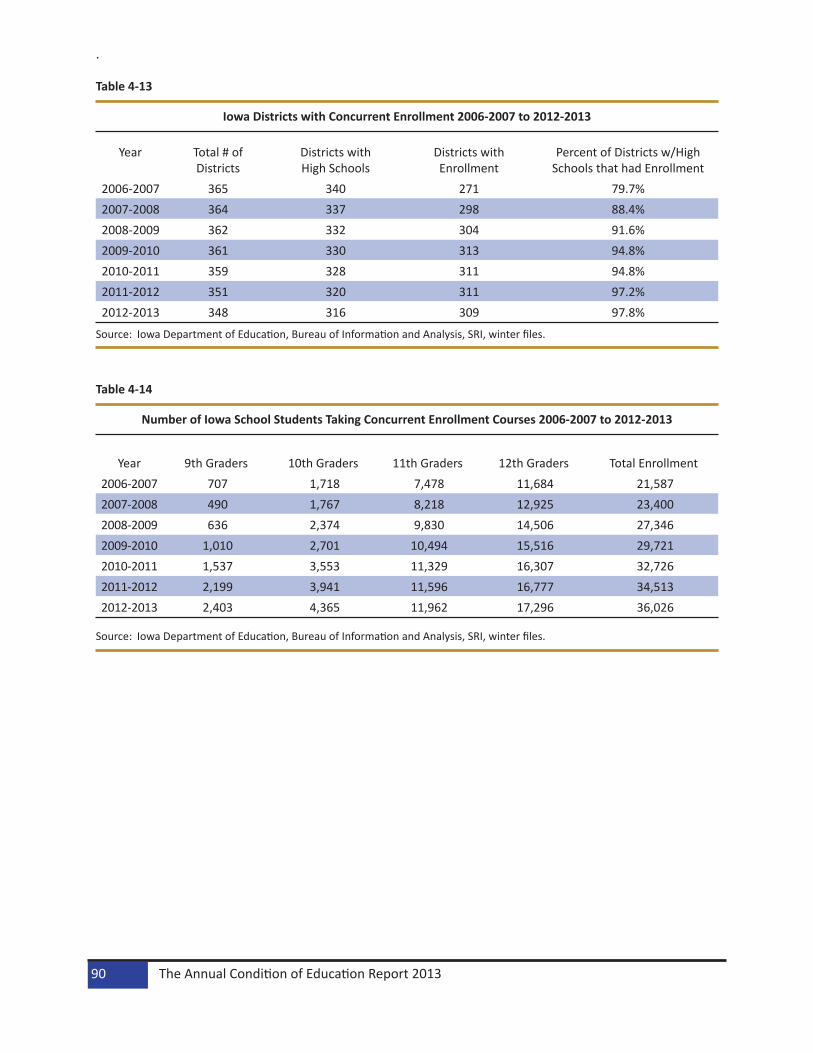
.
Table 4-13
Iowa Districts with Concurrent Enrollment 2006-2007 to 2012-2013
Source: Iowa Department of Education, Bureau of Information and Analysis, SRI, winter files.
Table 4-14
Number of Iowa School Students Taking Concurrent Enrollment Courses 2006-2007 to 2012-2013
Source: Iowa Department of Education, Bureau of Information and Analysis, SRI, winter files.
Year Total # of Districts
Districts with High Schools
Districts with Enrollment
Percent of Districts w/High Schools that had Enrollment
2006-2007 365 340 271 79.7%2007-2008 364 337 298 88.4%2008-2009 362 332 304 91.6%2009-2010 361 330 313 94.8%2010-2011 359 328 311 94.8%2011-2012 351 320 311 97.2%2012-2013 348 316 309 97.8%
Year 9th Graders 10th Graders 11th Graders 12th Graders Total Enrollment2006-2007 707 1,718 7,478 11,684 21,587 2007-2008 490 1,767 8,218 12,925 23,400 2008-2009 636 2,374 9,830 14,506 27,346 2009-2010 1,010 2,701 10,494 15,516 29,721 2010-2011 1,537 3,553 11,329 16,307 32,726 2011-2012 2,199 3,941 11,596 16,777 34,513 2012-2013 2,403 4,365 11,962 17,296 36,026
The Annual Condition of Education Report 201390

Table 4-15
Iowa Concurrent Enrollment Courses Taken by Subject Areas 2006-2007 to 2012-2013
Source: Iowa Department of Education, Bureau of Information and Analysis, SRI, winter files.
Figure 4-4
Percent of the Iowa Concurrent Enrollment Courses Taken by Subject Areas 2006-2007 to 2012-2013
20.8
%22
.0%
19.2
%18
.1%
17.1
%16
.8%
18.2
%
2.0%
1.8%
2.1%
2.1%
2.2%
2.5%
2.7% 5.
4%5.
6% 6.0% 6.5%
5.9%
4.9%
4.2%
10.7
%10
.4%
9.4% 10
.3%
10.6
%9.
9%10
.2%
4.9%
4.8%
4.5%
4.1%
3.6%
3.8%
4.0%
12.9
%13
.4%
13.3
%12
.7%
13.9
%14
.8%
15.6
%
36.8
%37
.6% 42
.4%
41.2
%37
.9%
38.7
%35
.1%
2006
-200
720
07-2
008
2008
-200
920
09-2
010
2010
-201
120
11-2
012
2012
-201
3
2006
-200
720
07-2
008
2008
-200
920
09-2
010
2010
-201
120
11-2
012
2012
-201
3
2006
-200
720
07-2
008
2008
-200
920
09-2
010
2010
-201
120
11-2
012
2012
-201
3
2006
-200
720
07-2
008
2008
-200
920
09-2
010
2010
-201
120
11-2
012
2012
-201
3
2006
-200
720
07-2
008
2008
-200
920
09-2
010
2010
-201
120
11-2
012
2012
-201
3
2006
-200
720
07-2
008
2008
-200
920
09-2
010
2010
-201
120
11-2
012
2012
-201
3
2006
-200
720
07-2
008
2008
-200
920
09-2
010
2010
-201
120
11-2
012
2012
-201
3English Arts Foreign Language Mathematics Science Social Studies Career Tech./Voc.
EdSubject Area
Source: Iowa Department of Education, Bureau of Information and Analysis, SRI, winter files.Note: About 10 percent of the concurrent courses taken were in “other” subject areas. For details, see Table 4-15.
Subject Area 2006-2007 2007-2008 2008-2009 2009-2010 2010-2011 2011-2012 2012-2013English Language Arts 7,541 8,953 9,862 10,507 11,226 11,636 13,459
Fine & Performance Arts 716 728 1,063 1,190 1,447 1,761 2,029 Foreign Language 1,968 2,280 3,083 3,775 3,887 3,364 3,093
Mathematics 3,871 4,246 4,808 5,943 6,969 6,872 7,555 Other 2,391 1,813 1,633 2,909 5,791 5,901 7,372
Science 1,789 1,968 2,288 2,380 2,352 2,665 2,921 Social Studies 4,695 5,474 6,793 7,346 9,164 10,238 11,495
Career Technical/Vocational Education
13,359 15,322 21,730 23,881 24,874 26,820 25,910
Total Courses Taken 36,330 40,784 51,260 57,931 65,710 69,257 73,834
Program 91

Postsecondary Enrollment Options (PSEO) ActThe Postsecondary Enrollment Options (PSEO) Act was enacted in 1987. The purpose of the act was to promote rigorous academic pursuits and to provide a wider variety of options to high school students by enabling 11th and 12th grade students to enroll part-time in nonsectarian courses in eligible postsecond-ary institutions of higher learning in Iowa. Ninth and 10th grade students who are identified as talented and gifted students according to the school district’s criteria and procedures may also participate under the Act (See Iowa Code - 261C.2). The Department of Education began collecting data on PSEO in 1993.
Figure 4-5 shows seven-year trends of PSEO courses taken by Iowa public high school students and PSEO enrollments from 2006-2007 to 2012-2013. In 2012-2013, the PSEO courses taken and enrollment de-creased more, while the concurrent enrollment and courses taken are much higher in 2012-2013 than the early years (see Figure 4-3) in contract. The trend switches between PSEO and concurrent enrollment due to recent year’s better data reporting from Iowa school districts.
Each year, 88 to 74 percent of Iowa districts (only those districts had a public high school) had PSEO enroll-ments. However, a downward trend of AP enrollment districts is reported in Table 4-16.
PSEO enrollments by grade are displayed in Table 4-17. In the last three years, about two-thirds of the PSEO enrollments were 12th graders.
Table 4-18 and Figure 4-6 show the PSEO courses taken by subject areas. The distributions are similar from 2009-2010 to 2012-2013, the number one courses taken were in social studies area.
Figure 4-5
Iowa PSEO Enrollments and Courses Taken 2006-2007 to 2012-2013
11,229 11,095
12,40611,235
9,6808,984 8,8886,318 6,276
6,835 6,7085,916 5,474
4,869
0
2000
4000
6000
8000
10000
12000
14000
2006-2007 2007-2008 2008-2009 2009-2010 2010-2011 2011-2012 2012-2013
Num
ber C
ours
es/N
umbe
r Stu
dent
s
Year
Courses Enrollment
Courses Enrollment
Source: Iowa Department of Education, Bureau of Information and Analysis, SRI, spring files.
The Annual Condition of Education Report 201392

Table 4-16
Iowa Districts with PSEO Enrollments 2009-2010 to 2012-2013
Source: Iowa Department of Education, Bureau of Information and Analysis, SRI, spring files.
Table 4-17
Number of Iowa School Students Taking PSEO Courses 2009-2010 to 2012-2013
Source: Iowa Department of Education, Bureau of Information and Analysis, SRI, spring files.
Year Total # of Districts
Districts with High Schools
Districts with PSEO Enrollment
Percent of Districts w/High Schools that had PSEO Enrollment
2009-2010 361 330 290 87.9%2010-2011 359 328 262 79.9%2011-2012 351 311 243 78.1%2012-2013 348 316 235 74.4%
Year 9th and 10th Graders 11th Graders 12th Graders Total PSEO Enrollment2009-2010 295 1,886 4,526 6,707 2010-2011 295 1,624 3,997 5,916 2011-2012 303 1,510 3,661 5,474 2012-2013 330 1,343 3,196 4,869
Program 93
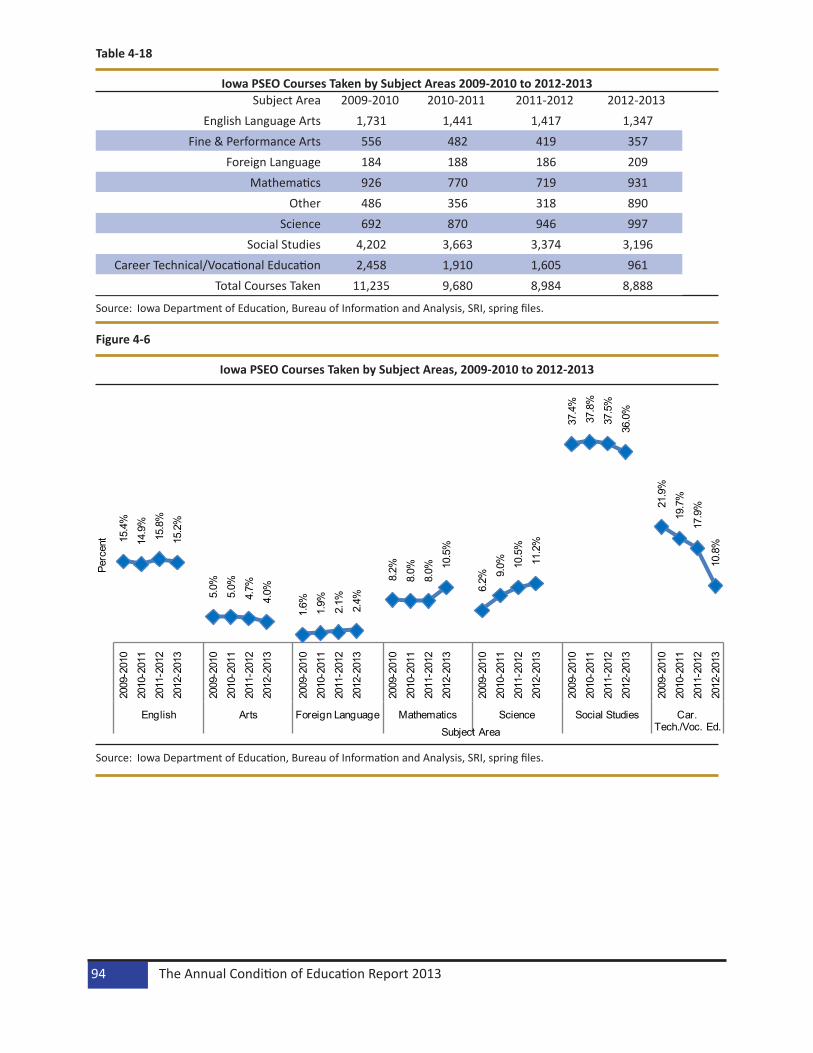
Table 4-18
Iowa PSEO Courses Taken by Subject Areas 2009-2010 to 2012-2013
Source: Iowa Department of Education, Bureau of Information and Analysis, SRI, spring files.
Figure 4-6
Iowa PSEO Courses Taken by Subject Areas, 2009-2010 to 2012-2013
15.4
%
14.9
%
15.8
%
15.2
%
5.0%
5.0%
4.7%
4.0%
1.6% 1.9% 2.1% 2.4%
8.2%
8.0%
8.0% 10
.5%
6.2% 9.
0% 10.5
%
11.2
%
37.4
%
37.8
%
37.5
%
36.0
%
21.9
%
19.7
%
17.9
%
10.8
%
2009
-201
0
2010
-201
1
2011
-201
2
2012
-201
3
2009
-201
0
2010
-201
1
2011
-201
2
2012
-201
3
2009
-201
0
2010
-201
1
2011
-201
2
2012
-201
3
2009
-201
0
2010
-201
1
2011
-201
2
2012
-201
3
2009
-201
0
2010
-201
1
2011
-201
2
2012
-201
3
2009
-201
0
2010
-201
1
2011
-201
2
2012
-201
3
2009
-201
0
2010
-201
1
2011
-201
2
2012
-201
3English Arts Foreign Language Mathematics Science Social Studies Car.
Tech./Voc. Ed.
Perc
ent
Subject Area
Source: Iowa Department of Education, Bureau of Information and Analysis, SRI, spring files.
Subject Area 2009-2010 2010-2011 2011-2012 2012-2013English Language Arts 1,731 1,441 1,417 1,347
Fine & Performance Arts 556 482 419 357 Foreign Language 184 188 186 209
Mathematics 926 770 719 931 Other 486 356 318 890
Science 692 870 946 997 Social Studies 4,202 3,663 3,374 3,196
Career Technical/Vocational Education 2,458 1,910 1,605 961 Total Courses Taken 11,235 9,680 8,984 8,888
The Annual Condition of Education Report 201394

Class SizeOverviewThe results of 13 years of class size reduction efforts, initiated by the Iowa Early Intervention Block Grant Program, are provided in this section. The Iowa Early Intervention Block Grant Program focused attention on class size reduction in kindergarten through third grade and established the goal of reaching an average class size of 17 students or less.
Public school districts report the number of kindergarten, first, second, and third grade classroom sections, students, teachers, and aides by building through the Fall Basic Educational Data Survey (BEDS). Special education teachers, aides, and “specialty” teachers, such as physical education, art, and music teachers are excluded from the teacher count.
Since the purpose was to calculate an average class size for each grade, kindergarten through grade three classrooms defined as multi-age or multi-grade classrooms were reported as grade level “other” and were not considered in the calculation of average class size. Special classrooms for special education students and other “pull-out” situations were also excluded. Average class size was calculated by dividing the number of students by the number of classrooms for each grade level.
Average Class Size = Number of Students / Number of Classrooms
Since average class size uses the number of classrooms as the denominator, adding additional teachers to a classroom does not lower the average class size for that grade level. The use of the classroom aides also does not reduce average class size at the district or state level.
TrendsFigures 4-7 to 4-10 provide a summary of average class size in grades kindergarten through third in Iowa public schools for the past thirteen years. None of the grades reached the state goal of 17 students per classroom during all years reported.
Table 4-19 shows the change in BEDS enrollment compared to the change in class size. From 1998-1999 to present, enrollment increased more than that of average class size in kindergarten and first grade. Class size increased slightly more than second grade enrollment and third grade enrollment decreased more than class size for third grade.
Table 4-20 shows the comparison between teachers, students, and class size. The number of students used in this table, were the number of students reported by districts for the purpose of calculating average class size. Although there was a small decrease for third graders, other grades showed average class size increased.
Summary statistics are presented in table 4-21.
Program 95

Figure 4-7
Iowa Public School District Average Class Size For Kindergarten 2000-2001 to 2012-2013
18.6 18.618.9 19.0
19.219.4
19.019.2 19.3
19.820.0 20.1 20.3
17.0
17.5
18.0
18.5
19.0
19.5
20.0
20.5
21.0
21.5
22.0
Cla
ss s
ize
School Year
Source: Iowa Department of Education, Bureau of Information and Analysis, Basic Educational Data Survey, Class Size files.
Figure 4-8
Iowa Public School District Average Class Size For First Grade 2000-2001 to 2012-2013
18.818.5
18.819.1 19.2
19.4 19.519.1
19.419.7
20.220.5 20.5
17.0
17.5
18.0
18.5
19.0
19.5
20.0
20.5
21.0
21.5
22.0
Cla
ss s
ize
School Year
Source: Iowa Department of Education, Bureau of Information and Analysis, Basic Educational Data Survey, Class Size files.
The Annual Condition of Education Report 201396
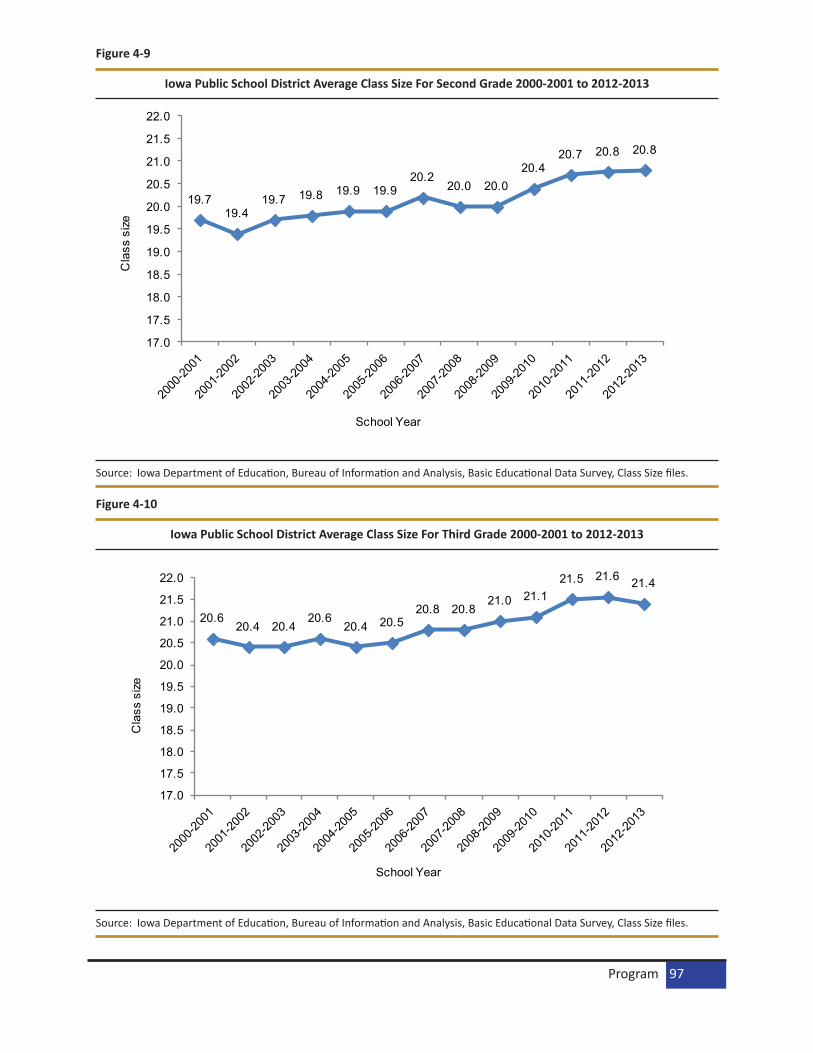
Figure 4-9
Iowa Public School District Average Class Size For Second Grade 2000-2001 to 2012-2013
19.719.4
19.7 19.8 19.9 19.920.2
20.0 20.020.4
20.7 20.8 20.8
17.0
17.5
18.0
18.5
19.0
19.5
20.0
20.5
21.0
21.5
22.0C
lass
siz
e
School Year
Source: Iowa Department of Education, Bureau of Information and Analysis, Basic Educational Data Survey, Class Size files.
Figure 4-10
Iowa Public School District Average Class Size For Third Grade 2000-2001 to 2012-2013
20.620.4 20.4
20.620.4 20.5
20.8 20.821.0 21.1
21.5 21.6 21.4
17.0
17.5
18.0
18.5
19.0
19.5
20.0
20.5
21.0
21.5
22.0
Cla
ss s
ize
School Year
Source: Iowa Department of Education, Bureau of Information and Analysis, Basic Educational Data Survey, Class Size files.
Program 97

Table 4-19
Iowa Public School BEDS Enrollments for Kindergarten Through Third Grade 1998-1999 and 2012-2013
Source: Iowa Department of Education, Bureau of Information and Analysis, Basic Educational Data Survey, Enrollment files.
Grade 1998-1999 Enrollment
2012-2013 Enrollment
Absolute Difference in Enrollment
Percent Change in Enrollment
Percent Change in Class Size
Kindergarten 35,772 41,400 5,628 15.7% 3.0%1 35,699 36,742 1,043 2.9% 2.0%2 35,866 35,902 36 0.1% 0.5%3 36,500 35,467 -1,033 -2.8% -1.4%
The Annual Condition of Education Report 201398

Table 4-20
Iowa Public School Students, Teachers, and Average Class Size 1998-1999 and 2012-2013
Source: Iowa Department of Education, Bureau of Information and Analysis, Basic Educational Data Survey, Enrollment and Class Size files.
Table 4-21
Class Size Summary Statistics for Kindergarten Through Grade 3 in Iowa Public Schools2000-2001, 2011-2012 and 2012-2013
Source: Iowa Department of Education, Bureau of Information and Analysis, Basic Educational Data Survey, Class Size files.
Grade Students Teachers Average Class Size1998-1999 2012-2013 1998-1999 2012-2013 1998-1999 2012-2013
Kindergarten 33,618 38,967 1,613.7 1,913.9 19.7 20.31 33,053 35,949 1,644.6 1,754.0 20.1 20.52 33,151 34,960 1,592.1 1,682.0 20.7 20.83 34,153 34,132 1,578.3 1,594.5 21.7 21.4
TeacherSchool Year Students Classrooms FTEs Mean Min Max
Kindergarten 2000-2001 33,004 1,774 1,793.0 18.6 3 342011-2012 36,723 1,825 1,825.0 20.1 4 372012-2013 38,967 1,919 1,913.9 20.3 2 28
Grade 1 2000-2001 32,016 1,700 1,735.0 18.8 2 302011-2012 34,155 1,668 1,669.4 20.5 6 292012-2013 35,949 1,754 1,754.0 20.5 5 28
Grade 2 2000-2001 33,125 1,679 1,712.8 19.7 2 312011-2012 33,762 1,626 1,627.0 20.8 5 302012-2013 34,960 1,679 1,682.0 20.8 7 34
Grade 3 2000-2001 34,293 1,661 1,695.7 20.6 2 302011-2012 33,526 1,555 1,555.0 21.6 6 312012-2013 34,132 1,595 1,594.5 21.4 4 31
Program 99
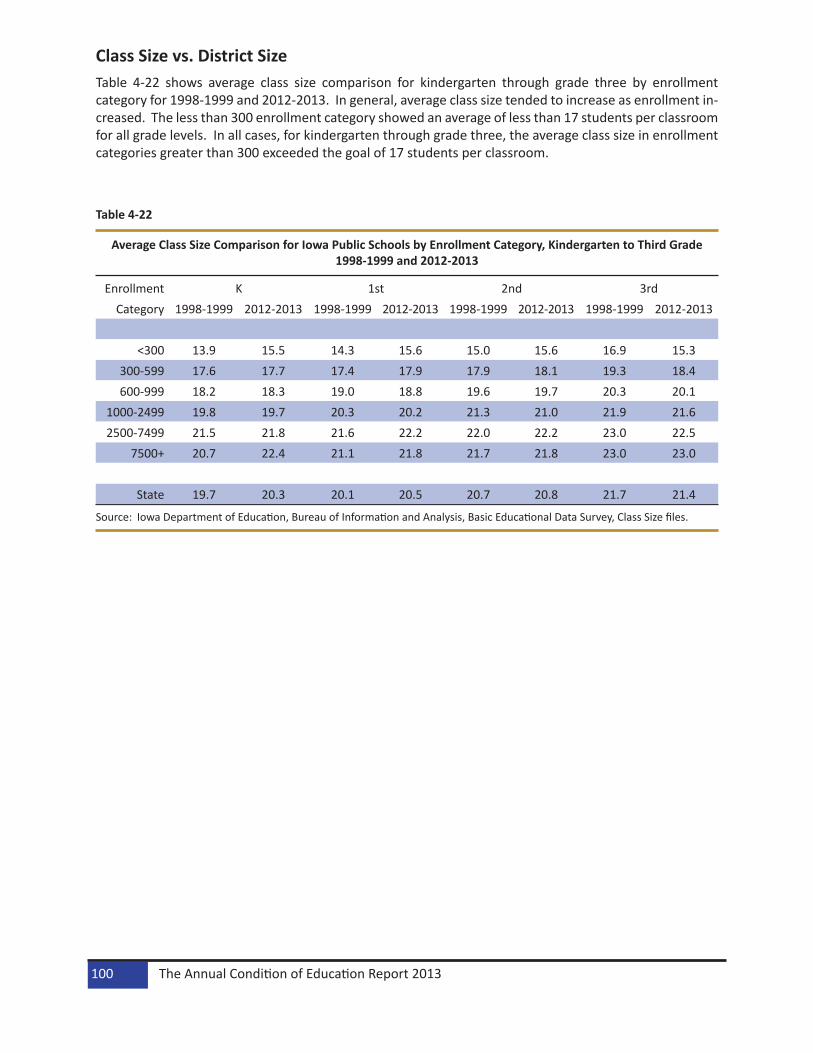
Class Size vs. District SizeTable 4-22 shows average class size comparison for kindergarten through grade three by enrollment category for 1998-1999 and 2012-2013. In general, average class size tended to increase as enrollment in-creased. The less than 300 enrollment category showed an average of less than 17 students per classroom for all grade levels. In all cases, for kindergarten through grade three, the average class size in enrollment categories greater than 300 exceeded the goal of 17 students per classroom.
Table 4-22
Average Class Size Comparison for Iowa Public Schools by Enrollment Category, Kindergarten to Third Grade 1998-1999 and 2012-2013
Source: Iowa Department of Education, Bureau of Information and Analysis, Basic Educational Data Survey, Class Size files.
Enrollment K 1st 2nd 3rdCategory 1998-1999 2012-2013 1998-1999 2012-2013 1998-1999 2012-2013 1998-1999 2012-2013
<300 13.9 15.5 14.3 15.6 15.0 15.6 16.9 15.3300-599 17.6 17.7 17.4 17.9 17.9 18.1 19.3 18.4600-999 18.2 18.3 19.0 18.8 19.6 19.7 20.3 20.1
1000-2499 19.8 19.7 20.3 20.2 21.3 21.0 21.9 21.62500-7499 21.5 21.8 21.6 22.2 22.0 22.2 23.0 22.5
7500+ 20.7 22.4 21.1 21.8 21.7 21.8 23.0 23.0
State 19.7 20.3 20.1 20.5 20.7 20.8 21.7 21.4
The Annual Condition of Education Report 2013100
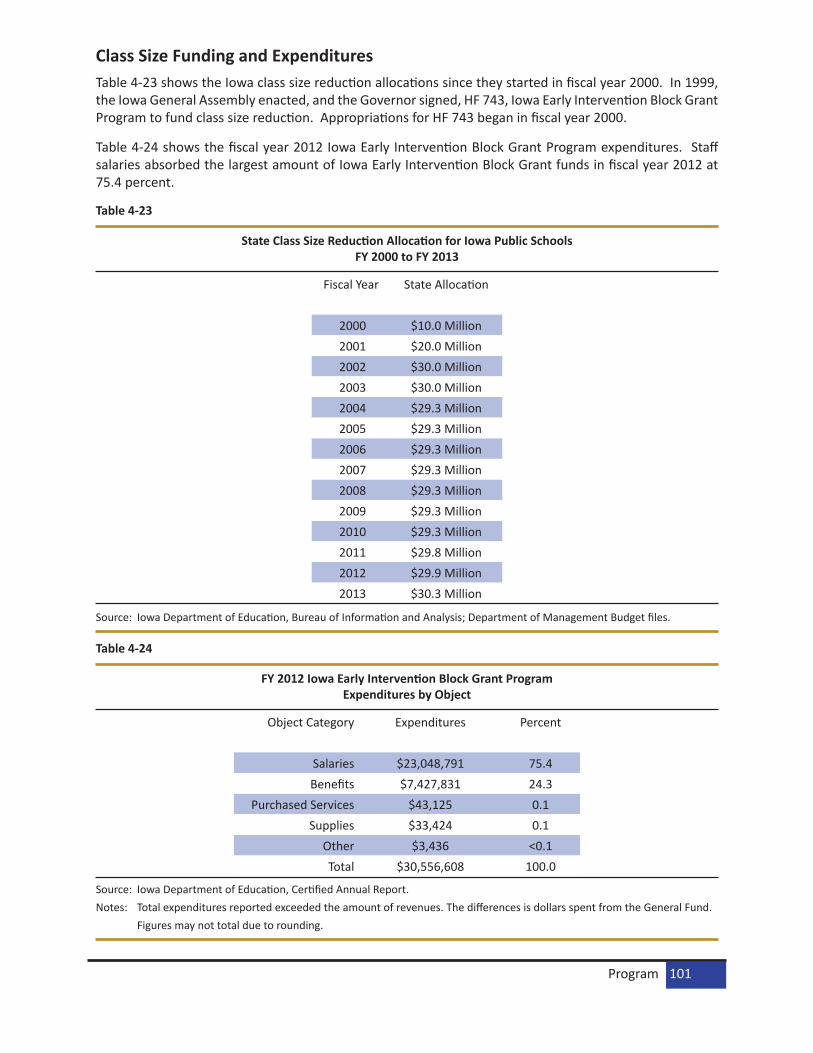
Class Size Funding and ExpendituresTable 4-23 shows the Iowa class size reduction allocations since they started in fiscal year 2000. In 1999, the Iowa General Assembly enacted, and the Governor signed, HF 743, Iowa Early Intervention Block Grant Program to fund class size reduction. Appropriations for HF 743 began in fiscal year 2000.
Table 4-24 shows the fiscal year 2012 Iowa Early Intervention Block Grant Program expenditures. Staff salaries absorbed the largest amount of Iowa Early Intervention Block Grant funds in fiscal year 2012 at 75.4 percent.
Table 4-23
State Class Size Reduction Allocation for Iowa Public Schools FY 2000 to FY 2013
Source: Iowa Department of Education, Bureau of Information and Analysis; Department of Management Budget files.
Table 4-24
FY 2012 Iowa Early Intervention Block Grant Program Expenditures by Object
Source: Iowa Department of Education, Certified Annual Report.Notes: Total expenditures reported exceeded the amount of revenues. The differences is dollars spent from the General Fund. Figures may not total due to rounding.
Fiscal Year State Allocation
2000 $10.0 Million 2001 $20.0 Million 2002 $30.0 Million 2003 $30.0 Million 2004 $29.3 Million 2005 $29.3 Million 2006 $29.3 Million 2007 $29.3 Million 2008 $29.3 Million 2009 $29.3 Million 2010 $29.3 Million 2011 $29.8 Million 2012 $29.9 Million 2013 $30.3 Million
Object Category Expenditures Percent
Salaries $23,048,791 75.4Benefits $7,427,831 24.3
Purchased Services $43,125 0.1Supplies $33,424 0.1
Other $3,436 <0.1Total $30,556,608 100.0
Program 101

TechnologyExpenditures for Computer Hardware and SoftwareExpenditures for computer hardware and software are collected from school districts as a part of the Certified Annual Financial Report. Table 4-25 provides the number of districts, software and hardware expenditures, district enrollment and per pupil expenditures for 2000-2001 and the two most recent years for which expenditures were available. Figure 4-11 provides computer hardware and software per pupil expenditures from 2000-2001 to 2011-2012.
Table 4-26 shows computer hardware and software expenditures data by enrollment category for 2000-2001 and the two most recent years for which expenditures were available. There was a decrease from the prior year in total per pupil expenditures for the 7,500+ enrollment category of $49.19.
Table 4-25
Total Expenditures and Average Per Pupil Expenditures for Computer Software and Hardware in Iowa Public Schools
2000-2001, 2010-2011, and 2011-2012
Source: Iowa Department of Education, Certified Annual Financial Reports.Note: Per pupil expenditures based on Certified Enrollment. Expenditures include administrative, instructional, and all other
software and hardware purchased.
Software Hardware CombinedYear No. of
DistrictsTotal
EnrollmentTotal
ExpendituresPer Pupil
ExpendituresTotal
ExpendituresPer Pupil
ExpendituresTotal
ExpendituresPer Pupil
Expenditures
2000-2001 374 494,291 8,144,617 16.48 34,462,240 69.72 42,606,857 86.20
2010-2011 359 473,493 17,365,237 36.67 61,666,581 130.24 79,031,818 166.91
2011-2012 351 473,504 11,651,689 24.61 70,925,816 149.79 82,577,504.7 174.40
The Annual Condition of Education Report 2013102

Figure 4-11
Computer Software and Hardware Per Pupil Expenditures in Iowa Public Schools 2000-2001 to 2011-2012
86.2
58.72 56.5964.44 64.93
71.51 77.2492.01 88.45
120.46
166.91174.4
69.72
45.53 41.71 46.89 47.81 53.13 58.370.67 65.37
90.94
130.24
149.79
16.48 13.19 14.88 17.55 17.12 18.38 18.94 21.34 23.0829.52
36.6724.61
$0
$20
$40
$60
$80
$100
$120
$140
$160
$180
$200
Per
Pup
il E
xpen
ditu
res
Year
Combined
Hardware
Software
Source: Iowa Department of Education, Certified Annual Financial Reports.Note: Per pupil expenditures based on certified enrollment. Expenditures include administrative, instructional, and all other
software and hardware purchased.
Program 103
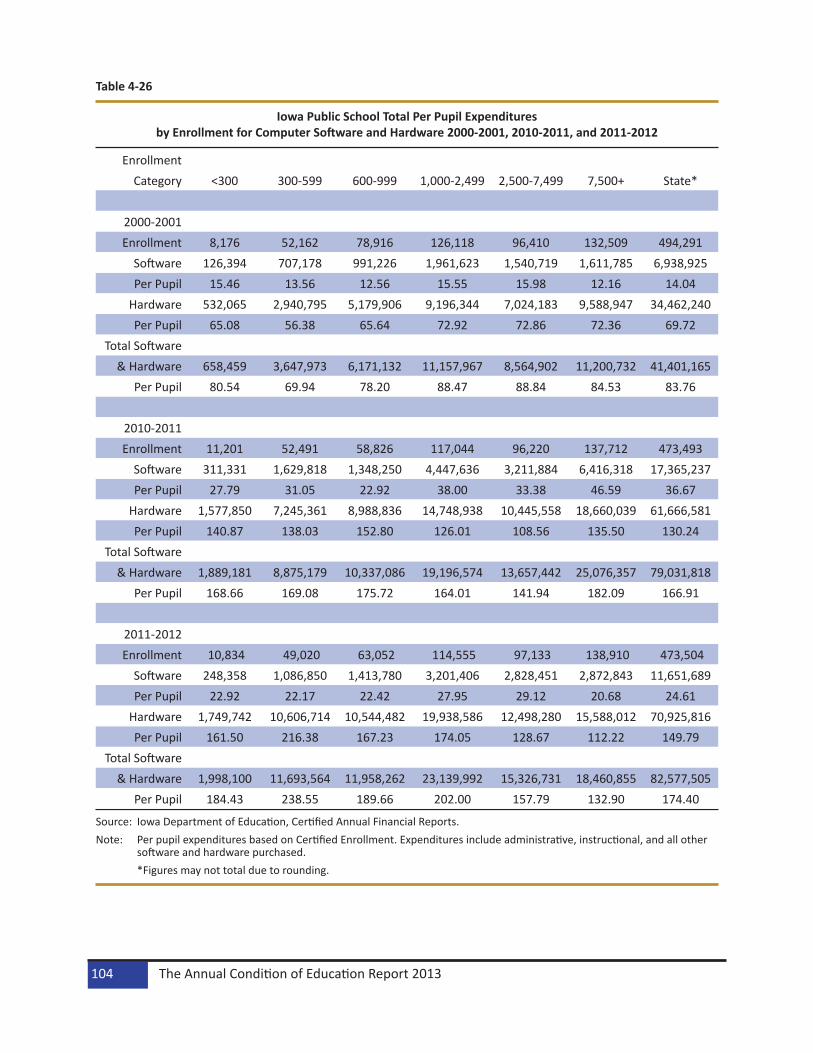
Table 4-26
Iowa Public School Total Per Pupil Expenditures by Enrollment for Computer Software and Hardware 2000-2001, 2010-2011, and 2011-2012
Source: Iowa Department of Education, Certified Annual Financial Reports.Note: Per pupil expenditures based on Certified Enrollment. Expenditures include administrative, instructional, and all other
software and hardware purchased. *Figures may not total due to rounding.
Enrollment Category <300 300-599 600-999 1,000-2,499 2,500-7,499 7,500+ State*
2000-2001Enrollment 8,176 52,162 78,916 126,118 96,410 132,509 494,291
Software 126,394 707,178 991,226 1,961,623 1,540,719 1,611,785 6,938,925Per Pupil 15.46 13.56 12.56 15.55 15.98 12.16 14.04
Hardware 532,065 2,940,795 5,179,906 9,196,344 7,024,183 9,588,947 34,462,240Per Pupil 65.08 56.38 65.64 72.92 72.86 72.36 69.72
Total Software & Hardware 658,459 3,647,973 6,171,132 11,157,967 8,564,902 11,200,732 41,401,165
Per Pupil 80.54 69.94 78.20 88.47 88.84 84.53 83.76
2010-2011Enrollment 11,201 52,491 58,826 117,044 96,220 137,712 473,493
Software 311,331 1,629,818 1,348,250 4,447,636 3,211,884 6,416,318 17,365,237Per Pupil 27.79 31.05 22.92 38.00 33.38 46.59 36.67
Hardware 1,577,850 7,245,361 8,988,836 14,748,938 10,445,558 18,660,039 61,666,581Per Pupil 140.87 138.03 152.80 126.01 108.56 135.50 130.24
Total Software & Hardware 1,889,181 8,875,179 10,337,086 19,196,574 13,657,442 25,076,357 79,031,818
Per Pupil 168.66 169.08 175.72 164.01 141.94 182.09 166.91
2011-2012Enrollment 10,834 49,020 63,052 114,555 97,133 138,910 473,504
Software 248,358 1,086,850 1,413,780 3,201,406 2,828,451 2,872,843 11,651,689Per Pupil 22.92 22.17 22.42 27.95 29.12 20.68 24.61
Hardware 1,749,742 10,606,714 10,544,482 19,938,586 12,498,280 15,588,012 70,925,816Per Pupil 161.50 216.38 167.23 174.05 128.67 112.22 149.79
Total Software & Hardware 1,998,100 11,693,564 11,958,262 23,139,992 15,326,731 18,460,855 82,577,505
Per Pupil 184.43 238.55 189.66 202.00 157.79 132.90 174.40
The Annual Condition of Education Report 2013104

Availability of ComputersAs a part of the Basic Educational Data Survey (BEDS), Iowa public school districts report on the number of computers made available for student use. The Department of Education has collected this informa-tion since 1995-1996. However, in 2012-2013 the definition of student accessible computer was revised to include tablets. The ratio of students per computer is calculated by dividing the number of students reported on the Certified Enrollment form by the number of computers available for student use.
Figures 4-12 and 4-13, and Table 4-27 provide the student to computer ratios. The overall trend shows a steady decrease.
Table 4-28 provides the number of computers per pupil by school type within enrollment category. In general, students in higher grades have more access to a computer than students in lower grades.
Figure 4-12
Pupils Per Computer in Iowa Public Schools 2000-2001 to 2012-2013
4.13.9
3.7 3.7 3.6 3.53.3 3.2
3.0 2.92.6
2.3
1.7
0.0
0.5
1.0
1.5
2.0
2.5
3.0
3.5
4.0
4.5
Num
ber o
f Pup
ils p
er C
ompu
ter
Year
Source: Iowa Department of Education, Bureau of Information and Analysis, Basic Educational Data Survey.Note: Pupils per computer based on Certified Enrollment.
Program 105

Figure 4-13
Pupils Per Computer in Iowa Public Schools by Enrollment Category
2000-2001, 2011-2012, and 2012-2013
3.4
3.3
3.8 4.
1 4.3 4.
7
4.1
1.6
1.6 1.
8 2.2
2.7 3.
0
2.3
1.4 1.3 1.31.6
2.02.4
1.7
0
1
2
3
4
5
6
<300 300-599 600-999 1,000-2,499 2,500-7,499 7,500+ State
Num
ber o
f Pup
ils p
er C
ompu
ter
Enrollment Category
2000-20012011-20122012-2013
Source: Iowa Department of Education, Bureau of Information and Analysis, Basic Educational Data Survey.Note: Pupils per computer based on Certified Enrollment.
The Annual Condition of Education Report 2013106
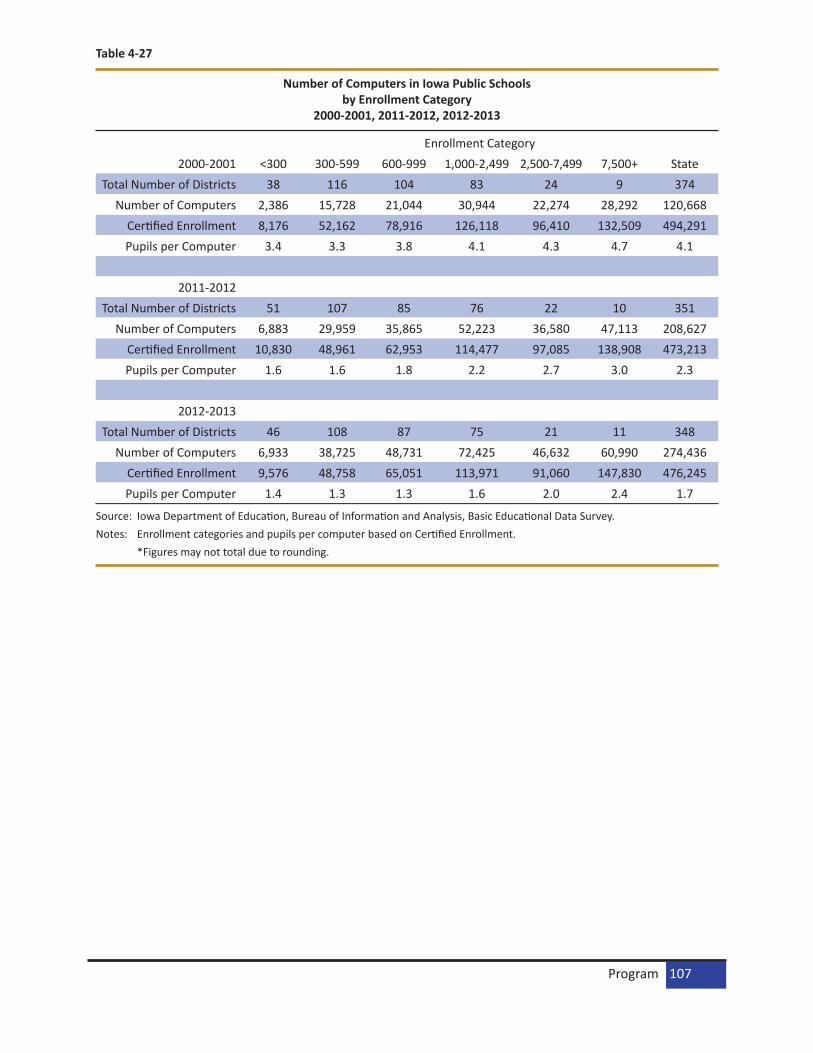
Table 4-27
Number of Computers in Iowa Public Schools by Enrollment Category
2000-2001, 2011-2012, 2012-2013
Source: Iowa Department of Education, Bureau of Information and Analysis, Basic Educational Data Survey.Notes: Enrollment categories and pupils per computer based on Certified Enrollment. *Figures may not total due to rounding.
Enrollment Category2000-2001 <300 300-599 600-999 1,000-2,499 2,500-7,499 7,500+ State
Total Number of Districts 38 116 104 83 24 9 374Number of Computers 2,386 15,728 21,044 30,944 22,274 28,292 120,668
Certified Enrollment 8,176 52,162 78,916 126,118 96,410 132,509 494,291Pupils per Computer 3.4 3.3 3.8 4.1 4.3 4.7 4.1
2011-2012 Total Number of Districts 51 107 85 76 22 10 351
Number of Computers 6,883 29,959 35,865 52,223 36,580 47,113 208,627Certified Enrollment 10,830 48,961 62,953 114,477 97,085 138,908 473,213Pupils per Computer 1.6 1.6 1.8 2.2 2.7 3.0 2.3
2012-2013 Total Number of Districts 46 108 87 75 21 11 348
Number of Computers 6,933 38,725 48,731 72,425 46,632 60,990 274,436Certified Enrollment 9,576 48,758 65,051 113,971 91,060 147,830 476,245Pupils per Computer 1.4 1.3 1.3 1.6 2.0 2.4 1.7
Program 107
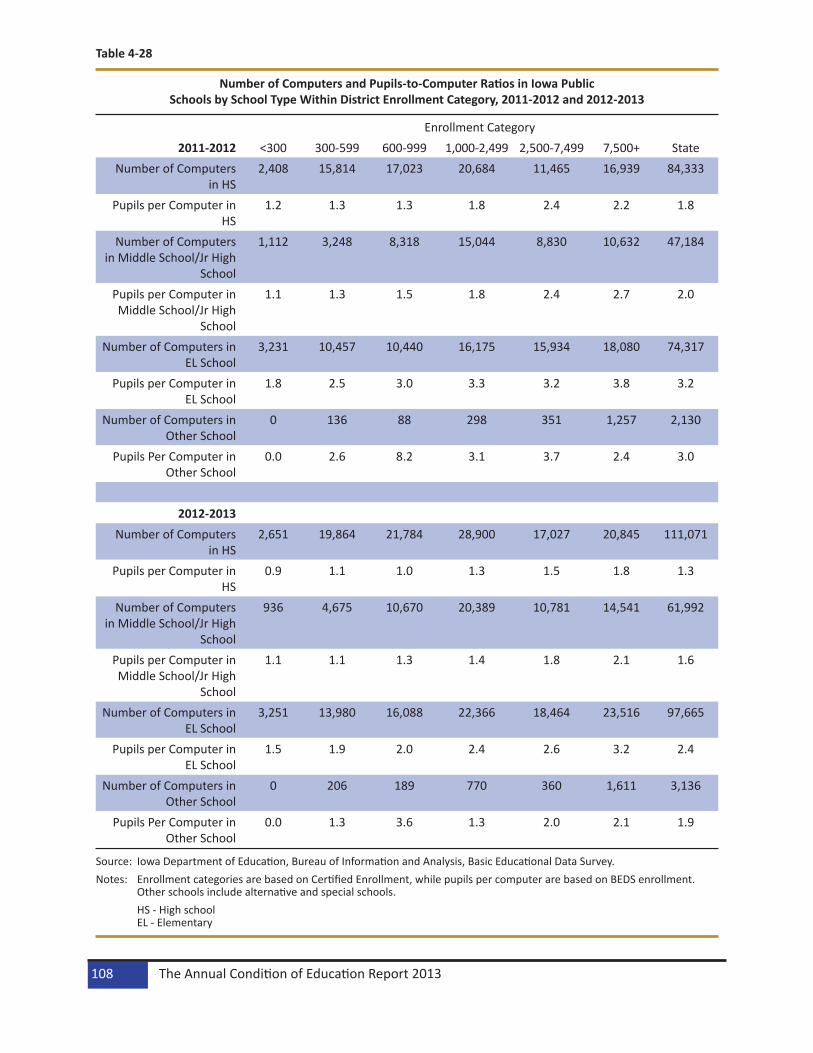
Table 4-28
Number of Computers and Pupils-to-Computer Ratios in Iowa Public Schools by School Type Within District Enrollment Category, 2011-2012 and 2012-2013
Source: Iowa Department of Education, Bureau of Information and Analysis, Basic Educational Data Survey.Notes: Enrollment categories are based on Certified Enrollment, while pupils per computer are based on BEDS enrollment.
Other schools include alternative and special schools. HS - High school
EL - Elementary
Enrollment Category2011-2012 <300 300-599 600-999 1,000-2,499 2,500-7,499 7,500+ State
Number of Computers in HS
2,408 15,814 17,023 20,684 11,465 16,939 84,333
Pupils per Computer in HS
1.2 1.3 1.3 1.8 2.4 2.2 1.8
Number of Computers in Middle School/Jr High
School
1,112 3,248 8,318 15,044 8,830 10,632 47,184
Pupils per Computer in Middle School/Jr High
School
1.1 1.3 1.5 1.8 2.4 2.7 2.0
Number of Computers in EL School
3,231 10,457 10,440 16,175 15,934 18,080 74,317
Pupils per Computer in EL School
1.8 2.5 3.0 3.3 3.2 3.8 3.2
Number of Computers in Other School
0 136 88 298 351 1,257 2,130
Pupils Per Computer in Other School
0.0 2.6 8.2 3.1 3.7 2.4 3.0
2012-2013Number of Computers
in HS2,651 19,864 21,784 28,900 17,027 20,845 111,071
Pupils per Computer in HS
0.9 1.1 1.0 1.3 1.5 1.8 1.3
Number of Computers in Middle School/Jr High
School
936 4,675 10,670 20,389 10,781 14,541 61,992
Pupils per Computer in Middle School/Jr High
School
1.1 1.1 1.3 1.4 1.8 2.1 1.6
Number of Computers in EL School
3,251 13,980 16,088 22,366 18,464 23,516 97,665
Pupils per Computer in EL School
1.5 1.9 2.0 2.4 2.6 3.2 2.4
Number of Computers in Other School
0 206 189 770 360 1,611 3,136
Pupils Per Computer in Other School
0.0 1.3 3.6 1.3 2.0 2.1 1.9
The Annual Condition of Education Report 2013108
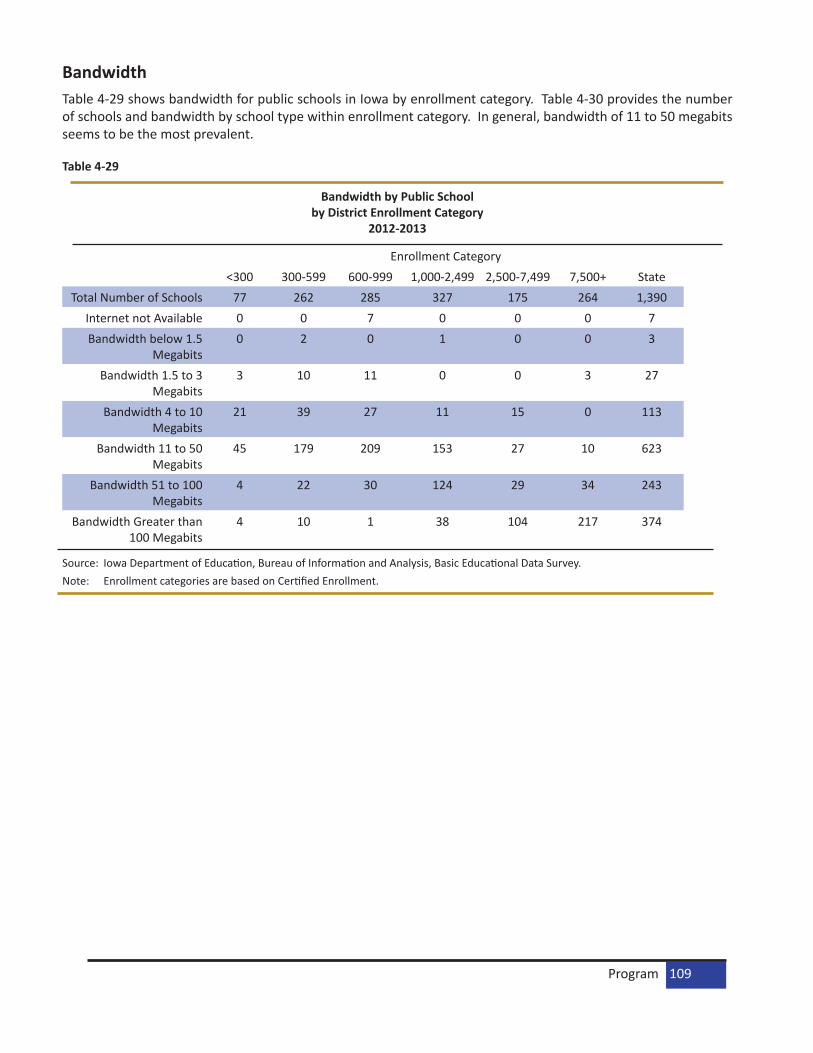
BandwidthTable 4-29 shows bandwidth for public schools in Iowa by enrollment category. Table 4-30 provides the number of schools and bandwidth by school type within enrollment category. In general, bandwidth of 11 to 50 megabits seems to be the most prevalent.
Table 4-29
Bandwidth by Public School by District Enrollment Category
2012-2013
Source: Iowa Department of Education, Bureau of Information and Analysis, Basic Educational Data Survey.Note: Enrollment categories are based on Certified Enrollment.
Enrollment Category<300 300-599 600-999 1,000-2,499 2,500-7,499 7,500+ State
Total Number of Schools 77 262 285 327 175 264 1,390Internet not Available 0 0 7 0 0 0 7Bandwidth below 1.5
Megabits0 2 0 1 0 0 3
Bandwidth 1.5 to 3 Megabits
3 10 11 0 0 3 27
Bandwidth 4 to 10 Megabits
21 39 27 11 15 0 113
Bandwidth 11 to 50 Megabits
45 179 209 153 27 10 623
Bandwidth 51 to 100 Megabits
4 22 30 124 29 34 243
Bandwidth Greater than 100 Megabits
4 10 1 38 104 217 374
Program 109
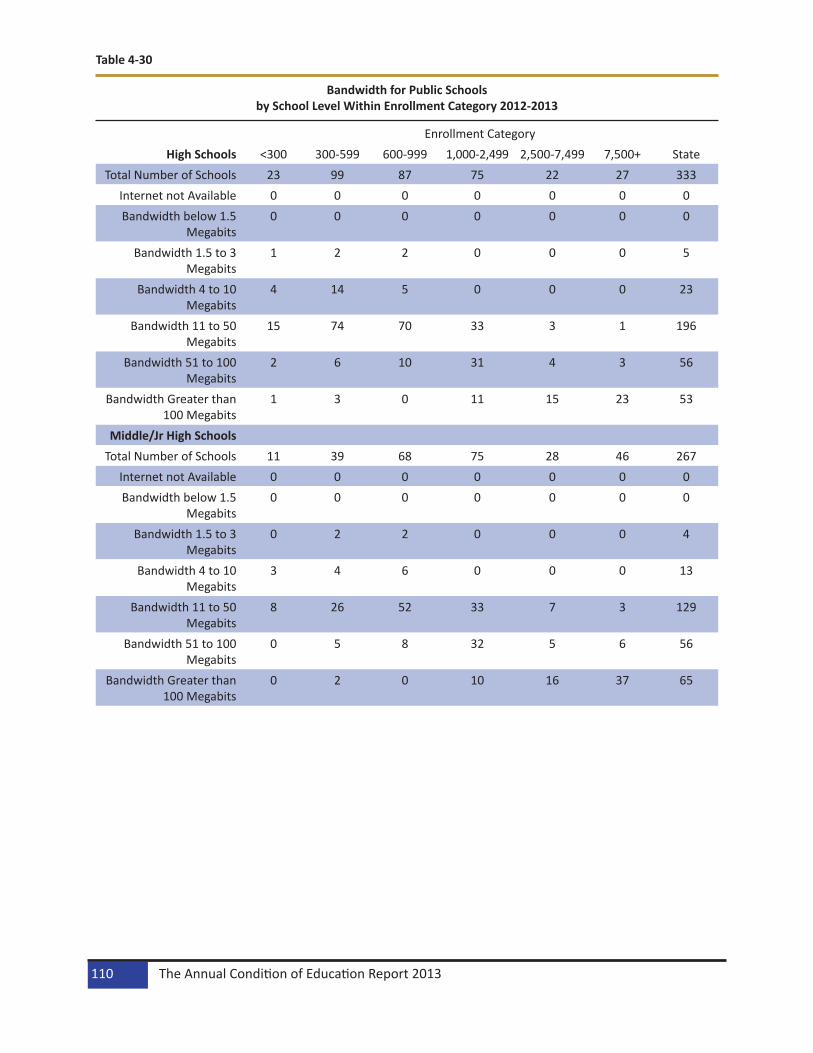
Table 4-30
Bandwidth for Public Schools by School Level Within Enrollment Category 2012-2013
Enrollment CategoryHigh Schools <300 300-599 600-999 1,000-2,499 2,500-7,499 7,500+ State
Total Number of Schools 23 99 87 75 22 27 333Internet not Available 0 0 0 0 0 0 0Bandwidth below 1.5
Megabits0 0 0 0 0 0 0
Bandwidth 1.5 to 3 Megabits
1 2 2 0 0 0 5
Bandwidth 4 to 10 Megabits
4 14 5 0 0 0 23
Bandwidth 11 to 50 Megabits
15 74 70 33 3 1 196
Bandwidth 51 to 100 Megabits
2 6 10 31 4 3 56
Bandwidth Greater than 100 Megabits
1 3 0 11 15 23 53
Middle/Jr High SchoolsTotal Number of Schools 11 39 68 75 28 46 267
Internet not Available 0 0 0 0 0 0 0Bandwidth below 1.5
Megabits0 0 0 0 0 0 0
Bandwidth 1.5 to 3 Megabits
0 2 2 0 0 0 4
Bandwidth 4 to 10 Megabits
3 4 6 0 0 0 13
Bandwidth 11 to 50 Megabits
8 26 52 33 7 3 129
Bandwidth 51 to 100 Megabits
0 5 8 32 5 6 56
Bandwidth Greater than 100 Megabits
0 2 0 10 16 37 65
The Annual Condition of Education Report 2013110
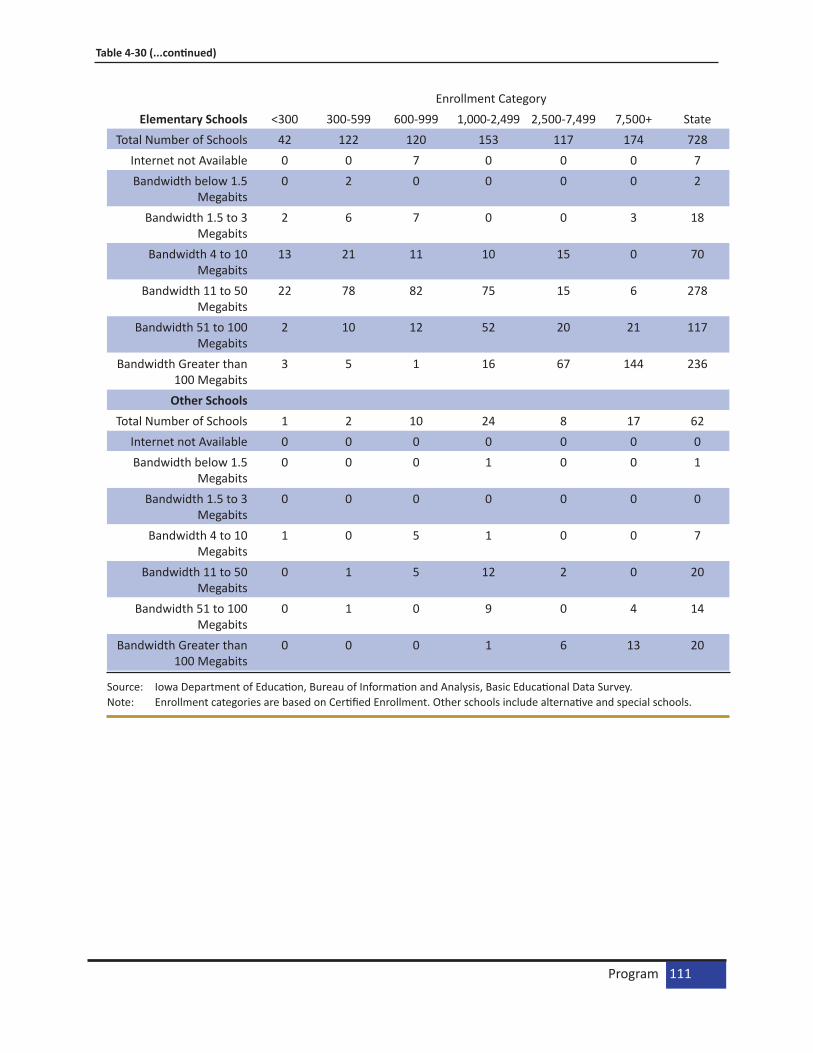
Table 4-30 (...continued)
Enrollment CategoryElementary Schools <300 300-599 600-999 1,000-2,499 2,500-7,499 7,500+ State
Total Number of Schools 42 122 120 153 117 174 728Internet not Available 0 0 7 0 0 0 7Bandwidth below 1.5
Megabits0 2 0 0 0 0 2
Bandwidth 1.5 to 3 Megabits
2 6 7 0 0 3 18
Bandwidth 4 to 10 Megabits
13 21 11 10 15 0 70
Bandwidth 11 to 50 Megabits
22 78 82 75 15 6 278
Bandwidth 51 to 100 Megabits
2 10 12 52 20 21 117
Bandwidth Greater than 100 Megabits
3 5 1 16 67 144 236
Other SchoolsTotal Number of Schools 1 2 10 24 8 17 62
Internet not Available 0 0 0 0 0 0 0Bandwidth below 1.5
Megabits0 0 0 1 0 0 1
Bandwidth 1.5 to 3 Megabits
0 0 0 0 0 0 0
Bandwidth 4 to 10 Megabits
1 0 5 1 0 0 7
Bandwidth 11 to 50 Megabits
0 1 5 12 2 0 20
Bandwidth 51 to 100 Megabits
0 1 0 9 0 4 14
Bandwidth Greater than 100 Megabits
0 0 0 1 6 13 20
Source: Iowa Department of Education, Bureau of Information and Analysis, Basic Educational Data Survey.Note: Enrollment categories are based on Certified Enrollment. Other schools include alternative and special schools.
Program 111

The Annual Condition of Education Report 2013112

Student PerformanceThe student performance chapter contains two major sections. The first section reports the State Indica-tors of Student Success data required by Iowa Administrative Code. Data from the Iowa Assessments are included. The second section provides achievement trends and student performance for all students by enrollment categories, gender, race/ethnicity, and other subgroups. Besides the Iowa Assessment results, results from the National Assessment of Educational Progress (NAEP), ACT, SAT, and Advanced Placement Assessments are incorporated. In addition, Basic Educational Data Survey (BEDS) and the Student Report-ing in Iowa data provide information pertaining to dropouts for grades 7-12 and 9-12, high school gradua-tion rates, high school graduate intentions, postsecondary enrollment options for public school students, and suspension and expulsion data.
Iowa Testing Programs introduced new assessments for Iowa in the fall of 2011. Previously, Iowa Test Forms A and B had been used since the 2001-2002 school year. The new Iowa Assessments were linked to the Iowa Tests of Basic Skills (ITBS) and Iowa Tests of Educational Development (ITED), Forms A and B, through a national study. Proficiency cut scores for the Iowa Assessments are presented in Standard Score metric and are specific to grade, content, and time of year.
State Indicators of Student SuccessThe seven required state indicators for student success include:
1. The percentage of all fourth, eighth, and eleventh grade students achieving a proficient or higher reading status on the Iowa Assessment;
2. The percentage of all fourth, eighth, and eleventh grade students achieving a proficient or higher mathematics status on the Iowa Assessment;
3. The percentage of all eighth and eleventh grade students achieving a proficient or higher science status on the Iowa Assessment;
4. The percentage of students considered as dropouts for grades 7 through 12 and the percentage of high school students who graduate;
5. The percentage of high school seniors who intend to pursue postsecondary education/training;6. The percentage of high school students achieving at the ACT national average score or above, and
the percentage of students achieving an ACT score of 20 or above; and7. The percentage of high school graduates who complete a “core” high school program of four years
of English-language arts and three or more years each of mathematics, science, and social studies (Iowa Administrative Code – 12.8(3)).
Subgroup data are shown for gender, race/ethnicity, socioeconomic status (determined by eligibility for free or reduced price lunch), disability status (determined by the presence of an individualized education program – IEP), primary language status (determined by English language learner status), and migrant/non-migrant status (defined by Title I requirements). Separate tables show achievement level perfor-mance for students by gender, race/ethnicity, disability, socioeconomic, primary language, and migrant subgroups. These subgroups vary in size in a given biennium, and each varies in size from year to year. The subgroup data should not be averaged to obtain an overall value and will not match the data for the total grade group.
Student Performance 113

Iowa Student Counts for Iowa Assessment Reading, Mathematics, and Science Test-Takers including SubgroupsThree of the seven indicators requested by the State Board of Education are percent proficient for Iowa students in the selected grades in each subgroup on the Iowa Assessment in reading, mathematics, and science.
Since group size varies from one subgroup to another, it is important to consider the students tested by subgroup. The approximate average number tested by grade (in grades 4, 8, and 11) and by subgroup for reading and mathematics for the biennium periods 2005-2007 through 2009-2011 and 2011-2013 are shown in Tables 5-1 and 5-2. Table 5-3 shows the approximate average number of grade 8 and 11 students tested by subgroup in science for the same six biennium periods. The number of students tested shown in Tables 5-1 to 5-3 include both public and nonpublic school participants. The students in the biennium analysis are those who enrolled for a full academic year (FAY), as well as those who were enrolled only part of the academic year in Iowa schools, plus some home schooled students who took the Iowa Assessments in reading, mathematics, or science.
Table 5-1
Approximate Average Number of Iowa Students Tested on ITBS and ITED (Iowa Assessments) Reading Tests by Subgroup
Biennium Periods 2005-2007 to 2009-2011 and 2011-2013
Grade 4 2005-2007 2006-2008 2007-2009 2008-2010 2009-2011 2011-2013Male 18,970 19,220 19,320 19,400 19,400 19,400
Female 18,060 18,420 18,580 18,570 18,650 18,620African American 1,960 2,160 2,240 2,100 1,920 1,910American Indian 230 220 220 210 190 170
Asian 770 810 830 840 800 880Hispanic 2,340 2,500 2,620 2,950 3,230 3,500
White 31,580 31,800 31,910 31,440 31,020 30,430ELL 1 1,590 1,700 1,790 1,940 2,010 2,270
Migrant 2 250 210 160 130 120 100SES Eligible 3 11,950 12,800 13,400 14,200 14,940 15,320
IEP 4 4,480 4,660 4,630 4,510 4,550 4,590
The Annual Condition of Education Report 2013114
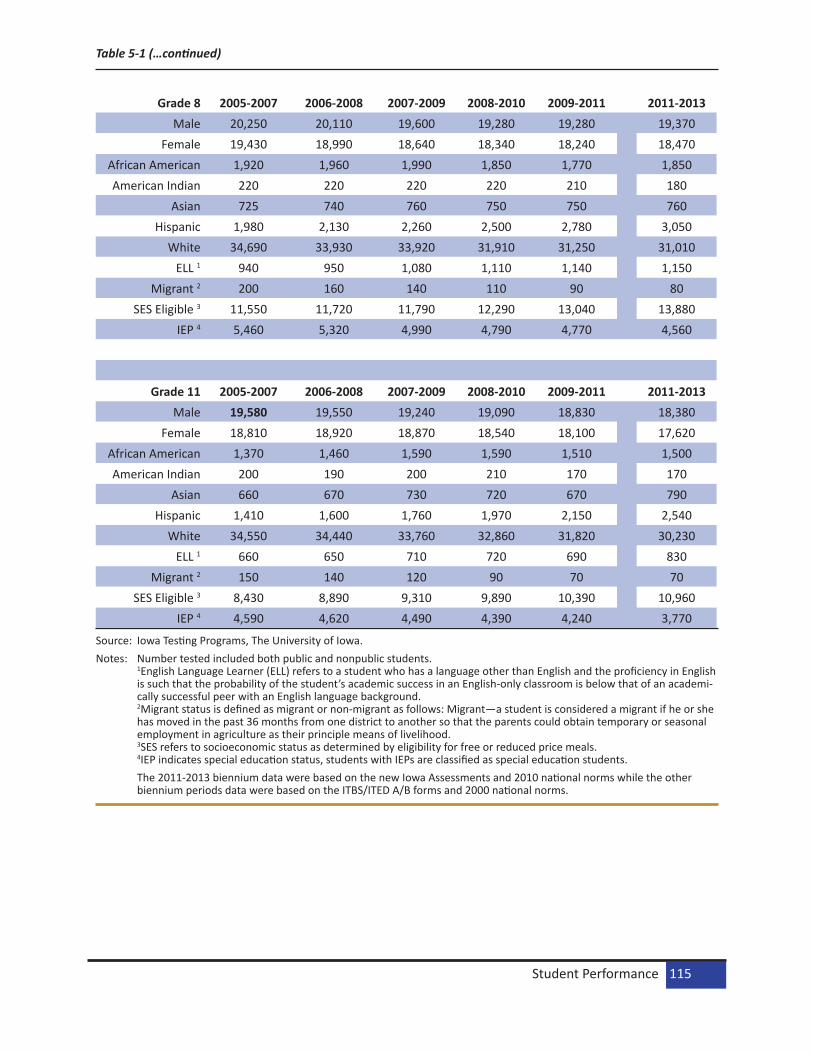
Table 5-1 (…continued)
Source: Iowa Testing Programs, The University of Iowa.Notes: Number tested included both public and nonpublic students.
1English Language Learner (ELL) refers to a student who has a language other than English and the proficiency in English is such that the probability of the student’s academic success in an English-only classroom is below that of an academi-cally successful peer with an English language background. 2Migrant status is defined as migrant or non-migrant as follows: Migrant—a student is considered a migrant if he or she has moved in the past 36 months from one district to another so that the parents could obtain temporary or seasonal employment in agriculture as their principle means of livelihood. 3SES refers to socioeconomic status as determined by eligibility for free or reduced price meals. 4IEP indicates special education status, students with IEPs are classified as special education students.
The 2011-2013 biennium data were based on the new Iowa Assessments and 2010 national norms while the other biennium periods data were based on the ITBS/ITED A/B forms and 2000 national norms.
Grade 8 2005-2007 2006-2008 2007-2009 2008-2010 2009-2011 2011-2013Male 20,250 20,110 19,600 19,280 19,280 19,370
Female 19,430 18,990 18,640 18,340 18,240 18,470African American 1,920 1,960 1,990 1,850 1,770 1,850American Indian 220 220 220 220 210 180
Asian 725 740 760 750 750 760Hispanic 1,980 2,130 2,260 2,500 2,780 3,050
White 34,690 33,930 33,920 31,910 31,250 31,010ELL 1 940 950 1,080 1,110 1,140 1,150
Migrant 2 200 160 140 110 90 80SES Eligible 3 11,550 11,720 11,790 12,290 13,040 13,880
IEP 4 5,460 5,320 4,990 4,790 4,770 4,560
Grade 11 2005-2007 2006-2008 2007-2009 2008-2010 2009-2011 2011-2013Male 19,580 19,550 19,240 19,090 18,830 18,380
Female 18,810 18,920 18,870 18,540 18,100 17,620African American 1,370 1,460 1,590 1,590 1,510 1,500American Indian 200 190 200 210 170 170
Asian 660 670 730 720 670 790Hispanic 1,410 1,600 1,760 1,970 2,150 2,540
White 34,550 34,440 33,760 32,860 31,820 30,230ELL 1 660 650 710 720 690 830
Migrant 2 150 140 120 90 70 70SES Eligible 3 8,430 8,890 9,310 9,890 10,390 10,960
IEP 4 4,590 4,620 4,490 4,390 4,240 3,770
Student Performance 115
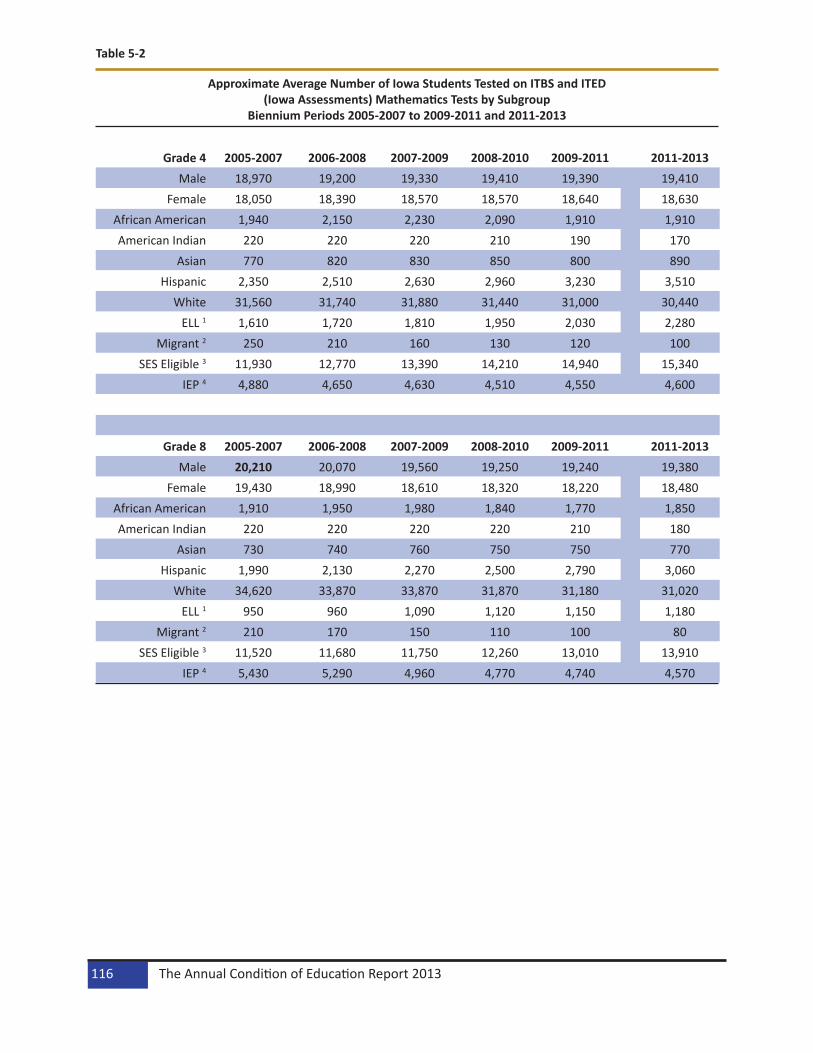
Table 5-2
Approximate Average Number of Iowa Students Tested on ITBS and ITED (Iowa Assessments) Mathematics Tests by Subgroup
Biennium Periods 2005-2007 to 2009-2011 and 2011-2013
Grade 4 2005-2007 2006-2008 2007-2009 2008-2010 2009-2011 2011-2013Male 18,970 19,200 19,330 19,410 19,390 19,410
Female 18,050 18,390 18,570 18,570 18,640 18,630African American 1,940 2,150 2,230 2,090 1,910 1,910American Indian 220 220 220 210 190 170
Asian 770 820 830 850 800 890Hispanic 2,350 2,510 2,630 2,960 3,230 3,510
White 31,560 31,740 31,880 31,440 31,000 30,440ELL 1 1,610 1,720 1,810 1,950 2,030 2,280
Migrant 2 250 210 160 130 120 100SES Eligible 3 11,930 12,770 13,390 14,210 14,940 15,340
IEP 4 4,880 4,650 4,630 4,510 4,550 4,600
Grade 8 2005-2007 2006-2008 2007-2009 2008-2010 2009-2011 2011-2013Male 20,210 20,070 19,560 19,250 19,240 19,380
Female 19,430 18,990 18,610 18,320 18,220 18,480African American 1,910 1,950 1,980 1,840 1,770 1,850American Indian 220 220 220 220 210 180
Asian 730 740 760 750 750 770Hispanic 1,990 2,130 2,270 2,500 2,790 3,060
White 34,620 33,870 33,870 31,870 31,180 31,020ELL 1 950 960 1,090 1,120 1,150 1,180
Migrant 2 210 170 150 110 100 80SES Eligible 3 11,520 11,680 11,750 12,260 13,010 13,910
IEP 4 5,430 5,290 4,960 4,770 4,740 4,570
The Annual Condition of Education Report 2013116

Table 5-2 (…continued)
Source: Iowa Testing Programs, The University of Iowa. Notes: Number tested included both public and nonpublic students.
1English Language Learner (ELL) refers to a student who has a language other than English and the proficiency in English is such that the probability of the student’s academic success in an English-only classroom is below that of an academi-cally successful peer with an English language background. 2Migrant status is defined as migrant or non-migrant as follows: Migrant—a student is considered a migrant if he or she has moved in the past 36 months from one district to another so that the parents could obtain temporary or seasonal employment in agriculture as their principle means of livelihood. 3SES refers to socioeconomic status as determined by eligibility for free or reduced price meals. 4IEP indicates special education status, students with IEPs are classified as special education students.
The 2011-2013 biennium data were based on the new Iowa Assessments and 2010 national norms while the other biennium periods data were based on the ITBS/ITED A/B forms and 2000 national norms.
Grade 11 2005-2007 2006-2008 2007-2009 2008-2010 2009-2011 2011-2013Male 19,570 19,550 19,250 19,100 18,820 18,380
Female 18,810 18,910 18,860 18,540 18,100 17,620African American 1,370 1,450 1,590 1,590 1,510 1,500American Indian 200 190 200 210 170 170
Asian 660 680 730 720 680 790Hispanic 1,400 1,600 1,760 1,970 2,150 2,540
White 34,540 34,430 33,750 32,850 31,810 30,230ELL 1 670 660 720 730 700 850
Migrant 2 150 150 120 90 70 70SES Eligible 3 8,420 8,890 9,310 9,890 10,380 10,950
IEP 4 4,580 4,620 4,490 4,400 4,240 3,770
Student Performance 117

Table 5-3
Approximate Average Number of Iowa Students Tested on ITBS and ITED (Iowa Assessments) Science Tests by Subgroup
Biennium Periods 2005-2007 to 2009-2011 and 2011-2013
Source: Iowa Testing Programs, The University of Iowa. Notes: Number tested included both public and nonpublic students.
1English Language Learner (ELL) refers to a student who has a language other than English and the proficiency in English is such that the probability of the student’s academic success in an English-only classroom is below that of an academi-cally successful peer with an English language background. 2Migrant status is defined as migrant or non-migrant as follows: Migrant—a student is considered a migrant if he or she has moved in the past 36 months from one district to another so that the parents could obtain temporary or seasonal employment in agriculture as their principle means of livelihood. 3SES refers to socioeconomic status as determined by eligibility for free or reduced price meals. 4IEP indicates special education status, students with IEPs are classified as special education students.
The 2011-2013 biennium data were based on the new Iowa Assessments and 2010 national norms while the other biennium periods data were based on the ITBS/ITED A/B forms and 2000 national norms.
Grade 8 2005-2007 2006-2008 2007-2009 2008-2010 2009-2011 2011-2013Male 20,150 20,010 19,500 19,190 19,180 19,290
Female 19,330 18,880 18,540 18,260 18,170 18,400African American 1,900 1,950 1,980 1,840 1,770 1,850American Indian 220 220 220 220 210 180
Asian 720 740 760 750 750 770Hispanic 1,980 2,120 2,260 2,500 2,790 3,060
White 34,520 33,760 32,750 31,750 31,090 30,850ELL 1 942 950 1,080 1,110 1,140 1,180
Migrant 2 200 160 140 110 90 80SES Eligible 3 11,520 11,680 11,760 12,270 13,020 13,890
IEP 4 5,420 5,300 4,980 4,780 4,760 4,560
Grade 11 2005-2007 2006-2008 2007-2009 2008-2010 2009-2011 2011-2013Male 19,410 19,420 19,140 19,000 18,730 18,350
Female 18,330 18,800 18,770 18,470 18,030 17,600African American 1,330 1,420 1,570 1,580 1,490 1,490American Indian 200 190 200 200 170 170
Asian 650 670 720 720 670 790Hispanic 1,370 1,570 1,750 1,950 2,130 2,540
White 34,330 34,250 33,600 32,730 31,710 30,200ELL 1 650 640 700 720 690 840
Migrant 2 150 140 120 90 70 70SES Eligible 3 8,300 8,870 9,230 9,810 10,300 10,930
IEP 4 4,510 4,550 4,450 4,360 4,200 3,760
The Annual Condition of Education Report 2013118

Reading
Indicator: : Percentage of 4th, 8th, and 11th grade students achieving proficient or higher reading status on the Iowa Assessments Reading Tests (reported for all students and by gender, race/ethnicity, socioeconomic status, disability, primary language status, and migrant status).
Figure 5-1
Percent of Iowa Fourth Grade Students Proficient on ITBS/Iowa Assessments Reading Test Biennium Periods 2005-2007 to 2009-2011 and 2011-2013
79.0 78.9 79.2 79.5 80.0 74.6
0
20
40
60
80
100
2005-2007 2006-2008 2007-2009 2008-2010 2009-2011 2011-2013
Perc
ent
Biennium Periods
Source: Iowa Testing Programs, The University of Iowa.Notes: Percentages for each biennium period represent average percentages of proficient students for the two school years
represented, e.g., 2009-2011 represents the average for the 2009-2010 and the 2010-2011 school years. A student designated as proficient can, at a minimum, do the following: Usually understands factual information and new words in context. Usually is able to make inferences and interpret either nonliteral language or information in new contexts. Often can determine a selection’s main idea and analyze its style and structure.
The 2011-2013 biennium data were based on the new Iowa Assessments and 2010 national norms while the other biennium periods data were based on the ITBS/ITED A/B forms and 2000 national norms.
Student Performance 119

Figure 5-2
Percent of Iowa Fourth Grade Students Proficient on ITBS/Iowa Assessments Reading Test by Gender Biennium Periods 2005-2007 to 2009-2011 and 2011-2013
81.2 81.0 81.3 81.5 81.9 76.7 76.8 77.0 77.2 77.7 78.372.5
0
20
40
60
80
100
2005-2007
2006-2008
2007-2009
2008-2010
2009-2011
2011-2013
2005-2007
2006-2008
2007-2009
2008-2010
2009-2011
2011-2013
Per
cent
Biennium Periods
Female Male
Source: Iowa Testing Programs, The University of Iowa.Notes: Percentages for each biennium period represent average percentages of proficient students for the two school years
represented, e.g., 2009-2011 represents the average for the 2009-2010 and the 2010-2011 school years. A student designated as proficient can, at a minimum, do the following: Usually understands factual information and new words in context. Usually is able to make inferences and interpret either nonliteral language or information in new contexts. Often can determine a selection’s main idea and analyze its style and structure.
The 2011-2013 biennium data were based on the new Iowa Assessments and 2010 national norms while the other biennium periods data were based on the ITBS/ITED A/B forms and 2000 national norms.
The Annual Condition of Education Report 2013120

Figure 5-3
Percent of Iowa Fourth Grade Students Proficient on ITBS/Iowa Assessments Reading Test by Race/Ethnicity Biennium Periods 2005-2007 to 2009-2011 and 2011-2013
81.9
81.9
82.2
82.9
83.6
78.7 56
.256
.156
.355
.154
.7
46.5
59.9
61.4
62.6
62.7
63.2
57.3
82.0
80.4
80.9
82.0
80.9
73.9
67.7
68.6
63.6
63.7 67
.9
60.7
0102030405060708090
100
2005
-200
720
06-2
008
2007
-200
920
08-2
010
2009
-201
1
2011
-201
320
05-2
007
2006
-200
820
07-2
009
2008
-201
020
09-2
011
2011
-201
320
05-2
007
2006
-200
820
07-2
009
2008
-201
020
09-2
011
2011
-201
320
05-2
007
2006
-200
820
07-2
009
2008
-201
020
09-2
011
2011
-201
320
05-2
007
2006
-200
820
07-2
009
2008
-201
020
09-2
011
2011
-201
3
Per
cent
Biennium Periods
White African AmericanHispanic AsianAmerican Indian
Source: Iowa Testing Programs, The University of Iowa.Notes: Percentages for each biennium period represent average percentages of proficient students for the two school years
represented, e.g., 2009-2011 represents the average for the 2009-2010 and the 2010-2011 school years. A student designated as proficient can, at a minimum, do the following: Usually understands factual information and new words in context. Usually is able to make inferences and interpret either nonliteral language or information in new contexts. Often can determine a selection’s main idea and analyze its style and structure.
The 2011-2013 biennium data were based on the new Iowa Assessments and 2010 national norms while the other biennium periods data were based on the ITBS/ITED A/B forms and 2000 national norms.
Student Performance 121

Figure 5-4
Percent of Iowa Fourth Grade Students Proficient on ITBS/Iowa Assessments Reading Test by Socioeconomic Status* Biennium Periods 2005-2007 to 2009-2011 and 2011-2013
65.6 65.7 66.4 67.2 68.561.4
85.3 85.8 86.2 86.9 87.683.5
0.0
20.0
40.0
60.0
80.0
100.0
2005-2007 2006-2008 2007-2009 2008-2010 2009-2011 2011-2013
Per
cent
Biennium Periods
Eligible for Free or Reduced Price MealsNot Eligible for Free or Reduced Price Meals
Source: Iowa Testing Programs, The University of Iowa.Notes: Percentages for each biennium period represent average percentages of proficient students for the two school years
represented, e.g., 2009-2011 represents the average for the 2009-2010 and the 2010-2011 school years. A student designated as proficient can, at a minimum, do the following: Usually understands factual information and new words in context. Usually is able to make inferences and interpret either nonliteral language or information in new contexts. Often can determine a selection’s main idea and analyze its style and structure. *Socioeconomic Status is determined by eligibility for free or reduced price meals.
The 2011-2013 biennium data were based on the new Iowa Assessments and 2010 national norms while the other biennium periods data were based on the ITBS/ITED A/B forms and 2000 national norms.
The Annual Condition of Education Report 2013122
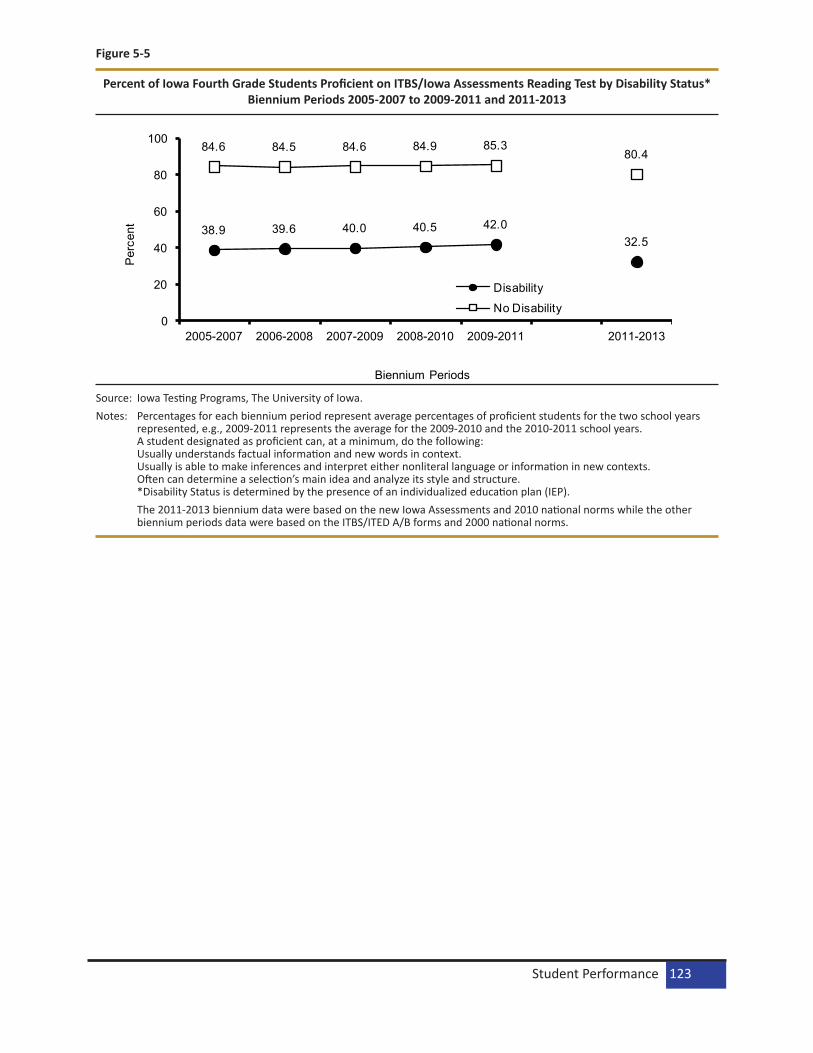
Figure 5-5
Percent of Iowa Fourth Grade Students Proficient on ITBS/Iowa Assessments Reading Test by Disability Status* Biennium Periods 2005-2007 to 2009-2011 and 2011-2013
38.9 39.6 40.0 40.5 42.032.5
84.6 84.5 84.6 84.9 85.380.4
0
20
40
60
80
100
2005-2007 2006-2008 2007-2009 2008-2010 2009-2011 2011-2013
Per
cent
Biennium Periods
Disability
No Disability
Source: Iowa Testing Programs, The University of Iowa.Notes: Percentages for each biennium period represent average percentages of proficient students for the two school years
represented, e.g., 2009-2011 represents the average for the 2009-2010 and the 2010-2011 school years. A student designated as proficient can, at a minimum, do the following: Usually understands factual information and new words in context. Usually is able to make inferences and interpret either nonliteral language or information in new contexts. Often can determine a selection’s main idea and analyze its style and structure. *Disability Status is determined by the presence of an individualized education plan (IEP).
The 2011-2013 biennium data were based on the new Iowa Assessments and 2010 national norms while the other biennium periods data were based on the ITBS/ITED A/B forms and 2000 national norms.
Student Performance 123

Figure 5-6
Percent of Iowa Fourth Grade Students Proficient on ITBS/Iowa Assessments Reading Test by Primary Language Status Biennium Periods 2005-2007 to 2009-2011 and 2011-2013
48.7 50.1 52.1 52.1 52.045.9
79.1 79.1 80.5 81.0 81.776.4
0
20
40
60
80
100
2005-2007 2006-2008 2007-2009 2008-2010 2009-2011 2011-2013
Per
cent
Biennium Periods
ELL* English
Source: Iowa Testing Programs, The University of Iowa.Notes: Percentages for each biennium period represent average percentages of proficient students for the two school years
represented, e.g., 2009-2011 represents the average for the 2009-2010 and the 2010-2011 school years. A student designated as proficient can, at a minimum, do the following: Usually understands factual information and new words in context. Usually is able to make inferences and interpret either nonliteral language or information in new contexts. Often can determine a selection’s main idea and analyze its style and structure. *Primary Language Status is classified by English and English Language Learner and determined according to the follow-ing definition: English Language Learner refers to a student who has a language other than English and the proficiency in English is such that the probability of the student’s academic success in an English-only classroom is below that of an academically successful peer with an English language background.
The 2011-2013 biennium data were based on the new Iowa Assessments and 2010 national norms while the other biennium periods data were based on the ITBS/ITED A/B forms and 2000 national norms.
The Annual Condition of Education Report 2013124

Figure 5-7
Percent of Iowa Fourth Grade Students Proficient on ITBS/Iowa Assessments Reading Test by Migrant Status* Biennium Periods 2005-2007 to 2009-2011 and 2011-2013
51.6 54.8 55.4 55.1 56.2
41.0
79.1 79.1 80.5 79.7 81.776.4
0
20
40
60
80
100
2005-2007 2006-2008 2007-2009 2008-2010 2009-2011 2011-2013
Per
cent
Biennium Periods
Migrant Non-Migrant
Source: Iowa Testing Programs, The University of Iowa.Notes: Percentages for each biennium period represent average percentages of proficient students for the two school years
represented, e.g., 2009-2011 represents the average for the 2009-2010 and the 2010-2011 school years. A student designated as proficient can, at a minimum, do the following: Usually understands factual information and new words in context. Usually is able to make inferences and interpret either nonliteral language or information in new contexts. Often can determine a selection’s main idea and analyze its style and structure. *Migrant status is defined as migrant or non-migrant as follows: Migrant—a student is considered a migrant if he or she has moved in the past 36 months from one district to another so that the parents could obtain temporary or seasonal employment in agriculture as their principle means of livelihood.
The 2011-2013 biennium data were based on the new Iowa Assessments and 2010 national norms while the other biennium periods data were based on the ITBS/ITED A/B forms and 2000 national norms.
Student Performance 125

Figure 5-8
Percent of Iowa Eighth Grade Students Proficient on ITBS/Iowa Assessments Reading Test Biennium Periods 2005-2007 to 2009-2011 and 2011-2013
72.3 72.5 72.8 73.8 74.365.8
0
20
40
60
80
100
2005-2007 2006-2008 2007-2009 2008-2010 2009-2011 2011-2013
Per
cent
Biennium Periods
Source: Iowa Testing Programs, The University of Iowa.Notes: Percentages for each biennium period represent average percentages of proficient students for the two school years
represented, e.g., 2009-2011 represents the average for the 2009-2010 and the 2010-2011 school years. A student designated as proficient can, at a minimum, do the following: Usually is able to make inferences and interpret either nonliteral language or information in new contexts. Often is able to determine a selection’s main idea, identify the author’s purpose or viewpoint, and analyze its style and structure.
The 2011-2013 biennium data were based on the new Iowa Assessments and 2010 national norms while the other biennium periods data were based on the ITBS/ITED A/B forms and 2000 national norms.
The Annual Condition of Education Report 2013126

Figure 5-9
Percent of Iowa Eighth Grade Students Proficient on ITBS/Iowa Assessments Reading Test by Gender Biennium Periods 2005-2007 to 2009-2011 and 2011-2013
74.2 74.3 75.1 76.2 76.468.2 70.2 70.7 70.6 71.5 72.3
63.5
0
20
40
60
80
100
2005-2007
2006-2008
2007-2009
2008-2010
2009-2011
2011-2013
2005-2007
2006-2008
2007-2009
2008-2010
2009-2011
2011-2013
Per
cent
Biennium Periods
Female Male
Source: Iowa Testing Programs, The University of Iowa.Notes: Percentages for each biennium period represent average percentages of proficient students for the two school years
represented, e.g., 2009-2011 represents the average for the 2009-2010 and the 2010-2011 school years. A student designated as proficient can, at a minimum, do the following: Usually is able to make inferences and interpret either nonliteral language or information in new contexts. Often is able to determine a selection’s main idea, identify the author’s purpose or viewpoint, and analyze its style and structure.
The 2011-2013 biennium data were based on the new Iowa Assessments and 2010 national norms while the other biennium periods data were based on the ITBS/ITED A/B forms and 2000 national norms.
Student Performance 127

Figure 5-10
Percent of Iowa Eighth Grade Students Proficient on ITBS/Iowa Assessments Reading Test by Race/Ethnicity Biennium Periods 2005-2007 to 2009-2011 and 2011-2013
75.2
75.7
76.2
77.0
77.5
69.8 44
.444
.245
.246
.346
.0
36.9
49.0
48.3
49.1 54
.1 57.6
46.1
74.0
74.3
74.3
77.3
77.9
66.3
59.1
60.7
61.2
62.2
64.4
45.6
0102030405060708090
100
2005
-200
720
06-2
008
2007
-200
920
08-2
010
2009
-201
1
2011
-201
320
05-2
007
2006
-200
820
07-2
009
2008
-201
020
09-2
011
2011
-201
320
05-2
007
2006
-200
820
07-2
009
2008
-201
020
09-2
011
2011
-201
320
05-2
007
2006
-200
820
07-2
009
2008
-201
020
09- 2
011
2011
-201
320
05-2
007
2006
-200
820
07-2
009
2008
-201
020
09-2
011
2011
-201
3
Per
cent
Biennium Periods
White African American HispanicAsian American Indian
Source: Iowa Testing Programs, The University of Iowa.Notes: Percentages for each biennium period represent average percentages of proficient students for the two school years
represented, e.g., 2009-2011 represents the average for the 2009-2010 and the 2010-2011 school years. A student designated as proficient can, at a minimum, do the following: Usually is able to make inferences and interpret either nonliteral language or information in new contexts. Often is able to determine a selection’s main idea, identify the author’s purpose or viewpoint, and analyze its style and structure.
The 2011-2013 biennium data were based on the new Iowa Assessments and 2010 national norms while the other biennium periods data were based on the ITBS/ITED A/B forms and 2000 national norms.
The Annual Condition of Education Report 2013128

Figure 5-11
Percent of Iowa Eighth Grade Students Proficient on ITBS/Iowa Assessments Reading Test by Socioeconomic Status* Biennium Periods 2005-2007 to 2009-2011 and 2011-2013
55.0 54.7 55.1 57.4 59.349.2
79.3 80.1 80.7 81.7 82.275.5
0.0
20.0
40.0
60.0
80.0
100.0
2005-2007 2006-2008 2007-2009 2008-2010 2009-2011 2011-2013
Per
cent
Biennium Periods
Eligible for Free or Reduced Price MealsNot Eligible for Free or Reduced Price Meals
Source: Iowa Testing Programs, The University of Iowa.Notes: Percentages for each biennium period represent average percentages of proficient students for the two school years
represented, e.g., 2009-2011 represents the average for the 2009-2010 and the 2010-2011 school years. A student designated as proficient can, at a minimum, do the following: Usually is able to make inferences and interpret either nonliteral language or information in new contexts. Often is able to determine a selection’s main idea, identify the author’s purpose or viewpoint, and analyze its style and structure. *Socioeconomic Status is determined by eligibility for free or reduced price meals.
The 2011-2013 biennium data were based on the new Iowa Assessments and 2010 national norms while the other biennium periods data were based on the ITBS/ITED A/B forms and 2000 national norms.
Student Performance 129

Figure 5-12
Percent of Iowa Eighth Grade Students Proficient on ITBS/Iowa Assessments Reading Test by Disability Status* Biennium Periods 2005-2007 to 2009-2011 and 2011-2013
24.7 24.5 24.6 26.0 27.017.2
79.8 80.0 80.0 80.8 81.172.5
0
20
40
60
80
100
2005-2007 2006-2008 2007-2009 2008-2010 2009-2011 2011-2013
Per
cent
Biennium Periods
Disability No Disability
Source: Iowa Testing Programs, The University of Iowa.Notes: Percentages for each biennium period represent average percentages of proficient students for the two school years
represented, e.g., 2009-2011 represents the average for the 2009-2010 and the 2010-2011 school years. A student designated as proficient can, at a minimum, do the following: Usually is able to make inferences and interpret either nonliteral language or information in new contexts. Often is able to determine a selection’s main idea, identify the author’s purpose or viewpoint, and analyze its style and structure. *Disability Status is determined by the presence of an individualized education plan (IEP).
The 2011-2013 biennium data were based on the new Iowa Assessments and 2010 national norms while the other biennium periods data were based on the ITBS/ITED A/B forms and 2000 national norms.
The Annual Condition of Education Report 2013130
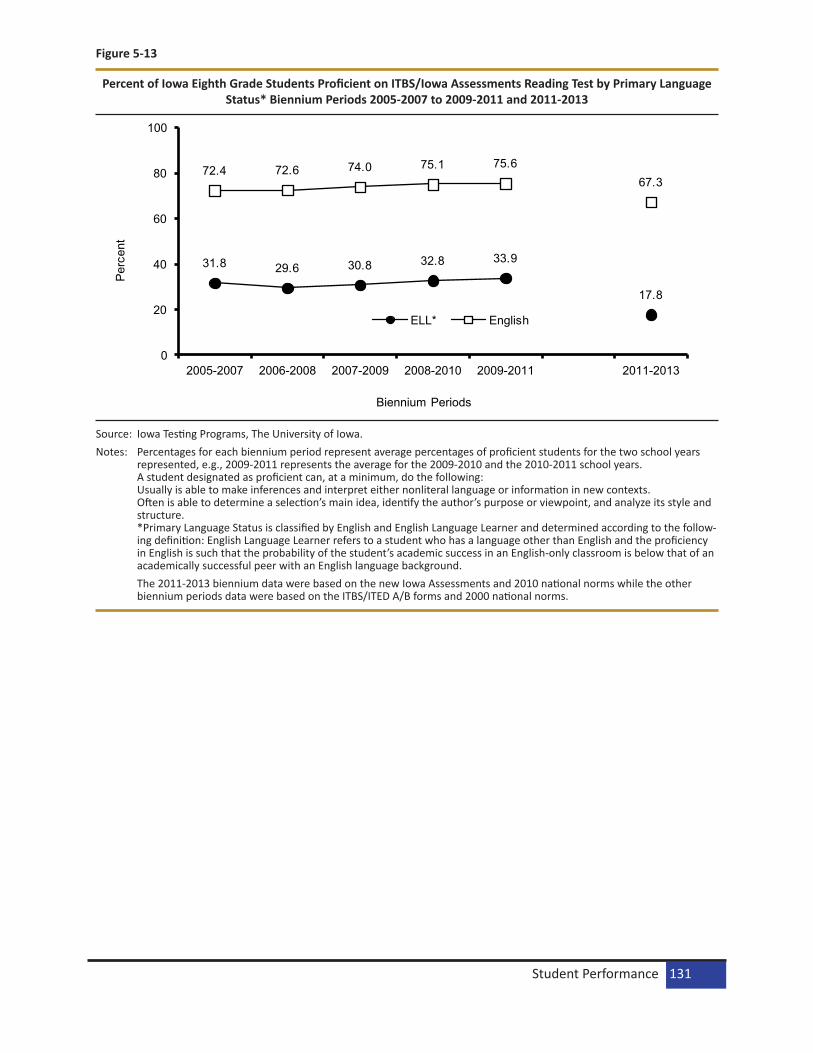
Figure 5-13
Percent of Iowa Eighth Grade Students Proficient on ITBS/Iowa Assessments Reading Test by Primary Language Status* Biennium Periods 2005-2007 to 2009-2011 and 2011-2013
31.8 29.6 30.8 32.8 33.9
17.8
72.4 72.6 74.0 75.1 75.667.3
0
20
40
60
80
100
2005-2007 2006-2008 2007-2009 2008-2010 2009-2011 2011-2013
Per
cent
Biennium Periods
ELL* English
Source: Iowa Testing Programs, The University of Iowa.Notes: Percentages for each biennium period represent average percentages of proficient students for the two school years
represented, e.g., 2009-2011 represents the average for the 2009-2010 and the 2010-2011 school years. A student designated as proficient can, at a minimum, do the following: Usually is able to make inferences and interpret either nonliteral language or information in new contexts. Often is able to determine a selection’s main idea, identify the author’s purpose or viewpoint, and analyze its style and structure. *Primary Language Status is classified by English and English Language Learner and determined according to the follow-ing definition: English Language Learner refers to a student who has a language other than English and the proficiency in English is such that the probability of the student’s academic success in an English-only classroom is below that of an academically successful peer with an English language background.
The 2011-2013 biennium data were based on the new Iowa Assessments and 2010 national norms while the other biennium periods data were based on the ITBS/ITED A/B forms and 2000 national norms.
Student Performance 131

Figure 5-14
Percent of Iowa Eighth Grade Students Proficient on ITBS/Iowa Assessments Reading Test by Migrant Status* Biennium Periods 2005-2007 to 2009-2011 and 2011-2013
34.8 35.841.3 38.1 38.3
26.3
72.4 72.6 74.0 73.9 75.667.3
0
20
40
60
80
100
2005-2007 2006-2008 2007-2009 2008-2010 2009-2011 2011-2013
Per
cent
Biennium Periods
MigrantNon-Migrant
Source: Iowa Testing Programs, The University of Iowa.Notes: Percentages for each biennium period represent average percentages of proficient students for the two school years
represented, e.g., 2009-2011 represents the average for the 2009-2010 and the 2010-2011 school years. A student designated as proficient can, at a minimum, do the following: Usually is able to make inferences and interpret either nonliteral language or information in new contexts. Often is able to determine a selection’s main idea, identify the author’s purpose or viewpoint, and analyze its style and structure. *Migrant status is defined as migrant or non-migrant as follows: Migrant—a student is considered a migrant if he or she has moved in the past 36 months from one district to another so that the parents could obtain temporary or seasonal employment in agriculture as their principle means of livelihood.
The 2011-2013 biennium data were based on the new Iowa Assessments and 2010 national norms while the other biennium periods data were based on the ITBS/ITED A/B forms and 2000 national norms.
The Annual Condition of Education Report 2013132
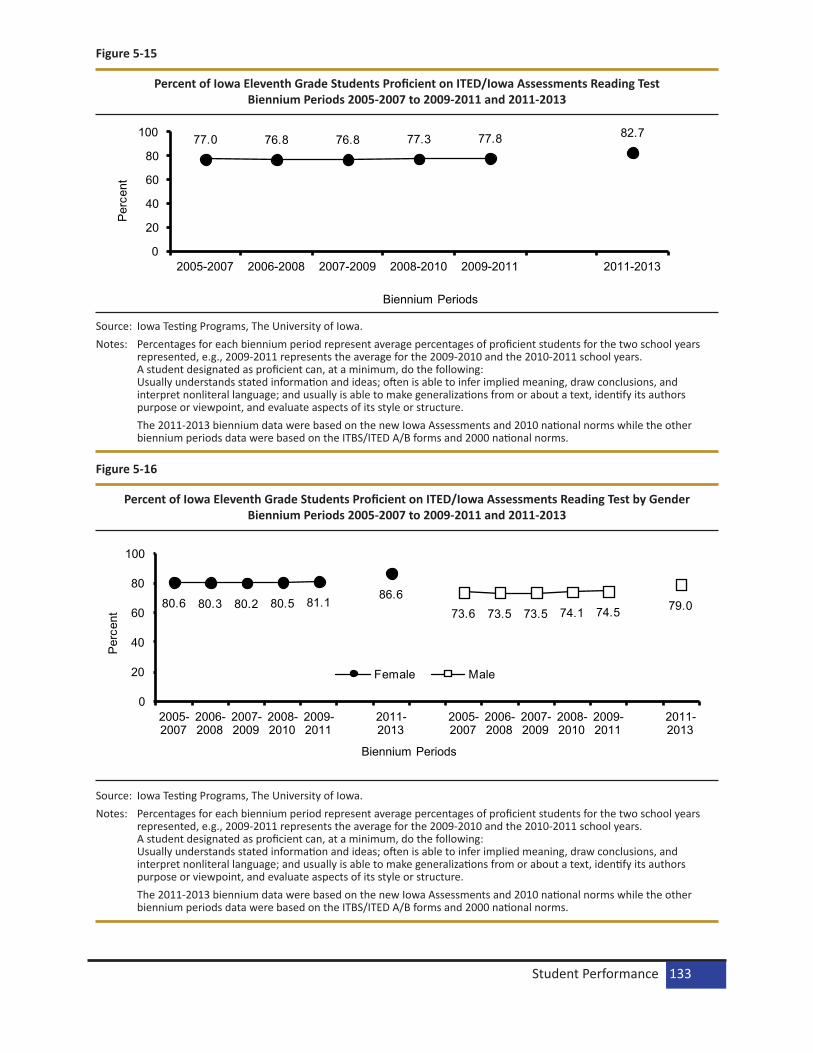
Figure 5-15
Percent of Iowa Eleventh Grade Students Proficient on ITED/Iowa Assessments Reading Test Biennium Periods 2005-2007 to 2009-2011 and 2011-2013
77.0 76.8 76.8 77.3 77.8 82.7
0
20
40
60
80
100
2005-2007 2006-2008 2007-2009 2008-2010 2009-2011 2011-2013
Per
cent
Biennium Periods
Source: Iowa Testing Programs, The University of Iowa.Notes: Percentages for each biennium period represent average percentages of proficient students for the two school years
represented, e.g., 2009-2011 represents the average for the 2009-2010 and the 2010-2011 school years. A student designated as proficient can, at a minimum, do the following: Usually understands stated information and ideas; often is able to infer implied meaning, draw conclusions, and interpret nonliteral language; and usually is able to make generalizations from or about a text, identify its authors purpose or viewpoint, and evaluate aspects of its style or structure.
The 2011-2013 biennium data were based on the new Iowa Assessments and 2010 national norms while the other biennium periods data were based on the ITBS/ITED A/B forms and 2000 national norms.
Figure 5-16
Percent of Iowa Eleventh Grade Students Proficient on ITED/Iowa Assessments Reading Test by Gender Biennium Periods 2005-2007 to 2009-2011 and 2011-2013
80.6 80.3 80.2 80.5 81.186.6
73.6 73.5 73.5 74.1 74.5 79.0
0
20
40
60
80
100
2005-2007
2006-2008
2007-2009
2008-2010
2009-2011
2011-2013
2005-2007
2006-2008
2007-2009
2008-2010
2009-2011
2011-2013
Per
cent
Biennium Periods
Female Male
Source: Iowa Testing Programs, The University of Iowa.Notes: Percentages for each biennium period represent average percentages of proficient students for the two school years
represented, e.g., 2009-2011 represents the average for the 2009-2010 and the 2010-2011 school years. A student designated as proficient can, at a minimum, do the following: Usually understands stated information and ideas; often is able to infer implied meaning, draw conclusions, and interpret nonliteral language; and usually is able to make generalizations from or about a text, identify its authors purpose or viewpoint, and evaluate aspects of its style or structure.
The 2011-2013 biennium data were based on the new Iowa Assessments and 2010 national norms while the other biennium periods data were based on the ITBS/ITED A/B forms and 2000 national norms.
Student Performance 133

Figure 5-17
Percent of Iowa Eleventh Grade Students Proficient on ITED/Iowa Assessments Reading Test by Race/Ethnicity Biennium Periods 2005-2007 to 2009-2011 and 2011-2013
79.1
79.1
79.2
80.0
80.6 85
.450
.150
.150
.849
.248
.5
59.4
53.2
53.8 55.9 57.9 59.9 69
.3 77.6
75.5
76.1
77.5
76.5
74.7
66.4
65.7
59.6 62.1 65.1 74
.6
0
10
20
30
40
50
60
70
80
90
100
2005
-200
720
06-2
008
2007
-200
920
08-2
010
2009
-201
1
2011
-201
320
05-2
007
2006
-200
820
07-2
009
2008
-201
020
09-2
011
2011
-201
320
05-2
007
2006
-200
820
07- 2
009
2008
-201
020
09-2
011
2011
-201
320
05-2
007
2006
-200
820
07-2
009
2008
-201
020
09-2
011
2011
-201
320
05-2
007
2006
-200
820
07-2
009
2008
-201
020
09-2
011
2011
-201
3
Perc
ent
Biennium Periods
White African American HispanicAsian American Indian
Source: Iowa Testing Programs, The University of Iowa.Notes: Percentages for each biennium period represent average percentages of proficient students for the two school years
represented, e.g., 2009-2011 represents the average for the 2009-2010 and the 2010-2011 school years. A student designated as proficient can, at a minimum, do the following: Usually understands stated information and ideas; often is able to infer implied meaning, draw conclusions, and interpret nonliteral language; and usually is able to make generalizations from or about a text, identify its authors purpose or viewpoint, and evaluate aspects of its style or structure.
The 2011-2013 biennium data were based on the new Iowa Assessments and 2010 national norms while the other biennium periods data were based on the ITBS/ITED A/B forms and 2000 national norms.
The Annual Condition of Education Report 2013134

Figure 5-18
Percent of Iowa Eleventh Grade Students Proficient on ITED/Iowa Assessments Reading Test by Socioeconomic Status* Biennium Periods 2005-2007 to 2009-2011 and 2011-2013
59.8 59.6 60.3 61.3 62.169.3
82.0 81.9 82.1 83.0 83.988.6
0.0
20.0
40.0
60.0
80.0
100.0
2005-2007 2006-2008 2007-2009 2008-2010 2009-2011 2011-2013
Per
cent
Biennium Periods
Eligible for Free or Reduced Price MealsNot Eligible for Free or Reduced Price Meals
Source: Iowa Testing Programs, The University of Iowa.Notes: Percentages for each biennium period represent average percentages of proficient students for the two school years
represented, e.g., 2009-2011 represents the average for the 2009-2010 and the 2010-2011 school years. A student designated as proficient can, at a minimum, do the following: Usually understands stated information and ideas; often is able to infer implied meaning, draw conclusions, and interpret nonliteral language; and usually is able to make generalizations from or about a text, identify its authors purpose or viewpoint, and evaluate aspects of its style or structure. *Socioeconomic Status is determined by eligibility for free or reduced price meals.
The 2011-2013 biennium data were based on the new Iowa Assessments and 2010 national norms while the other biennium periods data were based on the ITBS/ITED A/B forms and 2000 national norms.
Student Performance 135
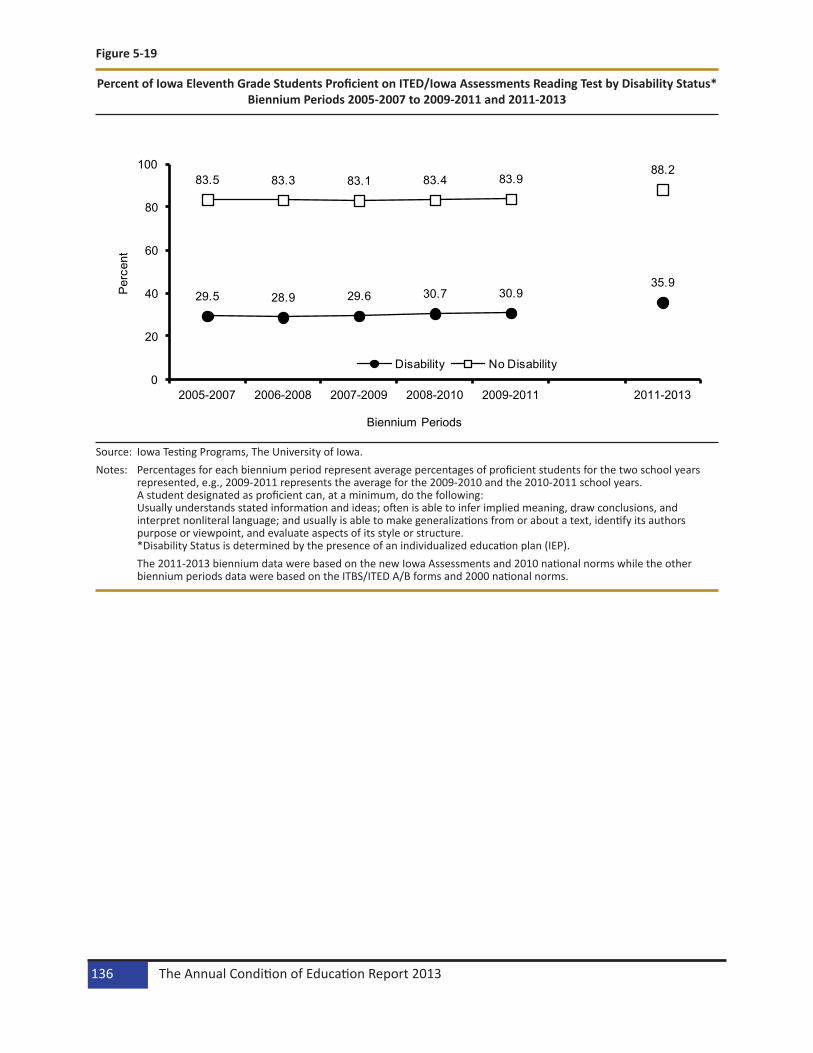
Figure 5-19
Percent of Iowa Eleventh Grade Students Proficient on ITED/Iowa Assessments Reading Test by Disability Status* Biennium Periods 2005-2007 to 2009-2011 and 2011-2013
29.5 28.9 29.6 30.7 30.935.9
83.5 83.3 83.1 83.4 83.988.2
0
20
40
60
80
100
2005-2007 2006-2008 2007-2009 2008-2010 2009-2011 2011-2013
Per
cent
Biennium Periods
Disability No Disability
Source: Iowa Testing Programs, The University of Iowa.Notes: Percentages for each biennium period represent average percentages of proficient students for the two school years
represented, e.g., 2009-2011 represents the average for the 2009-2010 and the 2010-2011 school years. A student designated as proficient can, at a minimum, do the following: Usually understands stated information and ideas; often is able to infer implied meaning, draw conclusions, and interpret nonliteral language; and usually is able to make generalizations from or about a text, identify its authors purpose or viewpoint, and evaluate aspects of its style or structure. *Disability Status is determined by the presence of an individualized education plan (IEP).
The 2011-2013 biennium data were based on the new Iowa Assessments and 2010 national norms while the other biennium periods data were based on the ITBS/ITED A/B forms and 2000 national norms.
The Annual Condition of Education Report 2013136
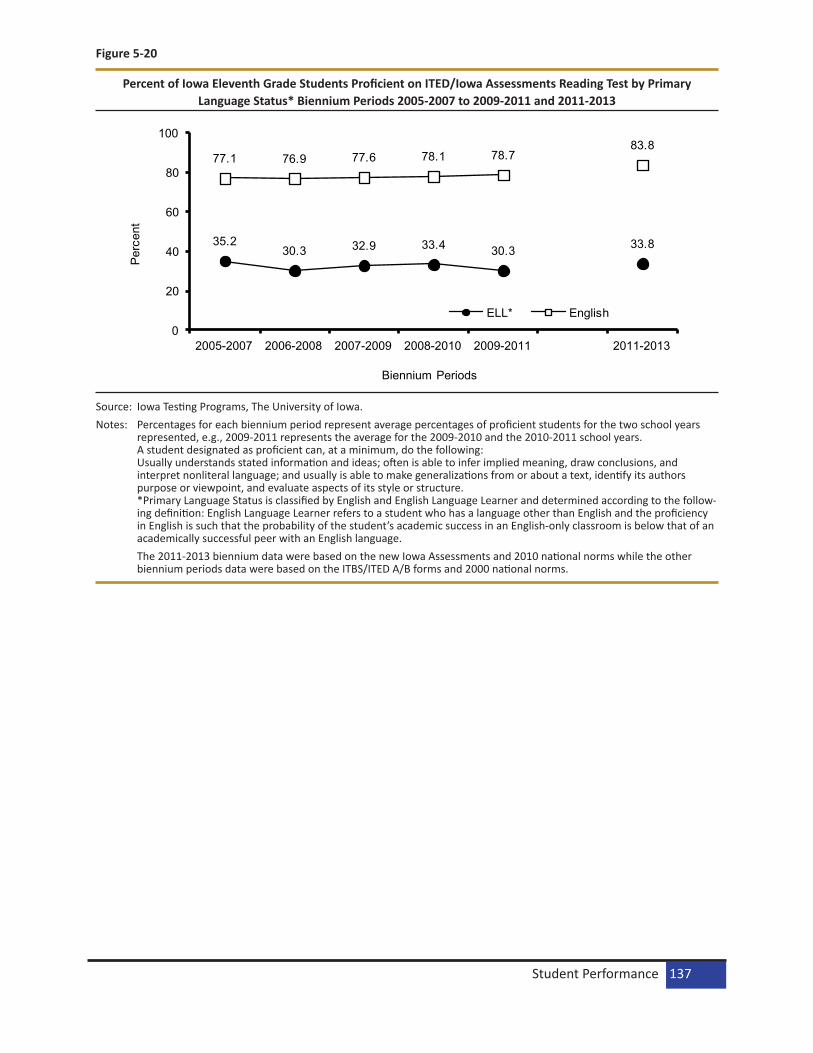
Figure 5-20
Percent of Iowa Eleventh Grade Students Proficient on ITED/Iowa Assessments Reading Test by Primary Language Status* Biennium Periods 2005-2007 to 2009-2011 and 2011-2013
35.230.3 32.9 33.4 30.3 33.8
77.1 76.9 77.6 78.1 78.783.8
0
20
40
60
80
100
2005-2007 2006-2008 2007-2009 2008-2010 2009-2011 2011-2013
Per
cent
Biennium Periods
ELL* English
Source: Iowa Testing Programs, The University of Iowa.Notes: Percentages for each biennium period represent average percentages of proficient students for the two school years
represented, e.g., 2009-2011 represents the average for the 2009-2010 and the 2010-2011 school years. A student designated as proficient can, at a minimum, do the following: Usually understands stated information and ideas; often is able to infer implied meaning, draw conclusions, and interpret nonliteral language; and usually is able to make generalizations from or about a text, identify its authors purpose or viewpoint, and evaluate aspects of its style or structure. *Primary Language Status is classified by English and English Language Learner and determined according to the follow-ing definition: English Language Learner refers to a student who has a language other than English and the proficiency in English is such that the probability of the student’s academic success in an English-only classroom is below that of an academically successful peer with an English language.
The 2011-2013 biennium data were based on the new Iowa Assessments and 2010 national norms while the other biennium periods data were based on the ITBS/ITED A/B forms and 2000 national norms.
Student Performance 137
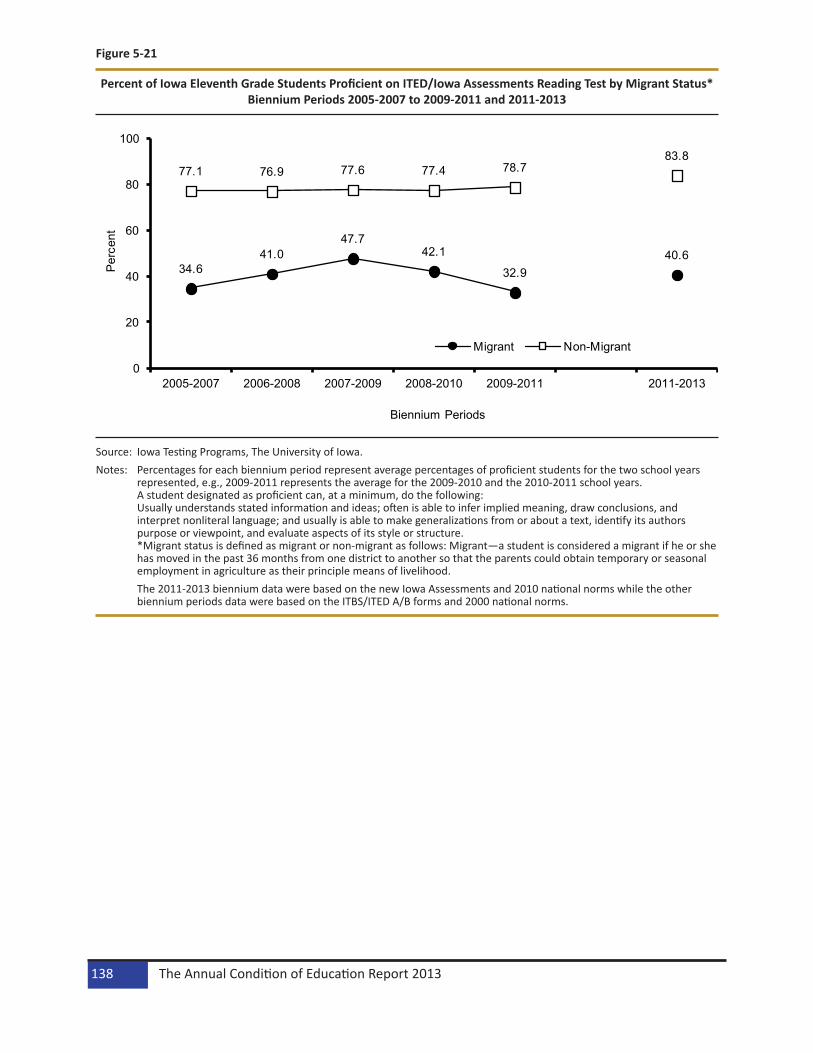
Figure 5-21
Percent of Iowa Eleventh Grade Students Proficient on ITED/Iowa Assessments Reading Test by Migrant Status* Biennium Periods 2005-2007 to 2009-2011 and 2011-2013
34.641.0
47.742.1
32.940.6
77.1 76.9 77.6 77.4 78.783.8
0
20
40
60
80
100
2005-2007 2006-2008 2007-2009 2008-2010 2009-2011 2011-2013
Per
cent
Biennium Periods
Migrant Non-Migrant
Source: Iowa Testing Programs, The University of Iowa.Notes: Percentages for each biennium period represent average percentages of proficient students for the two school years
represented, e.g., 2009-2011 represents the average for the 2009-2010 and the 2010-2011 school years. A student designated as proficient can, at a minimum, do the following: Usually understands stated information and ideas; often is able to infer implied meaning, draw conclusions, and interpret nonliteral language; and usually is able to make generalizations from or about a text, identify its authors purpose or viewpoint, and evaluate aspects of its style or structure. *Migrant status is defined as migrant or non-migrant as follows: Migrant—a student is considered a migrant if he or she has moved in the past 36 months from one district to another so that the parents could obtain temporary or seasonal employment in agriculture as their principle means of livelihood.
The 2011-2013 biennium data were based on the new Iowa Assessments and 2010 national norms while the other biennium periods data were based on the ITBS/ITED A/B forms and 2000 national norms.
The Annual Condition of Education Report 2013138
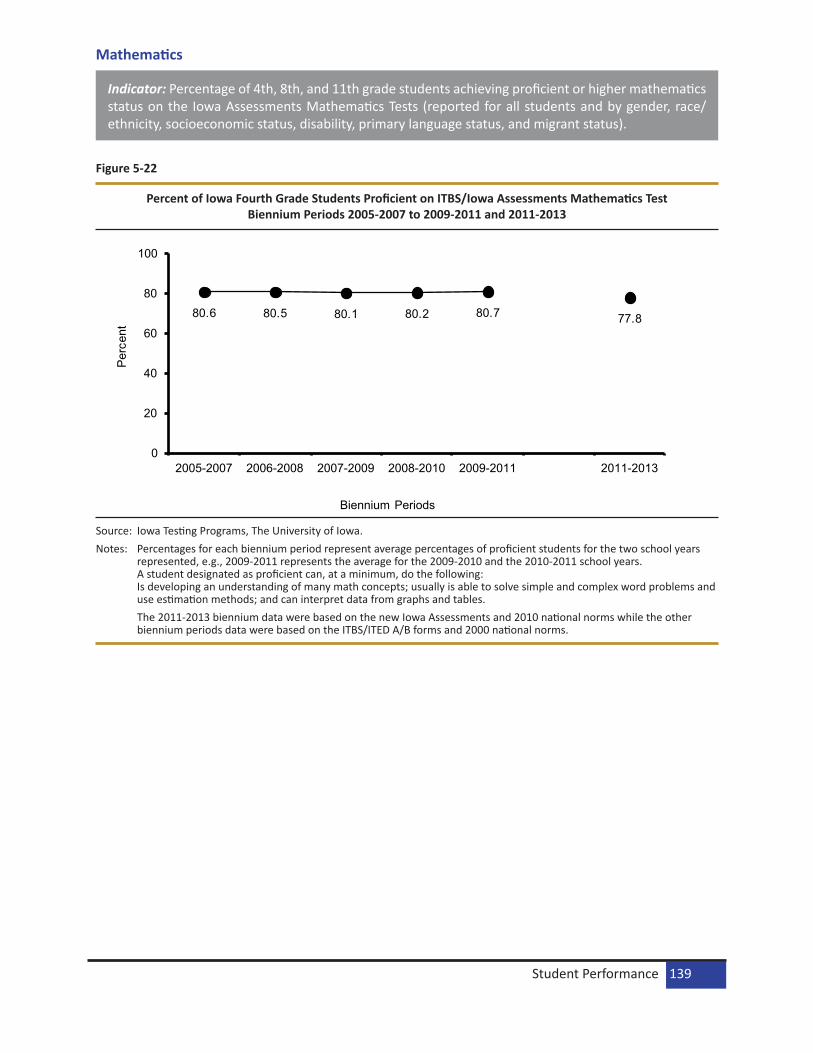
Mathematics
Indicator: Percentage of 4th, 8th, and 11th grade students achieving proficient or higher mathematics status on the Iowa Assessments Mathematics Tests (reported for all students and by gender, race/ethnicity, socioeconomic status, disability, primary language status, and migrant status).
Figure 5-22
Percent of Iowa Fourth Grade Students Proficient on ITBS/Iowa Assessments Mathematics Test Biennium Periods 2005-2007 to 2009-2011 and 2011-2013
80.6 80.5 80.1 80.2 80.7 77.8
0
20
40
60
80
100
2005-2007 2006-2008 2007-2009 2008-2010 2009-2011 2011-2013
Per
cent
Biennium Periods
Source: Iowa Testing Programs, The University of Iowa.Notes: Percentages for each biennium period represent average percentages of proficient students for the two school years
represented, e.g., 2009-2011 represents the average for the 2009-2010 and the 2010-2011 school years. A student designated as proficient can, at a minimum, do the following: Is developing an understanding of many math concepts; usually is able to solve simple and complex word problems and use estimation methods; and can interpret data from graphs and tables.
The 2011-2013 biennium data were based on the new Iowa Assessments and 2010 national norms while the other biennium periods data were based on the ITBS/ITED A/B forms and 2000 national norms.
Student Performance 139

Figure 5-23
Percent of Iowa Fourth Grade Students Proficient on ITBS/Iowa Assessments Mathematics Test by Gender Biennium Periods 2005-2007 to 2009-2011 and 2011-2013
79.7 79.7 79.4 79.3 79.7 77.4 81.4 81.3 80.8 81.0 81.6 78.1
0
20
40
60
80
100
2005-2007
2006-2008
2007-2009
2008-2010
2009-2011
2011-2013
2005-2007
2006-2008
2007-2009
2008-2010
2009-2011
2011-2013
Per
cent
Biennium Periods
Female Male
Source: Iowa Testing Programs, The University of Iowa.Notes: Percentages for each biennium period represent average percentages of proficient students for the two school years
represented, e.g., 2009-2011 represents the average for the 2009-2010 and the 2010-2011 school years. A student designated as proficient can, at a minimum, do the following: Is developing an understanding of many math concepts; usually is able to solve simple and complex word problems and use estimation methods; and can interpret data from graphs and tables.
The 2011-2013 biennium data were based on the new Iowa Assessments and 2010 national norms while the other biennium periods data were based on the ITBS/ITED A/B forms and 2000 national norms.
The Annual Condition of Education Report 2013140

Figure 5-24
Percent of Iowa Fourth Grade Students Proficient on ITBS/Iowa Assessments Mathematics Test by Race/Ethnicity Biennium Periods 2005-2007 to 2009-2011 and 2011-2013
83.4
83.5
83.4
83.8
84.2
81.4 56
.655
.954
.652
.451
.4
48.2
84.3
84.1
83.2
83.1
83.1
81.7
63.6
65.6
61.5
63.2 67
.2
63.1
0102030405060708090
10020
05-2
007
2006
-200
820
07-2
009
2008
-201
020
09-2
011
2011
-201
320
05-2
007
2006
-200
820
07-2
009
2008
-201
020
09-2
011
2011
-201
320
05-2
007
2006
-200
820
07-2
009
2008
-201
020
09-2
011
2011
-201
320
05-2
007
2006
-200
820
07-2
009
2008
-201
020
09-2
011
2011
-201
320
05-2
007
2006
-200
820
07-2
009
2008
-201
020
09-2
011
2011
-201
3
Per
cent
Biennium Periods
White African American Asian American Indian
Source: Iowa Testing Programs, The University of Iowa.Notes: Percentages for each biennium period represent average percentages of proficient students for the two school years
represented, e.g., 2009-2011 represents the average for the 2009-2010 and the 2010-2011 school years. A student designated as proficient can, at a minimum, do the following: Is developing an understanding of many math concepts; usually is able to solve simple and complex word problems and use estimation methods; and can interpret data from graphs and tables.
The 2011-2013 biennium data were based on the new Iowa Assessments and 2010 national norms while the other biennium periods data were based on the ITBS/ITED A/B forms and 2000 national norms.
Student Performance 141
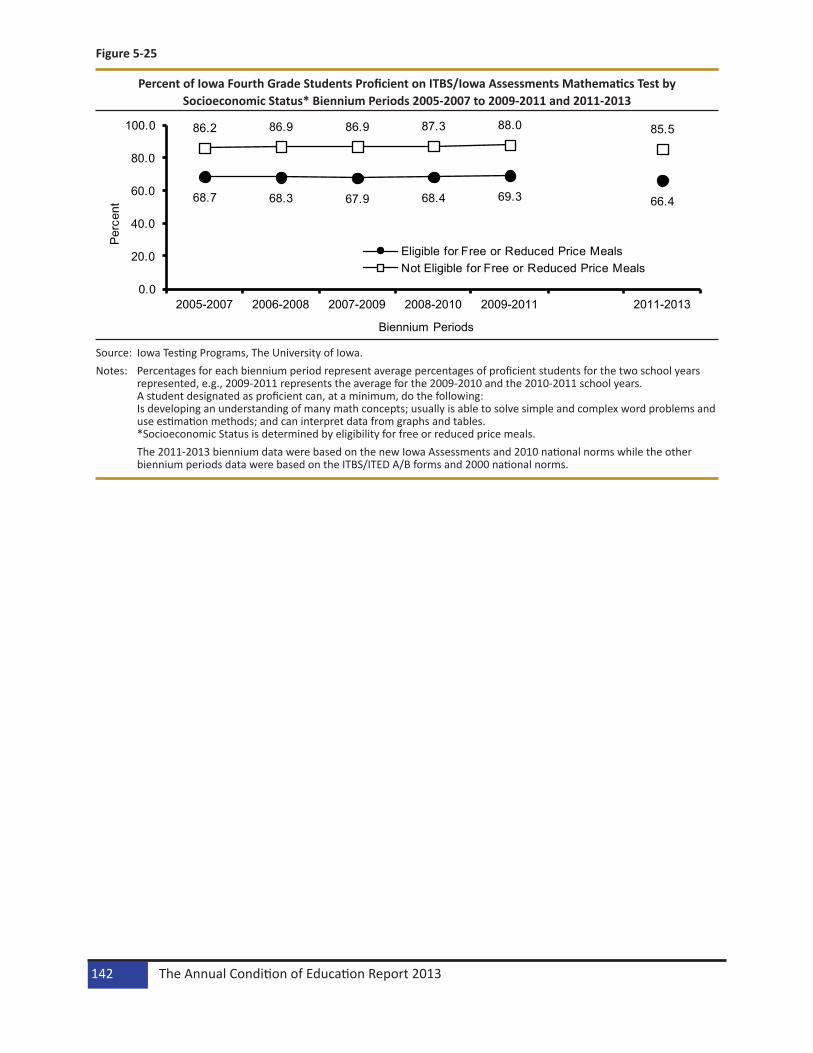
Figure 5-25
Percent of Iowa Fourth Grade Students Proficient on ITBS/Iowa Assessments Mathematics Test by Socioeconomic Status* Biennium Periods 2005-2007 to 2009-2011 and 2011-2013
68.7 68.3 67.9 68.4 69.3 66.4
86.2 86.9 86.9 87.3 88.0 85.5
0.0
20.0
40.0
60.0
80.0
100.0
2005-2007 2006-2008 2007-2009 2008-2010 2009-2011 2011-2013
Per
cent
Biennium Periods
Eligible for Free or Reduced Price MealsNot Eligible for Free or Reduced Price Meals
Source: Iowa Testing Programs, The University of Iowa.Notes: Percentages for each biennium period represent average percentages of proficient students for the two school years
represented, e.g., 2009-2011 represents the average for the 2009-2010 and the 2010-2011 school years. A student designated as proficient can, at a minimum, do the following: Is developing an understanding of many math concepts; usually is able to solve simple and complex word problems and use estimation methods; and can interpret data from graphs and tables. *Socioeconomic Status is determined by eligibility for free or reduced price meals.
The 2011-2013 biennium data were based on the new Iowa Assessments and 2010 national norms while the other biennium periods data were based on the ITBS/ITED A/B forms and 2000 national norms.
The Annual Condition of Education Report 2013142

Figure 5-26
Percent of Iowa Fourth Grade Students Proficient on ITBS/Iowa Assessments Mathematics Test by Disability Status* Biennium Periods 2005-2007 to 2009-2011 and 2011-2013
49.1 49.2 47.9 48.3 49.044.6
85.0 84.9 84.6 84.5 85.0 82.4
0
20
40
60
80
100
2005-2007 2006-2008 2007-2009 2008-2010 2009-2011 2011-2013
Per
cent
Biennium Periods
Disability No Disability
Source: Iowa Testing Programs, The University of Iowa.Notes: Percentages for each biennium period represent average percentages of proficient students for the two school years
represented, e.g., 2009-2011 represents the average for the 2009-2010 and the 2010-2011 school years. A student designated as proficient can, at a minimum, do the following: Is developing an understanding of many math concepts; usually is able to solve simple and complex word problems and use estimation methods; and can interpret data from graphs and tables. *Disability Status is determined by the presence of an individualized education plan (IEP).
The 2011-2013 biennium data were based on the new Iowa Assessments and 2010 national norms while the other biennium periods data were based on the ITBS/ITED A/B forms and 2000 national norms.
Student Performance 143
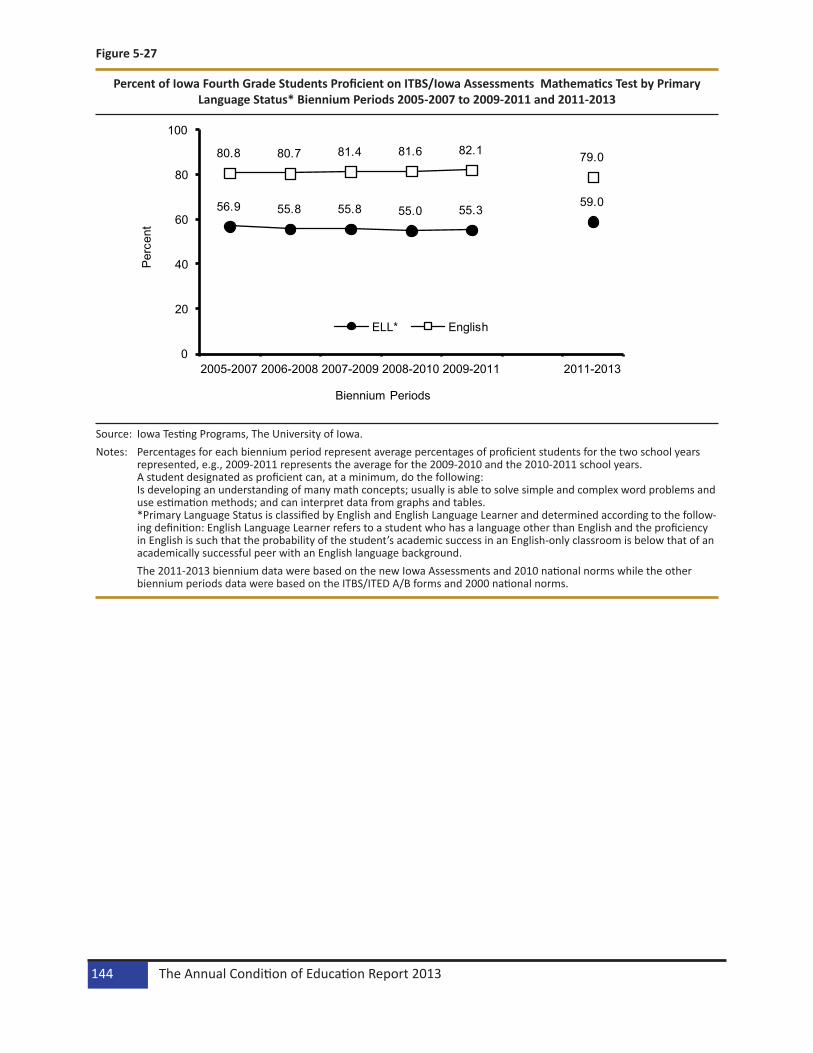
Figure 5-27
Percent of Iowa Fourth Grade Students Proficient on ITBS/Iowa Assessments Mathematics Test by Primary Language Status* Biennium Periods 2005-2007 to 2009-2011 and 2011-2013
56.9 55.8 55.8 55.0 55.359.0
80.8 80.7 81.4 81.6 82.1 79.0
0
20
40
60
80
100
2005-2007 2006-2008 2007-2009 2008-2010 2009-2011 2011-2013
Per
cent
Biennium Periods
ELL* English
Source: Iowa Testing Programs, The University of Iowa.Notes: Percentages for each biennium period represent average percentages of proficient students for the two school years
represented, e.g., 2009-2011 represents the average for the 2009-2010 and the 2010-2011 school years. A student designated as proficient can, at a minimum, do the following: Is developing an understanding of many math concepts; usually is able to solve simple and complex word problems and use estimation methods; and can interpret data from graphs and tables. *Primary Language Status is classified by English and English Language Learner and determined according to the follow-ing definition: English Language Learner refers to a student who has a language other than English and the proficiency in English is such that the probability of the student’s academic success in an English-only classroom is below that of an academically successful peer with an English language background.
The 2011-2013 biennium data were based on the new Iowa Assessments and 2010 national norms while the other biennium periods data were based on the ITBS/ITED A/B forms and 2000 national norms.
The Annual Condition of Education Report 2013144

Figure 5-28
Percent of Iowa Fourth Grade Students Proficient on ITBS/Iowa Assessments Mathematics Test by Migrant Status* Biennium Periods 2005-2007 to 2009-2011 and 2011-2013
56.3 57.2 56.6 54.5 54.8 57.5
80.8 80.7 81.4 80.3 82.1 79.0
0
20
40
60
80
100
2005-2007 2006-2008 2007-2009 2008-2010 2009-2011 2011-2013
Per
cent
Biennium Periods
Migrant
Non-Migrant
Source: Iowa Testing Programs, The University of Iowa.Notes: Percentages for each biennium period represent average percentages of proficient students for the two school years
represented, e.g., 2009-2011 represents the average for the 2009-2010 and the 2010-2011 school years. A student designated as proficient can, at a minimum, do the following: Is developing an understanding of many math concepts; usually is able to solve simple and complex word problems and use estimation methods; and can interpret data from graphs and tables. *Migrant status is defined as migrant or non-migrant as follows: Migrant—a student is considered a migrant if he or she has moved in the past 36 months from one district to another so that the parents could obtain temporary or seasonal employment in agriculture as their principle means of livelihood.
The 2011-2013 biennium data were based on the new Iowa Assessments and 2010 national norms while the other biennium periods data were based on the ITBS/ITED A/B forms and 2000 national norms.
Student Performance 145
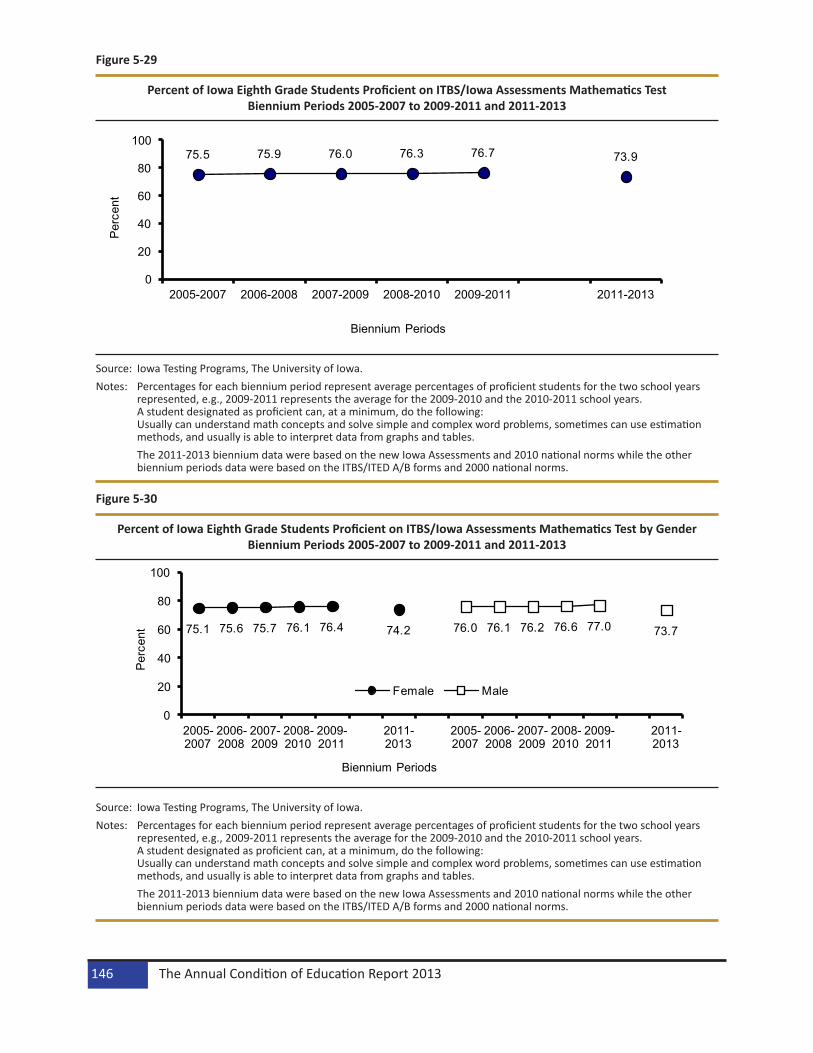
Figure 5-29
Percent of Iowa Eighth Grade Students Proficient on ITBS/Iowa Assessments Mathematics Test Biennium Periods 2005-2007 to 2009-2011 and 2011-2013
75.5 75.9 76.0 76.3 76.7 73.9
0
20
40
60
80
100
2005-2007 2006-2008 2007-2009 2008-2010 2009-2011 2011-2013
Per
cent
Biennium Periods
Source: Iowa Testing Programs, The University of Iowa.Notes: Percentages for each biennium period represent average percentages of proficient students for the two school years
represented, e.g., 2009-2011 represents the average for the 2009-2010 and the 2010-2011 school years. A student designated as proficient can, at a minimum, do the following: Usually can understand math concepts and solve simple and complex word problems, sometimes can use estimation methods, and usually is able to interpret data from graphs and tables.
The 2011-2013 biennium data were based on the new Iowa Assessments and 2010 national norms while the other biennium periods data were based on the ITBS/ITED A/B forms and 2000 national norms.
Figure 5-30
Percent of Iowa Eighth Grade Students Proficient on ITBS/Iowa Assessments Mathematics Test by Gender Biennium Periods 2005-2007 to 2009-2011 and 2011-2013
75.1 75.6 75.7 76.1 76.4 74.2 76.0 76.1 76.2 76.6 77.0 73.7
0
20
40
60
80
100
2005-2007
2006-2008
2007-2009
2008-2010
2009-2011
2011-2013
2005-2007
2006-2008
2007-2009
2008-2010
2009-2011
2011-2013
Per
cent
Biennium Periods
Female Male
Source: Iowa Testing Programs, The University of Iowa.Notes: Percentages for each biennium period represent average percentages of proficient students for the two school years
represented, e.g., 2009-2011 represents the average for the 2009-2010 and the 2010-2011 school years. A student designated as proficient can, at a minimum, do the following: Usually can understand math concepts and solve simple and complex word problems, sometimes can use estimation methods, and usually is able to interpret data from graphs and tables.
The 2011-2013 biennium data were based on the new Iowa Assessments and 2010 national norms while the other biennium periods data were based on the ITBS/ITED A/B forms and 2000 national norms.
The Annual Condition of Education Report 2013146

Figure 5-31
Percent of Iowa Eighth Grade Students Proficient on ITBS/Iowa Assessments Mathematics Test by Race/Ethnicity Biennium Periods 2005-2007 to 2009-2011 and 2011-2013
78.6
79.1
79.4
79.8
80.2
78.0
42.4
44.0
44.5
45.1
44.3
41.4
53.6
53.7
54.6 57
.5 59.5
54.9
81.7
81.3
80.8
81.7
81.6
80.6
58.9
59.5
59.7
60.5
58.7
50.9
0
10
20
30
40
50
60
70
80
90
10020
05-2
007
2006
-200
820
07-2
009
2008
-201
020
09-2
011
2011
-201
320
05-2
007
2006
-200
820
07-2
009
2008
-201
020
09-2
011
2011
-201
320
05-2
007
2006
-200
820
07-2
009
2008
-201
020
09-2
011
2011
-201
320
05-2
007
2006
-200
820
07-2
009
2008
-201
020
09-2
011
2011
-201
320
05-2
007
2006
-200
820
07-2
009
2008
-201
020
09-2
011
2011
-201
3
Perc
ent
Biennium Periods
White African American HispanicAsian American Indian
Source: Iowa Testing Programs, The University of Iowa.Notes: Percentages for each biennium period represent average percentages of proficient students for the two school years
represented, e.g., 2009-2011 represents the average for the 2009-2010 and the 2010-2011 school years. A student designated as proficient can, at a minimum, do the following: Usually can understand math concepts and solve simple and complex word problems, sometimes can use estimation methods, and usually is able to interpret data from graphs and tables.
The 2011-2013 biennium data were based on the new Iowa Assessments and 2010 national norms while the other biennium periods data were based on the ITBS/ITED A/B forms and 2000 national norms.
Student Performance 147

Figure 5-32
Percent of Iowa Eighth Grade Students Proficient on ITBS/Iowa Assessments Mathematics Test by Socioeconomic Status* Biennium Periods 2005-2007 to 2009-2011 and 2011-2013
58.5 58.6 59.1 60.3 61.8 57.7
82.5 83.1 83.5 84.1 84.6 83.4
0.0
20.0
40.0
60.0
80.0
100.0
2005-2007 2006-2008 2007-2009 2008-2010 2009-2011 2011-2013
Per
cent
Biennium Periods
Eligible for Free or Reduced Price Meals
Not Eligible for Free or Reduced Price Meals
Source: Iowa Testing Programs, The University of Iowa.Notes: Percentages for each biennium period represent average percentages of proficient students for the two school years
represented, e.g., 2009-2011 represents the average for the 2009-2010 and the 2010-2011 school years. A student designated as proficient can, at a minimum, do the following: Usually can understand math concepts and solve simple and complex word problems, sometimes can use estimation methods, and usually is able to interpret data from graphs and tables. *Socioeconomic Status is determined by eligibility for free or reduced price meals.
The 2011-2013 biennium data were based on the new Iowa Assessments and 2010 national norms while the other biennium periods data were based on the ITBS/ITED A/B forms and 2000 national norms.
The Annual Condition of Education Report 2013148
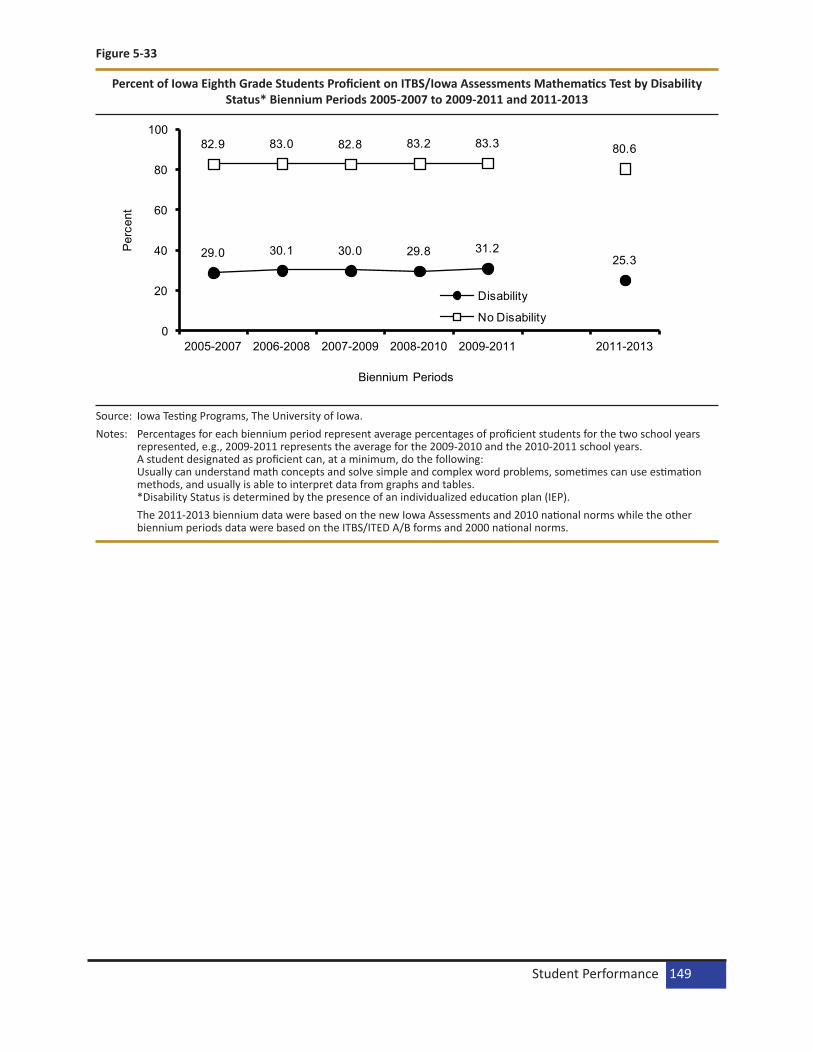
Figure 5-33
Percent of Iowa Eighth Grade Students Proficient on ITBS/Iowa Assessments Mathematics Test by Disability Status* Biennium Periods 2005-2007 to 2009-2011 and 2011-2013
29.0 30.1 30.0 29.8 31.225.3
82.9 83.0 82.8 83.2 83.3 80.6
0
20
40
60
80
100
2005-2007 2006-2008 2007-2009 2008-2010 2009-2011 2011-2013
Per
cent
Biennium Periods
Disability
No Disability
Source: Iowa Testing Programs, The University of Iowa.Notes: Percentages for each biennium period represent average percentages of proficient students for the two school years
represented, e.g., 2009-2011 represents the average for the 2009-2010 and the 2010-2011 school years. A student designated as proficient can, at a minimum, do the following: Usually can understand math concepts and solve simple and complex word problems, sometimes can use estimation methods, and usually is able to interpret data from graphs and tables. *Disability Status is determined by the presence of an individualized education plan (IEP).
The 2011-2013 biennium data were based on the new Iowa Assessments and 2010 national norms while the other biennium periods data were based on the ITBS/ITED A/B forms and 2000 national norms.
Student Performance 149
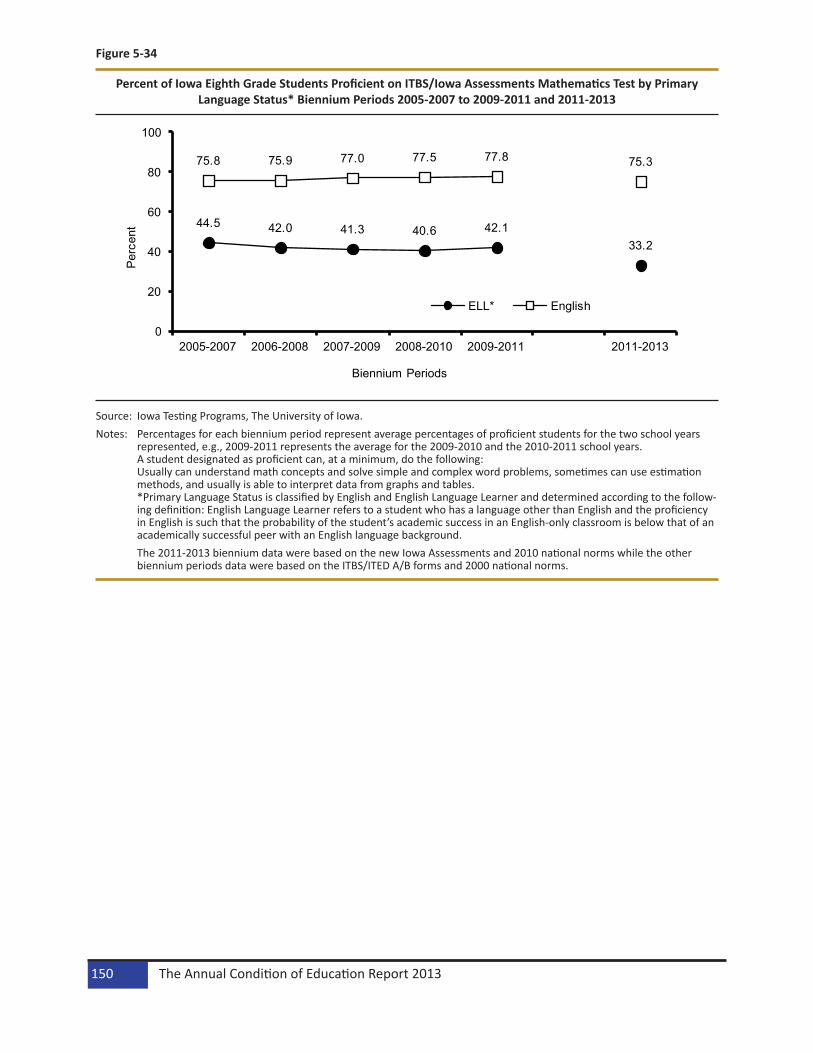
Figure 5-34
Percent of Iowa Eighth Grade Students Proficient on ITBS/Iowa Assessments Mathematics Test by Primary Language Status* Biennium Periods 2005-2007 to 2009-2011 and 2011-2013
44.5 42.0 41.3 40.6 42.133.2
75.8 75.9 77.0 77.5 77.8 75.3
0
20
40
60
80
100
2005-2007 2006-2008 2007-2009 2008-2010 2009-2011 2011-2013
Per
cent
Biennium Periods
ELL* English
Source: Iowa Testing Programs, The University of Iowa.Notes: Percentages for each biennium period represent average percentages of proficient students for the two school years
represented, e.g., 2009-2011 represents the average for the 2009-2010 and the 2010-2011 school years. A student designated as proficient can, at a minimum, do the following: Usually can understand math concepts and solve simple and complex word problems, sometimes can use estimation methods, and usually is able to interpret data from graphs and tables. *Primary Language Status is classified by English and English Language Learner and determined according to the follow-ing definition: English Language Learner refers to a student who has a language other than English and the proficiency in English is such that the probability of the student’s academic success in an English-only classroom is below that of an academically successful peer with an English language background.
The 2011-2013 biennium data were based on the new Iowa Assessments and 2010 national norms while the other biennium periods data were based on the ITBS/ITED A/B forms and 2000 national norms.
The Annual Condition of Education Report 2013150

Figure 5-35
Percent of Iowa Eighth Grade Students Proficient on ITBS/Iowa Assessments Mathematics Test by Migrant Status* Biennium Periods 2005-2007 to 2009-2011 and 2011-2013
45.2 47.151.6 51.2 50.0
40
75.8 75.9 77.0 76.4 77.8 75.3
0
20
40
60
80
100
2005-2007 2006-2008 2007-2009 2008-2010 2009-2011 2011-2013
Per
cent
Biennium Periods
Migrant
Non-Migrant
Source: Iowa Testing Programs, The University of Iowa.Notes: Percentages for each biennium period represent average percentages of proficient students for the two school years
represented, e.g., 2009-2011 represents the average for the 2009-2010 and the 2010-2011 school years. A student designated as proficient can, at a minimum, do the following: Usually can understand math concepts and solve simple and complex word problems, sometimes can use estimation methods, and usually is able to interpret data from graphs and tables. *Migrant status is defined as migrant or non-migrant as follows: Migrant—a student is considered a migrant if he or she has moved in the past 36 months from one district to another so that the parents could obtain temporary or seasonal employment in agriculture as their principle means of livelihood.
The 2011-2013 biennium data were based on the new Iowa Assessments and 2010 national norms while the other biennium periods data were based on the ITBS/ITED A/B forms and 2000 national norms.
Student Performance 151

Figure 5-36
Percent of Iowa Eleventh Grade Students Proficient on ITED/Iowa Assessments Mathematics Test Biennium Periods 2005-2007 to 2009-2011 and 2011-2013
78.4 78.0 77.4 77.4 77.4 81.7
0
20
40
60
80
100
2005-2007 2006-2008 2007-2009 2008-2010 2009-2011 2011-2013
Per
cent
Biennium Periods
Source: Iowa Testing Programs, The University of Iowa.Notes: Percentages for each biennium period represent average percentages of proficient students for the two school years
represented, e.g., 2009-2011 represents the average for the 2009-2010 and the 2010-2011 school years. A student designated as proficient can, at a minimum, do the following: Sometimes applies math concepts and procedures, makes inferences with quantitative information, and solves variety of quantitative reasoning problems.
The 2011-2013 biennium data were based on the new Iowa Assessments and 2010 national norms while the other biennium periods data were based on the ITBS/ITED A/B forms and 2000 national norms.
Figure 5-37
Percent of Iowa Eleventh Grade Students Proficient on ITED/Iowa Assessments Mathematics Test by Gender Biennium Periods 2005-2007 to 2009-2011 and 2011-2013
77.7 77.3 76.5 76.4 76.481.6 78.9 78.8 78.2 78.2 78.4 81.7
0
20
40
60
80
100
2005-2007
2006-2008
2007-2009
2008-2010
2009-2011
2011-2013
2005-2007
2006-2008
2007-2009
2008-2010
2009-2011
2011-2013
Per
cent
Biennium Periods
Female Male
Source: Iowa Testing Programs, The University of Iowa.Notes: Percentages for each biennium period represent average percentages of proficient students for the two school years
represented, e.g., 2009-2011 represents the average for the 2009-2010 and the 2010-2011 school years. A student designated as proficient can, at a minimum, do the following: Sometimes applies math concepts and procedures, makes inferences with quantitative information, and solves variety of quantitative reasoning problems.
The 2011-2013 biennium data were based on the new Iowa Assessments and 2010 national norms while the other biennium periods data were based on the ITBS/ITED A/B forms and 2000 national norms.
The Annual Condition of Education Report 2013152

Figure 5-38
Percent of Iowa Eleventh Grade Students Proficient on ITED/Iowa Assessments Mathematics Test by Race/Ethnicity Biennium Periods 2005-2007 to 2009-2011 and 2011-2013
80.6
80.6
80.2
80.4
80.7 84
.846
.344
.744
.843
.841
.5
53.4 55.2
54.3
55.0
55.8
57.0
65.1
79.3
77.7
77.6 80
.279
.0 81.0
61.1 63.1
61.0 64
.564
.1 66.4
0
10
20
30
40
50
60
70
80
90
100
2005
-200
720
06-2
008
2007
-200
920
08-2
010
2009
-201
1
2011
-201
320
05-2
007
2006
-200
820
07-2
009
2008
-201
020
09-2
011
2011
-201
320
05-2
007
2006
-200
820
07-2
009
2008
-201
020
09-2
011
2011
-201
320
05-2
007
2006
-200
820
07-2
009
2008
-201
020
09-2
011
2011
-201
320
05-2
007
2006
-200
820
07-2
009
2008
-201
020
09-2
011
2011
-201
3
Perc
ent
Biennium Periods
White African American Hispanic
Asian American Indian
Source: Iowa Testing Programs, The University of Iowa.Notes: Percentages for each biennium period represent average percentages of proficient students for the two school years
represented, e.g., 2009-2011 represents the average for the 2009-2010 and the 2010-2011 school years. A student designated as proficient can, at a minimum, do the following: Sometimes applies math concepts and procedures, makes inferences with quantitative information, and solves variety of quantitative reasoning problems.
The 2011-2013 biennium data were based on the new Iowa Assessments and 2010 national norms while the other biennium periods data were based on the ITBS/ITED A/B forms and 2000 national norms.
Student Performance 153
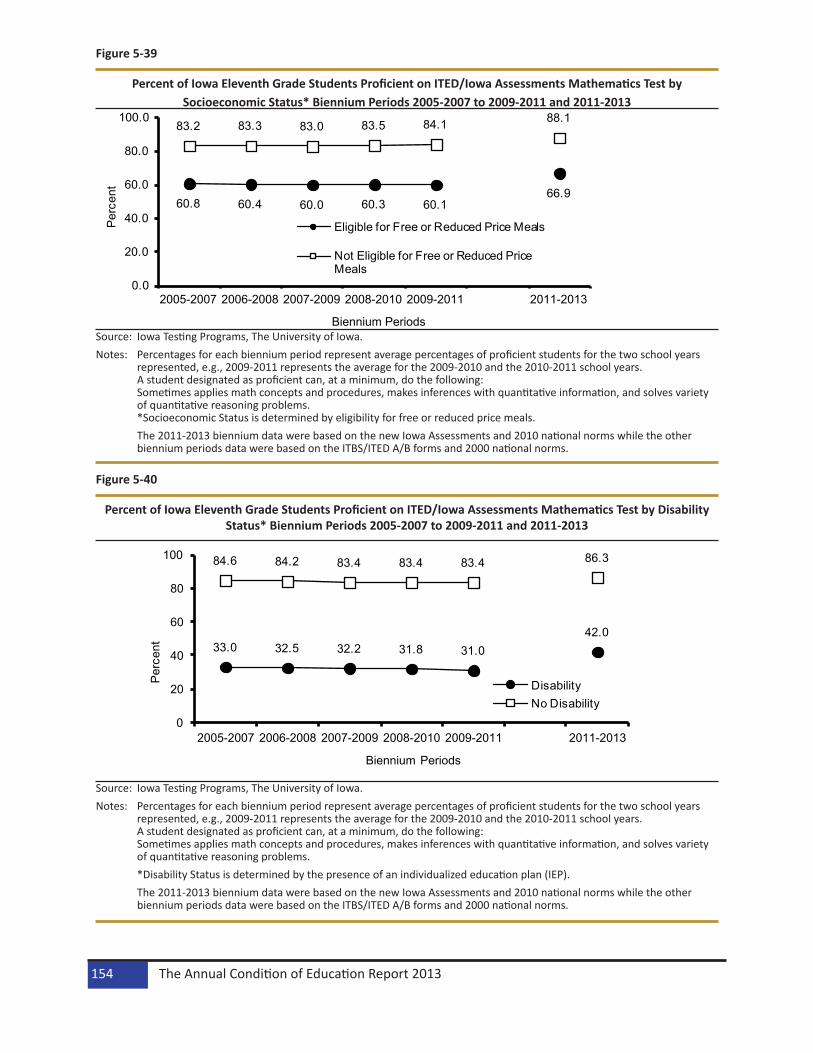
Figure 5-39
Percent of Iowa Eleventh Grade Students Proficient on ITED/Iowa Assessments Mathematics Test by Socioeconomic Status* Biennium Periods 2005-2007 to 2009-2011 and 2011-2013
60.8 60.4 60.0 60.3 60.166.9
83.2 83.3 83.0 83.5 84.1 88.1
0.0
20.0
40.0
60.0
80.0
100.0
2005-2007 2006-2008 2007-2009 2008-2010 2009-2011 2011-2013
Per
cent
Biennium Periods
Eligible for Free or Reduced Price Meals
Not Eligible for Free or Reduced Price Meals
Source: Iowa Testing Programs, The University of Iowa.Notes: Percentages for each biennium period represent average percentages of proficient students for the two school years
represented, e.g., 2009-2011 represents the average for the 2009-2010 and the 2010-2011 school years. A student designated as proficient can, at a minimum, do the following: Sometimes applies math concepts and procedures, makes inferences with quantitative information, and solves variety of quantitative reasoning problems. *Socioeconomic Status is determined by eligibility for free or reduced price meals.
The 2011-2013 biennium data were based on the new Iowa Assessments and 2010 national norms while the other biennium periods data were based on the ITBS/ITED A/B forms and 2000 national norms.
Figure 5-40
Percent of Iowa Eleventh Grade Students Proficient on ITED/Iowa Assessments Mathematics Test by Disability Status* Biennium Periods 2005-2007 to 2009-2011 and 2011-2013
33.0 32.5 32.2 31.8 31.042.0
84.6 84.2 83.4 83.4 83.4 86.3
0
20
40
60
80
100
2005-2007 2006-2008 2007-2009 2008-2010 2009-2011 2011-2013
Per
cent
Biennium Periods
DisabilityNo Disability
Source: Iowa Testing Programs, The University of Iowa.Notes: Percentages for each biennium period represent average percentages of proficient students for the two school years
represented, e.g., 2009-2011 represents the average for the 2009-2010 and the 2010-2011 school years. A student designated as proficient can, at a minimum, do the following: Sometimes applies math concepts and procedures, makes inferences with quantitative information, and solves variety of quantitative reasoning problems.
*Disability Status is determined by the presence of an individualized education plan (IEP). The 2011-2013 biennium data were based on the new Iowa Assessments and 2010 national norms while the other
biennium periods data were based on the ITBS/ITED A/B forms and 2000 national norms.
The Annual Condition of Education Report 2013154

Figure 5-41
Percent of Iowa Eleventh Grade Students Proficient on ITED/Iowa Assessments Mathematics Test by Primary Language Status* Biennium Periods 2005-2007 to 2009-2011 and 2011-2013
44.238.6 39.3 37.3 34.4
42.9
78.5 78.2 78.1 78.1 78.282.7
0
20
40
60
80
100
2005-2007 2006-2008 2007-2009 2008-2010 2009-2011 2011-2013
Per
cent
Biennium Periods
ELL* English
Source: Iowa Testing Programs, The University of Iowa.Notes: Percentages for each biennium period represent average percentages of proficient students for the two school years
represented, e.g., 2009-2011 represents the average for the 2009-2010 and the 2010-2011 school years. A student designated as proficient can, at a minimum, do the following: Sometimes applies math concepts and procedures, makes inferences with quantitative information, and solves variety of quantitative reasoning problems. *Primary Language Status is classified by English and English Language Learner and determined according to the follow-ing definition: English Language Learner refers to a student who has a language other than English and the proficiency in English is such that the probability of the student’s academic success in an English-only classroom is below that of an academically successful peer with an English language background.
The 2011-2013 biennium data were based on the new Iowa Assessments and 2010 national norms while the other biennium periods data were based on the ITBS/ITED A/B forms and 2000 national norms.
Student Performance 155
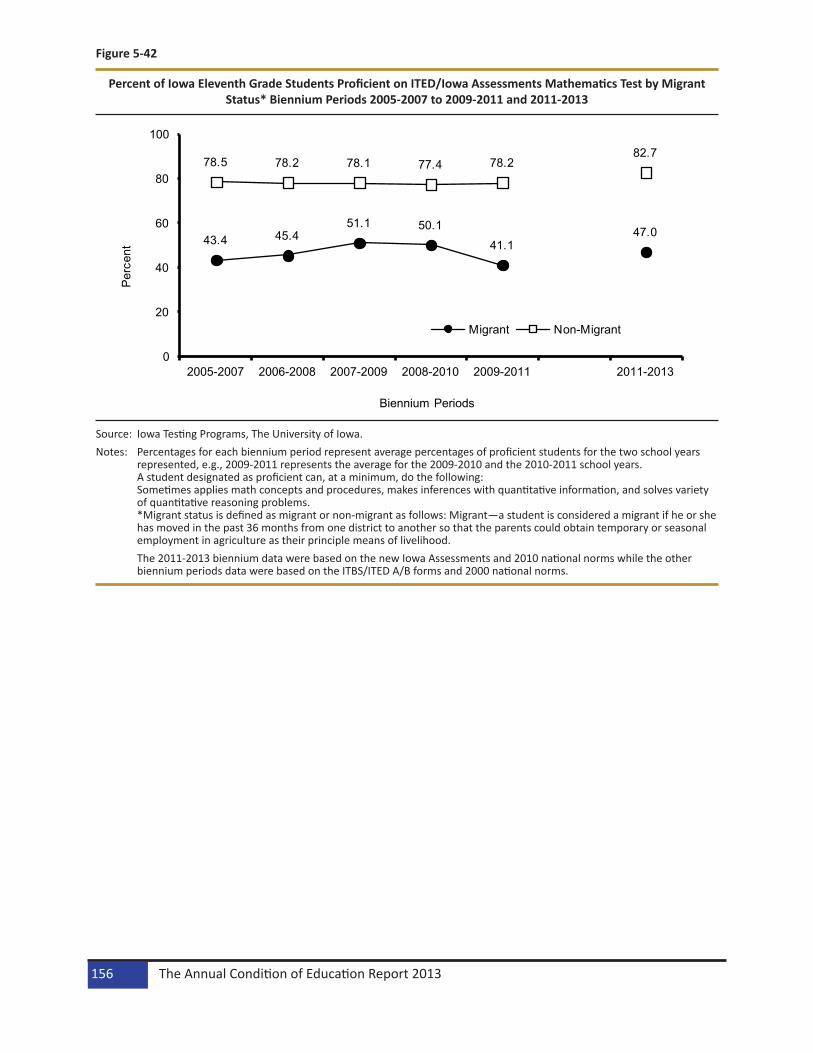
Figure 5-42
Percent of Iowa Eleventh Grade Students Proficient on ITED/Iowa Assessments Mathematics Test by Migrant Status* Biennium Periods 2005-2007 to 2009-2011 and 2011-2013
43.4 45.451.1 50.1
41.147.0
78.5 78.2 78.1 77.4 78.282.7
0
20
40
60
80
100
2005-2007 2006-2008 2007-2009 2008-2010 2009-2011 2011-2013
Per
cent
Biennium Periods
Migrant Non-Migrant
Source: Iowa Testing Programs, The University of Iowa.Notes: Percentages for each biennium period represent average percentages of proficient students for the two school years
represented, e.g., 2009-2011 represents the average for the 2009-2010 and the 2010-2011 school years. A student designated as proficient can, at a minimum, do the following: Sometimes applies math concepts and procedures, makes inferences with quantitative information, and solves variety of quantitative reasoning problems. *Migrant status is defined as migrant or non-migrant as follows: Migrant—a student is considered a migrant if he or she has moved in the past 36 months from one district to another so that the parents could obtain temporary or seasonal employment in agriculture as their principle means of livelihood.
The 2011-2013 biennium data were based on the new Iowa Assessments and 2010 national norms while the other biennium periods data were based on the ITBS/ITED A/B forms and 2000 national norms.
The Annual Condition of Education Report 2013156
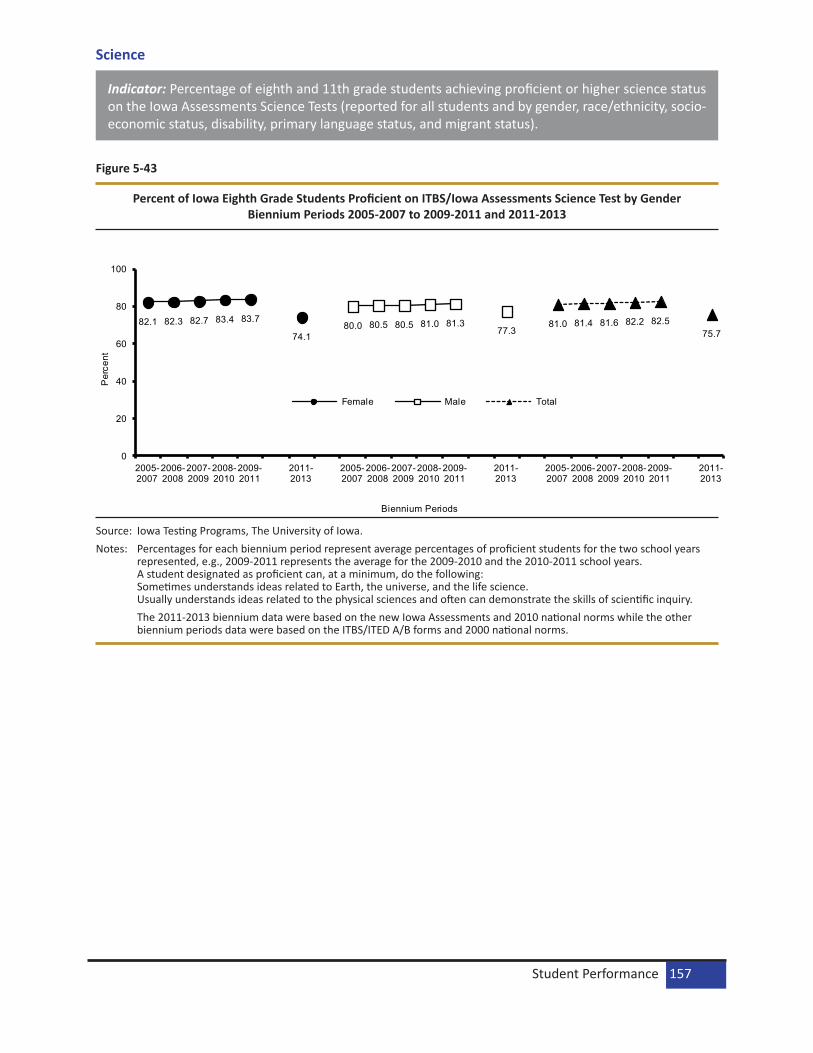
Science
Indicator: Percentage of eighth and 11th grade students achieving proficient or higher science status on the Iowa Assessments Science Tests (reported for all students and by gender, race/ethnicity, socio-economic status, disability, primary language status, and migrant status).
Figure 5-43
Percent of Iowa Eighth Grade Students Proficient on ITBS/Iowa Assessments Science Test by Gender Biennium Periods 2005-2007 to 2009-2011 and 2011-2013
82.1 82.3 82.7 83.4 83.7
74.180.0 80.5 80.5 81.0 81.3
77.381.0 81.4 81.6 82.2 82.5
75.7
0
20
40
60
80
100
2005-2007
2006-2008
2007-2009
2008-2010
2009-2011
2011-2013
2005-2007
2006-2008
2007-2009
2008-2010
2009-2011
2011-2013
2005-2007
2006-2008
2007-2009
2008-2010
2009-2011
2011-2013
Per
cent
Biennium Periods
Female Male Total
Source: Iowa Testing Programs, The University of Iowa.Notes: Percentages for each biennium period represent average percentages of proficient students for the two school years
represented, e.g., 2009-2011 represents the average for the 2009-2010 and the 2010-2011 school years. A student designated as proficient can, at a minimum, do the following: Sometimes understands ideas related to Earth, the universe, and the life science. Usually understands ideas related to the physical sciences and often can demonstrate the skills of scientific inquiry.
The 2011-2013 biennium data were based on the new Iowa Assessments and 2010 national norms while the other biennium periods data were based on the ITBS/ITED A/B forms and 2000 national norms.
Student Performance 157

Figure 5-44
Percent of Iowa Eighth Grade Students Proficient on ITBS/Iowa Assessments Science Test by Race/Ethnicity Biennium Periods 2005-2007 to 2009-2011 and 2011-2013
83.6
84.1
84.5
84.9
85.3
79.8
55.1
55.9
56.8
57.3
51.2
43.3
62.9
62.7
62.5 66
.1 69.0
58.3
83.7
83.4
83.2
85.6
84.5
75.5
68.8
68.4
70.3
71.5
71.3
54.5
0
10
20
30
40
50
60
70
80
90
100
2005
-200
720
06-2
008
2007
-200
920
08-2
010
2009
-201
1
2011
-201
320
05-2
007
2006
-200
820
07-2
009
2008
-201
020
09-2
011
2011
-201
320
05-2
007
2006
-200
820
07-2
009
2008
-201
020
09-2
011
2011
-201
320
05-2
007
2006
-200
820
07-2
009
2008
-201
020
09-2
011
2011
-201
320
05-2
007
2006
-200
820
07-2
009
2008
-201
020
09-2
011
2011
-201
3
Per
cent
Biennium Periods
White African American HispanicAsian American Indian
Source: Iowa Testing Programs, The University of Iowa.Notes: Percentages for each biennium period represent average percentages of proficient students for the two school years
represented, e.g., 2009-2011 represents the average for the 2009-2010 and the 2010-2011 school years. A student designated as proficient can, at a minimum, do the following: Sometimes understands ideas related to Earth, the universe, and the life science. Usually understands ideas related to the physical sciences and often can demonstrate the skills of scientific inquiry.
The 2011-2013 biennium data were based on the new Iowa Assessments and 2010 national norms while the other biennium periods data were based on the ITBS/ITED A/B forms and 2000 national norms.
The Annual Condition of Education Report 2013158
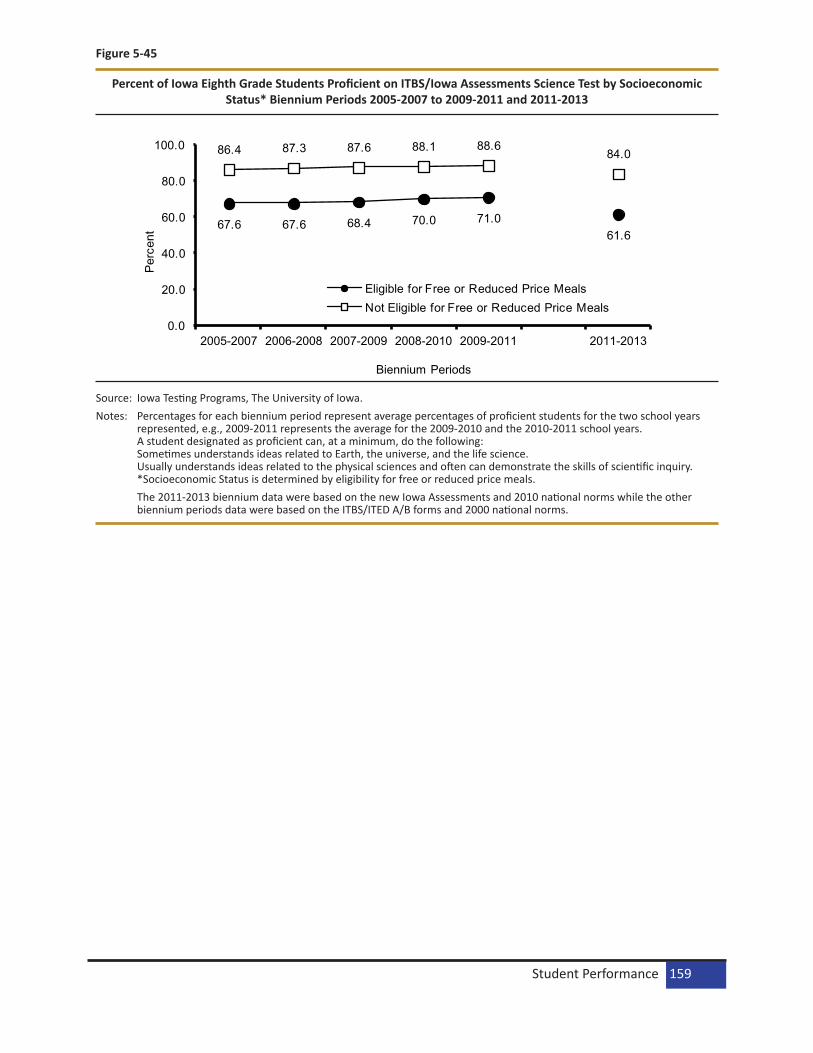
Figure 5-45
Percent of Iowa Eighth Grade Students Proficient on ITBS/Iowa Assessments Science Test by Socioeconomic Status* Biennium Periods 2005-2007 to 2009-2011 and 2011-2013
67.6 67.6 68.4 70.0 71.061.6
86.4 87.3 87.6 88.1 88.684.0
0.0
20.0
40.0
60.0
80.0
100.0
2005-2007 2006-2008 2007-2009 2008-2010 2009-2011 2011-2013
Per
cent
Biennium Periods
Eligible for Free or Reduced Price MealsNot Eligible for Free or Reduced Price Meals
Source: Iowa Testing Programs, The University of Iowa.Notes: Percentages for each biennium period represent average percentages of proficient students for the two school years
represented, e.g., 2009-2011 represents the average for the 2009-2010 and the 2010-2011 school years. A student designated as proficient can, at a minimum, do the following: Sometimes understands ideas related to Earth, the universe, and the life science. Usually understands ideas related to the physical sciences and often can demonstrate the skills of scientific inquiry. *Socioeconomic Status is determined by eligibility for free or reduced price meals.
The 2011-2013 biennium data were based on the new Iowa Assessments and 2010 national norms while the other biennium periods data were based on the ITBS/ITED A/B forms and 2000 national norms.
Student Performance 159
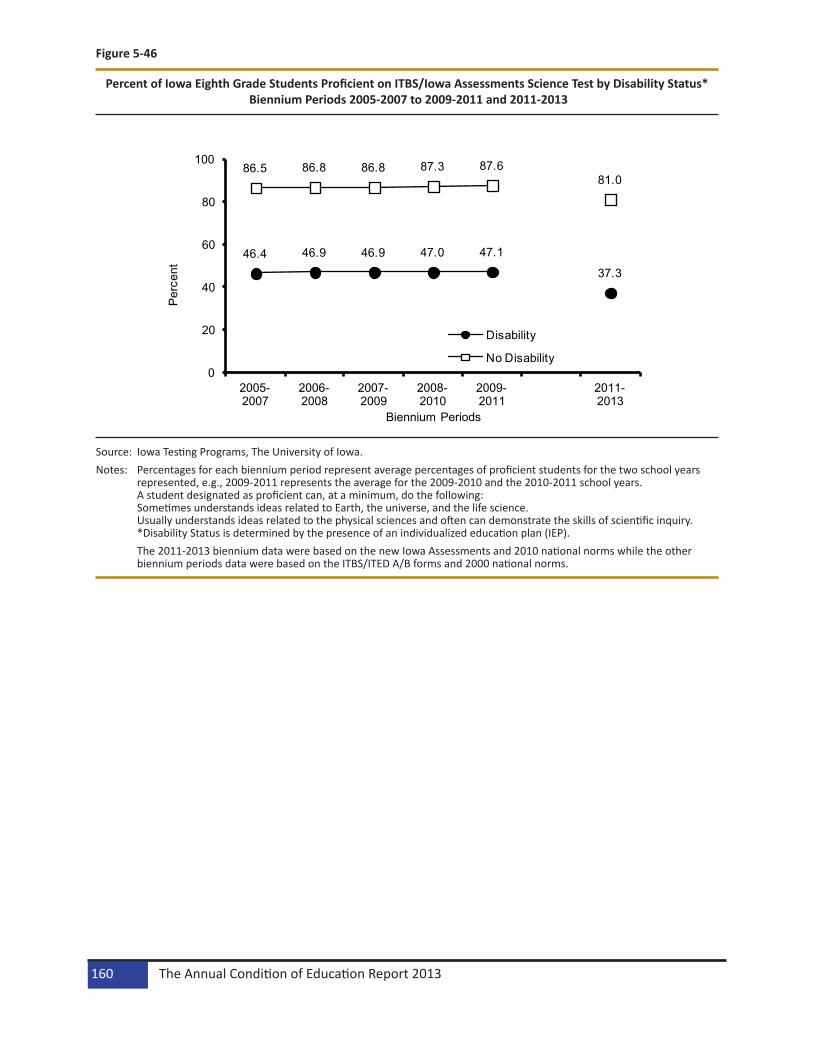
Figure 5-46
Percent of Iowa Eighth Grade Students Proficient on ITBS/Iowa Assessments Science Test by Disability Status* Biennium Periods 2005-2007 to 2009-2011 and 2011-2013
46.4 46.9 46.9 47.0 47.1
37.3
86.5 86.8 86.8 87.3 87.681.0
0
20
40
60
80
100
2005-2007
2006-2008
2007-2009
2008-2010
2009-2011
2011-2013
Per
cent
Biennium Periods
Disability
No Disability
Source: Iowa Testing Programs, The University of Iowa.Notes: Percentages for each biennium period represent average percentages of proficient students for the two school years
represented, e.g., 2009-2011 represents the average for the 2009-2010 and the 2010-2011 school years. A student designated as proficient can, at a minimum, do the following: Sometimes understands ideas related to Earth, the universe, and the life science. Usually understands ideas related to the physical sciences and often can demonstrate the skills of scientific inquiry. *Disability Status is determined by the presence of an individualized education plan (IEP).
The 2011-2013 biennium data were based on the new Iowa Assessments and 2010 national norms while the other biennium periods data were based on the ITBS/ITED A/B forms and 2000 national norms.
The Annual Condition of Education Report 2013160
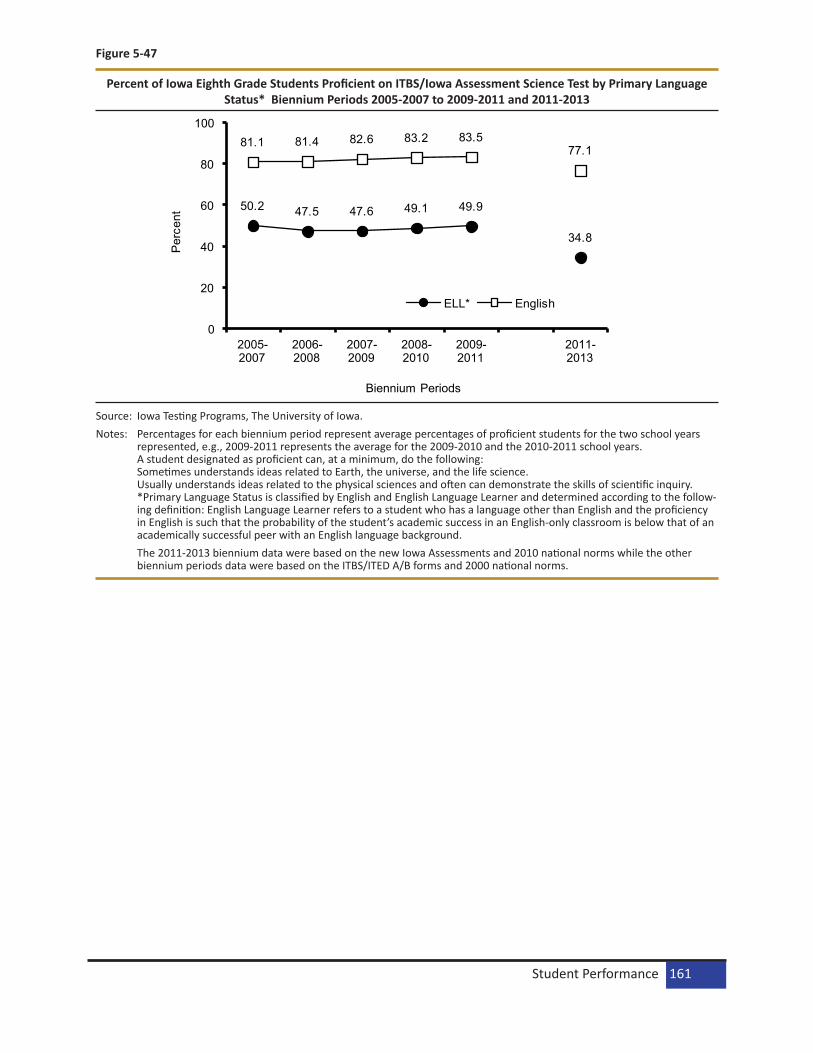
Figure 5-47
Percent of Iowa Eighth Grade Students Proficient on ITBS/Iowa Assessment Science Test by Primary Language Status* Biennium Periods 2005-2007 to 2009-2011 and 2011-2013
50.2 47.5 47.6 49.1 49.9
34.8
81.1 81.4 82.6 83.2 83.577.1
0
20
40
60
80
100
2005-2007
2006-2008
2007-2009
2008-2010
2009-2011
2011-2013
Per
cent
Biennium Periods
ELL* English
Source: Iowa Testing Programs, The University of Iowa.Notes: Percentages for each biennium period represent average percentages of proficient students for the two school years
represented, e.g., 2009-2011 represents the average for the 2009-2010 and the 2010-2011 school years. A student designated as proficient can, at a minimum, do the following: Sometimes understands ideas related to Earth, the universe, and the life science. Usually understands ideas related to the physical sciences and often can demonstrate the skills of scientific inquiry. *Primary Language Status is classified by English and English Language Learner and determined according to the follow-ing definition: English Language Learner refers to a student who has a language other than English and the proficiency in English is such that the probability of the student’s academic success in an English-only classroom is below that of an academically successful peer with an English language background.
The 2011-2013 biennium data were based on the new Iowa Assessments and 2010 national norms while the other biennium periods data were based on the ITBS/ITED A/B forms and 2000 national norms.
Student Performance 161

Figure 5-48
Percent of Iowa Eighth Grade Students Proficient on ITBS/Iowa Assessments Science Test by Migrant Status* Biennium Periods 2005-2007 to 2009-2011 and 2011-2013
56.8 60.6 60.654.1
49.9
39.9
81.1 81.4 82.6 82.2 83.577.1
0
20
40
60
80
100
2005-2007 2006-2008 2007-2009 2008-2010 2009-2011 2011-2013
Per
cent
Biennium Periods
Migrant
Non-Migrant
Source: Iowa Testing Programs, The University of Iowa.Notes: Percentages for each biennium period represent average percentages of proficient students for the two school years
represented, e.g., 2009-2011 represents the average for the 2009-2010 and the 2010-2011 school years. A student designated as proficient can, at a minimum, do the following: Sometimes understands ideas related to Earth, the universe, and the life science. Usually understands ideas related to the physical sciences and often can demonstrate the skills of scientific inquiry. *Migrant status is defined as migrant or non-migrant as follows: Migrant—a student is considered a migrant if he or she has moved in the past 36 months from one district to another so that the parents could obtain temporary or seasonal employment in agriculture as their principle means of livelihood.
The 2011-2013 biennium data were based on the new Iowa Assessments and 2010 national norms while the other biennium periods data were based on the ITBS/ITED A/B forms and 2000 national norms.
The Annual Condition of Education Report 2013162
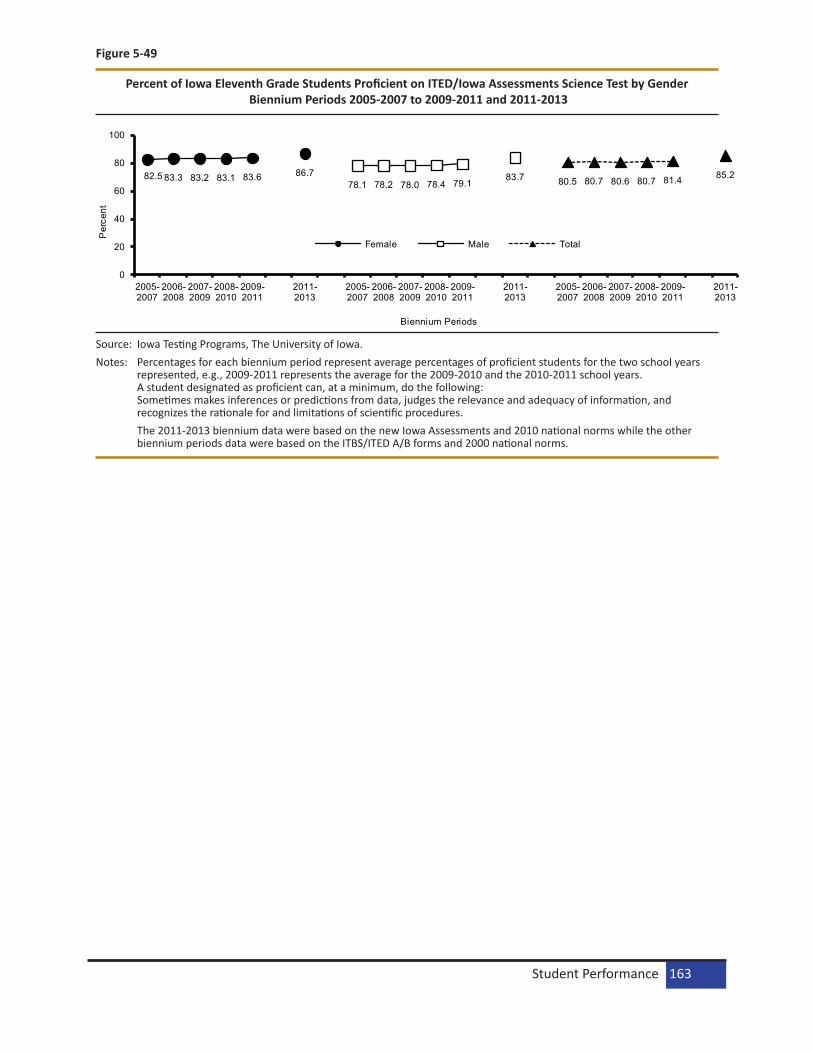
Figure 5-49
Percent of Iowa Eleventh Grade Students Proficient on ITED/Iowa Assessments Science Test by Gender Biennium Periods 2005-2007 to 2009-2011 and 2011-2013
82.5 83.3 83.2 83.1 83.6 86.778.1 78.2 78.0 78.4 79.1
83.7 80.5 80.7 80.6 80.7 81.4 85.2
0
20
40
60
80
100
2005-2007
2006-2008
2007-2009
2008-2010
2009-2011
2011-2013
2005-2007
2006-2008
2007-2009
2008-2010
2009-2011
2011-2013
2005-2007
2006-2008
2007-2009
2008-2010
2009-2011
2011-2013
Per
cent
Biennium Periods
Female Male Total
Source: Iowa Testing Programs, The University of Iowa.Notes: Percentages for each biennium period represent average percentages of proficient students for the two school years
represented, e.g., 2009-2011 represents the average for the 2009-2010 and the 2010-2011 school years. A student designated as proficient can, at a minimum, do the following: Sometimes makes inferences or predictions from data, judges the relevance and adequacy of information, and recognizes the rationale for and limitations of scientific procedures.
The 2011-2013 biennium data were based on the new Iowa Assessments and 2010 national norms while the other biennium periods data were based on the ITBS/ITED A/B forms and 2000 national norms.
Student Performance 163

Figure 5-50
Percent of Iowa Eleventh Grade Students Proficient on ITED/Iowa Assessments Science Test by Race/Ethnicity Biennium Periods 2005-2007 to 2009-2011 and 2011-2013
82.3
82.8
82.9
83.2
84.0 88
.154
.254
.353
.652
.851
.9 59.6
60.2
60.7
62.5
63.8
65.3 70
.782
.080
.781
.882
.681
.2
79.6
67.0
67.4
64.3 67
.865
.6
75.4
0
10
20
30
40
50
60
70
80
90
10020
05-2
007
2006
-200
820
07-2
009
2008
-201
020
09-2
011
2011
-201
320
05-2
007
2006
-200
820
07-2
009
2008
-201
020
09-2
011
2011
-201
320
05-2
007
2006
-200
820
07-2
009
2008
-201
020
09-2
011
2011
-201
320
05-2
007
2006
-200
820
07-2
009
2008
- 201
020
09-2
011
2011
-201
320
05-2
007
2006
-200
820
07-2
009
2008
-201
020
09-2
011
2011
-201
3
Perc
ent
Biennium Periods
White African American HispanicAsian American Indian
Source: Iowa Testing Programs, The University of Iowa.Notes: Percentages for each biennium period represent average percentages of proficient students for the two school years
represented, e.g., 2009-2011 represents the average for the 2009-2010 and the 2010-2011 school years. A student designated as proficient can, at a minimum, do the following: Sometimes makes inferences or predictions from data, judges the relevance and adequacy of information, and recognizes the rationale for and limitations of scientific procedures.
The 2011-2013 biennium data were based on the new Iowa Assessments and 2010 national norms while the other biennium periods data were based on the ITBS/ITED A/B forms and 2000 national norms.
The Annual Condition of Education Report 2013164

Figure 5-51
Percent of Iowa Eleventh Grade Students Proficient on ITED/Iowa Assessments Science Test by Socioeconomic Status* Biennium Periods 2005-2007 to 2009-2011 and 2011-2013
65.6 66.3 66.9 67.1 67.673.1
84.6 85.0 85.0 85.6 86.7 90.5
0.0
20.0
40.0
60.0
80.0
100.0
2005-2007 2006-2008 2007-2009 2008-2010 2009-2011 2011-2013
Per
cent
Biennium Periods
Eligible for Free or Reduced Price MealsNot Eligible for Free or Reduced Price Meals
Source: Iowa Testing Programs, The University of Iowa.Notes: Percentages for each biennium period represent average percentages of proficient students for the two school years
represented, e.g., 2009-2011 represents the average for the 2009-2010 and the 2010-2011 school years. A student designated as proficient can, at a minimum, do the following: Sometimes makes inferences or predictions from data, judges the relevance and adequacy of information, and recognizes the rationale for and limitations of scientific procedures. *Socioeconomic Status is determined by eligibility for free or reduced price meals.
The 2011-2013 biennium data were based on the new Iowa Assessments and 2010 national norms while the other biennium periods data were based on the ITBS/ITED A/B forms and 2000 national norms.
Student Performance 165
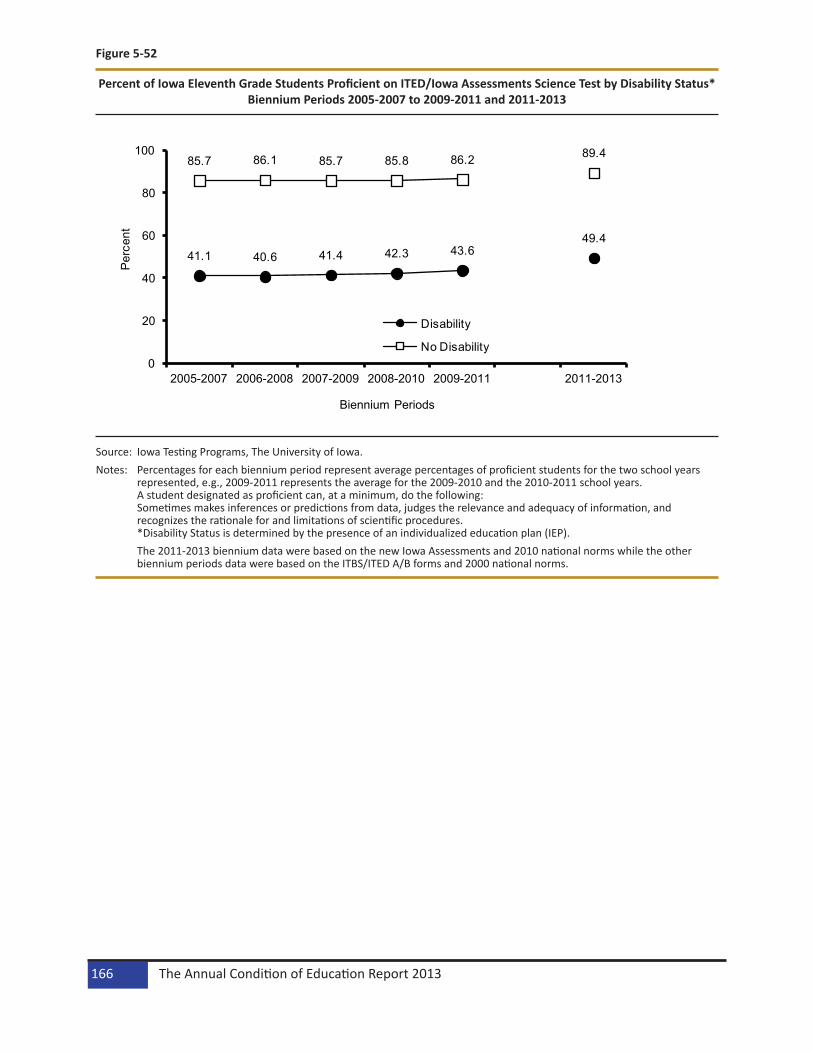
Figure 5-52
Percent of Iowa Eleventh Grade Students Proficient on ITED/Iowa Assessments Science Test by Disability Status* Biennium Periods 2005-2007 to 2009-2011 and 2011-2013
41.1 40.6 41.4 42.3 43.649.4
85.7 86.1 85.7 85.8 86.2 89.4
0
20
40
60
80
100
2005-2007 2006-2008 2007-2009 2008-2010 2009-2011 2011-2013
Per
cent
Biennium Periods
Disability
No Disability
Source: Iowa Testing Programs, The University of Iowa.Notes: Percentages for each biennium period represent average percentages of proficient students for the two school years
represented, e.g., 2009-2011 represents the average for the 2009-2010 and the 2010-2011 school years. A student designated as proficient can, at a minimum, do the following: Sometimes makes inferences or predictions from data, judges the relevance and adequacy of information, and recognizes the rationale for and limitations of scientific procedures. *Disability Status is determined by the presence of an individualized education plan (IEP).
The 2011-2013 biennium data were based on the new Iowa Assessments and 2010 national norms while the other biennium periods data were based on the ITBS/ITED A/B forms and 2000 national norms.
The Annual Condition of Education Report 2013166

Figure 5-53
Percent of Iowa Eleventh Grade Students Proficient on ITED/Iowa Assessments Science Test by Primary Language Status* Biennium Periods 2005-2007 to 2009-2011 and 2011-2013
46.3 43.2 46.9 44.840.8 43.6
80.6 80.8 81.2 81.5 82.186.2
0
20
40
60
80
100
2005-2007 2006-2008 2007-2009 2008-2010 2009-2011 2011-2013
Per
cent
Biennium Periods
ELL* English
Source: Iowa Testing Programs, The University of Iowa.Notes: Percentages for each biennium period represent average percentages of proficient students for the two school years
represented, e.g., 2009-2011 represents the average for the 2009-2010 and the 2010-2011 school years. A student designated as proficient can, at a minimum, do the following: Sometimes makes inferences or predictions from data, judges the relevance and adequacy of information, and recognizes the rationale for and limitations of scientific procedures. *Primary Language Status is classified by English and English Language Learner and determined according to the follow-ing definition: English Language Learner refers to a student who has a language other than English and the proficiency in English is such that the probability of the student’s academic success in an English-only classroom is below that of an academically successful peer with an English language background.
The 2011-2013 biennium data were based on the new Iowa Assessments and 2010 national norms while the other biennium periods data were based on the ITBS/ITED A/B forms and 2000 national norms.
Student Performance 167

Figure 5-54
Percent of Iowa Eleventh Grade Students Proficient on ITED/Iowa Assessments Science Test by Migrant Status* Biennium Periods 2005-2007 to 2009-2011 and 2011-2013
41.647.7
57.1 55.146.7 49.6
80.6 80.8 81.2 80.8 82.1 86.2
0
20
40
60
80
100
2005-2007 2006-2008 2007-2009 2008-2010 2009-2011 2011-2013
Per
cent
Biennium Periods
Migrant
Non-Migrant
Source: Iowa Testing Programs, The University of Iowa.Notes: Percentages for each biennium period represent average percentages of proficient students for the two school years
represented, e.g., 2009-2011 represents the average for the 2009-2010 and the 2010-2011 school years. A student designated as proficient can, at a minimum, do the following: Sometimes makes inferences or predictions from data, judges the relevance and adequacy of information, and recognizes the rationale for and limitations of scientific procedures. *Migrant status is defined as migrant or non-migrant as follows: Migrant—a student is considered a migrant if he or she has moved in the past 36 months from one district to another so that the parents could obtain temporary or seasonal employment in agriculture as their principle means of livelihood.
The 2011-2013 biennium data were based on the new Iowa Assessments and 2010 national norms while the other biennium periods data were based on the ITBS/ITED A/B forms and 2000 national norms.
The Annual Condition of Education Report 2013168
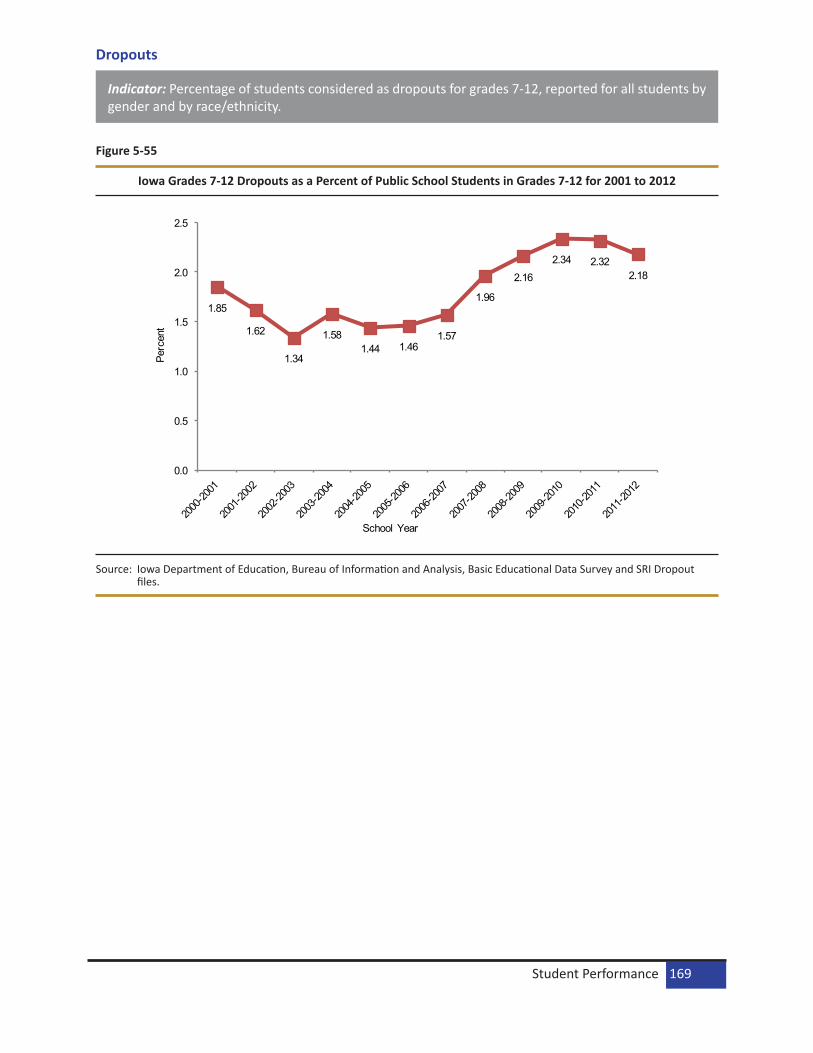
Dropouts
Indicator: Percentage of students considered as dropouts for grades 7-12, reported for all students by gender and by race/ethnicity.
Figure 5-55
Iowa Grades 7-12 Dropouts as a Percent of Public School Students in Grades 7-12 for 2001 to 2012
1.85
1.62
1.34
1.581.44 1.46
1.57
1.96
2.16
2.34 2.322.18
0.0
0.5
1.0
1.5
2.0
2.5
Perc
ent
School Year
Source: Iowa Department of Education, Bureau of Information and Analysis, Basic Educational Data Survey and SRI Dropout files.
Student Performance 169

Figure 5-56
Iowa Grades 7-12 Dropouts as a Percent of Public School Students in Grades 7-12 by Gender 2001 to 2012
2.081.79
1.531.77
1.56 1.611.79
2.222.43
2.64 2.73 2.56
1.601.45
1.131.39 1.33 1.29 1.35
1.691.88
2.031.88 1.79
0.00
0.50
1.00
1.50
2.00
2.50
3.00
2001 2002 2003 2004 2005 2006 2007 2008 2009 2010 2011 2012
Per
cent
School Year Ending
Males Females
Source: Iowa Department of Education, Bureau of Information and Analysis, Basic Educational Data Survey, Dropout files and SRI files.
Figure 5-57
Iowa Grades 7-12 Dropouts as a Percent of Public School Students in Grades 7-12 by Race/Ethnicity 2001-2002, 2009-2010 to 2011-2012
4.35
4.18
1.85
4.55
1.40
6.31
6.15
1.41
4.49
3.04 3.11
1.92
5.85
6.43
1.71
4.19
3.60
2.98
1.92
6.06
4.55
1.56
3.84
3.41
3.25
1.76
0
1
2
3
4
5
6
7
African American
American Indian Asian Hispanic Native Hawaiian/Pacific
Islander
Two or More White
Perc
ent
Race/Ethnicity
2001-2002 2009-2010 2010-2011 2011-2012
Source: Iowa Department of Education, Bureau of Information and Analysis, Basic Educational Data Survey, Dropout files and SRI files.
The Annual Condition of Education Report 2013170
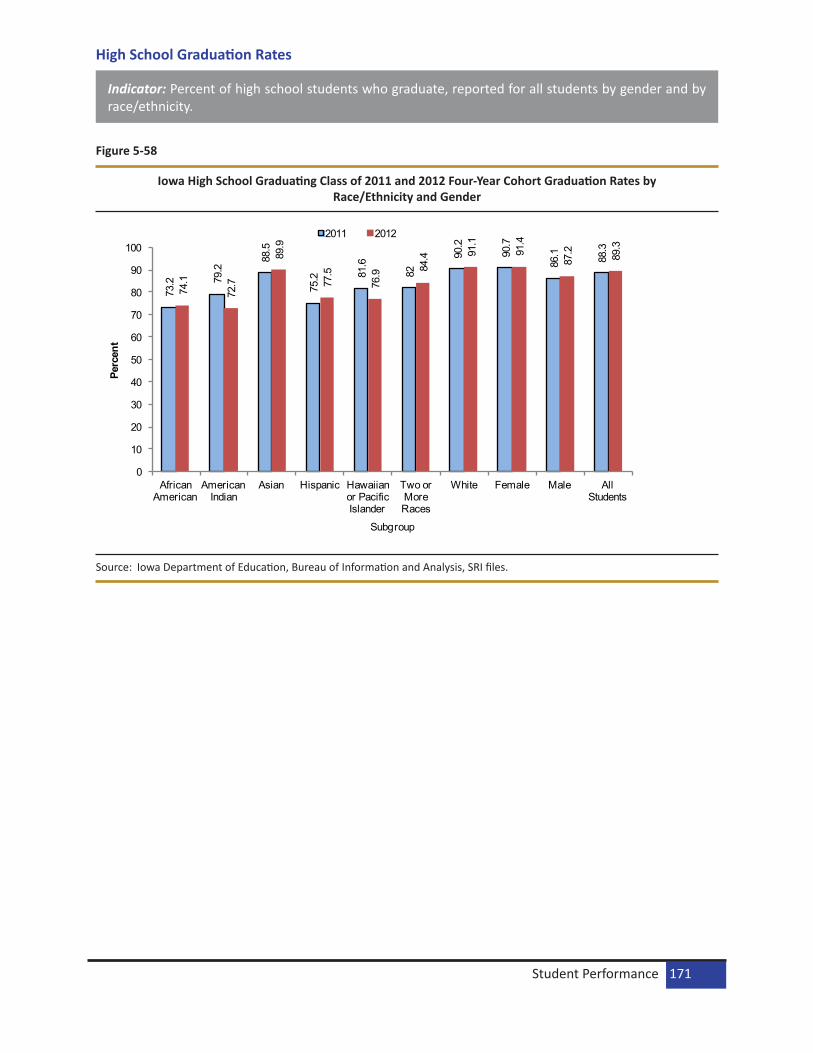
High School Graduation Rates
Indicator: Percent of high school students who graduate, reported for all students by gender and by race/ethnicity.
Figure 5-58
Iowa High School Graduating Class of 2011 and 2012 Four-Year Cohort Graduation Rates by Race/Ethnicity and Gender
73.2 79
.2
88.5
75.2 81
.6
82
90.2
90.7
86.1 88.3
74.1
72.7
89.9
77.5
76.9 84
.4 91.1
91.4
87.2 89.3
0
10
20
30
40
50
60
70
80
90
100
African American
American Indian
Asian Hispanic Hawaiian or Pacific Islander
Two or More Races
White Female Male All Students
Perc
ent
Subgroup
2011 2012
Source: Iowa Department of Education, Bureau of Information and Analysis, SRI files.
Student Performance 171

Postsecondary Education/Training Intentions
Indicator: Percentage of high school graduates/seniors pursuing or intending to pursue postsecondary education/training reported for all students by gender and by race/ethnicity.
Figure 5-59
Percent of All Iowa Public School Graduates/Seniors Pursuing or Intending to Pursue Postsecondary Education/Training Graduating Classes 2001 to 2013
82.7 82.4 82.9 83.5 82.5 83.4 82.5 81.5 81.2 82.1 80.5 80.7 80.5
0
20
40
60
80
100
2001 2002 2003 2004 2005 2006 2007 2008 2009 2010 2011 2012 2013
Per
cent
Graduating Class
Source: Iowa Department of Education, Bureau of Information and Analysis, Basic Educational Data Survey files and SRI files.
Figure 5-60
Percent of Iowa Public School Graduates/Seniors Pursuing or Intending to Pursue Postsecondary Education/Training by Gender Graduating Classes 2001 to 2013
87.5 86.9 87.8 88.3 84.7 86.4 87.1 86.1 85.6 86.5 85.6 86.4 86.7
77.8 77.9 78.0 78.7 75.6 77.2 78.0 77.1 76.8 77.5 75.3 75.0 74.5
0102030405060708090
100
2001 2002 2003 2004 2005 2006 2007 2008 2009 2010 2011 2012 2013
Per
cent
Graduating Class
FemaleMale
Source: Iowa Department of Education, Bureau of Information and Analysis, Basic Educational Data Survey files and SRI files.
The Annual Condition of Education Report 2013172

Figure 5-61
Percent of Iowa Public School Graduates/Seniors Pursuing or Intending to Pursue Postsecondary Education/Training by Race/Ethnicity Graduating Class of 2013
74.569.5
84.9
71.162.2
79.8 81.6 80.5
0102030405060708090
100Pe
rcen
t
Race/Ethnicity
Source: Iowa Department of Education, Bureau of Information and Analysis, Basic Educational Data Survey files.
Probable Postsecondary Success
Indicator: Percentage of students achieving an ACT score above the national average and the percent-age of students achieving an ACT score of 20 or above.
Figure 5-62
Percent of Iowa ACT Participants Achieving an ACT Score Above the National Average and an ACT Score of 20 or Above 2001 to 2013
60.3 62.1 62.4 61.5 62.1 61.4 62.1 63.1 62.9 62.5 63.0 61.4 61.7
68.9 68.8 69.3 69.5 69.9 71.2 71.9 72.7 72.2 70.8 71.4 70.3 69.7
0102030405060708090
100
2001 2002 2003 2004 2005 2006 2007 2008 2009 2010 2011 2012 2013
Per
cent
Graduating Class
% Above National Average
% Scoring 20 or Above
Source: ACT, Inc., The High School Profile Report for Iowa.
Student Performance 173
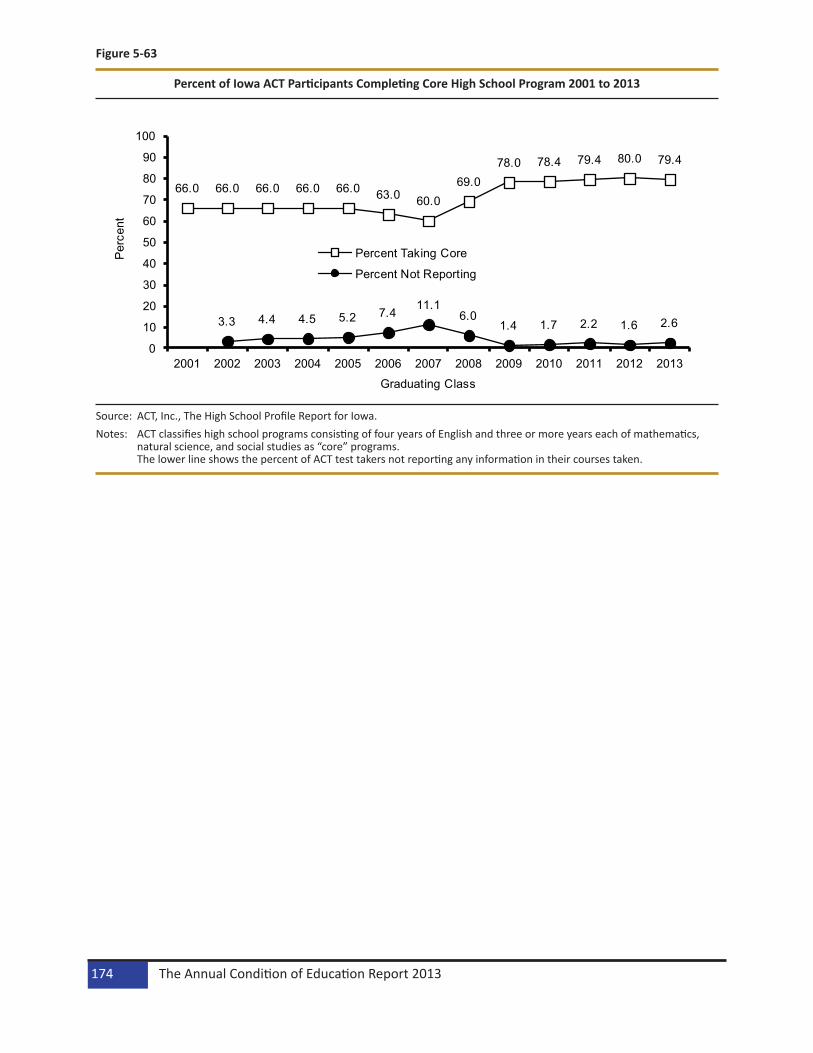
Figure 5-63
Percent of Iowa ACT Participants Completing Core High School Program 2001 to 2013
66.0 66.0 66.0 66.0 66.0 63.0 60.069.0
78.0 78.4 79.4 80.0 79.4
3.3 4.4 4.5 5.2 7.4 11.16.0
1.4 1.7 2.2 1.6 2.6
0
10
20
30
40
50
60
70
80
90
100
2001 2002 2003 2004 2005 2006 2007 2008 2009 2010 2011 2012 2013
Per
cent
Graduating Class
Percent Taking Core
Percent Not Reporting
Source: ACT, Inc., The High School Profile Report for Iowa.Notes: ACT classifies high school programs consisting of four years of English and three or more years each of mathematics,
natural science, and social studies as “core” programs. The lower line shows the percent of ACT test takers not reporting any information in their courses taken.
The Annual Condition of Education Report 2013174
Student Performance by Tests and Areas
Iowa AssessmentsThe standardized achievement tests, Iowa Assessments, are developed by Iowa Testing Programs (ITP) at The University of Iowa for use nationally in grades K-12. During the 2012-2013 school year, all Iowa public school districts and over 170 nonpublic schools participated in the ITP achievement assessments. The biennium trends of the percent of public and nonpublic school students proficient in grades 4, 8, and 11 in reading and mathematics, and the percent of students in grades 8 and 11 proficient in science are included in the state indicators.
Iowa Assessment Achievement Level DistributionsForm E of the Iowa Assessments with 2011 national norms was used for the first time during the 2011-2012 school year. The achievement level data on Iowa Assessments are shown for all students in grades 4, 8, and 11 in reading and mathematics and in grades 8 and 11 in science between 2005-2007 and 2011-2013. Proficiency cut scores for the three achievement levels of the Iowa Assessments are presented in Standard Score metric and are specific to grade, content, and time of year. The Standard Score metric allows teach-ers and parents to monitor growth across years and make connections between growth and proficiency.
Student Performance 175

Achievement Levels for ReadingFigures 5-64 through 5-66 show the achievement level trends for reading for all students in grades 4, 8, and 11 for the biennium periods 2005-2007 through 2011-2013. More students were categorized in the Low achievement level in reading in grades 4 (Figure 5-64) and grade 8 (Figure 5-65). Less students were categorized in the Low achievement level and more students were categorized in the Intermediate achievement level in grade 11 (Figure 5-66) in 2011-2013.
Figure 5-64
ITBS/Iowa Assessments Reading - Grade 4 Percentages for Iowa Achievement Levels Biennium Periods 2005-2007 to 2011-2013
21.0
21.1
20.8
20.4
19.9 25
.4
57.8
58.0
57.8
57.9
58.3
56.3
21.2
20.9
21.4
21.6
21.7
18.3
0
20
40
60
80
100
2005
-200
720
06-2
008
2007
-200
920
08-2
010
2009
-201
1
2011
-201
3
2005
-200
720
06-2
008
2007
-200
920
08-2
010
2009
-201
1
2011
-201
3
2005
-200
720
06-2
008
2007
-200
920
08-2
010
2009
-201
1
2011
-201
3
Per
cent
Biennium Periods
Low
Intermediate
High
Source: Iowa Testing Programs, The University of Iowa.Notes: The descriptions below indicate how the typical grade 4 student at each achievement level performs with respect to the
ITBS Reading Comprehension test: HIGH PERFORMANCE LEVEL Understands factual information; draws conclusions and makes inferences about the motives and feelings of characters; identifies the main idea; evaluates the style and structure of the text; and interprets nonliteral language. INTERMEDIATE PERFORMANCE LEVEL Understands some factual information; sometimes can draw conclusions and make inferences about the motives and feelings of characters; and is beginning to be able to identify the main idea, evaluates the style and structure of the text, and interpret nonliteral language. LOW PERFORMANCE LEVEL Understands little factual information; seldom draws conclusions or makes simple inferences about characters; rarely grasps the main idea, evaluates the style and structure of the text, or interprets nonliteral language. Percentages for each biennium period represent average percentages of proficient students for the two school years represented, e.g., 2009-2011 represents the average for the 2009-2010 and the 2010-2011 school years. Figures may not total 100 percent due to rounding.
The 2011-2013 biennium data were based on the new Iowa Assessments and 2010 national norms while the other biennium periods data were based on the ITBS/ITED A/B Forms and 2000 national norms.
The Annual Condition of Education Report 2013176
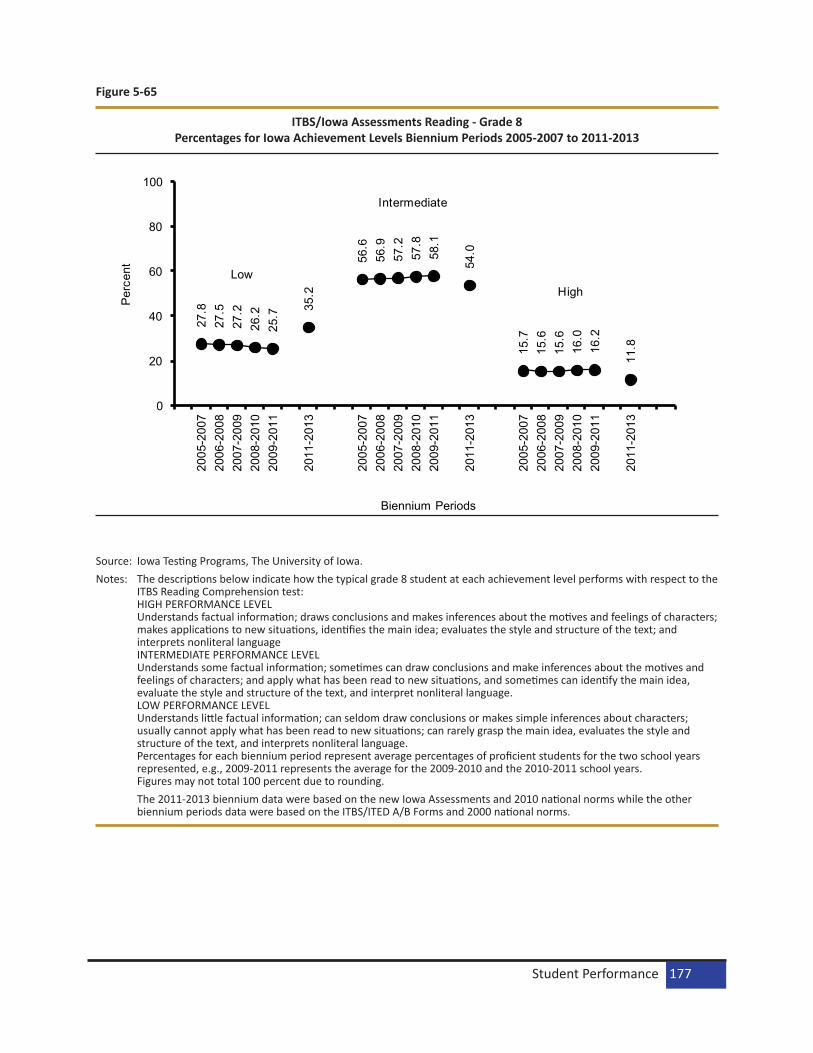
Figure 5-65
ITBS/Iowa Assessments Reading - Grade 8 Percentages for Iowa Achievement Levels Biennium Periods 2005-2007 to 2011-2013
27.8
27.5
27.2
26.2
25.7
35.2
56.6
56.9
57.2
57.8
58.1
54.0
15.7
15.6
15.6
16.0
16.2
11.8
0
20
40
60
80
10020
05-2
007
2006
-200
820
07-2
009
2008
-201
020
09-2
011
2011
-201
3
2005
-200
720
06-2
008
2007
-200
920
08-2
010
2009
-201
1
2011
-201
3
2005
-200
720
06-2
008
2007
-200
920
08-2
010
2009
-201
1
2011
-201
3
Per
cent
Biennium Periods
Low
Intermediate
High
Source: Iowa Testing Programs, The University of Iowa.Notes: The descriptions below indicate how the typical grade 8 student at each achievement level performs with respect to the
ITBS Reading Comprehension test: HIGH PERFORMANCE LEVEL Understands factual information; draws conclusions and makes inferences about the motives and feelings of characters; makes applications to new situations, identifies the main idea; evaluates the style and structure of the text; and interprets nonliteral language INTERMEDIATE PERFORMANCE LEVEL Understands some factual information; sometimes can draw conclusions and make inferences about the motives and feelings of characters; and apply what has been read to new situations, and sometimes can identify the main idea, evaluate the style and structure of the text, and interpret nonliteral language. LOW PERFORMANCE LEVEL Understands little factual information; can seldom draw conclusions or makes simple inferences about characters; usually cannot apply what has been read to new situations; can rarely grasp the main idea, evaluates the style and structure of the text, and interprets nonliteral language. Percentages for each biennium period represent average percentages of proficient students for the two school years represented, e.g., 2009-2011 represents the average for the 2009-2010 and the 2010-2011 school years. Figures may not total 100 percent due to rounding.
The 2011-2013 biennium data were based on the new Iowa Assessments and 2010 national norms while the other biennium periods data were based on the ITBS/ITED A/B Forms and 2000 national norms.
Student Performance 177
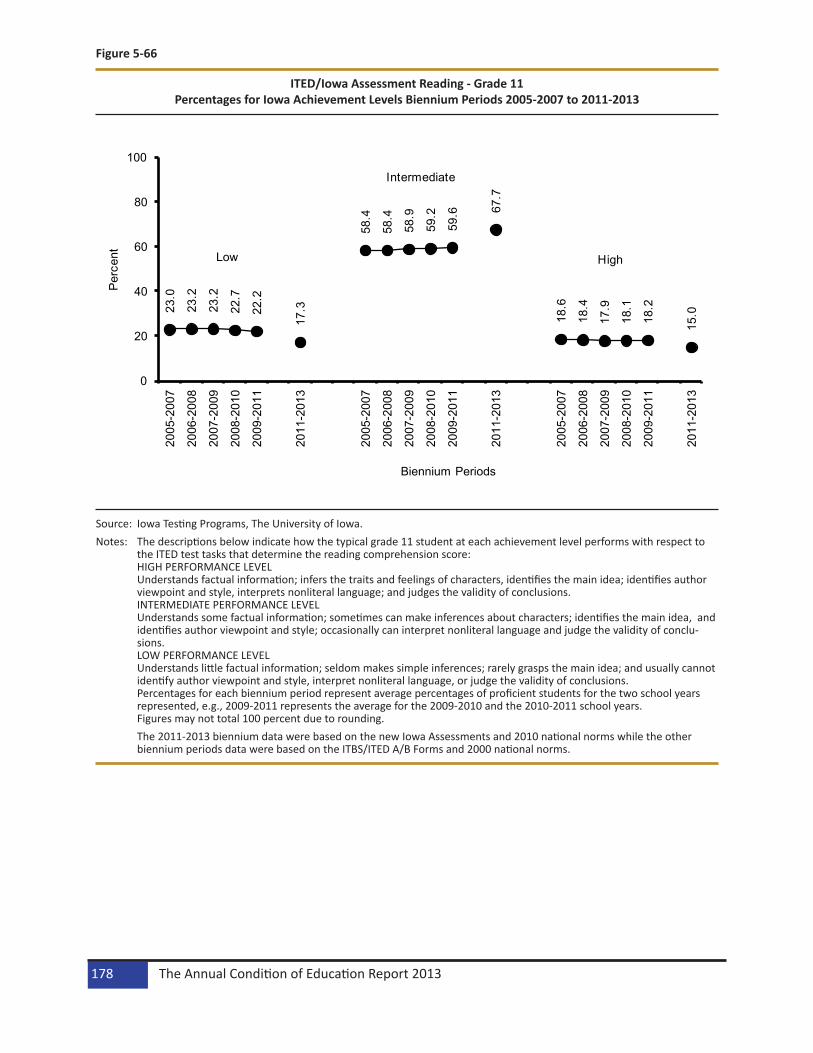
Figure 5-66
ITED/Iowa Assessment Reading - Grade 11 Percentages for Iowa Achievement Levels Biennium Periods 2005-2007 to 2011-2013
23.0
23.2
23.2
22.7
22.2
17.3
58.4
58.4
58.9
59.2
59.6 67
.7
18.6
18.4
17.9
18.1
18.2
15.0
0
20
40
60
80
10020
05-2
007
2006
-200
8
2007
-200
9
2008
-201
0
2009
-201
1
2011
-201
3
2005
-200
7
2006
-200
8
2007
-200
9
2008
-201
0
2009
-201
1
2011
-201
3
2005
-200
7
2006
-200
8
2007
-200
9
2008
-201
0
2009
-201
1
2011
-201
3
Per
cent
Biennium Periods
Low
Intermediate
High
Source: Iowa Testing Programs, The University of Iowa.Notes: The descriptions below indicate how the typical grade 11 student at each achievement level performs with respect to
the ITED test tasks that determine the reading comprehension score: HIGH PERFORMANCE LEVEL Understands factual information; infers the traits and feelings of characters, identifies the main idea; identifies author viewpoint and style, interprets nonliteral language; and judges the validity of conclusions. INTERMEDIATE PERFORMANCE LEVEL Understands some factual information; sometimes can make inferences about characters; identifies the main idea, and identifies author viewpoint and style; occasionally can interpret nonliteral language and judge the validity of conclu-sions. LOW PERFORMANCE LEVEL Understands little factual information; seldom makes simple inferences; rarely grasps the main idea; and usually cannot identify author viewpoint and style, interpret nonliteral language, or judge the validity of conclusions. Percentages for each biennium period represent average percentages of proficient students for the two school years represented, e.g., 2009-2011 represents the average for the 2009-2010 and the 2010-2011 school years. Figures may not total 100 percent due to rounding.
The 2011-2013 biennium data were based on the new Iowa Assessments and 2010 national norms while the other biennium periods data were based on the ITBS/ITED A/B Forms and 2000 national norms.
The Annual Condition of Education Report 2013178

Achievement Levels for MathematicsFigures 5-67 through 5-69 show the mathematics achievement level distributions for students in grades 4, 8, and 11 for the biennium periods 2005-2007 through 2011-2013. More students performed at the Low achievement level during 2011-2013 in mathematics in grades 4 (Figure 5-67) and 8 (Figure 5-68). Less students performed at the Low achievement level and more students were categorized in the Intermedi-ate achievement level in grade 11 (Figure 5-69) in 2011-2013.
Figure 5-67
ITBS/Iowa Assessments Mathematics - Grade 4 Percentages for Iowa Achievement Levels Biennium Periods 2005-2007 to 2011-2013
19.4 19
.519
.919
.819
.3
22.2
56.6
56.1
55.8
55.9
56.3
55.7
24.0
24.4
24.3
24.3
24.4
22.1
0
20
40
60
80
100
2005
-200
720
06-2
008
2007
-200
920
08-2
010
2009
-201
1
2011
-201
3
2005
-200
720
06-2
008
2007
-200
920
08-2
010
2009
-201
1
2011
-201
3
2005
-200
720
06-2
008
2007
-200
920
08-2
010
2009
-201
1
2011
-201
3
Per
cent
Biennium Periods
LowHigh
Intermediate
Source: Iowa Testing Programs, The University of Iowa.Notes: The descriptions below indicate how the typical grade 4 student at each achievement level performs with respect to the
ITBS test tasks that determine the Mathematics Total score: HIGH PERFORMANCE LEVEL Understands math concepts, solves complex word problems, uses various estimation methods, and is learning to interpret data from graphs and tables. INTERMEDIATE PERFORMANCE LEVEL Is developing an understanding of most math concepts, is developing the ability to solve simple and complex word problems and to use estimation methods, and is beginning to develop the ability to interpret data from graphics and tables. LOW PERFORMANCE LEVEL Is beginning to develop an understanding of many math concepts and an ability to solve simple word problems. Is generally unable to use estimation methods, and is seldom able to interpret data from graphs and tables. Percentages for each biennium period represent average percentages of proficient students for the two school years represented, e.g., 2009-2011 represents the average for the 2009-2010 and the 2010-2011 school years. Figures may not total 100 percent due to rounding.
The 2011-2013 biennium data were based on the new Iowa Assessments and 2010 national norms while the other biennium periods data were based on the ITBS/ITED A/B Forms and 2000 national norms.
Student Performance 179
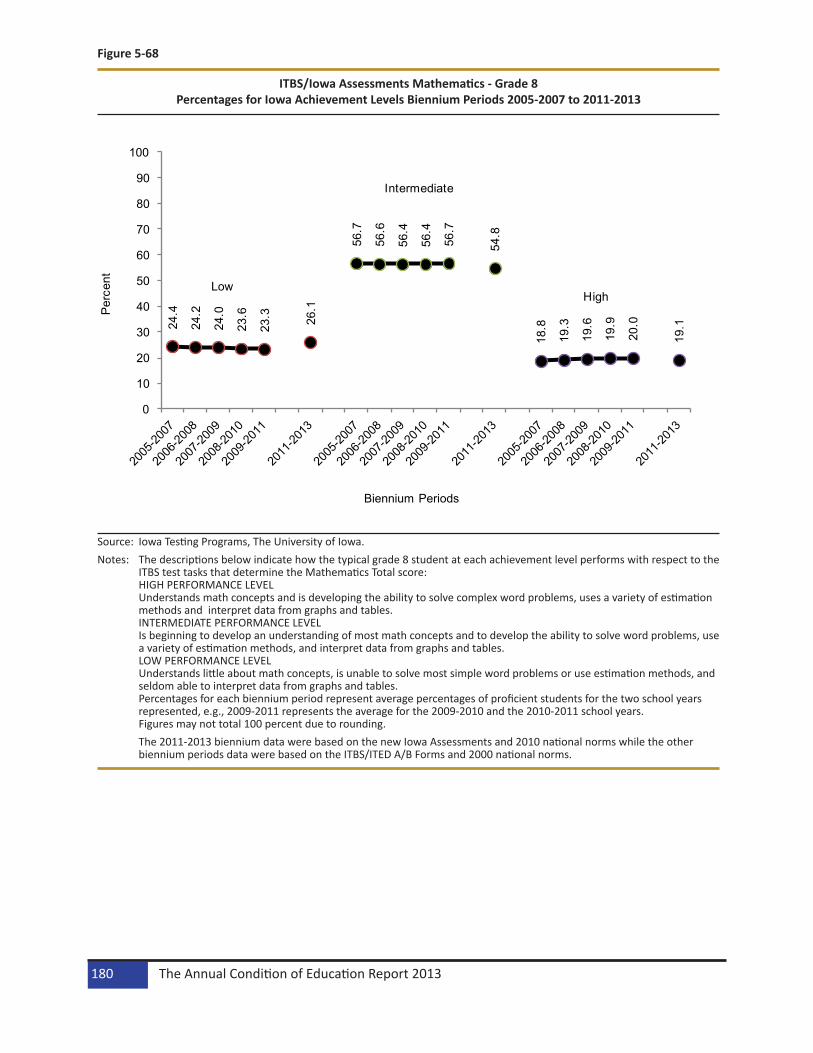
Figure 5-68
ITBS/Iowa Assessments Mathematics - Grade 8 Percentages for Iowa Achievement Levels Biennium Periods 2005-2007 to 2011-2013
24.4
24.2
24.0
23.6
23.3 26
.1
56.7
56.6
56.4
56.4
56.7
54.8
18.8
19.3
19.6
19.9
20.0
19.1
0
10
20
30
40
50
60
70
80
90
100
Per
cent
Biennium Periods
Low
Intermediate
High
Source: Iowa Testing Programs, The University of Iowa.Notes: The descriptions below indicate how the typical grade 8 student at each achievement level performs with respect to the
ITBS test tasks that determine the Mathematics Total score: HIGH PERFORMANCE LEVEL Understands math concepts and is developing the ability to solve complex word problems, uses a variety of estimation methods and interpret data from graphs and tables. INTERMEDIATE PERFORMANCE LEVEL Is beginning to develop an understanding of most math concepts and to develop the ability to solve word problems, use a variety of estimation methods, and interpret data from graphs and tables. LOW PERFORMANCE LEVEL Understands little about math concepts, is unable to solve most simple word problems or use estimation methods, and seldom able to interpret data from graphs and tables. Percentages for each biennium period represent average percentages of proficient students for the two school years represented, e.g., 2009-2011 represents the average for the 2009-2010 and the 2010-2011 school years. Figures may not total 100 percent due to rounding.
The 2011-2013 biennium data were based on the new Iowa Assessments and 2010 national norms while the other biennium periods data were based on the ITBS/ITED A/B Forms and 2000 national norms.
The Annual Condition of Education Report 2013180
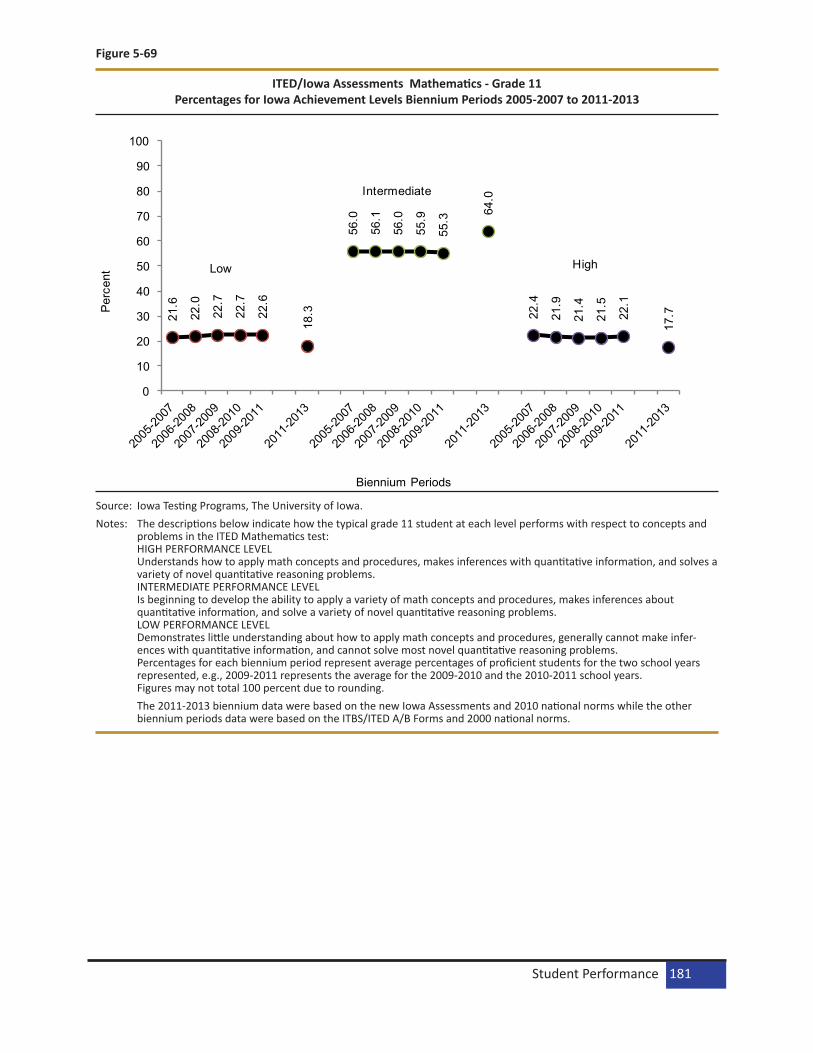
Figure 5-69
ITED/Iowa Assessments Mathematics - Grade 11 Percentages for Iowa Achievement Levels Biennium Periods 2005-2007 to 2011-2013
21.6
22.0
22.7
22.7
22.6
18.3
56.0
56.1
56.0
55.9
55.3
64.0
22.4
21.9
21.4
21.5
22.1
17.7
0
10
20
30
40
50
60
70
80
90
100
Per
cent
Biennium Periods
Low
Intermediate
High
Source: Iowa Testing Programs, The University of Iowa.Notes: The descriptions below indicate how the typical grade 11 student at each level performs with respect to concepts and
problems in the ITED Mathematics test: HIGH PERFORMANCE LEVEL Understands how to apply math concepts and procedures, makes inferences with quantitative information, and solves a variety of novel quantitative reasoning problems. INTERMEDIATE PERFORMANCE LEVEL Is beginning to develop the ability to apply a variety of math concepts and procedures, makes inferences about quantitative information, and solve a variety of novel quantitative reasoning problems. LOW PERFORMANCE LEVEL Demonstrates little understanding about how to apply math concepts and procedures, generally cannot make infer-ences with quantitative information, and cannot solve most novel quantitative reasoning problems. Percentages for each biennium period represent average percentages of proficient students for the two school years represented, e.g., 2009-2011 represents the average for the 2009-2010 and the 2010-2011 school years. Figures may not total 100 percent due to rounding.
The 2011-2013 biennium data were based on the new Iowa Assessments and 2010 national norms while the other biennium periods data were based on the ITBS/ITED A/B Forms and 2000 national norms.
Student Performance 181

Achievement Levels for ScienceFigure 5-70 shows the Iowa Assessment science achievement level distributions for students in grade 8 and Figure 5-71 shows the science achievement level distributions for students in grade 11. Grade 8 students had a higher percent of students performing at the Low achievement level and a lower percent of students performing at the High achievement level in 2011-2013. In 2011-2013, less grade 11 students performed in the Low level for science, while the Intermediate achievement level for grade 11 science increased.
Figure 5-70
ITBS/Iowa Assessments Science - Grade 8 Percentages for Iowa Achievement Levels Biennium Periods 2005-2007 to 2011-2013
19.0
18.6
18.4
17.8
17.5
24.3
64.0
64.3
64.6
64.8
65.1
65.1
17.0
17.1
17.0
17.4
17.4
10.6
0
20
40
60
80
100
2005
-200
720
06-2
008
2007
-200
920
08-2
010
2009
-201
1
2011
-201
3
2005
-200
720
06-2
008
2007
-200
920
08-2
010
2009
-201
1
2011
-201
3
2005
-200
720
06-2
008
2007
-200
920
08-2
010
2009
-201
1
2011
-201
3
Per
cent
Biennium Periods
Low
Intermediate
High
Source: Iowa Testing Programs, The University of Iowa.Notes: The descriptions below indicate how the typical grade 8 student at each achievement level performs with respect to the
ITBS Science test: HIGH PERFORMANCE LEVEL Usually understands ideas related to Earth and the universe and to the life sciences. Understands ideas related to the physical sciences and is able to demonstrate the skills of scientific inquiry. INTERMEDIATE PERFORMANCE LEVEL Sometimes understands ideas related to Earth and the universe, the life sciences, and the physical sciences. Often can demonstrate the skills of scientific inquiry. LOW PERFORMANCE LEVEL Sometimes understands ideas related to Earth and the universe, but seldom understands ideas about the life sciences or the physical sciences. Rarely demonstrates the skills of scientific inquiry. Percentages for each biennium period represent average percentages of proficient students for the two school years represented, e.g., 2009-2011 represents the average for the 2009-2010 and the 2010-2011 school years.
The 2011-2013 biennium data were based on the new Iowa Assessments and 2010 national norms while the other biennium periods data were based on the ITBS/ITED A/B Forms and 2000 national norms.
The Annual Condition of Education Report 2013182

Figure 5-71
ITED/Iowa Assessments Science - Grade 11 Percentages for Iowa Achievement Levels Biennium Periods 2005-2007 to 2011-2013
19.6
19.3
19.5
19.3
18.7
14.8
56.4
56.7
57.2
57.1
57.2 64
.2
24.1
24.0
23.4
23.6
24.2
21.0
0
20
40
60
80
10020
05-2
007
2006
-200
8
2007
-200
9
2008
-201
0
2009
-201
1
2011
-201
3
2005
-200
7
2006
-200
8
2007
-200
9
2008
-201
0
2009
-201
1
2011
-201
3
2005
-200
7
2006
-200
8
2007
-200
9
2008
-201
0
2009
-201
1
2011
-201
3
Per
cent
Biennium Periods
Low
Intermediate
High
Source: Iowa Testing Programs, The University of Iowa.Notes: The descriptions below indicate how the typical grade 11 student at each achievement level performs with respect to
the ITED Science test: HIGH PERFORMANCE LEVEL Makes inferences and predictions from data, recognizes the rationale for and limitations of scientific procedures, and usually judges the relevance and adequacy of information. INTERMEDIATE PERFORMANCE LEVEL Sometimes makes inferences or predictions from data, judges the relevance and adequacy of information, and recognizes the rationale for and limitations of scientific procedures. LOW PERFORMANCE LEVEL Rarely makes inferences or predictions from data, judges the relevance and adequacy of information, or recognizes the rationale for and limitations of scientific procedures. Percentages for each biennium period represent average percentages of proficient students for the two school years represented, e.g., 2009-2011 represents the average for the 2009-2010 and the 2010-2011 school years. Figures may not total 100 percent due to rounding.
The 2011-2013 biennium data were based on the new Iowa Assessments and 2010 national norms while the other biennium periods data were based on the ITBS/ITED A/B Forms and 2000 national norms.
Student Performance 183

National Assessment of Educational Progress (NAEP)The National Assessment of Educational Progress (NAEP), conducted by the U.S. Department of Education since 1969, is the only national assessment of student achievement. The NAEP state assessments have been administered periodically in grades 4 and 8 since 1990 in the areas of reading, mathematics, science, and writing. In 2009, Iowa participated in the first state NAEP assessment for grade 12 students.
NAEP began testing with the use of accommodations in reading in 1998 and in mathematics in 2000. The use of accommodations allows for the assessment of special needs students (e.g., students with disabili-ties, ELL students) in a small group setting, with extra time, or with more breaks to result in higher levels of inclusion. Tables and figures in this section include the results for accommodations not permitted in the earlier years and for accommodations permitted in the most recent years.
Average Scale Scores NAEP assessment scores in reading and mathematics are reported on a scale range of 0 to 500 while the science and writing assessments are reported on a 300 point scale. Iowa’s average assessment scale scores in 2013 exceed the national averages in grades 4 and 8 for reading and in grade 4 for mathematics. The Iowa average score in grade 8 mathematics is not statistically different from the national average.
The National Assessment Governing Board uses three achievement levels for reporting student perfor-mance results: Basic, Proficient, and Advanced. Basic represents at least a partial mastery of prerequisite knowledge and skills that are fundamental for proficient work at each grade. Proficient represents solid academic performance, and Advanced represents superior performance. Students not achieving the Basic level are classified as Below Basic.
Table 5-4
Average NAEP Scale Scores for Public Schools Grades 4, 8, and 12
Scale Score Achievement Level Iowa Percent At or Above
Subject Grade Year State National Basic Proficient AdvancedMathematics 4 2013 246 241 87 48 9(scale: 0-500) 2011 243 240 86 43 6
2009 243 239 87 41 52007 243 239 87 43 52005 240 237 85 37 42003 238 234 83 36 32000 231 224 75 26 2
2000* 233 226 78 28 21996* 229 222 74 22 11992* 230 219 72 26 2
8 2013 285 284 76 36 72011 285 283 77 34 82009 284 282 76 34 72007 285 280 77 35 72005 284 278 75 34 62003 284 276 76 33 5
The Annual Condition of Education Report 2013184

Table 5-4 (…continued)
Source: U.S. Department of Education, Institute of Education Sciences, National Center for Education Statistics, National Assessment of Educational Progress (NAEP).
Notes: *Accommodations not allowed. Observed differences are not necessarily statistically significant. Detail may not sum to totals because of rounding.
Scale Score Achievement LevelIowa Percent At or Above
Subject Grade Year State National Basic Proficient Advanced1996* 284 271 78 31 41992* 283 267 76 31 41990* 278 262 70 25 3
(scale: 0-300) 12 2009 156 152 71 25 1
Reading 4 2013 224 221 72 38 9(scale: 0-500) 2011 221 220 69 33 6
2009 221 220 69 34 72007 225 220 74 36 72005 221 217 67 33 72003 223 216 70 35 72002 223 217 69 35 71998 220 213 67 33 7
1998* 223 215 70 35 71994* 223 212 69 35 81992* 225 215 73 36 7
8 2013 269 266 81 37 32011 265 264 77 33 22009 265 262 77 32 22007 267 261 80 36 22005 267 260 79 34 32003 268 261 79 36 3
12 2009 291 287 79 39 4
Science 4 2009 157 149 80 41 1(scale: 0-300) 8 2009 156 149 72 35 1
Writing 4 2002 155 153 89 27 1(scale: 0-300) 8 2007 155 154 88 32 1
Student Performance 185

The following figures show the scale score growth of Iowa students on the NAEP during the period from 2003 to 2013. The eleven other states classified as Midwestern states are also included for comparison. Iowa has not shown the growth in reading or in grade 8 mathematics that has been found in other states across the Midwest and across the nation.
Figure 5-72
NAEP Mathematics Grade 4 Midwest States Change in Average Scale Score 2003-2013
MI
ILMONational Public
SDNE WI
Iowa OH ND
KS
IN
MN
220
225
230
235
240
245
250
255
260
2013 Average Scale Score
2003 Average Scale Score
Source: U.S. Department of Education, Institute of Education Sciences, National Center for Education Statistics, National Assessment of Educational Progress (NAEP), 2013 Mathematics Assessment.
The Annual Condition of Education Report 2013186

Figure 5-73
NAEP Mathematics Grade 8 Midwest States Change in Average Scale Scores 2003-2013
MIMO
National Public
NE
IL
Iowa SD
IN
WIOH
KS
ND
MN
260
265
270
275
280
285
290
295
300
2013 Average Scale Score
2003 Average Scale Score
Source: U.S. Department of Education, Institute of Education Sciences, National Center for Education Statistics, National Assess-ment of Educational Progress (NAEP), 2013 Mathematics Assessment.
Student Performance 187

Figure 5-74
NAEP Reading Grade 4 Midwest States Change in Average Scale Score 2003-2013
SDWI MO
IL
MINational Public
NE KSIowa OH ND IN
MN
200
205
210
215
220
225
230
235
240
245
250
2013 Average Scale Score
2003 Average Scale Score
Source: U.S. Department of Education, Institute of Education Sciences, National Center for Education Statistics, National Assess-ment of Educational Progress (NAEP), 2013 Reading Assessment.
The Annual Condition of Education Report 2013188

Figure 5-75
NAEP Reading Grade 8 Midwest States Change in Average Scale Score 2003-2013
National PublicMI IN KS IL MO WI
ND SD
NE OH Iowa MN
250
255
260
265
270
275
280
285
290
2013 Average Scale Score
2003 Average Scale Score
Source: U.S. Department of Education, Institute of Education Sciences, National Center for Education Statistics, National Assess-ment of Educational Progress (NAEP), 2013 Reading Assessment.
Student Performance 189
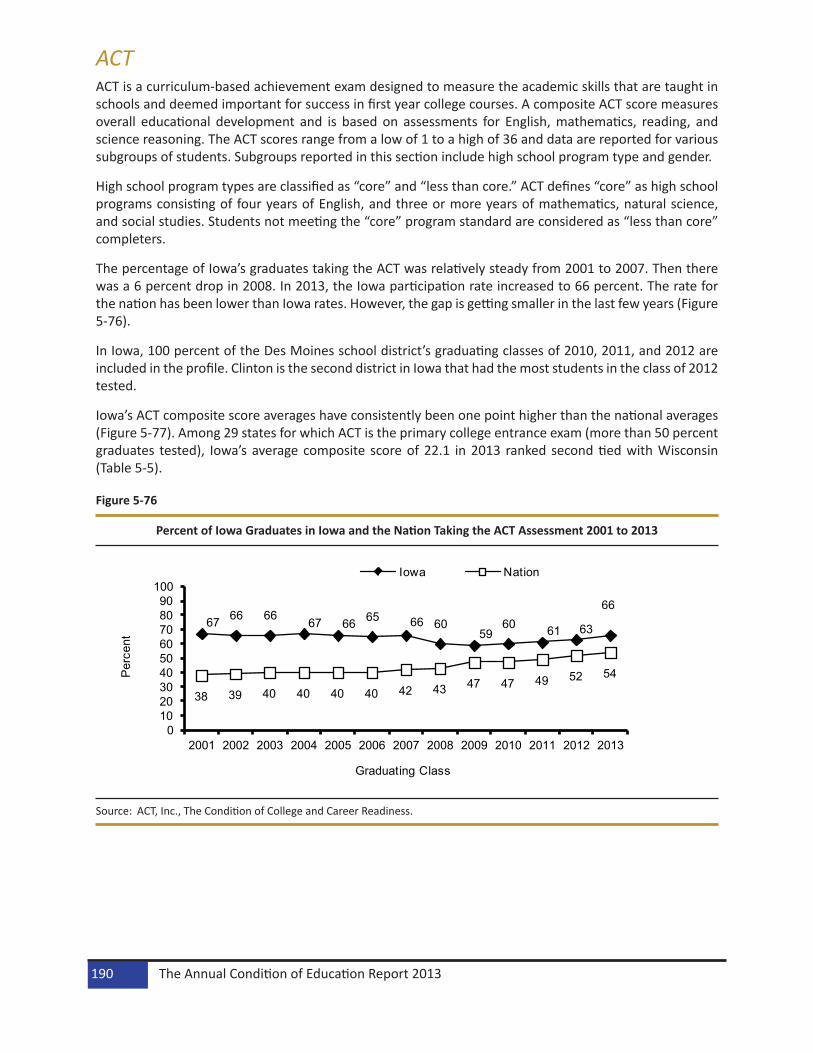
ACTACT is a curriculum-based achievement exam designed to measure the academic skills that are taught in schools and deemed important for success in first year college courses. A composite ACT score measures overall educational development and is based on assessments for English, mathematics, reading, and science reasoning. The ACT scores range from a low of 1 to a high of 36 and data are reported for various subgroups of students. Subgroups reported in this section include high school program type and gender.
High school program types are classified as “core” and “less than core.” ACT defines “core” as high school programs consisting of four years of English, and three or more years of mathematics, natural science, and social studies. Students not meeting the “core” program standard are considered as “less than core” completers.
The percentage of Iowa’s graduates taking the ACT was relatively steady from 2001 to 2007. Then there was a 6 percent drop in 2008. In 2013, the Iowa participation rate increased to 66 percent. The rate for the nation has been lower than Iowa rates. However, the gap is getting smaller in the last few years (Figure 5-76).
In Iowa, 100 percent of the Des Moines school district’s graduating classes of 2010, 2011, and 2012 are included in the profile. Clinton is the second district in Iowa that had the most students in the class of 2012 tested.
Iowa’s ACT composite score averages have consistently been one point higher than the national averages (Figure 5-77). Among 29 states for which ACT is the primary college entrance exam (more than 50 percent graduates tested), Iowa’s average composite score of 22.1 in 2013 ranked second tied with Wisconsin (Table 5-5).
Figure 5-76
Percent of Iowa Graduates in Iowa and the Nation Taking the ACT Assessment 2001 to 2013
67 66 66 67 66 65 66 6059
60 61 63
66
38 39 40 40 40 40 42 43 47 47 49 52 54
0102030405060708090
100
2001 2002 2003 2004 2005 2006 2007 2008 2009 2010 2011 2012 2013
Per
cent
Graduating Class
Iowa Nation
Source: ACT, Inc., The Condition of College and Career Readiness.
The Annual Condition of Education Report 2013190
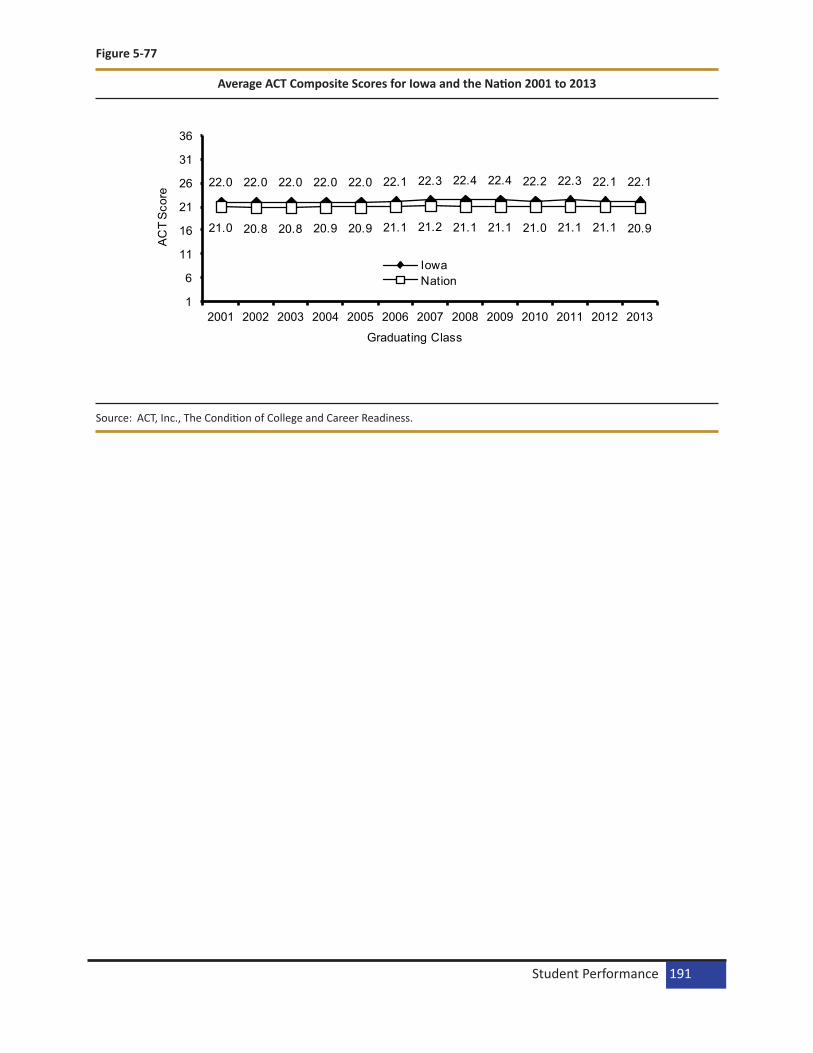
Figure 5-77
Average ACT Composite Scores for Iowa and the Nation 2001 to 2013
22.0 22.0 22.0 22.0 22.0 22.1 22.3 22.4 22.4 22.2 22.3 22.1 22.1
21.0 20.8 20.8 20.9 20.9 21.1 21.2 21.1 21.1 21.0 21.1 21.1 20.9
1
6
11
16
21
26
31
36
2001 2002 2003 2004 2005 2006 2007 2008 2009 2010 2011 2012 2013
AC
T S
core
Graduating Class
IowaNation
Source: ACT, Inc., The Condition of College and Career Readiness.
Student Performance 191

Table 5-5
ACT Average Composite Scores for Iowa, the Nation, and Midwest States Classes of 2011 to 2013
Source: ACT, Inc., The Condition of College and Career Readiness.Note: *National rank includes only those states where ACT is the primary college entrance exam.
ACT Score Comparisons for English, Mathematics, Reading, and Science for Iowa and the NationIowa’s average ACT scores were higher than the national averages in English, mathematics, reading, and science (Table 5-6).
Class of 2011 Class of 2012 Class of 2013Nation and
StateACT
CompositePercent
Graduates Tested
ACT Composite
Percent Graduates
Tested
ACT Composite
Percent Graduates
Tested
2013 National
RankNation 21.1 49% 21.1 52% 20.9 54% -Illinois 20.9 100 20.9 100% 20.6 100% 13
Indiana 22.3 29 22.3 32.00% 21.7 38% -Iowa 22.3 61 22.1 63% 22.1 66% 2
Kansas 22.0 79 21.9 81% 21.8 75% 5Michigan 20.0 100 20.1 100% 19.9 100% 20
Minnesota 22.9 72 22.8 74% 23.0 74% 1Missouri 21.6 71 21.6 75% 21.6 74% 7
Nebraska 22.1 76 22.0 78% 21.5 84% 8North Dakota 20.7 98 20.7 100% 20.5 98% 15
Ohio 21.8 69 21.8 71% 21.8 72% 5South Dakota 21.8 81 21.8 81% 21.9 78% 4
Wisconsin 22.2 71 22.1 71% 22.1 71% 2
The Annual Condition of Education Report 2013192

Table 5-6
Average ACT Scores for Iowa and the Nation Graduating Classes 2001 to 2013
Source: ACT, Inc., The Condition of College and Career Readiness.
ACT Scores for Core and Less-than-Core StudentsACT defines the college-preparatory core curriculum as at least four years of English and at least three years each of mathematics, natural science, and social studies (Table 5-7). Core mathematics and natural science courses are beyond the introductory level. For example, a typical minimal core mathematics course might include Algebra I, Algebra II, and geometry one year each. A typical minimal core natural science course might include one year each of general science, biology, and chemistry or physics.
Almost 80 percent of Iowa’s 2013 graduates taking the ACT indicated that they participated in the core high school program (Figure 5-78). The enforcement from 2008, for reporting seniors taking core high school program, shows higher Iowa and national percentages in recent five years.
Overall, average ACT composite scores for Iowa students taking core have been approximately three points higher than those not taking core (Table 5-8). This trend has been consistent at more than two points difference score for nationwide students.
Table 5-7
ACT Standards for Core High School Programs
Source: ACT, Inc., The Condition of College and Career Readiness.
Graduating Class English Mathematics Reading Science
Iowa Nation Iowa Nation Iowa Nation Iowa Nation
2001 21.3 20.5 21.6 20.7 22.3 21.3 22.2 21.0
2002 21.2 20.2 21.7 20.6 22.4 21.1 22.1 20.8
2003 21.3 20.3 21.6 20.6 22.4 21.2 22.1 20.8
2004 21.4 20.4 21.8 20.7 22.4 21.3 22.1 20.9
2005 21.5 20.4 21.7 20.7 22.4 21.3 22.1 20.9
2006 21.6 20.6 21.8 20.8 22.5 21.4 22.1 20.9
2007 21.6 20.7 21.9 21.0 22.6 21.5 22.3 21.0
2008 21.9 20.6 22.0 21.0 22.9 21.4 22.3 20.8
2009 21.9 20.6 21.9 21.0 22.9 21.4 22.4 20.9
2010 21.8 20.5 21.8 21.0 22.6 21.3 22.3 20.9
2011 21.7 20.6 21.9 21.1 22.6 21.3 22.4 20.9
2012 21.6 20.5 21.7 21.1 22.5 21.3 22.2 20.9
2013 21.5 20.2 21.6 20.9 22.5 21.1 22.2 20.7
Core Area Years Course CreditEnglish 4 or more English 9, 10, 11, 12 1 year each
Mathematics 3 or more Algebra I & II, Geometry 1 year eachTrigonometry & calculus (not precalculus), other math courses
beyond Algebra II, computer math/computer1/2 year each
Social Studies 3 or more American history, world history, American government 1 year eachEconomics, geography, psychology, other history 1/2 year each
Natural Science 3 or more General/physical/earch science, biology, chemistry, physics 1 year each
Student Performance 193

Figure 5-78
Percent of ACT Participants Taking Core High School Program 2001 to 2013
66.0 66.0 66.0 66.0 66.0 63.0 60.069.0
78.0 78.4 79.4 80.0 79.0
60.0 58.0 57.0 56.5 56.0 54.0 51.061.0
70.0 71.3 74.1 75.6 74.0
0102030405060708090
100
2001 2002 2003 2004 2005 2006 2007 2008 2009 2010 2011 2012 2013
Per
cent
Graduating Class
Iowa Nation
Source: ACT, Inc., The Condition of College and Career Readiness.Note: ACT classifies high school consisting of four years of English and three or more years of mathematics, natural science,
and social studies as “core” programs.
The Annual Condition of Education Report 2013194
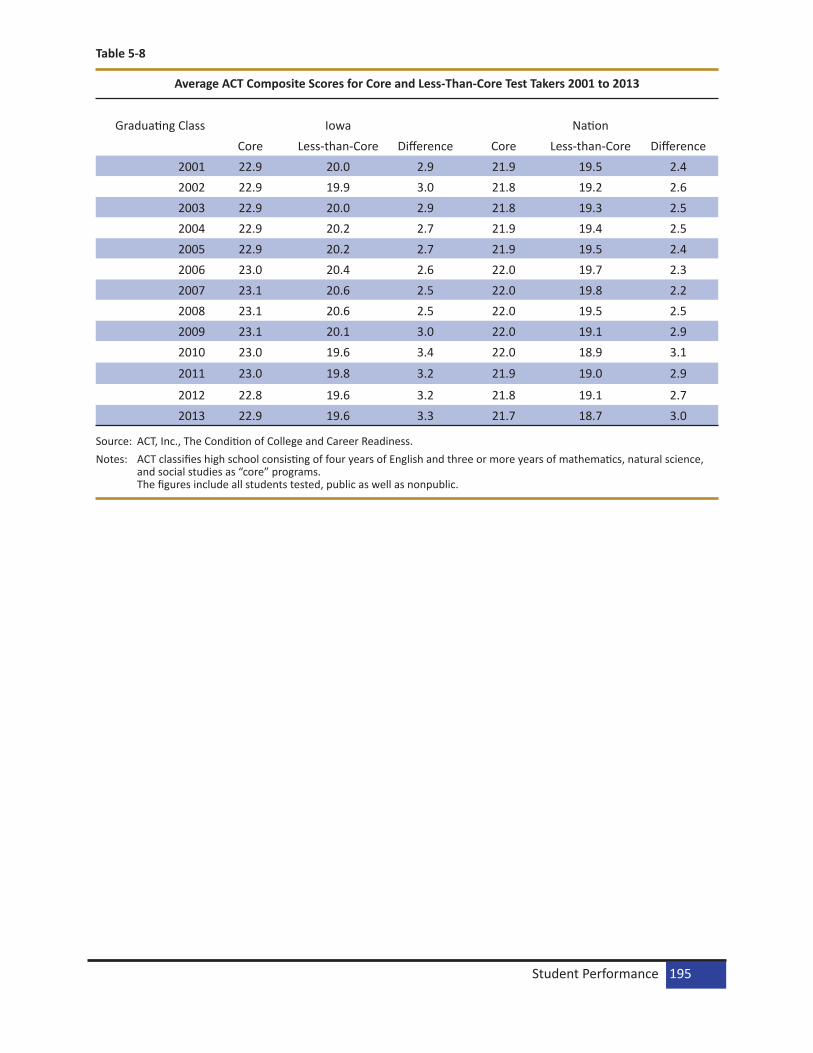
Table 5-8
Average ACT Composite Scores for Core and Less-Than-Core Test Takers 2001 to 2013
Source: ACT, Inc., The Condition of College and Career Readiness.Notes: ACT classifies high school consisting of four years of English and three or more years of mathematics, natural science,
and social studies as “core” programs. The figures include all students tested, public as well as nonpublic.
Graduating Class Iowa NationCore Less-than-Core Difference Core Less-than-Core Difference
2001 22.9 20.0 2.9 21.9 19.5 2.42002 22.9 19.9 3.0 21.8 19.2 2.62003 22.9 20.0 2.9 21.8 19.3 2.52004 22.9 20.2 2.7 21.9 19.4 2.52005 22.9 20.2 2.7 21.9 19.5 2.42006 23.0 20.4 2.6 22.0 19.7 2.32007 23.1 20.6 2.5 22.0 19.8 2.22008 23.1 20.6 2.5 22.0 19.5 2.52009 23.1 20.1 3.0 22.0 19.1 2.92010 23.0 19.6 3.4 22.0 18.9 3.1
2011 23.0 19.8 3.2 21.9 19.0 2.9
2012 22.8 19.6 3.2 21.8 19.1 2.72013 22.9 19.6 3.3 21.7 18.7 3.0
Student Performance 195

ACT Composite Score DistributionsTable 5-9 provides the Iowa ACT composite score distributions for 2010, 2012, and 2013 (also see Figure 5-79). About 70 percent of Iowa test takers had a composite score of 20 or greater, with approximately 54 percent scoring 22 or higher in all three years.
Table 5-9
Iowa ACT Composite Score Distributions Classes of 2011 to 2013
Source: ACT, Inc., The Condition of College and Career Readiness.
Class of 2011 Class of 2012 Class of 2013Percent Percent At Percent Percent At Percent Percent At
Score At or Below At or Below At or Below<14 2.2% 2.2% 2.4% 2.4% 3.0% 3.0%
14 1.9 4.1 2.0 4.4 2.0 5.015 2.7 6.8 2.8 7.2 2.8 7.816 3.5 10.4 3.9 11.1 3.9 11.817 5.0 15.3 4.9 16.0 4.9 16.718 6.1 21.5 6.5 22.5 6.4 23.119 7.1 28.5 7.2 29.7 7.3 30.320 8.3 36.8 8.1 37.8 8.0 38.321 8.5 45.3 8.5 46.3 8.2 46.622 8.6 53.9 8.3 54.6 8.5 55.123 8.2 62.0 8.1 62.7 8.2 63.324 7.0 69.1 7.5 70.2 7.1 70.425 6.6 75.7 6.5 76.7 6.3 76.726 5.6 81.2 5.1 81.8 5.2 82.027 4.6 85.8 4.6 86.4 4.4 86.328 4.0 89.8 3.8 90.2 3.6 89.929 2.8 92.6 2.8 93.0 2.8 92.830 2.6 95.2 2.5 95.5 2.4 95.231 1.8 97.0 1.8 97.3 1.8 97.032 1.3 98.4 1.2 98.5 1.3 98.333 0.8 99.2 0.8 99.2 0.9 99.2
34+ 0.8 100.0 0.8 100.0 0.8 100.0
The Annual Condition of Education Report 2013196
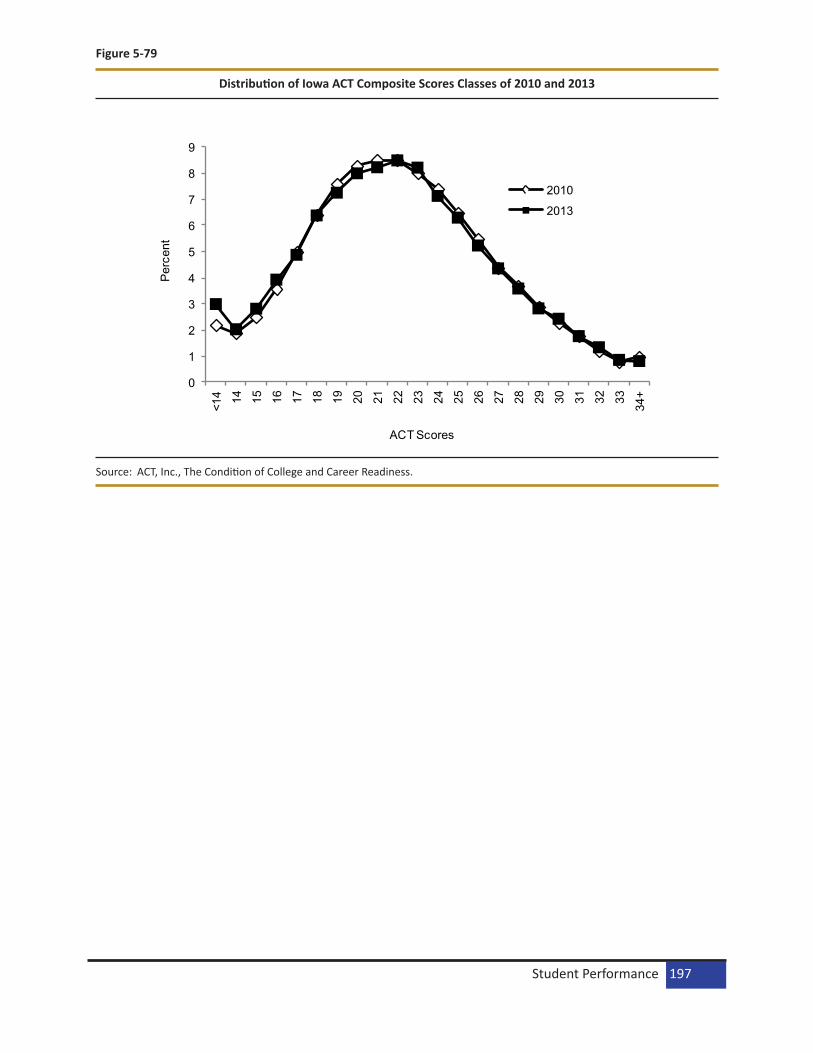
Figure 5-79
Distribution of Iowa ACT Composite Scores Classes of 2010 and 2013
0
1
2
3
4
5
6
7
8
9
<14 14 15 16 17 18 19 20 21 22 23 24 25 26 27 28 29 30 31 32 33 34+
Per
cent
ACT Scores
2010
2013
Source: ACT, Inc., The Condition of College and Career Readiness.
Student Performance 197

ACT Scores by Enrollment CategoryAverage ACT scores by enrollment category for the graduating classes of 2011 to 2013 are provided in Table 5-10, Table 5-11 and Figure 5-80.
Table 5-10
Iowa Public School Average ACT Scores by Enrollment Category Graduating Classes 2011 to 2013
Source: ACT, Inc., The Condition of College and Career Readiness; Iowa Department of Education, Certified Enrollment files.Note: State figures include all students tested, public as well as nonpublic, while figures in each enrollment category only
include public school students tested.
Graduating Class Enrollment Category English Mathematics Reading Science Composite2011 <300 20.8 20.5 21.5 21.8 21.3
300-599 21.2 21.4 22.0 22.0 21.8600-999 21.2 21.4 22.2 22.2 21.9
1,000-2,499 21.9 22.1 22.8 22.8 22.52,500-7,499 22.6 22.6 23.4 23.1 23.1
7,500+ 20.8 21.4 22.0 21.8 21.6State 21.7 21.9 22.6 22.4 22.3
2012 <300 20.8 20.3 21.8 21.5 21.2300-599 20.9 20.9 21.9 21.6 21.4600-999 21.1 21.2 22.0 21.9 21.7
1,000-2,499 21.9 22.0 22.8 22.5 22.42,500-7,499 22.5 22.5 23.4 23.0 23.0
7,500+ 20.7 21.2 21.9 21.7 21.5State 21.6 21.7 22.5 22.2 22.1
2013 <300 20.6 20.4 22.0 21.4 21.2300-599 21.1 20.9 22.1 21.8 21.6600-999 20.9 20.8 21.9 21.7 21.5
1,000-2,499 22.0 21.9 22.8 22.5 22.42,500-7,499 22.2 22.5 23.1 23.0 22.8
7,500+ 20.5 21.2 21.8 21.5 21.4State 21.5 21.6 22.5 22.2 22.1
The Annual Condition of Education Report 2013198

Table 5-11
Average ACT Composite Scores for Iowa Public School Graduating Classes 2011 to 2013 by Enrollment Category and Course of Study
Source: ACT, Inc., The Condition of College and Career Readiness; Iowa Department of Education, Certified Enrollment files.Notes: State figures include all students tested, public as well as nonpublic, while figures in each enrollment category only
include public school students tested. ACT classifies high school programs consisting of four years of English and three or more years each of mathematics, natural science, and social studies as “core programs.”
Course of Study - Core Course of Study - Less Than CoreEnrollment Category 2011 2012 2013 2011 2012 2013
<300 21.9 22.0 22.0 19.8 19.3 18.9300-599 22.4 22.1 22.2 19.5 19.4 19.6600-999 22.5 22.3 22.1 19.6 19.3 19.3
1,000-2,499 23.1 22.9 22.9 20.2 20.3 20.32,500-7,499 23.5 23.4 23.3 20.9 21.0 20.3
7,500+ 22.8 22.6 22.7 18.8 18.4 18.5State 23.0 22.8 22.9 19.8 19.6 19.6
Student Performance 199

Figure 5-80
Graduating Class of 2013 Average ACT Composite Scores for Iowa Public School Students by Enrollment Category and Course of Study
22.0
22.2
22.1 22.9
23.3
22.7
22.9
18.9
19.6
19.3 20
.3
20.3
18.5 19
.6
1
6
11
16
21
26
31
36
<300 300-599 600-999 1,000-2,499 2,500-7,499 7,500+ State
ACT
Scor
e
Enrollment Category
Core Less Than Core
Source: ACT, Inc., The Condition of College and Career Readiness; Iowa Department of Education, Certified Enrollment files.Notes: State figures include all students tested, public as well as nonpublic, while figures in each enrollment category only
include public school students tested. ACT classifies high school programs consisting of four years of English and three or more years each of mathematics, natural science, and social studies as “core programs.”
The Annual Condition of Education Report 2013200

ACT Scores by GenderFigure 5-81 shows the average composite scores by gender for Iowa and the Nation students.
Table 5-12 shows the average scores by subject as well as gender for Iowa students. Females reported higher average scores in English and reading and lower in mathematics, science, and ACT composite in 2013.
Figure 5-81
ACT Average Composite Scores by Gender 2001 to 2013
22.1 22.1 22.2 22.2 22.3 22.3 22.422.6 22.7
22.5 22.5 22.4 22.3
21.8 21.921.8
21.9 21.922.1 22.1
22.2 22.122.0
22.1
21.9 21.9
21.120.9
21.0 21.0 21.121.2 21.2 21.2 21.3
21.2 21.2 21.220.9
20.920.7 20.8 20.9 20.9
21.1 21.0 21.0 20.9 20.9 21.0 21.0 20.9
19
20
21
22
23
2001 2002 2003 2004 2005 2006 2007 2008 2009 2010 2011 2012 2013
ACT
Scor
e
Graduating Class
Iowa MaleIowa FemaleU.S. MaleU.S. Female
Source: ACT, Inc., The Condition of College and Career Readiness.
.
Table 5-12
Iowa Average ACT Scores by Gender 2012 and 2013
Source: ACT, Inc., The Condition of College and Career Readiness.Note: *ACT test-takers not reporting gender.
Number of Average ACT ScoresTest-takers English Mathematics Reading Science Composite
Gender 2012 2013 2012 2013 2012 2013 2012 2013 2012 2013 2012 2013Male 10,684 10,406 21.3 21.1 22.5 22.3 22.5 22.4 22.9 22.8 22.4 22.3
Female 12,380 12,091 22.0 21.9 21.1 21.0 22.5 22.7 21.7 21.7 21.9 21.9Unreported* 55 29
Student Performance 201

ACT Composite Scores by Student Planned Educational MajorsThe most popular planned educational majors by students taking the ACT in 2013 were Health Science/Allied Health Fields (Table 5-13). The highest average composite ACT scores in Iowa were reported by students who plan to major in English and Foreign Languages (24.7) and Engineering (24.8). The Iowa ACT test takers that indicated a planned major in education or teacher education had average ACT composite score above 21.
Table 5-13
ACT Average Composite Scores by Student Planned Educational Majors Class of 2013
Source: ACT, Inc., The Condition of College and Career Readiness.
Planned Major Nation Avg. Iowa Avg. Iowa Percent Planned
Agriculture & Nation Resources Conservation 19.6 20.6 4%Architecture 20.8 22.2 1
Area, Ethinic, & Multidisciplinary Studies 21.8 21.7 0Arts: Visual & Performing 20.1 22.0 5
Business 20.9 21.6 9Communications 21.4 22.2 2
Community, Family, & Personal Services 17.8 19.5 2Computer Science & Mathematics 22.6 23.6 2
Education/Teacher Education 20.4 21.3 8Engineering 23.5 24.8 7
Engineering Technology & Drafting 19.4 21.2 1English & Foreign Language 23.8 24.7 1
Health Administration & Assisting 17.9 19.7 2Health Sciences & Technologies/Allied Health
Fields20.9 22.3 18
Philosophy, Religion, & Theology 21.6 22.5 0Repair, Production, & Construction 17.1 18.7 1
Sciences: Biological & Physical 23.7 24.2 6Social Sciences & Law 21.3 22.6 7
Undecided 21.6 22.6 19No Response 17.0 15.8 3
The Annual Condition of Education Report 2013202

SATThe SAT is one of the national college entrance examinations developed by the College Board. Scores for the mathematics, critical reading, and writing test range from 200 to 800. The SAT was first administered in 1926 to 8,040 candidates nationwide. In 2012, the number of SAT takers in the Nation was over 1.6 million. In 2013, the number of Iowa SAT I takers was about 1,132 (approximately 3 percent) of the high school graduates. Iowa’s averages continue to be around 100 standard score points higher than the Nation’s in both Critical Reading and Mathematics (Table 5-14).
Table 5-15 shows a comparison between Iowa and other Midwest states on the average SAT scores.
Figures 5-83 and 5-84 show the trends for Iowa SAT takers by gender. Iowa’s males out-scored females all years shown in mathematics.
Figures 5-85 and 5-86 show the trends of average SAT Writing scores for Iowa and the nation. Iowa’s average score in writing was about 90 standard score points higher than the national average.
Table 5-14
Trends of Average SAT Scores for Iowa and the Nation 2001 to 2013
Source: The College Board, Profile of SAT Program Test Takers.Note: The Iowa participation rate in SAT for the class of 2013 was 3 percent. Historically, Iowa scores are based on 3 to 5
percent of the graduating class.
Graduating Class SAT Critical Reading SAT MathematicsIowa Nation Iowa Nation
2001 593 506 603 5142002 591 504 602 5162003 586 507 597 5192004 593 508 602 5182005 596 508 608 5202006 602 503 613 5182007 608 502 613 5152008 603 502 612 5152009 610 501 615 5152010 603 501 613 5162011 596 497 606 5142012 603 496 606 5142013 592 496 601 514
Student Performance 203
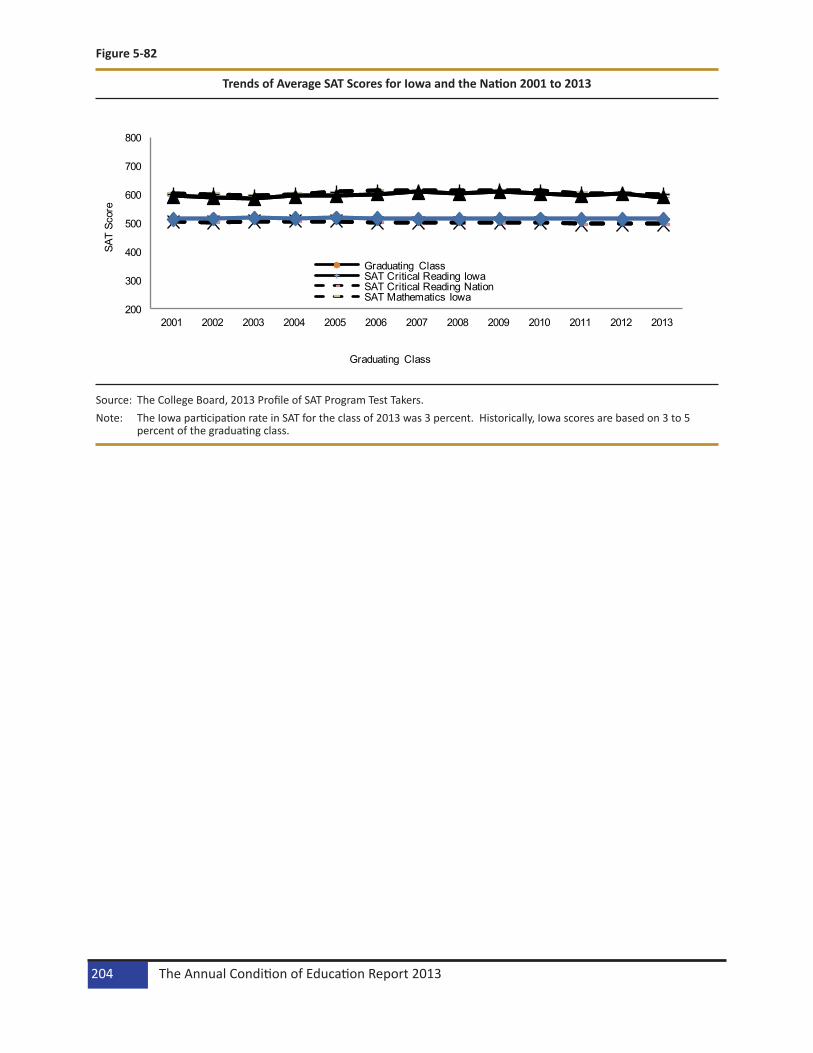
Figure 5-82
Trends of Average SAT Scores for Iowa and the Nation 2001 to 2013
200
300
400
500
600
700
800
2001 2002 2003 2004 2005 2006 2007 2008 2009 2010 2011 2012 2013
SAT
Scor
e
Graduating ClassSAT Critical Reading IowaSAT Critical Reading NationSAT Mathematics Iowa
Graduating Class
Source: The College Board, 2013 Profile of SAT Program Test Takers.Note: The Iowa participation rate in SAT for the class of 2013 was 3 percent. Historically, Iowa scores are based on 3 to 5
percent of the graduating class.
The Annual Condition of Education Report 2013204
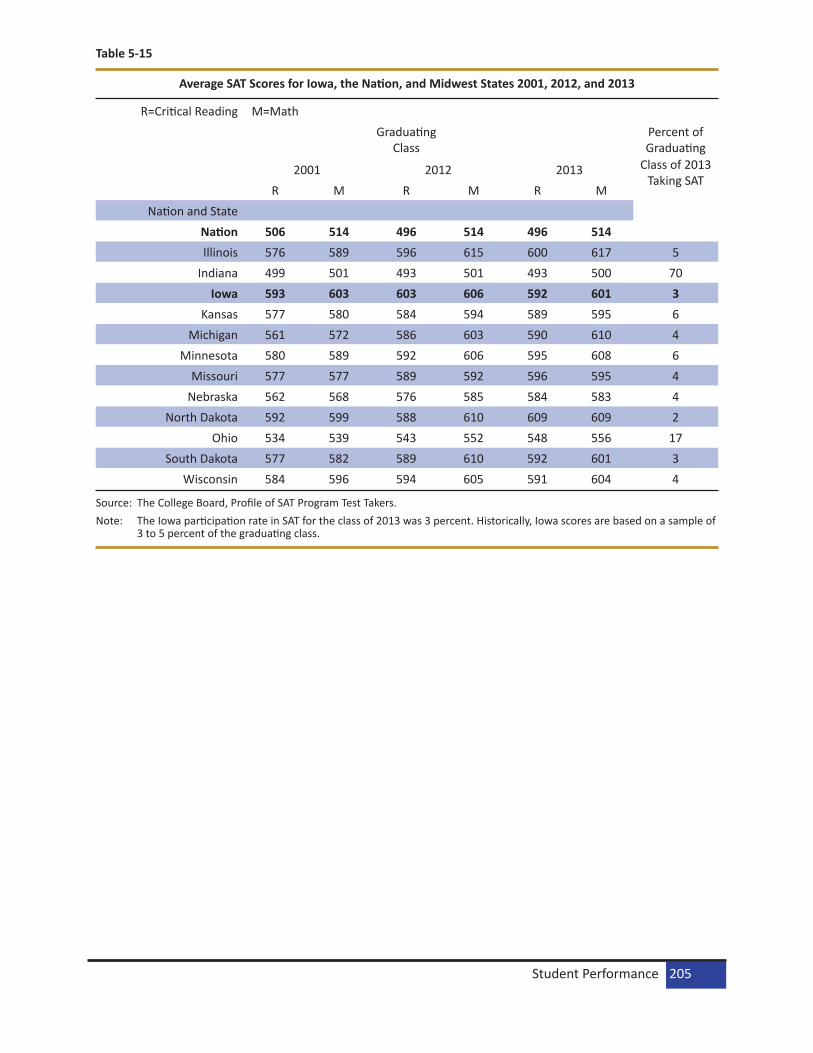
Table 5-15
Average SAT Scores for Iowa, the Nation, and Midwest States 2001, 2012, and 2013
Source: The College Board, Profile of SAT Program Test Takers.Note: The Iowa participation rate in SAT for the class of 2013 was 3 percent. Historically, Iowa scores are based on a sample of
3 to 5 percent of the graduating class.
R=Critical Reading M=MathGraduating
ClassPercent of Graduating
2001 2012 2013 Class of 2013 Taking SAT
R M R M R MNation and State
Nation 506 514 496 514 496 514Illinois 576 589 596 615 600 617 5
Indiana 499 501 493 501 493 500 70Iowa 593 603 603 606 592 601 3
Kansas 577 580 584 594 589 595 6Michigan 561 572 586 603 590 610 4
Minnesota 580 589 592 606 595 608 6Missouri 577 577 589 592 596 595 4
Nebraska 562 568 576 585 584 583 4North Dakota 592 599 588 610 609 609 2
Ohio 534 539 543 552 548 556 17South Dakota 577 582 589 610 592 601 3
Wisconsin 584 596 594 605 591 604 4
Student Performance 205

Figure 5-83
Iowa Average SAT Critical Reading Scores by Gender 2001 to 2013
593
591
586
593
596
602
608
603
610
603
596
603
592
593
594
588
596
602 611
610
605
608
607
602 611
602
593
589
584
590
591
595 607
601 611
599
591
595
583
200
400
600
80020
0120
0220
0320
0420
0520
0620
0720
0820
0920
1020
1120
1220
13
2001
2002
2003
2004
2005
2006
2007
2008
2009
2010
2011
2012
2013
2001
2002
2003
2004
2005
2006
2007
2008
2009
2010
2011
2012
2013
SAT
Scor
e
Year
Total Male Female
Source: The College Board, Profile of SAT Program Test Takers.Note: The Iowa participation rate in SAT for the class of 2013 was 3 percent. Historically, Iowa scores are based on 3 to 5
percent of the graduating class.
The Annual Condition of Education Report 2013206

Figure 5-84
Iowa Average SAT Mathematics Scores by Gender 2001 to 2013
603 60
259
760
260
861
361
361
261
561
360
660
660
1 621
621
615
620 632
639
636
635
632
637
627
631
621
586
586
580
583
584
589
593
593
600
592
586
585
581
200
400
600
800
2001
2002
2003
2004
2005
2006
2007
2008
2009
2010
2011
2012
2013
2001
2002
2003
2004
2005
2006
2007
2008
2009
2010
2011
2012
2013
2001
2002
2003
2004
2005
2006
2007
2008
2009
2010
2011
2012
2013
SAT
Scor
e
Year
Total Male Female
Source: The College Board, Profile of SAT Program Test Takers.Note: The Iowa participation rate in SAT for the class of 2013 was 3 percent. Historically, Iowa scores are based on 3 to 5
percent of the graduating class.
Student Performance 207
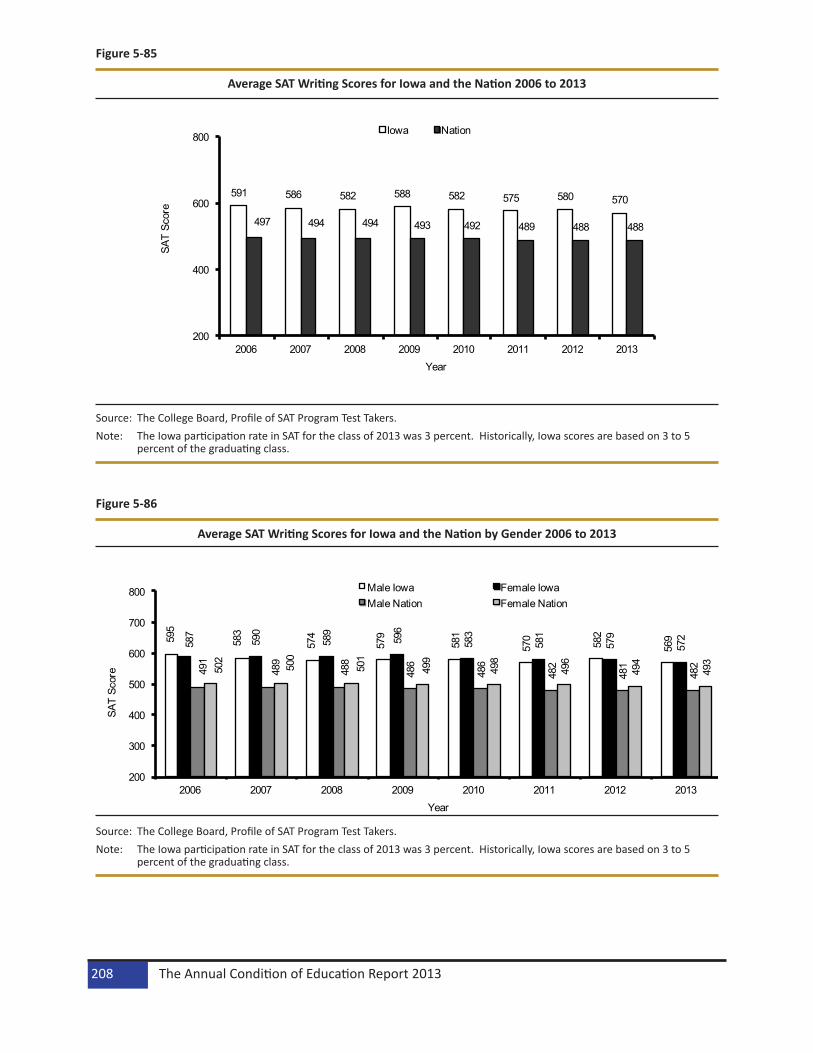
Figure 5-85
Average SAT Writing Scores for Iowa and the Nation 2006 to 2013
591 586 582 588 582 575 580 570
497 494 494 493 492 489 488 488
200
400
600
800
2006 2007 2008 2009 2010 2011 2012 2013
SAT
Scor
e
Year
Iowa Nation
Source: The College Board, Profile of SAT Program Test Takers.Note: The Iowa participation rate in SAT for the class of 2013 was 3 percent. Historically, Iowa scores are based on 3 to 5
percent of the graduating class.
Figure 5-86
Average SAT Writing Scores for Iowa and the Nation by Gender 2006 to 2013
595
583
574
579
581
570 582
569587
590
589
596
583
581
579
572
491
489
488
486
486
482
481
482502
500
501
499
498
496
494
493
200
300
400
500
600
700
800
2006 2007 2008 2009 2010 2011 2012 2013
SAT
Scor
e
Year
Male Iowa Female IowaMale Nation Female Nation
Source: The College Board, Profile of SAT Program Test Takers.Note: The Iowa participation rate in SAT for the class of 2013 was 3 percent. Historically, Iowa scores are based on 3 to 5
percent of the graduating class.
The Annual Condition of Education Report 2013208

Advanced Placement (AP) The College Board sponsors the Advanced Placement (AP) Program in Iowa, which offered more than 35 courses in over 30 subject areas in 2012-2013. AP provides secondary school students the opportunity to take college-level courses in a high school setting. Courses are taught by highly qualified high school teachers who use the AP Course Descriptions to guide them.
In Iowa, over 17,600 AP exams were taken by more than 11,000 students in 2013 (Figure 5-87). English Language and Composition, English Literature and Comprehension, U.S. History and Government, Biology and Chemistry, Calculus, and Psychology in aggregate, accounted for more than 70 percent of the exams taken in 2013. The number of students/candidates in 2013 was 6.1 percent higher than the number in 2012. The number of exams taken increased 7.4 percent over that one-year period. Both of the enrollment and exams have almost tripled since 2001.
From 2001 to 2013, the percentage of Iowa’s students receiving a score of three or better has consistently been higher than the national percentage (Figure 5-88).
Nationally, and in Iowa, greater percentages of males are reported as receiving a score of three or higher than females. The achievement gap between Iowa males and females is displayed in Figure 5-89.
Table 5-16 shows most recent year nationwide AP test results by state.
.
Figure 5-87
Advanced Placement Participation for Iowa Students 2001 to 2013
4,069 4,499 5,141 5,425 6,047 6,507 7,127 7,798 8,298 8,979 9,60910,443 11,0845,995 6,565
7,721 8,192 8,9869,833
10,77611,786 12,512
14,02814,896
16,41317,628
02,0004,0006,0008,000
10,00012,00014,00016,00018,00020,000
2001 2002 2003 2004 2005 2006 2007 2008 2009 2010 2011 2012 2013
Num
ber o
f Stu
dent
s
Year
Test Takers Exams
Source: The College Board, Advanced Placement Program, Iowa National Summary Reports.
Student Performance 209
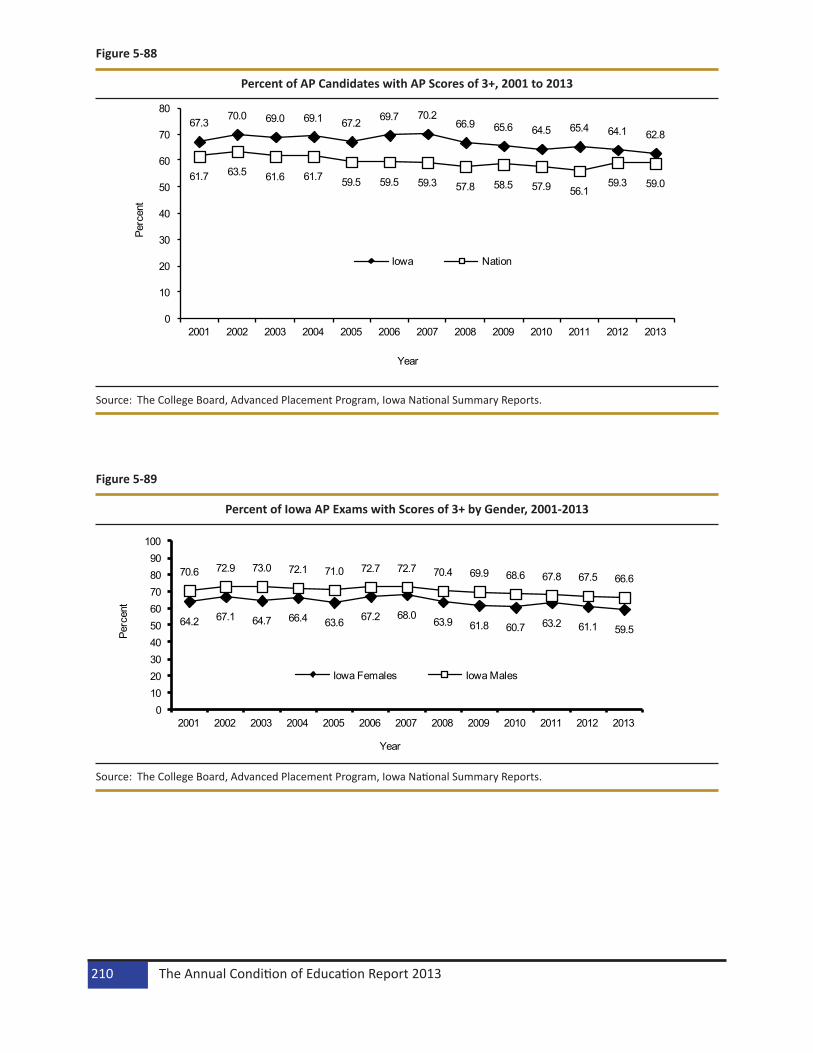
Figure 5-88
Percent of AP Candidates with AP Scores of 3+, 2001 to 2013
67.370.0 69.0 69.1 67.2 69.7 70.2
66.9 65.6 64.5 65.4 64.1 62.8
61.7 63.5 61.6 61.7 59.5 59.5 59.3 57.8 58.5 57.9 56.159.3 59.0
0
10
20
30
40
50
60
70
80
2001 2002 2003 2004 2005 2006 2007 2008 2009 2010 2011 2012 2013
Perc
ent
Year
Iowa Nation
Source: The College Board, Advanced Placement Program, Iowa National Summary Reports.
Figure 5-89
Percent of Iowa AP Exams with Scores of 3+ by Gender, 2001-2013
64.2 67.1 64.7 66.4 63.6 67.2 68.0 63.9 61.8 60.7 63.2 61.1 59.5
70.6 72.9 73.0 72.1 71.0 72.7 72.7 70.4 69.9 68.6 67.8 67.5 66.6
0102030405060708090
100
2001 2002 2003 2004 2005 2006 2007 2008 2009 2010 2011 2012 2013
Perc
ent
Year
Iowa Females Iowa Males
Source: The College Board, Advanced Placement Program, Iowa National Summary Reports.
The Annual Condition of Education Report 2013210

Table 5-16
Number of Graduates Who Took Advanced Placement Exams and Percent of Them Scored 3+ on an AP Exam During High School by State, Graduating Class 2011 and 2012
State 2011 Number of Students Taken
2011 Percent Scored 3+
2012 Number of Students Taken
2012 Percent Scored 3+
Alabama 8,584 45.1% 9,852 43.2%Alaska 1,599 62.9% 1,621 65.5%
Arizona 13,297 57.7% 14,407 57.7%Arkansas 11,326 33.8% 12,175 34.7%
California 136,787 66.1% 144,801 66.1%Colorado 17,303 61.8% 18,358 62.3%
Connecticut 12,906 71.8% 13,332 72.6%Delaware 2,191 53.5% 2,417 52.0%
District of Columbia 1,471 22.0% 1,512 25.7%Florida 72,767 50.4% 76,128 51.6%
Georgia 31,764 51.9% 33,647 52.8%Hawaii 2,338 45.3% 2,905 41.3%Idaho 3,016 68.9% 3,150 67.1%
Illinois 37,723 64.8% 40,653 65.1%Indiana 20,047 43.8% 21,260 45.3%
Iowa 5,345 63.5% 5,542 62.8%Kansas 4,853 60.6% 5,167 60.3%
Kentucky 10,872 49.6% 12,218 49.7%Louisiana 3,528 41.8% 3,931 38.9%
Maine 4,400 62.6% 4,576 64.1%Maryland 25,934 60.1% 26,640 61.3%
Massachusetts 21,605 70.0% 22,808 71.3%Michigan 25,709 64.7% 26,822 64.4%
Minnesota 16,181 64.8% 16,780 66.0%Mississippi 3,605 31.4% 3,615 31.7%
Missouri 8,560 57.9% 9,235 60.1%Montana 1,823 65.6% 1,913 63.0%Nebraska 2,665 60.2% 2,886 59.7%
Nevada 6,217 55.5% 6,890 52.4%New Hampshire 3,206 76.5% 3,238 75.0%
New Jersey 26,546 73.4% 27,433 73.9%New Mexico 4,274 45.7% 4,815 43.8%
New York 63,032 65.7% 64,946 65.6%
Student Performance 211

Table 5-16 (…continued)
Source: The College Board, Applied Educational Research Inc. of Princeton, NJ.Note: This is the number of exams taken by the current year’s 11th and 12th grade AP students (number of exams not shown)
divided by the state’s “11th and 12th Grade Enrollment” x 1000.
State 2011 Number of Students Taken
2011 Percent Scored 3+
2012 Number of Students Taken
2012 Percent Scored 3+
North Carolina 25,709 60.5% 26,633 62.2%North Dakota 888 62.5% 882 62.7%
Ohio 24,585 62.9% 25,170 64.4%Oklahoma 7,806 49.9% 8,140 49.4%
Oregon 7,706 61.2% 8,059 62.4%Pennsylvania 27,357 64.4% 28,750 64.9%Rhode Island 1,907 61.2% 2,176 59.8%
South Carolina 10,149 57.7% 10,564 59.0%South Dakota 1,509 64.5% 1,545 65.0%
Tennessee 10,067 52.4% 10,743 53.9%Texas 90,673 50.8% 96,166 51.0%Utah 9,761 70.2% 10,439 69.9%
Vermont 2,061 66.0% 2,151 66.2%Virginia 32,212 63.8% 33,626 64.0%
Washington 19,305 61.5% 20,581 60.9%West Virginia 3,453 42.9% 3,722 43.8%
Wisconsin 17,280 69.8% 18,076 69.7%Wyoming 892 56.2% 974 53.7%
United States 904,794 59.8% 954,070 60.1%
The Annual Condition of Education Report 2013212

Pursuit of Postsecondary Education/TrainingInformation on Iowa public high school graduates intending to pursue postsecondary education or training is presented in this section. Graduate intention data have been collected through Student Reporting in Iowa (SRI, formerly EASIER).
The percent of graduates intending to pursue postsecondary education or training decreased in the last three years (Figure 5-90). The 2,500-7,499 and 7,500+ enrollment categories were the only enroll-ment categories where the percent of graduates intending to pursue postsecondary education/training increased between 2012 and 2013 (Table 5-17). As seen in Table 5-18, the percent of female graduates intending to pursue postsecondary education/training was higher than the percent of male graduates intending to pursue postsecondary education/training in all years presented. In all years presented, the largest percent of graduates intended to pursue postsecondary education at a community college (Table 5-19). Table 5-20 shows that the percent of graduates intending to pursue postsecondary education at a four-year college was higher than the percent of graduates intending to pursue postsecondary education at a two-year college in 2013. Figure 5-91 gives details for the graduate intention trends.
Figure 5-90
Percent of All Iowa Public School Graduates Intending to Pursue Postsecondary Education/Training Graduating Classes 2001 to 2013
0102030405060708090
100
2001 2002 2003 2004 2005 2006 2007 2008 2009 2010 2011 2012 2013
Perc
ent
Graduating Class
Source: Iowa Department of Education, Bureau of Information and Analysis, SRI, Graduate Intentions files.Note: Figures for 2006 to 2012 include graduates receiving a diploma. Students who were listed as Other Completers (e.g.,
received a Certificate of Attendance) are not included in these figures.
Student Performance 213

Table 5-17
Percent of Iowa Public High School Graduates Intending to Pursue Postsecondary Education/Training by Enrollment Category Graduating Classes of 2001 and 2010 to 2013
Source: Iowa Department of Education, Bureau of Information and Analysis, SRI, Graduate Intentions files.Note: Data for the 2010 to 2013 graduating classes includes students who received a regular diploma or a modified diploma.
Other completers, such as students who received a certified attendance, are not included.
Table 5-18
Percent of Iowa Public High School Graduates Intending to Pursue Postsecondary Education/Training by Gender, 2001 and 2010 to 2013
Source: Iowa Department of Education, Bureau of Information and Analysis, SRI, Graduate Intentions files.Note: Data for the 2010 to 2013 graduating classes includes students who received a regular diploma or a modified diploma.
Other completers, such as students who received a certified attendance, are not included.
Graduating ClassEnrollment Category 2001 2010 2011 2012 2013
<300 77.6 86.6 86.0 81.3 79.6300-599 81.2 85.8 84.0 84.0 83.0600-999 82.5 84.1 83.6 83.9 82.9
1,000-2,499 83.1 82.7 80.7 81.0 80.32,500-7,499 81.9 82.1 80.7 80.9 81.7
7,500+ 84.3 77.8 76.3 77.0 77.7State 82.7 82.1 80.5 80.7 80.5
Graduating ClassGender 2001 2010 2011 2012 2013
Male 77.8 77.5 75.3 75.0 74.5Female 87.5 86.5 85.6 86.4 86.7
Total 82.7 82.1 80.5 80.7 80.5
The Annual Condition of Education Report 2013214

Table 5-19
Percent of Iowa Public High School Graduates Intending to Pursue Postsecondary Education/Training by Postsecondary Institution, 2001 and 2010 to 2013
Source: Iowa Department of Education, Bureau of Information and Analysis, SRI, Graduate Intentions files.Notes: Data for the 2010 to 2013 graduating classes includes students who received a regular diploma or a modified diploma.
Other completers, such as students who received a certified attendance, are not included. Data may not sum to total due to rounding.
Table 5-20
Percent of Iowa Public High School Graduates Intending to Pursue Postsecondary Education/Training at Four-Year and Two-Year Colleges, 2001 and 2010 to 2013
Source: Iowa Department of Education, Bureau of Information and Analysis, SRI Graduate Intentions files.Note: Data for the 2010 to 2013 graduating classes includes students who received a regular diploma or a modified diploma.
Other completers, such as students who received a certified attendance, are not included.
Graduating ClassPostsecondary Institution 2001 2010 2011 2012 2013
Private 4-Year College 14.9 13.2 13.5 13.3 12.9Public 4-Year College 27.3 24.3 25.0 25.5 26.7
Private 2-Year College 5.2 1.1 1.0 0.9 0.9Community College 31.0 40.2 38.3 38.4 37.7
Other Training 4.3 3.2 2.6 2.6 2.4Total 82.7 82.1 80.5 80.7 80.5
Graduating ClassPostsecondary Institution 2001 2010 2011 2012 2013
Four-Year College 42.2 37.5 38.4 38.7 39.6Two-Year College 36.2 41.3 39.3 39.3 38.6
Student Performance 215
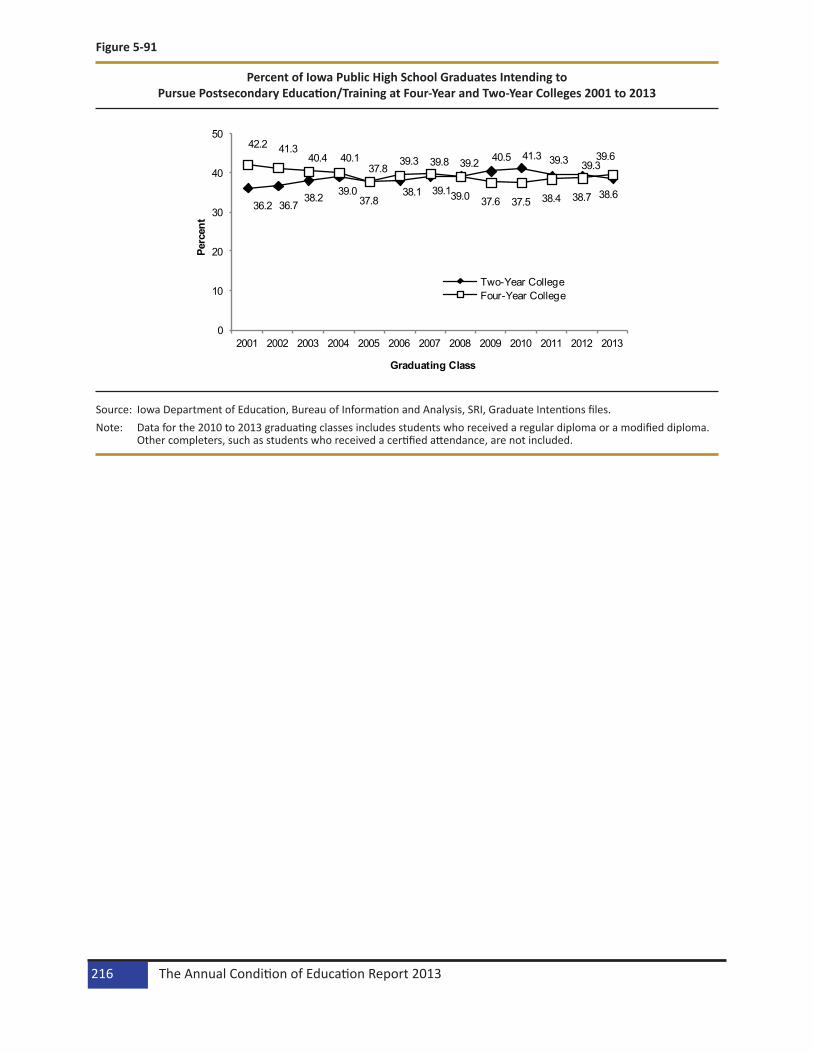
Figure 5-91
Percent of Iowa Public High School Graduates Intending to Pursue Postsecondary Education/Training at Four-Year and Two-Year Colleges 2001 to 2013
36.2 36.738.2 39.0
37.8
38.1 39.1
39.2 40.5 41.3 39.3 39.3
38.6
42.2 41.340.4 40.1
37.8
39.3 39.8
39.0 37.6 37.5 38.4 38.7
39.6
0
10
20
30
40
50
2001 2002 2003 2004 2005 2006 2007 2008 2009 2010 2011 2012 2013
Perc
ent
Graduating Class
Two-Year CollegeFour-Year College
Source: Iowa Department of Education, Bureau of Information and Analysis, SRI, Graduate Intentions files.Note: Data for the 2010 to 2013 graduating classes includes students who received a regular diploma or a modified diploma.
Other completers, such as students who received a certified attendance, are not included.
The Annual Condition of Education Report 2013216

DropoutsThe National Center for Education Statistics (NCES) definitions used for dropouts include students who satisfy one or more of the following conditions:
• Was enrolled in school at some time during the previous school year and was not enrolled as of Count Day of the current year or
• Was enrolled in school at some time during the previous school year and left the school before the previous summer and
• Has not graduated from high school or completed a state or district-approved educational program; and
• Does not meet any of the following exclusionary conditions:
a) transfer to another public school district, private school, or state or district-approved educational program, b) temporary school-recognized absence for suspension or illness, c) death, or d) move out of the state or leave the country.
A student who has left the regular program to attend an adult program designed to earn a General Educational Development (GED) or an adult high school diploma administered by a community college is considered a dropout. However, a student who enrolls in an alternative school or alternative program administered by a public school district is NOT considered a dropout.
The numerator of the grades 7-12 dropout rate (or grades 9-12 dropout rate) is the total number of drop-outs for grades 7-12 (or the total number of dropouts for grades 9-12) and the denominator is the total enrollment of grades 7-12 (or total enrollment of grades 9-12).
Figure 5-92 shows the two statewide public school trends, the lower line is for grades 7-12 and the upper line is for grades 9-12 dropout rates. There are upward dropout trends for both grades 7-12 and grades 9-12 since 2006-2007. Both rates decreased in 2010-2011 and 2011-2012 from the previous year.
The public school dropout distributions by grade and enrollment categories for 2011-2012 are available in Table 5-21. Grade 12 had the highest number and percent of dropouts. Districts with enrollments of 7,500 and above accounted for more than 45 percent of the total dropouts while comprised less than 28 percent of the total enrollment in grades 7 to 12.
Table 5-22 shows the dropout rates by gender. Males had a higher dropout rate than females in all years shown.
The public school grade 7-12 dropout and enrollment data by race/ethnicity are presented in Table 5-23 and Table 5-24.
Table 5-25 shows the distribution of the dropout rate by Iowa public school districts.
Student Performance 217
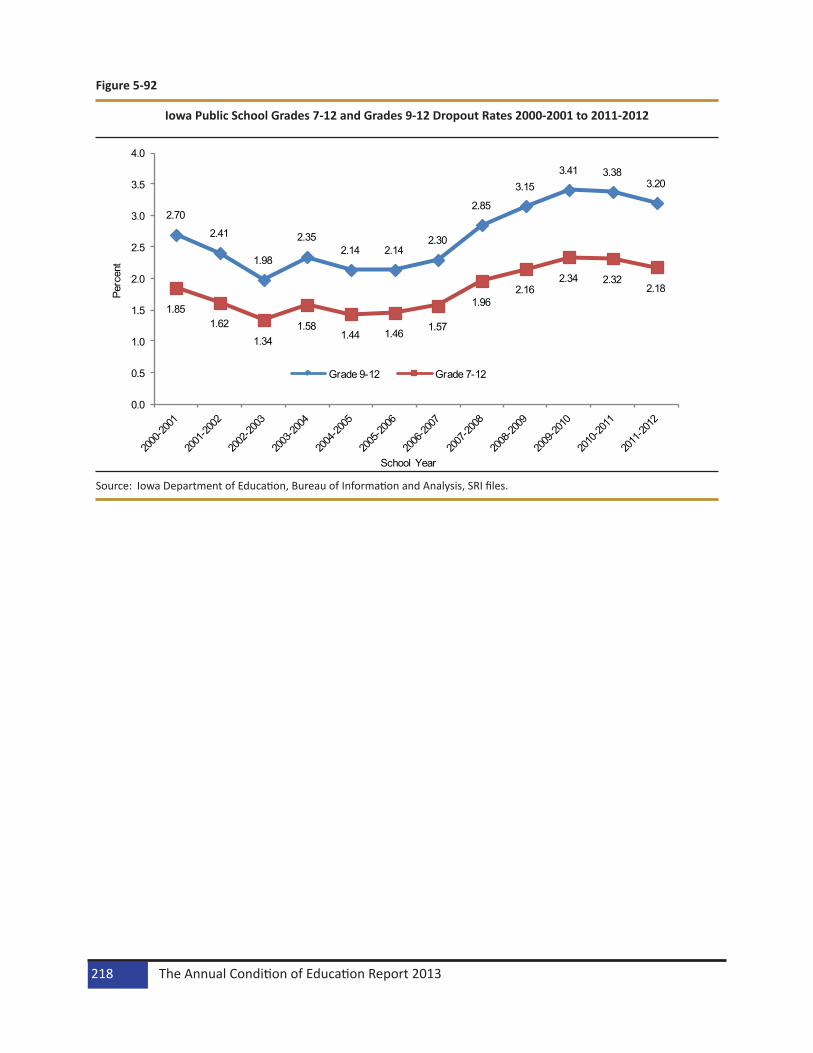
Figure 5-92
Iowa Public School Grades 7-12 and Grades 9-12 Dropout Rates 2000-2001 to 2011-2012
2.70
2.41
1.98
2.352.14 2.14
2.30
2.85
3.153.41 3.38
3.20
1.851.62
1.341.58
1.44 1.46 1.57
1.962.16
2.34 2.322.18
0.0
0.5
1.0
1.5
2.0
2.5
3.0
3.5
4.0
Perc
ent
School Year
Grade 9-12 Grade 7-12
Source: Iowa Department of Education, Bureau of Information and Analysis, SRI files.
The Annual Condition of Education Report 2013218
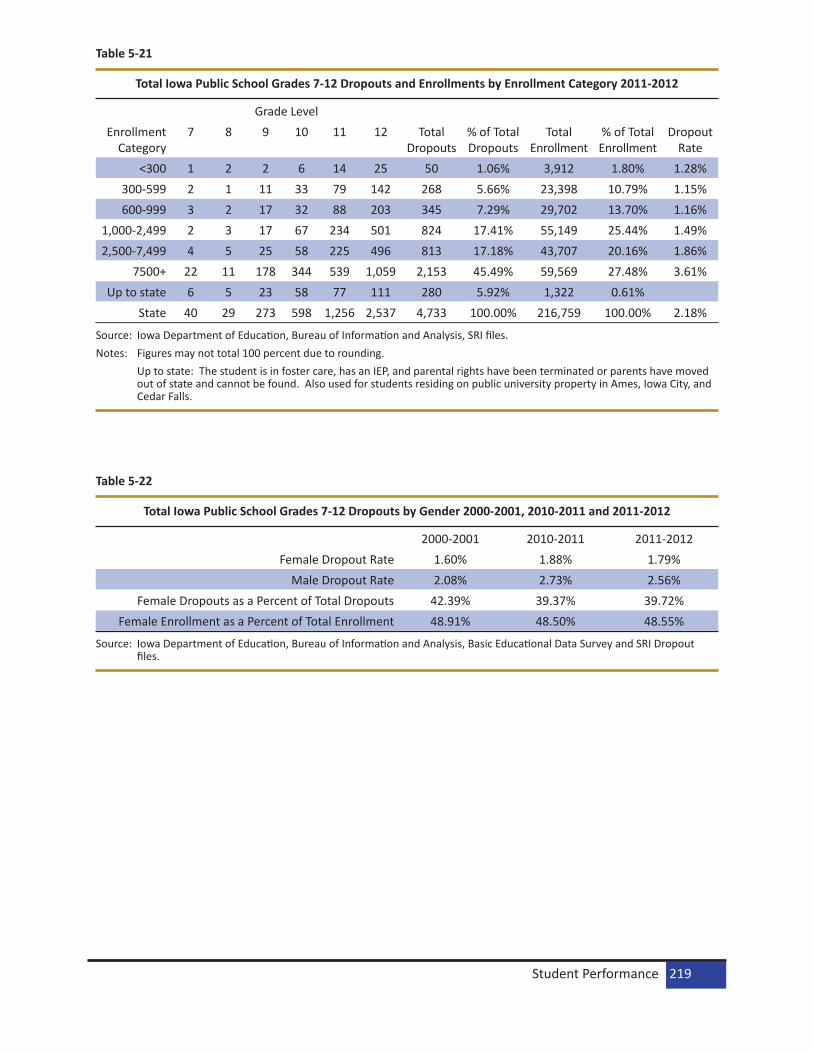
Table 5-21
Total Iowa Public School Grades 7-12 Dropouts and Enrollments by Enrollment Category 2011-2012
Source: Iowa Department of Education, Bureau of Information and Analysis, SRI files.Notes: Figures may not total 100 percent due to rounding. Up to state: The student is in foster care, has an IEP, and parental rights have been terminated or parents have moved
out of state and cannot be found. Also used for students residing on public university property in Ames, Iowa City, and Cedar Falls.
Table 5-22
Total Iowa Public School Grades 7-12 Dropouts by Gender 2000-2001, 2010-2011 and 2011-2012
Source: Iowa Department of Education, Bureau of Information and Analysis, Basic Educational Data Survey and SRI Dropout files.
Grade LevelEnrollment
Category7 8 9 10 11 12 Total
Dropouts% of Total Dropouts
Total Enrollment
% of Total Enrollment
Dropout Rate
<300 1 2 2 6 14 25 50 1.06% 3,912 1.80% 1.28%300-599 2 1 11 33 79 142 268 5.66% 23,398 10.79% 1.15%600-999 3 2 17 32 88 203 345 7.29% 29,702 13.70% 1.16%
1,000-2,499 2 3 17 67 234 501 824 17.41% 55,149 25.44% 1.49%2,500-7,499 4 5 25 58 225 496 813 17.18% 43,707 20.16% 1.86%
7500+ 22 11 178 344 539 1,059 2,153 45.49% 59,569 27.48% 3.61%Up to state 6 5 23 58 77 111 280 5.92% 1,322 0.61%
State 40 29 273 598 1,256 2,537 4,733 100.00% 216,759 100.00% 2.18%
2000-2001 2010-2011 2011-2012Female Dropout Rate 1.60% 1.88% 1.79%
Male Dropout Rate 2.08% 2.73% 2.56%Female Dropouts as a Percent of Total Dropouts 42.39% 39.37% 39.72%
Female Enrollment as a Percent of Total Enrollment 48.91% 48.50% 48.55%
Student Performance 219
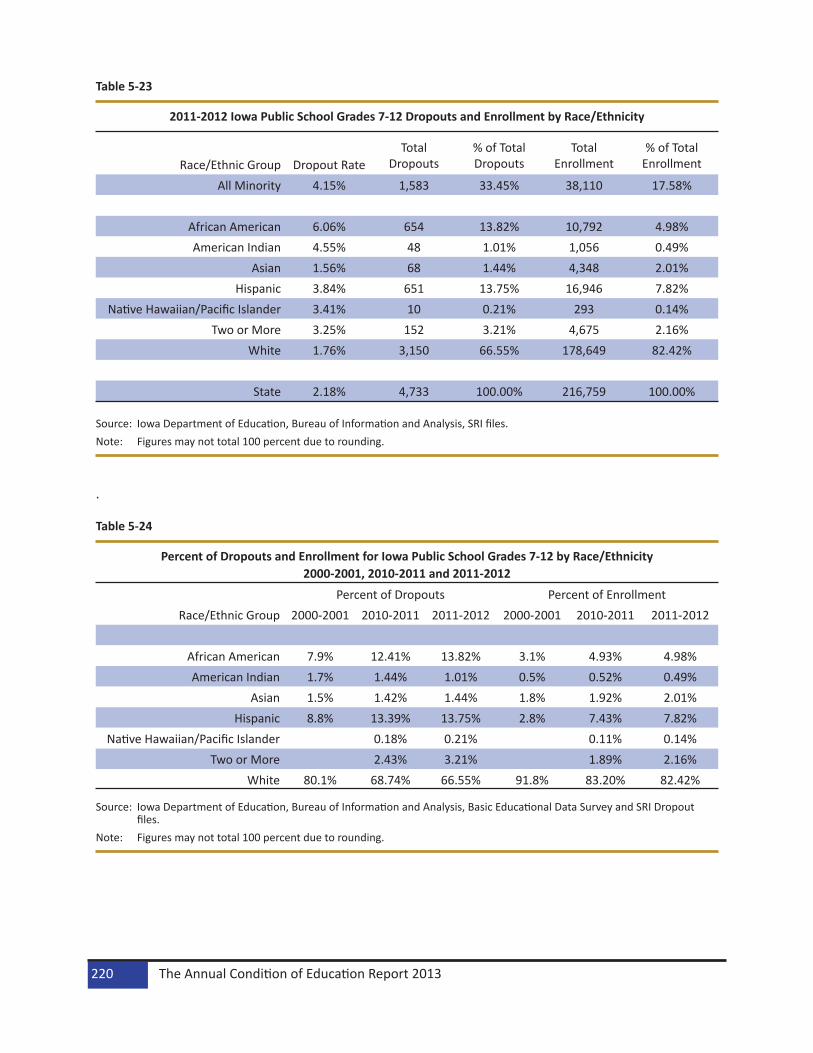
Table 5-23
2011-2012 Iowa Public School Grades 7-12 Dropouts and Enrollment by Race/Ethnicity
Source: Iowa Department of Education, Bureau of Information and Analysis, SRI files.Note: Figures may not total 100 percent due to rounding.
.
Table 5-24
Percent of Dropouts and Enrollment for Iowa Public School Grades 7-12 by Race/Ethnicity 2000-2001, 2010-2011 and 2011-2012
Source: Iowa Department of Education, Bureau of Information and Analysis, Basic Educational Data Survey and SRI Dropout files.
Note: Figures may not total 100 percent due to rounding.
Race/Ethnic Group Dropout RateTotal
Dropouts% of Total Dropouts
Total Enrollment
% of Total Enrollment
All Minority 4.15% 1,583 33.45% 38,110 17.58%
African American 6.06% 654 13.82% 10,792 4.98%American Indian 4.55% 48 1.01% 1,056 0.49%
Asian 1.56% 68 1.44% 4,348 2.01%Hispanic 3.84% 651 13.75% 16,946 7.82%
Native Hawaiian/Pacific Islander 3.41% 10 0.21% 293 0.14%Two or More 3.25% 152 3.21% 4,675 2.16%
White 1.76% 3,150 66.55% 178,649 82.42%
State 2.18% 4,733 100.00% 216,759 100.00%
Percent of Dropouts Percent of EnrollmentRace/Ethnic Group 2000-2001 2010-2011 2011-2012 2000-2001 2010-2011 2011-2012
African American 7.9% 12.41% 13.82% 3.1% 4.93% 4.98%American Indian 1.7% 1.44% 1.01% 0.5% 0.52% 0.49%
Asian 1.5% 1.42% 1.44% 1.8% 1.92% 2.01%Hispanic 8.8% 13.39% 13.75% 2.8% 7.43% 7.82%
Native Hawaiian/Pacific Islander 0.18% 0.21% 0.11% 0.14%Two or More 2.43% 3.21% 1.89% 2.16%
White 80.1% 68.74% 66.55% 91.8% 83.20% 82.42%
The Annual Condition of Education Report 2013220
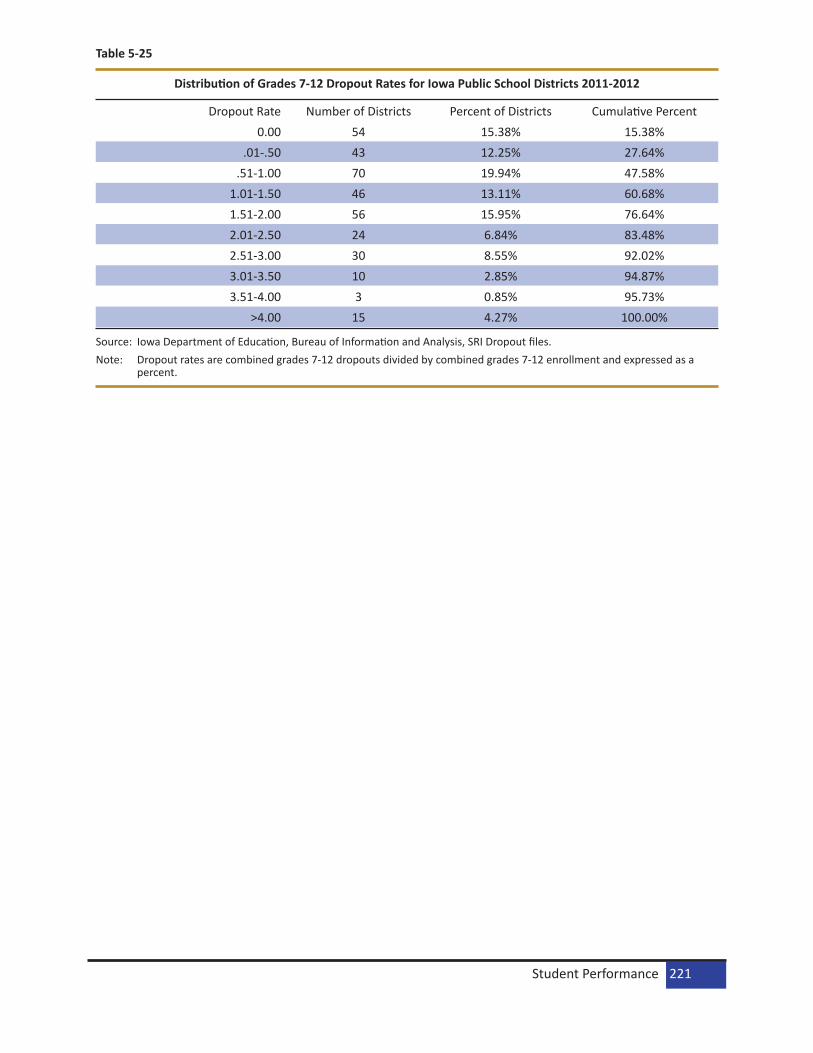
Table 5-25
Distribution of Grades 7-12 Dropout Rates for Iowa Public School Districts 2011-2012
Source: Iowa Department of Education, Bureau of Information and Analysis, SRI Dropout files.Note: Dropout rates are combined grades 7-12 dropouts divided by combined grades 7-12 enrollment and expressed as a
percent.
Dropout Rate Number of Districts Percent of Districts Cumulative Percent0.00 54 15.38% 15.38%
.01-.50 43 12.25% 27.64%.51-1.00 70 19.94% 47.58%
1.01-1.50 46 13.11% 60.68%1.51-2.00 56 15.95% 76.64%2.01-2.50 24 6.84% 83.48%2.51-3.00 30 8.55% 92.02%3.01-3.50 10 2.85% 94.87%3.51-4.00 3 0.85% 95.73%
>4.00 15 4.27% 100.00%
Student Performance 221
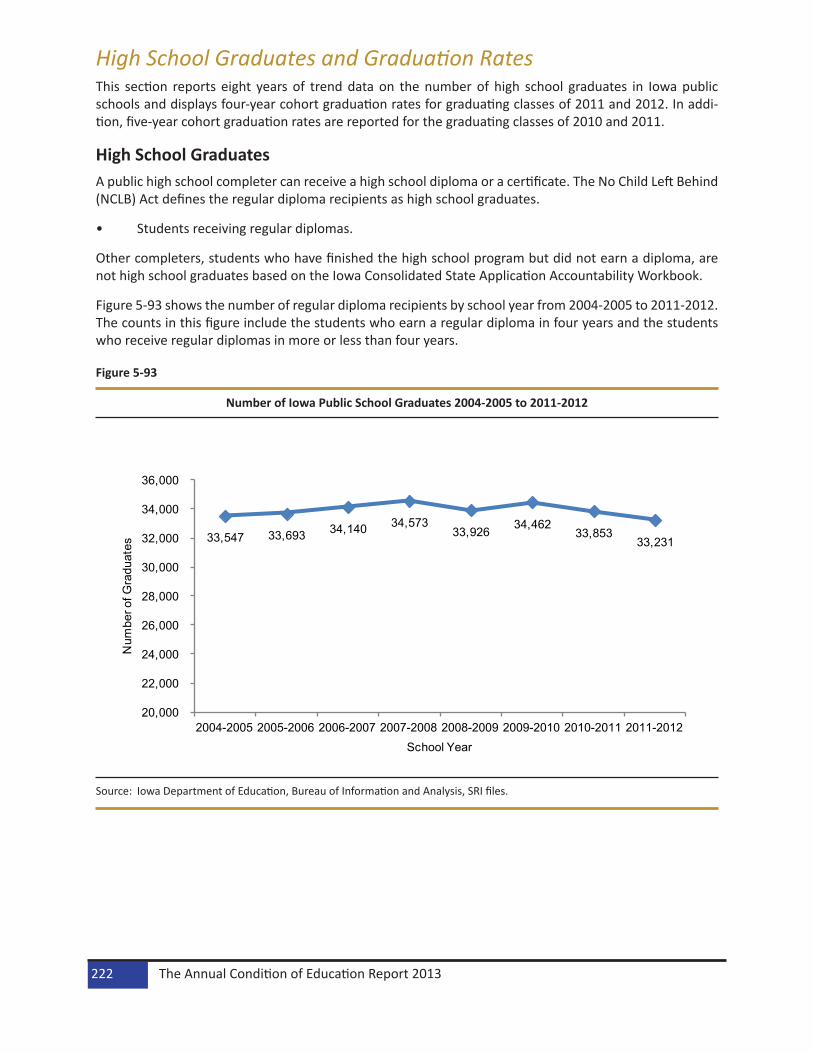
High School Graduates and Graduation RatesThis section reports eight years of trend data on the number of high school graduates in Iowa public schools and displays four-year cohort graduation rates for graduating classes of 2011 and 2012. In addi-tion, five-year cohort graduation rates are reported for the graduating classes of 2010 and 2011.
High School GraduatesA public high school completer can receive a high school diploma or a certificate. The No Child Left Behind (NCLB) Act defines the regular diploma recipients as high school graduates.
• Students receiving regular diplomas.
Other completers, students who have finished the high school program but did not earn a diploma, are not high school graduates based on the Iowa Consolidated State Application Accountability Workbook.
Figure 5-93 shows the number of regular diploma recipients by school year from 2004-2005 to 2011-2012. The counts in this figure include the students who earn a regular diploma in four years and the students who receive regular diplomas in more or less than four years.
Figure 5-93
Number of Iowa Public School Graduates 2004-2005 to 2011-2012
33,547 33,693 34,140 34,573 33,926 34,462
33,853 33,231
20,000
22,000
24,000
26,000
28,000
30,000
32,000
34,000
36,000
2004-2005 2005-2006 2006-2007 2007-2008 2008-2009 2009-2010 2010-2011 2011-2012
Num
ber o
f Gra
duat
es
School Year
Source: Iowa Department of Education, Bureau of Information and Analysis, SRI files.
The Annual Condition of Education Report 2013222

High School Graduation RatesWith the statewide identification system and Student Reporting in Iowa (SRI, EASIER) data, Iowa can fol-low the same group of students over several years and implement the first-time freshman cohort rates (students who repeated their 9th grade year were included in one of the earlier cohorts). The four-year cohort graduation rate is calculated for the class of 2012 by dividing the number of students in the cohort (denominator) who graduate with a regular high school diploma in four years or less by the number of first-time 9th graders enrolled in the fall of 2008 minus the number of students who transferred out plus the total number of students who transferred in.
Iowa Four-Year Cohort Graduation Rate = (FG + TIG) / (F + TI - TO)
For the graduating class of 2012
FG = First-time 9th grade students in fall of 2008 and graduated in 2012 or earlier
TIG = Students who transferred in grades 9 to 12 and graduated in 2012 or sooner
F = First-time 9th grade students in fall of 2008
TI = Transferred in the first-time 9th graders’ cohort in grades 9 to 12
TO = Transfer out (including emigrates and deceased)
First-time freshmen and transferred-in students include: resident students attending a public school in the district; non-resident students open-enrolled in, whole-grade sharing in, or tuition in; and foreign students on Visa. Those excluded are: home-schooled and nonpublic schooled students; public school students en-rolled in another district but taking courses on a part-time basis; and foreign exchange students. Students receiving regular diplomas are included as graduates in the numerator. Early graduates are included in the original cohort. All students who take longer to graduate (including students with IEPs) are included in the denominator, but not in the numerator for the four-year rate. Figure 5-94 shows a four-year graduation rate trend for the classes 2009 to 2012.
Figure 5-94
Iowa Public High School Four-Year Cohort Graduation Rate for the Graduating Classes of 2009 to 2012
87.3% 88.8% 88.3% 89.3%
50%55%60%65%70%75%80%85%90%95%
100%
2009 2010 2011 2012
Per
cent
Graduating Class
Source: Iowa Department of Education, Bureau of Information and Analysis, SRI file.
Student Performance 223
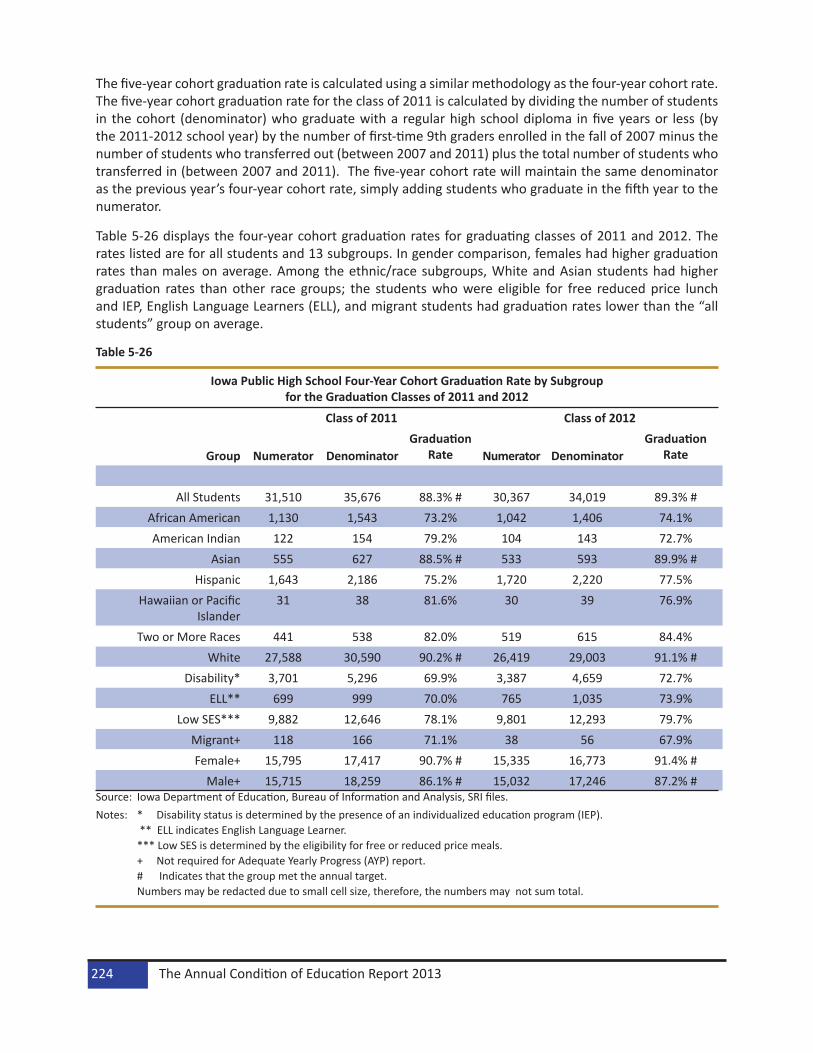
The five-year cohort graduation rate is calculated using a similar methodology as the four-year cohort rate. The five-year cohort graduation rate for the class of 2011 is calculated by dividing the number of students in the cohort (denominator) who graduate with a regular high school diploma in five years or less (by the 2011-2012 school year) by the number of first-time 9th graders enrolled in the fall of 2007 minus the number of students who transferred out (between 2007 and 2011) plus the total number of students who transferred in (between 2007 and 2011). The five-year cohort rate will maintain the same denominator as the previous year’s four-year cohort rate, simply adding students who graduate in the fifth year to the numerator.
Table 5-26 displays the four-year cohort graduation rates for graduating classes of 2011 and 2012. The rates listed are for all students and 13 subgroups. In gender comparison, females had higher graduation rates than males on average. Among the ethnic/race subgroups, White and Asian students had higher graduation rates than other race groups; the students who were eligible for free reduced price lunch and IEP, English Language Learners (ELL), and migrant students had graduation rates lower than the “all students” group on average.
Table 5-26
Iowa Public High School Four-Year Cohort Graduation Rate by Subgroup for the Graduation Classes of 2011 and 2012
Class of 2011 Class of 2012
Group Numerator DenominatorGraduation
Rate Numerator DenominatorGraduation
Rate
All Students 31,510 35,676 88.3% # 30,367 34,019 89.3% #African American 1,130 1,543 73.2% 1,042 1,406 74.1%American Indian 122 154 79.2% 104 143 72.7%
Asian 555 627 88.5% # 533 593 89.9% #Hispanic 1,643 2,186 75.2% 1,720 2,220 77.5%
Hawaiian or Pacific Islander
31 38 81.6% 30 39 76.9%
Two or More Races 441 538 82.0% 519 615 84.4%White 27,588 30,590 90.2% # 26,419 29,003 91.1% #
Disability* 3,701 5,296 69.9% 3,387 4,659 72.7%ELL** 699 999 70.0% 765 1,035 73.9%
Low SES*** 9,882 12,646 78.1% 9,801 12,293 79.7%Migrant+ 118 166 71.1% 38 56 67.9%Female+ 15,795 17,417 90.7% # 15,335 16,773 91.4% #
Male+ 15,715 18,259 86.1% # 15,032 17,246 87.2% #Source: Iowa Department of Education, Bureau of Information and Analysis, SRI files.Notes: * Disability status is determined by the presence of an individualized education program (IEP). ** ELL indicates English Language Learner. *** Low SES is determined by the eligibility for free or reduced price meals. + Not required for Adequate Yearly Progress (AYP) report. # Indicates that the group met the annual target. Numbers may be redacted due to small cell size, therefore, the numbers may not sum total.
The Annual Condition of Education Report 2013224

Table 5-27
Iowa Public High School Five-Year Cohort Graduation Rate by Subgroup for the Graduation Classes of 2010 and 2011
Source: Iowa Department of Education, Bureau of Information and Analysis, SRI (EASIER) files.Notes: * Disability status is determined by the presence of an individualized education program (IEP). ** ELL indicates English Language Learner. *** Low SES is determined by the eligibility for free or reduced price meals. + Not required for Adequate Yearly Progress (AYP) report. – Data are not available. # Indicates that the group met the annual target.
Class of 2010 Class of 2011Enrollment Category Numerator Denominator Graduation
RateNumerator Denominator Graduation
Rate
All Students 33,189 36,152 91.8% # 32,624 35,676 91.4% #African American 1,181 1,494 79.0% 1,223 1,543 79.3%American Indian 142 185 76.8% 127 154 82.5%
Asian 630 668 94.3% # 577 627 92.0% #Hispanic 1,685 2,021 83.4% 1,800 2,186 82.3%
Hawaiian or Pacific Islander
- - - 33 38 86.8%
Two or More Races - - - 463 538 86.1%White 29,152 31,349 93.0% # 28,401 30,590 92.8% #
Disability* 4,280 5,252 81.5% 4,273 5,296 80.7%ELL** 789 962 82.0% 800 999 80.1%
Low SES*** 10,439 12,383 84.3% 10,575 12,646 83.6%Migrant+ 167 221 75.6% 133 166 80.1%Female+ 16,779 17,999 93.2% # 16,203 17,417 93.0% #
Male+ 16,410 18,153 90.4% # 16,421 18,259 89.9% #
Student Performance 225

Table 5-28
Class of 2011 Four Year (Regulatory Adjusted) Cohort Graduation Rates
State All Students
African American
American Indian
Asian Hispanic Hawaiian or Pacific Islander
Two or More
White Disability ELL Low SES
ALABAMA 72% 63% 80% - 66% - - 78% 30% 36% 62%
ALASKA 68% 63% 51% 79% 62% 59% 65% 75% 40% 41% 56%
ARIZONA 78% 74% 62% - 72% - - 85% 67% 25% 73%
ARKANSAS 81% 73% 85% 80% 77% 51% 82% 84% 75% 76% 75%
CALIFORNIA 76% 63% 68% 90% 70% 74% 65% 85% 59% 60% 70%
COLORADO 74% 65% 52% 81% 60% - - 81% 53% 53% 62%
CONNECTICUT 83% 71% 72% - 64% - - 89% 61% 59% 62%
DELAWARE 78% 73% 78% ‡ 71% ‡ 93% 82% 56% 65% 71%
DISTRICT OF COLUMBIA
59% 58% ‡ ‡ 55% ‡ - 85% 39% 53% 58%
FLORIDA 71% 59% 70% 86% 69% - - 76% 44% 53% 60%
GEORGIA 67% 60% 68% - 58% - 69% 76% 30% 32% 59%
HAWAII 80% 77% 60% - 79% - - 78% 59% 60% 75%
IDAHO † † † † † † † † † † †
ILLINOIS 84% 74% 78% 92% 77% 96% 81% 89% 66% 68% 75%
INDIANA 86% 75% 76% 89% 81% 80% 80% 88% 65% 73% 79%
IOWA 88% 73% 79% 89% 75% 82% 82% 90% 70% 70% 78%
KANSAS 83% 72% 72% 88% 73% 79% 81% 86% 73% 70% 73%
KENTUCKY † † † † † † † † † † †
LOUISIANA 71% 64% 71% ‡ 70% ≥80% 80% 77% 29% 43% 64%
MAINE 84% 77% 82% ‡ 87% ‡ 86% 84% 66% 78% 73%
MARYLAND 83% 76% 74% 93% 72% 88% 91% 89% 57% 54% 74%
MASSACHUSETTS 83% 71% 76% 88% 62% 81% 81% 89% 66% 56% 70%
MICHIGAN 74% 57% 62% 87% 63% 52% 69% 80% 52% 62% 63%
MINNESOTA 77% 49% 42% - 51% - - 84% 56% 52% 58%
MISSISSIPPI 81% 66% 77% 87% 75% 81% 92% 85% 68% 62% 74%MISSOURI 82% 81% 63% 90% 78% 80% - 85% 69% 57% 71%
MONTANA 82% 81% 63% 90% 78% 80% - 85% 69% 57% 71%
The Annual Condition of Education Report 2013226

Table 5-28 (…continued)
Source: U.S. Department of Education, 2012 November.Note: + Cohort Graduation Rates not available
All Students
African American
American Indian
Asian Hispanic Hawaiian or Pacific Islander
Two or More
White Disability ELL Low SES
NEBRASKA 86% 70% 64% 83% 74% - - 90% 70% 52% 78%
NEVADA 62% 43% 52% 73% 53% 80% 80% 71% 23% 29% 53%
NEW HAMPSHIRE
86% 73% 78% ‡ 73% ‡ 86% 87% 69% 73% 72%
NEW JERSEY 83% 69% 87% 93% 73% 88% 84% 90% 73% 68% 71%
NEW MEXICO 63% 60% 56% - 59% - - 73% 47% 56% 56%
NEW YORK 77% 64% 64% - 63% - 79% 86% 48% 46% 69%
NORTH CAROLINA
78% 72% 70% - 69% - 77% 83% 57% 48% 71%
NORTH DAKOTA 86% 74% 62% 88% 76% - - 90% 67% 61% 76%
OHIO 80% 59% 71% - 66% - 71% 85% 67% 53% 65%
OKLAHOMA - - - - - - - - - - -
OREGON 68% 54% 52% 79% 58% 69% 73% 70% 42% 52% 61%
PENNSYLVANIA 83% 65% 77% - 65% - 75% 88% 71% 63% 71%
RHODE ISLAND 77% 67% 66% 75% 67% 76% 77% 82% 58% 68% 66%
SOUTH CAROLINA
74% 70% 67% - 69% - - 77% 39% 62% 67%
SOUTH DAKOTA 83% 73% 49% 84% 73% 63% 87% 88% 84% 82% 86%
TENNESSEE 86% 78% 89% 91% 79% 91% - 89% 67% 71% 80%
TEXAS 86% 81% 87% 95% 82% 88% 92% 92% 77% 58% 84%
UTAH 76% 61% 57% 72% 57% 69% - 80% 59% 45% 65%
VERMONT 87% - - - - - - - 69% 82% 77%
VIRGINIA 82% 73% - - 71% - - 86% 47% 55% 70%
WASHINGTON 76% 65% 57% ‡ 63% ‡ 73% 79% 56% 51% 66%
WEST VIRGINIA 76% 72% ‡ - 71% - ‡ 77% 57% 79% 68%
WISCONSIN 87% 64% 75% - 72% - - 91% 67% 66% 74%
WYOMING 80% 58% 51% 91% 74% 73% 77% 82% 57% 62% 66%
Student Performance 227

Suspensions and ExpulsionsIn-school suspensions, out-of-school suspensions, expulsions, and removals to an interim setting can be given to students because of incidents that occur on school property. Table 5-29 shows public school removals by type. In-School Suspensions comprise 57 percent of all removals, followed by Out-of-School Suspensions over 40 percent in 2012-2013. When multiple offenses are removed from the counts to reveal the number of unique students involved, just less than 9 percent of enrolled students statewide are affected.
An in-school suspension is defined as an:
Administrative removal of a student from regular classes or activities for disciplinary reasons, but the student continues to be under the supervision of the school district.
School district personnel were instructed to report all in-school suspensions regardless of their length. Therefore, an in-school suspension lasting as little as one period of the day is included in this data, as long as the removal was initiated and/or approved by building or district administration. Detail distribution of reason for in-school removal is illustrated in Table 5-30.
An out-of-school suspension is defined as an:
Administrative removal of a student from regular classes or activities for disciplinary reasons.
Again, school district personnel were instructed to report all out-of-school suspensions regardless of their length. Detail distribution of reason for out-of-school suspension is illustrated in Table 5-31.
An expulsion is defined as:
School board action resulting in the removal of a student ‘from the rolls’ of a district (unless the student has an IEP and requires continuing services) for disciplinary reasons.
If the length of a student expulsion is greater than the remaining number of days in the current school year and the student returns to the district the following school year, district personnel are instructed to report the expulsion in both school years. In 2012-2013, expulsions were most often given as a result of drug related incidents (Table 5-32).
For removals to an interim setting initiated by school personnel given to special education students, the reason for removal must be drug related, weapons related, or due to serious bodily injury with a maximum length of 45 days. There are no similar restrictions for placement of regular education students.
Removals to an interim setting initiated by a special education administrative law judge remain very sparse across the state. This type of removal is reserved for special education students and may only be used if there is a threat of injury. Since 2010-2011, removals to an interim setting by a special education admin-istrative law judge were given as a result of attendance policy violations and disruptive behavior (Table 5-33).
Tables 5-35 to 5-37 show removal information by subgroups, grade span, and district enrollment size categories.
The Annual Condition of Education Report 2013228

Table 5-29
K-12 Removals by Removal Type 2009-2010 and 2011-2012 to 2012-2013
Source: Iowa Department of Education, Bureau of Information and Analysis, SRI unilateral removal and student archive files.Note: Figures may not total due to rounding.
Removals % of Removals
2012-2013
% Change 2009-2010 to
2012-20132009-2010 2011-2012 2012-2013
In-School Suspensions
42,186 39,604 33,447 57.0% -20.7%
Out-of-School Suspensions
27,087 28,843 25,033 42.7% -7.6%
Expulsions 131 159 151 0.3% 15.3%Interim Setting by School Personnel
15 59 63 0.1% 320.0%
Total 69,419 68,666 58,694 100% -15.4%
Student Performance 229

Table 5-30
K-12 In-School Suspensions by Reason for Removal 2009-2010 and 2011-2012 to 2012-2013
Source: Iowa Department of Education, Bureau of Information and Analysis, SRI unilateral removal and student archive files.
2009-2010 2011-2012 2012-2013 Percent of In-School
Suspensions 2012-2013
% Change in In-School Suspensions 2009-2010 to
2012-2013
Reason for Removal
Removals Distinct Students
Removals Distinct Students
Removals Distinct Students
Alcohol Related
82 77 62 61 54 52 0.2% -34.1%
Attendance Policy
Violation
12,743 6,379 9,923 5,278 8,686 4,426 26.0% -31.8%
Disruptive Behavior
12,707 7,783 12,339 7,769 8,863 6,055 26.5% -30.3%
Drug Related 82 81 122 119 94 90 0.3% 14.6%Physical
Fighting w/ Injury
302 293 373 361 304 294 0.9% 0.7%
Physical Fighting w/o
Injury
3,017 2,682 3,265 2,861 3,066 2,764 9.2% 1.6%
Property Related
714 672 763 712 654 619 2.0% -8.4%
Serious Bodily Injury
46 45 18 18 19 19 0.1% -58.7%
Tobacco Related
375 349 388 357 291 274 0.9% -22.4%
Violent Behavior w/
Injury
153 150 196 189 194 185 0.6% 26.8%
Violent Behavior w/o
Injury
1,136 1,009 1,288 1,147 1,092 966 3.3% -3.9%
Weapons Related
190 185 230 226 234 226 0.7% 23.2%
Threat of Destruction
or Harm
524 476 1.6%
Other 10,639 6,956 10,637 6,736 9,372 5,723 28.0% -11.9%Total 42,186 26,661 39,604 25,834 33,447 22,169 100% -20.7%
The Annual Condition of Education Report 2013230
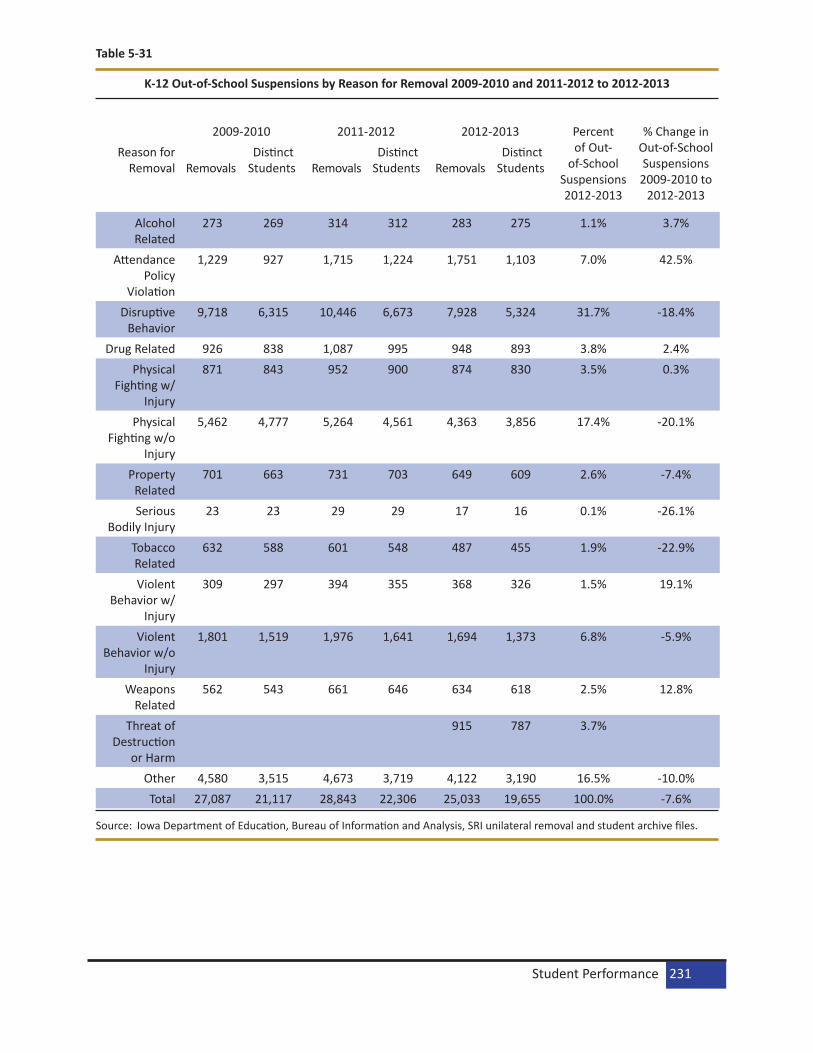
Table 5-31
K-12 Out-of-School Suspensions by Reason for Removal 2009-2010 and 2011-2012 to 2012-2013
Source: Iowa Department of Education, Bureau of Information and Analysis, SRI unilateral removal and student archive files.
2009-2010 2011-2012 2012-2013 Percent of Out-
of-School Suspensions 2012-2013
% Change in Out-of-School Suspensions 2009-2010 to
2012-2013
Reason for Removal
Removals
Distinct Students
Removals
Distinct Students
Removals
Distinct Students
Alcohol Related
273 269 314 312 283 275 1.1% 3.7%
Attendance Policy
Violation
1,229 927 1,715 1,224 1,751 1,103 7.0% 42.5%
Disruptive Behavior
9,718 6,315 10,446 6,673 7,928 5,324 31.7% -18.4%
Drug Related 926 838 1,087 995 948 893 3.8% 2.4%Physical
Fighting w/ Injury
871 843 952 900 874 830 3.5% 0.3%
Physical Fighting w/o
Injury
5,462 4,777 5,264 4,561 4,363 3,856 17.4% -20.1%
Property Related
701 663 731 703 649 609 2.6% -7.4%
Serious Bodily Injury
23 23 29 29 17 16 0.1% -26.1%
Tobacco Related
632 588 601 548 487 455 1.9% -22.9%
Violent Behavior w/
Injury
309 297 394 355 368 326 1.5% 19.1%
Violent Behavior w/o
Injury
1,801 1,519 1,976 1,641 1,694 1,373 6.8% -5.9%
Weapons Related
562 543 661 646 634 618 2.5% 12.8%
Threat of Destruction
or Harm
915 787 3.7%
Other 4,580 3,515 4,673 3,719 4,122 3,190 16.5% -10.0%Total 27,087 21,117 28,843 22,306 25,033 19,655 100.0% -7.6%
Student Performance 231

Table 5-32
K-12 Expulsions by Reason for Removal 2009-2010 and 2011-2012 to 2012-2013
Source: Iowa Department of Education, Bureau of Information and Analysis, SRI unilateral removal and student archive files.
Expulsions Percent of Expulsions 2012-2013Reason for Removal 2009-2010 2011-2012 2012-2013
Alcohol Related 7 6 4 2.6%Attendance Policy Violation 0 0 0 0.0%
Disruptive Behavior 8 8 12 7.9%Drug Related 71 98 64 42.4%
Physical Fighting w/ Injury 4 3 6 4.0%Physical Fighting w/o Injury 6 1 3 2.0%
Property Related 6 3 3 2.0%Serious Bodily Injury 0 0 0 0.0%
Tobacco Related 1 1 0 0.0%Violent Behavior w/ Injury 1 2 0 0.0%
Violent Behavior w/o Injury 2 11 4 2.6%Weapons Related 19 17 29 19.2%
Threat of Destruction or Harm 0 0 20 13.2%
Other 6 9 6 4.0%Total 131 159 151 100.0%
The Annual Condition of Education Report 2013232
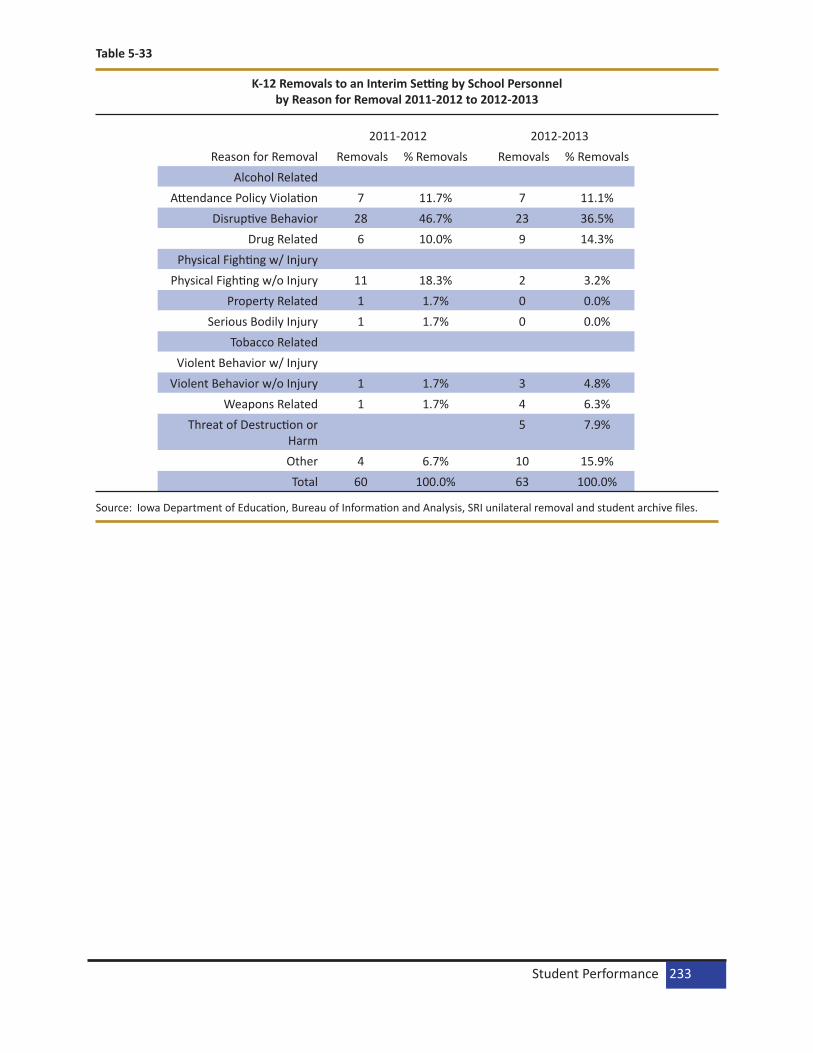
Table 5-33
K-12 Removals to an Interim Setting by School Personnel by Reason for Removal 2011-2012 to 2012-2013
Source: Iowa Department of Education, Bureau of Information and Analysis, SRI unilateral removal and student archive files.
2011-2012 2012-2013Reason for Removal Removals % Removals Removals % Removals
Alcohol RelatedAttendance Policy Violation 7 11.7% 7 11.1%
Disruptive Behavior 28 46.7% 23 36.5%Drug Related 6 10.0% 9 14.3%
Physical Fighting w/ InjuryPhysical Fighting w/o Injury 11 18.3% 2 3.2%
Property Related 1 1.7% 0 0.0%Serious Bodily Injury 1 1.7% 0 0.0%
Tobacco RelatedViolent Behavior w/ Injury
Violent Behavior w/o Injury 1 1.7% 3 4.8%Weapons Related 1 1.7% 4 6.3%
Threat of Destruction or Harm
5 7.9%
Other 4 6.7% 10 15.9%Total 60 100.0% 63 100.0%
Student Performance 233
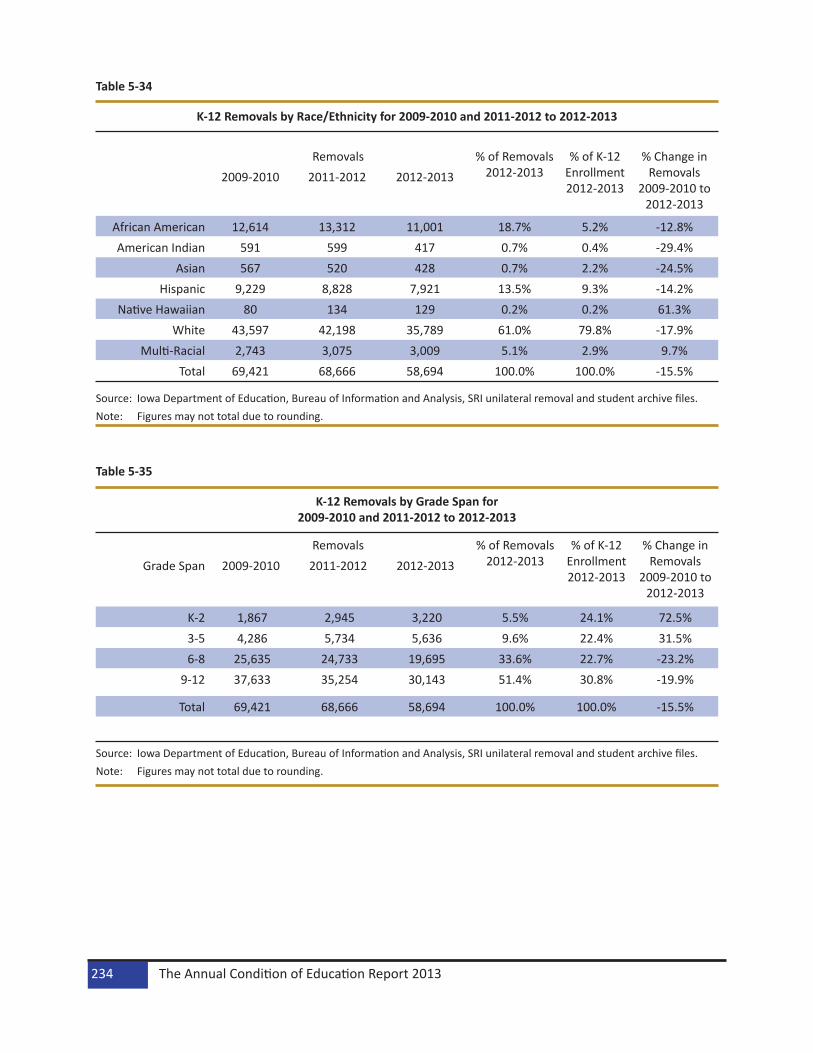
Table 5-34
K-12 Removals by Race/Ethnicity for 2009-2010 and 2011-2012 to 2012-2013
Source: Iowa Department of Education, Bureau of Information and Analysis, SRI unilateral removal and student archive files.Note: Figures may not total due to rounding.
Table 5-35
K-12 Removals by Grade Span for 2009-2010 and 2011-2012 to 2012-2013
Source: Iowa Department of Education, Bureau of Information and Analysis, SRI unilateral removal and student archive files.Note: Figures may not total due to rounding.
Removals % of Removals 2012-2013
% of K-12 Enrollment 2012-2013
% Change in Removals
2009-2010 to 2012-2013
2009-2010 2011-2012 2012-2013
African American 12,614 13,312 11,001 18.7% 5.2% -12.8%American Indian 591 599 417 0.7% 0.4% -29.4%
Asian 567 520 428 0.7% 2.2% -24.5%Hispanic 9,229 8,828 7,921 13.5% 9.3% -14.2%
Native Hawaiian 80 134 129 0.2% 0.2% 61.3%White 43,597 42,198 35,789 61.0% 79.8% -17.9%
Multi-Racial 2,743 3,075 3,009 5.1% 2.9% 9.7%Total 69,421 68,666 58,694 100.0% 100.0% -15.5%
Removals % of Removals 2012-2013
% of K-12 Enrollment 2012-2013
% Change in Removals
2009-2010 to 2012-2013
Grade Span 2009-2010 2011-2012 2012-2013
K-2 1,867 2,945 3,220 5.5% 24.1% 72.5%3-5 4,286 5,734 5,636 9.6% 22.4% 31.5%6-8 25,635 24,733 19,695 33.6% 22.7% -23.2%
9-12 37,633 35,254 30,143 51.4% 30.8% -19.9%
Total 69,421 68,666 58,694 100.0% 100.0% -15.5%
The Annual Condition of Education Report 2013234
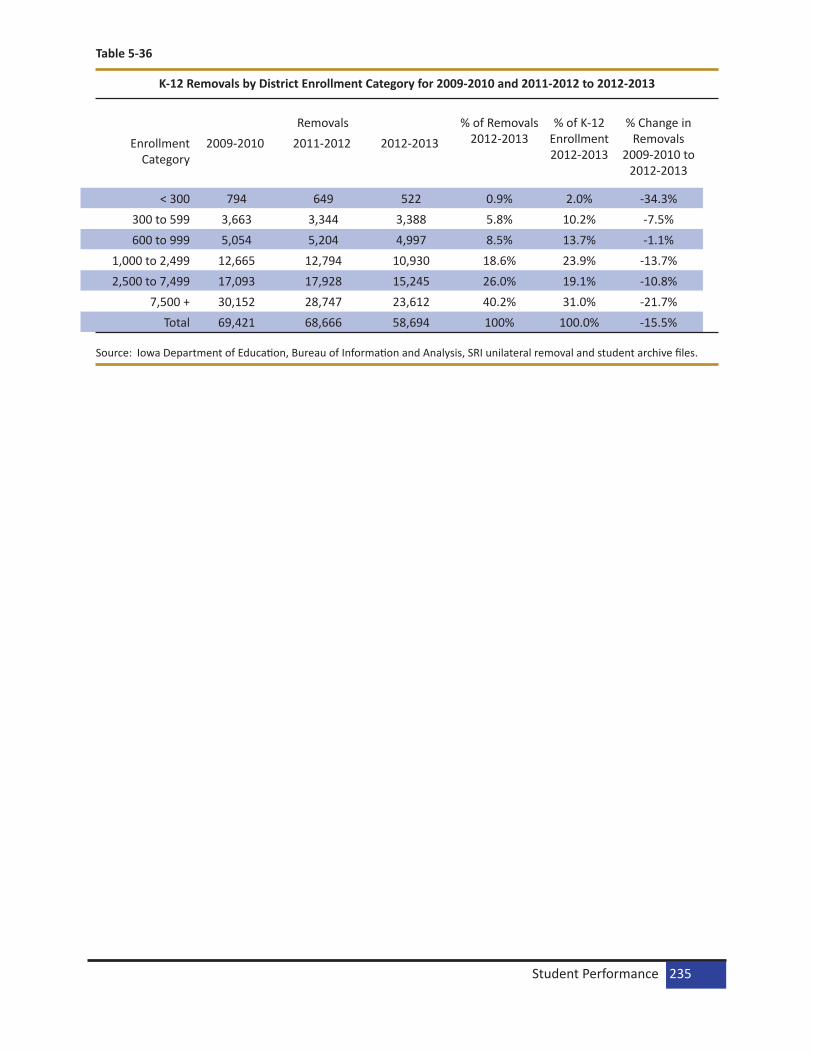
Table 5-36
K-12 Removals by District Enrollment Category for 2009-2010 and 2011-2012 to 2012-2013
Source: Iowa Department of Education, Bureau of Information and Analysis, SRI unilateral removal and student archive files.
Removals % of Removals 2012-2013
% of K-12 Enrollment 2012-2013
% Change in Removals
2009-2010 to 2012-2013
Enrollment Category
2009-2010 2011-2012 2012-2013
< 300 794 649 522 0.9% 2.0% -34.3%300 to 599 3,663 3,344 3,388 5.8% 10.2% -7.5%600 to 999 5,054 5,204 4,997 8.5% 13.7% -1.1%
1,000 to 2,499 12,665 12,794 10,930 18.6% 23.9% -13.7%2,500 to 7,499 17,093 17,928 15,245 26.0% 19.1% -10.8%
7,500 + 30,152 28,747 23,612 40.2% 31.0% -21.7%Total 69,421 68,666 58,694 100% 100.0% -15.5%
Student Performance 235

Evaluating School Performance in the Context of Academic Challenge
Background
The mission of an educational institution ought to include something about “a quality educational experi-ence,” serving “a diverse community of students,” and having “high expectations for all students.” Many school districts have statements that mention something about preparing students for success in life after school. Indeed, readiness for college and careers is becoming popular and has become part of federal education policy. Some institutions profess to do “whatever it takes” to enable students to succeed.
There once was a time where students who didn’t meet the academic standards were left to figure out something else to do, or counseled to enter a trade school or the military. We are at a time in our history when we now believe that we have no expendable children. We value the worth and promise of every child that walks through the doors of our schools. But is this sentiment reflected by our actions?
While we maintain that we have the same high expectations of our students that our predecessors had of their students, there are students who struggle to achieve the academic excellence that we pride ourselves in being able to deliver. The academic challenges that face our students today have existed in the past. Such challenges have been based on a child’s wealth, a child’s physical or cognitive disability, a child’s abil-ity to engage the language of the academic content, or a child’s race. Though educational institutions say they are doing what they can to address the needs of these students, large proportions of these students fail to reach the established student learning goals.
For now, we will call these students the “historically disenfranchised.” These students have been marginal-ized by our educational system. And while much rhetoric has given lip service to issues like “opportunity to learn” and “diversity,” people’s behavior, regardless of intention, and sometimes in spite of what some say, further alienates and “disenfranchises” students who are different from the dominant culture.
If we believe that education is for all students, then it is our responsibility to know about the experiences of these historically disenfranchised students, and to figure out ways to address their needs. This will enable them a true opportunity to learn through access to quality instructional practices.
Many studies have been done to identify and quantify an “achievement gap” that exists between students who are poor compared to students who are not poor; students with disabilities compared to their non-disabled peers; students who speak a language other than English, and comparing students of different races. Indeed, the No Child Left Behind Act was designed to require public schools and districts to change what they do to address these gaps.
This emphasis on subgroup accountability is one of the major changes that Con-gress made to the Elementary and Secondary Education Act (ESEA) accountability provisions when it enacted No Child Left Behind (NCLB). In fact, as stated in section 1001(3) of the ESEA, one of the primary purposes of NCLB is to close the achieve-ment gap between high- and low-performing students, especially the achievement gaps between minority and non-minority students and between disadvantaged children and their more advantaged peers. This purpose could not be accomplished without subgroup accountability. (United States Department of Education, 2008).
The Annual Condition of Education Report 2013236
Implicit in this statement is that white, non-poor, non-disabled, English speaking students are the stan-dard against which the gap is measured. For this paper, we refer to a “NONCAT” group, short for “non-categorized,” a group of students who do not possess any of the characteristic classifications related to disenfranchisement. These students are white, not poor, not disabled, and are native English speakers.
Thus, we have identified four demographic characteristics that can be used to classify a student as histori-cally disenfranchised, the group of marginalized children. These are children who are non-white, or poor, or disabled, or non-native English speakers. We use the term “academic challenge” to refer to students who fit into one, or any combination, of these groups.
We, as a community of professionals, need to come together and engage in conversations about how to ameliorate these historical barriers to learning. Not that students in these identified groups are not able to achieve success, but as large groups of students with similar characteristics, they struggle. Until we are able to get past our own pride in our abilities to teach, we will not be able to teach all children to a level that they deserve.
We can, whenever and wherever we choose, successfully teach all children whose schooling is of interest to us. We already know more than we need to do that. Wheth-er or not we do it must finally depend on how we feel about the fact that we haven’t so far. – Ron Edmonds, 1979
This study is an attempt to understand the effects of poverty, disability, race, and language as they relate to student achievement and performance.
Some may think that a student with a disability, given more of the same type of instruction will improve their achievement. This assumption is far from reality. Fuchs and Fuchs (2001) found through a meta analysis that 72 percent of low-achieving students perform better in reading than the average of learning disabled students. This highlights the issue that students with disabilities have different needs than other low-performing subgroups. Although that is beyond the scope of the current study, it does emphasize the need to explicitly identify needs of certain groups of students.
Evolution of the Process
During the fall of 2008, we started having conversations about the achievement of certain subgroups of students. Initially, much of the achievement gap work was focused on students in poverty, because every district serves such students. Then the conversations included students with disabilities, because every district serves these students as well. We began building an indicator system based on rankings of districts based on the percent of students in each category who scored proficient on the state assessment. This became more problematic when we added two more subgroups to the analysis: English language learn-ers, and minority students. While many districts have students who are members of a non-white race/ethnic group, some do not. Also, around 240 of the current 348 districts have English language learners. Because of group non-membership, when an index was calculated, only the available data were used in the calculations, resulting in many districts moving down a rank-ordered final list. To improve the system, our conversations moved from ranking schools and districts to identifying a weighting for each student, and aggregating those weightings at the school or district level.
Student Performance 237
We modified the indexing system to consider the context of academic challenges that students bring with them to the educational setting. Challenges that the educational and political communities have come to believe about students, and have found their way into the No Child Left Behind Act of 2001, include the following generalizations:
• Poor students don’t do as well as non-poor students• Disabled students don’t do as well as non-disabled students• English language learners don’t do as well as native English speakers• Children of color don’t do as well as their white classmates.
These were the student subgroups specified in the NCLB Act, and for which states would be held account-able, and in turn hold districts and schools accountable. This is where we began, to define the context of academic challenge, the extent of the academic challenges that students bring with them to the school-house door. The extent of these educational challenges require schools and districts to respond to student needs differently, in order to support students in their quest for success, and ameliorate the disenfran-chisement related to their academic challenges.
We built an index, for now, we can call it a School Performance Index (SPI). The index is intended to reflect how well a district or school is supporting the academic needs of its historically disenfranchised students, as evidenced by students achieving at the proficient level or above on the state’s NCLB accountability as-sessment. For comparison purposes, the interpretations answer the question, “How well does one district address the academic needs of its children, compared to how well another district addresses the academic needs of its children?”
Instances where the SPI might not be too useful are when academic performance is very high or academic challenge is very low. Regardless of these outliers, if we believe that we have no expendable children, even one child not succeeding is not good enough, and we need to have conversations about how we can do better.
Current Methodology
The student data files for 2009-2010, 2010-2011, 2011-2012, and 2012-2013 adequate yearly progres (AYP) decisions, grades 3-8 and 11, were used. Students with disabilities were coded as having an IEP, be-ing eligible for free or reduced meals (FRL), being a non-native English speaker (ELL), or being a member of one or more race groups (Asian, Black, Hispanic, Native American, Pacific Islander, two or more races, and White). Weightings for students who were members of any combinations of these groups were deter-mined by dividing the percent of proficient students in a given subgroup (or combination) into the percent of proficient students in the White NONCAT group. With the weighting for the White NONCAT group set at 1.00, the weighting for a historically disenfranchised subgroup would be greater than 1.00. The weight, then, reflects how much less likely a student in a given subgroup will be proficient when compared to a White NONCAT student. By assigning each proficient student a corresponding weight, and summing the weights for each school/district, we were able to determine the extent to which the SPI reflected school performance within the context of a more level playing field.
The Annual Condition of Education Report 2013238

In the Weightings Tables, if we subtract 1 from the number in a specific cell, and interpret as in the follow-ing example: for reading, Asian students with disabilities (1-IEP, 1.82), are 82 percent less likely than the White NONCAT group to be proficient on the Iowa Assessments. If the numbers in the cells are greater than 1, students in those subgroups are 2 or 3, or 4 times less likely to be proficient than the White NON-CAT group. And although our data show that more than half of the groups are improving their proficiency status, we have some distance to go before all achievement gaps are sufficiently closed. Note that the cells in which there were fewer than 10 students have been suppressed, and their student records have been set to a weighting of 1.00.
Table 1
Reading Weightings by Subgroup and Race 2013
1-IEP 2-ELL 3-FRL 4-IEP/ELL
5-IEP/FRL
6-ELL/FRL 7-IEP/FRL/ELL
8-Noncat
Asian 1.82* 1.45 1.06* 2.50* 2.94 2.62 4.32* 0.95Black 3.34 1.88 1.63* 5.06* 2.67* 5.90* 1.17
Hispanic 2.80* 1.87* 1.25* 4.63* 2.00* 2.02* 6.48* 1.06*Native American 3.50 3.34 3.14* 1.13
Two or more races 2.24* 1.23* 3.25* 1.36 1.02*Pacific Islander 1.39 3.24 5.83* 1.08*
White 2.24 1.55* 1.18* 4.23 2.88* 1.89* 6.04* 1.00Source: Iowa Department of Education, Bureau of Information and Analysis, 2013 Adequate Yearly Progress (AYP) Data Set.
*GAP is less than 2012.
Table 2
Mathematics Weightings by Subgroup and Race 20131-IEP 2-ELL 3-FRL 4-IEP/
ELL5-IEP/
FRL6-ELL/FRL 7-IEP/
FRL/ELL8-Noncat
Asian 1.37* 1.14 1.05 1.64* 2.39 1.68 2.86 0.96Black 3.03 2.24 1.65* 4.34 2.41* 6.98 1.21
Hispanic 2.45 1.49* 1.23* 3.23* 2.85* 1.58* 3.92 1.07*Native American 1.89 1.39 2.92* 1.12
Two or more races 2.06 1.27* 2.89 1.01 1.05*Pacific Islander 1.24* 2.15* 1.07*
White 1.81 1.31* 1.16* 3.28 2.33* 1.51* 3.27* 1.00
Source: Iowa Department of Education, Bureau of Information and Analysis, 2013 Adequate Yearly Progress (AYP) Data Set.
*GAP is less than 2012.
Student Performance 239
If we look at the change in the subgroup weightings over time, it is possible to determine if the achieve-ment gaps are changing. So, we first placed students from each of seven race groups into one of eight academically challenged subgroups, all combinations of IEP, ELL, and FRL status. Note that we did not count the Asian NONCAT group, because their achievement was greater than the White NONCAT group. If we use the White, NONCAT group (non-ELL, non-FRL, and on-IEP) as an anchor point, and we divide the percent of student achieving proficiency in that group by the percent of students achieving proficiency in any of the other subgroups, we find a measure of the achievement gap between a given subgroup and the white NONCAT group.
If we compare the results of 2013 with the results of 2012, for reading, of 42 valid subgroups (greater than 10 students), 28, or 66.7 percent of subgroup gaps grew closer to the White NONCAT group. For math, of 41 valid subgroups, 21, or 51.2 percent of subgroup gaps grew closer to the White NONCAT group.
How the Weighting is Applied
When a student in any academically challenged subgroup achieved proficiency, their school and district is awarded the number of points (the weighting) for their subgroup. This is done for all students, and ag-gregated at the subgroup level within buildings, and subgroup level within districts.
Weightings for all proficient students were summed to yield a total number of points. This total was di-vided by the maximum number of possible points, given that all students achieved proficiency and all of their weightings contributed to the total. This yielded a weighted proficiency result, reflecting the propor-tion of points gained by a district compared to the total number of possible points. This was done for both math and reading individually. The proportion of non-categorized students was determined by dividing the number of non-categorized students by the total number of FAY students tested. The proportion of disenfranchised students was determined by dividing the number of disenfranchised students by the to-tal number of FAY tested. A variable called “challenge density” was determined by taking the total points possible for math and reading, and dividing by the number of students tested. The index for the content area was found by multiplying the weighted proficiency for the content area by the challenge density for the content area.
For each content area (reading and mathematics), the following calculations are used to contribute to the overall district results.
1. The number of FAY (full academic year) students tested. This is the number of students that were enrolled for a full academic year, took the test, and received a score.
2. The Total number of points earned. Calculated for the 56 groups (race x group category), it is the sum of the number of proficient students in a group multiplied by the weighting of that group.
3. The Maximum number of points possible. Calculated for the 56 groups (race x group category), it is the sum of the weightings for all groups given that every student in every group achieved profi-ciency.
4. The Challenge Density is the maximum number of points possible divided by the number or FAY students tested. The greater the number of academic challenges that students bring with them to school, the greater the challenge density will be. If there are no students coded as FRL, IEP, ELL, or in a race group other than white, the challenge density will be 1.0. So a district with a challenge density close to 1 means that the district has relatively few students with academic challenges. A district with a challenge density that approaches 2.0 means that there are enough academic challenges that with the weightings, amounts to twice the number of students.
The Annual Condition of Education Report 2013240

5. The Weighted Proficiency is the total number of points earned divided by the maximum number of points possible.
6. The School Performance Index (SPI) is the Weighted Proficiency multiplied by the Challenge Density.
Results - What Have We Found Thus Far?
The following table shows the number of districts falling into each index range, based on an N size of 30 or more students for each subgroup. Five districts had fewer than 30 and are not included in Table 3.
Table 3
Number of Districts in Each Index Range
Index Range Reading Mathematics100 or greater 1 21
90 to <100 84 17280 to <90 240 12170 to <80 17 28
Source: Iowa Department of Education, Bureau of Information and Analysis, 2013 Adequate Yearly Progress (AYP) Data Set.
The data in Table 3 shows a more symmetrical distribution of indices of mathematics than in reading. While we can always improve in all content areas, these data shows that there is more work that needs to be done relative to student achievement in literacy.
Comments
Historically, NCLB has only looked at proficiency of students of all subgroups without consideration of the academic challenges some students bring with them to the schoolhouse door. This index attempts to ac-knowledge the efforts that districts are making on behalf of historically disenfranchised students and the challenges they bring with them to school each day.
Certainly, more examination of what these districts are doing to support the education of their histori-cally disenfranchised students is warranted. This includes a) how districts are identifying the instructional needs of their students b) how districts are addressing those instructional needs, and c) how students are responding to district practices.
Student Performance 241
This ongoing study is an effort to identify successes that districts are realizing, especially within the context of academic challenges that many of their students bring with them to the instructional set-ting. Over time, this process will evolve, and the information gained from these analyses can be used to identify where good things are happening for students, document those things that districts are doing for their students, and scale up this information so that districts who are struggling to support their students can use this information to improve their practices.
Individual district ratings for 2013 can be received by contacting [email protected].
References
Edmonds, R. (1979, October). Effective schools for the urban poor. Educational Leadership, 37(1), 15-23.
Fuchs, D., Fuchs, L. S., Mathes, P. G., Lipsey, M. W., Roberts, P. H. (2001). Is “Learning Disabilities” just a fancy term for low achievement? A meta-analysis of reading differences between low achievers with and without the label. Paper presented at the Learning Disabilities Summit, August 27-28, 2001. Washington D.C.
No Child Left Behind (NCLB) Act of 2001, 20 U.S.C.
United States Department of Education (2008, October). Title I--Improving the Academic Achievement of the Disadvantaged. Final regulations. 34 CFR Part 200.
Authors: Thomas E. Deeter, Ph.D., Lead Consultant Bureau of Information and Analysis Services
John A. Scott Beijing 21st Century International School
The Annual Condition of Education Report 2013242

Student Performance 243

Special EducationIowa reports annually on the condition and performance of students with disabilities ages 3-21 in the Annual Performance Report (APR) for Part B of the Individuals with Disabilities Education Act (IDEA) sub-mitted to the Office of Special Education Programs on February 1 of each year. Performance is measured against state targets that are set in the State Performance Plan (SPP) every six years using baseline data along with input from various stakeholders. Measures of compliance with IDEA are also reported in the SPP and APR. Some of the measures of performance presented in this section are modified from Iowa’s Part B APR, which is accessible in its entirety on the Department’s website in the Special Education section.
Other measures in this section are included to address the four areas that special education stakeholders in the state have agreed are important to monitor and with which to compare students with and without disabilities.
• Students come to school ready to learn • Students attend school in safe and caring environments • Students achieve at high levels • Students leave school ready for life
Context of Special Education in IowaIdentification RatesThe identification rate refers to the percentage of students who are identified as needing special education services. The following graph presents the special education identification rate for students ages 6-21 from 2005-2006 to 2011-2012. Generally, the rate has decreased slightly over the last six years.
Figure 6-1
Special Education Identification Rate for Students Ages 6-21, 2005-2006 to 2011-2012
2005-2006 2006-2007 2007-2008 2008-2009 2009-2010 2010-2011 2011-2012ID Rate 13.92 13.73 13.40 13.05 12.88 13.04 12.90
0
5
10
15
20
Perc
ent
Sources: Iowa Department of Education, Bureau of School Improvement, Information Management System, Count Files; Bureau of Information and Analysis, SRI, Fall Student Files.
The Annual Condition of Education Report 2013244

PlacementChildren and students receiving special education services may be served in a variety of educational set-tings. Data are collected on these settings based on the amount of time children and students spend with their nondisabled peers. Over time, the percent of children/students served in settings with typically developing peers has increased significantly in Iowa.
The following graphs show the percentage of students with disabilities ages 6-21 served (1) in the regu-lar education classroom for the greatest percentage (80% or more) of the school day, (2) in the regular education classroom for less than 40% of the school day, and (3) in private separate schools, residential placements, homebound or hospital placements, respectively.
Figure 6-2
Percent of Students with Disabilities Ages 6-21 In the Regular Classroom 80 Percent or More of the Day 2005-2006 to 2011-2012
2005-2006 2006-2007 2007-2008 2008-2009 2009-2010 2010-2011 2011-2012State 49.00 55.05 59.97 61.81 61.72 63.47 64.18Target 44.00 44.00 50.00 55.00 65.00 75.00 75.00
0
20
40
60
80
100
Per
cent
Source: Iowa Department of Education, Bureau of School Improvement, Information Management System, Count Files.
Special Education 245
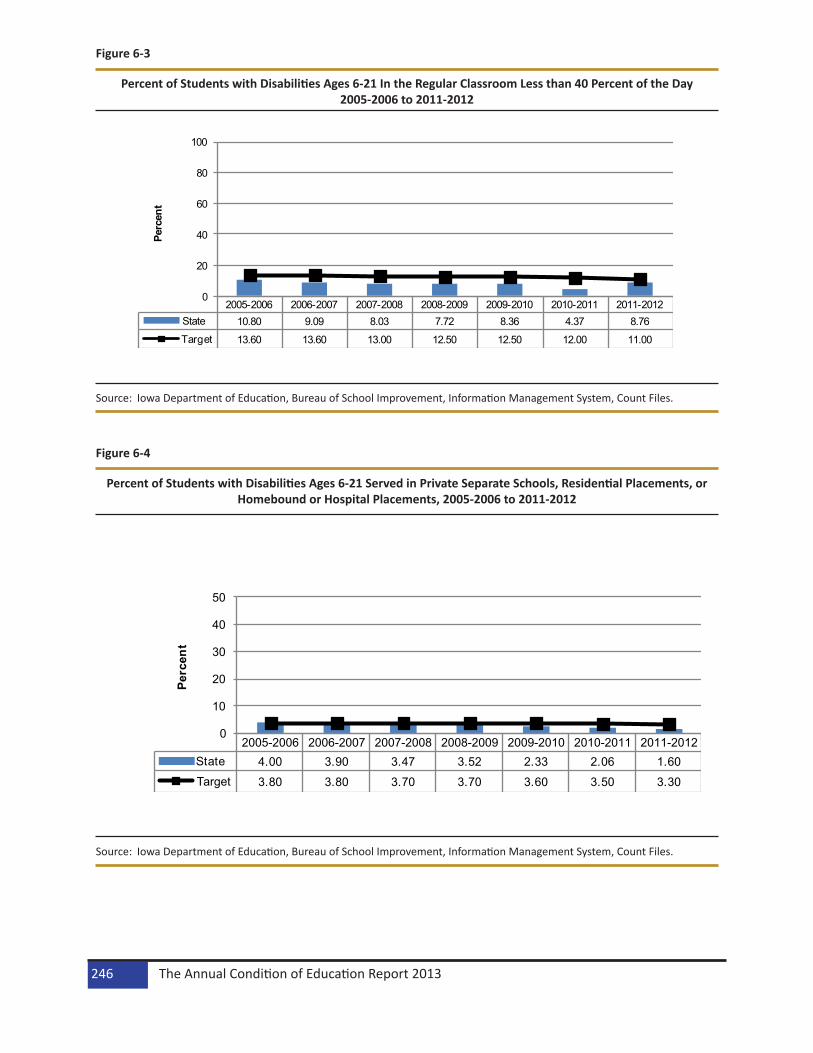
Figure 6-3
Percent of Students with Disabilities Ages 6-21 In the Regular Classroom Less than 40 Percent of the Day 2005-2006 to 2011-2012
2005-2006 2006-2007 2007-2008 2008-2009 2009-2010 2010-2011 2011-2012State 10.80 9.09 8.03 7.72 8.36 4.37 8.76
Target 13.60 13.60 13.00 12.50 12.50 12.00 11.00
0
20
40
60
80
100Pe
rcen
t
Source: Iowa Department of Education, Bureau of School Improvement, Information Management System, Count Files.
Figure 6-4
Percent of Students with Disabilities Ages 6-21 Served in Private Separate Schools, Residential Placements, or Homebound or Hospital Placements, 2005-2006 to 2011-2012
2005-2006 2006-2007 2007-2008 2008-2009 2009-2010 2010-2011 2011-2012State 4.00 3.90 3.47 3.52 2.33 2.06 1.60Target 3.80 3.80 3.70 3.70 3.60 3.50 3.30
0
10
20
30
40
50
Perc
ent
Source: Iowa Department of Education, Bureau of School Improvement, Information Management System, Count Files.
The Annual Condition of Education Report 2013246
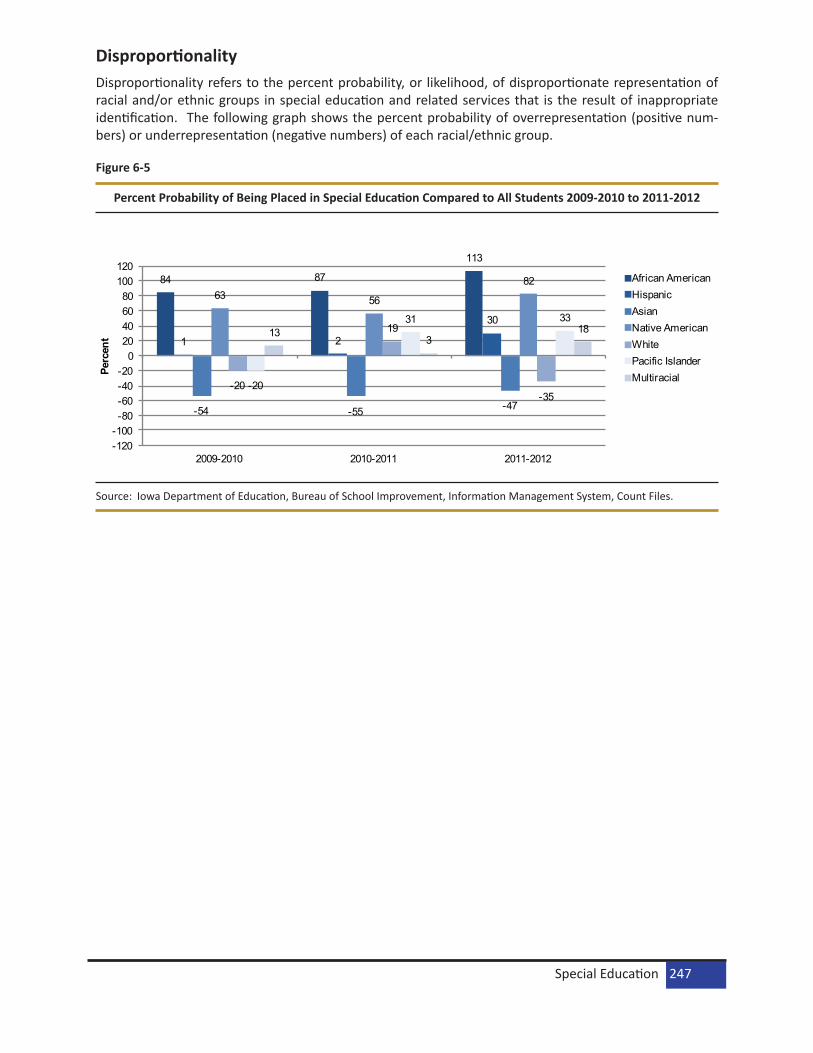
DisproportionalityDisproportionality refers to the percent probability, or likelihood, of disproportionate representation of racial and/or ethnic groups in special education and related services that is the result of inappropriate identification. The following graph shows the percent probability of overrepresentation (positive num-bers) or underrepresentation (negative numbers) of each racial/ethnic group.
Figure 6-5
Percent Probability of Being Placed in Special Education Compared to All Students 2009-2010 to 2011-2012
84 87
113
1 2
30
-54 -55 -47
63 56
82
-20
19
-35-20
31 3313
318
-120-100-80-60-40-20
020406080
100120
2009-2010 2010-2011 2011-2012
Perc
ent
African AmericanHispanicAsianNative AmericanWhitePacific IslanderMultiracial
Source: Iowa Department of Education, Bureau of School Improvement, Information Management System, Count Files.
Special Education 247
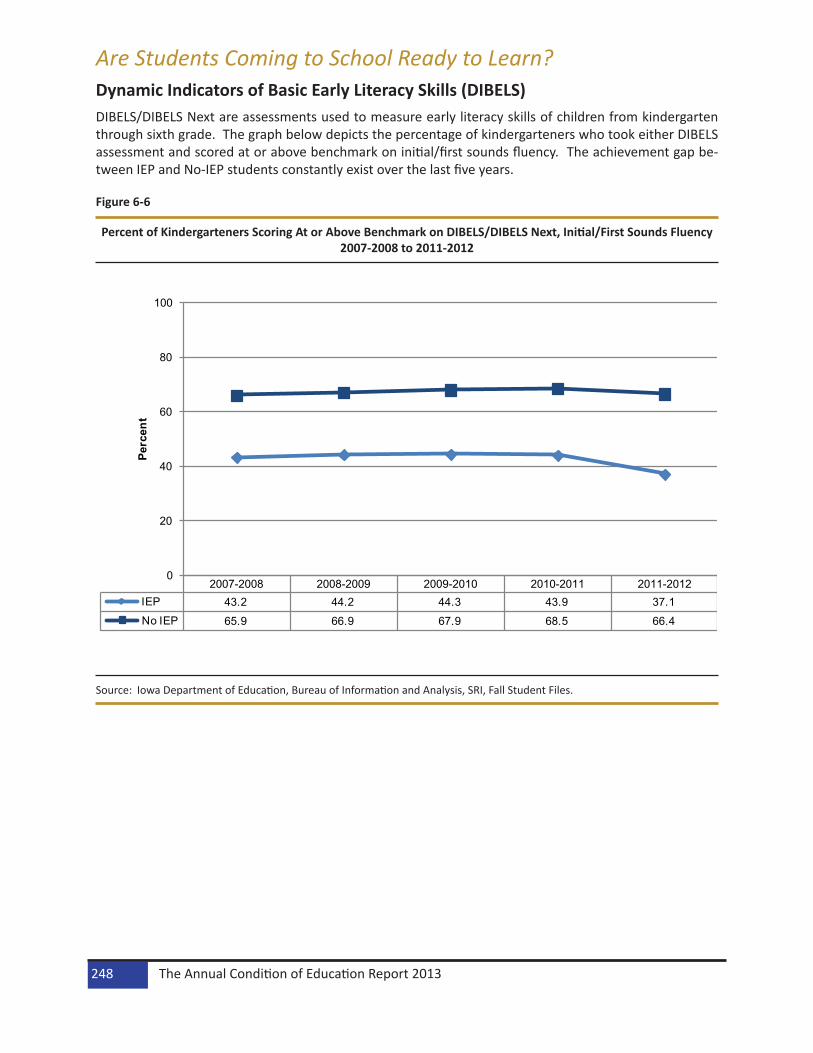
Are Students Coming to School Ready to Learn?Dynamic Indicators of Basic Early Literacy Skills (DIBELS)DIBELS/DIBELS Next are assessments used to measure early literacy skills of children from kindergarten through sixth grade. The graph below depicts the percentage of kindergarteners who took either DIBELS assessment and scored at or above benchmark on initial/first sounds fluency. The achievement gap be-tween IEP and No-IEP students constantly exist over the last five years.
Figure 6-6
Percent of Kindergarteners Scoring At or Above Benchmark on DIBELS/DIBELS Next, Initial/First Sounds Fluency 2007-2008 to 2011-2012
2007-2008 2008-2009 2009-2010 2010-2011 2011-2012IEP 43.2 44.2 44.3 43.9 37.1No IEP 65.9 66.9 67.9 68.5 66.4
0
20
40
60
80
100
Perc
ent
Source: Iowa Department of Education, Bureau of Information and Analysis, SRI, Fall Student Files.
The Annual Condition of Education Report 2013248

Are Students Going to School in Safe and Caring Environments?Positive Behavioral Interventions and Supports (PBIS)PBIS are evidence-based interventions that are integrated into the classroom activities and environment to encourage positive behavioral and academic outcomes for all children. The following graph depicts the percentage of public school buildings using PBIS, which has been constantly increasing.
Figure 6-7
Percent of Public Buildings that Use Positive Behavior Interventions and Supports 2005-2006 to 2011-2012
2005-2006 2006-2007 2007-2008 2008-2009 2009-2010 2010-2011 2011-2012% Bldgs 4.6 6.0 8.8 11.5 16.6 20.5 23.2
0
10
20
30
40
50
Perc
ent
Source: Iowa Department of Education, Bureau of School Improvement, PBIS Files.
DisciplineData on disciplinary actions taken against students with IEPs are collected and reported for students ages 6-21 who are suspended and/or expelled for a total of more than ten days in a school year. A district is considered significantly discrepant for the discipline of students with IEPs if the percent of students with IEPs suspended/expelled for the district is at least 2 percent greater than the state-wide average percent of students with IEPs suspended/expelled. The following graph presents the percent of districts with a significant discrepancy in the percentage of students with IEPs suspended/expelled for greater than ten days with respect to state targets from school year 2007-2008 to 2011-2012.
Special Education 249

Figure 6-8
Percent of Districts Significantly Discrepant in Suspension/Expulsion of Students with Disabilities Greater Than Ten Days, 2007-2008 to 2011-2012
2007-2008 2008-2009 2009-2010 2010-2011 2011-2012State 2.75 2.75 1.11 1.11 1.39Threshold 1.50 1.50 1.30 1.20 1.00
0
2
4
6
8
10
Per
cent
Sources: Iowa Department of Education, Bureau of School Improvement, Information Management System, Count Files; Bureau of Information and Analysis, SRI, Fall Student Files.
The Annual Condition of Education Report 2013250
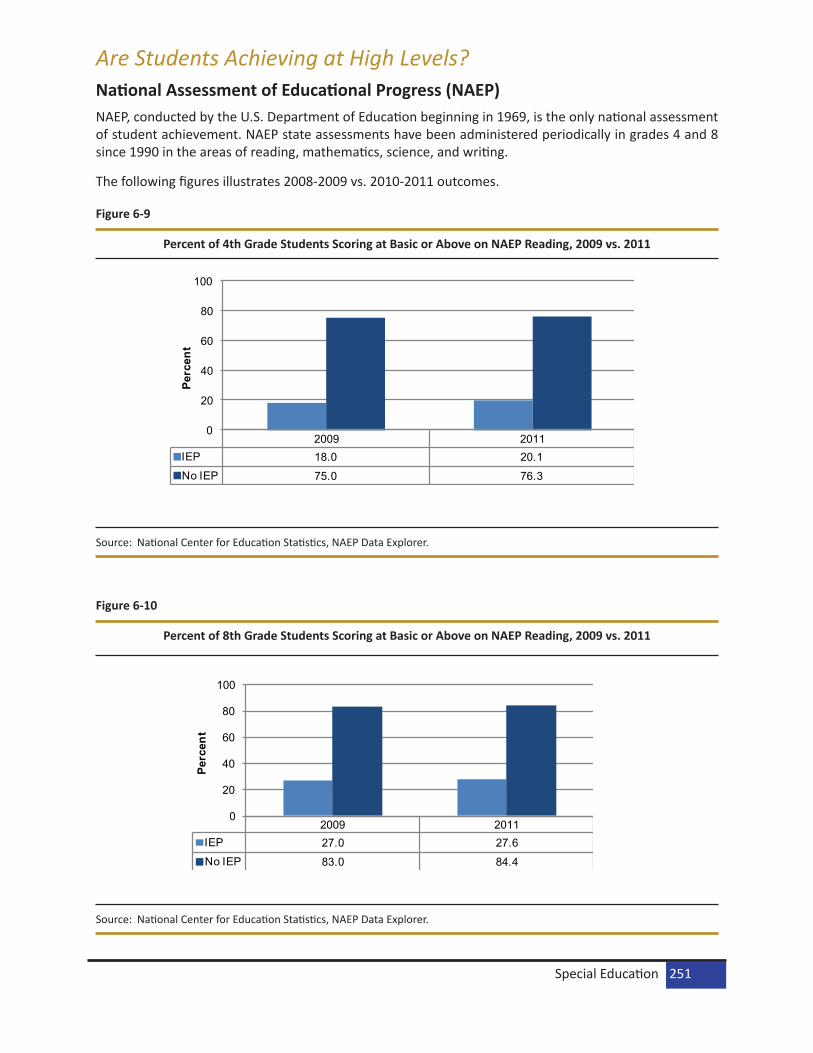
Are Students Achieving at High Levels?National Assessment of Educational Progress (NAEP) NAEP, conducted by the U.S. Department of Education beginning in 1969, is the only national assessment of student achievement. NAEP state assessments have been administered periodically in grades 4 and 8 since 1990 in the areas of reading, mathematics, science, and writing.
The following figures illustrates 2008-2009 vs. 2010-2011 outcomes.
Figure 6-9
Percent of 4th Grade Students Scoring at Basic or Above on NAEP Reading, 2009 vs. 2011
2009 2011IEP 18.0 20.1No IEP 75.0 76.3
0
20
40
60
80
100
Perc
ent
Source: National Center for Education Statistics, NAEP Data Explorer.
Figure 6-10
Percent of 8th Grade Students Scoring at Basic or Above on NAEP Reading, 2009 vs. 2011
2009 2011IEP 27.0 27.6No IEP 83.0 84.4
0
20
40
60
80
100
Perc
ent
Source: National Center for Education Statistics, NAEP Data Explorer.
Special Education 251

Figure 6-11
Percent of 4th Grade Students Scoring at Basic or Above on NAEP Mathematics, 2009 vs. 2011
2009 2011IEP 59.2 50.7No IEP 90.7 91.9
0
20
40
60
80
100Pe
rcen
t
Source: National Center for Education Statistics, NAEP Data Explorer.
Figure 6-12
Percent of 8th Grade Students Scoring at Basic or Above on NAEP Mathematics, 2009 vs. 2011
2009 2011IEP 25.0 28.6No IEP 83.1 83.5
0
20
40
60
80
100
Perc
ent
Source: National Center for Education Statistics, NAEP Data Explorer.
The Annual Condition of Education Report 2013252

Iowa AssessmentsThe standardized achievement tests, Iowa Assessments, are developed by Iowa Testing Programs (ITP) at The University of Iowa for use nationally in grades K-12. The following six graphs show the percentage of 4th, 8th, and 11th grade students proficient in reading and in math from 2007-2008 to 2011-2012. Less than 1 percent of Iowa students took the Iowa Alternative Assessment (IAA). Figures 6-13 to 6-18 show the Iowa public school student results on the Iowa Assessments and IAA. Distinctions are made between students with and without IEPs.
The gap between students with and without disabilities held fairly constant. Due to implementation of the new Iowa Assessments in 2011-2012, both IEP and No-IEP proficiency rates dropped significantly for 4th and 8th grades, in both reading and mathematics. However, the new Iowa Assessments resulted in higher 11th grade reading and mathematics proficiency rates.
Figure 6-13
Percent of 4th Grade Students Proficient in Reading on Iowa Testing Programs/Iowa Assessments and IAA2007-2008 to 2011-2012
2007-2008 2008-2009 2009-2010 2010-2011 2011-2012IEP 39.5 45.0 41.2 48.1 35.9No IEP 83.7 86.9 84.2 87.9 80.6
0
20
40
60
80
100
Perc
ent
Source: Iowa Department of Education, Bureau of Information and Analysis, AYP files.
Special Education 253

Figure 6-14
Percent of 8th Grade Students Proficient in Reading on Iowa Testing Programs/Iowa Assessments and IAA2007-2008 to 2011-2012
2007-2008 2008-2009 2009-2010 2010-2011 2011-2012IEP 25.9 27.7 28.8 29.3 20.2No IEP 79.4 81.8 80.9 82.9 73.2
0
20
40
60
80
100
Per
cent
Source: Iowa Department of Education, Bureau of Information and Analysis, AYP files.
Figure 6-15
Percent of 11th Grade Students Proficient in Reading on Iowa Testing Programs/Iowa Assessments and IAA2007-2008 to 2011-2012
2007-2008 2008-2009 2009-2010 2010-2011 2011-2012
IEP 33.0 28.6 35.2 30.4 38.9
No IEP 84.2 83.5 85.1 84.7 89.6
0
20
40
60
80
100
Perc
ent
Source: Iowa Department of Education, Bureau of Information and Analysis, AYP files.
The Annual Condition of Education Report 2013254
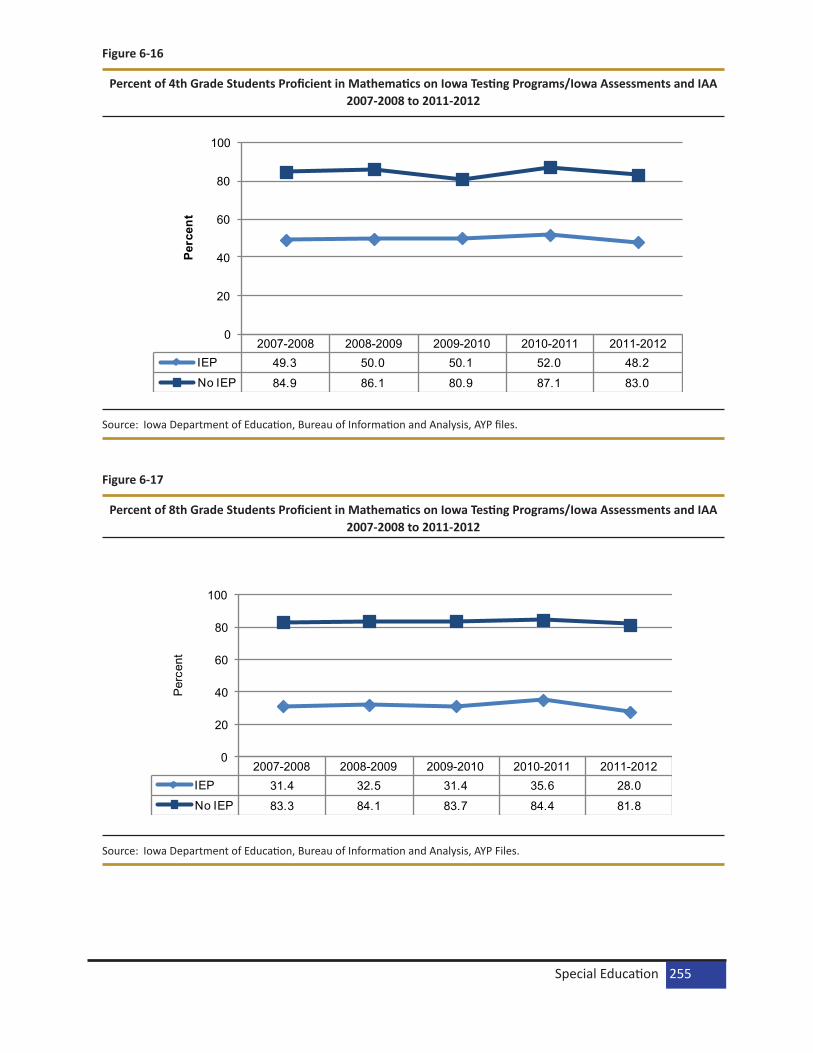
Figure 6-16
Percent of 4th Grade Students Proficient in Mathematics on Iowa Testing Programs/Iowa Assessments and IAA2007-2008 to 2011-2012
2007-2008 2008-2009 2009-2010 2010-2011 2011-2012IEP 49.3 50.0 50.1 52.0 48.2No IEP 84.9 86.1 80.9 87.1 83.0
0
20
40
60
80
100
Perc
ent
Source: Iowa Department of Education, Bureau of Information and Analysis, AYP files.
Figure 6-17
Percent of 8th Grade Students Proficient in Mathematics on Iowa Testing Programs/Iowa Assessments and IAA2007-2008 to 2011-2012
2007-2008 2008-2009 2009-2010 2010-2011 2011-2012IEP 31.4 32.5 31.4 35.6 28.0No IEP 83.3 84.1 83.7 84.4 81.8
0
20
40
60
80
100
Per
cent
Source: Iowa Department of Education, Bureau of Information and Analysis, AYP Files.
Special Education 255
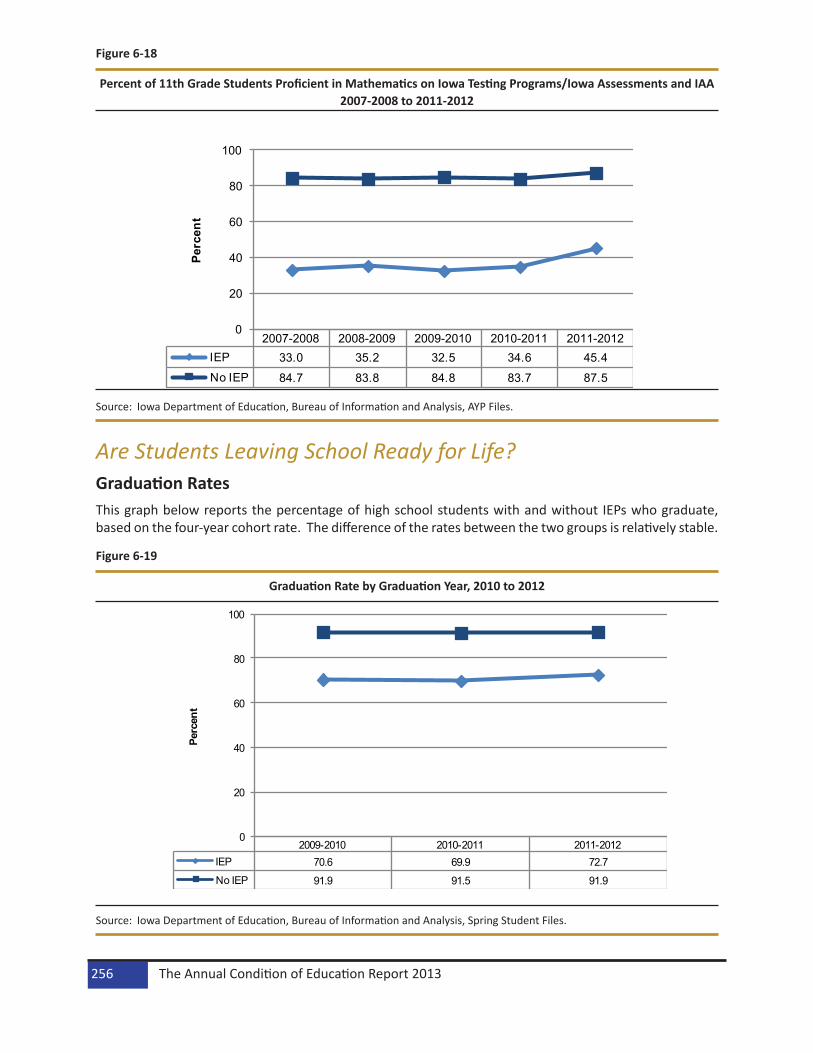
Figure 6-18
Percent of 11th Grade Students Proficient in Mathematics on Iowa Testing Programs/Iowa Assessments and IAA2007-2008 to 2011-2012
2007-2008 2008-2009 2009-2010 2010-2011 2011-2012IEP 33.0 35.2 32.5 34.6 45.4No IEP 84.7 83.8 84.8 83.7 87.5
0
20
40
60
80
100
Perc
ent
Source: Iowa Department of Education, Bureau of Information and Analysis, AYP Files.
Are Students Leaving School Ready for Life?Graduation RatesThis graph below reports the percentage of high school students with and without IEPs who graduate, based on the four-year cohort rate. The difference of the rates between the two groups is relatively stable.
Figure 6-19
Graduation Rate by Graduation Year, 2010 to 2012
2009-2010 2010-2011 2011-2012IEP 70.6 69.9 72.7
No IEP 91.9 91.5 91.9
0
20
40
60
80
100
Perc
ent
Source: Iowa Department of Education, Bureau of Information and Analysis, Spring Student Files.
The Annual Condition of Education Report 2013256

Special Education 257

FinanceInformation pertaining to revenues, property taxes, state aid, and income surtax at the state level and by enrollment category in certain cases is included in this chapter. This chapter contains the most current data available at the time of preparation. The sources of data for this chapter include the 2011-2012 Certi-fied Annual Financial Report from the Iowa Department of Education, the 2013-2014 Iowa Department of Management Aid and Levy worksheet database, and the Program and Budget Summary document from the Legislative Services Agency, Fiscal Services Division. Expenditure data are included and detailed by functions and objects. The 2000-2001 school year is used as the base year for comparison in most tables and figures.
Function Category ExpendituresThe function categories discussed in this section are broken out by instruction, student support services, staff support services, administration and central services, operations and maintenance, student transpor-tation, other support services, and community services. The breakdown of function category expenditures as a percent of general fund expenditures remained about the same over the last three years. All three years are higher than the base year in the areas of administration and instruction, and lower in mainte-nance, and support services (Table 7-1). The smallest enrollment category had the largest percentage of expenditures on Administration and Central Services when compared to the other enrollment categories (Table 7-2).
Table 7-1
Function Category Expenditures as a Percent of Total General Fund Expenditures in Iowa Public Schools 2000-2001, 2009-2010 to 2011-2012
Source: Iowa Department of Education, Division of School Finance and Support Services, Certified Annual Financial Reports.Note: Figures may not total 100 percent due to rounding.
Function Category Year2000-2001 2009-2010 2010-2011 2011-2012
Instruction 69.0% 70.8% 70.8% 70.8%Student Support Services 3.8% 3.3% 3.2% 3.2%
Staff Support Services 4.0% 3.3% 3.6% 3.6%Administration & Central Services 9.9% 10.4% 10.2% 10.2%
Operations and Maintenance 9.2% 8.3% 8.2% 8.2%Student Transportation 3.8% 3.7% 3.9% 3.9%Other Support Services 0.1% 0.0% 0.0% 0.0%
Community Services 0.2% 0.1% 0.1% 0.1%
The Annual Condition of Education Report 2013258

Table 7-2
Function Category Expenditures as a Percent of Total General Fund Expenditures in Iowa Public Schools by Enrollment Category, 2011-2012
Source: Iowa Department of Education, Division of School Finance and Support Services, Certified Annual Financial Reports.Note: Figures may not total 100 percent due to rounding.
Object Category ExpendituresObject category expenditures for school districts include salaries, benefits, purchased services, supplies, property, and other expenditures. The breakdown of object category expenditures was about the same in 2009-2010, 2010-2011 and 2011-2012 (Table 7-3). Employee benefits have increased and salaries decreased in each of 2009-2010, 2010-2011, and 2011-2012 compared to the base year; and purchased services have increased while supplies and property (equipment) have decreased. In 2011-2012, pur-chased services as a percentage of general fund expenditures decreased as the enrollment size category increased for the first four size categories and then increased in the next two size categories. Salaries as a percentage of general fund expenditures was lowest for the smallest enrollment category (Table 7-4).
Table 7-3
Object Category Expenditures as a Percent of Total General Fund Expenditures in Iowa Public Schools 2000-2001, 2009-2010, 2010-2011 and 2011-2012
Source: Iowa Department of Education, Division of School Finance and Support Services, Certified Annual Financial Reports.Notes: Property included expenditures for the initial, additional, and replacement items of equipment, vehicles, and furniture.
Figures may not total 100 percent due to rounding.
Function Category Enrollment Category< 300 300-599 600-999 1,000-
2,4992,500-7,499
7,500+ State Total
Instruction 71.3% 70.6% 70.9% 70.8% 70.1% 71.3% 70.8%Student Support Services 1.7% 2.2% 2.5% 3.0% 3.9% 3.7% 3.2%
Staff Support Services 2.3% 3.0% 3.2% 3.7% 3.7% 3.9% 3.6%Administration & Central Services 12.1% 11.2% 10.4% 10.1% 10.2% 9.8% 10.2%
Operations & Maintenance 7.5% 8.0% 8.1% 8.4% 8.4% 8.2% 8.2%Student Transportation 5.0% 5.0% 4.8% 3.9% 3.6% 3.0% 3.9%
Community Service 0.0% 0.0% 0.0% 0.0% 0.0% 0.1% 0.1%Other Support Services 0.0% 0.0% 0.0% 0.0% 0.0% 0.0% 0.0%
Object Category Year2000-2001 2009-2010 2010-2011 2011-2012
Salaries 64.0% 63.2% 61.9% 61.4%Benefits 16.1% 18.6% 18.7% 19.4%
Purchased Services 10.3% 11.0% 11.4% 11.6%Supplies 6.8% 6.0% 6.3% 6.2%Property 2.5% 1.0% 1.4% 1.3%
Other Expenditures 0.3% 0.3% 0.2% 0.2%
Finance 259

Table 7-4
Object Category Expenditures as a Percent of Total General Fund Expenditures in Iowa Public Schools by Enrollment Category, 2011-2012
Source: Iowa Department of Education, Division of School Finance and Support Services, Certified Annual Financial Reports.Note: Figures may not total 100 percent due to rounding.
Object Category Enrollment Category< 300 300-599 600-999 1,000-
2,4992,500-7.499
7,500+ State Totals
Salaries 50.7% 59.2% 60.5% 62.9% 64.0% 60.6% 61.4%Benefits 14.9% 17.5% 18.4% 19.0% 18.9% 21.4% 19.4%
Purchased Services 26.6% 14.8% 12.9% 9.9% 10.0% 10.8% 11.6%Supplies 6.6% 7.1% 6.7% 6.6% 5.7% 5.6% 6.2%Property 0.8% 1.1% 1.2% 1.3% 1.3% 1.4% 1.3%
Other Objects 0.4% 0.4% 0.3% 0.3% 0.1% 0.2% 0.2%
The Annual Condition of Education Report 2013260
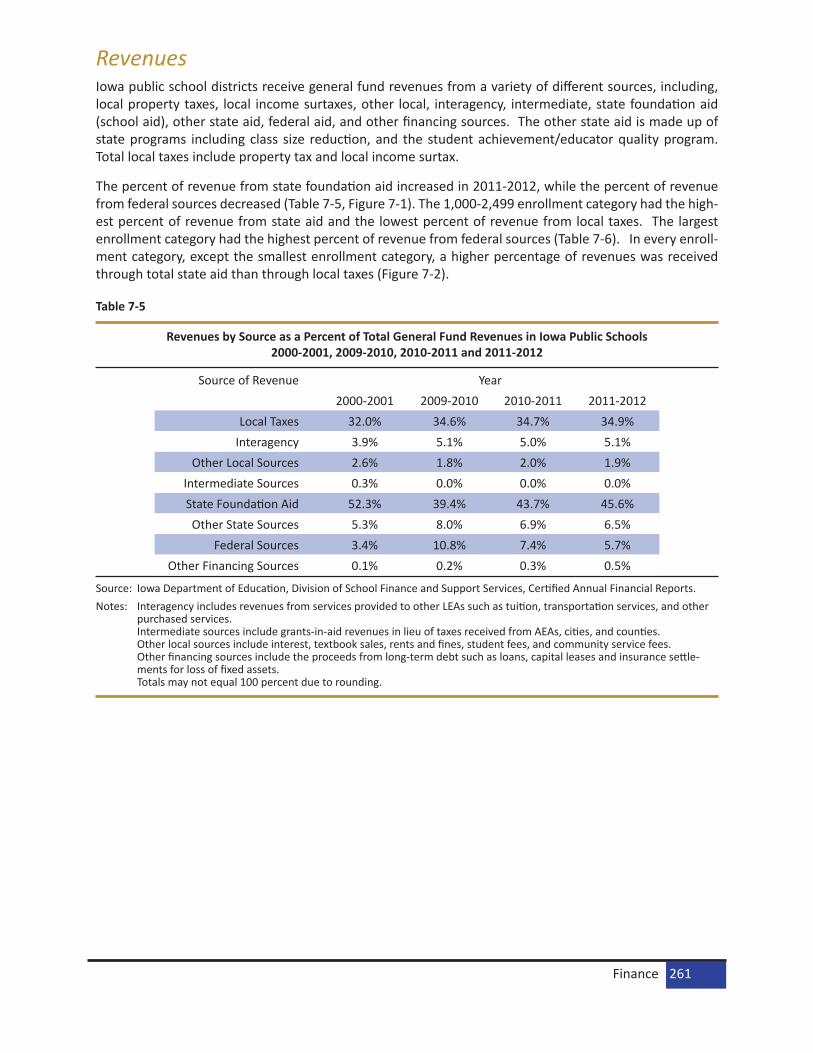
RevenuesIowa public school districts receive general fund revenues from a variety of different sources, including, local property taxes, local income surtaxes, other local, interagency, intermediate, state foundation aid (school aid), other state aid, federal aid, and other financing sources. The other state aid is made up of state programs including class size reduction, and the student achievement/educator quality program. Total local taxes include property tax and local income surtax.
The percent of revenue from state foundation aid increased in 2011-2012, while the percent of revenue from federal sources decreased (Table 7-5, Figure 7-1). The 1,000-2,499 enrollment category had the high-est percent of revenue from state aid and the lowest percent of revenue from local taxes. The largest enrollment category had the highest percent of revenue from federal sources (Table 7-6). In every enroll-ment category, except the smallest enrollment category, a higher percentage of revenues was received through total state aid than through local taxes (Figure 7-2).
Table 7-5
Revenues by Source as a Percent of Total General Fund Revenues in Iowa Public Schools 2000-2001, 2009-2010, 2010-2011 and 2011-2012
Source: Iowa Department of Education, Division of School Finance and Support Services, Certified Annual Financial Reports.Notes: Interagency includes revenues from services provided to other LEAs such as tuition, transportation services, and other
purchased services. Intermediate sources include grants-in-aid revenues in lieu of taxes received from AEAs, cities, and counties. Other local sources include interest, textbook sales, rents and fines, student fees, and community service fees. Other financing sources include the proceeds from long-term debt such as loans, capital leases and insurance settle-ments for loss of fixed assets. Totals may not equal 100 percent due to rounding.
Source of Revenue Year2000-2001 2009-2010 2010-2011 2011-2012
Local Taxes 32.0% 34.6% 34.7% 34.9%Interagency 3.9% 5.1% 5.0% 5.1%
Other Local Sources 2.6% 1.8% 2.0% 1.9%Intermediate Sources 0.3% 0.0% 0.0% 0.0%State Foundation Aid 52.3% 39.4% 43.7% 45.6%Other State Sources 5.3% 8.0% 6.9% 6.5%
Federal Sources 3.4% 10.8% 7.4% 5.7%Other Financing Sources 0.1% 0.2% 0.3% 0.5%
Finance 261
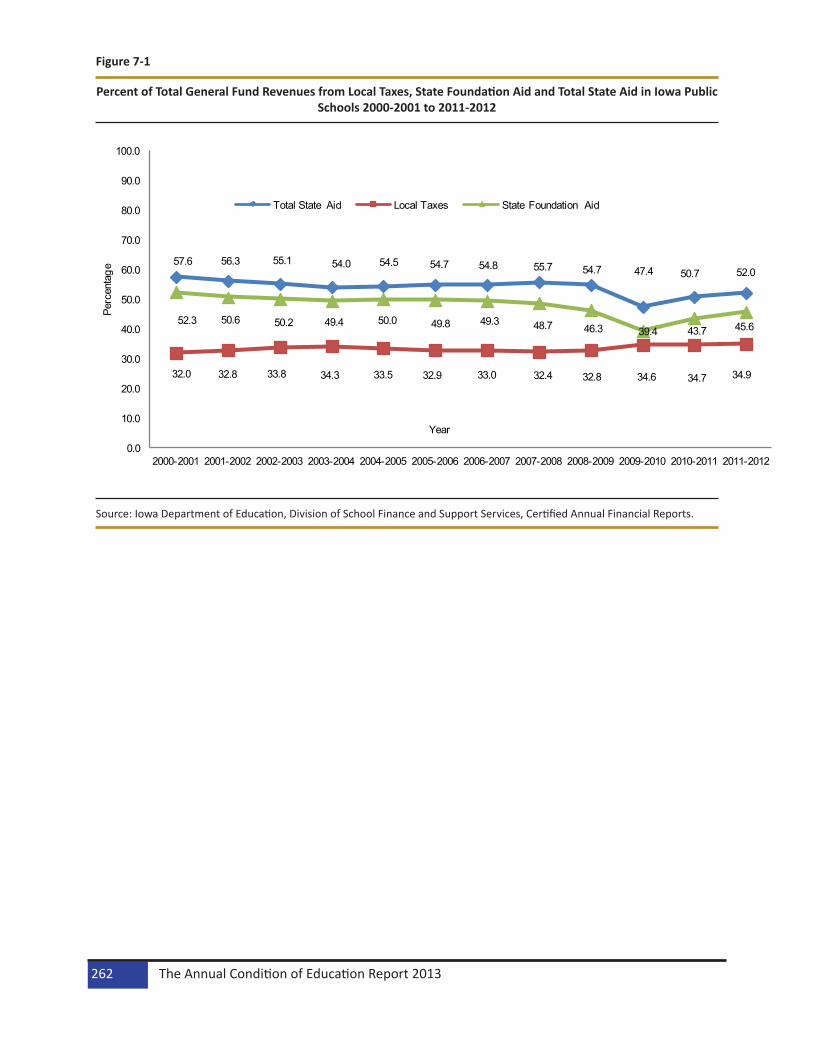
Figure 7-1
Percent of Total General Fund Revenues from Local Taxes, State Foundation Aid and Total State Aid in Iowa Public Schools 2000-2001 to 2011-2012
57.6 56.3 55.1 54.0 54.5 54.7 54.8 55.7 54.7 47.4 50.7 52.0
32.0 32.8 33.8 34.3 33.5 32.9 33.0 32.4 32.8 34.6 34.7 34.9
52.3 50.6 50.2 49.4 50.0 49.8 49.3 48.7 46.3 39.4 43.7 45.6
0.0
10.0
20.0
30.0
40.0
50.0
60.0
70.0
80.0
90.0
100.0
2000-2001 2001-2002 2002-2003 2003-2004 2004-2005 2005-2006 2006-2007 2007-2008 2008-2009 2009-2010 2010-2011 2011-2012
Perc
enta
ge
Year
Total State Aid Local Taxes State Foundation Aid
Source: Iowa Department of Education, Division of School Finance and Support Services, Certified Annual Financial Reports.
The Annual Condition of Education Report 2013262
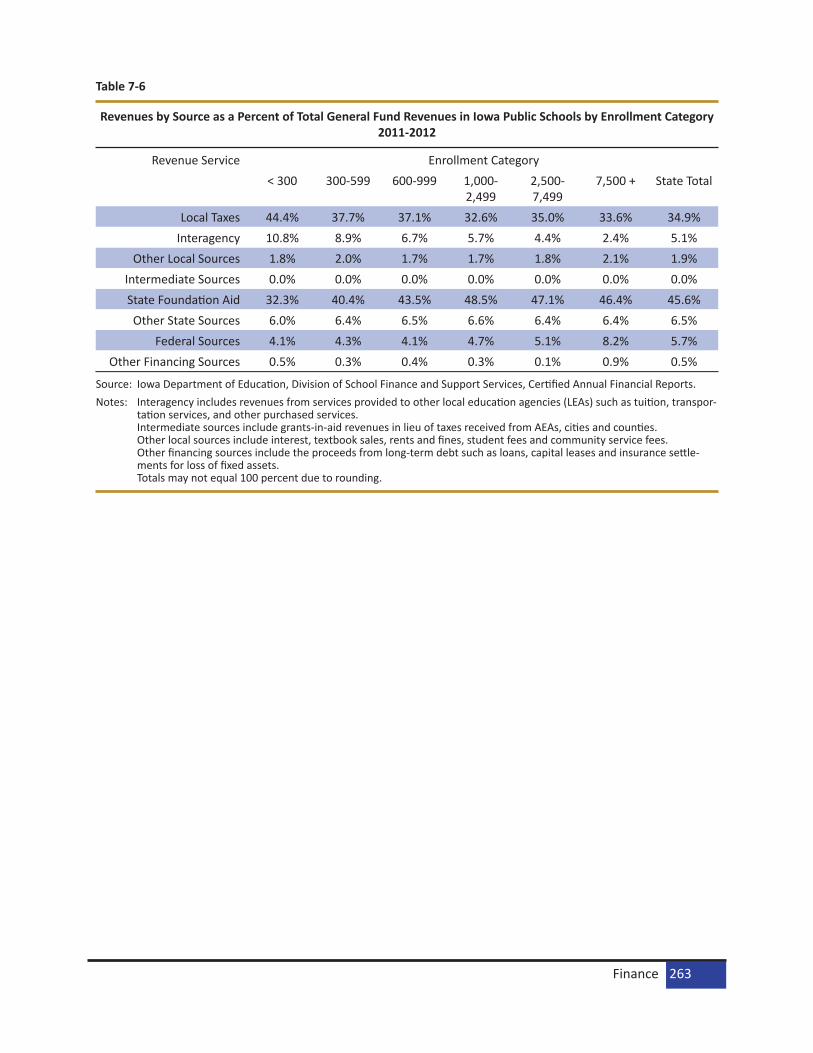
Table 7-6
Revenues by Source as a Percent of Total General Fund Revenues in Iowa Public Schools by Enrollment Category 2011-2012
Source: Iowa Department of Education, Division of School Finance and Support Services, Certified Annual Financial Reports.Notes: Interagency includes revenues from services provided to other local education agencies (LEAs) such as tuition, transpor-
tation services, and other purchased services. Intermediate sources include grants-in-aid revenues in lieu of taxes received from AEAs, cities and counties. Other local sources include interest, textbook sales, rents and fines, student fees and community service fees. Other financing sources include the proceeds from long-term debt such as loans, capital leases and insurance settle-ments for loss of fixed assets. Totals may not equal 100 percent due to rounding.
Revenue Service Enrollment Category< 300 300-599 600-999 1,000-
2,4992,500-7,499
7,500 + State Total
Local Taxes 44.4% 37.7% 37.1% 32.6% 35.0% 33.6% 34.9%Interagency 10.8% 8.9% 6.7% 5.7% 4.4% 2.4% 5.1%
Other Local Sources 1.8% 2.0% 1.7% 1.7% 1.8% 2.1% 1.9%Intermediate Sources 0.0% 0.0% 0.0% 0.0% 0.0% 0.0% 0.0%State Foundation Aid 32.3% 40.4% 43.5% 48.5% 47.1% 46.4% 45.6%Other State Sources 6.0% 6.4% 6.5% 6.6% 6.4% 6.4% 6.5%
Federal Sources 4.1% 4.3% 4.1% 4.7% 5.1% 8.2% 5.7%Other Financing Sources 0.5% 0.3% 0.4% 0.3% 0.1% 0.9% 0.5%
Finance 263

Figure 7-2
Percent of Total General Fund Revenues from Local Taxes and Total State Aid in Iowa Public Schools by Enrollment Category 2011-2012
44.4
37.7 37.1
32.635.0 33.6 34.9
38.3
46.850.0
55.053.5 52.8 52.0
0.0
10.0
20.0
30.0
40.0
50.0
60.0
<300 300-599 600-999 1,000-2,499 2,500-7,499 7,500+ State
Per
cent
Enrollment Category
Local Taxes=34.9%
Total State Aid=52.0%
Source: Iowa Department of Education, Division of School Finance and Support Services, Certified Annual Financial Reports.
Taxable ValuationThe adjusted-equalized value of real property is represented by taxable valuation. There are 112 assessing jurisdictions in the state of Iowa. The property in each of these jurisdictions is equalized by the state through the Department of Revenue every two years. Assessments are adjusted for classes of property to actual values, except for agriculture land values that are based on productivity. Adjustments are based on investigations and appraisals done by the state and on assessments/sales ratio studies. The agriculture land use productivity formula is based on agriculture prices and expenses. An adjustment is ordered by the state if reported valuation is more than 5 percent above or below those determined by the state. Taxes are assessed against equalized property values and the rates are expressed per $1,000 of valuation.
The amount of state aid a school district will receive is based on the taxable valuation in the school district. The Iowa school foundation formula requires all school districts to levy a uniform rate of $5.40 per $1,000 taxable valuation. State aid is provided to adjust for the different amounts of revenue raised in each district. The relative property wealth in a school district is the primary factor in determining the property tax rates.
In 2013-2014, the three largest enrollment categories had an average per pupil valuation below the state average (Table 7-7). The taxable valuation per pupil increases because of increases in valuation as well as decreases in enrollment. The 600-999 enrollment category had the biggest range in taxable valuation per pupil in 2013-2014 (Table 7-8). The highest enrollment category had the lowest taxable valuation per pupil and the lowest enrollment category had the highest taxable valuation per pupil.
The Annual Condition of Education Report 2013264
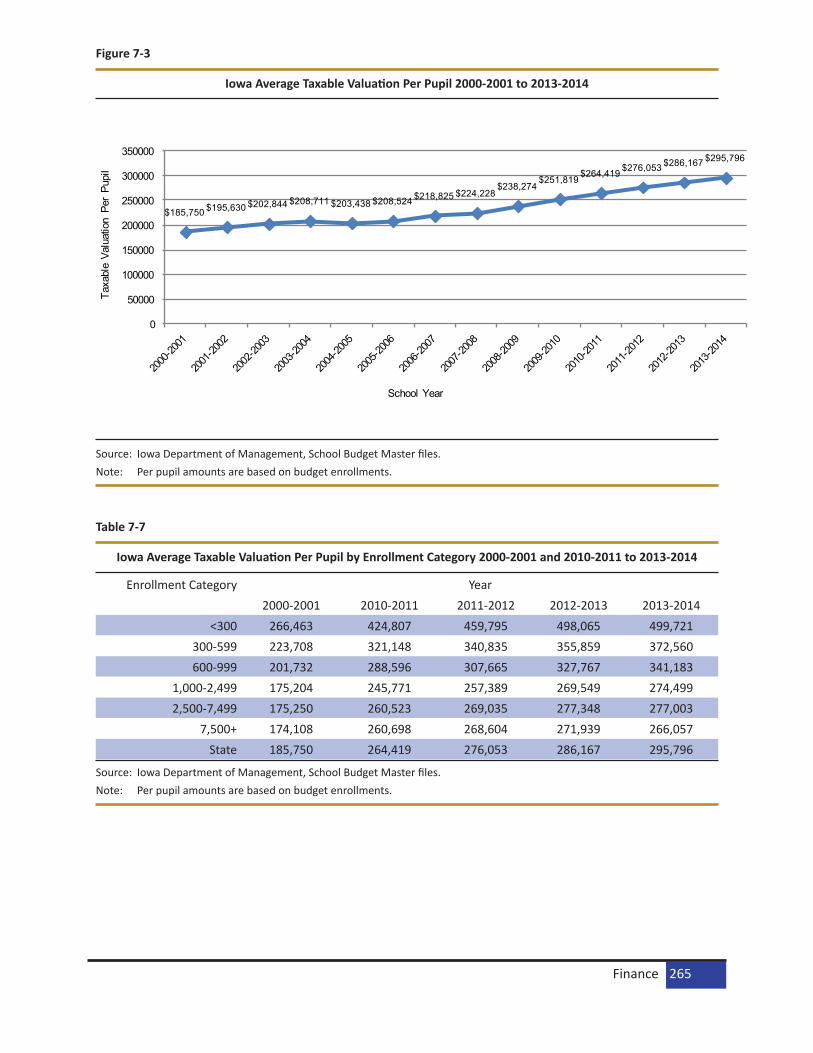
Figure 7-3
Iowa Average Taxable Valuation Per Pupil 2000-2001 to 2013-2014
$185,750 $195,630 $202,844 $208,711 $203,438 $208,524 $218,825 $224,228$238,274
$251,819$264,419 $276,053 $286,167 $295,796
0
50000
100000
150000
200000
250000
300000
350000
Taxa
ble
Valu
atio
n Pe
r Pu
pil
School Year
Source: Iowa Department of Management, School Budget Master files.Note: Per pupil amounts are based on budget enrollments.
Table 7-7
Iowa Average Taxable Valuation Per Pupil by Enrollment Category 2000-2001 and 2010-2011 to 2013-2014
Source: Iowa Department of Management, School Budget Master files.Note: Per pupil amounts are based on budget enrollments.
Enrollment Category Year2000-2001 2010-2011 2011-2012 2012-2013 2013-2014
<300 266,463 424,807 459,795 498,065 499,721300-599 223,708 321,148 340,835 355,859 372,560600-999 201,732 288,596 307,665 327,767 341,183
1,000-2,499 175,204 245,771 257,389 269,549 274,4992,500-7,499 175,250 260,523 269,035 277,348 277,003
7,500+ 174,108 260,698 268,604 271,939 266,057State 185,750 264,419 276,053 286,167 295,796
Finance 265
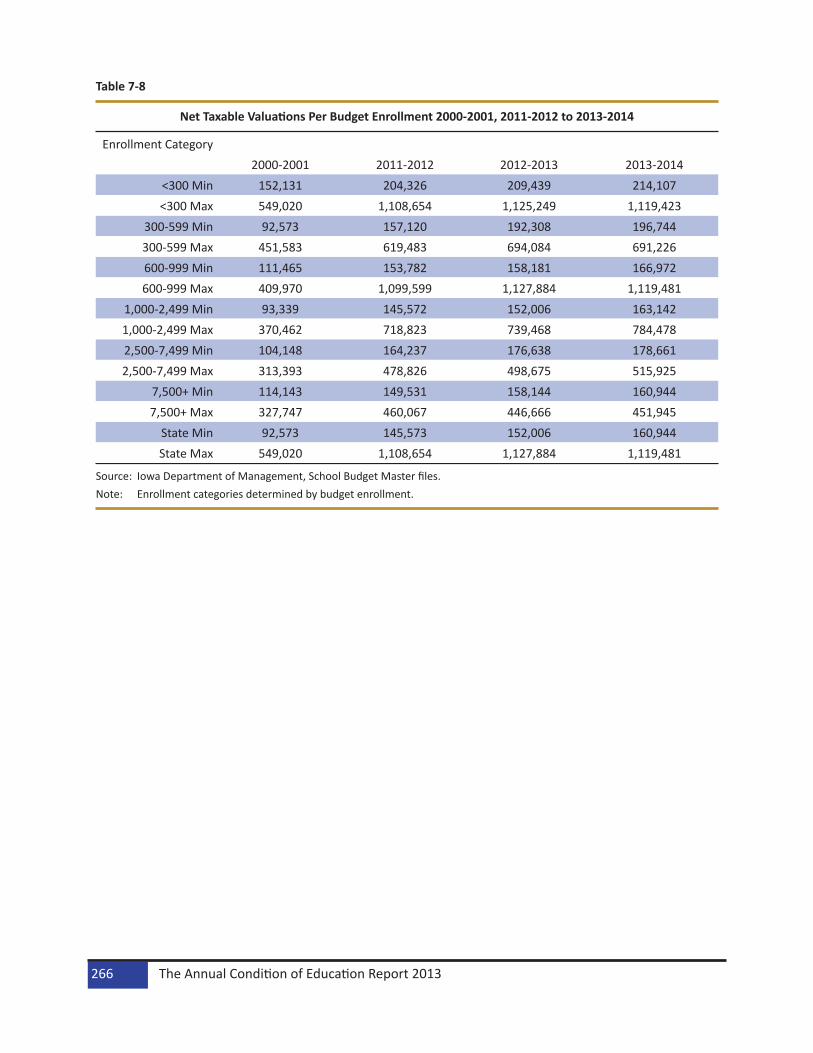
Table 7-8
Net Taxable Valuations Per Budget Enrollment 2000-2001, 2011-2012 to 2013-2014
Source: Iowa Department of Management, School Budget Master files.Note: Enrollment categories determined by budget enrollment.
Enrollment Category2000-2001 2011-2012 2012-2013 2013-2014
<300 Min 152,131 204,326 209,439 214,107<300 Max 549,020 1,108,654 1,125,249 1,119,423
300-599 Min 92,573 157,120 192,308 196,744300-599 Max 451,583 619,483 694,084 691,226600-999 Min 111,465 153,782 158,181 166,972600-999 Max 409,970 1,099,599 1,127,884 1,119,481
1,000-2,499 Min 93,339 145,572 152,006 163,1421,000-2,499 Max 370,462 718,823 739,468 784,4782,500-7,499 Min 104,148 164,237 176,638 178,6612,500-7,499 Max 313,393 478,826 498,675 515,925
7,500+ Min 114,143 149,531 158,144 160,9447,500+ Max 327,747 460,067 446,666 451,945
State Min 92,573 145,573 152,006 160,944State Max 549,020 1,108,654 1,127,884 1,119,481
The Annual Condition of Education Report 2013266

Expenditures Per PupilThe general fund expenditures per pupil include expenditures for instruction, student support services, administration, operation and maintenance, student transportation, and central support. Expenditures per pupil are calculated by dividing the total general fund expenditures by the certified enrollment. Ex-penditures for community service, adult education, nonpublic education, area education agency revenues from other school districts and area education agencies for services sold are not included in the per pupil calculation.
The smallest enrollment category had the highest average general fund per pupil expenditures in all years presented in Table 7-9. The 1,000-2,499 enrollment category had the lowest average general fund per pupil expenditures in all years presented. Table 7-10 and Figure 7-4 display the average per pupil expen-ditures for Iowa, the Midwest states and the nation. The National Education Association (NEA) collected and estimated the data. In 2011-2012, Iowa ranked 35th in the Nation in average expenditures per pupil. Nebraska, South Dakota and North Dakota ranked lower than Iowa.
Table 7-9
Average General Fund Per Pupil Expenditures for Iowa Public Schools by Enrollment Category 2000-2001, 2009-2010 to 2011-2012
Source: Iowa Department of Education, Division of School Finance and Support Services, Certified Enrollment and Certified Annual Financial Reports.
Enrollment Category Year2000-2001 2009-2010 2010-2011 2011-2012
< 300 $5,605 $9,658 $9,874 $10,094300-599 $5,106 $8,630 $8,854 $9,021600-999 $4,988 $8,348 $8,504 $8,766
1,000-2,499 $4,881 $8,183 $8,272 $8,5022,500-7,499 $5,055 $8,326 $8,385 $8,605
7,500 + $5,461 $9,252 $9,361 $9,524State $5,119 $8,603 $8,743 $8,948
Finance 267

Table 7-10
Iowa and Midwest States Public School Average Total Current Expenditures Per Pupil 2000-2001, 2010-2011 and 2011-2012
Source: National Education Association (NEA), Rankings and Estimates of School Statistics.Note: *2010-2011 figures have been adjusted. **2011-2012 are estimated by NEA.
State/Nation Year2000-2001 2010-2011* 2011-2012**
Per Pupil Expenditures
National Rank
Per Pupil Expenditures
National Rank
Per Pupil Expenditures
National Rank
Nation 7,296 10,669 10,834Iowa 6,434 34 9,425 35 9,435 35
Illinois 8,293 11 11,055 20 12,455 15Indiana 7,567 18 10,468 21 10,820 22Kansas 7,031 23 9,505 34 9,518 33
Michigan 8,127 13 12,799 14 13,313 14Minnesota 7,320 21 11,150 18 11,398 19
Missouri 6,323 38 9,422 36 9,760 31Nebraska 6,395 35 8,912 40 9,402 36
North Dakota 4,607 50 11,081 19 8,757 41Ohio 6,952 25 9,770 30 9,842 30
South Dakota 6,269 39 9,112 38 9,218 37Wisconsin 8,205 12 11,838 15 12,172 16
The Annual Condition of Education Report 2013268
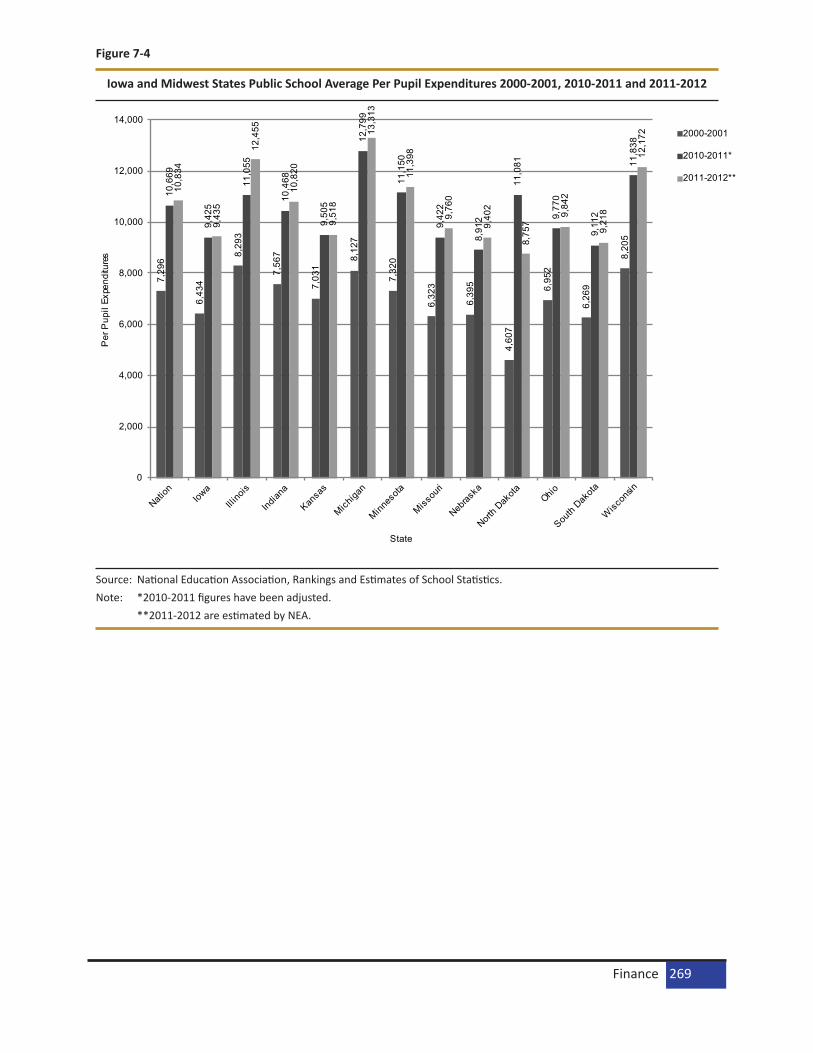
Figure 7-4
Iowa and Midwest States Public School Average Per Pupil Expenditures 2000-2001, 2010-2011 and 2011-2012
7,29
6
6,43
4
8,29
3
7,56
7
7,03
1
8,12
7
7,32
0
6,32
3
6,39
5
4,60
7
6,95
2
6,26
9
8,20
5
10,6
69
9,42
5
11,0
55
10,4
68
9,50
5
12,7
99
11,1
50
9,42
2
8,91
2
11,0
81
9,77
0
9,11
2
11,8
38
10,8
34
9,43
5
12,4
55
10,8
20
9,51
8
13,3
13
11,3
98
9,76
0
9,40
2
8,75
7
9,84
2
9,21
8
12,1
72
0
2,000
4,000
6,000
8,000
10,000
12,000
14,000P
er P
upil
Expe
nditu
res
State
2000-2001
2010-2011*
2011-2012**
Source: National Education Association, Rankings and Estimates of School Statistics.Note: *2010-2011 figures have been adjusted. **2011-2012 are estimated by NEA.
Finance 269

State AidThis section presents data on state aid including School Foundation Aid, Instructional Support, Class Size Reduc-tion, Early Intervention, and Student Achievement/Educator Quality. State aid is received by the districts through appropriations made from the state’s general fund each year. There are certain programs that have been added or removed in recent years. Funding for the Student Achievement/Educator Quality program was initiated in 2001-2002. Funding for the Technology/School Improvement program ended in 2002-2003. Funding for Phase III of Educational Excellence was discontinued in 2003-2004 and Phase I was discontinued and Phase II was rolled into the school finance formula in 2009-2010. In 1996-1997 and 1999-2000, changes were made to school foundation aid laws that impacted state aid amounts. The state foundation level was increased from 83.0 percent to 87.5 percent in 1996-1997. In 1999-2000, the special education foundation level increased from 79.0 percent to 87.5 percent. The changes to the foundation level did not increase school district budgets, but did increase the amount of state aid and lowered the amount of property tax.
Table 7-11 shows the General Fund appropriations and initial state aid to school districts for multiple years. The General Assembly initially appropriated $6.5 billion and initial state aid to districts was about $2.7 billion or 41.8 percent of the general fund appropriations in the 2013-2014 school year (fiscal year 2014). State aid to districts and total general fund appropriations increased between 2012-2013 and 2013-2014.
Table 7-11
Total Iowa Government Appropriations (In Millions) 2000-2001 to 2013-2014
Source: Legislative Services Agency, Fiscal Bureau, Session Fiscal Report, and Fiscal Tracking Report.Notes: Includes school foundation aid, educational excellence, instructional support, technology/school improvement, class
size reduction/school improvement, and teacher quality/compensation appropriations. 2011-2012 and 2012-2013 numbers are revised.
Year Initial State Aid to Districts
Initial General Fund
Appropriations
Initial Percent Spent on Education
Final State Aid to Districts
Final General Fund Appropriation
Final Percent Spent on Education
2013-2014 2,714.8 6,490.1 41.8% Not currently available2012-2013 2,653.7 6,222.6 42.6% 2,652.6 6,580.4 40.3%2011-2012 2,629.3 6,010.1 43.7% 2,623.8 6,008.0 43.7%2010-2011 2,668.5 5,279.2 50.5% 2,451.0 5,351.9 45.8%2009-2010 2,595.1 5,768.3 45.0% 2,150.8 5,303.3 40.6%2008-2009 2,584.0 6,133.1 42.1% 2,499.7 5,959.0 41.9%2007-2008 2,417.2 5,856.3 41.3% 2,415.1 5,898.4 40.9%2006-2007 2,252.8 5,296.5 42.5% 2,251.5 5,392.9 41.7%2005-2006 2,131.5 4,938.6 43.2% 2,131.9 5,031.7 42.4%2004-2005 2,025.6 4,464.2 45.4% 2,025.7 4,606.2 44.0%2003-2004 1,963.5 4,513.6 43.5% 1,919.4 4,500.5 42.6%2002-2003 1,935.7 4,509.9 42.9% 1,935.7 4,534.4 42.7%2001-2002 1,978.3 4,873.7 40.6% 1,899.1 4,607.1 41.2%2000-2001 1,893.1 4,880.1 38.8% 1,897.4 4,886.9 38.8%
The Annual Condition of Education Report 2013270
Property TaxesThe school aid formula for districts is funded by a combination of state foundation aid and the uniform ($5.40/$1,000 of taxable valuation) and additional levies. School districts may levy other local taxes along with the uniform and additional levies. The uniform levy, the additional levy, the instructional support levy, and the educational improvement levy are property taxes that are included in the school district’s general fund. The management levy, the regular physical plant and equipment levy (PPEL), the voter-approved physical plant and equipment levy (VPPEL), the public education and recreation levy (PERL) and debt services levy are other school district property taxes for specified purposes that are not included in the general fund.
Data on general fund property tax rates, management fund property tax rates, regular and voter-approved physical plant and equipment levy (PPEL) tax rates, the public education and recreation levy (PERL) tax rates, and debt service levy tax rates in 2013-2014 are found in Table 7-12.
All districts levy the general fund property tax. The three largest enrollment categories had an average general fund property tax rate greater than the state average. There are no restrictions for the manage-ment levy rate. The purpose for which the proceeds may be used, however, is restricted to paying tort claims, insurance premiums (except health insurance), unemployment benefits, and the cost of retire-ment benefits. The majority of the districts in 2013-2014 levy for the management fund. The regular physical plant and equipment levy (PPEL) is a levy the school board may approve that is up to $0.33 per $1,000 of taxable valuation. The school board may also request voter approval to increase the levy up to an additional $1.34 per $1,000 taxable valuation. The three largest districts have average voter-approved PPEL rates higher than the state average.
The Public Education and Recreation Levy (PERL) or playground levy must be approved by voters within the school districts. Funds from PERL must be used for the purchase of playgrounds and recreational facilities and for the costs of community education. The maximum rate for PERL is $0.135 per $1,000 of taxable valuation. In 2013-2014, 5.2 percent of the districts levy for PERL. Usage of the debt service levy is tied to passage of a bond issue, which requires the approval of 60 percent of the electorate within the school district. A little over half of the school districts use the debt services levy.
Table 7-13 lists the total taxes and property tax amounts for the general fund, management fund, regular PPEL, voter-approved PPEL, PERL and debt services levies for 2013-2014. The smallest enrollment category had the highest average tax per pupil for all taxes listed.
Finance 271

Table 7-12
Property Tax Rates and Number of Districts with Levies by Enrollment Category 2013-2014
Source: Iowa Department of Management, Master Budget files.Notes: PPEL means Physical Plant and Equipment Levy.
Average Tax Rate per $1,000 Valuation.
Enrollment Category<300 300-599 600-999 1,000-
2,4992,500-7,499
7,500+ State
Number of Districts 45 106 87 76 21 11 346
Number of Districts with General Fund Levy
45 106 87 76 21 11 346
Percent of Districts with General Fund Levy
100.0% 100.0% 100.0% 100.0% 100.0% 100.0% 100.0%
Average Tax Rate with General Fund Levy
10.2784 10.5029 10.8481 11.3368 12.2633 13.1386 10.9336
Number of Districts with Management Fund Levy
43 100 87 76 21 11 338
Percent of Districts with Management Fund Levy
95.6% 94.3% 100.0% 100.0% 100.0% 100.0% 97.7%
Average Management Levy Tax Rate
1.1309 1.1377 1.0450 1.1032 0.8870 1.1629 1.0905
Number of Districts with Regular PPEL Levy
43 102 84 75 20 11 335
Percent of Districts with Regular PPEL Levy
95.6% 96.2% 96.6% 98.7% 95.2% 100.0% 96.8%
Average Regular PPEL Tax Rate 0.31 0.31 0.32 0.32 0.33 0.32 0.32
Number of Districts with Voter-Approved PPEL Levy
31 70 58 57 17 10 243
Percent of Districts with Voter-Approved PPEL Levy
68.9% 66.0% 66.7% 75.0% 81.0% 90.9% 70.2%
Average Voter-Approved PPEL Tax Rate
0.5094 0.5019 0.5148 0.5645 0.7768 0.8774 0.5490
Number of Districts with PERL Levy
3 5 5 0 3 2 18
Percent of Districts with PERL Levy
6.7% 4.7% 5.7% 0.0% 14.3% 18.2% 5.2%
Average PERL Tax Rate 0.0090 0.0063 0.0072 0 0.0193 0.0246 0.0068
Number of Districts with Debt Services Levy
13 59 47 46 11 4 180
Percent of Districts with Debt Services Levy
28.9% 55.7% 54.0% 60.5% 52.4% 36.4% 52.0%
Average Debt Services Tax Rate
0.5331 1.1074 0.9157 1.3654 1.1391 0.7025 1.0312
The Annual Condition of Education Report 2013272
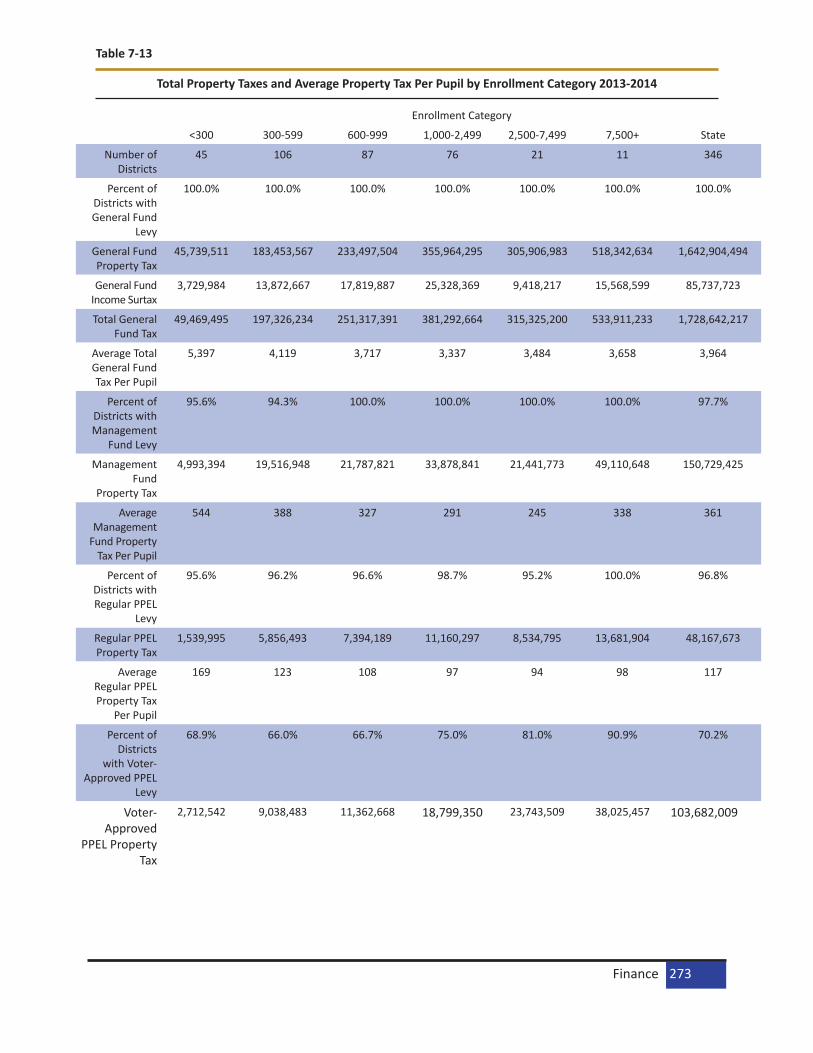
Table 7-13
Total Property Taxes and Average Property Tax Per Pupil by Enrollment Category 2013-2014
Enrollment Category
<300 300-599 600-999 1,000-2,499 2,500-7,499 7,500+ State
Number of Districts
45 106 87 76 21 11 346
Percent of Districts with General Fund
Levy
100.0% 100.0% 100.0% 100.0% 100.0% 100.0% 100.0%
General Fund Property Tax
45,739,511 183,453,567 233,497,504 355,964,295 305,906,983 518,342,634 1,642,904,494
General Fund Income Surtax
3,729,984 13,872,667 17,819,887 25,328,369 9,418,217 15,568,599 85,737,723
Total General Fund Tax
49,469,495 197,326,234 251,317,391 381,292,664 315,325,200 533,911,233 1,728,642,217
Average Total General Fund Tax Per Pupil
5,397 4,119 3,717 3,337 3,484 3,658 3,964
Percent of Districts with Management
Fund Levy
95.6% 94.3% 100.0% 100.0% 100.0% 100.0% 97.7%
Management Fund
Property Tax
4,993,394 19,516,948 21,787,821 33,878,841 21,441,773 49,110,648 150,729,425
Average Management
Fund Property Tax Per Pupil
544 388 327 291 245 338 361
Percent of Districts with Regular PPEL
Levy
95.6% 96.2% 96.6% 98.7% 95.2% 100.0% 96.8%
Regular PPEL Property Tax
1,539,995 5,856,493 7,394,189 11,160,297 8,534,795 13,681,904 48,167,673
Average Regular PPEL Property Tax
Per Pupil
169 123 108 97 94 98 117
Percent of Districts
with Voter-Approved PPEL
Levy
68.9% 66.0% 66.7% 75.0% 81.0% 90.9% 70.2%
Voter-Approved
PPEL Property Tax
2,712,542 9,038,483 11,362,668 18,799,350 23,743,509 38,025,457 103,682,009
Finance 273

Table 7-13 (…continued)
Source: Iowa Department of Management, Master Budget files.Notes: PPEL means Physical Plant and Equipment Levy.
Average Tax Rate per $1,000 Valuation.
Enrollment Category<300 300-599 600-999 1,000-2,499 2,500-7,499 7,500+ State
Voter-Approved
PPEL Income Surtax
612,750 2,240,342 2,449,198 4,659,428 0 0 9,961,718
Total Voter-Approved
PPEL Tax
3,325,292 11,278,825 13,811,866 23,458,778 23,743,509 38,025,457 113,643,727
Average Total Voter-
Approved PPEL Tax Per
Pupil
334 243 211 205 254 294 241
Percent of Districts with
PERL Levy
6.7% 4.7% 5.7% 0.0% 14.3% 18.2% 5.2%
PERL Property Tax
38,160 131,866 153,795 0 515,488 1,440,667 2,279,976
Average PERL Property Tax
Per Pupil
69 59 46 - 34 44 51
Percent of Districts with Debt Services
Levy
28.9% 55.7% 54.0% 60.5% 52.4% 36.4% 52.0%
Debt Services Property Tax
2,732,054 19,637,092 20,446,634 46,751,345 35,738,638 22,849,689 148,155,452
Average Debt Services
Property Tax Per Pupil
888 706 566 590 746 698 654
The Annual Condition of Education Report 2013274

Income SurtaxesData on income surtax usage by enrollment category for 2000-2001 and 2010-2011 to 2013-2014 are pre-sented in Table 7-14.
Table 7-14
Number and Percent of Districts with Income Surtaxes, Surtax Per Budget Enrollment, and Average Income Surtax Rates by Enrollment Category 2000-2001 and 2010-2011 to 2013-2014
Source: Iowa Department of Management, Master Budget files.Notes: Enrollment categories determined by budget enrollments.
Surtaxes include Educational Improvement, Instructional Support, Voter-Approved Physical Plant and Equipment Levy.
Enrollment Category<300 300-599 600-999 1,000-
2,4992,500-7,499
7,500+ State
2013-2014Number of Districts with Surtaxes 45 103 85 71 20 11 335Percent of Districts with Surtaxes 100.0% 97.2% 97.7% 93.4% 95.2% 100.0% 96.8%
Surtaxes Per Budget Enrollment 509 377 364 328 246 359 377Average Income Surtax Rate 10.24 8.02 7.56 6.42 4.40 5.33 7.71
2012-2013Number of Districts with Surtaxes 45 89 77 64 9 3 287Percent of Districts with Surtaxes 93.8% 84.8% 88.5% 84.2% 40.9% 30.0% 82.5%
Surtaxes Per Budget Enrollment 450 377 359 318 266 386 344Average Income Surtax Rate 9.66 8.25 7.64 6.43 4.79 5.62 6.62
2011-2012Number of Districts with Surtaxes 44 94 75 66 9 3 291Percent of Districts with Surtaxes 91.7% 86.2% 89.3% 84.6% 40.9% 30.0% 82.9%
Surtaxes Per Budget Enrollment 457 381 365 323 264 344 341Average Income Surtax Rate 10.56 8.67 8.13 6.75 4.80 5.20 6.80
2010-2011Number of Districts with Surtaxes 46 95 79 62 9 3 294Percent of Districts with Surtaxes 88.5% 84.8% 90.8% 81.6% 40.9% 30.0% 81.9%
Surtaxes Per Budget Enrollment 470 393 361 328 273 343 346Average Income Surtax Rate 10.90 9.07 7.85 6.70 4.83 5.21 6.81
2000-2001Number of Districts with Surtaxes 31 87 73 54 6 3 254Percent of Districts with Surtaxes 86.1% 77.0% 67.0% 65.1% 25.0% 33.3% 67.9%
Surtaxes Per Budget Enrollment 225 180 175 160 136 173 168Average Income Surtax Rate 12.03 8.29 7.29 5.37 3.66 3.59 5.46
Finance 275

Instructional SupportInstructional support is a program that must be approved through board action or referendum. It provides additional funding to a district. It may be imposed for up to 10 years if it is approved through a referendum and up to five years through board resolution. A school district’s budget may be increased by up to 10 percent of the district’s regular program cost through the instructional support program. In most years, state aid funds a portion of the program and the remaining portion of the program is funded through a property tax and income surtax, if approved, once the program is enacted.
The revenue sources and amounts for the instructional support program for 2013-2014 and previous years are shown in Table 7-15 and Figure 7-5. In 1992-1993 through 2003-2004, the state aid for instructional support was frozen at $14.8 million. In 2003-2004, the state aid amount was reduced to $14.5 million due to a 2.25 percent across-the-board reduction in fiscal year (FY) 2004. In FY 2005, the state aid amount was set at $14.4 million and remained unchanged up to FY 2009. In 2009-2010, The American Recovery and Reinvestment Act (ARRA) Education Fiscal Stabilization fiscal funds were paid in lieu of instructional sup-port state aid. In 2011-2012 through 2013-2014, state aid did not fund instructional support. As a result, the percent of the funding for instructional support that came from property taxes has increased each year (Table 7-15). The number of districts with an instructional support program by enrollment category in current and previous years is shown in Table 7-16. All of the districts in the smallest and largest enrollment categories had instructional support programs in the current and previous three years.
Table 7-15
Instructional Support Program by Revenue Source Property Tax, Income Surtax, and State Aid/ARRA 2000-2001 and 2010-2011 to 2013-2014
Source: Iowa Department of Management, Master Budget Files.
School Year Property Tax Percent Property
Tax
Income Surtax Percent Income Surtax
State Aid/ARRA
Percent State Aid/
ARRA
Total
2013-2014 114,476,664 57.2% 85,521,643 42.8% 0 0.0% 199,998,3072012-2013 104,229,555 54.9% 85,667,381 45.1% 0 0.0% 189,896,9362011-2012 100,385,847 54.1% 85,171,536 45.9% 0 0.0% 185,557,3832010-2011 98,265,550 51.7% 84,302,509 44.4% 7,499,936 3.9% 190,067,9952000-2001 58,678,106 53.5% 36,273,229 33.1% 14,798,227 13.5% 109,749,562
The Annual Condition of Education Report 2013276

Figure 7-5
Instructional Support Program Revenues, 2000-2001, and 2010-2011 to 2013-2014
0
20,000,000
40,000,000
60,000,000
80,000,000
100,000,000
120,000,000
140,000,000
160,000,000
180,000,000
200,000,000
220,000,000
2013-20142012-20132011-20122010-20112000-2001
Am
ount
School Year
Property Tax Income Surtax
State Aid / ARRA Total
Source: Iowa Department of Management, Master Budget Files.
Finance 277

Table 7-16
Instructional Support Program by Enrollment Category 2000-2001 and 2010-2011 to 2013-2014
Source: Iowa Department of Management, Master Budget files.Note: Enrollment categories determined by budget enrollment.
Enrollment Category<300 300-599 600-999 1,000-
2,4992,500-7,499
7,500+ State
2013-2014Number of Districts 45 106 87 76 21 11 346
Number of Districts with Instructional Support
45 103 85 71 20 11 335
Percent of Districts with Instructional Support
100.0% 97.2% 97.7% 93.4% 95.2% 100.0% 96.8%
2012-2013Number of Districts 48 105 87 76 22 10 348
Number of Districts with Instructional Support
48 102 85 71 20 10 336
Percent of Districts with Instructional Support
100.0% 97.1% 97.7% 93.4% 90.9% 100.0% 96.6%
2011-2012Number of Districts 48 109 84 78 22 10 351
Number of Districts with Instructional Support
48 104 81 71 20 10 334
Percent of Districts with Instructional Support
100.0% 95.4% 96.4% 91.0% 90.9% 100.0% 95.2%
2010-2011Number of Districts 52 112 87 76 22 10 359
Number of Districts with Instructional Support
52 108 83 68 20 10 341
Percent of Districts with Instructional Support
100.0% 96.4% 95.4% 89.5% 90.9% 100.0% 95.0%
2000-2001Number of Districts 36 113 109 83 24 9 374
Number of Districts with Instructional Support
33 95 79 54 16 8 285
Percent of Districts with Instructional Support
91.7% 84.1% 72.5% 65.1% 66.7% 88.9% 76.2%
The Annual Condition of Education Report 2013278
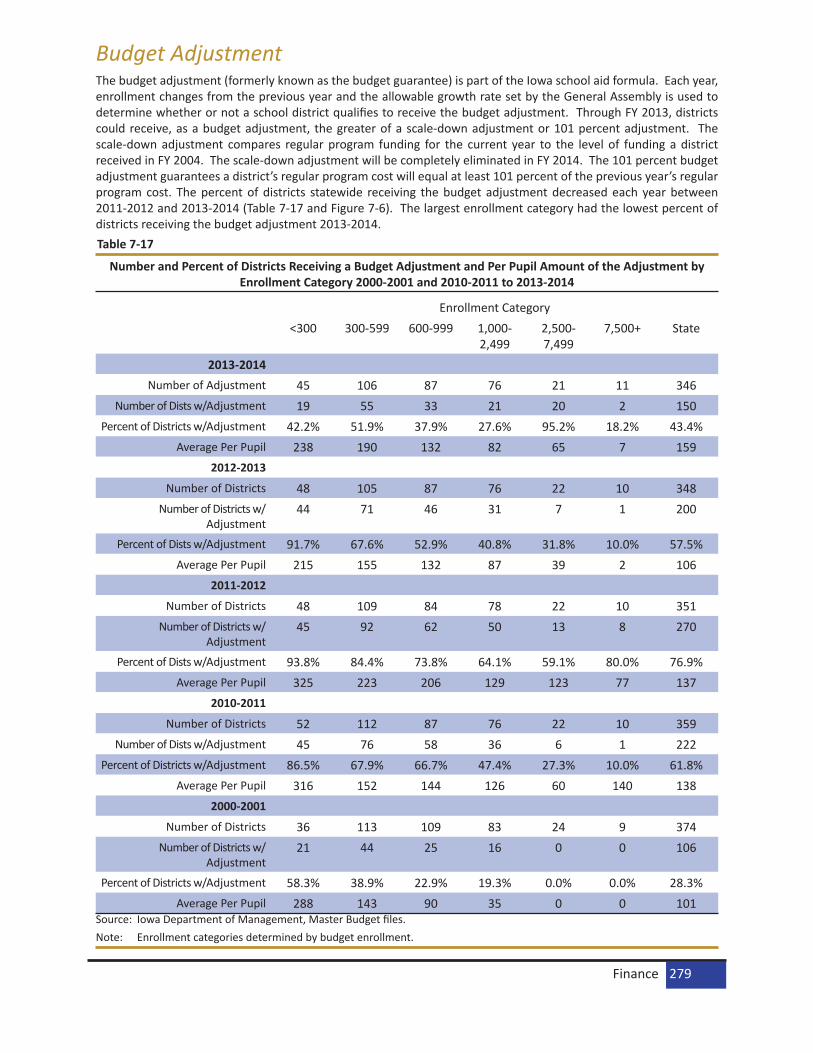
Budget AdjustmentThe budget adjustment (formerly known as the budget guarantee) is part of the Iowa school aid formula. Each year, enrollment changes from the previous year and the allowable growth rate set by the General Assembly is used to determine whether or not a school district qualifies to receive the budget adjustment. Through FY 2013, districts could receive, as a budget adjustment, the greater of a scale-down adjustment or 101 percent adjustment. The scale-down adjustment compares regular program funding for the current year to the level of funding a district received in FY 2004. The scale-down adjustment will be completely eliminated in FY 2014. The 101 percent budget adjustment guarantees a district’s regular program cost will equal at least 101 percent of the previous year’s regular program cost. The percent of districts statewide receiving the budget adjustment decreased each year between 2011-2012 and 2013-2014 (Table 7-17 and Figure 7-6). The largest enrollment category had the lowest percent of districts receiving the budget adjustment 2013-2014. Table 7-17
Number and Percent of Districts Receiving a Budget Adjustment and Per Pupil Amount of the Adjustment by Enrollment Category 2000-2001 and 2010-2011 to 2013-2014
Enrollment Category<300 300-599 600-999 1,000-
2,4992,500-7,499
7,500+ State
2013-2014Number of Adjustment 45 106 87 76 21 11 346
Number of Dists w/Adjustment 19 55 33 21 20 2 150Percent of Districts w/Adjustment 42.2% 51.9% 37.9% 27.6% 95.2% 18.2% 43.4%
Average Per Pupil 238 190 132 82 65 7 1592012-2013
Number of Districts 48 105 87 76 22 10 348Number of Districts w/
Adjustment44 71 46 31 7 1 200
Percent of Dists w/Adjustment 91.7% 67.6% 52.9% 40.8% 31.8% 10.0% 57.5%Average Per Pupil 215 155 132 87 39 2 106
2011-2012
Number of Districts 48 109 84 78 22 10 351Number of Districts w/
Adjustment45 92 62 50 13 8 270
Percent of Dists w/Adjustment 93.8% 84.4% 73.8% 64.1% 59.1% 80.0% 76.9%Average Per Pupil 325 223 206 129 123 77 137
2010-2011
Number of Districts 52 112 87 76 22 10 359Number of Dists w/Adjustment 45 76 58 36 6 1 222
Percent of Districts w/Adjustment 86.5% 67.9% 66.7% 47.4% 27.3% 10.0% 61.8%Average Per Pupil 316 152 144 126 60 140 138
2000-2001
Number of Districts 36 113 109 83 24 9 374Number of Districts w/
Adjustment21 44 25 16 0 0 106
Percent of Districts w/Adjustment 58.3% 38.9% 22.9% 19.3% 0.0% 0.0% 28.3%Average Per Pupil 288 143 90 35 0 0 101
Source: Iowa Department of Management, Master Budget files.Note: Enrollment categories determined by budget enrollment.
Finance 279
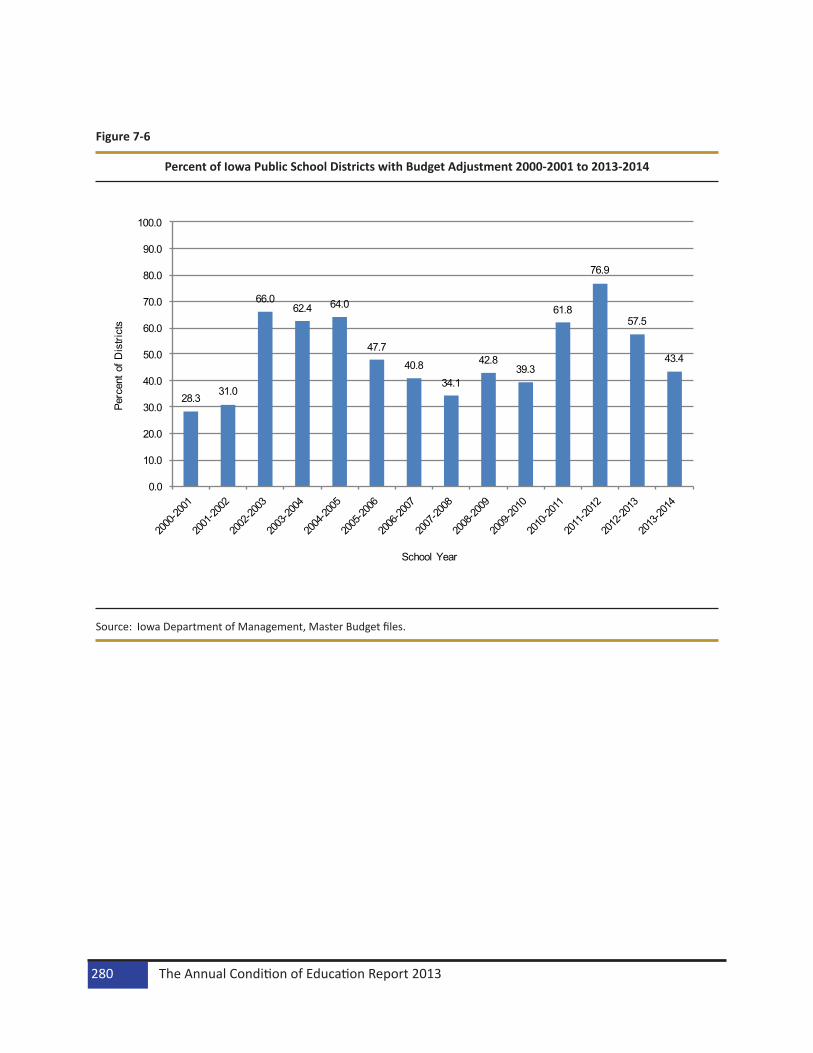
Figure 7-6
Percent of Iowa Public School Districts with Budget Adjustment 2000-2001 to 2013-2014
28.331.0
66.062.4 64.0
47.7
40.834.1
42.839.3
61.8
76.9
57.5
43.4
0.0
10.0
20.0
30.0
40.0
50.0
60.0
70.0
80.0
90.0
100.0
Perc
ent o
f Dis
trict
s
School Year
Source: Iowa Department of Management, Master Budget files.
The Annual Condition of Education Report 2013280

Bond ElectionsThe number of districts that attempted bond referendums by enrollment category is listed in Table 7-18. A bond referendum may be passed with approval of at least 60 percent of the total votes cast. In 2011-2012, 75.0 percent bond referendums passed compared to 42.0% in 2000-2001.
Table 7-18
Number of Districts Attempting Bond Referendums by Percentage of Yes Votes by Enrollment Category 2000-2001, 2010-2011 and 2011-2012
Source: Iowa Department of Education, Division of School Finance and Support Services, Certified Annual Financial Reports.Note: A district could be included more than once if it had more than one bond issue in a year, or more than one issue on a
ballot.
Physical Plant and Equipment ElectionsTable 7-19 lists the number of districts that attempted voter-approved physical plant and equipment referendums in 2001-2002 and 2010-2011 and 2011-2012. Voter-approved physical plant and equipment referendums require 50 percent approval for passage. In 2011-2012, 96.9 percent of the voter-approved physical plant and equipment referendums were passed, (Table 7-19) compared to 78.4% in 2001-2002..
Enrollment Category<300 300-599 600-999 1,000-
2,4992,500-7,499
7,500 + State
2011-2012 Number Attempted 0 4 2 3 3 0 12
<50 Percent 0 1 0 0 0 0 1 50-59.9 Percent 0 1 1 0 0 0 2
60 Percent + 0 2 1 3 3 0 9
2010-2011 Number Attempted 0 1 3 5 0 0 9
<50 Percent 0 0 0 0 0 0 0 50-59.9 Percent 0 1 2 1 0 0 4
60 Percent + 0 0 1 4 0 0 5
2000-2001 Number Attempted 0 11 6 6 4 1 28
<50 Percent 0 3 2 3 0 0 8 50-59.9 Percent 0 4 1 2 1 0 8
60 Percent + 0 4 3 1 3 1 12
Finance 281

Table 7-19
Number of Districts Attempting Voter-Approved Physical Plant and Equipment Referendums by Percent of Yes Votes by Enrollment Category 2001-2002, 2010-2011 and 2011-2012
Source: Iowa Department of Education, Division of School Finance and Support Services, Certified Annual Financial Reports.Notes: A district could be included more than once if it had more than one Voter-Approved Physical Plant and Equipment Levy
referendum in a year. FY 2002 was the first year the information was collected.
Secure an Advanced Vision for Education (SAVE)--Formerly Known as Local Option Sales and Services Tax for School InfrastructureSAVE is used by school districts for school infrastructure needs and property tax relief. Prior to July 1, 2008, all 99 counties had passed the local option tax and effective July 1, 2008, legislation changed the local option sales and services tax to a statewide sales and services tax. This legislation (Iowa Code 423F.1) increased the state sales, services, and use tax from 5 percent to 6 percent to continue providing revenues to local school districts solely for school infrastructure purposes or school district property tax relief. The statewide sales and services tax sunsets on December 31, 2029.
Use of revenues from SAVE depends on whether or not the school district has a revenue purpose state-ment (RPS). Current law specifies the usage of SAVE revenue as dictated by the RPS. RPS requires voter approval for designating specific use of SAVE. If there is no RPS, then the revenue is to be used for reduc-ing specified levies described in Iowa Code 423F.3 “Use of revenues.” RPSs in effect prior to July 1, 2008, are to remain in effect until amended or extended for each county. A school board may adopt a resolution for using the SAVE revenues solely for property tax relief by reducing indebtedness of the Physical Plant and Equipment Levy (PPEL) and debt levies without voter approval. If the school board approves a change in the RPS not solely for reduction of property tax relief, voter approval is required. Voter approved RPSs after July 1, 1998, are district statements – not county statements. The district-approved RPS is effective until amended or repealed on December 31, 2029.
Enrollment Category<300 300-599 600-999 1,000-
2,4992,500-7,499
7,500 + State
2011-2012Number Attempted 2 11 10 7 2 0 32
<50 Percent 0 0 0 1 0 0 150 Percent + 2 11 10 6 2 0 31
2010-2011Number Attempted 3 3 5 7 2 2 22
<50 Percent 1 0 0 0 0 1 250 Percent + 2 3 5 7 2 1 20
2001-2002Number Attempted 2 14 10 9 2 0 37
<50 Percent 0 3 2 2 1 0 850 Percent + 2 11 8 7 1 0 29
The Annual Condition of Education Report 2013282

The formula for the distribution of statewide sales and services tax revenue through the Secure an Ad-vanced Vision for Education (SAVE) fund continues to be based upon the amounts that school districts would have received under the former School Infrastructure Local Option Tax (SILO). SAVE was created as a separate and distinct fund in the state treasury under control of the Department of Revenue. Moneys in a fiscal year that are in excess of that needed to provide each school district with its formula amount shall be distributed and credited to the property tax equity and relief fund (PTER) created in section 257.16A. Estimated sales and services tax revenues for 2012-2013 were approximately $409 million.
Distribution of SAVE funds to school districts depends when the SILO was approved and also whether the sales tax capacity per student is above or below the guaranteed school infrastructure amount. Guaran-teed school infrastructure amount means the statewide sales tax revenues per student, multiplied by the quotient of the tax rate percent imposed in the county, divided by 1 percent and multiplied by the quotient of the number of quarters the tax is imposed during the fiscal year divided by four quarters.
School districts that approved the SILO prior to April 1, 2003, and had a sales tax capacity per student above the guaranteed school infrastructure amount were allowed to keep all funds until the initial 10 years expired, but school districts that are below the guaranteed school infrastructure amount would receive their pro rata share of SILO plus a supplemental school infrastructure amount. The initial 10 years has expired. School districts that approved the SILO on or after April 1, 2003, or schools that approved the continuation of the SILO, receive an amount equal to its pro rata share of local sales and services tax up to the guaranteed school infrastructure amount, but school districts below the guaranteed school infrastructure amount will receive an additional amount equal to its supplemental school infrastructure amount. School districts that approved SILO after January 1, 2007, and before July 1, 2007, receive all their money for the first five years before going into the SAVE fund. These funds have expired and the SAVE fund is set from 2012-2013 for approximately $38.9 million for 348 districts in all 99 counties.
Table 7-20
Local Option/Statewide Sales and Services Tax for School Infrastructure 2000-2001, 2010-2011 to 2012-2013
Source: Iowa Department of Education, Certified Enrollment files and Department of Revenue records.
2000-2001 2010-2011 2011-2012 2012-2013
Number of Counties with the Tax 15 99 99 99Number of Districts Partly or Wholly Located
in those Counties110 359 348 348
Resident Budget Enrollment in those Counties 171,150.6 474,227.3 473,493.4 473,504.2Estimated Revenues $122,683,313 $358,117,410 $356,483,791 $408,955,193
Percent of Counties Participating 15.2% 100.0% 100.0% 100.0%Percent of Districts Located Partly or Wholly in
Participating Counties29.4% 100.0% 100.0% 100.0%
Percent of Budget Enrollment Residing in Participating Counties
34.3% 100.0% 100.0% 100.0%
Number of Counties Receiving SAVE Funds (Receiving in Next Fiscal Year)
0 85 99 99
Number of Districts Partly or Wholly Located in those Counties
0 339 349 348
Resident Budget Enrollment in those Counties 0.0 432,319.3 470,586.8 473,504.2Estimated SAVE Revenues $0 $27,176,159 $23,909,079 $38,850,743
Finance 283
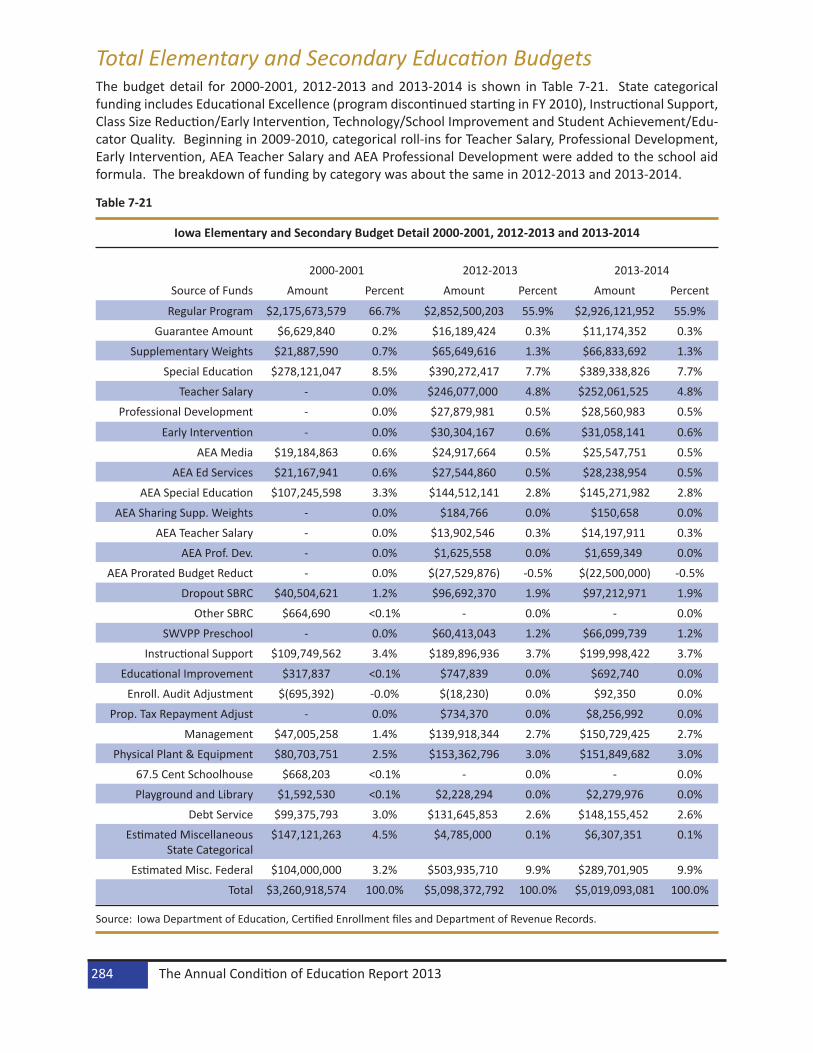
Total Elementary and Secondary Education BudgetsThe budget detail for 2000-2001, 2012-2013 and 2013-2014 is shown in Table 7-21. State categorical funding includes Educational Excellence (program discontinued starting in FY 2010), Instructional Support, Class Size Reduction/Early Intervention, Technology/School Improvement and Student Achievement/Edu-cator Quality. Beginning in 2009-2010, categorical roll-ins for Teacher Salary, Professional Development, Early Intervention, AEA Teacher Salary and AEA Professional Development were added to the school aid formula. The breakdown of funding by category was about the same in 2012-2013 and 2013-2014.
Table 7-21
Iowa Elementary and Secondary Budget Detail 2000-2001, 2012-2013 and 2013-2014
Source: Iowa Department of Education, Certified Enrollment files and Department of Revenue Records.
2000-2001 2012-2013 2013-2014
Source of Funds Amount Percent Amount Percent Amount Percent
Regular Program $2,175,673,579 66.7% $2,852,500,203 55.9% $2,926,121,952 55.9%
Guarantee Amount $6,629,840 0.2% $16,189,424 0.3% $11,174,352 0.3%
Supplementary Weights $21,887,590 0.7% $65,649,616 1.3% $66,833,692 1.3%
Special Education $278,121,047 8.5% $390,272,417 7.7% $389,338,826 7.7%
Teacher Salary - 0.0% $246,077,000 4.8% $252,061,525 4.8%
Professional Development - 0.0% $27,879,981 0.5% $28,560,983 0.5%
Early Intervention - 0.0% $30,304,167 0.6% $31,058,141 0.6%
AEA Media $19,184,863 0.6% $24,917,664 0.5% $25,547,751 0.5%
AEA Ed Services $21,167,941 0.6% $27,544,860 0.5% $28,238,954 0.5%
AEA Special Education $107,245,598 3.3% $144,512,141 2.8% $145,271,982 2.8%
AEA Sharing Supp. Weights - 0.0% $184,766 0.0% $150,658 0.0%
AEA Teacher Salary - 0.0% $13,902,546 0.3% $14,197,911 0.3%
AEA Prof. Dev. - 0.0% $1,625,558 0.0% $1,659,349 0.0%
AEA Prorated Budget Reduct - 0.0% $(27,529,876) -0.5% $(22,500,000) -0.5%
Dropout SBRC $40,504,621 1.2% $96,692,370 1.9% $97,212,971 1.9%
Other SBRC $664,690 <0.1% - 0.0% - 0.0%
SWVPP Preschool - 0.0% $60,413,043 1.2% $66,099,739 1.2%
Instructional Support $109,749,562 3.4% $189,896,936 3.7% $199,998,422 3.7%
Educational Improvement $317,837 <0.1% $747,839 0.0% $692,740 0.0%
Enroll. Audit Adjustment $(695,392) -0.0% $(18,230) 0.0% $92,350 0.0%
Prop. Tax Repayment Adjust - 0.0% $734,370 0.0% $8,256,992 0.0%
Management $47,005,258 1.4% $139,918,344 2.7% $150,729,425 2.7%
Physical Plant & Equipment $80,703,751 2.5% $153,362,796 3.0% $151,849,682 3.0%
67.5 Cent Schoolhouse $668,203 <0.1% - 0.0% - 0.0%
Playground and Library $1,592,530 <0.1% $2,228,294 0.0% $2,279,976 0.0%
Debt Service $99,375,793 3.0% $131,645,853 2.6% $148,155,452 2.6%
Estimated Miscellaneous State Categorical
$147,121,263 4.5% $4,785,000 0.1% $6,307,351 0.1%
Estimated Misc. Federal $104,000,000 3.2% $503,935,710 9.9% $289,701,905 9.9%
Total $3,260,918,574 100.0% $5,098,372,792 100.0% $5,019,093,081 100.0%
The Annual Condition of Education Report 2013284

Finance 285