iowa city wastewater expansion planning for nutrients c.ymcdn.com/sites/ · pdf fileiowa city...
TRANSCRIPT

Global Service Provider
Buildings Energy Environment Transportation Water
Iowa City Wastewater Expansion
Planning for Nutrients and Flood
Mitigation
Candice Bark, P.E., Jay Brady, P.E.
March 20, 2012

Project Overview
• Iowa City has two plants – North and South
• Older North Plant was flooded in 2008
• South Plant needs to be expanded to allow
decommissioning of the North Plant and for
future city growth
• Economic Development Administration (EDA)
and State of Iowa grants along with City sales
option tax is funding the $40 million project

Consulting Team
Stanley Consultants
Brown and Caldwell

Iowa City, Iowa

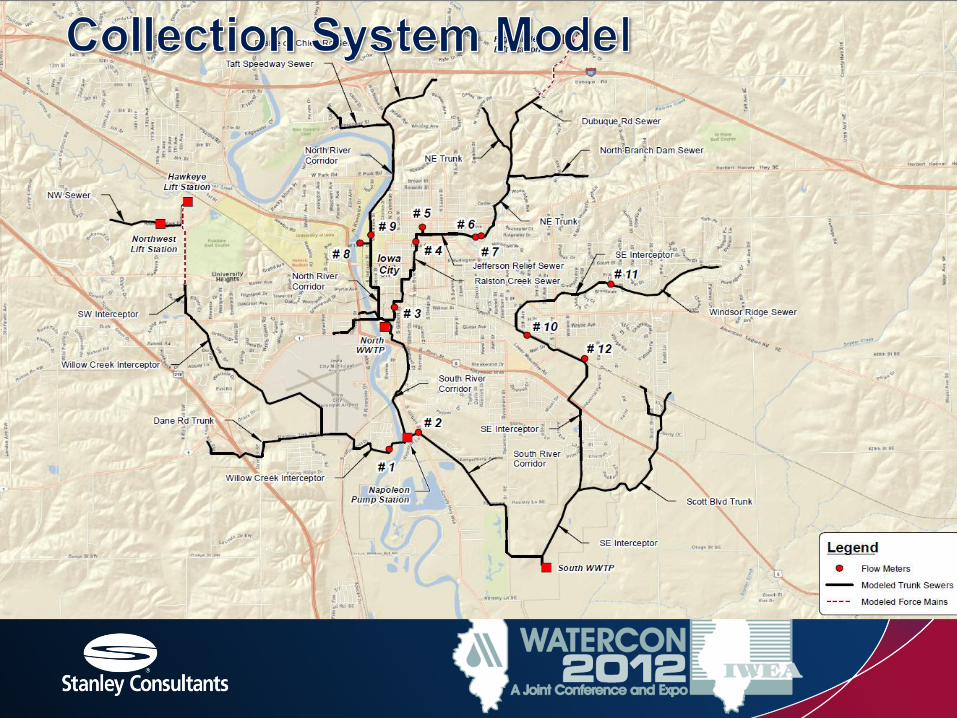
Project Overview • City of Iowa City sewer system serves 70,000
people. City population is 69,000 people.
• Major contributors:
– Proctor and Gamble (Health Care Products)
– University of Iowa (31,000 students and major
research institution,
– University of Iowa Hospitals and Clinics
• Major economic center in eastern Iowa

NORTH WWTP
SOUTH WWTP
Iowa River
Napolean Park
Lift Station

North Plant Overview
• Trickling filter plant – parts stem from 1935
• Raw sludge pumped to South Plant
• Location adjacent to city downtown
commercial district in flood prone area
• Long range planning from 1990s envisioned
migration of treatment to South Plant

North Plant – 2008 Flood

North Plant – 2008 Flood

North Plant – 2008 Flood

Napolean Park Lift Station

South Plant


Existing South Plant Design Flows
and Loads
Avg Max
Month
Max Day PHWW
Flow (mgd) 6 10 25 60
BOD5 (lb/d) 16,554
TSS (lb/d) 17,000
TKN (lb/d) 2,940

Existing Combined North and South
Plant Flows and Loads
Avg Max
Month
Max Day PHWW
Flow (mgd) 8.0 18.6 33.1 44.9
BOD5 (lb/d) 21,643
TSS (lb/d) 22,075
TKN (lb/d) 4,665

2025 Design Flows and Loads
Avg Max
Month
Max Day PHWW
Flow (mgd) 10 24.2 43/30 62/30
BOD5 (lb/d) 32,658
TSS (lb/d) 34,385
TKN (lb/d) 6,311

Design WLA
Pollutant Monthly Limit (lb/d) Max Day (lb/d)
CBOD5 25 mg/l 40 mg/l (7-day)
TSS 30 mg/l 45 mg/l (7-day)
NH3N Avg Max Avg Max
Month mg/l mg/l lb/d lb/d
January 12.4 16.6 2,857 4,111
February 14.1 15.8 3,234 3,877
March 6.4 15.9 1,470 3,952
April 4.6 16.6 1,060 4,192
May 3.9 16.1 905 4,051
June 2.7 15.3 620 3,181

Design WLA - NH3N
NH3N Avg Max Avg Max
Month mg/l mg/l lb/d lb/d
July 2.8 18.6 633 2,560
August 2.5 17.1 577 2,709
September 3.0 17.6 700 2,933
October 6.4 16.7 1,476 4,200
November 7.9 15.6 1,825 3,923
December 9.3 17.0 2,145 4,275

Why Look at Nutrient Removal for Iowa
City?
Existing process already allows partial dentrification
Use of nitrate in anoxic selector minimizes filaments
and reduces oxygen use
Anti-Degradation Analysis Pollutants of Concern
include Nitrogen and Phosphorus
High Potential for future nutrient limits

Planning Challenge: Nutrient Limits
not Set
Potential Total Nitrogen: <3 to 10 mg/l
Potential Total Phosphorus: 0.1 to 1 mg/l
Nutrient policy is being developed
Implementation likely in 5 years

Planning Effluent Quality
Parameter Base case Future
Phosphorus 1.0 mg/L 0.1 or 0.3 mg/L
Ammonia Current mass
loadings
Current mass loadings or
mussel toxicity
Total N 12 mg/l 5 or 10 mg/L

Phosphorus Removal
Two Main Approaches
Biological P Removal using P accumulating
organisms
Chemical Removal with iron salts, alum, or lime

Biological Phosphorus Removal
Consistent Removal to 1 mg/l Possible with adequate VFAs, COD, and Influent P

Phosphorus Removal Below
1 mg/l by Chemical Feed
0.5 to 1 mg/l: Chemical Feed with Filtration
O.1 to 0.5 mg/l: Chemical Feed with Flocculating
Clarifiers and Filtration or Membrane Separation

Filtration
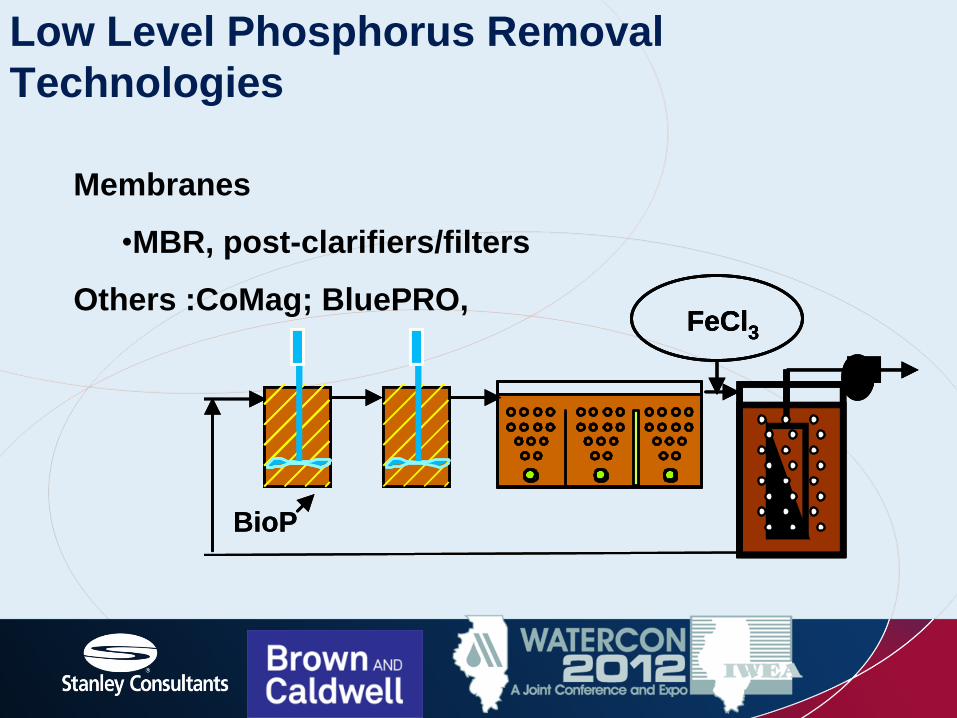
Low Level Phosphorus Removal
Technologies
FeCL3
Filter
Membrane

FeCl3FeCl3
PolymerPolymer
AlumAlum
AlumAlum
Clark County
BioP
Rock Creek
AlumAlum
Alum
Alum
AlumAlum
AlumAlumAlum
Blue Plains
CARBONFeCl3 FeSO4
CARBONCARBONFeCl3FeCl3 FeSO4FeSO4
Filter
Low Level Phosphorus Removal
Technologies
Tertiary sedimentation with
flocculation

BioP Alum
Polymer
Waste Sludge
to Sewer
BioP AlumAlum
PolymerPolymer
Waste Sludge
to Sewer
Iowa Hill
FeCl3
FeCl3
BioP
FeCl3FeCl3
FeCl3FeCl3
BioP
FeCl3
BioP
FeCl3FeCl3
BioP
F Wayne Hill
Cauley Creek
Filter
Low Level Phosphorus Removal
Technologies
Ballasted Sedimentation
•Densadeg/Actiflo
Low Level Phosphorus Removal
Technologies
BioP Alum
Polymer
Waste Sludge
to Sewer
BioP AlumAlum
PolymerPolymer
Waste Sludge
to Sewer
Iowa Hill
FeCl3
FeCl3
BioP
FeCl3FeCl3
FeCl3FeCl3
BioP
FeCl3
BioP
FeCl3FeCl3
BioP
F Wayne Hill
Cauley Creek
Membranes
•MBR, post-clarifiers/filters
Others :CoMag; BluePRO,

Total Nitrogen Removal
Total Nitrogen = NH3N + NO3 + Org N
1st Step Nitrification: Biological Conversion of NH3N
to NO3
2nd Step Denitrification: Biological Conversion of
NO3 to NOx/N2

Nitrification Process Implications
• High Oxygen Requirement:
– 4.6 lbs O2 per lb of NH3N
• Consumes Alkalinity
– 7.14 lb Alkalinity per lb NH3N
• Nitrifier Sensitivities

Activated Sludge Plant Alternatives
– Add aeration tanks (AT) to extend SRT √
– Bioaugmentation √
– Integrated Fixed Film Activated Sludge (IFAS) √
– Chemically enhanced primary treatment (CEPT)√
Nitrification – Ammonia removal
Footer | Date 32

Denitrification Process Implications
• Use of NO3 as electron donor can reduce O2
use by up to 25 percent
• Denitrification Process yields alkalinity
– 3.57 lb Alkalinity per lb NO3
• Tail End or 2nd Stage Denitrification generally
needs supplemental carbon – methonal or
ethanol

Combined N & P Flow Schemes
A2O/Phoredox

5-Stage Bardenpho
Combined N & P Flow Schemes

Separate Stage Denitrification with
External Carbon
36
RETURN ACTIVATED SLUDGE
ORGANIC
CARBON
AEROBIC ANOXIC AEROBIC CLARIFIER CLARIFIER
RETURN SLUDGE
Dentrification
Activated sludge
Deep Bed
filtration
Biologically
activated filters
(Biostyr, Biofor)

Whole Plant BioWin Model
Zone 1
Digesters
FSTPST
Zone 2
Aeration BasinsEffluent
RDT
Belt Press
EQ Basins
Dewatered Cake
South Influent
Digester
North Plant Solids
Solids EQ
Ferric
Aeration Basins

Selected Alternative: BAR/MLE

Birth of the BAR process: Need for High
Rate Nitrification: Constrained Sites
Appleton, WI
(Originator: Parker at Brown and
Caldwell)
Prague, Czech Republic
(Originator: Wanner at
Prague Institute)

The BAR Process
4
0
CLARIFIER
RETURN ACTIVATED SLUDGE
PRIMARY
EFFLUENT
EQUALIZED AMMONIA
LADEN FILTRATE
FROM DEWATERING
Pros
•Well proven
•Not “commercial”
•Reduced Ammonia Loading to
Main Process
•Continual Nitrifier Seeding of
Main Process
•Through bioaugmentation
mainstream tank size reduced
Con
•Alkalinity supplementation
unless stopping at nitrite in N/DN
plants
•High rate designs do not
produce lowest effluent
ammonia levels
Bioaugmentation
R = Reaeration or
Regeneration

Biosolids
Storage

BAR Addition/ Additional Cells in
Aeration Basin

Additional Blower Capacity

Questions/Discussion