io 2010 may aiece world trade.ppt
TRANSCRIPT

World Trade in 2010 and 2011AIECE General Meeting AIECE General Meeting
May 6, 2010Milan
Bart De Ketelbutter
plan.beplan.be

World trade in 2010-2011
plan.beplan.be

World economyy
Remarkably quick & Remarkably quick & vigorous recoveryOwing to extra-
d f l &3
4
5
ordinary fiscal & monetary stimulus... and the wearing 1
2
3
a d t e ea goff of the initial shock effectChina Asia and EM 2
-1
0
China, Asia and EM are leading the way
Size stimulus-3
-2
2006
Q1
2006
Q2
2006
Q3
2006
Q4
2007
Q1
2007
Q2
2007
Q3
2007
Q4
2008
Q1
2008
Q2
2008
Q3
2008
Q4
2009
Q1
2009
Q2
2009
Q3
2009
Q4
Largely insulated from fin.crisis
qoq grow th rates yoy grow th rates
plan.beplan.be

Commodities and financial markets
Oil & commodity Oil & commodity prices risen unabatedly since t t f 2009start of 2009
Financial markets rebounded (equity rebounded (equity, corporate debt, interbank market), b but not a normalisation yet as authorities have been authorities have been major player + fueled by liquidity
plan.beplan.besurge

World industrial productionp
115
120
10%
15%
IP bounced back strongly
10
110
0%
5%
back strongly Currently at 10% yoy
100
105
-10%
-5% But still not back to pre-crisis level
95
janv
/07
mar
s/07
mai
/07
juil/0
7
sept
/07
nov/
07
janv
/08
mar
s/08
mai
/08
juil/0
8
sept
/08
nov/
08
janv
/09
mar
s/09
mai
/09
juil/0
9
sept
/09
nov/
09
janv
/10
-15%
crisis level (blue line, LHS)
Index, 2005=100 yoy grow th rates (RHS)
plan.beplan.be

Industrial production, region by regionp , g y g
130
110
120
90
100
70
80
90
60
70
08M
1
08M
3
08M
5
08M
7
08M
9
8M11
09M
1
09M
3
09M
5
09M
7
09M
9
9M11
10M
1
Asian and EM lead and already above pre crisis level (not
200
200
200
200
200
2008 20
0
200
200
200
200
2009 20
1
US Japan Euro Area Emerging Countries Asia
plan.beplan.be
Asian and EM lead and already above pre-crisis level (not only because of faster recovery, higher trend growth)

World trade, growth rate, g
-16% in Oct08-16% in Oct08Jan09, -20% in 6M to Jan09
2 0%
4,0%
6,0%
10 0%
15,0%
20,0%
Reasons:US downturn, commodity prices-2,0%
0,0%
2,0%
0,0%
5,0%
10,0%
Consumer durables & investment gdsSynchronized -6,0%
-4,0%
2,0%
-15,0%
-10,0%
-5,0%
Synchronized downturnCredit conditions
Stabilisation in H1 09-10,0%
-8,0%
1 4 7 0 1 4 7 0 1 4 7 0 1-25,0%
-20,0%
,
Stabilisation in H1 09Strong recovery in H2 09 and start of 2010
2007
M20
07M
2007
M20
07M
120
08M
2008
M20
08M
2008
M1
2009
M20
09M
2009
M20
09M
120
10M
mom yoy (RHS)
plan.beplan.be
y y ( )

World trade, level,
But world trade not But world trade not back to pre-crisis level yet
160 0
170,0
Emerging countries are leading Asia China150,0
160,0
Among developed economies EA lags (US & Japan benefit
140,0
(US & Japan benefit from proximity China, size of stimulus)A i
130,0
Among emerging countries CEE lag (proximity lagging
120,0
2005
M1
2005
M9
2006
M5
2007
M1
2007
M9
2008
M5
2009
M1
2009
M9
plan.beplan.beEA)
2 2 2 2 2 2 2 2
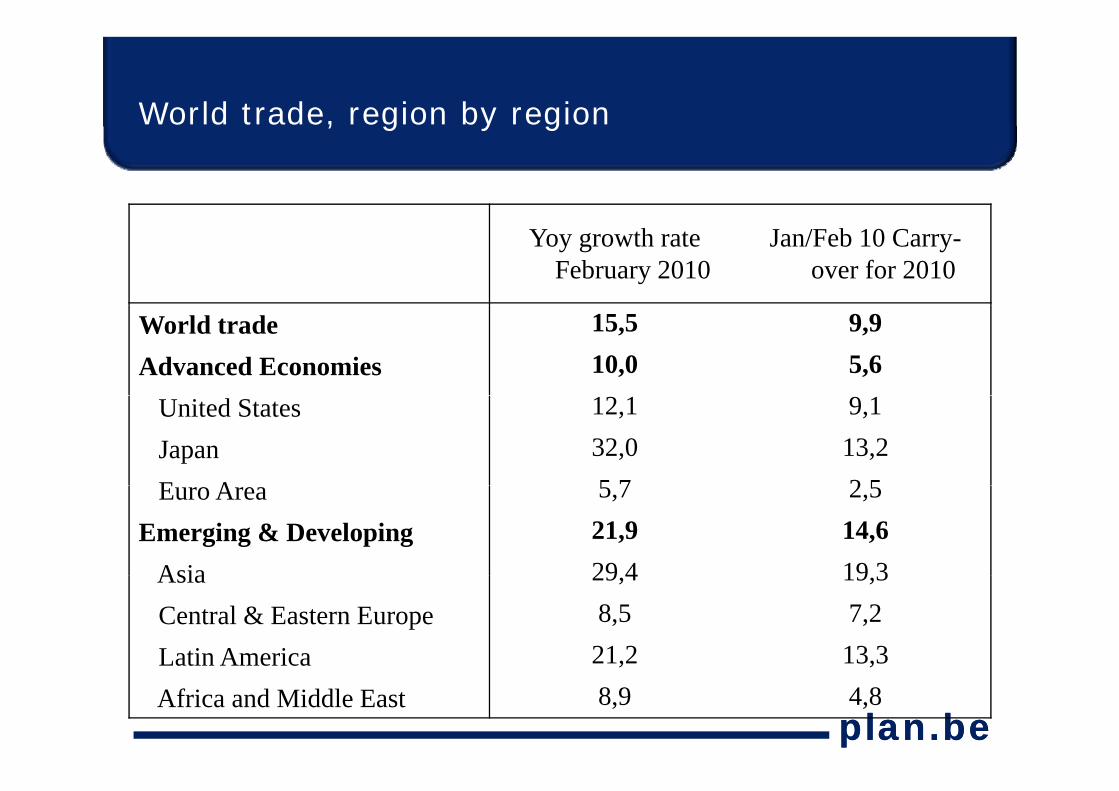
World trade, region by region, g y g
Yoy growth rate February 2010
Jan/Feb 10 Carry-over for 2010
World trade 15,5 9,9
Advanced Economies 10,0 5,6
United States 12,1 9,1
Japan 32,0 13,2
E A 5 7 2 5Euro Area 5,7 2,5
Emerging & Developing 21,9 14,6
Asia 29 4 19 3Asia 29,4 19,3
Central & Eastern Europe 8,5 7,2
Latin America 21,2 13,3
plan.beplan.be
Latin America , ,
Africa and Middle East 8,9 4,8

The outlook and the risks
plan.beplan.be

Outlook 1
M i t t d i Many economists expect some decrease in economic growth after a remarkably quick recovery (esp in Asia & US) from the depths recovery (esp. in Asia & US) from the depths of the recession Reasons for this relative pessimism are Reasons for this relative pessimism are numerous
plan.beplan.be

Outlook 2
Ending of large fiscal stimulusEnding of extra-ordinary monetary stimulus
Depart from near 0% interest ratesStop in provisioning of almost limitless liquidityQuantitative easingQuantitative easing
Ending of decreased destocking/restockingReduced level of credit supply by banks esp in Reduced level of credit supply by banks, esp. in EuropeRising commodity prices (oil!)Rising commodity prices (oil!)Sovereign debt crisis
plan.beplan.be

Outlook 3
But other economists (a growing number) are more optimistic about ) pthe futureReasons:
World trade and industrial production is surgingIndicators are often at levels that signal strong growth ahead
plan.beplan.be

Key Assumptions & World trade forecasty p
Autumn 2009 Spring 20102009 2010 2009 2010 2011
GDP volume (yoy)United States 2 7 2 0 2 4 3 0 2 5United States ‐2,7 2,0 ‐2,4 3,0 2,5Japan ‐5,4 2,0 ‐5,2 1,8 1,4Euro Area ‐3,7 1,5 ‐4,0 1,2 1,5China 8,2 8,5 8,6 10,0 8,7
Exchange Rates (levels)USD/EUR 1 38 1 45 1 39 1 38 1 38USD/EUR 1,38 1,45 1,39 1,38 1,38JPY/USD 95 90 93,6 92,0 92,0
World trade prices (USD)pCrude oil (Brent, level, $/b) 60,1 75,2 61,5 80 80Non‐energy prim. Commodities, yoy ‐23 12 ‐22,4 20 2
M f d d 6 3 0 4 0 4 1 3
plan.beplan.beManufactured goods, yoy ‐6,3 0,4 ‐7,5 ‐0,4 1,3World trade volume (goods, yoy) ‐13,5 7,4 ‐12,1 10,7 7,6

World trade forecast, quarterly profile, q y p
Level, 2000=100 qoq yoy
2009Q1 131,7 -9,9% -18,6%2009Q2 131,8 0,1% -18,2%2009Q3 137,0 3,9% -13,7%2009Q4 144,1 5,1% -1,4%2010Q1 147,7 2,5% 12,2%2010Q2 149 5 1 2% 13 4%2010Q2 149,5 1,2% 13,4%2010Q3 151,4 1,3% 10,5%2010Q4 154,0 1,7% 6,9%2011Q1 157,0 2,0% 6,3%2011Q2 160,3 2,1% 7,3%
plan.beplan.be2011Q3 163,7 2,1% 8,1%2011Q4 167,2 2,1% 8,6%

China
Ever more a driver for the world economy and financial Ever more a driver for the world economy and financial markets (cf. Market reaction when authorities signalled monetary tightening)Ever more important in our forecasts, but statistics not abundant & of doubtful qualityC b t Chi dit i t i Concerns about Chinese credit expansion, asset prices and rising inflationBank reserve requirements raised and lending Bank reserve requirements raised and lending restrictions imposedChina needs a new growth model relying more on g y ginternal consumer demand rather than on external demandY /USD R l ti US t ti i t
plan.beplan.beYuan/USD: Revaluation soon or US protectionist measures will be taken

China GDP growthg
Fiscal stimulus planIncredible surge in Incredible surge in bank lendingPushed yoy GDP y ygrowth from 6% to 12% in the course of just one yearjust one year
plan.beplan.be
The rising importance of emerging markets in world trademarkets in world trade
Source: DOTS IMF (values)
plan.beplan.be

World import market shares EM, BRICs, Chinap , ,
EM M growth 40%
surgingHigh domestic demand growth
30%
35%
40%
demand growthOpening up economies 15%
20%
25%
Shift toward intra-EM & intra-BRICs trade
5%
10%
15%
BRICs trade 0%19
90
1991
1992
1993
1994
1995
1996
1997
1998
1999
2000
2001
2002
2003
2004
2005
2006
2007
2008
EM China BRICsAv M gr 00-08DM 9,8EM 19,1
plan.beplan.beBRICs 21,7China 25,1

EM & DM export share going to EMp g g
40%
30%
35%
25%
15%
20%
1990 1992 1994 1996 1998 2000 2002 2004 2006 20081990 1992 1994 1996 1998 2000 2002 2004 2006 2008
Emerging markets Developed markets
plan.beplan.be

World trade becoming more diversified-Top 10 Mg p
1990 2000 2008
1 US 14,6% US 18,8% US 13,1%
2 Germany 9 8% Germany 7 6% Germany 7 2%2 Germany 9,8% Germany 7,6% Germany 7,2%
3 Japan 6,7% Japan 5,8% China 6,8%
4 France 6,6% UK 5,1% Japan 4,6%, , p ,
5 UK 6,3% France 5,0% France 4,3%
6 Asia 5,7% Canada 4,0% UK 3,8%
7 Italy 5,2% Italy 3,6% Netherlands 3,5%
8 Canada 3,7% China 3,4% Italy 3,4%
9 N h l d 3 5 N h l d 3 3 B l i 2 89 Netherlands 3,5% Netherlands 3,3% Belgium 2,8%
10 Spain 2,5% Hong Kong 3,2% Canada 2,7%
Top 10 Total 64 6% Top 10 Total 59 7% Top 10 Total 52 2%
plan.beplan.be
Top 10 Total 64,6% Top 10 Total 59,7% Top 10 Total 52,2%

World trade becoming more diversified-Next 10 Mg
1990 2000 2008
11 Hong Kong 2,3% Mexico 3,0% South Korea 2,6%
12 South Korea 2,0% Belgium 2,7% Spain 2,6%, g , p ,
13 Switzerland 2,0% South Korea 2,4% Hong Kong 2,3%
14 Singapore 1,7% Spain 2,2% Mexico 2,1%
15 Sweden 1,5% Singapore 2,0% Singapore 1,9%
16 China 1,5% Switzerland 1,3% India 1,7%
17 Austria 1,4% Malaysia 1,2% Russia 1,6%17 Austria 1,4% Malaysia 1,2% Russia 1,6%
18 Australia 1,2% Australia 1,1% Brazil 1,4%
19 Thailand 0,9% Sweden 1,1% Australia 1,3%
20 Mexico 0,9% Austria 1,1% Poland 1,3%
Next 10 Total 15,5% Next 10 Total 18,1% Next 10 Total 18,8%
Top 20 Total 80 2% Top 20 Total 77 8% Top 20 Total 71 0%
plan.beplan.be
Top 20 Total 80,2% Top 20 Total 77,8% Top 20 Total 71,0%

European sovereign debt crisis
plan.beplan.be

Next big phase in the financial crisisg p
Let us not be overly optimistic C l bi 1998Let us not be overly optimistic because of buoyant world trade, IP & GDP growth Chile, 1980
Finland, 1991
Colombia, 1998
Financial crisis still among us (all our risks relate to it)Next big phase in the financial Historical Average
Spain, 1977
Indonesia, 1997
Next big phase in the financial crisis (after subprime, banking & economic crisis) Korea, 1997
Sweden, 1991
Historical Average
Reinhart & Rogoff: Public debt soars in wake of fin.crises & defaults often follow Japan 1992
Norway, 1987
Philippines, 1997
defaults often follow
Malaysia, 1997
Mexico, 1994
Japan, 1992
Cumulative rise in real debt in the 3Y following the banking/financial crisis
plan.beplan.be0 50 100 150 200 250 300
following the banking/financial crisis
Index= 100 in year of crisis

Bond yield spreads against German Bundsy p g
• It started with Greece s d G(statistics falsified) & 2009 deficit estimate suddenly doubled suddenly doubled
• Credit downgrades• Spreads of ES, PT, IR
also on the rise• Last week even small
rises in other countriesrises in other countries• Reasons behind crisis?
GR 714 IT 110
PT 286 BE 62
IR 225 FR 33
plan.beplan.be
IR 225 FR 33
ES 115 NL 29Spreads on 28/04:

1.State of public financesp
Deficit DebtGreece 12 7 112 6 D t i t d t l d Greece ‐12,7 112,6Spain ‐11,2 54,3Portugal ‐8,0 77,4
Deteriorated strongly due to recession, stimulus & capital injections in banksg , ,
Ireland ‐12,5 65,8Italy ‐5,3 114,6
p jIn some countries : Over-reliance on above-trend
i t f b bbl France ‐8,3 76,1Belgium ‐5,9 97,2Germany 3 4 73 1
receipts from bubbly sectors (e.g. construction in ES, financ.sector in UK)Germany ‐3,4 73,1
NL ‐4,7 59,8Austria ‐4,3 69,1
in ES, financ.sector in UK)LT cost of ageing
, ,Finland ‐2,8 41,3EA12 ‐6,4 78,7
plan.beplan.beUK ‐12,1 68,6US ‐11,3 65,2 Ameco Autumn 09 fc for 2009

2. Phasing out of exceptional monetary stimulusg p y
D t f 0% IRDeparture from near 0% IRsFade out almost limitless provisioning of liquidityprovisioning of liquidityEnd QEHas powered financial assetspCarry-trade on gov.bnds, popular strategyRemoval of subsidy to public debtM i l h t t i d bt d Mainly hurts most indebted countries (higher ylds ,made them main beneficiaries
plan.beplan.becarry-trade)

3.Competitiveness, CA deficits and foreign debtp , g
ULC Ch CA/GDP • Entrance in euro area Country
ULC Ch 08‐99
CA/GDP change 08‐99
Greece 40.4 ‐8.6Ireland 37 5 5 3
lowered interest rates & unleashed credit boomIreland 37.5 ‐5.3
Portugal 35.5 ‐3.2Spain 33.3 ‐6.8
boom• Higher wage growth
and inflationItaly 16.7 ‐4.0Belgium 17.8 ‐4.7Austria 8.6 5.1
• Deterioration of competitivenessSt t i l t France 19.7 ‐5.8
NL 24.9 0.0Finland 19 8 5 4
• Strongest rise over last 10Y seen in the four problem countriesFinland 19.8 ‐5.4
Germany 3.4 7.8EA12 17.9 ‐1.2U
problem countries• Related: The level of
foreign debt and the
plan.beplan.beUK 24.3 0.7US 17.2 ‐1.8
dependence on foreign capital (PT)

4. The functioning of the euro area: more integration?integration?
Lack of means to address these imbalancesLack to reach consensus rapidly in times of crisisInitial plan for Greece was vague and incredible & markets did not buy ith lThe EA is no optimal currency area
US neither, but regional imbalances are tt t d b th f d l b d t (b lk f t i attenuated by the federal budget (bulk of taxing
& spending) and stronger labour mobility Euro area needs to integrate more and go Euro area needs to integrate more and go towards a fiscal & political union or else ...
plan.beplan.be

What next? – The new plan for Greecep
M i fl ti t d d bt h d f lt More inflation to erode debt overhang, defaults, general loss of confidence in sovereign debt?The new plan for Greece:The new plan for Greece:
110bn EUR loan package from EA & IMFCondition of spending cuts & tax hikesEffort needed not entirely unprecedented, but ... (cf. Belgian case)10 bn EUR to stabilise banking systemg yECB suspends colleteral rule for Greek bondsPlus: No need to turn to bond market next 3YEnough to restore confidence?Enough to restore confidence?Insolvency remains a problem, some kind of debt restructuring still likely
plan.beplan.be

Questions remainQ
Amounts lent to Greece still need to be approved in Amounts lent to Greece still need to be approved in national parliamentsWill Greece really be able to achieve these draconian measuresContagion risk not addressed (ES, PT): Will they be saved too?saved too?Markets risk testing this & see if countries are really prepared to restore health in public financesp epa ed to esto e ea t pub c a cesNot only in Europe (US, UK, Japan)Policymakers need to find way to convince markets y ythey’ll do whatever necessary to get ahead of the crisis
plan.beplan.be

Effects of full-blown sovereign debt crisisg
Loss of confidence could still spreadEffects of a full-blown sovereign debt crisis:
Higher interest ratesPremature and severe tightening of fiscal policyHit to bank assets (writedowns on sovereign debt) and Hit to bank assets (writedowns on sovereign debt) and financial panic: The sovereign version of Lehman?Would imperil the still fragile economic recovery
plan.beplan.be

Foreign banks’ exposure to problem countriesg p p
Bulk with European banks in bn EURIncludes debt of public and private sector
in bn EUR
Greece 163,9
Portugal 198,3
Ireland 601,8e a d 60 ,8
Spain 795,4
Italy 984,2
Source: BIS
plan.beplan.be
Source: BIS

Thank you for your attention.
plan.beplan.be