investor seminar 30 may 2018 · • trusted international bank, aspirational brand ... value client...
TRANSCRIPT

Retail BankingInvestor seminar
30 May 2018

Seminar summary
Introduction Bill Winters Group Chief Executive
Retail Banking Ben Hung CEO, Retail Banking and
Wealth Management
1
Webcast session
Focus on:
• Digital Aalishaan Zaidi Global Head, Digital Banking
• Wealth Management Didier von Daeniken Global Head, Private and Wealth Management
• Greater China & North Asia Samir Subberwal Regional Head, Retail Banking, GCNA
• ASEAN & South Asia Sebastian Arcuri Regional Head, Retail Banking, ASA
• Africa & Middle East Jaydeep Gupta Regional Head, Retail Banking, AME
• Products and Segments Fernando Morillo Global Head, Retail Products and Segments

IntroductionBill Winters

Retail BankingBen Hung
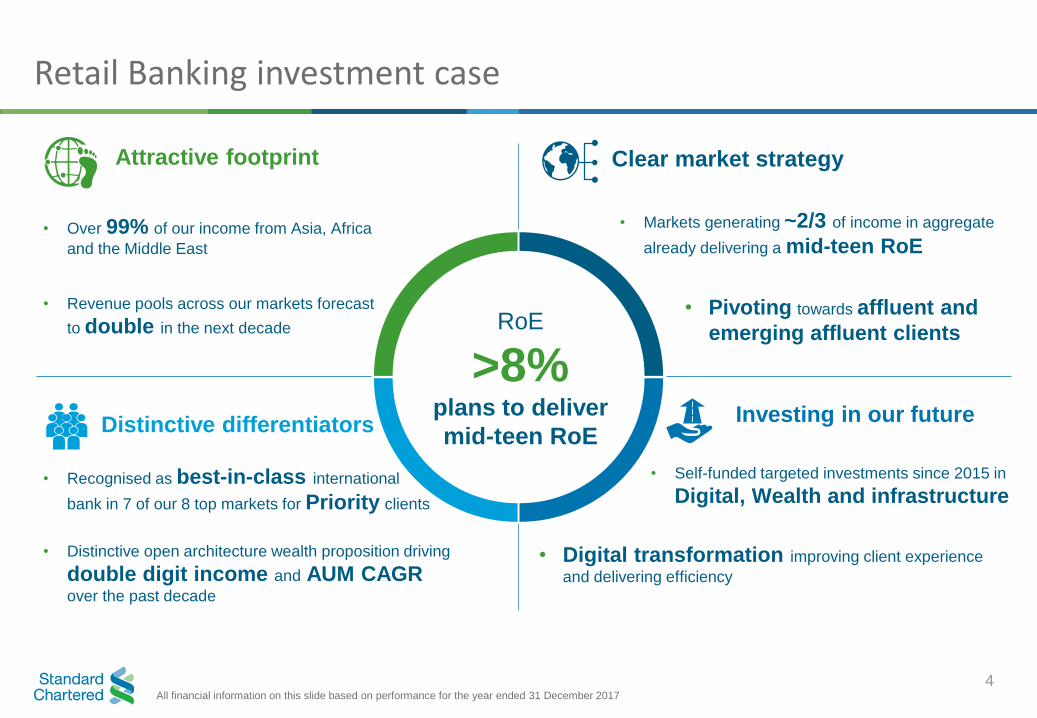
Retail Banking investment case
4
• Recognised as best-in-class international
bank in 7 of our 8 top markets for Priority clients
• Self-funded targeted investments since 2015 in
Digital, Wealth and infrastructure
Attractive footprint
Distinctive differentiators Investing in our future
• Distinctive open architecture wealth proposition driving
double digit income and AUM CAGRover the past decade
RoE
>8%plans to deliver
mid-teen RoE
• Digital transformation improving client experience
and delivering efficiency
• Over 99% of our income from Asia, Africa
and the Middle East
• Revenue pools across our markets forecast
to double in the next decade
All financial information on this slide based on performance for the year ended 31 December 2017
• Markets generating ~2/3 of income in aggregate
already delivering a mid-teen RoE
Clear market strategy
• Pivoting towards affluent and
emerging affluent clients
What you will hear today
• Shape of our business today
• Progress on our strategic priorities
• Confidence in sustainably improving our returns
• Our focus in Digital and Wealth Management
• Future shape of our business and how to measure progress
5
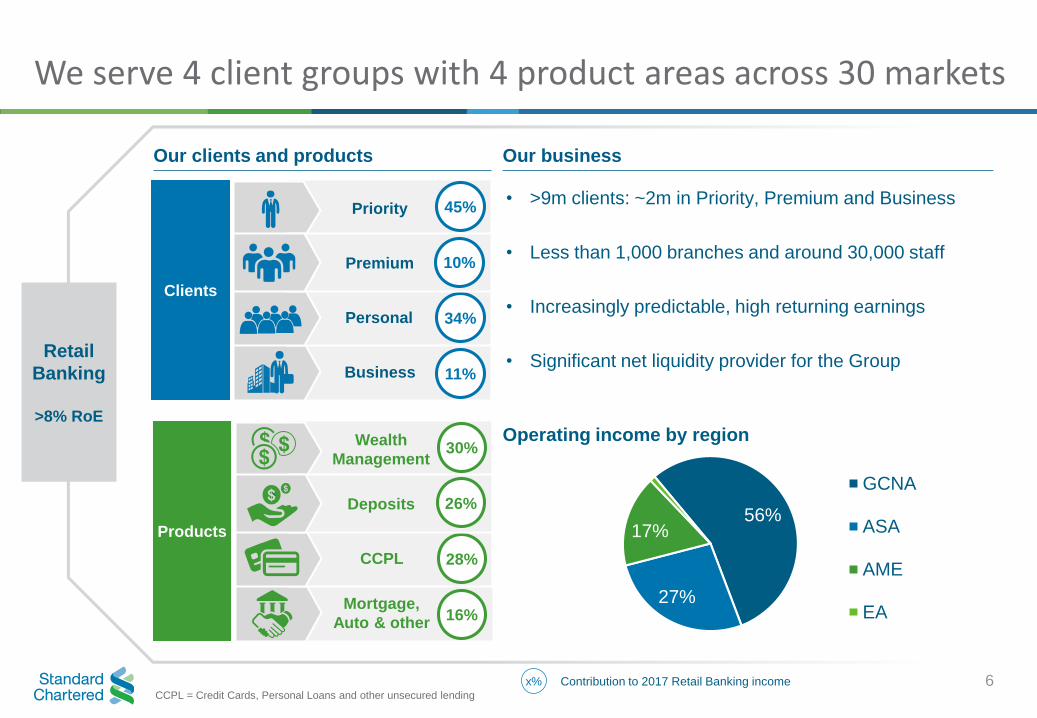
56%
27%
17%
GCNA
ASA
AME
EA
We serve 4 client groups with 4 product areas across 30 markets
Retail
Banking
>8% RoE
Our clients and products
Clients
Business 11%
Priority 45%
Personal 34%
Premium 10%
Products
Mortgage,
Auto & other16%
Wealth
Management30%
CCPL 28%
Deposits 26%`
Our business
x% Contribution to 2017 Retail Banking income
• >9m clients: ~2m in Priority, Premium and Business
• Less than 1,000 branches and around 30,000 staff
• Increasingly predictable, high returning earnings
• Significant net liquidity provider for the Group
Operating income by region
CCPL = Credit Cards, Personal Loans and other unsecured lending
6

We have distinctive propositions in Priority and Wealth
Net promoter score for Priority clients1Why clients choose Standard Chartered
7
• Trusted international bank, aspirational brand
• Strong Priority CVPs and cross-border capabilities
• Unbiased open architecture Wealth platform
• Relationship management based approach
• Compelling digital, product and payments capabilities
CVP = Customer value proposition
1. ‘Net Promoter Score’ and ‘NPS’ are trademarks of Satmetrix Systems Inc., Bain & Company, and Fred Reichheld. Standard Chartered uses Bain methodology
recalibrated for financial services to calculate NPS
MarketBest-in-class
international bank
YoY change
in NPS
Hong Kong Standard Chartered ▲16
Singapore Global peer ▲11
Taiwan Standard Chartered ▲8
Korea Standard Chartered ▼3
China Standard Chartered ▲9
India Standard Chartered ▲6
Malaysia Standard Chartered ▲9
UAE Standard Chartered ▼1
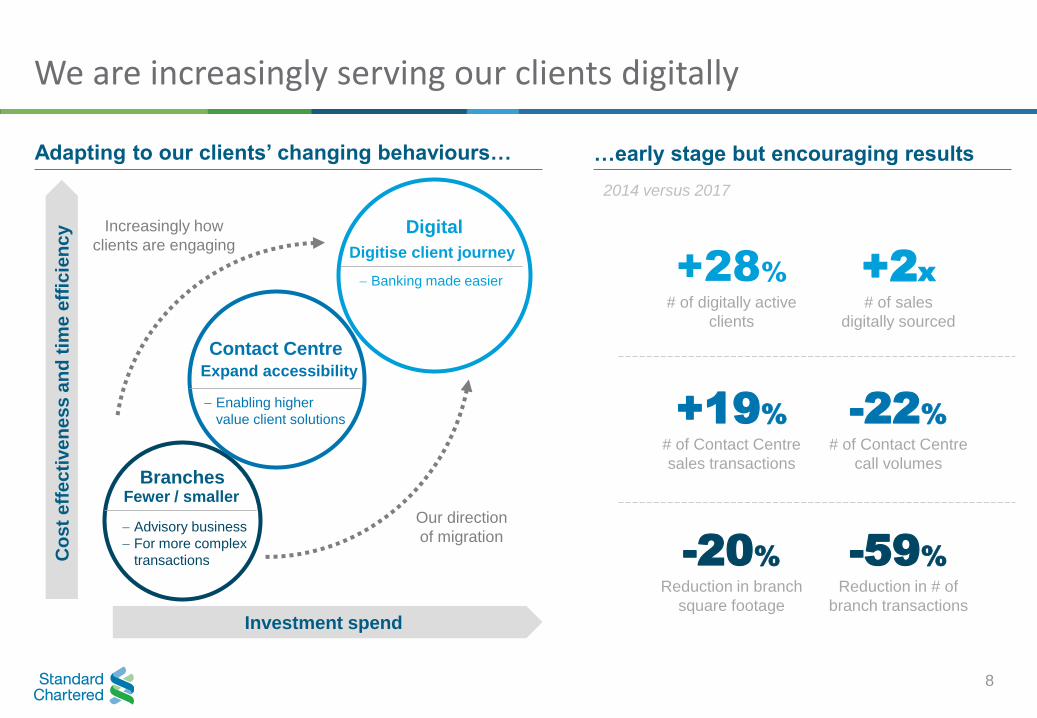
We are increasingly serving our clients digitally
8
Co
st
eff
ec
tive
ne
ss
an
d t
ime
eff
icie
nc
y
Investment spend
Our direction
of migration
BranchesFewer / smaller
Advisory business
For more complex
transactions
Digital
Banking made easier
Digitise client journey
Enabling higher
value client solutions
Expand accessibility
Contact Centre
+28%# of digitally active
clients
+2x# of sales
digitally sourced
+19%# of Contact Centre
sales transactions
-22%# of Contact Centre
call volumes
-20%Reduction in branch
square footage
-59%Reduction in # of
branch transactions
Adapting to our clients’ changing behaviours…
2014 versus 2017
…early stage but encouraging results
Increasingly how
clients are engaging
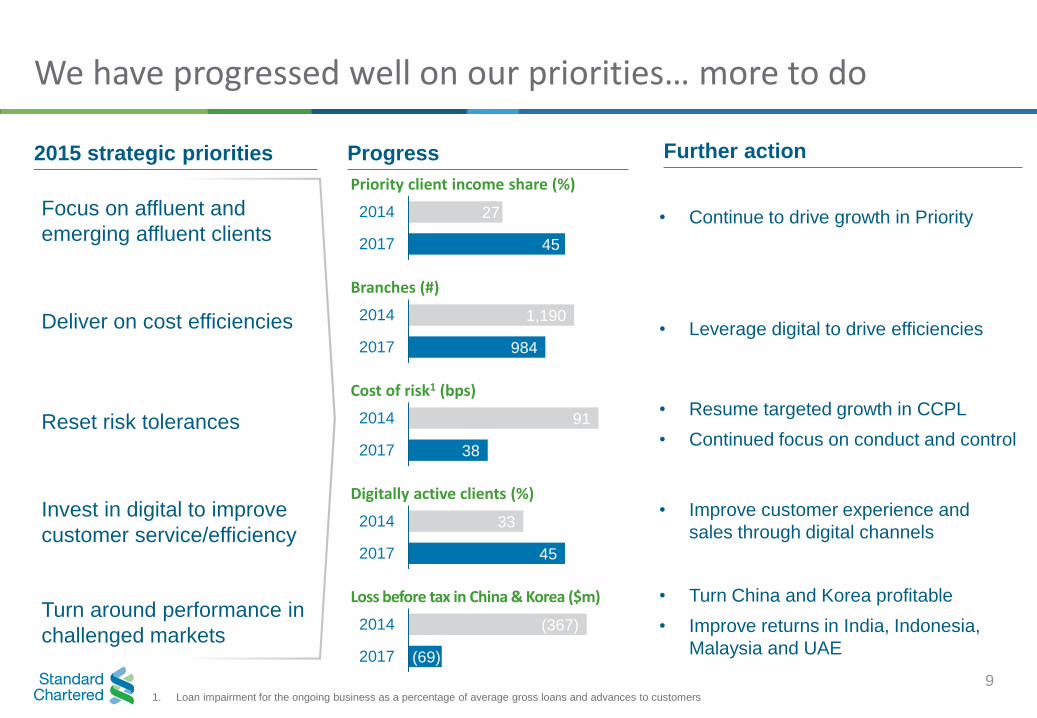
2015 strategic priorities
Turn around performance in
challenged markets
Reset risk tolerances
Deliver on cost efficiencies
Focus on affluent and
emerging affluent clients
Invest in digital to improve
customer service/efficiency
Progress Further action
• Continue to drive growth in Priority
• Leverage digital to drive efficiencies
• Turn China and Korea profitable
• Improve returns in India, Indonesia,
Malaysia and UAE
• Resume targeted growth in CCPL
• Continued focus on conduct and control
• Improve customer experience and
sales through digital channels
Priority client income share (%)
45
27
2017
2014
Branches (#)
984
1,190
2017
2014
Cost of risk1 (bps)
38
91
2017
2014
Digitally active clients (%)
45
33
2017
2014
Loss before tax in China & Korea ($m)
(69)
(367)
2017
2014
1. Loan impairment for the ongoing business as a percentage of average gross loans and advances to customers
9
We have progressed well on our priorities… more to do

$bn 2014 2015 2016 2017 Q1 18
Income 5.7 5.1 4.7 4.8 1.3
Expenses (3.9) (3.5) (3.4) (3.6)
Impairment (0.9) (0.7) (0.5) (0.4)
Underlying
profit before tax0.9 0.9 0.8 0.9 >0.3
RWA 56 48 42 44
Underlying RoRWA 1.5% 1.8% 1.7% 2.0% >2.5%
10
• Driving higher quality income
• Created capacity to invest
• Significantly de-risked portfolio
• Higher, more sustainable return
• Reduced low-value CCPL
• Maintained profitability on lower RWA
We have repositioned for sustainable profitable growth

We are confident we can sustainably improve RoE
11
We are in economies with structural growth
drivers
We are focused on areas of strongest
differentiation
Each market has a clear strategy and tailored priorities
Our network creates valuable
opportunities
We have multiple new growth initiatives
in flight
We are self-funding substantial, targeted
investments
2
3
4
1
6
5
Sustainable
mid-teen RoE in
the medium term

AAME 8
CAGR (%), 2010 – 2030
EuAm 2-3
Growth of emerging affluent2
• Our footprint markets outpace the developed economy
on affluent growth
• AAME expected to be the largest source of wealth
creation in next 5-10 years
Rise of urban middle class1
• By 2030, over 2bn will join the middle class in AAME
• Estimated ~$750bn of new Retail Banking wallet
1. Source: The Brookings Institution
2. Source: Global Data, Affluent defined as individuals with liquid financial assets between $100K and $1m
3. Source: McKinsey, Standard Chartered estimates
4. Source: Swiss Re Institute
1 We are in economies with structural growth drivers
12
2010A 2020F 2030F
Affluent and emerging affluent
Other
~350
~750
~1,500
Growth (%)
Emerging Asia and
Middle East19
World 2
20172016
17
3
AAME Retail Banking revenue pools3 ($bn)
Life insurance premium growth4

We are focused on areas of strongest differentiation (1/2)
13
Wealth /
Deposits Mortgages2
Income
per client Our approach
>10x ~5%
>3x ~20%
1x ~60%
• Invest to build differentiated propositions
• Focused on Wealth, Deposit and Mortgage
• Deepen and continue to win market share
• Launching Premium in top markets
• Digital convenience with ‘expert on demand’
• Leverage employee banking and alliances
• Targeted growth in markets with scale
• Leverage EB to build affluent pipeline
• Relentless focus on efficiency via digital
>8x
• Expand supply chain ecosystem
• Build sales force capabilities
• Automate to build scale
~20%
2
Segment
(Definition)1
Priority
(>$100k)
Premium
(>$10k)
Personal
(<$10k)
Business (Companies)
~80%
~30%
~30%
~50%
~15%
~50%
~10%
~30%
CCPL
Income mix by product
EB = Employee Banking
1. Required funds under management in US$ on a per client basis, varies by individual market
2. Includes mortgages, auto and other
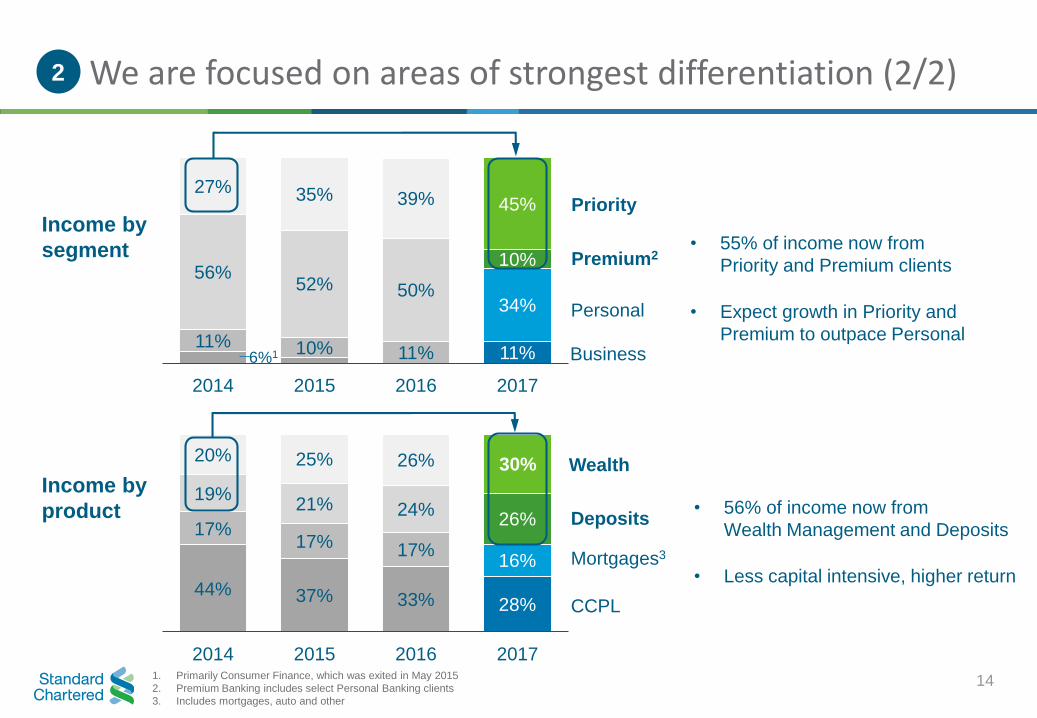
44% 37% 33% 28%
17%17% 17%
16%
19%21% 24%
26%
20% 25% 26% 30%
2014 2015 2016 2017
6%111% 10% 11% 11%
56%52% 50%
34%
10%
27% 35% 39% 45%
2014 2015 2016 2017
1. Primarily Consumer Finance, which was exited in May 2015
2. Premium Banking includes select Personal Banking clients
3. Includes mortgages, auto and other
Income by
segment
Income by
product
We are focused on areas of strongest differentiation (2/2)
14
• 55% of income now from
Priority and Premium clients
• Expect growth in Priority and
Premium to outpace Personal
Priority
Premium2
Personal
Business
Wealth
Deposits
CCPL
Mortgages3
2
• 56% of income now from
Wealth Management and Deposits
• Less capital intensive, higher return

Financial hubs
Hong Kong, Singapore
Universal marketsBangladesh, Bahrain,
Botswana, Ghana, Kenya,
Nigeria, Pakistan, Taiwan,
Uganda, Zambia, Zimbabwe
Large marketsChina, Korea, India,
Indonesia, Malaysia, UAE
Emerging marketsother markets
(e.g. Côte d'Ivoire)
• Invest to further build market share
• Further deepen Priority, Premium and Wealth
• Capture cross-border wealth corridors
• Accelerate pivot to Priority and Wealth
• Drive efficiency to fund investment
• Focus on clients’ international needs
• Potential to test digital disruptive platforms
• Enhance network value
• Enhance business model to protect returns
• Leverage scale to attract quality deposits
• Focus on core cities
Income%1
Retail
Banking
>8% RoE
WM%2 Relative RoE% Focus Markets Shift in our approach
Invest to
gain share
Grow and
deepen
Turnaround
Network
Each market has a clear strategy and tailored priorities
All financial information on this slide based on performance for the year ended 31 December 2017
1. Income % = Income as a percentage of total Retail Banking income
2. WM % = Wealth Management and Deposits income as a percentage of total income
15
3
42 66 Highest
21 63 High
34 38 Low
3 55 Low

16
Our network creates valuable opportunities4
EB = Employee Banking
1. Source: Capgemini, Asia Pacific Wealth Report 2017
Global solutions designed centrally, and
customised for deployment in multiple markets
Digital
Alliances
/ Partnerships
Segment
collaboration
Hong Kong
UAE
Singapore
Mainland China offshore wealth flows1:
$2.6tn
India (NRI)offshore wealth flows1:
$360bn
Servicing international clients’ needs
and wealth flowsR
eg
ion
al
Lo
ca
l
EB referrals from
CIB / CB clients
+28% YoY
>50% of new to
bank clients from
EB / alliances
Create leading affluent-oriented alliances
Leverage CIB / CB to drive client acquisition
Côte d’Ivoire digital bankModel to be rolled out in Africa
India real-time onboardingPlanned launches in more markets
Group
• Generates ~$27bn of surplus liquidity for the Group
• High quality funding with 73% of deposits in CASA
• Reinforce branding, local market presence

We have multiple new growth initiatives and have reinforced our approach to conduct and controls5
17
Investing in differentiated
client propositions and products
Protecting our clients by
improving risk, conduct and controls
Enhanced risk management
• Refreshed risk decision framework
• Real-time onboarding
• Digital customer due-diligence
• Enhanced sales models
Embedding good conduct into all we do
• Targeted propositions for HNWI, Expats,
Entrepreneurs and Silvers (aged 55+)
• Personalised investment ideas, click to RM
• Rolling out suite of digital Wealth and
Deposits capabilities
• Deploying Premium Executive on demand
• New digital platforms in sales and servicing
• New generation of digital products: Real-time
onboarding, DigiLoans, Rewards API
• Banking the ecosystems of CIB clients,
eCommerce platforms
• Automate client onboarding and origination
Priority
Premium
Personal
Business
• Robust controls and governance
• Incentives aligned to reward right behaviours
• Focus on proactive risk identification
• Ensure critical information highlighted to clients

We are self-funding substantial, targeted investments6
18
• Investing at pace and
scale since 2015
• Targeted at E2E Digital,
Wealth and infrastructure
• Improving our income
potential and efficiency
• Expect to sustain current
investment levels
Cash investments (2015 – 2018)
2015 2016 2017 2018
Seamless
omni-channel
experience
Banking
made easier
Trusted
Wealth advisor
Digital capabilities
Wealth products
and platforms
Risk, analytics and
infrastructure
Aalishaan ZaidiGlobal Head, Digital Banking
Focus: Digital

Yesterday Today and the Future
Going digital with a “human” touch
Journeys
20
Paper based
Traditional
channels led
Manual
decisioning
Specialist only
Automated
real-time
Self-serve
Straight
through
Mobile
led
Corporate
Partnership
and
Alliances
Fintech
and
start-up
Big tech
Companies
Measuring Impact
Service request via self-serve1
~1% ~50%
Account opening time1
5 days 15 mins
Digitally active clients (%)
33% 45%
Digital NPS
n.m. 53
2014 TodayAccelerating by
partnering
Account
opening
Transacting
/ Servicing
Investing
Borrowing
n.m. = not measured in 2014 (Digital NPS in 2016 = 46)
1. In select markets where services have been rolled out

Catering to our differentiated
market positions
Real Time Onboarding CDI
21
Popular banking
services digitised70
<
90%
Reduction in
cost per
transaction
Rapid
development
and deployment
>1yr
Automated
with direct link
to national IDCDDDigital only bank in
Côte d'Ivoire1st
Instant account
opening15
minutes
~

22
Online Equity Trading
50%
Increase in
online
acquisition
Uplift in digital
sales since
20152.4x
2xIncrease in
monthly income
Increase in
monthly new
accounts23%
Catering to our differentiated
market positions
Asia Miles

FinTechWe select
BigTechWe connect
Accelerating by partnering with
FinTech and BigTech players
Access to cash
at 400 retail locations
in SingaporeSoCash Connected in
2 markets
SocialChannels
Keyboard banking in
Korea – access to
banking from any appPayKey Live in
7 markets
DigitalPayments
23

Focus: Wealth Management
Didier von DaenikenGlobal Head, Private and Wealth Management

Diversified and resilient with a track record of growth
1.4
2009 2010 2011 2012 2013 2014 2015 2016 2017
Track record of growth over last decadeRetail Banking Wealth Management income ($bn)
25
Our Wealth Management proposition
• Differentiated wealth advisory capabilities
• Open architecture from investment strategy
through to product selection
• Strong strategic partnerships with insurers and
asset managers
• Distribution presence in the fastest growing
markets for wealth management
Diversified and resilient income mix2017 income mix (%)
Insurance
18%
40%
Capital market1
18%FX
24%
Funds
1. Capital market includes Cash Equities, Fixed Income, Structured Products and Wealth lending
+10%
CAGR
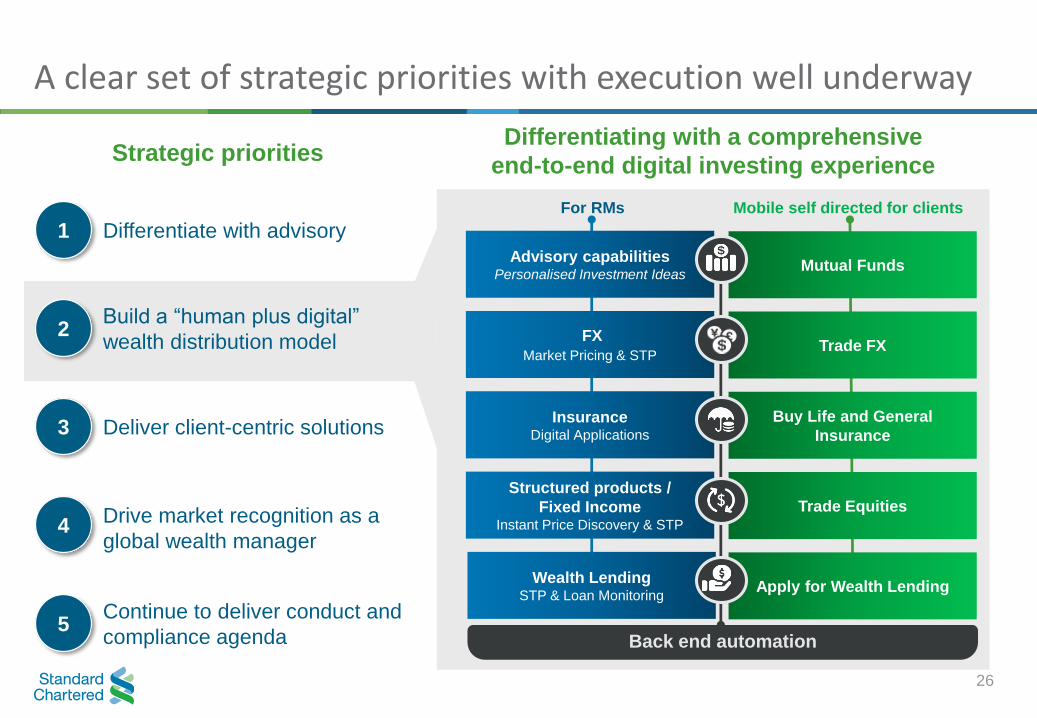
A clear set of strategic priorities with execution well underway
Continue to deliver conduct and
compliance agenda5
Deliver client-centric solutions3
Build a “human plus digital”
wealth distribution model2
Differentiate with advisory1
Drive market recognition as a
global wealth manager4
Strategic prioritiesDifferentiating with a comprehensive
end-to-end digital investing experience
For RMs Mobile self directed for clients
Advisory capabilitiesPersonalised Investment Ideas
Mutual Funds
InsuranceDigital Applications
Buy Life and General
Insurance
FX
Market Pricing & STPTrade FX
Structured products /
Fixed IncomeInstant Price Discovery & STP
Trade Equities
Wealth LendingSTP & Loan Monitoring
Apply for Wealth Lending
Back end automation
26
27
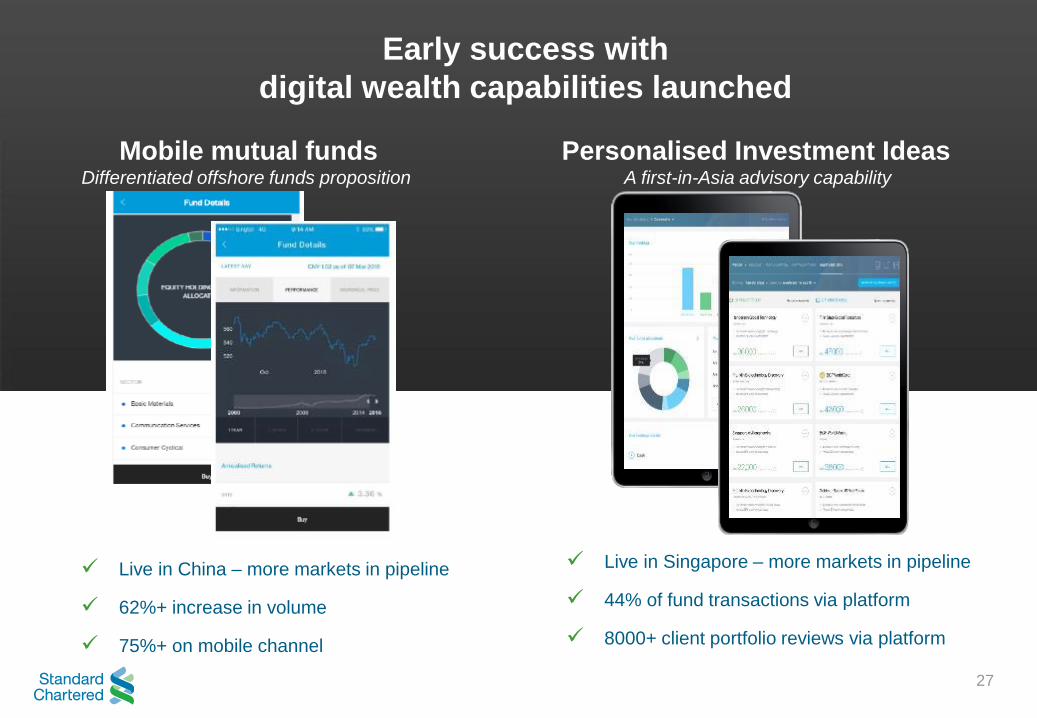
Early success with
digital wealth capabilities launched
Mobile mutual fundsDifferentiated offshore funds proposition
Personalised Investment IdeasA first-in-Asia advisory capability
✓ Live in Singapore – more markets in pipeline
✓ 44% of fund transactions via platform
✓ 8000+ client portfolio reviews via platform
✓ Live in China – more markets in pipeline
✓ 62%+ increase in volume
✓ 75%+ on mobile channel

Retail BankingBen Hung

Summary – what you can expect from us
29
Sustainable mid-teen RoE in the medium term
Medium-term objectives How to measure progress
▪ Generate more high quality liquidityfor the Group
3
▪ Engage clients more digitally ▪ Further increase in digital adoption2
▪ Continue pivot to:
• Priority and Premium
• Wealth Management and Deposits
▪ Focus on areas of strongest
differentiation1
▪ Invest, while delivering positive
operating leverage
▪ Mid-to-high single-digit income CAGR
▪ Controlling cost to support the Group’s cost target…
▪ … while continuing to invest
4
▪ Increase surplus liquidity

Samir SubberwalRegional Head of Retail Banking, GCNA
GCNA Retail Banking
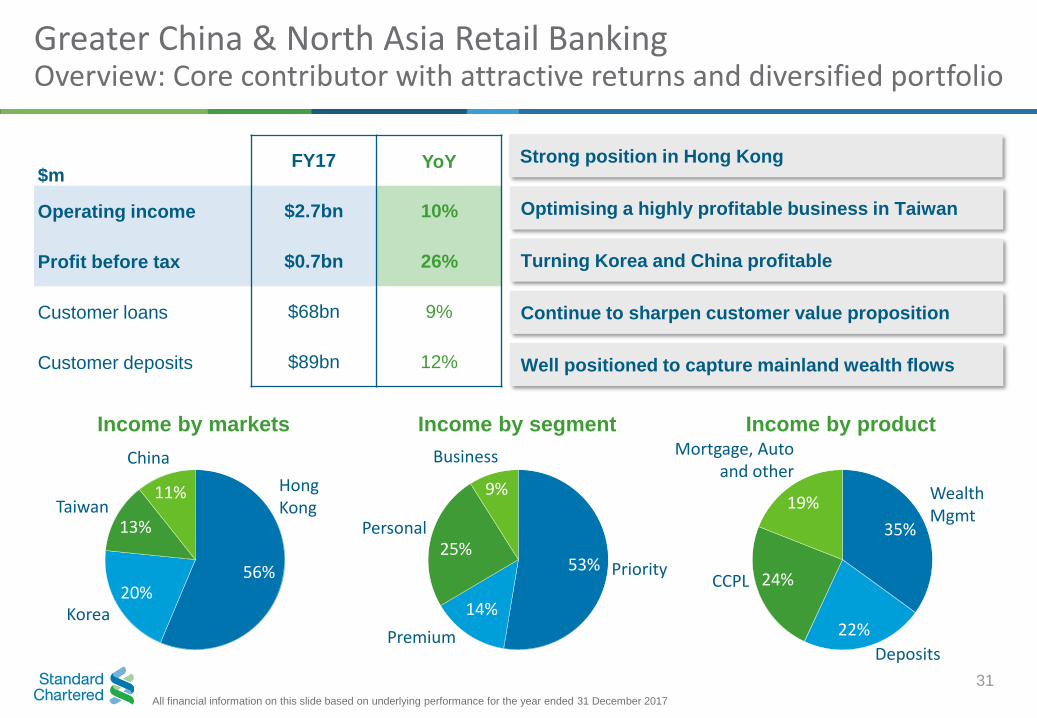
Greater China & North Asia Retail BankingOverview: Core contributor with attractive returns and diversified portfolio
Strong position in Hong Kong
Optimising a highly profitable business in Taiwan
Well positioned to capture mainland wealth flows
Income by markets Income by segment Income by product
$mFY17 YoY
Operating income $2.7bn 10%
Profit before tax $0.7bn 26%
Customer loans $68bn 9%
Customer deposits $89bn 12%
All financial information on this slide based on underlying performance for the year ended 31 December 2017
Taiwan
Korea
56%
13%
11%
20%
Hong Kong
China
Personal
53%25%
Premium
Priority
9%
Business
35%
Deposits
19%
Mortgage, Autoand other
WealthMgmt
24%
22%
CCPL
Turning Korea and China profitable
Continue to sharpen customer value proposition
14%
31

• Competitive landscape dominated by large local players investing
• Increasing regulatory compliance costs
• Potential disruption from FinTechs and Platform players
• Three years into transformation with encouraging progress
• Significantly grew share of income from Priority clients to 53% (2015: 41%)
• Continued investment in digital to improve client experience
• Progressing well against multi-year Wealth product and platform capability build
• Alliances and EB through CIB/CB ecosystem showing early success
• Drive return on investments through top line and efficiencies
• Continue to improve income quality: targeted clients, products and risk profile
• Continue to sharpen CVP centred around customer needs and lifestyle
• Further strengthen brand, simplify our product and service offering
Greater China & North Asia Retail BankingKey messages
32
Challenges
Progress
Priorities

Focus on
Affluent and
Emerging
Affluent
Leveraging
alliances and
Employee
Banking
Build
best-in-class
digital
capabilities
Hong Kong: Accelerating growthStrong position with room to grow further
Wealth and Deposit income as % of totalPriority as % of total income
# of NTB through alliances# of Priority NTB from Employee Banking
% of digitally active clients# of products sold through digital channels
Hong Kong Income of $1.5bn (+11% YoY)
69%
20172015
56%
61%
20172015
51%
2017201520172015
20172015
33
35%44%
2015 2017
+2.3x +14x
+2.4x
+10pp +13pp

Taiwan, Korea and ChinaTransformation in Taiwan, Turning Korea and China profitable
Challenges Strategic priorities
▪ Underpenetrated client base
▪ Predominantly in Personal
▪ Reliant on lending
▪ High cost to income ratio
✓ Focus in SKI1 area
✓ Scale up EB and alliances to
build scale in affluent segment
✓ Build Priority brand and
WM product / platform
▪ Low market share
▪ Reliant on lending
▪ Low productivity
✓ Focus on core growth cities
✓ Drive EB and alliances
✓ Improve productivity
✓ Build WM product / platform
▪ Universal bank outside Taipei
▪ Moderate scale in Taipei
▪ Legacy branch network
concentrated in two cities
✓ Focus on 5 core cities
✓ EB / Alliances to build scale in
affluent segment in Taipei
✓ Build WM product / platform
WM% = Wealth Management and Deposits income as a percentage of total income
1. Seoul, Kyungki and Incheon
34
TaiwanIncome: $343m
(+8% YoY)
KoreaIncome: $546m
(+7% YoY)
ChinaIncome: $284m
(+9% YoY)
Income
WM%: 62
WM%: 33
WM%: 40
Relative ROE: High
Relative ROE: Low
Relative ROE: Low
2015 2016 2017
2015 2016 2017
2015 2016 2017
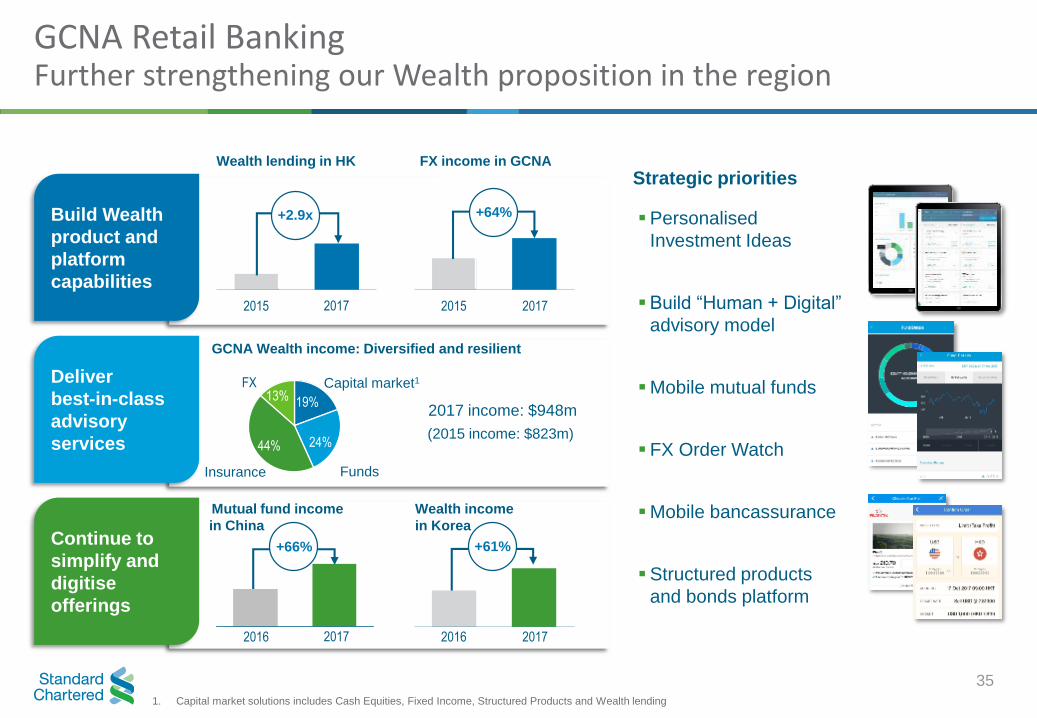
Build Wealth
product and
platform
capabilities
Deliver
best-in-class
advisory
services
Continue to
simplify and
digitise
offerings
GCNA Retail Banking Further strengthening our Wealth proposition in the region
1. Capital market solutions includes Cash Equities, Fixed Income, Structured Products and Wealth lending
▪Personalised
Investment Ideas
▪Build “Human + Digital”
advisory model
▪Mobile mutual funds
▪FX Order Watch
▪Mobile bancassurance
▪Structured products
and bonds platform
Wealth lending in HK FX income in GCNA
GCNA Wealth income: Diversified and resilient
Wealth income
in Korea
(2015 income: $823m)
2017 income: $948m
Mutual fund income
in China
Strategic priorities
35
20172015 20172015
20172016 20172016
FX
FundsInsurance
Capital market1
44%
13% 19%
24%
+2.9x +64%
+66% +61%

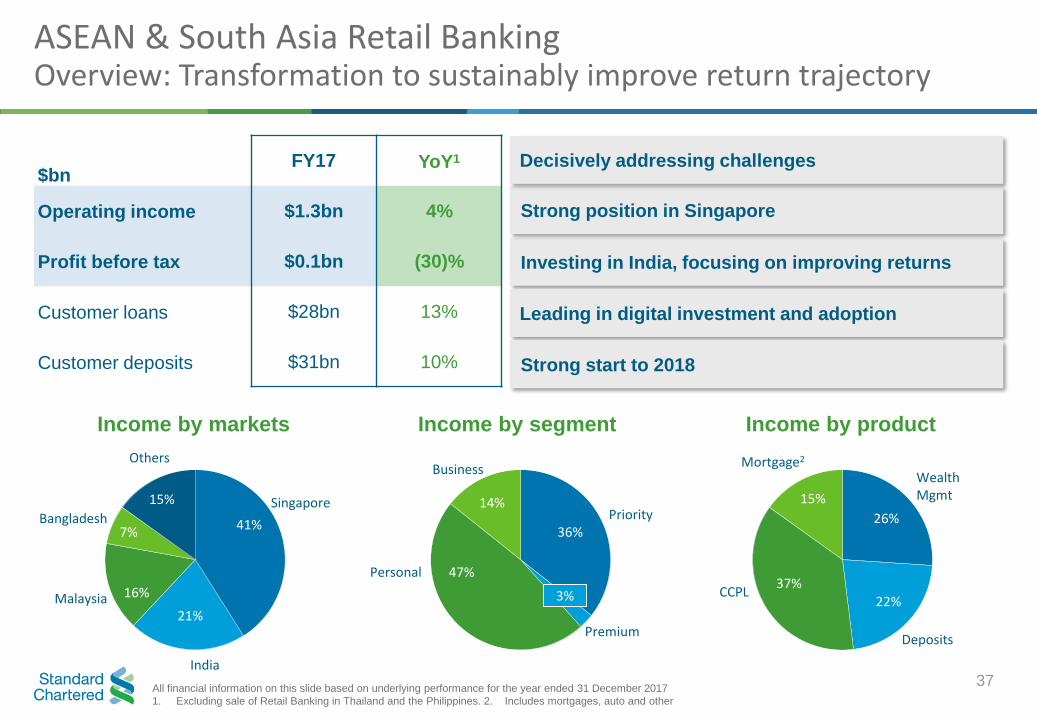
ASA Retail Banking
Sebastian Arcuri Regional Head of Retail Banking, ASA
Investing in India, focusing on improving returns
Leading in digital investment and adoption
Strong position in Singapore
Income by markets Income by segment Income by product
$bnFY17 YoY1
Operating income $1.3bn 4%
Profit before tax $0.1bn (30)%
Customer loans $28bn 13%
Customer deposits $31bn 10%
All financial information on this slide based on underlying performance for the year ended 31 December 2017
1. Excluding sale of Retail Banking in Thailand and the Philippines. 2. Includes mortgages, auto and other
Singapore
41%
Malaysia
15%
Others
Bangladesh
16%
7%
Personal
14%
36%
Priority
50%
Business
Strong start to 2018
21%
India
Premium
36%
47%
14%
3%
Mortgage2
22%
15%
CCPL37%
Deposits
26%
WealthMgmt
Decisively addressing challenges
37
ASEAN & South Asia Retail BankingOverview: Transformation to sustainably improve return trajectory

• Margin compression due to interest rate reduction and regulatory changes
• Legacy portfolio with over reliance on mass and high intensity RWA products
• Dependency on non-automated processes, resulting in high operational cost
• Two years into transformation with encouraging progress
− Divested subscale businesses (Thailand, Philippines)
− Invested in high growth / opportunity markets (Singapore, India, Bangladesh)
• Improved revenue mix from Priority and Wealth (+14pp and +11pp from 2014)
• Significantly invested in digital to improve client experience
• Wealth capability build well underway, Wealth AUM +34% YoY
• Drive return on investments through both income and cost lines
• Accelerate pivot to Affluent and Emerging Affluent client segments
• Continue to improve income quality: targeted geographies, clients, product mix
• Capture international flow business in Singapore and India
ASEAN & South Asia Retail BankingKey messages
38
Challenges
Progress
Priorities

Focusing on
Affluent and
Emerging
Affluent
Capturing
ASEAN wealth
corridor into
Singapore
Building
best-in-class
digital and
payments
capabilities
Singapore reported 2017 income of $539m (+7% YoY)
SingaporeLeading the region with clear propositions
39
Enhancing our propositions in
Priority and Wealth
MyWay Programme
• Targets 55+ year olds
• ~20% of SG population
• ~50% of SG WM AuM
• First to launch Personalised Investment Ideas
• Differentiated propositions in:
Core retail product portfolio
Cross border services, focusing on inbound SG
• Propositions delivering 30% AuM YoY growth
39
3957
2015 2017
Wealth and Deposit
income as % of total
Priority income
as % of total
International Banking Center (“IBC”)
▲59%Growth in IBC
income since
2015
▲40%Growth in no. of
IBC new-to-bank
clients since 2015
32 40
2015 2017
Online remittances
with FX
Mobile wallets
spend
Q1 17 Q1 18 Q1 17 Q1 18
116% 102%
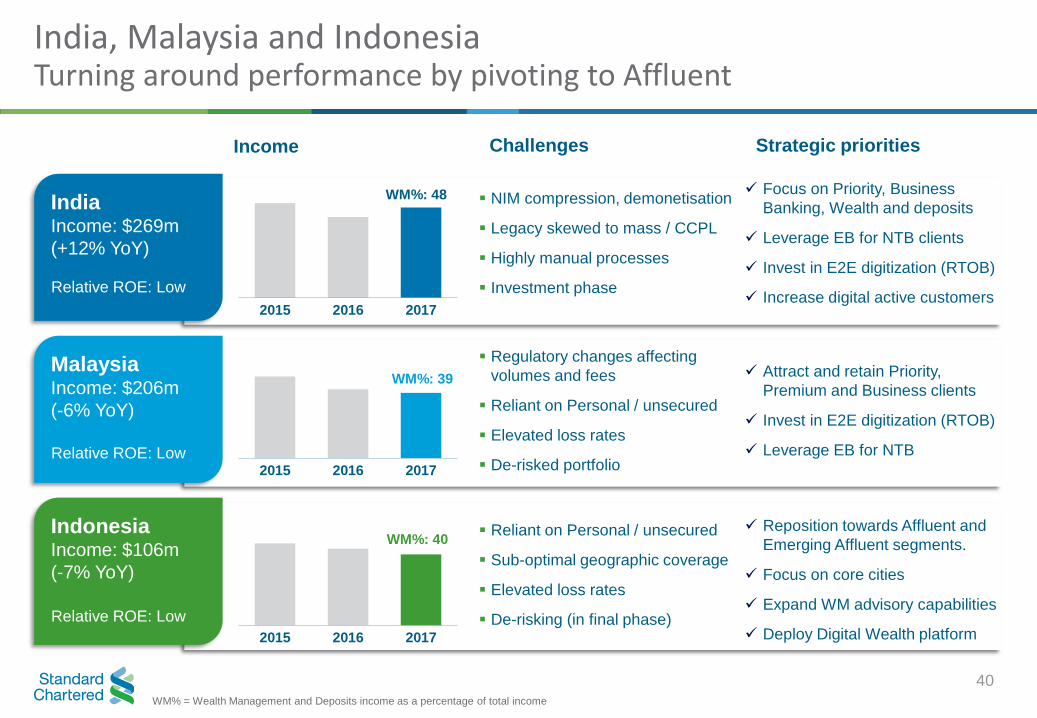
IndiaIncome: $269m
(+12% YoY)
MalaysiaIncome: $206m
(-6% YoY)
IndonesiaIncome: $106m
(-7% YoY)
India, Malaysia and IndonesiaTurning around performance by pivoting to Affluent
Challenges Strategic priorities
▪ Regulatory changes affecting
volumes and fees
▪ Reliant on Personal / unsecured
▪ Elevated loss rates
▪ De-risked portfolio
✓ Attract and retain Priority,
Premium and Business clients
✓ Invest in E2E digitization (RTOB)
✓ Leverage EB for NTB
▪ Reliant on Personal / unsecured
▪ Sub-optimal geographic coverage
▪ Elevated loss rates
▪ De-risking (in final phase)
✓ Reposition towards Affluent and
Emerging Affluent segments.
✓ Focus on core cities
✓ Expand WM advisory capabilities
✓ Deploy Digital Wealth platform
▪ NIM compression, demonetisation
▪ Legacy skewed to mass / CCPL
▪ Highly manual processes
▪ Investment phase
✓ Focus on Priority, Business
Banking, Wealth and deposits
✓ Leverage EB for NTB clients
✓ Invest in E2E digitization (RTOB)
✓ Increase digital active customers
40
Income
WM%: 48
WM%: 39
WM%: 40
WM% = Wealth Management and Deposits income as a percentage of total income
Relative ROE: Low
Relative ROE: Low
Relative ROE: Low
2015 2016 2017
2015 2016 2017
2015 2016 2017
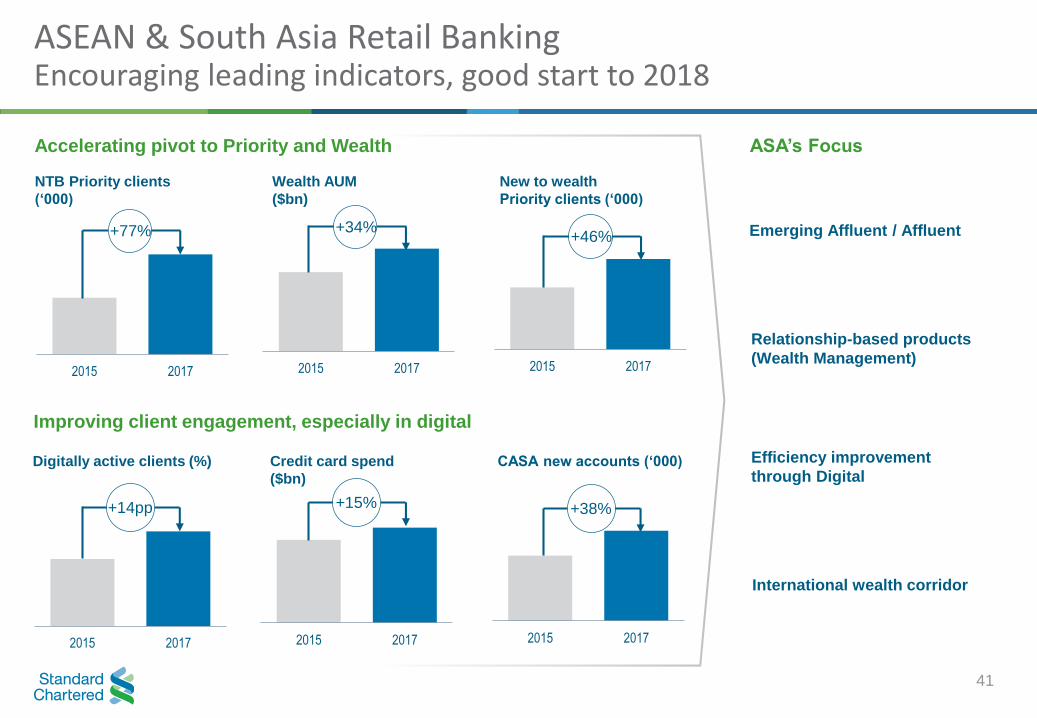
ASEAN & South Asia Retail BankingEncouraging leading indicators, good start to 2018
41
Emerging Affluent / Affluent
Relationship-based products
(Wealth Management)
Efficiency improvement
through Digital
NTB Priority clients
(‘000)
Wealth AUM
($bn)
New to wealth
Priority clients (‘000)
2015 20172015 2017 2015 2017
Digitally active clients (%) Credit card spend
($bn)
CASA new accounts (‘000)
2015 20172015 2017 2015 2017
Improving client engagement, especially in digital
International wealth corridor
ASA’s Focus Accelerating pivot to Priority and Wealth
+77%
+38%
+34%+46%
+14pp +15%

AME Retail Banking
Jaydeep GuptaRegional Head of Retail Banking, AME
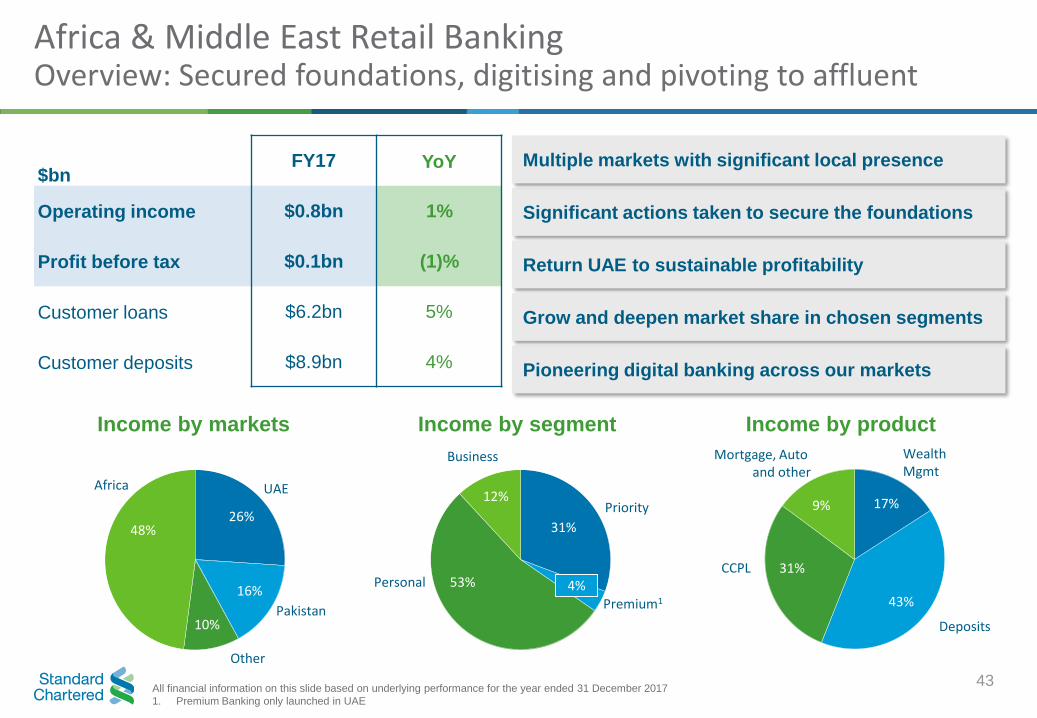
Africa & Middle East Retail BankingOverview: Secured foundations, digitising and pivoting to affluent
43
Significant actions taken to secure the foundations
Multiple markets with significant local presence$bn
FY17 YoY
Operating income $0.8bn 1%
Profit before tax $0.1bn (1)%
Customer loans $6.2bn 5%
Customer deposits $8.9bn 4%
All financial information on this slide based on underlying performance for the year ended 31 December 2017
1. Premium Banking only launched in UAE
UAE
26%
Pakistan
48%
Africa
Other
16%
10%
Personal
12%
31%
Priority
57%
Business
Pioneering digital banking across our markets
Premium1
31%
4%53%
12%
Mortgage, Auto and other
[XX%]
[XX%]
Deposits
43%
CCPL
17%
WealthMgmt
Return UAE to sustainable profitability
Grow and deepen market share in chosen segments
9% 17%
43%
31%
Income by markets Income by segment Income by product

• Significant actions had to be taken to secure the foundation
• Margin compression due to interest rate reduction and regulatory changes
• Legacy portfolio with over reliance on unsecured loans
• Two years into transformation and making steady progress
• Increased Priority income mix to 31% in 2017 (2015: 29%)
• Expanded range and market coverage of retail and wealth products
• Extensively deployed analytics capabilities to drive productivity
• Launched digital bank
• Drive sustainably higher returns with a key focus on the Middle East
• Scale up and accelerate growth in Wealth Management
• Strengthen customer value propositions for affluent and mass
• Deploy digital bank across our markets to reduce cost of acquisition
Africa & Middle East Retail BankingKey messages
44
Challenges
Progress
Priorities
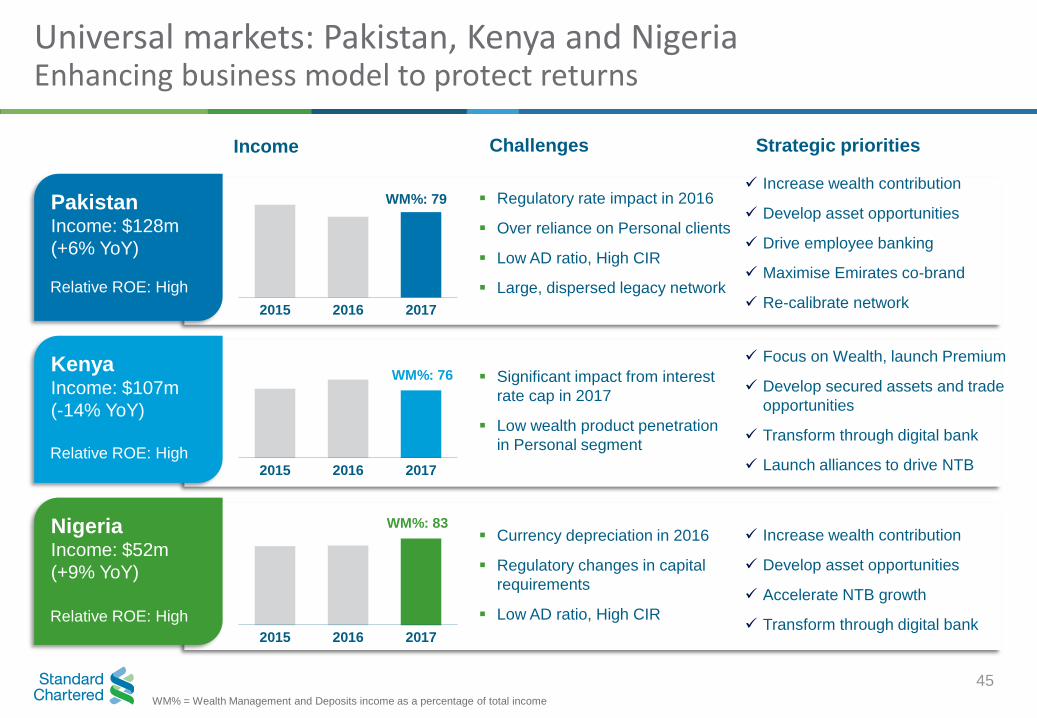
PakistanIncome: $128m
(+6% YoY)
KenyaIncome: $107m
(-14% YoY)
NigeriaIncome: $52m
(+9% YoY)
Universal markets: Pakistan, Kenya and NigeriaEnhancing business model to protect returns
Challenges Strategic priorities
▪ Significant impact from interest
rate cap in 2017
▪ Low wealth product penetration
in Personal segment
✓ Focus on Wealth, launch Premium
✓ Develop secured assets and trade
opportunities
✓ Transform through digital bank
✓ Launch alliances to drive NTB
▪ Currency depreciation in 2016
▪ Regulatory changes in capital
requirements
▪ Low AD ratio, High CIR
✓ Increase wealth contribution
✓ Develop asset opportunities
✓ Accelerate NTB growth
✓ Transform through digital bank
▪ Regulatory rate impact in 2016
▪ Over reliance on Personal clients
▪ Low AD ratio, High CIR
▪ Large, dispersed legacy network
✓ Increase wealth contribution
✓ Develop asset opportunities
✓ Drive employee banking
✓ Maximise Emirates co-brand
✓ Re-calibrate network
45
Income
WM%: 79
WM%: 76
WM%: 83
WM% = Wealth Management and Deposits income as a percentage of total income
Relative ROE: High
Relative ROE: High
Relative ROE: High
2015 2016 2017
2015 2016 2017
2015 2016 2017

2015 2016 2017
2015 2016 2017
UAEIncome:$215m
(+1% YoY)
BahrainIncome: $65m
(+3% YoY)
Middle East: UAE, BahrainDe-risked portfolio and reshaped business
Income Challenges Strategic priorities
▪ De-risked portfolio
▪ Exited SME segment
▪ Wealth slowdown due to macro
▪ Margin pressure on unsecured
✓ Drive cross border opportunities
across GCC
✓ Leverage best-in-class alliance with
Gulf Air to drive cards proposition
✓ Launch structured notes and new
insurance partnerships
▪ De-risked portfolio
▪ Exited SME segment
▪ Wealth slowdown due to macro
▪ Margin pressure on mortgage
▪ High AD ratio
✓ Continue to accelerate Wealth
✓ Develop sustainable funding base
✓ Focus on Priority and Premium
✓ Leverage strong digital penetration
in the UAE
46WM% = Wealth Management and Deposits income as a percentage of total income
WM%: 33
WM%: 37
Relative ROE: Low
Relative ROE: Medium

Reshaping Retail Participation ModelFirst fully digital retail bank in Côte d'Ivoire
47
Building relationships through technology
• Major milestone reinforcing commitment to AME
• Unique disruptive solution designed entirely on client inputs
• Digitised over 70 of the most popular banking services
• Account opening anytime, anywhere in less than 15 minutes
• Planned launches across AME with enhanced capabilities
1stDigital only bank in
Côte d'Ivoire
70+Popular banking
services digitised
<1 year
Development and
deployment

Products and Segments
Fernando MorilloGlobal Head, Retail Products and Segments
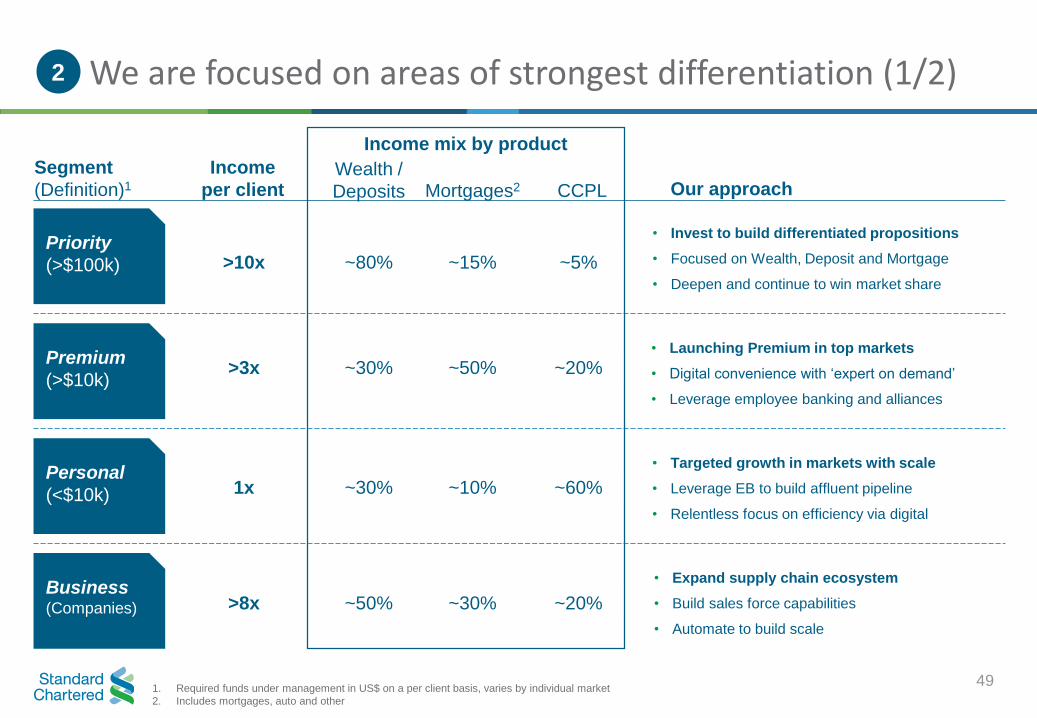
We are focused on areas of strongest differentiation (1/2)
49
Wealth /
Deposits Mortgages2
Income
per client Our approach
>10x ~5%
>3x ~20%
1x ~60%
• Invest to build differentiated propositions
• Focused on Wealth, Deposit and Mortgage
• Deepen and continue to win market share
• Launching Premium in top markets
• Digital convenience with ‘expert on demand’
• Leverage employee banking and alliances
• Targeted growth in markets with scale
• Leverage EB to build affluent pipeline
• Relentless focus on efficiency via digital
>8x
• Expand supply chain ecosystem
• Build sales force capabilities
• Automate to build scale
~20%
2
Segment
(Definition)1
Priority
(>$100k)
Premium
(>$10k)
Personal
(<$10k)
Business (Companies)
~80%
~30%
~30%
~50%
~15%
~50%
~10%
~30%
CCPL
Income mix by product
1. Required funds under management in US$ on a per client basis, varies by individual market
2. Includes mortgages, auto and other

• Presence in 25 markets and 5 Global Banking centres
• ~2,400 Relationship Managers
• ~1 million clients
• Key liquidity provider for the Group
Priority Banking: A leading affluent bank in our markets
50
Key facts
• International franchise and Wealth capabilities
• Consistent customer value proposition
• Independent advice, open architecture
• “Best in class International” NPS in 7 markets
Differentiators
• Accelerate client acquisition with targeted CVPs
(HNWI, Entrepreneurs, Silvers, Expats)
• Improved client engagement models: PII, click to RM
• Accelerate deposit growth
Key initiatives
✓

• Emerging affluent focus: Millennials, young
professionals and couples and young parents
• Typically younger demographic: <40 years of age
• ~1 million clients, ~10% of Retail income
• Highly digital clients
Premium Banking: Delivering for emerging affluent clients
51
Key facts
• Access to Premium Executives seamlessly via chat /
call on digital banking platform
• Strong reward offering
• Digital savings and investment products
Differentiators
• Rolling out in top markets
• Further develop CVP, rollout suite of digital WM and deposits
• Deploy Premium Executive on demand across top markets
Key initiatives
✓

• >7 million active clients
• ~35% of Retail income, CCPL main income source
• ~5m credit cards in issue, ~1/2 of new clients from cards
• Strong Risk Decision Framework in place
Personal Banking: Growing from more secure foundations
52
Key facts
• “Best Consumer Digital Bank”: Global Finance
• High quality credit card offering:
• Best Co-Brand (Asia Miles HK)
• Best Cashback (Unlimited SG, Titanium UAE)
• Most Innovative (JustOne Platinum MY)
Differentiators
• New digital platforms in sales and servicing
• New generation of digital products: Real-time onboarding,
instant issuance / virtual cards, DigiLoans, Rewards API
Key initiatives
✓

Business Banking: Building on our clients’ ecosystems
• International brand and sustained presence
• Efficient risk decisioning
• Attractive combination of retail distribution and
corporate product capabilities
• Automate client onboarding and loan origination
• Bank supply-chain ecosystems of CIB clients
• Build sales force capabilities for larger clients
• Aimed at <$15m sales turnover businesses
• ~10% of Retail income with good momentum
• Typically small market shares, headroom to grow
• Liability led business
• A/D ratio of ~50%, CASA > 60% of deposits
• ~65% secured financing and low impairments
• Strong connectivity with Retail and CIB
• Owners with Priority profiled
• Part of wider CIB ecosystem
Key facts Differentiators
Key initiatives
53
✓

Retail BankingBen Hung

Retail Banking investment case
55
• Recognised as best-in-class international
bank in 7 of our 8 top markets for Priority clients
• Self-funded targeted investments since 2015 in
Digital, Wealth and infrastructure
Attractive footprint
Distinctive differentiators Investing in our future
• Distinctive open architecture wealth proposition driving
double digit income and AUM CAGRover the past decade
RoE
>8%plans to deliver
mid-teen RoE
• Digital transformation improving client experience
and delivering efficiency
• Over 99% of our income from Asia, Africa
and the Middle East
• Revenue pools across our markets forecast
to double in the next decade
All financial information on this slide based on performance for the year ended 31 December 2017
• Markets generating ~2/3 of income in aggregate
already delivering a mid-teen RoE
Clear market strategy
• Pivoting towards affluent and
emerging affluent clients
Q&A
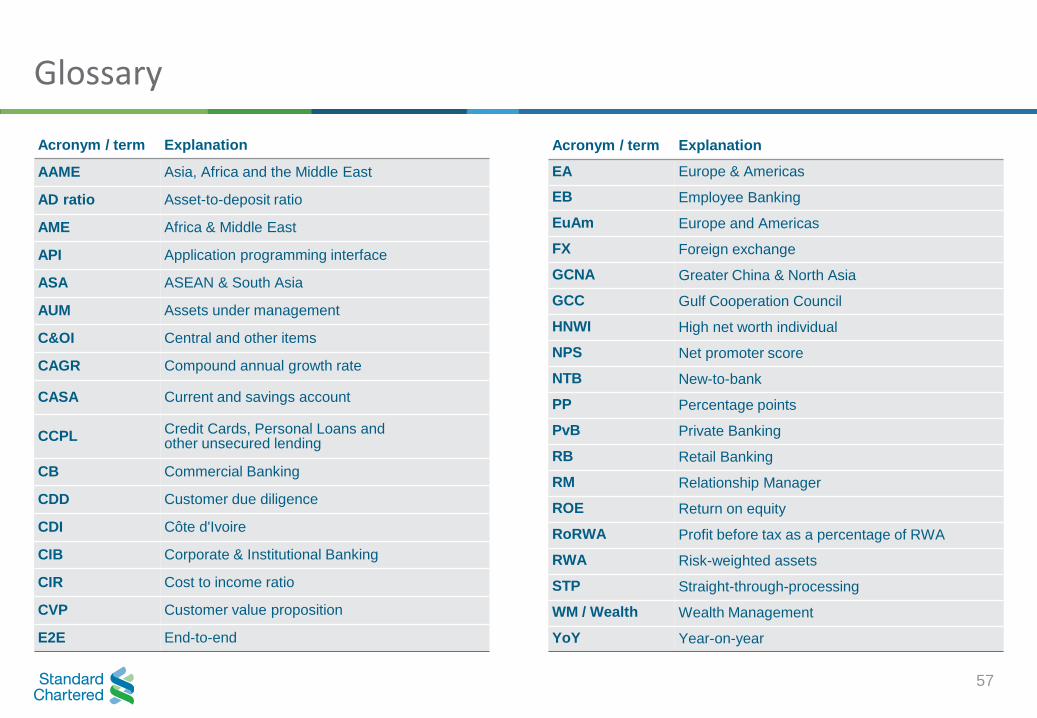
Glossary
Acronym / term Explanation
AAME Asia, Africa and the Middle East
AD ratio Asset-to-deposit ratio
AME Africa & Middle East
API Application programming interface
ASA ASEAN & South Asia
AUM Assets under management
C&OI Central and other items
CAGR Compound annual growth rate
CASA Current and savings account
CCPLCredit Cards, Personal Loans and other unsecured lending
CB Commercial Banking
CDD Customer due diligence
CDI Côte d'Ivoire
CIB Corporate & Institutional Banking
CIR Cost to income ratio
CVP Customer value proposition
E2E End-to-end
Acronym / term Explanation
EA Europe & Americas
EB Employee Banking
EuAm Europe and Americas
FX Foreign exchange
GCNA Greater China & North Asia
GCC Gulf Cooperation Council
HNWI High net worth individual
NPS Net promoter score
NTB New-to-bank
PP Percentage points
PvB Private Banking
RB Retail Banking
RM Relationship Manager
ROE Return on equity
RoRWA Profit before tax as a percentage of RWA
RWA Risk-weighted assets
STP Straight-through-processing
WM / Wealth Wealth Management
YoY Year-on-year
57

Important Notice
This document contains or incorporates by reference “forward-looking statements” regarding the belief or current expectations of Standard Chartered PLC (the “Company”), the board
of the Company (the “Directors”) and other members of its senior management about the strategy, businesses and performance of the Company and its subsidiaries (the “Group”) and
the other matters described in this document. Generally, words such as ‘‘may’’, ‘‘could’’, ‘‘will’’, ‘‘expect’’, ‘‘intend’’, ‘‘estimate’’, ‘‘anticipate’’, ‘‘believe’’, ‘‘plan’’, ‘‘seek’’, ‘‘continue’’ or
similar expressions are intended to identify forward-looking statements.
Forward-looking statements involve inherent risks and uncertainties. They are not guarantees of future performance and actual results could differ materially from those contained in
the forward-looking statements. Recipients should not place reliance on, and are cautioned about relying on, any forward-looking statements. Forward-looking statements are based on
current views, estimates and assumptions and involve known and unknown risks, uncertainties and other factors, many of which are outside the control of the Group and are difficult to
predict. Such risks, factors and uncertainties may cause actual results to differ materially from any future results or developments expressed or implied from the forward-looking
statements. Such risks, factors and uncertainties include but are not limited to: changes in the credit quality and the recoverability of loans and amounts due from counterparties;
changes in the Group’s financial models incorporating assumptions, judgments and estimates which may change over time; risks relating to capital, capital management and liquidity;
risks associated with implementation of Basel III and uncertainty over the timing and scope of regulatory changes in various jurisdictions in which the Group operates; risks arising out
of legal and regulatory matters, investigations and proceedings; operational risks inherent in the Group’s business; risks ar ising out of the Group’s holding company structure; risks
associated with the recruitment, retention and development of senior management and other skilled personnel; risks associated with business expansion and engaging in acquisitions;
reputational, compliance, conduct, information and cyber security and financial crime risks; global macroeconomic and geopoli tical risks; risks arising out of the dispersion of the
Group’s operations, the locations of its businesses and the legal, political and economic environment in such jurisdictions; competition; risks associated with the UK Banking Act 2009
and other similar legislation or regulations; changes in the credit ratings or outlook for the Group; market, interest rate, commodity prices, equity price and other market risk; foreign
exchange risk; financial market volatility; systemic risk in the banking industry and among other financial institutions or corporate borrowers; country risk; risks arising from operating in
markets with less developed judicial and dispute resolution systems; risks arising out of regional hostilities, terrorist attacks, social unrest or natural disasters; climate related transition
and physical risks; business model disruption risks; the implications of a post-Brexit and the disruption that may result in the United Kingdom and globally from the withdrawal of the
United Kingdom from the European Union; and failure to generate sufficient level of profits and cash flows to pay future dividends.
Any forward-looking statement contained in this document is based on past or current trends and/or activities of the Company and should not be taken as a representation that such
trends or activities will continue in the future. No statement in this document is intended to be a profit forecast or to imply that the earnings of the Company and/or the Group for the
current year or future years will necessarily match or exceed the historical or published earnings of the Company and/or the Group. Each forward-looking statement speaks only as of
the date of the particular statement. Except as required by any applicable law or regulations, the Company expressly disclaims any obligation or undertaking to release publicly or
make any updates or revisions to any forward-looking statement contained herein whether as a result of new information, future events or otherwise.
Nothing in this document shall constitute, in any jurisdiction, an offer or solicitation to sell or purchase any securities or other financial instruments, nor shall it constitute a
recommendation or advice in respect of any securities or other financial instruments or any other matter.
58