investor presentation - shalby hospitals
TRANSCRIPT

InvestorPresentation
SHALBY LIMITED (BSE CODE: 540797 I SHALBY, NSE CODE: SHALBY)
A leader in Joint Replacement surgeries in India with an established chain of multi-specialty tertiary care hospitals.

2
AGENDA
01 BUSINESS OVERVIEW
02 FINANCIAL PERFORMANCE
03 STRATEGIC DIRECTION
04 APPENDIX

BUSINESS OVERVIEW

4
OUR REGIONAL PRESENCE
PUNJAB
Mohali – 145 beds
RAJASTHAN
Jaipur – 237 beds
GUJARAT
Ahmedabado SG – 201 bedso Krishna – 220 bedso Vijay – 27 bedsoNaroda – 267 beds
Vapi – 146 beds
Surat – 243 beds
MADHYA PRADESH
Indore – 243 beds
Jabalpur – 233 bedsMAHARASHTRA
Mumbai (Santacruz) – 175 beds
Nashik – 113 beds
Ghatkoper (Zyonova) – 100 beds
National Presence International Presence (in Africa)
MAHARASHTRA
Ghatkoper (Zynova) – 50 beds
Upcoming Two Units
Shalby has developed strong brand recognition in its core markets and is well positioned for further expansion
Existing 11 Units (2012 beds) Upcoming 2 Units (288 beds) 50 Outpatient Clinics across 15 states in India
Existing 11 Units (2012 beds) Upcoming 2 Units (288 beds) 50 Outpatient Clinics across 15 states in India
Existing 11 Units (2012 beds) Upcoming 2 Units (288 beds) 50 Outpatient Clinics across 15 states in India

5
BUSINESS MODEL
Naroda2017 Year
267 Beds
SG2007 Year
201 Beds
Nashik2023 Year
113 Beds
Jabalpur2015 Year
233 Beds
Santa Cruz 2024 Year
175 Beds
Greenfield 907 Beds Brownfield977 Beds
Acquisition366 Beds
Franchise
Upcoming hospital developments
Lea
sed
Fra
nc
his
e
Faster time to market
Low
er c
ap
ital re
qu
irem
en
tJaipur2017 Year
237 Beds
Vijay 1994 Year
27 BedsSurat
2017 Year
243 Beds
Indore2015 Year
243 BedsKrishna
2012 Year
220 Beds
Vapi2012 Year
146 Beds
Mohali2017 Year
145 Beds
Fre
eh
old
Notes:1. SG Group comprises of SG and Vijay. Surat Group comprises of Surat and Vapi2. Fixed rent of Rs. 5L per month is paid by Shalby SG to Dr. Vikram Shah and Rs. 50,000 per month is paid by Vijay Shalby to Shalby Orthopedic and Research Centre in which Dr. Vikram Shah is a partner3. Total bed count of 2012 includes 50 beds at Zynova-Shalby Hospital, Mumbai
New Growth Area

6
Our Business Model – Optimising Capex and Opex
BUSINESS MODEL
Lowest Capex and Opex per bed due to optimal use of real-estate
Equipment planning and utilities planning
In-house planning teams
Focus on surgeries with higher
ARPOB, better margins and return ratios
Centralised procurement
Gradual ramp-up of bed capacity
Fully owned or O&M on revenue sharing (no fixed rentals, no security deposit or MG)
Optimize capexplanning with
Inhouse projects
team
Utilities planningto optimize
capex
Better utilizationof space [andexpensive real
estate]
Cost per bed ~Rs. 4.5 millionsfor fully owned
set-up. Lower for leased premises
OperationalEfficiency due
tobetter capex
planning
Low consumable
cost
Leveragingeconomies ofscale through
centralizedprocurement
EBITDA upwards of 20% which is
higher than industry average

7
CARDIAC GROWTH
The Cardiac growth story in India
Year 1984
Surgeries
Year 1994
Surgeries
Year 2017
Surgeries
Year 2004
Surgeries~ 500
~ 5,000
~ 50,000
~ 2,00,000
CAGR – 29% in 30 years.
Currently growing @ 2-3%
Wide procedure penetration
to Tier 2 and 3 cities

8
KNEE REPLACEMENT
Knee Replacement - The big opportunity
Year 1994
Surgeries
Year 2000
Surgeries
Year 2017
Surgeries
Year 2010
Surgeries~ 300
~ 6,000
~ 54,000
~ 1,75,000
Last year, In United States ~0.8 mn knee
replacements in a population of
~300 mn
Asian population 15
times more prone to Arthritis
of knee than their western counter parts
India has a similar affording
population. Hence, direct potential to
grow to 8 lacs Knee
replacements
Hence huge potential for
growth based
on incidence rates

9
Jaipur
3+ Years
Naroda
SG Group
8+ Years
Indore
5+ Years
Surat GroupJabalpurKrishna
Pipeline
Nashik
Santa Cruz
Jaipur
241 – 260 Beds
NarodaSG Group
200 – 230 Beds
Indore
231 – 240 Beds
Surat GroupJabalpurKrishna
Nashik
261+ Beds<200 Beds
Shalby Hospitals generates positive EBITDAR Margin within 3 years of its operations
Pipeline focused on high ARPOB regions and Franchise rollout
Greenfield Brownfield Acquisition Franchise
HOSPITAL MATURITY PROFILE
2+ Years
Pipeline
Santa Cruz Pipeline
Mohali
Mohali
33%Avg. EBITDAR Margin
13%Avg. EBITDAR Margin
15%Avg. EBITDAR Margin
Note:1. All numbers are on Standalone and FY2020 basis

10
HOSPITAL BUSINESS UPDATE
Business Model: Revenue Sharing
Bed Capacity: 175
Operating and Management Term: 30 + 30 years
Operationalization Year: FY 2024
Estimated Cost: Rs. 1,600 million
Approval awaited from Brihanmumbai Municipal Corporation (BMC)
Santa Cruz Development Update Nashik Development Update
Business Model: Revenue Sharing
Bed Capacity: 113
Operating and Management Term: 30 years
Operationalization Year: FY 2023
Estimated Cost: Rs. 310 million
Brownfield development with Shalby to invest in medical equipments

11
BOARD OF DIRECTORS
Experienced Board of Directors
Dr. Vikram ShahChairman and Managing Director
Over two and a half decades of professional healthcare experience across UK,
USA and India, Dr. Shah has been serving as Director of the Department of Knee
Replacement at Shalby Hospitals since 1993. Recognised for his outstanding
contribution in the field of orthopaedics on completion of 1,00,000 joint
replacement surgeries, he received the ‘Times Man of the Year’ Award by Times of
India Group in 2018.
Mr. Shyamal JoshiNon-Executive Director
Associated with Shalby Hospitals since 2010, Mr. Joshi has significant experience in
various areas including corporate strategy and fund raising. he holds a Bachelor’s
degree in Commerce from Gujarat University and is also a member of the ICAI.
Dr. Ashok BhatiaNon- Executive Director
With more than 40 years of professional experience, in the past Dr. Bhatia was
associated with Cadila Healthcare as President, Emerging Markets. Currently, he is
an external consultant of McKinsey & Co and a visiting faculty member at IIM
Ahmedabad, IIM Rohtak and IIT Gandhinagar.
Mr. Tej MalhotraIndependent Director
Mr. Malhotra has over four decades of experience in various industries both in
India and internationally. Previously he held the positions of Senior Executive
Director at GHCL, Technical Director at Idea Soda Ash and Calcium Chloride
Company of Saudi Arabia and Executive Engineer (Mechanical) at Hindustan
Copper.
Dr. Umesh MenonIndependent Director
Dr. Menon has experience in the areas of finance and cost accounting and is currently
also on the board of directors of Varis Management Services. He is a regular visiting
faculty member at Emirates Foundation and an international expert and trainer for the
United Nations Industrial Development Organisation.
Ms. Sujana ShahIndependent Director
Ms. Shah is a practicing Chartered Accountant and has vast experience of over 18 years
in the fields of finance, accounts, audit, direct and indirect taxes, banking and treasury.
Presently she is a partner of V. R. Shah & Associates. She has also been the statutory and
internal auditor of some of the most reputed public banks of India.

12
SENIOR MANAGEMENT
Senior Management
Mr. Shanay ShahPresident
With over six years of experience in the healthcare industry, Mr. Shah is involved in
overseeing the international business, investor relations and digital transformation
of Shalby Hospitals.
Mr. Muraarie RajanPrincipal Advisor
25 years experience in corporate strategy, mergers and acquisitions and fund raising.
Worked at Wolfensohn & Company, Credit Suisse and JP Morgan in New York. Was
Executive Director at Piramal Enterprises and JSW. Qualified as Chartered
Accountant from the UK and holds an MBA from MIT Sloan School of Management
Mr. Prahalad Rai InaniChief Financial Officer
Mr. Inani has over 24 years of experience in the fields of finance, accounts,
financial planning & analysis, budgeting, cost control, project costing and
auditing. Previously he was associated with Apollo Hospitals, TM Goup of
Companies and Octant Interactive Technologies.
Mr. Jayesh PatelCompany Secretary and Compliance Officer
With over 18 years of experience in the field of corporate law Mr. Patel is involved
in the legal, corporate compliance and secretarial matters of Shalby Limited.
Dr. Nishita ShuklaChief Operating Officer
Dr. Shukla holds a bachelors’ degree in Homeopathic Medicine and Surgery and has
experience of over 13 years in the healthcare industry. As the Shalby Hospitals Group
COO, her responsibilities include overseeing the overall business, clinical operations
and administration of all hospital facilities.
Mr. Babu ThomasChief Human Resource Officer
With over 25 years of experience in talent management, Mr. Thomas heads the
Human Resources and Operation functions of the Group. He is involved in strategic
HR initiatives, change management, talent acquisition, employee engagement,
Shalby Academy and training and development.

13
ORGANISATION STRUCTURE
Group
COOCFO CHRO CIO
VP
Projects
Chairman & Managing Director
President
CORPORATE SUB-FUNCTIONS
UNIT TEAMS
Unit CAO
Cluster COO
Corporate development
Clinical Applications
HR
Accounts
IT/Systems
Hospitality
Pharmacy
Billing
Quality
Admin/Operations/Eng.
Nursing
SCM
Radiology & Pathology
Unit CAO
CORPORATE STRUCTURE UNIT LEVEL STRUCTURE
Internal Auditor Statutory Auditor
PWC T R Chadha & Co LLP
Advisor to
CMD

FINANCIAL PERFORMANCE

15
5,196
19,674
23,728
FY 18 FY 19 FY 20
27,771
36,311 39,030
FY 18 FY 19 FY 20
ANNUAL PERFORMANCE TRENDS
Day CareIn Patients
Increasing number of patients across all care formats reflects Shalby’s strong brand recognition
222,970
296,197325,596
FY 18 FY 19 FY 20
Out Patients
ARPOB (In Rs.) Surgery Count
17,554
19,908 19,835
FY 18 FY 19 FY 20
7.5%
Y-o-Y
20.6%
Y-o-Y
9.9%
Y-o-Y
Significant impact on FY20 surgeries due to
Covid-19 during March-20
31,564 31,296 30,457
FY 18 FY 19 FY 20

16
ANNUAL PERFORMANCE TRENDS
Number of beds occupied increased by 8.9% y-o-y and occupancy rate of 38%
Hospital Revenue Mix by Care % of Revenue from Arthroplasty
55%45% 45%
FY 18 FY 19 FY 20
Notes:1. Occupancy rate is on the basis of operational beds. Adjusted occupancy rates is on the basis of FY20 operational beds of 12002. ALOS is without Day Care
Occupancy RateNo. of Beds Occupied
335
413 450
FY 18 FY 19 FY 20
ALOS (Days)
3.70 4.15 4.22
FY 18 FY 19 FY 20
8.9%Y-o-Y
Adjusted
Occupancy28% 34% 38%
88% 84% 83%
2% 4% 5%
11% 12% 13%
FY 18 FY 19 FY 20
In Patient Day Care Out Patient
29%
37% 38%
FY 18 FY 19 FY 20

17
44%
13%6%
6%3%3%4%
21%
48%
12%
8%
7%
3%
3%
3%
16% Arthroplasty
Orthopedic
Nephrology
General Surgery
Cosmetic & Plastic Surgery
Oncology
Cardiac Science
Others
Surgery Mix
(Nos.)
Revenue by Hospital Specialty
Number of Surgeries by Specialty Revenues by End Patient
Note:1. All numbers are on Standalone basis
FY 19
FY 20
HOSPITALS SPECIALTIES
45%
11%7%
11%
4%8%
4%10%
45%
10%6%
9%4%
9%5%
11%
0%
10%
20%
30%
40%
50%
Arthroplasty Cardiac Science Cardia Care &
General Medicine
Nephrology Neurology Oncology Other Ortho Others
FY 19 FY 20
60%
20%15%
4%
48%
27%23%
2%
Self Pay Corporate
Government
Insurance Corporate Private
FY 19 FY 20

18
FINANCIAL PERFORMANCE
3,880
4,715 5,042
FY 18 FY 19 FY 20
Total Revenue (Rs. Mn)
Significant impact on FY20
surgeries due to
Covid-19 during March-20
21.5%
Y-o-Y
14.0%
CAGR
6.9%
Y-o-Y

19
FINANCIAL PERFORMANCE
537
504
567 13.8%
10.7% 11.3%
FY 18 FY 19 FY 20
Total EBITDA (Rs. Mn)
Despite subdued FY2020 revenue growth, Shalby continued to deliver higher margins
Total PBT (Rs. Mn)
881 916
991
22.7%
19.4%19.7%
FY 18 FY 19 FY 20
8.1%
Y-o-Y
12.6%
Y-o-Y

20
Total Operating Expenses (Rs. Mn)
Doctor Costs as % of Revenue from Operations
Ongoing optimization of doctor cost and centralized sourcing of medical instruments, devices and consumables
Employee Costsas % of Revenue from Operations
11.9%14.0% 13.5%
FY 18 FY 19 FY 20
Total Costs ex Finance Cost (Rs. Mn)
Notes:1. Total Operating Expenses comprises of Operative and other expenses, Purchase and Change in Inventory, Employee costs and Other Expenses2. All numbers are on Consolidated basis
Consumables as % of Revenue from Operations
Other Operative Expense as % of Revenue from Operations
2,999
3,799 4,051
FY 18 FY 19 FY 20
57% 59% 55%
12% 10% 12%
14% 16% 15%
10% 8% 10%7% 8% 8%
FY 18 FY 19 FY 20
D&A Expenses
Other Expenses
Employee Benefit Expenses
Purchase and Change in
Inventory
Operative and Other
Expenses
14.1%15.8% 14.8%
FY 18 FY 19 FY 20
23.8%26.9% 25.7%
FY 18 FY 19 FY 20
10.5% 10.1% 9.3%
FY 18 FY 19 FY 20
FINANCIAL PERFORMANCE

21
FINANCIAL PERFORMANCE
Total Profit after Tax (Rs. Mn)
Adjusted PAT FY20 reflects Profit after deduction of Cash MAT Tax outflow from PBT
392 317
276
10.4%
6.8%5.7%
FY 18 FY 19 FY 20 Accounting
TaxCash Tax Adjusted PAT FY20
460
291
(107)
Note:1. Cash tax rate is calculated as Taxes outflow as per cash flow divided by PBT

22
Phase III – Capex Rs. 3,183 mnLaunch of 7 New Hospitals: Vapi, Krishna, Jabalpur,
Indore, Jaipur, Naroda, Surat
Total 6 Hospitals with 1,817 Beds
Notes:
1. ROCE is calculated as EBIT divided by Average Capital Employed
2. Total bed count of 1,962 at the end of FY2020 is excluding Zynova bed count of 50
3. All numbers are on Standalone FY2020 basis
4. Occupancy rate is calculated on operational number of beds
HOSPITAL INVESTMENT JOURNEY
Phase I – Capex Rs. 4 mn 1 Hospital with 27 Beds
Return on Capital Employed currently reflects real estate investments and a relatively younger maturity portfolio
Phase II – Capex Rs. 329 mnLaunch of Shalby SG in 2007
Total 2 Hospitals with 228 Beds
Phase IV – Capex Rs.
3,410 mnLaunch of 1 New
Hospitals: Mohali
Total 10 Hospitals with
1,962 Beds
Investment Phase
Added 8 Hospitals with 1,734 new beds
Shalby Branding Phase
2 Hospitals with 228 beds
Current
Occupancy of
38% reflects
younger maturity
of hospital portfolio
given Phase IV
investments
- 1 3 155 123
24 13 14 56
827
220 375
1,572
134
2,731
609 69
55%
13%11%
17%
25%
48%
58%
24%
43%
25%
14%13%
10% 7%7%
0%
10%
20%
30%
40%
50%
60%
70%
-
500
1,000
1,500
2,000
2,500
3,000
3,500
4,000
2004 2005 2006 2007 2008 2009 2010 2011 2012 2013 2014 2015 2016 2017 2018 2019 2020
RO
CE %
Ca
pe
x R
s. M
illio
n
Total CAPEX ROCE on Avg CE

23
35.6%
25.9%
23.2%
14.7%
11.9%10.9%
8.5%
0%
5%
10%
15%
20%
25%
30%
35%
40%
SG Group Krishna Naroda Indore Jaipur Surat Group Jabalpur Mohali
EB
ITD
A %
HOSPITAL MARGIN PROFILE
Notes:1. Hospital and Other EBITDA Margins is a sum of Hospital EBITDA divided by Total Income and Other Income divided by Total Income2. Corporate Cost primarily comprises of corporate employees, advertisements, CSR expenses, taxes and professional fees3. All numbers are on FY2020 basis
Corporate Cost 4.7%
24.5%
Hospital and Other
EBITDA Margins
19.7%
EBITDA Margins
Each hospital group makes a positive contribution at the Shalby level where corporate costs are 4.7% of total revenue
ARPOB Rs. 51,231 27,843 21,382 22,635 31,517 24,427 16,801
nm

24
SG Group, 36.0%
Krishna, 25.9%
Naroda, 25.7%
Indore, 14.7%Jaipur, 11.9%Surat Group, 10.9%
Jabalpur, 10.5%
0.0%
5.0%
10.0%
15.0%
20.0%
25.0%
30.0%
35.0%
40.0%
45.0%
20.0% 25.0% 30.0% 35.0% 40.0% 45.0% 50.0% 55.0% 60.0% 65.0%
EB
ITD
AR
Ma
rgin
s %
Bed Occupancy %
Notes:1. Mohali is less than 3 years of operation hence not included2. All numbers are on Standalone FY2020 basis3. Bubble size represents FY2020 Standalone Revenue
HOSPITAL MARGIN PROFILE
30.5%Min. Occupancy
10.5%Min. EBITDAR
Shalby is able to operate hospitals profitability at EBITDA and EBITDAR levels even at a bed occupancy of 30%
Jaipur, Surat and Naroda which have been operational for less than 5 years are currently ramping up

25
Cash Flow Statement (Rs. Mn) – FY2020
Cash Flow Statement (Rs. Mn) – FY2019
567 553
31
360
4
(176)
(202)
(198)
(109)
(215)
PBT D&A Other Non
Cash
Charges
Working
Capital
Changes
Taxes Paid Cash flow
from
operations
CapEx Other
Investments
Cash from
Financing
Free Cash
Flow
• Mat tax outflow of Rs. 107 mn, Tax
receivables created of Rs. 95 mn
• Maintenance capex of 3.9% of
Total Income
• Net other investment activity of
Rs. (161) mn
• Interest received of Rs. 52 mn
• Debt and interest repayment of
Rs. (150) mn
• Dividend Payment of Rs. (65) mn
504 434
(65)
332
26
329
(333)
(94)(315) (512)
PBT D&A Other Non
Cash
Charges
Working
Capital
Changes
Taxes Paid Cash flow
from
operations
CapEx Other
Investments
Cash from
Financing
Free Cash
Flow
• Maintenance capex of 7.6% of
Total Income
• Net other investment activity of
Rs. 236 mn
• Interest received of Rs. 93 mn
• Debt and interest repayment of
Rs. (512) mn
Notes:1. All numbers are on Consolidated basis
FINANCIAL PERFORMANCE

26
FINANCIAL PERFORMANCE
ROE ROCE
CFO to EBITDA Capital Structure
Strong EBITDA to Cash Flow conversion rate of 55.9%. Unlevered balance sheet results in lower Return on Equity
Figures in Rs Million FY 18 FY 19 FY 20
Gross Borrowings 1,137 708 622
Cash and Investments 1,162 862 1,021
Net Debt/ (Net Cash) (25) (154) (399)
Equity 7,515 7,798 7,992
7.7%6.9%
7.3%
FY 18 FY 19 FY 20
5.2%
4.1%3.5%
5.8%
FY 18 FY 19 FY 20 FY20 Adjusted
Notes:
1. FY2020 Adjusted ROE is calculated using Adjusted PAT for MAT cash outflow adjustment
2. ROCE is calculated as EBIT divided by Average Capital Employed (Total Assets – Total Current Liabilities)
3. All numbers are on consolidated basis
15.8%
47.4%
55.9%
FY 18 FY 19 FY 20

27
FINANCIAL PERFORMANCE
Re
ve
nu
es
Over last two years, Total Revenue increased by 14.0% and EBITDA by 6.1% CAGR with EBITDA margins at 19.7%
Increasing number of patients across all care formats reflects Shalby’s strong brand recognition: In Patients 7.5%, Day Care 20.6% and Out Patients 9.9%
Number of beds occupied increased by 8.9% y-o-y and current occupancy rate of 38%, increasing by 4% last year on a like for like basis
Shalby’s diversification strategy towards multi specialty will drive patient numbers, surgery count and occupancy rates going forward
Arthroplasty surgeries are increasing in number but declining as a percentage of Total Revenue as part of the diversification strategy
Arthroplasty to reach 35% of total revenues in the coming years with ARPOB reflecting other speciality offerings
Relatively newer hospitals (Jaipur, Mohali, Naroda and Surat) payer mix now moving more towards self-pay which is expected to result in higher ARPOB
Average length of stay increasing in line with greater trend towards non-arthroplasty surgeries
Actively sourcing direct patient referrals from Kenya and Tanzania, in addition to partnerships with international hospitals
Co
sts
Ongoing optimization of doctor costs within COGS resulting in a move from fixed pay to minimum guarantee to visiting doctor
model
Centralized sourcing of medical instruments, devices and other consumables across all Shalby doctors
Greater than 95% of material purchases are from J&J and Meril India; less than 2% from Slaney, a promoter group company
Re
turn
s
PBT margins at 11.7% and PAT margins adjusted for cash tax at 9.1%
Well capitalized balance sheet with Debt of Rs. 62 Crores, Cash and investments of Rs. 102 Cr
Strong EBITDA to Cash Flow conversion rate of 55.9%
Return on Capital Employed of 7.3% based on current occupancy rate of 38%
Unlevered net debt balance sheet results in lower Return on Equity
Co
sts

STRATEGIC DIRECTION

29
FRANCHISE MODEL ASSET LIGHT
• Economies of Scale
• Greater Market
Penetration
Franchisee Footprint• All franchisees to be branded as Shalby
• Hopsitals located in key catchment areas & should have upto
50 beds
• Focus on Orthropaedics as a specialty
Operating Model• Provide Shalby systems (HIS, procurement, manpower planning
etc)
• All hospital activities will be supervised and governed by Shalby
SOP
• The hospitals will be managed and operated by Franchisees
Financial Model• Revenue sharing contract with Shalby receiving a % of
revenues
• Franchisee is responsible for real estate and its maintenance
• Franchisee is responsible for all opex and capex Franchise Owned – Franchise Operated (FOFO)
SHALBY SYSTEM
Shalby Brand
SHALBY
Franchise Owned Franchise Operated (FOFO)
• Win-win for parties
• Access & quality for
patients

30
HOMECARE SERVICE OFFERINGS
Present offerings
• Home COVID-19 care
package
• Nursing (incl. critical care)
• Attendant
• Physiotherapy
• Pathology
• Medical Equipment
• Pharmacy @home
• Home visits by doctors
Future offerings
• ICU Setup @home
• Chronic disease
management
• Rehabiliation
• Personalised & tech
enabled integrated
services

31
CARE CARD PRIMARY FEATURES
Note1: There are other benefits as well e.g. Homecare.
Note1: Family members of the card holder can avail the card at a discounted rate
Membership Fee : Rs 2500/-
• Complimentary Health check-up: Worth Rs 2500/-
• OPD Services: Consultations(20%), Lab & Diagnostics (15%)
• OP Pharmacy: 10%
• IP Services*: 15% on service charges
• Super-specialty Surgery discount : NA
• Room Category: Economy
Membership Fee : Rs 5000/-
• Complimentary Health check-up: Worth Rs 5000/-
• OPD Services: Consultations(20%), Lab & Diagnostics (15%)
• OP Pharmacy: 10%
• IP Services*: 25% on service charges
• Super-specialty Surgery discount* : 15% on service charges
• Room Category: Economy, Twin-sharing

32
STRATEGIC GROWTH DRIVERS
Franchise Model Home Care Care Card
Strategy:
• The need for localization of hospital
treatment. Faster penetration in pan
India
• Franchise model which is capital light
and fully leverages our expertise and
brand name
Franchise Model:
• Franchise hospitals will be located in key
catchment areas and will have around
50 beds
• Focus on Orthopaedics as a specialty
• Revenue sharing arrangement
• Franchisee remains responsible for all
aspects of capex and opex
Strategy:
• The healthcare dynamics in India all
point towards a high need for affordable
medical services required at home
• India has the 2nd largest geriatric
population and hence there is a greater
need for homecare services
Services Offerings:
• The primary focus right now is on Covid-
19 packages and diagnostic services
• Current offerings include:• COVID-19 home care package• Nursing (incl. critical care) services• Attendant services• Physiotherapy• Pathology• Medical Equipment rentals• Pharmacy @home• Home visits by doctors
Strategy:
• Constructive mechanism to promote
health awareness
• To provide affordable healthcare
services to the people who do not have
Mediclaim/Insurance
• Effective tool to increase new in-patient
and out-patient count
• This will create brand loyalty and is
synergistic with our core business
Service Offerings:
• Provide two levels of service to
accommodate different patient
requirements and budget
• Silver Care card will be available for a
yearly membership fee of Rs. 2500
• Gold Care card will be available for a
yearly membership fee of Rs. 5000

APPENDIX

34
HOSPITAL BUSINESS UPDATE SG
Vij
ayK
rish
na
Nar
od
a
Commencement 2007 | 13 Years
No. of beds / Occupancy 201 | 50.3%
Type of Arrangement Leased – Fixed Rent
Revenue Contribution % 32.8%
Catchment: Ahmedabad and surrounding areas of Gujarat, Rajasthan and Mumbai
• Transfer of Covid-19 positive patients to other Shalby units• Optimum utilization of manpower• Specialties such as otho trauma, neurology and neuro-
surgery, oncology, spine and general surgery along with critical care and general medicine showed major growth
Commencement 1994 | 26 Years
No. of beds / Occupancy 27 | 11.1%
Type of Arrangement Freehold
Revenue Contribution% 0.4%
Catchment: Ahmedabad and surrounding areas of Gujarat
• Vijay was one of the first to start Covid-19 treatment in Ahmedabad
Commencement 2012 | 8 Years
No. of beds / Occupancy 220 | 36.9%
Type of Arrangement Freehold
Revenue Contribution% 12.3%
Catchment: Ahmedabad and surrounding areas of Gujarat and Rajasthan. Also attracts international patients
• Continued engagement through webinars• A surge was seen in critical care specialty• Started treating Covid-19 patients from Jun’20, treated 325
Covid-19 to date
Commencement 2017 | 3 Years
No. of beds / Occupancy 267 | 55.1%
Type of Arrangement Leased – Revenue Share
Revenue Contribution% 8.0%
Catchment: Ahmedabad and surrounding areas of Gujarat
• Treated more than 300 Covid-19 positive patients• Growth in oncology, nephrology and critical care• Tie-up with nearby nursing home and consultants
SG
Gro
up
SG
Gro
up
Notes: 1. Revenue contribution % is a contribution to total hospital revenue2. All numbers are on Standalone FY2020 basis

35
HOSPITAL BUSINESS UPDATE Su
rat
Vap
iIn
do
reJa
bap
lpu
r
Commencement 2017 | 3 Years
No. of beds / Occupancy 243 | 39.1%
Type of Arrangement Freehold
Revenue Contribution% 10.0%
Catchment: South Gujarat, North Maharashtra (including Mumbai)
• Conducted multiple awareness sessions for corporates like Reliance, L&T and Shell about Covid-19 dos and don’ts
• Dialysis specialty saw a spike in Q1 FY2021
Commencement 2012 | 8 Years
No. of beds / Occupancy 146 | 20.0%
Type of Arrangement Freehold
Revenue Contribution% 1.4%
Catchment: South Gujarat
• Short stay trauma was introduced• Focused on digital marketing initiatives
Commencement 2012 | 8 Years
No. of beds / Occupancy 243 I 46.0%
Type of Arrangement Freehold
Revenue Contribution% 13.0%
Catchment: Madhya Pradesh
• Appreciation from local administration (Collector) for managing variety of complicated Covid-19 patients
• While the elective work was less in Q1 the time was used to improve the services through continuous training and process improvement
Commencement 2015 | 5 Years
No. of beds / Occupancy 233 | 35.3%
Type of Arrangement Leased – Revenue Share
Revenue Contribution% 7.6%
Catchment: Madhya Pradesh
• Treated 50 Covid-19 patients
• Focused on digital marketing avenues to generate more leads• Witnessed good numbers in specialties like cardiac science,
critical care and general medicine and neurology
Su
rat G
rou
p
Notes: 1. Revenue contribution % is a contribution to total hospital revenue2. All numbers are on Standalone FY2020 basis
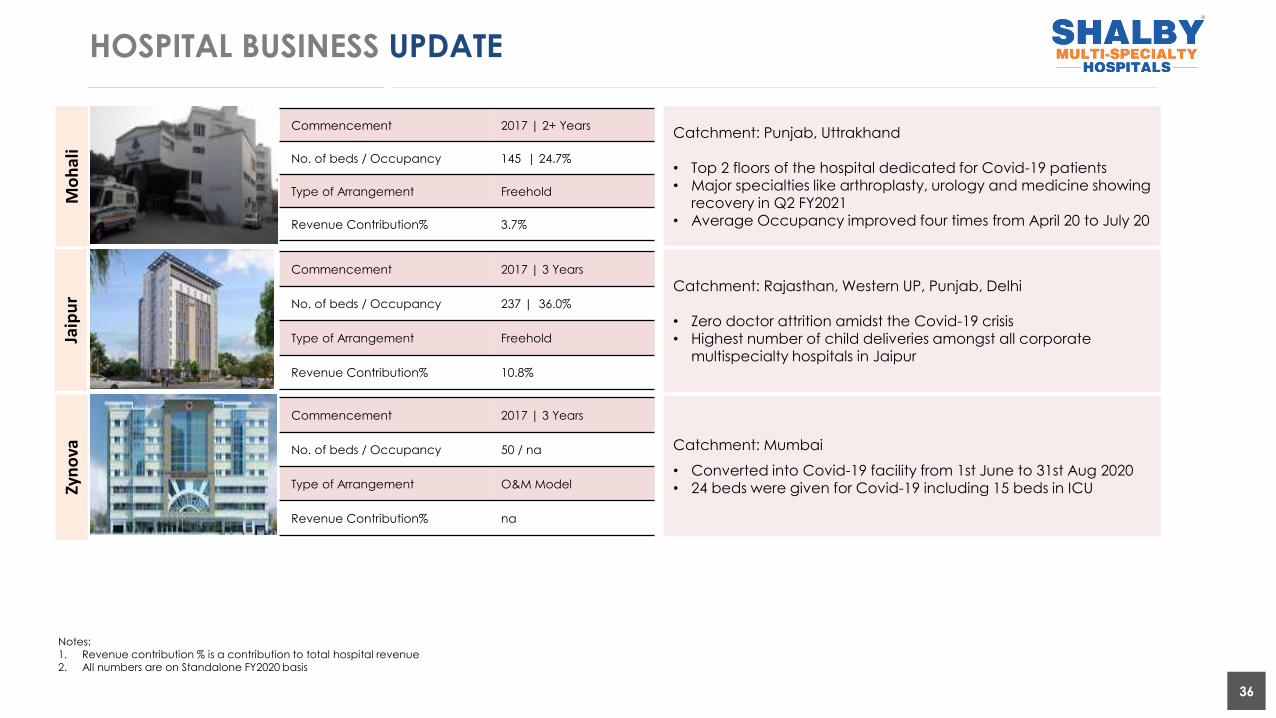
36
HOSPITAL BUSINESS UPDATE M
oh
ali
Jaip
ur
Zyn
ova
Commencement 2017 | 2+ Years
No. of beds / Occupancy 145 | 24.7%
Type of Arrangement Freehold
Revenue Contribution% 3.7%
Catchment: Punjab, Uttrakhand
• Top 2 floors of the hospital dedicated for Covid-19 patients• Major specialties like arthroplasty, urology and medicine showing
recovery in Q2 FY2021• Average Occupancy improved four times from April 20 to July 20
Commencement 2017 | 3 Years
No. of beds / Occupancy 237 | 36.0%
Type of Arrangement Freehold
Revenue Contribution% 10.8%
Catchment: Rajasthan, Western UP, Punjab, Delhi
• Zero doctor attrition amidst the Covid-19 crisis• Highest number of child deliveries amongst all corporate
multispecialty hospitals in Jaipur
Commencement 2017 | 3 Years
No. of beds / Occupancy 50 / na
Type of Arrangement O&M Model
Revenue Contribution% na
Catchment: Mumbai
• Converted into Covid-19 facility from 1st June to 31st Aug 2020• 24 beds were given for Covid-19 including 15 beds in ICU
Notes: 1. Revenue contribution % is a contribution to total hospital revenue2. All numbers are on Standalone FY2020 basis

37
ANNUAL PERFORMANCE TRENDS
Particulars (in Rs. Million) FY 18 FY 19 FY 20 CAGR
Revenue from Operations 3,780 4,623 4,869 13.5%
Other Income 100 93 174 31.7%
Total Income 3,880 4,715 5,042 14.0%
Expenses
COGS 2,219 2,833 2,953 15.4%
% of Revenue from Operations 59% 61% 61%
Employee Benefit Expenses 451 646 655 20.5%
% of Revenue from Operations 12% 14% 13%
Other Expenses 330 320 443 15.9%
% of Revenue from Operations 9% 7% 9%
Total Operating Expenses 2,999 3,799 4,051 16.2%
% of Revenue from Operations 79% 82% 83%
EBITDA 881 916 991 2.3%
EBITDA Margins % 22.7% 19.4% 19.7%
Depreciation and Amortisation 229 332 360
Finance Cost 115 81 64
PBT 537 504 567 2.8%
Total tax 146 187 291
Effective Tax Rate % 27.2% 37.1% 51.3%
PAT 392 317 276 (16.1)%
PAT Margins % 10.1% 6.7% 5.5%
Note: Margins are calculated on the basis of Total Income

38
ANNUAL PERFORMANCE TRENDS
Operational Metrics FY 18 FY 19 FY 20 CAGR
In Patient Count (Nos.)
27,771 36,311 39,030 18.6%
Day Care Patient Count (Nos.)
5,196 19,674 23,728 113.7%
Out Patient Count (Nos.)
2,22,970 2,96,197 3,25,596 20.8%
Surgeries Count 17,554 19,908 19,835 6.3%
ARPOB (Rs.)
31,564 31,296 30,457 (1.8)%
Bed Capacity (Nos.)
2,012 2,012 2,012 0.0%
Operational Beds (Nos.)
1,150 1,102 1,200 2.2%
Occupancy (Beds)
335 413 450 15.9%
Occupancy (%) (operational beds)
29.0% 37.0% 38.0% 14.5%
Average Length of Stay (without Daycare)
3.70 4.15 4.22 6.8%
Note: The operational bed count of 1,200 considers 36 operational beds at Zynova-Shalby Hospital, Mumbai, for which no other operational parameters are tracked

39www.shalby.org
DISCLAIMER and CONTACT DETAILS
No representation or warranty, express or implied is made as to, and no reliance should be placed on, the fairness, accuracy, completeness or correctness of such information
or opinions contained herein. The information contained in this presentation is only current as of its date. Certain statements made in this presentation may not be based on
historical information or facts and may be “forward looking statements”, including those relating to the Company’s general business plans and strategy, its future financial
condition and growth prospects, and future developments in its industry and its competitive and regulatory environment. Actual results may differ materially from these
forward-looking statements due to a number of factors, including future changes or developments in the Company’s business, its competitive environment and political,
economic, legal and social conditions in India. This communication is for general information purpose only, without regard to specific objectives, financial situations and needs
of any particular person. This presentation does not constitute an offer or invitation to purchase or subscribe for any shares in the Company and neither any part of it shall form
the basis of or be relied upon in connection with any contract or commitment whatsoever. The Company may alter, modify or otherwise change in any manner the content of
this presentation, without obligation to notify any person of such revision or changes. This presentation can not be copied and/or disseminated in any manner.
For further information, please contact:
Mahesh Purohit
Asst. Manager – Corporate Strategy & Investor Relations
+91 951 204 9871
Ravi Gothwal / Vikas Luhach
Churchgate Partners
+91 22 6169 5988
SHALBY LIMITED I Regd Off: Opp. Karnavati Club, S.G. Road, Ahmedabad – 380015, Gujarat, India. Phone: 079 4020 3000 Fax: +91 79 4020 3109 |
Website: www.shalby.org | CIN: L85110GJ2004PLC044667