investor presentation q4 12 - bmo 2012 analyst presentation.pdfgrew loans by 7.4% and deposits by...
TRANSCRIPT

Investor Presentation Q4 12For the Quarter Ended – October 31, 2012
December 4th 2012

2Investor Presentation • Q3 2012 2December 4 • 2012
Caution Regarding Forward-Looking Statements
Bank of Montreal’s public communications often include written or oral forward-looking statements. Statements of this type are included in this document, and may be included in other filings with Canadian securities regulators or the U.S. Securities and Exchange Commission, or in other communications. All such statements are made pursuant to the “safe harbor” provisions of, and are intended to be forward-looking statements under, the United States Private Securities Litigation Reform Act of 1995 and any applicable Canadian securities legislation. Forward-looking statements may involve, but are not limited to, comments with respect to our objectives and priorities for 2013 and beyond, our strategies or future actions, our targets, expectations for our financial condition or share price, and the results of or outlook for our operations or for the Canadian and U.S. economies.
By their nature, forward-looking statements require us to make assumptions and are subject to inherent risks and uncertainties. There is significant risk that predictions, forecasts, conclusions or projections will not prove to be accurate, that our assumptions may not be correct and that actual results may differ materially from such predictions, forecasts, conclusions or projections. We caution readers of this document not to place undue reliance on our forward-looking statements as a number of factors could cause actual future results, conditions, actions or events to differ materially from the targets, expectations, estimates or intentions expressed in the forward-looking statements.
The future outcomes that relate to forward-looking statements may be influenced by many factors, including but not limited to: general economic and market conditions in the countries in which we operate; weak, volatile or illiquid capital and/or credit markets; interest rate and currency value fluctuations; changes in monetary, fiscal or economic policy; the degree of competition in the geographic and business areas in which we operate; changes in laws or in supervisory expectations or requirements, including capital, interest rate and liquidity requirements and guidance; judicial or regulatory proceedings; the accuracy and completeness of the information we obtain with respect to our customers and counterparties; our ability to execute our strategic plans and to complete and integrate acquisitions; critical accounting estimates and the effect of changes to accounting standards, rules and interpretations on these estimates; operational and infrastructure risks; changes to our credit ratings; general political conditions; global capital markets activities; the possible effects on our business of war or terrorist activities; disease or illness that affects local, national or international economies; natural disasters and disruptions to public infrastructure, such as transportation, communications, power or water supply; technological changes; and our ability to anticipate and effectively manage risks associated with all of the foregoing factors.
We caution that the foregoing list is not exhaustive of all possible factors. Other factors could adversely affect our results. For more information, please see the discussion on pages 28 and 29 of BMO’s 2012 annual MD&A, which outlines in detail certain key factors that may affect Bank of Montreal’s future results. When relying on forward-looking statements to make decisions with respect to Bank of Montreal, investors and others should carefully consider these factors, as well as other uncertainties and potential events, and the inherent uncertainty of forward-looking statements. Bank of Montreal does not undertake to update any forward-looking statements, whether written or oral, that may be made from time to time by the organization or on its behalf, except as required by law. The forward-looking information contained in this document is presented for the purpose of assisting our shareholders in understanding our financial position as at and for the periods ended on the dates presented, as well as our strategic priorities and objectives, and may not be appropriate for other purposes.
In calculating the pro-forma impact of Basel III on our regulatory capital, risk-weighted assets (including Counterparty Credit Risk and Market Risk) and regulatory capital ratios, we have assumed that our interpretation of the proposed rules and amendments announced by the Basel Committee on Banking Supervision (BCBS) as of this date, and our models used to assess those requirements, are consistent with the final requirements that will be promulgated by the Office of the Superintendent of Financial Institutions Canada (OSFI). We have also assumed that the proposed changes affecting capital deductions, risk-weighted assets, the regulatory capital treatment for non-common share capital instruments (i.e. grandfathered capital instruments) and the minimum regulatory capital ratios will be adopted by OSFI as proposed by BCBS, unless OSFI has expressly advised otherwise. We have also assumed that existing capital instruments that are non-Basel III compliant but are Basel II compliant can be fully included in the October 31, 2012, pro-forma calculations. The full impact of the Basel III proposals has been quantified based on our financial and risk positions at year end or as close to year end as was practical. In setting out the expectation that we will be able to refinance certain capital instruments in the future, as and when necessary to meet regulatory capital requirements, we have assumed that factors beyond our control, including the state of the economic and capital markets environment, will not impair our ability to do so.
Assumptions about the performance of the Canadian and U.S. economies, as well as overall market conditions and their combined effect on our business, are material factors we consider when determining our strategic priorities, objectives and expectations for our business. In determining our expectations for economic growth, both broadly and in the financial services sector, we primarily consider historical economic data provided by the Canadian and U.S. governments and their agencies. See the Economic Developments section on pages 30 of BMO’s 2012 annual MD&A. Among the material factors that we considered when establishing our expectation of net interest margin changes in 2013 in the P&C Canada business, were assumptions about growth in and mix of loans and deposits, stable competitive pressures and an interest rate and economic environment as described on page 48 of BMO’s 2012 annual MD&A.
Non-GAAP Measures
Bank of Montreal uses both GAAP and non-GAAP measures to assess performance. Readers are cautioned that earnings and other measures adjusted to a basis other than GAAP do not have standardized meanings under GAAP and are unlikely to be comparable to similar measures used by other companies. Reconciliations of GAAP to non-GAAP measures as well as the rationale for their use can be found in Bank of Montreal’s Fourth Quarter 2012 Earnings Release and Bank of Montreal’s 2012 Management’s Discussion and Analysis, all of which are available on our website at www.bmo.com/investorrelations.
Examples of non-GAAP amounts or measures include: efficiency and leverage ratios; revenue and other measures presented on a taxable equivalent basis (teb); amounts presented net of applicable taxes; adjusted net income, revenues, provision for credit losses, specific provision for credit losses, expenses, earnings per share, effective tax rate, ROE, efficiency ratio and other adjusted measures which exclude the impact of certain items such as credit-related items on the acquired M&I performing loans, run-off structured credit activities, hedge costs related to foreign currency risk on purchase of M&I, M&I integration costs, M&I acquisition-related costs, amortization of acquisition-related intangibles, decrease (increase) in collective allowance for credit losses and restructuring costs.
Bank of Montreal provides supplemental information on combined business segments to facilitate comparisons to peers.
Forward Looking Statements & Non-GAAP Measures

Strategic Highlights Q4 12For the Quarter Ended – October 31, 2012
Bill DownePresident & Chief Executive Officer
December 4th 2012
4Strategic Highlights | December 4 • 2012
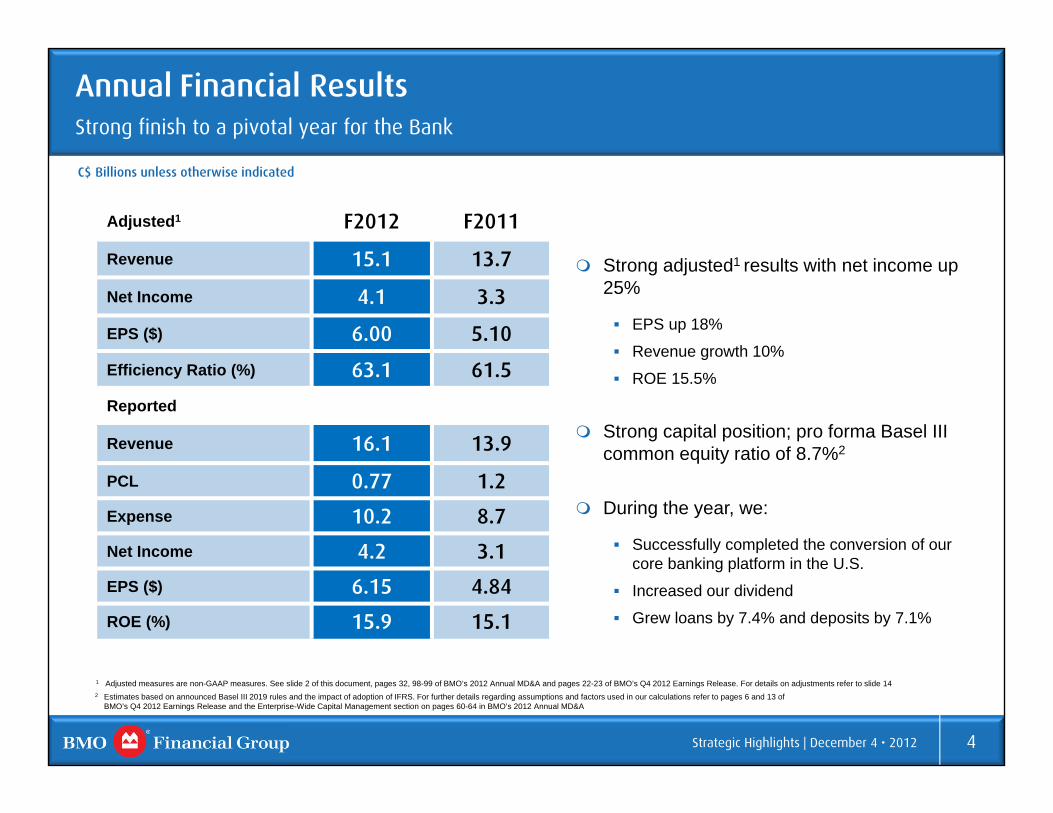
Annual Financial ResultsStrong finish to a pivotal year for the Bank
Strong adjusted1 results with net income up 25%
EPS up 18%
Revenue growth 10%
ROE 15.5%
Strong capital position; pro forma Basel III common equity ratio of 8.7%2
During the year, we:
Successfully completed the conversion of our core banking platform in the U.S.
Increased our dividend
Grew loans by 7.4% and deposits by 7.1%
1 Adjusted measures are non-GAAP measures. See slide 2 of this document, pages 32, 98-99 of BMO’s 2012 Annual MD&A and pages 22-23 of BMO’s Q4 2012 Earnings Release. For details on adjustments refer to slide 14 2 Estimates based on announced Basel III 2019 rules and the impact of adoption of IFRS. For further details regarding assumptions and factors used in our calculations refer to pages 6 and 13 of
BMO’s Q4 2012 Earnings Release and the Enterprise-Wide Capital Management section on pages 60-64 in BMO’s 2012 Annual MD&A
C$ Billions unless otherwise indicated
Adjusted1 F2012 F2011
Revenue 15.1 13.7
Net Income 4.1 3.3
EPS ($) 6.00 5.10
Efficiency Ratio (%) 63.1 61.5
Reported
Revenue 16.1 13.9
PCL 0.77 1.2
Expense 10.2 8.7
Net Income 4.2 3.1
EPS ($) 6.15 4.84
ROE (%) 15.9 15.1

5Strategic Highlights | December 4 • 2012
P & C Banking Canada
P & C Banking U.S.(US$)
Private ClientGroup
BMOCapital Markets
* P&C Canada growth rate is on a reported, actual loss basis
F2012F2011
C$ millions unless otherwise indicated
F2012F2011 F2012F2011 F2012F2011
392 486
902
579 546
949
Y/Y Growth3%* 48% 12% 5%
1,781 1,794
Operating Group Performance Confident each of our businesses is positioned to deliver high quality sustained earnings growth
1 Adjusted measures are non-GAAP measures. See slide 2 of this document, pages 32, 98-99 of BMO’s 2012 Annual MD&A and pages 22-23 of BMO’s Fourth Quarter 2012 Earnings Release; For details on adjustments refer to slide 14; Operating Group reported net income F2011 | F2012: P&C Canada $1,773 | $1,784; P&C US $356 | $516; PCG $476 | $525; BMO CM $902 | $948
Annual Adjusted1 Net Income

6Strategic Highlights | December 4 • 2012
Turning the page on M&I Looking back 24 months since announcement, we’ve achieved what we said we would
Conversion of our core banking platform completed Completed on schedule in October and we’ve upgraded U.S. online, branch, core banking and mobile banking
platforms at the same time
Rebranding completed Over 600 U.S. bank branches refreshed and over 1,300 bank machines were raised to a new standard
Income contribution has exceeded our business case Transaction accretive throughout F2012; well in advance of our target In F2012, acquired business contributed $647MM to reported net income and $730MM to adjusted net income
Credit performance better than anticipated Recoveries on the acquired impaired portfolio have offset integration costs
Cost synergy realization progressing well; target increased Expect annual cost savings will exceed US$400MM compared with original estimate of US$250MM at announcement
Maintain strong capital position Both our Basel II and III common equity ratios have been rebuilt to above pre-transaction levels

7Strategic Highlights | December 4 • 2012
Looking Ahead…We’ve created a much stronger business platform and have clear opportunities for organic growth
Commercial Banking strength in Canada and the U.S.
Wealth Management momentum with a strengthened U.S. market position in asset management and private banking
Leveraging investments in Capital Markets
In Personal Banking, driving growth by achieving industry-leading customer loyalty and delivering on our brand promise…
Making money make senseR

Q4 12Financial Results
Tom FlynnExecutive Vice President & Chief Financial Officer
December 4th 2012
For the Quarter Ended – October 31, 2012

9Financial Results | December 4 • 2012
Q4 2012 - Financial HighlightsStrong Performance with Adjusted Net Income of $1.1B, Increasing EPS by 38% from a Year Ago
Adjusted EPS of $1.65 up 37.5% Y/Y, Reported up 43.2% Adjusted net income of $1.1B up 35.1% Y/Y
Adjusted revenue increased 6.8% P&C Canada income up 6.4% on an actual loss basis P&C U.S. income consistent with last quarter and down 13.8% from a very strong quarter a year ago PCG income up 19.9% driven by Insurance BMO CM income up $150MM as the market environment improved Specific PCL of $113MM, down $168MM Adjusted effective tax rate of 17.9%
Adjusted revenue up 6.7% and net income up 11.1% Q/Q Adjusted net income up in most operating groups
See slide 14 for adjustments to reported results
Revenue Net Income EPS ROE Efficiency
Specific PCL
Common Equity Ratio
(Basel II)
Reported Results $4,176MM $1,082MM $1.59 15.6% 64.7% $216MM 10.5%
Adjusted Results $3,920MM $1,125MM $1.65 16.3% 62.2% $113MM 10.5%
Adjusted measures are non-GAAP measures. See slide 2 of this document, pages 32, 98-99 of BMO’s 2012 Annual MD&A and pages 22-23 of BMO’s Fourth Quarter 2012 Earnings Release

10Financial Results | December 4 • 2012
F2012 - Financial HighlightsStrong Annual Performance with Adjusted Income of $4.1B, Increasing EPS by 18% from a Year Ago
Adjusted EPS of $6.00 up 17.6% Y/Y, reported up 27.1% Adjusted revenue increased 9.7% Adjusted net income of $4.1B up 24.9% Y/Y
P&C Canada income up 3.4% on an actual loss basis P&C U.S. income up 48.1% reflecting strong growth due to acquisition PCG income up 12.1% BMO CM income up 5.2%
Adjusted Specific PCL of $471MM, down $637MM Adjusted effective tax rate of 19.5% Good adjusted ROE performance of 15.5%
See slide 14 for adjustments to reported results
Revenue Net Income EPS ROE Efficiency
Specific PCL
Common Equity Ratio
(Basel II)
Reported Results $16,130MM $4,189MM $6.15 15.9% 63.5% $762MM 10.5%
Adjusted Results $15,067MM $4,092MM $6.00 15.5% 63.1% $471MM 10.5%
Adjusted measures are non-GAAP measures. See slide 2 of this document, pages 32, 98-99 of BMO’s 2012 Annual MD&A and pages 22-23 of BMO’s Fourth Quarter 2012 Earnings Release

11Financial Results | December 4 • 2012
183188189205201
202203210213 221
Q4 Q1 Q2 Q3 Q4
NIM (Reported)
NIM (Adjusted & excl. Trading)
1,674 1,651 1,758 1,665 1,964
1,996 2,092 1,969 2,0121,956
Q4 Q1 Q2 Q3 Q4
RevenueRevenue growth driven by strong BMO CM and PCG results
NIR
NII
Total Bank Adjusted Revenue (C$MM) Net Interest Margin(bps)
F11 F12
F11 F12
13.4% 8.5% Y/Y Growth
3,670 3,743 3,727
14.9% 8.8%
3,677
NIM Adjusted and excl. Trading
Q/Q (1) bp change was relatively flat as decreases primarily in P&C businesses were offset by a positive contribution from Corporate reflecting a decline in lower yielding earning assets
Y/Y (11) bps decline due to lower spreads across all operating groups, partially mitigated by a higher margin in Corporate. Decrease in P&C businesses primarily driven by lower deposit spreads and changes in mix in Canada and pricing pressures in the U.S. Capital Markets decline due to growth in low spread assets
6.8%3,920
Q4 adjusted revenue up 6.8% Y/Y
NIR up 17.3% driven by strong growth in BMO CM and PCG Significantly higher trading revenues in an improved market
environment compared to a year ago Insurance revenue benefited from actuarial adjustments and
investment portfolio changes
NII down 2.0% as volume growth in P&C Canada and U.S. was more than offset by lower net interest margin
Q4 adjusted revenue up 6.7% Q/Q
NIR up 17.9% reflecting strong growth in BMO CM and higher Insurance results in PCG
NII down 2.7% predominantly in BMO CM due to lower assets and reduced margin
Adjusted measures are non-GAAP measures. See slide 2 of this document, pages 32, 98-99 of BMO’s 2012 Annual MD&Aand pages 22-23 of BMO’s Fourth Quarter 2012 Earnings Release. For details on adjustments refer to slide 14
12Financial Results | December 4 • 2012
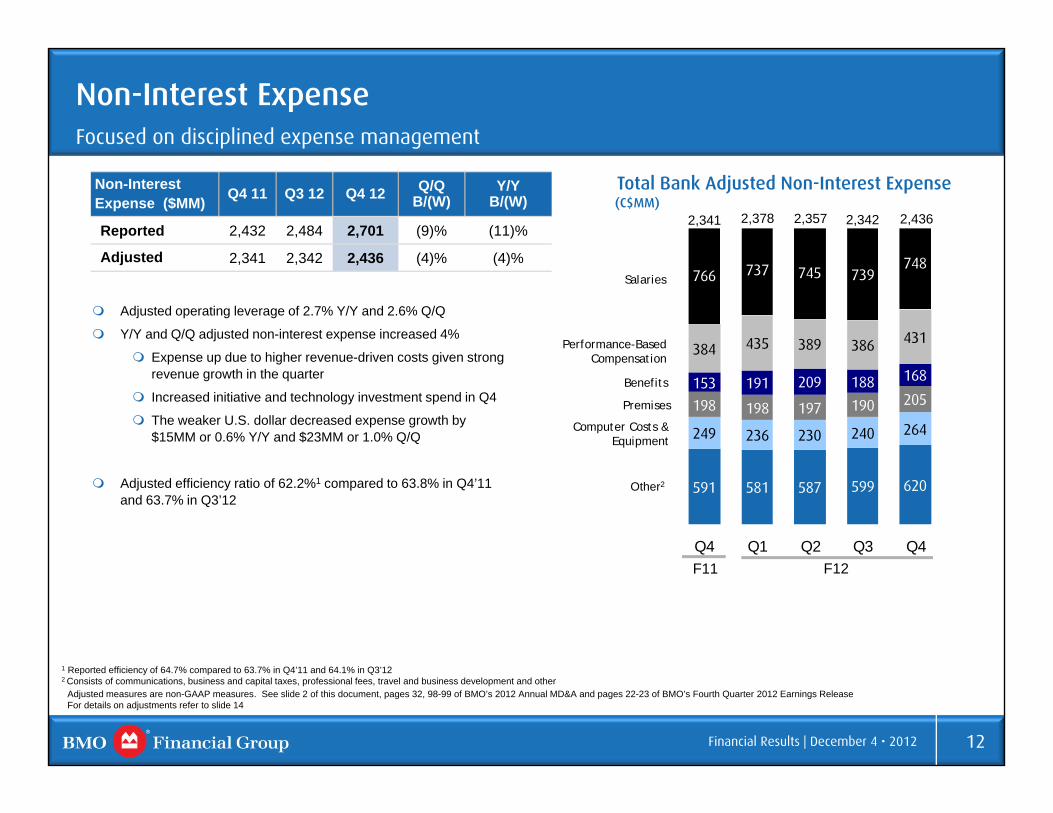
591 581 587 599 620
249 236 230 240 264
198 198 197 190 205153 191 209 188 168
384 435 389 386 431
766 737 745 739748
Q4 Q1 Q2 Q3 Q4
Non-Interest ExpenseFocused on disciplined expense management
Non-Interest Expense ($MM) Q4 11 Q3 12 Q4 12 Q/Q
B/(W)Y/Y
B/(W)
Reported 2,432 2,484 2,701 (9)% (11)%
Adjusted 2,341 2,342 2,436 (4)% (4)%
Adjusted operating leverage of 2.7% Y/Y and 2.6% Q/Q
Y/Y and Q/Q adjusted non-interest expense increased 4%
Expense up due to higher revenue-driven costs given strong revenue growth in the quarter
Increased initiative and technology investment spend in Q4
The weaker U.S. dollar decreased expense growth by $15MM or 0.6% Y/Y and $23MM or 1.0% Q/Q
Adjusted efficiency ratio of 62.2%1 compared to 63.8% in Q4’11 and 63.7% in Q3’12
F11 F12
2,341
Total Bank Adjusted Non-Interest Expense(C$MM)
Computer Costs & Equipment
Performance-Based Compensation
Benefits
Premises
Salaries
Other2
2,378 2,357
1 Reported efficiency of 64.7% compared to 63.7% in Q4’11 and 64.1% in Q3’122 Consists of communications, business and capital taxes, professional fees, travel and business development and other
2,342 2,436
Adjusted measures are non-GAAP measures. See slide 2 of this document, pages 32, 98-99 of BMO’s 2012 Annual MD&A and pages 22-23 of BMO’s Fourth Quarter 2012 Earnings ReleaseFor details on adjustments refer to slide 14
13Financial Results | December 4 • 2012
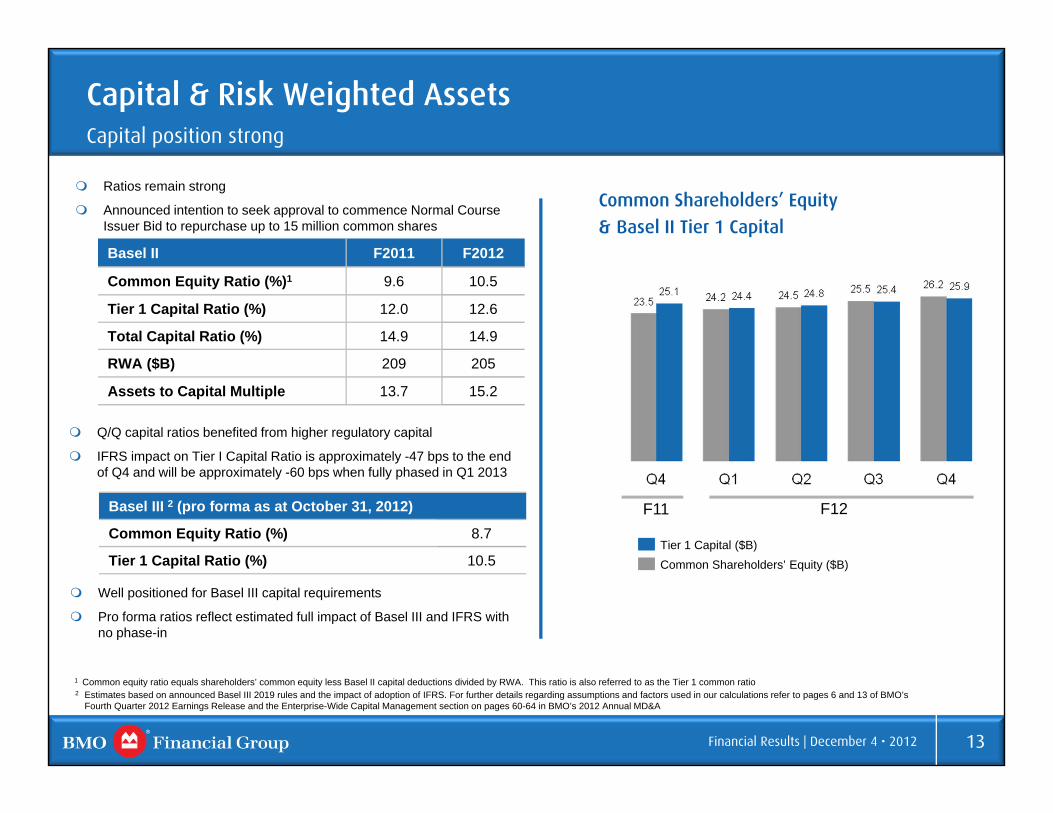
Q/Q capital ratios benefited from higher regulatory capital
IFRS impact on Tier I Capital Ratio is approximately -47 bps to the end of Q4 and will be approximately -60 bps when fully phased in Q1 2013
Capital & Risk Weighted AssetsCapital position strong
1 Common equity ratio equals shareholders’ common equity less Basel II capital deductions divided by RWA. This ratio is also referred to as the Tier 1 common ratio
Basel II F2011 F2012
Common Equity Ratio (%)1 9.6 10.5
Tier 1 Capital Ratio (%) 12.0 12.6
Total Capital Ratio (%) 14.9 14.9
RWA ($B) 209 205
Assets to Capital Multiple 13.7 15.2
Tier 1 Capital ($B)Common Shareholders’ Equity ($B)
F11 F12
Common Shareholders’ Equity
& Basel II Tier 1 Capital
Well positioned for Basel III capital requirements
Pro forma ratios reflect estimated full impact of Basel III and IFRS with no phase-in
Basel III 2 (pro forma as at October 31, 2012)
Common Equity Ratio (%) 8.7
Tier 1 Capital Ratio (%) 10.5
Ratios remain strong
Announced intention to seek approval to commence Normal Course Issuer Bid to repurchase up to 15 million common shares
2 Estimates based on announced Basel III 2019 rules and the impact of adoption of IFRS. For further details regarding assumptions and factors used in our calculations refer to pages 6 and 13 of BMO’s Fourth Quarter 2012 Earnings Release and the Enterprise-Wide Capital Management section on pages 60-64 in BMO’s 2012 Annual MD&A

14Financial Results | December 4 • 2012
Adjusting Items
Adjusting1 items – Pre-tax($MM) Q4 11 Q3 12 Q4 12 Annual
F2011Annual F2012
Credit-related items on the M&I purchased performing loan portfolio 173 76 57 173 407Hedge costs related to foreign currency risk on purchase of M&I - - - (20) -M&I integration costs (53) (105) (153) (131) (402)M&I acquisition-related costs (5) - - (87) -Amortization of acquisition-related intangible assets (33) (33) (34) (70) (134)Decrease/(increase) in the collective allowance for credit losses 17 15 49 (6) 82Run-off structured credit activities (119) (15) 67 (50) 264Restructuring costs - - (74) - (173)Adjusting items included in reported pre-tax income (20) (62) (88) (191) 44
Adjusting1 items – After-tax($MM) Q4 11 Q3 12 Q4 12 Annual
2011Annual F2012
Credit-related items on the M&I purchased performing loan portfolio 107 47 35 107 251Hedge costs related to foreign currency risk on purchase of M&I - - - (14) -M&I integration costs (35) (65) (95) (84) (250)M&I acquisition-related costs (4) - - (62) -Amortization of acquisition-related intangible assets (25) (24) (24) (54) (96)Decrease/(increase) in the collective allowance for credit losses 12 14 27 (4) 53Run-off structured credit activities (119) (15) 67 (50) 261Restructuring costs - - (53) - (122)
Adjusting items included in reported after-tax net income (64) (43) (43) (161) 97EPS ($) (0.09) (0.07) (0.06) (0.26) 0.15
1 All adjusting items are reflected in Corporate Services with the exception of the amortization of acquisition-related intangible assets, which is reflected across the Operating GroupsAdjusted measures are non-GAAP measures. See slide 2 of this document, pages 32, 98-99 of BMO’s 2012 Annual MD&A and pages 22-23 of BMO’s Fourth Quarter 2012 Earnings Release

15Financial Results | December 4 • 2012
Net income of $293MM, more than doubled Y/Y; up 26% Q/Q
Revenue up 30% Y/Y reflecting significantly higher trading revenues in improved environment
ROE 25.2% Efficiency ratio 57.8%
Adjusted net income2 of US$147MM, down from a strong quarter a year ago; up $4MM Q/Q
Revenue down US$38MM Y/Y, reflecting reductions in certain loan portfolios and lower interchange fees
Adjusted Efficiency ratio 59.7% Strong commercial loan growth with core C&I up 15%
Y/Y
Operating Groups – Q4 2012 Quick Facts77% of adjusted revenue from retail businesses1
P&C Canada P&C U.S. Net income up 6.2% Y/Y on an actual loss basis Revenue relatively flat Y/Y and Q/Q with higher volumes
across most products offset by lower margin Good loan growth Y/Y and Q/Q. Y/Y personal loans up
7.8% and commercial loans up 8.1% Net interest margin of 267 bps - down 7 bps Q/Q; NIM
remains above peer average Efficiency ratio 52.3%
Adjusted net income3 of $171MM, up 20% Y/Y Revenue up 11% Y/Y Insurance results up significantly AUA / AUM of $465B up $40B Y/Y due to market
appreciation and new client assets
Private Client Group BMO Capital Markets
1 Based on adjusted operating segment results; excludes Corporate Services 3 PCG reported net income of $166MM, up 21% Y/Y2 P&C U.S. reported net income of US$132MM, down $21MM Y/Y and up $5MM Q/Q
* BMO employs a methodology for segmented reporting purposes whereby expected credit losses are charged to the operating groups quarterly based on their share of expected credit losses. The difference between quarterly charges based on expected losses and required quarterly provisions based on actual losses, as well as changes in the collective allowance are charged (or credited) to Corporate Services
Adjusted measures are non-GAAP measures. See slide 2 of this document, pages 32, 98-99 of BMO’s 2012 Annual MD&A and pages 22-23 of BMO’s Fourth Quarter 2012 Earnings ReleaseFor details on adjustments refer to slide 14

16Financial Results | December 4 • 2012
F11
Personal & Commercial Banking – CanadaStrong loan growth and continued focus on actively managing expenses
F12
Net Interest Margin(bps)
As Reported ($MM) Q4 11 Q3 12 Q4 12 Q/Q
B/(W)Y/Y
B/(W)
Personal Revenue 970 963 970 1% -
Commercial Revenue 588 593 583 (2)% (1)%
Revenue 1,558 1,556 1,553 - -
PCL 138 143 145 (1)% (6)%
Expenses 808 795 812 (2)% (1)%
Net Income 439 453 439 (3)% -
Net Income (actual PCL) 415 454 441 (3)% 6%
Efficiency (%) 51.8 51.1 52.3 (1.2) (0.5)
Q4 Highlights
Net income up 6.2% Y/Y on an actual loan loss basis
Y/Y and Q/Q revenue relatively unchanged as higher balances across most products offset by lower NIM
Expenses actively managed while Q4 in part reflects higher initiative spend
Good loan balance growth with Personal up 7.8% Y/Y and 3.1% Q/Q and Commercial up 8.1% Y/Y and 1.7% Q/Q
Deposit balances increased 4.4% Y/Y and 1.7% Q/Q
NIM down 7 bps Q/Q primarily due to:
Deposit spread compression in a low rate environment
Changes in mix including loan growth exceeding deposits growth
P&C Canada NIM remains above peer average: Q3’12 NIM of 274 bps vs. 5 Canadian peer banks average Q3’12 NIM of 253 bps
Rate of NIM decline expected to moderate in 2013
F2012 net income of $1.8B, up 3.4% on an actual loss basis, and 0.6% on a reported (EL) basis. Efficiency ratio of 51.7%
267274281290288
Q4 Q1 Q2 Q3 Q4
* BMO employs a methodology for segmented reporting purposes whereby expected credit losses are charged to the operating groups quarterly based on their share of expected credit losses. The difference between quarterly charges based on expected losses and required quarterly provisions based on actual losses, as well as changes in the collective allowance are charged (or credited) to Corporate Services
17Financial Results | December 4 • 2012
452443
435 438426
Q4 Q1 Q2 Q3 Q4F11
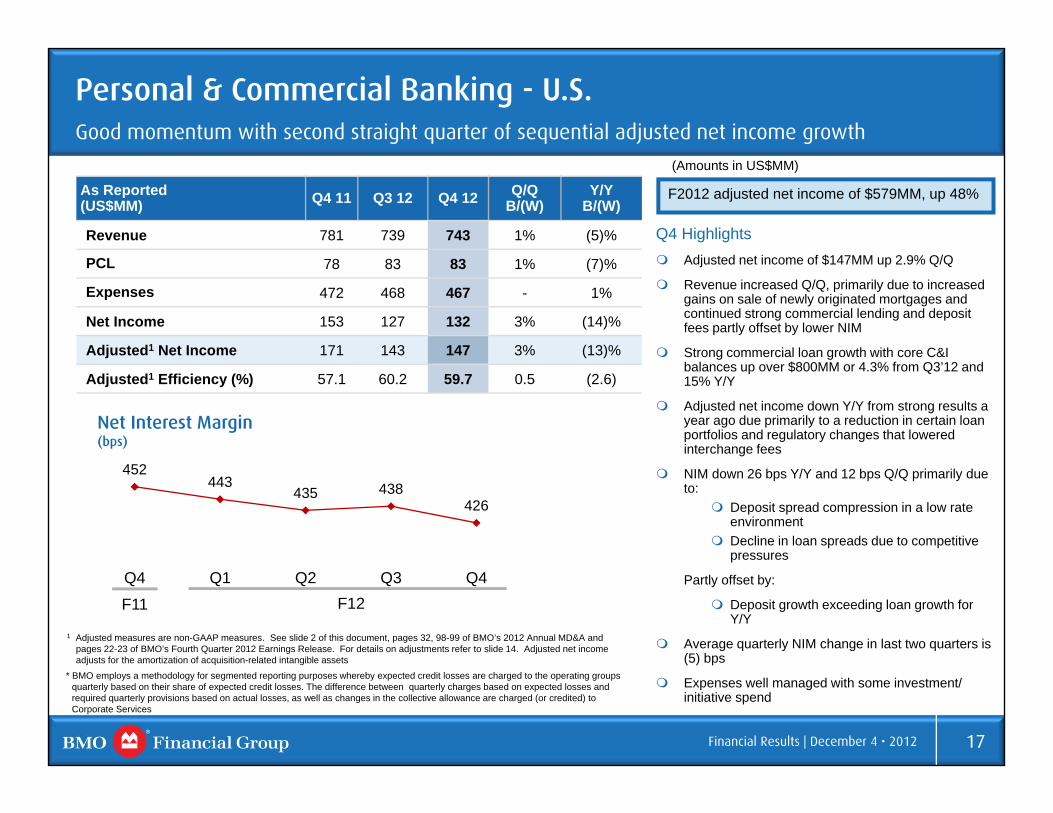
As Reported (US$MM) Q4 11 Q3 12 Q4 12 Q/Q
B/(W)Y/Y
B/(W)
Revenue 781 739 743 1% (5)%
PCL 78 83 83 1% (7)%
Expenses 472 468 467 - 1%
Net Income 153 127 132 3% (14)%
Adjusted1 Net Income 171 143 147 3% (13)%
Adjusted1 Efficiency (%) 57.1 60.2 59.7 0.5 (2.6)
F12
Personal & Commercial Banking - U.S.Good momentum with second straight quarter of sequential adjusted net income growth
(Amounts in US$MM)
Net Interest Margin(bps)
F2012 adjusted net income of $579MM, up 48%
1 Adjusted measures are non-GAAP measures. See slide 2 of this document, pages 32, 98-99 of BMO’s 2012 Annual MD&A and pages 22-23 of BMO’s Fourth Quarter 2012 Earnings Release. For details on adjustments refer to slide 14. Adjusted net income adjusts for the amortization of acquisition-related intangible assets
Q4 Highlights Adjusted net income of $147MM up 2.9% Q/Q
Revenue increased Q/Q, primarily due to increased gains on sale of newly originated mortgages and continued strong commercial lending and deposit fees partly offset by lower NIM
Strong commercial loan growth with core C&I balances up over $800MM or 4.3% from Q3’12 and 15% Y/Y
Adjusted net income down Y/Y from strong results a year ago due primarily to a reduction in certain loan portfolios and regulatory changes that lowered interchange fees
NIM down 26 bps Y/Y and 12 bps Q/Q primarily due to:
Deposit spread compression in a low rate environment
Decline in loan spreads due to competitive pressures
Partly offset by:
Deposit growth exceeding loan growth for Y/Y
Average quarterly NIM change in last two quarters is (5) bps
Expenses well managed with some investment/ initiative spend
* BMO employs a methodology for segmented reporting purposes whereby expected credit losses are charged to the operating groups quarterly based on their share of expected credit losses. The difference between quarterly charges based on expected losses andrequired quarterly provisions based on actual losses, as well as changes in the collective allowance are charged (or credited) to Corporate Services
18Financial Results | December 4 • 2012
275 280 287 287 301
150 155 158 158 164
Q4 Q1 Q2 Q3 Q4
F12
AUM/AUA ($B)
AUA
AUM
F11
425 435 445
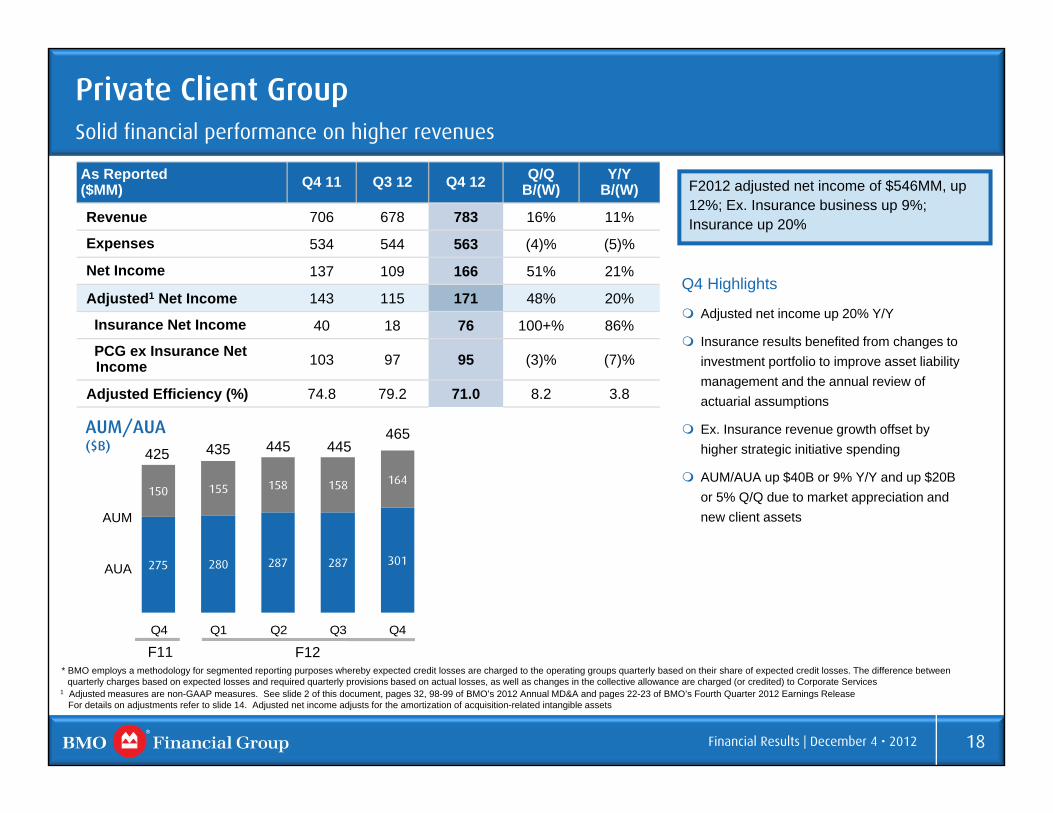
Q4 Highlights
Adjusted net income up 20% Y/Y
Insurance results benefited from changes to investment portfolio to improve asset liability management and the annual review of actuarial assumptions
Ex. Insurance revenue growth offset by higher strategic initiative spending
AUM/AUA up $40B or 9% Y/Y and up $20B or 5% Q/Q due to market appreciation and new client assets
As Reported ($MM) Q4 11 Q3 12 Q4 12 Q/Q
B/(W)Y/Y
B/(W)
Revenue 706 678 783 16% 11%
Expenses 534 544 563 (4)% (5)%
Net Income 137 109 166 51% 21%
Adjusted1 Net Income 143 115 171 48% 20%
Insurance Net Income 40 18 76 100+% 86%
PCG ex Insurance Net Income 103 97 95 (3)% (7)%
Adjusted Efficiency (%) 74.8 79.2 71.0 8.2 3.8
445
F2012 adjusted net income of $546MM, up 12%; Ex. Insurance business up 9%; Insurance up 20%
465
Private Client GroupSolid financial performance on higher revenues
* BMO employs a methodology for segmented reporting purposes whereby expected credit losses are charged to the operating groups quarterly based on their share of expected credit losses. The difference between quarterly charges based on expected losses and required quarterly provisions based on actual losses, as well as changes in the collective allowance are charged (or credited) to Corporate Services
1 Adjusted measures are non-GAAP measures. See slide 2 of this document, pages 32, 98-99 of BMO’s 2012 Annual MD&A and pages 22-23 of BMO’s Fourth Quarter 2012 Earnings ReleaseFor details on adjustments refer to slide 14. Adjusted net income adjusts for the amortization of acquisition-related intangible assets

19Financial Results | December 4 • 2012
BMO Capital MarketsStrong Q4 results
F12F11
Return on Equity (%)
As Reported ($MM) Q4 11 Q3 12 Q4 12 Q/Q
B/(W)Y/Y
B/(W)
Trading Products Revenue 436 488 584 20% 34%
Investment & Corp Banking Revenue 257 318 314 (1)% 22%
Revenue 693 806 898 11% 30%
PCL 30 25 24 1% 20%
Expenses 485 480 519 (8)% (7)%
Net Income 143 232 293 26% +100%
Efficiency Ratio (%) 70.0 59.6 57.8 1.8 12.2
Q4 Highlights Y/Y net income more than doubled due to an
increase in revenues as the market environment improved and a recovery of prior periods’ income taxes in the current quarter
Y/Y revenue higher mainly due to significantly higher trading revenues and to a lesser extent higher underwriting fees and corporate banking revenue
Y/Y expenses up mainly due to higher variable compensation costs consistent with revenue performance, partially offset by lower professional fees
Q/Q revenue higher mainly due to higher trading revenues as market conditions improved, higher equity underwriting fees and normalizing securities gains from low levels in Q3’12, partially offset by lower M&A and debt underwriting fees
Q/Q expenses up consistent with strong revenue
F2012 net income of $948MM, up 5%; with strong ROE of 20.1%
13.917.4 18.6 19.3
25.2
Q4 Q1 Q2 Q3 Q4
* BMO employs a methodology for segmented reporting purposes whereby expected credit losses are charged to the operating groups quarterly based on their share of expected credit losses. The difference between quarterly charges based on expected losses and required quarterly provisions based on actual losses, as well as changes in the collective allowance are charged (or credited) to Corporate Services

20Financial Results | December 4 • 2012
Corporate Services
Adjusted results up Y/Y and Q/Q
As Reported ($MM) Q4 11 Q3 12 Q4 12
Revenue (teb) 78 87 205
PCL – Specific 50 (28) (38)
– Collective 63 8 (24)
Expenses 131 188 345
Net Income (106) 47 54
Adjusted($MM) Q4 11 Q3 12 Q4 12
Revenue (teb) (74) (114) (51)
PCL – Specific 32 (140) (141)
– Collective -- -- --
Expenses 73 79 114
Net Income (67) 65 74
Y/Y adjusted net income higher by $141MM Adjusted revenues increased $23MM due to a number of small items Adjusted PCL improved $173MM consisting of a $132MM recovery of provisions on the M&I purchased credit impaired loan portfolio and $41MM
lower provisions charged to Corporate Services under BMO’s Expected Loss (EL) provisioning methodology Expenses increased $41MM primarily due to higher technology investment spend and professional fees
Q/Q adjusted net income higher by $9MM Adjusted revenues increased $63MM from a low third quarter due to a number of small items Adjusted PCL was flat as the increased recovery on the M&I purchased credit impaired loan portfolio ($14MM) was offset by higher provisions
charged to Corporate Services under BMO’s EL provisioning methodology Expenses increased $35MM mainly as a result of higher technology investment spend
See slide 14 for adjustments to reported results. All adjustments impact Corporate Services with the exception of amortization of acquisition-related intangible assets
2 BMO employs a methodology for segmented reporting purposes whereby expected credit losses are charged to the operating groups quarterly based on their share of expected credit losses. The difference between quarterly charges based on expected losses and required quarterly provisions based on actual losses, as well as changes in the collective allowance are charged (or credited) to Corporate Services
1 Adjusted measures are non-GAAP measures. See slide 2 of this document, pages 32, 98-99 of BMO’s 2012 Annual MD&A and pages 22-23 of BMO’s Fourth Quarter 2012 Earnings Release

21Financial Results | December 4 • 2012
Net Income, Reported($MM) F2011 F2012
B/(W)
$ Y/Y
P&C Canada 1,773 1,784 11 1%
P&C U.S. 352 517 165 47%
Total P&C 2,125 2,301 176 8%
PCG 476 525 49 10%
BMO Capital Markets 902 948 46 5%
Corporate Services (389) 415 804 +100%
Total Bank 3,114 4,189 1,075 35%
Net Income, Adjusted($MM) F2011 F2012
B/(W)$ Y/Y
P&C Canada 1,781 1,794 13 1%
P&C U.S. 387 581 194 50%
Total P&C 2,168 2,375 207 9%
PCG 486 546 60 12%
BMO Capital Markets 902 949 47 5%
Corporate Services (281) 222 503 +100%
Total Bank 3,275 4,092 817 25%
Group Net Income
Strong adjusted net income growth of 25% with all Groups up
1 Adjusted measures are non-GAAP measures. See slide 2 of this document, pages 32, 98-99 of BMO’s 2012 Annual MD&A and pages 22-23 of BMO’s Fourth Quarter 2012 Earnings ReleaseFor details on adjustments refer to slide 14

22Financial Results | December 4 • 2012
Personal & Commercial Banking Canada – Product Balances & Market Share
Market Share (%) Q4 11 Q1 12 Q2 12 Q3 12 Q4 12
Total Personal Lending1 10.8 10.8 10.8 10.9 11.0
Personal Deposits1 11.6 11.3 11.2 11.2 11.1
Mutual Funds2 11.9 12.0 11.8 11.8 11.8
Commercial Loans $0 -$5MM3 20.0 19.9 19.9 19.6 N/A
Personal Good lending growth with balances up 7.8% Y/Y and 3.1% Q/Q Deposit balances up 3.5% Y/Y and 0.7% Q/Q Total personal lending market share up 10 bps Q/Q and personal
deposit market share down 7 bps Q/Q Mortgage balances up 9.4% Y/Y and 4.0% Q/Q
Commercial Commercial loans up 8.1% Y/Y and 1.7% Q/Q No. 2 market share position in small and medium sized loans.
Commercial pipeline strong Commercial deposits up 6.2% Y/Y and 3.6% Q/Q
Sources: Mutual Funds – IFIC; Consumer Loans, Residential Mortgages & Personal Deposits – OSFI; Business Loans and Retail Cards – CBA1. Personal share issued by OSFI (one month lag basis (Q4 F12: Sept 2012))2. Mutual Funds share issued by IFIC (5 Bank, one month lag basis (Q4 F12: Sept 2012)). Previous quarters have been restated to reflect Scotia’s acquisition of Dynamic Funds3. Business loan share (Banks) issued by CBA (one calendar quarter lag basis (Q3 F12: Jun 2012))
66.4 66.6 67.2 69.8 72.6
40.3 41 41.3 41.8 42.4
106.7 107.6 108.5 111.6 115.0
67.9 68.8 68.8 69.8 70.3
Q4 11 Q1 12 Q2 12 Q3 12 Q4 12
Personal Lending and Deposits ($B) -Average
Residential Mortgages Personal LoansPersonal Deposits
38.0 38.2 39.2 40.4 41.1
36.4 37.4 36.6 37.338.7
Q4 11 Q1 12 Q2 12 Q3 12 Q4 12
Commercial Loans & Acceptances and Deposits ($B) - Average
Commercial Loans and AcceptancesCommercial Deposits
Cards ($B) - Average
7.5 7.5 7.2 7.3 7.4
1.6 1.6 1.6 1.7 1.5
Q4 11 Q1 12 Q2 12 Q3 12 Q4 12
Personal Cards Commercial Cards

23Financial Results | December 4 • 2012
17.3 18.0 18.8 19.1 19.9
Q4 11 Q1 12 Q2 12 Q3 12 Q4 12
Core C&I ($B) - Average
Personal & Commercial Banking U.S. – Commercial Balances
All amounts in U.S. $B
3.7 3.2 3.0 3.0 2.9
Q4 11 Q1 12 Q2 12 Q3 12 Q4 12
Core Commercial Real Estate ($B) - Average
4.0 3.6 3.4 3.1 2.7
Q4 11 Q1 12 Q2 12 Q3 12 Q4 12
Run-off Loans ($B) - Average
15.6 16.9 17.7 17.7 18.7
Q4 11 Q1 12 Q2 12 Q3 12 Q4 12
Commercial Deposits ($B) - Average
Strong C&I loan growth, with Q4’12 being the 4th straight sequential quarter of growth; growth of 15% since Q4’11
New client acquisitions strong, reflecting a significant number of completed transactions. Pipeline remains strong.
Commercial Run-off portfolio continues to decline as expected
Commercial deposits continue to be at high levels

24Financial Results | December 4 • 2012
6.9 6.8 6.6 6.4 6.3
3.9 3.9 4.0 4.1 4.2
Q4 11 Q1 12 Q2 12 Q3 12 Q4 12
Mortgages ($B) - AverageMortgages Serviced Mortgage
Personal & Commercial Banking U.S. – Personal Balances
4.9 4.9 5.0 5.2 5.4
Q4 11 Q1 12 Q2 12 Q3 12 Q4 12
Indirect Auto ($B) - Average
All amounts in U.S. $B
6.2 5.9 5.8 5.7 5.6
Q4 11 Q1 12 Q2 12 Q3 12 Q4 12
Home Equity ($B) - Average
6.0 5.7 5.5 5.4 5.3
Q4 11 Q1 12 Q2 12 Q3 12 Q4 12
Business Banking / Small Business Loans ($B) -Average
4.5 4.4 4.2 3.9 3.7
Q4 11 Q1 12 Q2 12 Q3 12 Q4 12
Other Loans ($B) - Average
41.8 41.5 41.5 41.3 40.6
Q4 11 Q1 12 Q2 12 Q3 12 Q4 12
Personal Deposits ($B) - Average
Mortgage originations of $821MM up $33MM or 4.2% Q/Q and $271MM or 49% Y/Y
Mortgage portfolio declines as new originations are sold into the secondary market
Serviced portfolio up
Home Equity portfolio continues to reflect consumer deleveraging
Increased Indirect Auto originations lead to higher portfolio balances
Business Banking environment remains cautious for new borrowings
Deposit balances have declined during the year in money market and higher cost CD portfolios, as expected, which has more than offset growth in core deposits
Other loans include non-strategic portfolios such as wholesale mortgages, purchased home equity, and certain small business CRE, as well as credit card balances and other personal loans

Risk Review
Surjit RajpalExecutive Vice President & Chief Risk Officer
Q4 12December 4th 2012
For the Quarter Ended – October 31, 2012

26Risk Review | December 4 • 2012
Loan Portfolio OverviewCanadian and US portfolios are well diversified by industry
1 Includes ~$5B from Other Countries2 Other Commercial & Corporate includes Portfolio Segments that are each <3% of total loans
P&C business represents the majority of loans Retail portfolios are predominantly secured – 88% in Canada and 97% in the US
132.1
21.3
44.033.0
18.29.7
Canada & Other Countries US
Line of Business
P&C Consumer P&C Commercial BMO CM
By Industry(C$ B)
Canada & Other
Countries1US Total % of
total
Residential Mortgages 76.7 7.4 84.1 32%
Personal Lending 48.0 13.5 61.5 24%
Cards 7.4 0.4 7.8 3%
Total Consumer 132.1 21.3 153.4 59%
Financial Institutions 12.1 7.0 19.1 8%
CRE/Investor Owned Mortgages 10.2 8.3 18.5 7%
Services 8.4 5.1 13.5 5%
Manufacturing 4.0 5.4 9.4 4%
Retail 6.1 2.4 8.5 3%
Wholesale 3.0 3.4 6.4 3%
Owner Occupied Commercial Mortgages 2.0 4.3 6.3 2%
Agriculture 4.3 0.8 5.1 2%
Other Commercial & Corporate2 12.1 6.0 18.1 7%
Total Commercial & Corporate 62.2 42.7 104.9 41%
Total Loans 194.3 64.0 258.3 100%

27Risk Review | December 4 • 2012
Actual Losses By Business Line Segment (C$ MM)
Q4 11 Q3 12 Q4 12
Consumer – P&C Canada 134 122 121
Commercial – P&C Canada 38 19 21
Total P&C Canada 172 141 142
Consumer – P&C US 38 46 74
Commercial – P&C US 31 25 (5)
Total P&C US 69 71 69
PCG 2 4 10
Capital Markets 12 (1) (5)
Corporate Services1 26 19 29
Sub-Total 281 234 245
Purchased Credit Impaired Loans - (118) (132)
Adjusted Specific Provisions 281 116 113
P&C US 20 99 101
PCG - 3 2
Corporate Services (2) 11 -
Purchased Performing Loans 18 113 103
Specific Provisions 299 229 216
Change in Collective Allowance 63 8 (24)
Total PCL 362 237 192
Fiscal 2012 adjusted specific provisions are $471MM (Fiscal 2011: $1,108MM) and include $509MM in recoveries related to the Purchased Credit Impaired Loans (Fiscal 2011: $ nil)
During the quarter US Consumer provisions have increased primarily due to US regulatory guidance, adding ~$33MM for P&C US and ~$38MM for M&I Purchased Performing Loans
Q4 '12 adjusted specific provisions are $113MM (Q3 '12: $116MM) Recovery related to the Purchased Credit Impaired Loans is $132MM (Q3 '12: $118MM)
1 Includes: Real estate secured assets transferred out of P&C US Commercial as of Q3’11 and IFRS impact related to interest on impaired loans
317 265 245 299122 195 229 216
6 32
(15)
63
198
(24)
Q1 11 Q2 11 Q3 11 Q4 11 Q1 12 Q2 12 Q3 12 Q4 12
Quarterly PCL
Specific Collective
Provision for Credit Losses (PCL)Down 19% q/q and 47% y/y

28Risk Review | December 4 • 2012
Canadian provisions are $144MM (Q3 '12: $140MM)
US Legacy provisions are $102MM (Q3 '12: $96MM)
Other Countries provisions are recoveries of $1MM (Q3 '12 recoveries of $2MM)
Consumer portfolio accounts for ~84% of legacy provisions in both the US and Canada
By Industry(C$ MM)
Canada & Other Countries US (Legacy) Total
Personal Lending 36 60 96Cards 81 3 84Residential Mortgages 4 23 27Consumer 121 86 207Manufacturing 12 4 16Services 2 13 15Owner Occupied Commercial Mortgages 1 10 11Agriculture 3 0 3Retail 2 1 3Construction 0 2 2Other1 2 -14 -12Commercial and Corporate 22 16 38Specific PCL 143 102 245
1 Other Commercial & Corporate includes Portfolio Segments that are each <1% of total specific PCL
Specific Provision Segmentation – Legacy Portfolio

29Risk Review | December 4 • 2012
By Industry(C$ MM)
Formations Gross Impaired Loans
Canada & Other
Countries2US Total
Canada & Other
Countries2US Total
Consumer 139 137 276 338 395 733
CRE/Investor Owned Mortgages 10 34 44 98 379 477
Owner Occupied Commercial Mortgages 2 7 9 17 165 182
Services 24 14 38 90 77 167
Manufacturing 26 5 31 133 23 156
Agriculture 10 - 10 93 3 96
Financial Institutions - 1 1 8 63 71
Construction 1 3 4 44 7 51
Retail 3 5 8 26 25 51
Other Commercial & Corporate1 5 2 7 82 32 114
Commercial and Corporate 81 71 152 591 774 1,365
Total Legacy 220 208 428 929 1,169 2,098
M&I Purchased Performing n.a. 359 359 n.a. 878 878
During the quarter US Consumer formations have increased primarily due to US regulatory guidance issued requiring changes to impairment classification for certain loans in our P&C US portfolio, adding ~$75MM for P&C US and ~$67MM for M&I Purchased Performing
Legacy portfolio formations (excluding M&I purchased performing portfolio) are $428MM (Q3 '12: $405MM) M&I Purchased Performing loan formations are down for the quarter at $359MM (Q3 '12: $386MM). The potential for impairment
and losses in this portfolio was adequately provided for in the credit mark Gross Impaired Loans (GIL) are $2,976MM (Q3 '12: $2,867MM) of which the Legacy portfolio is $2,098MM (Q3 '12: $2,074MM)
1 Other Commercial & Corporate includes Portfolio Segments that are each <2% of total GIL2 Includes ~$20MM formations and ~$43MM GIL from Other Countries
628 392 455 405 428
732 624 899 791 787
Q4 11 Q1 12 Q2 12 Q3 12 Q4 12
Formations
Legacy M&I Purchased Performing
2,581 2,343 2,248 2,074 2,098
2,685 2,657 2,837 2,867 2,976
Q4 11 Q1 12 Q2 12 Q3 12 Q4 12
Gross Impaired Loans
Legacy M&I Purchased Performing
Impaired Loans and FormationsLegacy Impaired Loans and formations up slightly q/q but down y/y

30Risk Review | December 4 • 2012
Canadian Residential Mortgages
Total Canadian portfolio $76.7B (Q3 '12: $73.9B)
~64% of the portfolio is insured (Q3 '12: ~65%)
Average LTV1 of portfolio 62% (Q3 '12: 61%)
insured portfolio 64% (Q3 '12: 64%)
uninsured portfolio 58% (Q3 '12: 56%)
Residential Mortgages by Province(C$B)
Insured Uninsured Total % of Total
Atlantic 3.3 1.3 4.6 6%
Quebec 7.5 3.8 11.3 15%
Ontario 20.4 10.6 31.0 40%
Alberta 8.7 3.5 12.2 16%
British Columbia 7.4 7.4 14.8 19%
All Other Canada 1.9 0.9 2.8 4%
Total Portfolio 49.2 27.5 76.7 100%
1 Loan to Value (LTV) adjusted for property values using the Housing Price Index

31Risk Review | December 4 • 2012
(30)
(10)
10
30
50
01-A
ug-12
08-A
ug-12
14-A
ug-12
20-A
ug-12
24-A
ug-12
30-A
ug-12
06-S
ep-12
12-S
ep-12
18-S
ep-12
24-S
ep-12
28-S
ep-12
04-O
ct-12
11-O
ct-12
17-O
ct-12
23-O
ct-12
29-O
ct-12
Daily Revenues Total Trading & Underwriting MVE Interest Rate VaR (AFS)
Trading & Underwriting Net Revenues vs. Market Value Exposure
August 1, 2012 to October 31, 2012 (Presented on a Pre-Tax Basis)
The largest daily P&L gains for the quarter are as follows: • September 12 – Primarily reflects normal trading activity and credit valuation adjustments, daily net revenue C$31.4 million• October 23 – Primarily reflects normal trading activity, daily net revenue C$37.8 million
No significant loss days in the quarter.

Investor Relations Contact Information
E-mail: [email protected]
www.bmo.com/investorrelations
Fax: 416.867.3367
ANDREW CHINSenior [email protected]
SHARON HAWARD-LAIRDHead, Investor [email protected]